Article

Grazing Systems to Retain and Redistribute Soil Phosphorus and to Reduce Phosphorus Losses in Runoff

Department of Crop and Soil Sciences, University of Georgia, Athens, GA 30602, USA
*
Author to whom correspondence should be addressed.
Submission received: 11 September 2020 / Revised: 6 November 2020 / Accepted: 13 November 2020 / Published: 16 November 2020

Abstract

:
A study of phosphorus accumulation and mobility was conducted in eight pastures in the Georgia piedmont, USA. We compared two potential grazing treatments: strategic-grazing (STR) and continuous-grazing-with-hay-distribution (CHD) from 2015 (Baseline) to 2018 (Post-Treatment) for (1) distribution of Mehlich-1 Phosphorus (M1P) in soil and (2) dissolved reactive phosphorus (DRP) and total Kjeldahl phosphorus (TKP) in runoff water. STR included rotational grazing, excluding erosion vulnerable areas, and cattle-lure management using movable equipment (hay-rings, shades, and waterers). After three years of treatment, M1P had significantly accrued 6- and 5-fold in the 0–5 cm soil layer and by 2- and 1.6-fold in the 5–10 cm layer for CHD and STR, respectively, compared to Baseline M1P. In STR exclusions, M1P also increased to 10 cm depth post-treatment compared to Baseline. During Post-Treatment, TKP runoff concentrations were 21% and 29% lower, for CHD and STR, respectively, in 2018 compared to 2015. Hot Spot Analysis, a spatial clustering tool that utilizes Getis-Ord Gi* statistic, revealed no change in Post-Treatment CHD pastures, while hotspots in STR pastures had moved from low-lying to high-lying areas. Exclusion vegetation retained P and reduced bulk density facilitating vertical transportation of P deeper into the soil, ergo, soil P was less vulnerable to export in runoff, retained in the soil for forage utilization and reduced export of P to aquatic systems

1. Introduction

Improving availability of phosphorus (P) and at the same time reducing its loss to streams can contribute to sustainability of grazed pastures. Phosphorus is a vital nutrient for plants and animals, but it has been long identified as a major contributor to eutrophication. The underlying problem of the existing P-cycle is the failure to recover and reuse P in human waste, livestock manure, and food waste [1]. Grazing animals urinate and defecate around 81% of the P eaten [2]. Retention of P in animal waste, within the soils of grazing systems, will improve the efficiency of P use which could contribute to solving this problem. Management practices aimed toward vertical and horizontal distribution of P for better retention and utilization could reduce overall P losses from pastures. Distribution of P should focus on utilization of P for plant production while at the same time maintain soil surface properties that maximize infiltration, minimize over-land flow [3] and P improved water quality.
Internal inputs of P in pastures from weathered parent materials and external inputs from mineral fertilizers and dust deposited from the atmosphere are internally cycled through dung deposited by cattle, plant residues, and animal matter [4].
Surface application of phosphatic fertilizers exceeding the agronomic requirements of forages to kaolinitic soils has been shown to transfer readily soluble forms of inorganic phosphorus to lower depths in soil profile [5]. However, a study by McClaren et al. [6] reported total concentration of organic and inorganic forms of soil P in the 10–20 cm soil layer to be only 42% of the concentration measured in the 0–10 cm soil layer. Dung and plant residues are organic sources of P in soil that can reduce the need for external inputs of P, however, nutrient management strategies seldom consider both inorganic and organic forms of P [7]. Dung deposited by cattle during in-situ grazing can have cumulative benefits of improved pH and decreased P sorption, thus improving the efficiency of P cycle in the long term [8]. Adding P to the soil cannot be the sole strategy as research has shown increased losses of P with increased accumulation of P in soil. Phosphorus is relatively immobile in soil [9] until it reaches relatively high levels of soil saturation. Studies have shown that around 80% of manure P incorporated into soil by rain remains in the top 2 cm [10]. Surface soil P (2 cm) is a major contributor of P in runoff due to the desorption by runoff water [10], and this effect is exacerbated when vegetative cover is minimal [11]. Hence, P management should encompass strategies aimed to uniformly distribute available P to ensure better production of grass and forages and at the same time prevent addition of P in vulnerable areas with high transport and export potential to aquatic systems.
Managing P in pastures is particularly challenging given the diversity of landscapes under pastures and the complexity of P cycling, which is usually site specific. Dung produced by animals in pastures is deposited in patches that correlate with animal loci due to microtopography [12]. Dung returned to pasture soils is spatially heterogenous with greater dung P concentration near resting places (waterers, feeding stations, shades) [13,14].
Inherent vulnerability of sites based on proximity to streams and vulnerability to runoff and erosion should be considered [15]. The incidence of extreme events is expected to increase in the coming decades and research has reported increased rainfall intensity [16,17] and runoff [18,19] can increase P loss. Where P is deposited by cattle may greatly influence its retention within the pastures. In their study on grazed pastures, under contrasting grazing management and fertilizer applications, Bilotto et al. [20] reported greater mean annual changes in soil P on low slopes in comparison to high and medium slopes attributing the difference to movement of phosphorus in animal dung from higher slopes to the lower slopes. Nellesen et al. [21] indicated greater loss of P from pastures with unrestricted stream access compared to pastures with restricted stream access. Grazed grasslands are a significant source of P inputs to surface waters [16]. Additionally, Kurz et al. [22] suggested higher loss potential of organic P in pastures due to manure from grazing animals. In pastures under in-situ grazing, cattle dung stabilized P and increased soil pH [8]. Thus, effective P management strategies should involve use of techniques to reduce continuous treading of soil and excessive inputs of manure at vulnerable sites and maintain continuous vegetative soil cover to lower the losses as both particulate and dissolved P forms.
It is therefore important to generate strategic management systems that can uniformly distribute P inputs (dung and mineral fertilizers) in the pastures such that surface accumulation of P in erosion-prone regions of pastures is minimized. Areas with free access to cattle had 57–83% lower soil macroporosity and 8–17% greater bulk density when compared to areas where cattle were excluded [22]. Use of off-stream watering points (OSWPs) can have a potential benefit of reducing time spent by cattle in riparian areas, but, inclusions with shades, consideration of slope, size of paddock, and good grazing management practices could influence the effectiveness of OSWPs [23]. Rotational grazing in combination with a fenced riparian buffer can be effective in reducing runoff and erosion from pasture soils [24]. Management practices such as stocking rate and methods to manipulate distribution of shade structures, supplement feeding stations, waterers, fertilizers, and forage species diversity can affect efficiency of nutrient cycling in pastures [25].
Grasslands managed under different management practices have been extensively studied for nutrient cycling that encompasses nutrient composition of soils, input of nutrients, and management strategies to minimize losses and associated risks. Research on the relationships between soil test P and runoff P at the field- or pasture-scale is lacking. Most of the previous studies in grazing management have been small-scale plot studies and runoff simulation studies. Understanding the extent to which grazing management can vertically and horizontally retain and redistribute soil P concentrations and reduce P in runoff water at the pasture scale is needed. Strategies such as rotational grazing, exclusion of areas vulnerable to loss of P, and lure management of cattle have been identified as best management practices with the potential to improve P distribution, recycling, and retention in grazed pastures. This study compares two combinations of best management practices, strategic grazing (STR) or continuous-grazing-with-hay-distribution (CHD), to determine their impacts on distribution of soil P (Mehlich-1 P, M1P) and P loss as dissolved reactive P (DRP) and total Kjeldahl P (TKP) in runoff water, over a period of three years.

2. Materials and Methods
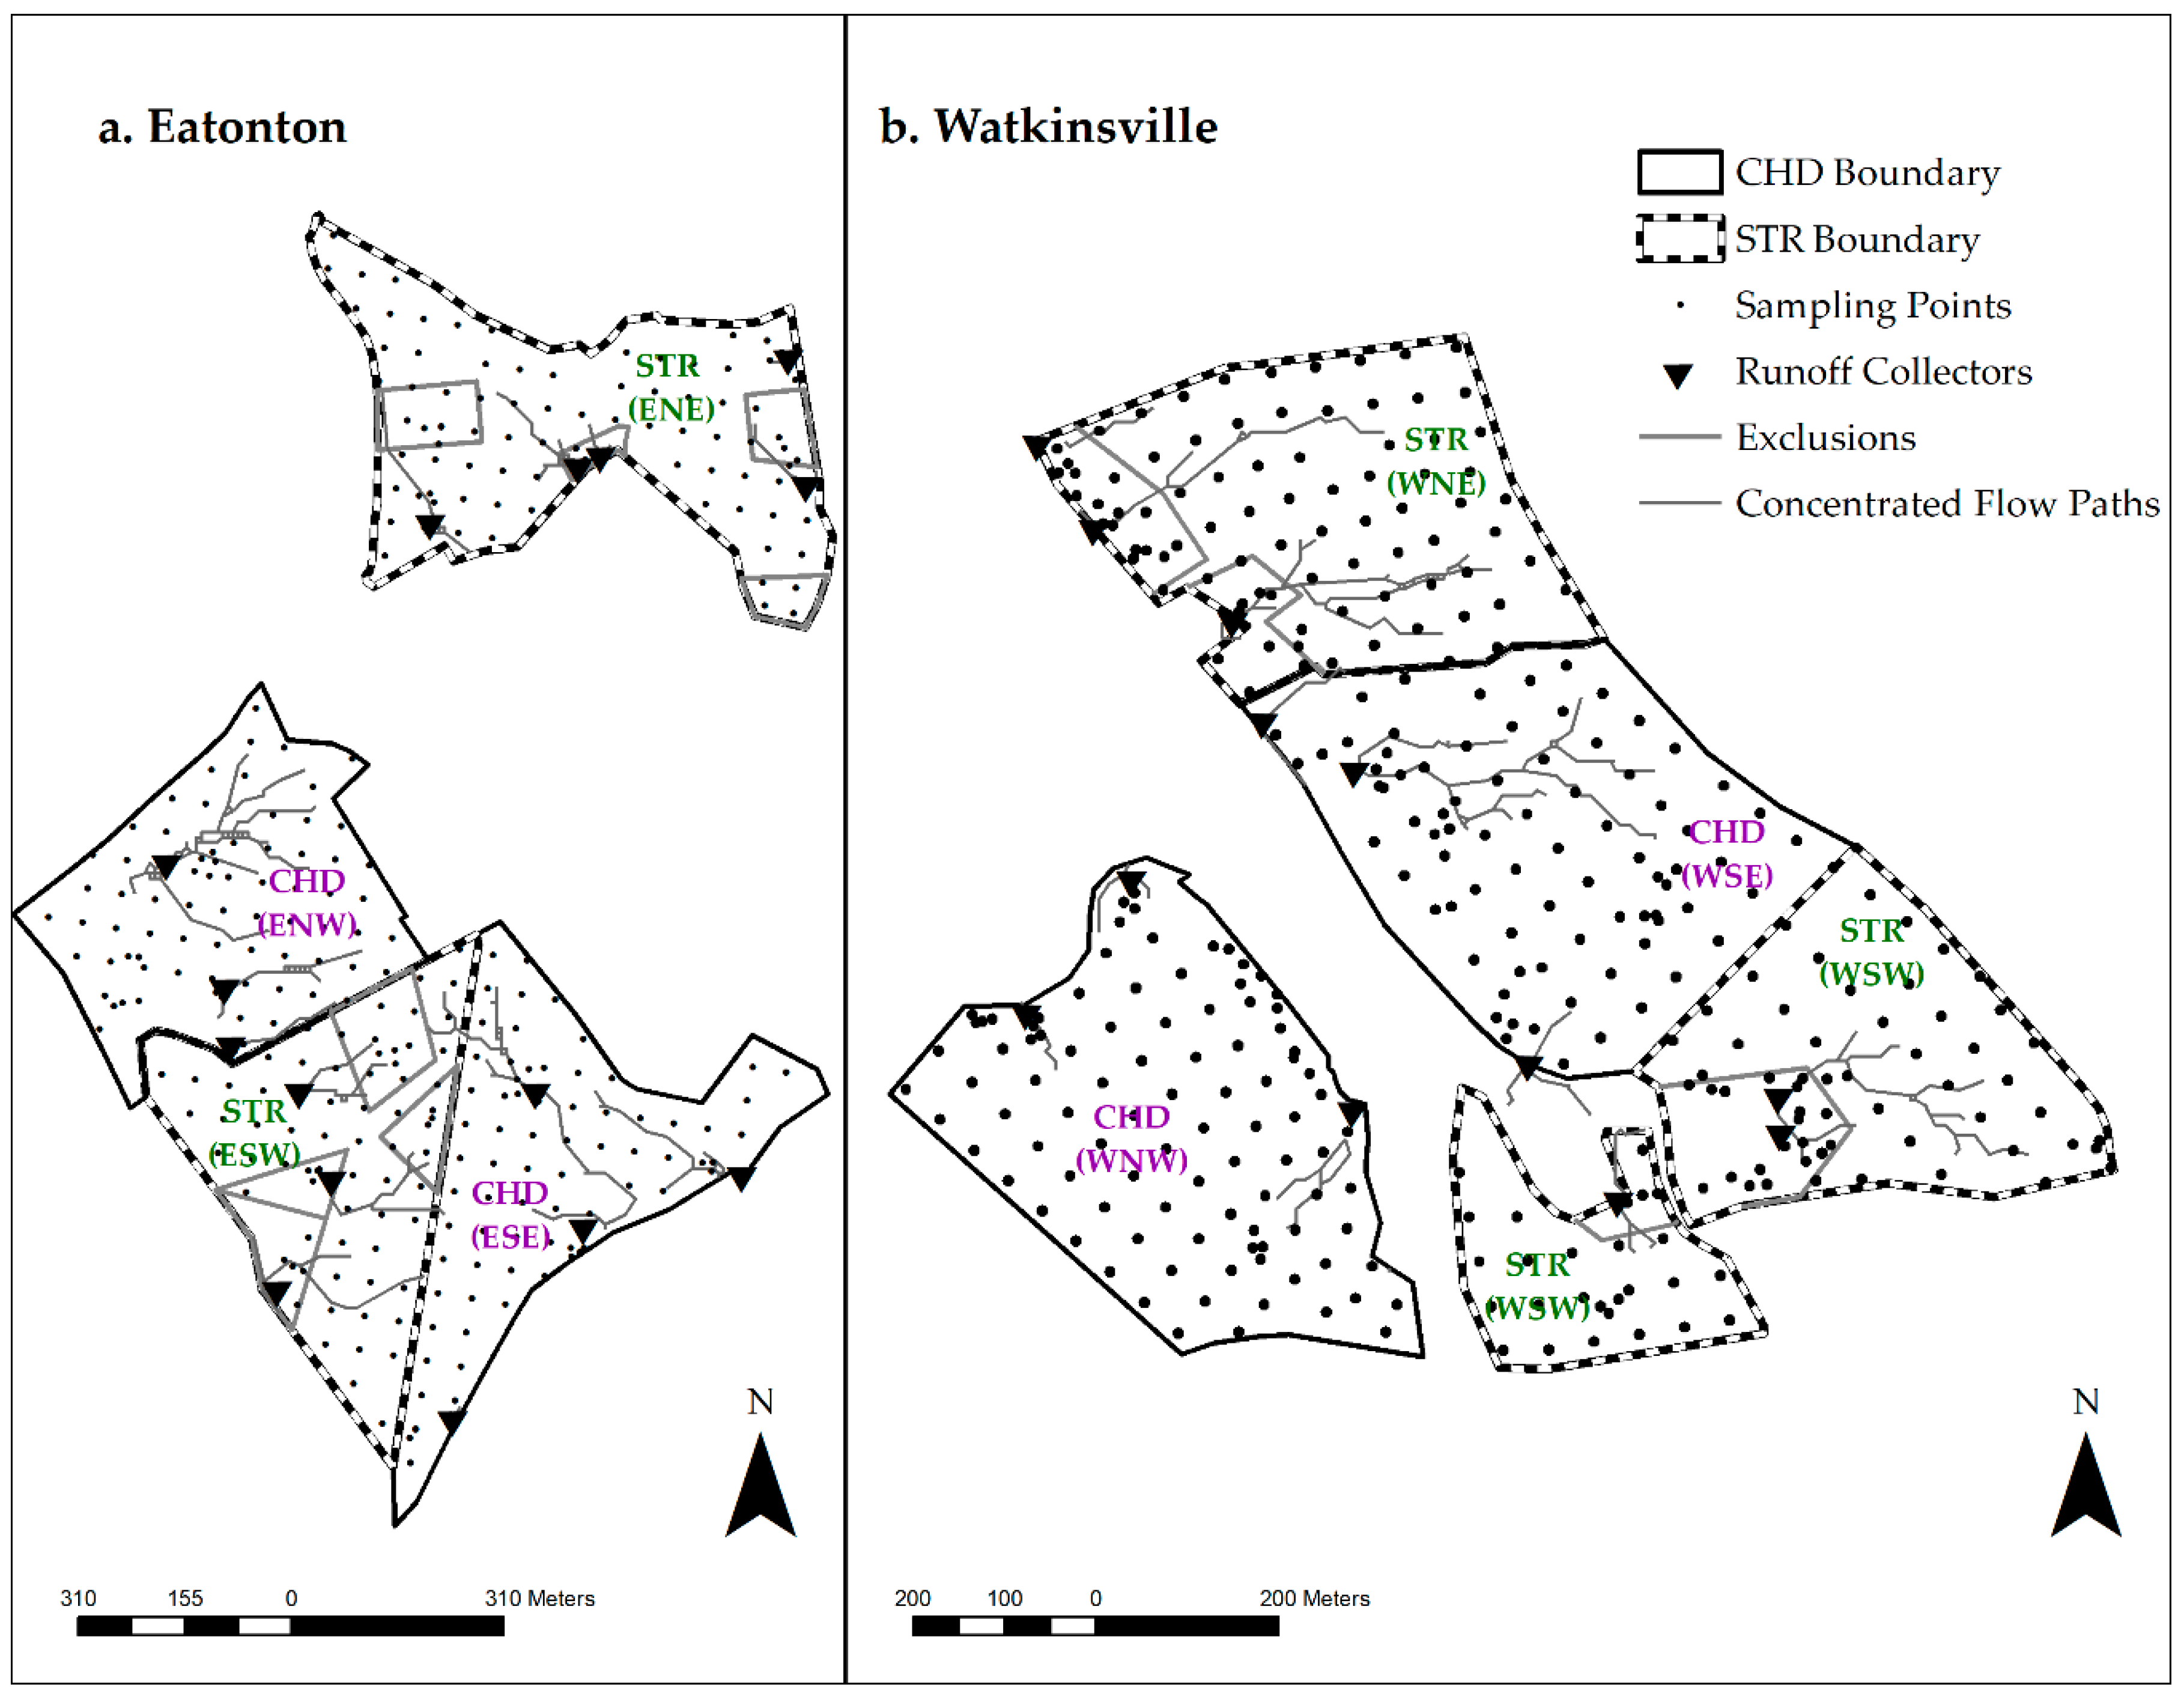
2.1. Study Sites

This study was conducted in eight pastures within the Georgia piedmont; four at the Animal and Dairy Science Eatonton Beef Research Unit (33.420759° N, 83.476555° W, Elevation 152–177 m, Eatonton) in Putnam County, GA, USA, and four at J Phil Campbell (JPC) Sr. Research and Education Center (33.887487° N, 83.420966° W; Elevation 213–259 m, Watkinsville) in Oconee County, GA (Figure 1). Pastures are characterized by moderate and wet winters and long and dry summers. Table 1 describes the study pastures at two locations, their respective area coverage, and number of sampling points in pastures (Matrix). Denser sampling indicates areas of interest (AOIs). The soil types [26] in the study locations, along with other hydrologically important characteristics, are summarized in Table 2.

2.2. Experimental Design

The study began in 2015 at both study sites with Baseline sampling carried out in spring/summer of 2015 (May–June). The 10-year legacy pasture management was continuous grazing management with free movement of cattle and fixed locations for hay feeding, waterers, and shade. All pastures were grazed continuously with 1.7–2.2 cattle head ha−1 prior to treatment application.
In May 2016, four replications of each of two grazing management treatments: (1) Continuous grazing with hay distribution (CHD) and (2) strategic rotational grazing (STR) were implemented. Cattle in CHD pastures had continued access to all locations inside pastures including areas with high P transport potential. Hay, however, was fed by distributing it to other locations in the pastures instead of conventional hay feeding at fixed locations in the pastures. This was done to prevent congregation of cattle at vulnerable locations during hay feeding. In this study, areas where cattle tended to congregate and that were also either close to the streams and/or areas in higher elevation, which had high P transport potential with steep slopes (6–27% slope), were designated as areas of interest (AOIs). In STR pastures, exclusions were setup by fencing the areas with high transport potential of P (Figure 1) and were over-seeded to maintain forage productivity and ground cover. Movable farm equipages: shades, waterers (with quick connects at different locations), and hay feeding rings were used to lure cattle to different locations strategically in STR pastures. Cattle density of all pastures during post-treatment was 1.1 cattle head ha−1.
In STR pastures, exclusions were over-seeded with pearl millet (Pennisetum glaucum), crabgrass (Digitaria spp), and cow pea (Vigna unguiculata) in the spring, and with crimson clover (Trifolium incarnatum), canola (Brassica napus), ryegrass (Lolium) and cereal rye (Secale cereale) in the fall. The exclusions were flash grazed based on the height of forage. Adaptive rotation strategy was used based on forage availability. Shade and waterers were moved to lure animals away from AOIs so that manure deposited by animals was less likely to be transported to the edge of fields or streams.

2.3. Sampling

Soils were sampled on a 50 m grid (matrix samples) in all pastures, with additional samples taken to ensure coverage with the AOIs. At each sampling point, two soil cores were taken, and each was divided into 0–5 cm, 5–10 cm, and 10–20 cm sections, bagged, placed in a dark cooler, and taken to the lab for processing. Soil sampling was carried out from mid-May to June in 2015 (Baseline) and 2018 (Post-Treatment). Within STR sites, sample points that were inside the excluded areas were termed “exclusions” while all other points outside the exclusions were termed “non-exclusions” to further understand the influence of the exclusions.
Pour-point runoff collectors were set up during Baseline (2015) at the drainage outlets of at least three watersheds within each pasture. Surface runoff samples generated by medium to high intensity rainfall (>20 mm) were collected from pour-point collectors, which had replaceable Nalgene bottles. Runoff samples were collected from June 2015 through April 2016 for Baseline (2015). Post-treatment runoff samples were collected from May 2016 to December 2018 as 2016, 2017, and 2018 sampling years. As 2016 was a drought year, there were no runoff samples for a 10-month period and this year was excluded from the analysis. Samples from each runoff event were brought to the lab and a 50 mL sub-sample was filtered (0.45 µm) within 48 h of the end of each event. The filtered runoff sub-samples and unfiltered runoff samples were stored in acid-washed Nalgene bottles at −10 °C for further analyses.

2.4. Analysis of Soil and Water Samples

Mehlich-1 phosphorus (M1P), which is a measure of plant available P in soil, was calculated using spectrophotometric analysis of soil extracts obtained from a two-component acid mixture [27]. Five grams of each soil sample was mixed with 20 mL of the double acid mixture (HCl and H2SO4) and shaken for 5 min, followed by filtering using a Whatman #42 filter. The extract was then analyzed for M1P employing the molybdenum blue dye procedure with spectrophotometric determination at 882 nm [28]. The analyses were expressed on a dry-weight basis by taking soil moisture into account. The concentrations of M1P were then converted to mass of M1P in kg P ha−1 using the bulk density of the soil samples calculated for another part of the study.
Dissolved reactive P (DRP) in runoff samples was measured in filtered runoff samples using spectrophotometric analysis on a Tecan Infinite Pro 200 (Tecan Group Ltd., Männedorf, Switzerland) with the Molybdenum-Blue dye [28]. Total Kjeldahl P (TKP) in runoff samples was determined from unfiltered runoff samples. A digestion solution containing HgSO4, K2SO4 and concentrated H2SO4 was used to digest the unfiltered water samples at 114 °C for 14 h followed by digestion at 380 °C for another 2.5 h [29]. Phosphorus in the digests was determined using the Murphy–Riley procedure [28].

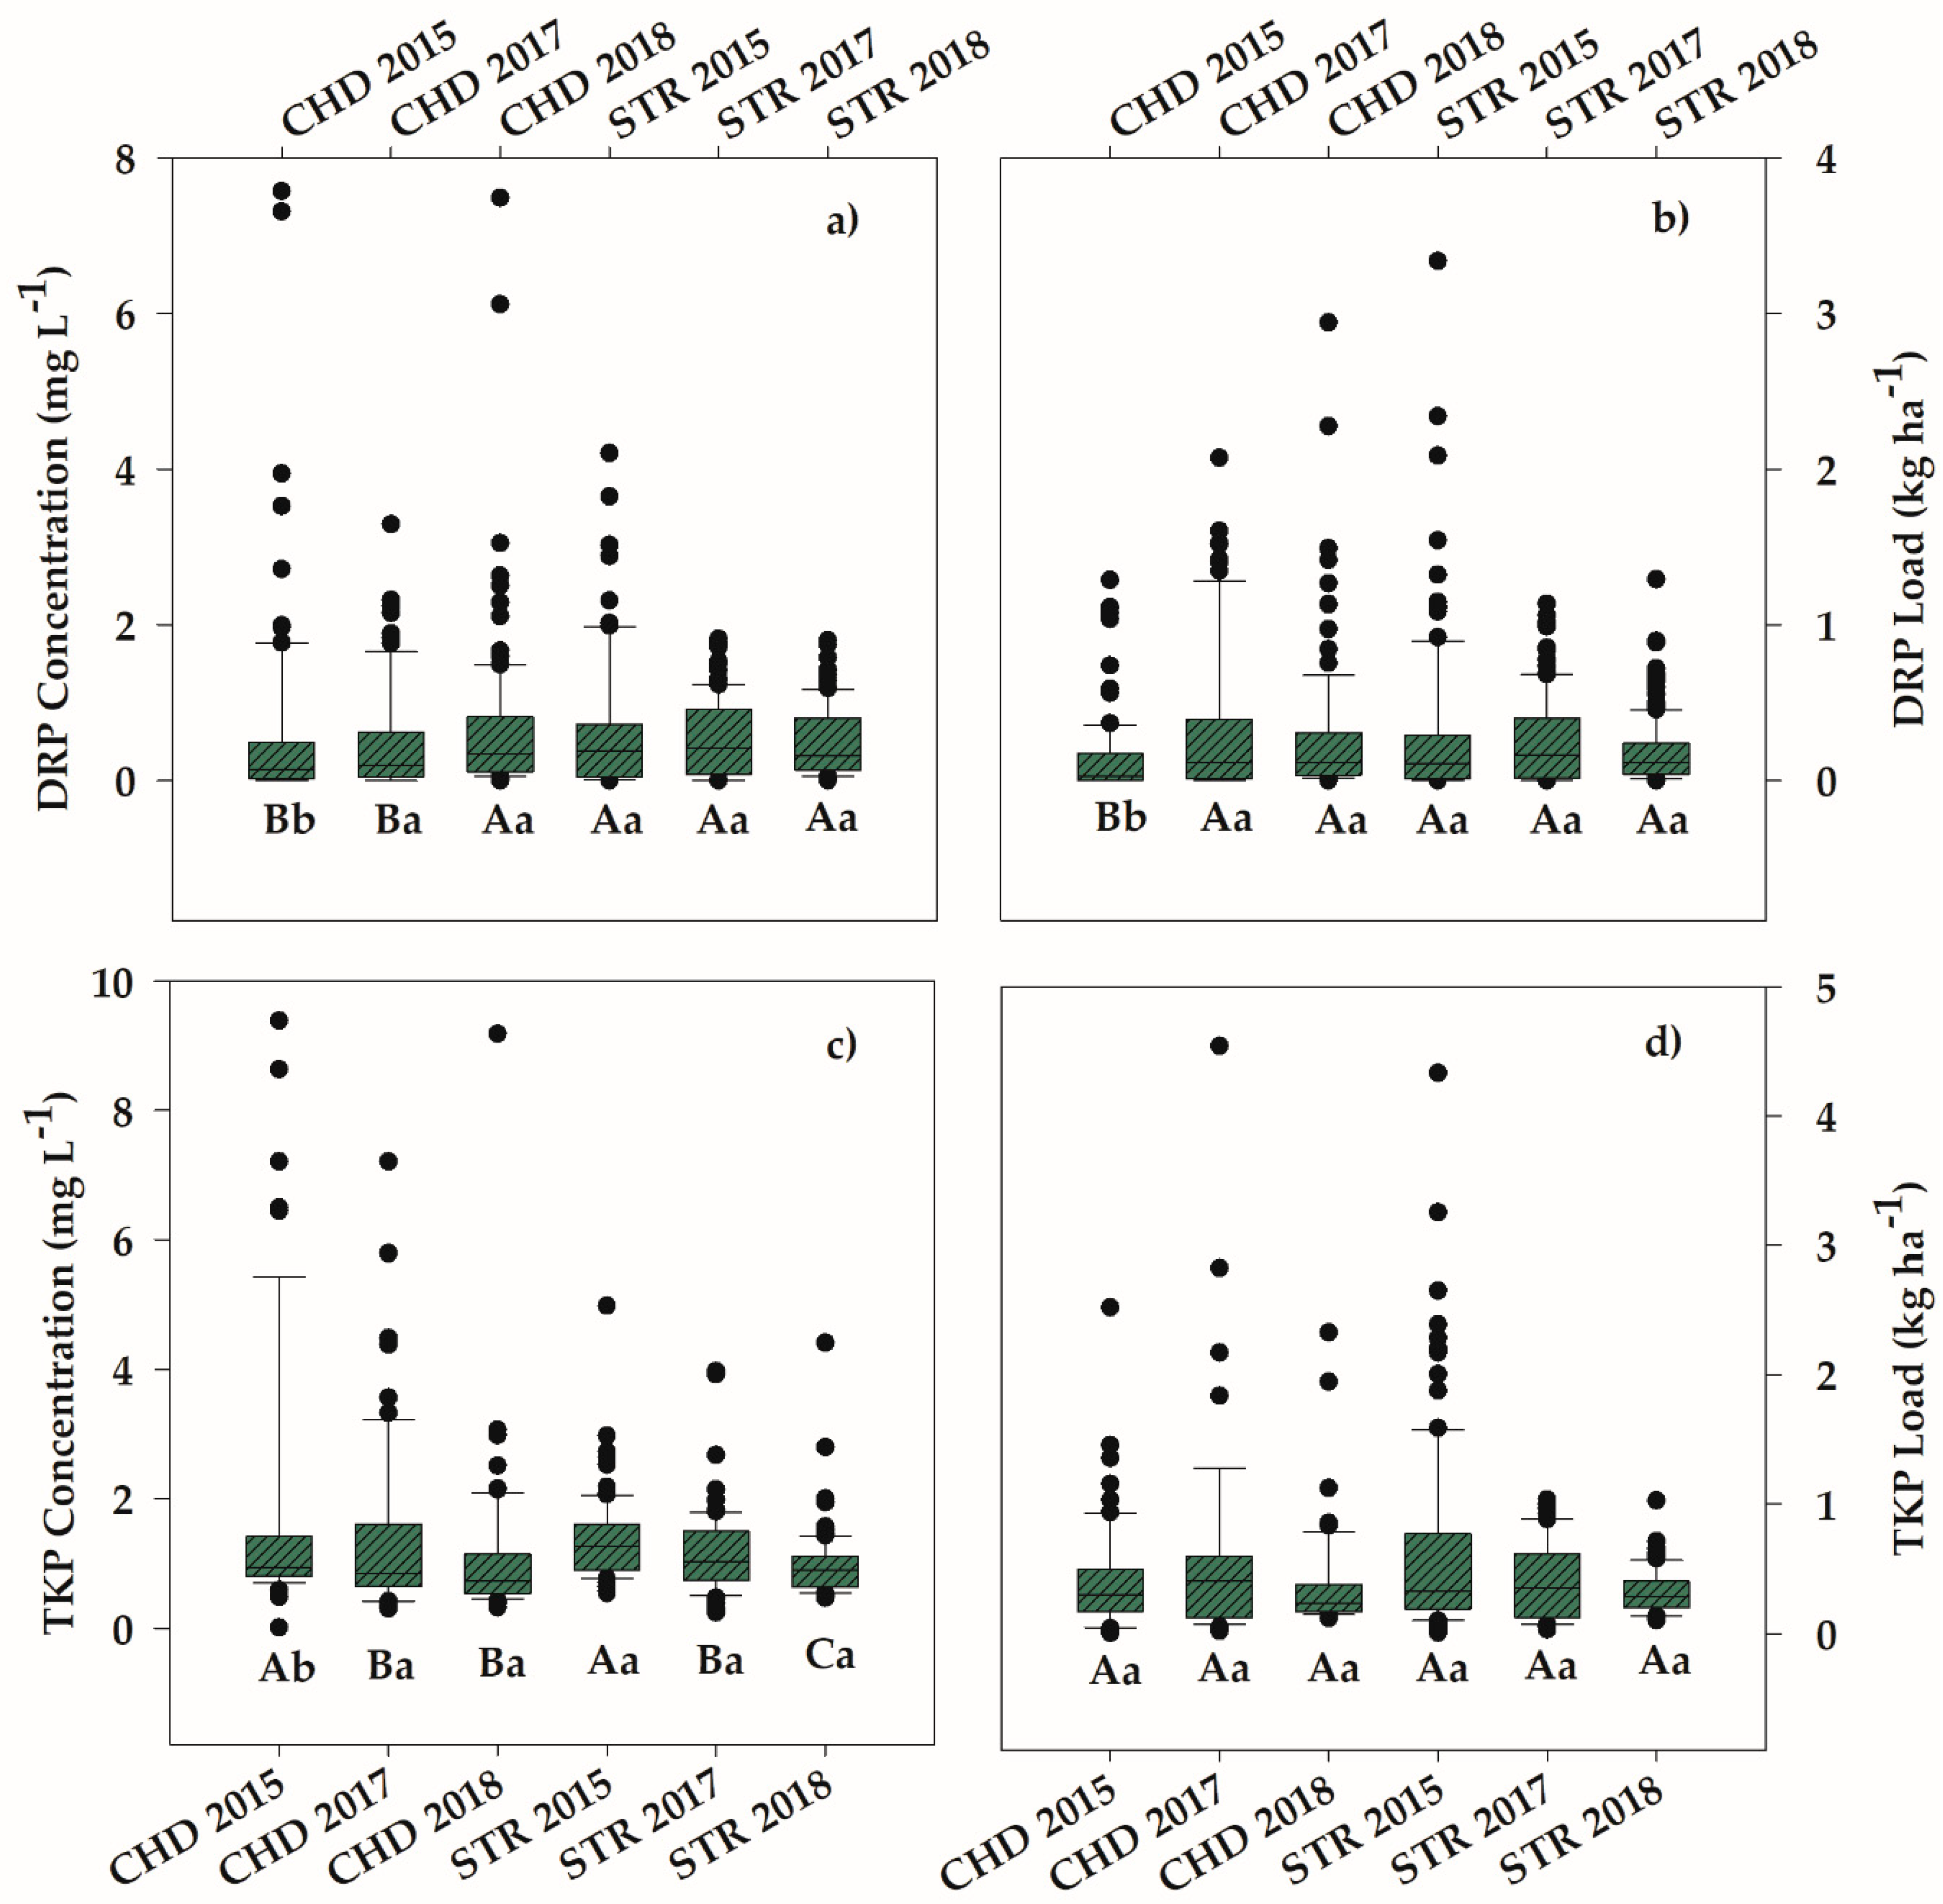
2.5. Conversion of Concentration to Loads of DRP and TKP in Runoff

Amount of runoff was estimated based on the amount of precipitation received, hydrologic condition of the soil and cover on the ground surface using the Curve Number (CN) method for estimating runoff [30]. It should be noted that ground cover conditions varied between post treatment calculations and the hydrologic conditions did not change for post treatment calculations. The CN is related to the potential maximum retention after runoff begins (S) as,
S = (1000/CN) − 10
Initial abstraction (Ia), which represents all losses before runoff begins, is related to S as,
Ia = 0.2S
and was used to estimate the amount of runoff for each rainfall event using Equation (3),
Q = (P − 0.2S)2/(P + 0.8S)
where Q is the amount of runoff, and P is the amount of precipitation. All values of DRP and TKP concentrations were converted to loads in runoff using the amount of runoff generated during each runoff event.

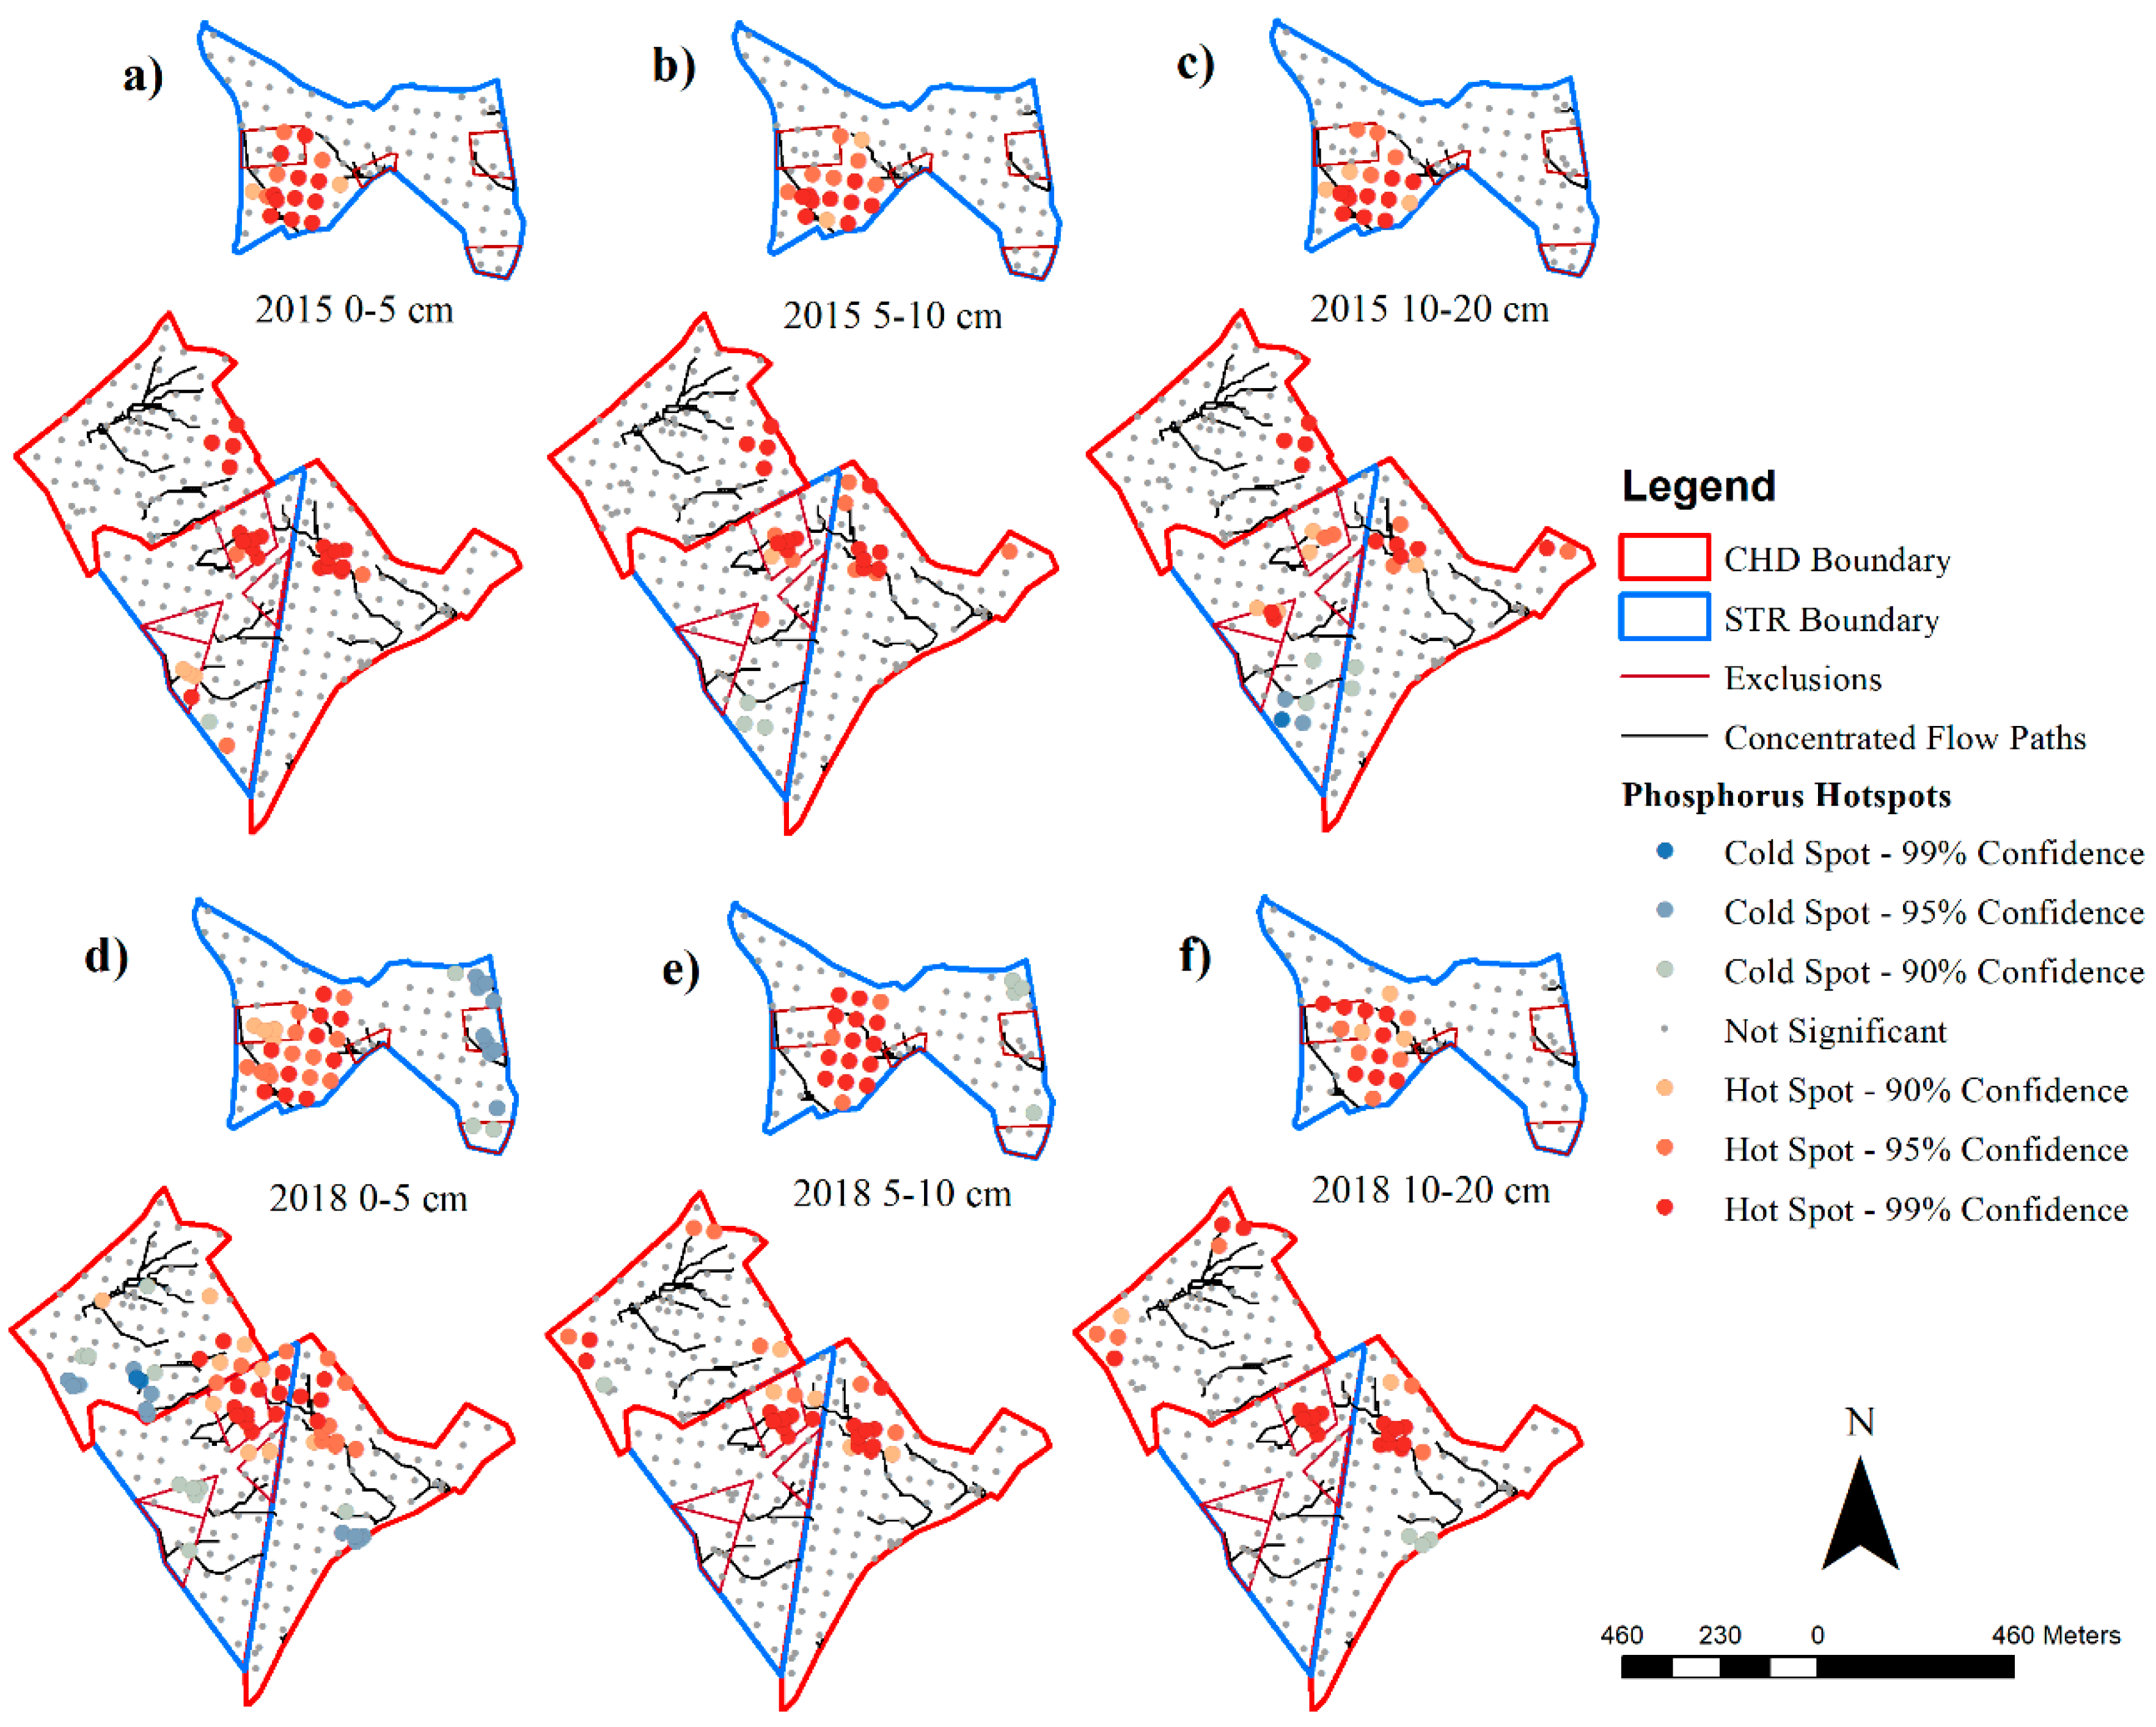
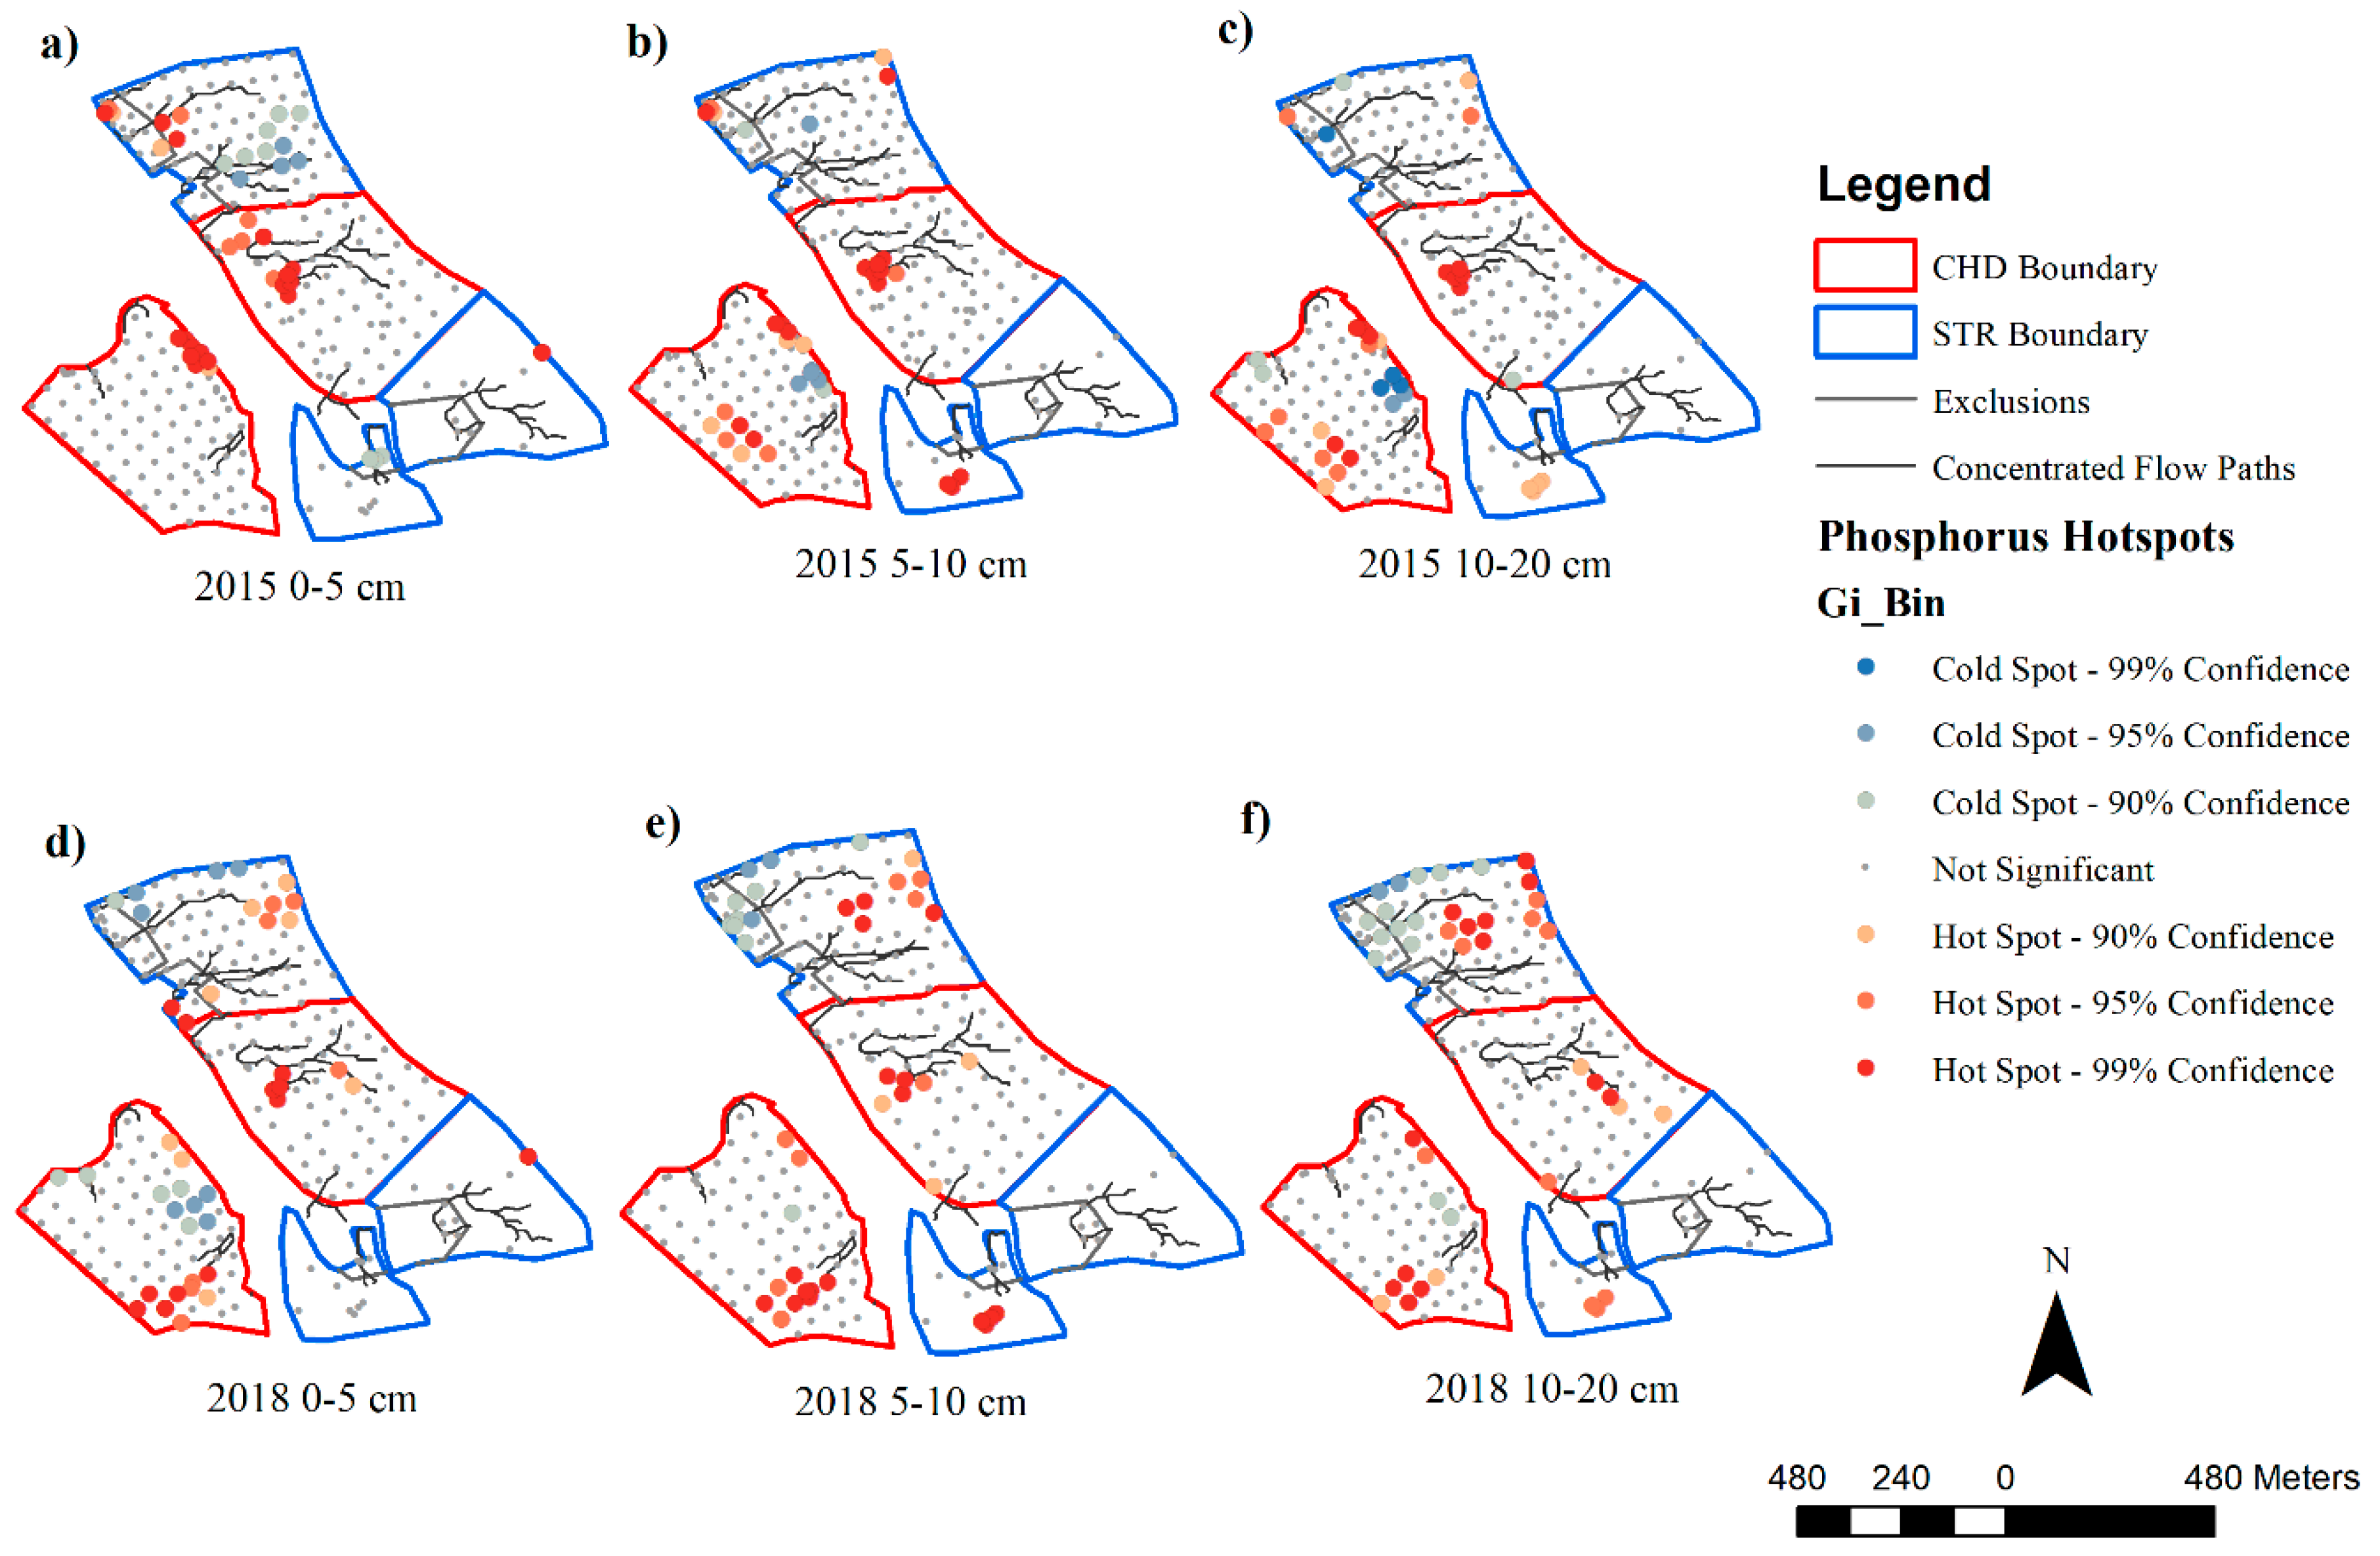
2.6. Spatial Analysis

A Trimble R10 GPS unit (Trimble, Sunnyvale, CA) was used to locate sampling points within the study pastures on a 50 m grid and to collect elevation every 2 m (4 cm resolution) for the development of digital elevation models (DEMs). ArcGIS 10.6.1 (ESRI, Redlands, CA, USA) was used to process the data by storing them in geodatabases. The DEMs were used to identify locations for pour-point collectors and delineation of watersheds. Values of the M1P concentrations in mg kg−1 of each soil depth (0–5, 5–10, and 10–20 cm) at point locations were converted into raster files using “Create TIN” and “TIN to Raster” tools to create a continuous surface (raster file) from the point file (ESRI). The raster files (M1P concentrations) were then used to visualize differences between 2015 and 2018 samples for M1P as 2018 minus 2015 raster for each depth. “Raster calculator” was used to carry out this analysis.
Spatial autocorrelation of M1P was estimated for each pasture under study using the Global Moran’s I tool. Clusters of P in pastures were determined from the point values of M1P using the “Hot Spot Analysis” tool in ArcGIS (ESRI). Since sampling was conducted on a 50 m grid, 55 m was used to ensure more than one neighbor for each point, which would also ensure that not all points were neighbors of each other. The Hot Spot tool calculates the Getis-Ord GI* statistic [31,32], which is a z-score for each point under consideration, along with a p-value denoting significance. Higher z-values (0 to 1) would mean clustering of either high or low P concentrations.

2.7. Statistical Analysis

Comparison of the amount of M1P in soil between sampling periods, 2015 and 2018, was carried out for individual treatments (Baseline-CHD-2015 to Post-Treatment-CHD-2018, and Baseline-STR-2015 to Post-Treatment-STR-2018) using one-way analysis of variance (ANOVA) with differences analyzed by the Wilcoxon Test, which compared median M1P concentration. Comparison of the amount of M1P in soil between CHD and STR pastures at each sampling period (2015 or 2018) was also carried out using one-way ANOVA with differences analyzed by the Wilcoxon Test comparing median M1P concentrations. Comparisons between “exclusions” and “non-exclusions” in STR pastures for 2015 and 2018 sampling periods were carried out using one-way ANOVA. Non-exclusions are all other parts of STR pastures outside of fenced exclusions. The differences revealed were analyzed by the Wilcoxon Test. The Wilcoxon Test was used because of the non-normal M1P distribution.
Concentrations and loads of DRP and TKP in runoff were compared between sampling years (2015, 2017, and 2018) for each of the treatments (CHD or STR) and between CHD and STR treatments for each of the sampling years using one-way ANOVA. Differences were analyzed by the Wilcoxon Each Pair Test as DRP and TKP concentrations and loads did not meet the normal distribution assumption for parametric analysis. Simple linear regression model was used to determine the relationships between soil P (0–5 cm layer) and runoff P loads (DRP load, and TKP load) during Baseline and Post-Treatment. Event loads of DRP and TKP of the individual watersheds were fitted with the average soil-P values for each of the individual watersheds for the Baseline and Post-Treatment periods. Harmel et al. [33] did similar analysis on NO3 and PO4 losses from cropland and grazed pastures. The difference in slopes were analyzed by comparing fitted models with runoff P loads as response variables and soil P as the explanatory variable. Significance of interaction between sampling periods (Baseline vs. Post-Treatment) and soil P denotes difference in regression slopes between Baseline and Post-Treatment. Test of significance was conducted at 0.05 level of significance in all cases. All statistical analysis was carried out using the JMP software package (JMP®, Version 14. SAS Institute Inc., Cary, NC, USA, 1989–2019).

3. Results and Discussion

3.1. Changes in Vertical Distribution of Soil P

In this study, M1P increased significantly from 2015 to 2018 at 0–5 and 5–10 cm in both treatments (Table 3). These results indicate an accumulation of P in the top 10 cm layer of soil for both treatments, with 6.1 and 4.9 times increase in median M1P for the 0–5 cm layer and 2 and 1.6 times increase in median M1P for the 5–10 cm soil layer, CHD and STR pastures, respectively. Optimum M1P in Georgia Piedmont pasture soil is 30 mg P kg−1 [34]. In only a few years, both treatments were able to improve soil P concentrations of the 0–5 cm soil layer from low to moderate (half of the optimum M1P). The increase in M1P at 0–5 cm soil layer in both the treatments was due in part to the manure deposited by the grazing animals. P is relatively immobile in soil [9] and deposition of cattle dung accumulates inorganic P in the top 5 cm soil layer for a wide range of soils [35] while surface applied superphosphate accumulates inorganic P in the top 7.5 cm layer of a silt loam soil [5]. The unexpected increase in M1P at 5–10 cm depth could be explained by the decrease in bulk density [36]. Reduced bulk density results in greater porosity and movement (eluviation and illuviation) of clays and nutrients down the soil profile.
We speculate that soil biology and plant roots were responsible for transporting the available P from the top 5 cm to the 5–10 cm interval. However, this does not fully explain the increase in the 0–5 cm soil layer.
In CHD pastures, the increase at 0–5 cm may be partially explained by hay bales added during the drought in 2016. CHD pastures required 102 hay bales while STR pastures required only 34 hay bales due to sustained vegetation in exclusions late into a 2016 drought. Hay bales distributed at the Eatonton pastures had an average dry weight of 389 kg, 0.28% of which is P [37]. Assuming 1.1 kg P in each hay bale, the amount of P added would be 112 kg P in CHD and 37 kg P in STR pastures. As hay bales were distributed throughout the pasture during treatments and not in areas vulnerable to loss and because P increased in the top two layers, these results indicate that hay distribution can help retain P in pastures. Most P eaten by cattle returns to the soil in the form of manure adding the P eaten in hay and forage. In STR pastures, the increase in the 0–5 cm layer was likely due more to the retention of P deposited by grazing cattle than hay. STR pastures were effective in accumulating P due to redistribution, recycling, and retention of P.

3.2. Spatial Distribution of Phosphorus

With baseline hotspot analysis, all pastures and depths showed clusters of high M1P concentrations at low-lying areas that had high P transport potential (Figure 2a–c and Figure 3a–c). Such hotspots must have been present due to continuous addition of manure and hay at congregation sites such as feeding areas and trees (natural shades). During Post-Treatment sampling, hotspots were still prevalent at similar locations in CHD pastures, but STR pastures showed such hotspots were more prevalent at higher elevations (Figure 2d–f and Figure 3d–f). This has implications as to the reasons for reduced P losses in runoff from the STR pastures (see below).
Change in M1P distribution was mapped for the Eatonton (Figure S1) and the Watkinsville (Figure S2) study pastures calculated as 2018 raster–2015 raster. Difference maps of Eatonton and Watkinsville showed increase in M1P at locations of greater elevations in the pastures as compared to lower elevations. The high lying areas in pastures, denoted by yellowish to red color in the elevation model, showed greater increase in M1P at all three sampling depths in 2018 as compared to 2015. Increased availability of soil P at higher locations would mean greater time for runoff sediments to settle, possibly leading to lower losses of particulate P in runoff.
STR pastures showed lower availability of M1P at low lying exclusions close to streams. However, CHD pastures showed no change with higher M1P at low-lying, edge-of-stream areas making them more prone to lose P in soil as DRP and TKP. These areas were not excluded and over seeded to provide soil cover. It was interesting to see how M1P values were still high in areas at the previous hay-feeding locations in both CHD and STR pastures. STR pastures due to more uniform distribution of change (no hotspots) presented the potential of better redistribution of P compared to CHD.

3.3. Effect of Exclusions

Both excluded and non-excluded areas, in STR pastures only, showed an almost five-fold increase from Baseline to Post-Treatment in the 0–5 cm layer. M1P in the 5–10 cm layer was almost twice as high in exclusions than in non-exclusions in 2018 (Table 4). Significant increases in M1P concentration in exclusions of the STR pastures at 0–5 and 5–10 cm layers suggest more P being captured by exclusions. The over-seeded exclusions could have helped slow runoff water and allowed for greater retention of particulate P even at 5–10 cm depth due to decreased bulk density and continued cover on the soil surface.

3.4. Changes in Runoff Water Phosphorus

Median concentrations and corresponding loads of DRP in runoff samples from CHD treatment was 0.14 mg P L−1 and 0.03 kg P ha−1 in 2015, 0.20 mg L−1 and 0.11 kg ha−1 in 2017, and 0.34 mg P L−1 and 0.12 kg P ha−1 in 2018, respectively. Similarly, in STR pastures, the median concentrations and corresponding loads of DRP were 0.38 mg P L−1 and 0.11 kg P ha−1 in 2015, 0.41 mg P L−1 and 0.17 kg P ha−1 in 2017, and 0.32 mg P L−1 and 0.12 kg P ha−1 in 2018, respectively. The DRP concentrations and loads for the CHD treatments were significantly greater in 2018 when compared to 2015 and 2017 concentrations and loads (Figure 4). Stratification of P near the soil surface makes it more prone to loss in runoff water through desorption of P from soil surface and residues (litter and shoot) by water [38]. In the STR pastures no significant differences in either concentrations or loads of DRP were observed between sampling dates. For a given sampling period, the only significant difference between treatments for DRP concentrations and loads was noted in 2015 data, where STR 2015 was significantly greater than the CHD 2015. Distribution of DRP concentration in runoff samples from the two grazing treatments during the three sampling years revealed the absence of ≥2 mg P L−1 concentration in Post-Treatment runoff samples in the STR pastures. We make note of this as there were two tropical storms that occurred during the period 2017–2018 suggesting that, even during extreme events, the STR grazing system was able to reduce large pulses of DRP in runoff. For example, in 2015 the maximum rainfall event was 163.3 mm with a rainfall intensity of 2.0 mm hr−1 and in 2017 the maximum rainfall event (Hurricane Irma) was 103.6 mm with a rainfall intensity of 4.2 mm hr−1. Yet the maximum concentration in runoff was <2 mg P L−1.
Median concentrations and corresponding loads of TKP in runoff samples from CHD treatment were 0.94 mg P L−1 and 0.30 kg P ha−1 in 2015, 0.85 mg L−1 and 0.40 kg ha−1 in 2017, and 0.74 mg P L−1 and 0.24 kg P ha−1 in 2018, respectively. Similarly, in STR pastures, the median concentrations and corresponding loads of TKP were 1.26 mg P L−1 and 0.33 kg P ha−1 in 2015, 1.03 mg P L−1 and 0.35 kg P ha−1 in 2017, and 0.90 mg P L−1 and 0.30 kg P ha−1 in 2018, respectively. Comparison of TKP concentrations in runoff water between sampling years revealed significantly lower TKP concentration in 2017 sampling compared to 2015 in both treatments. In 2018, however, only STR showed significant decrease in TKP concentration in comparison to both 2015 and 2017. Over-seeded exclusions in STR treatment could have helped reduce the concentration of TKP in runoff water through retention.

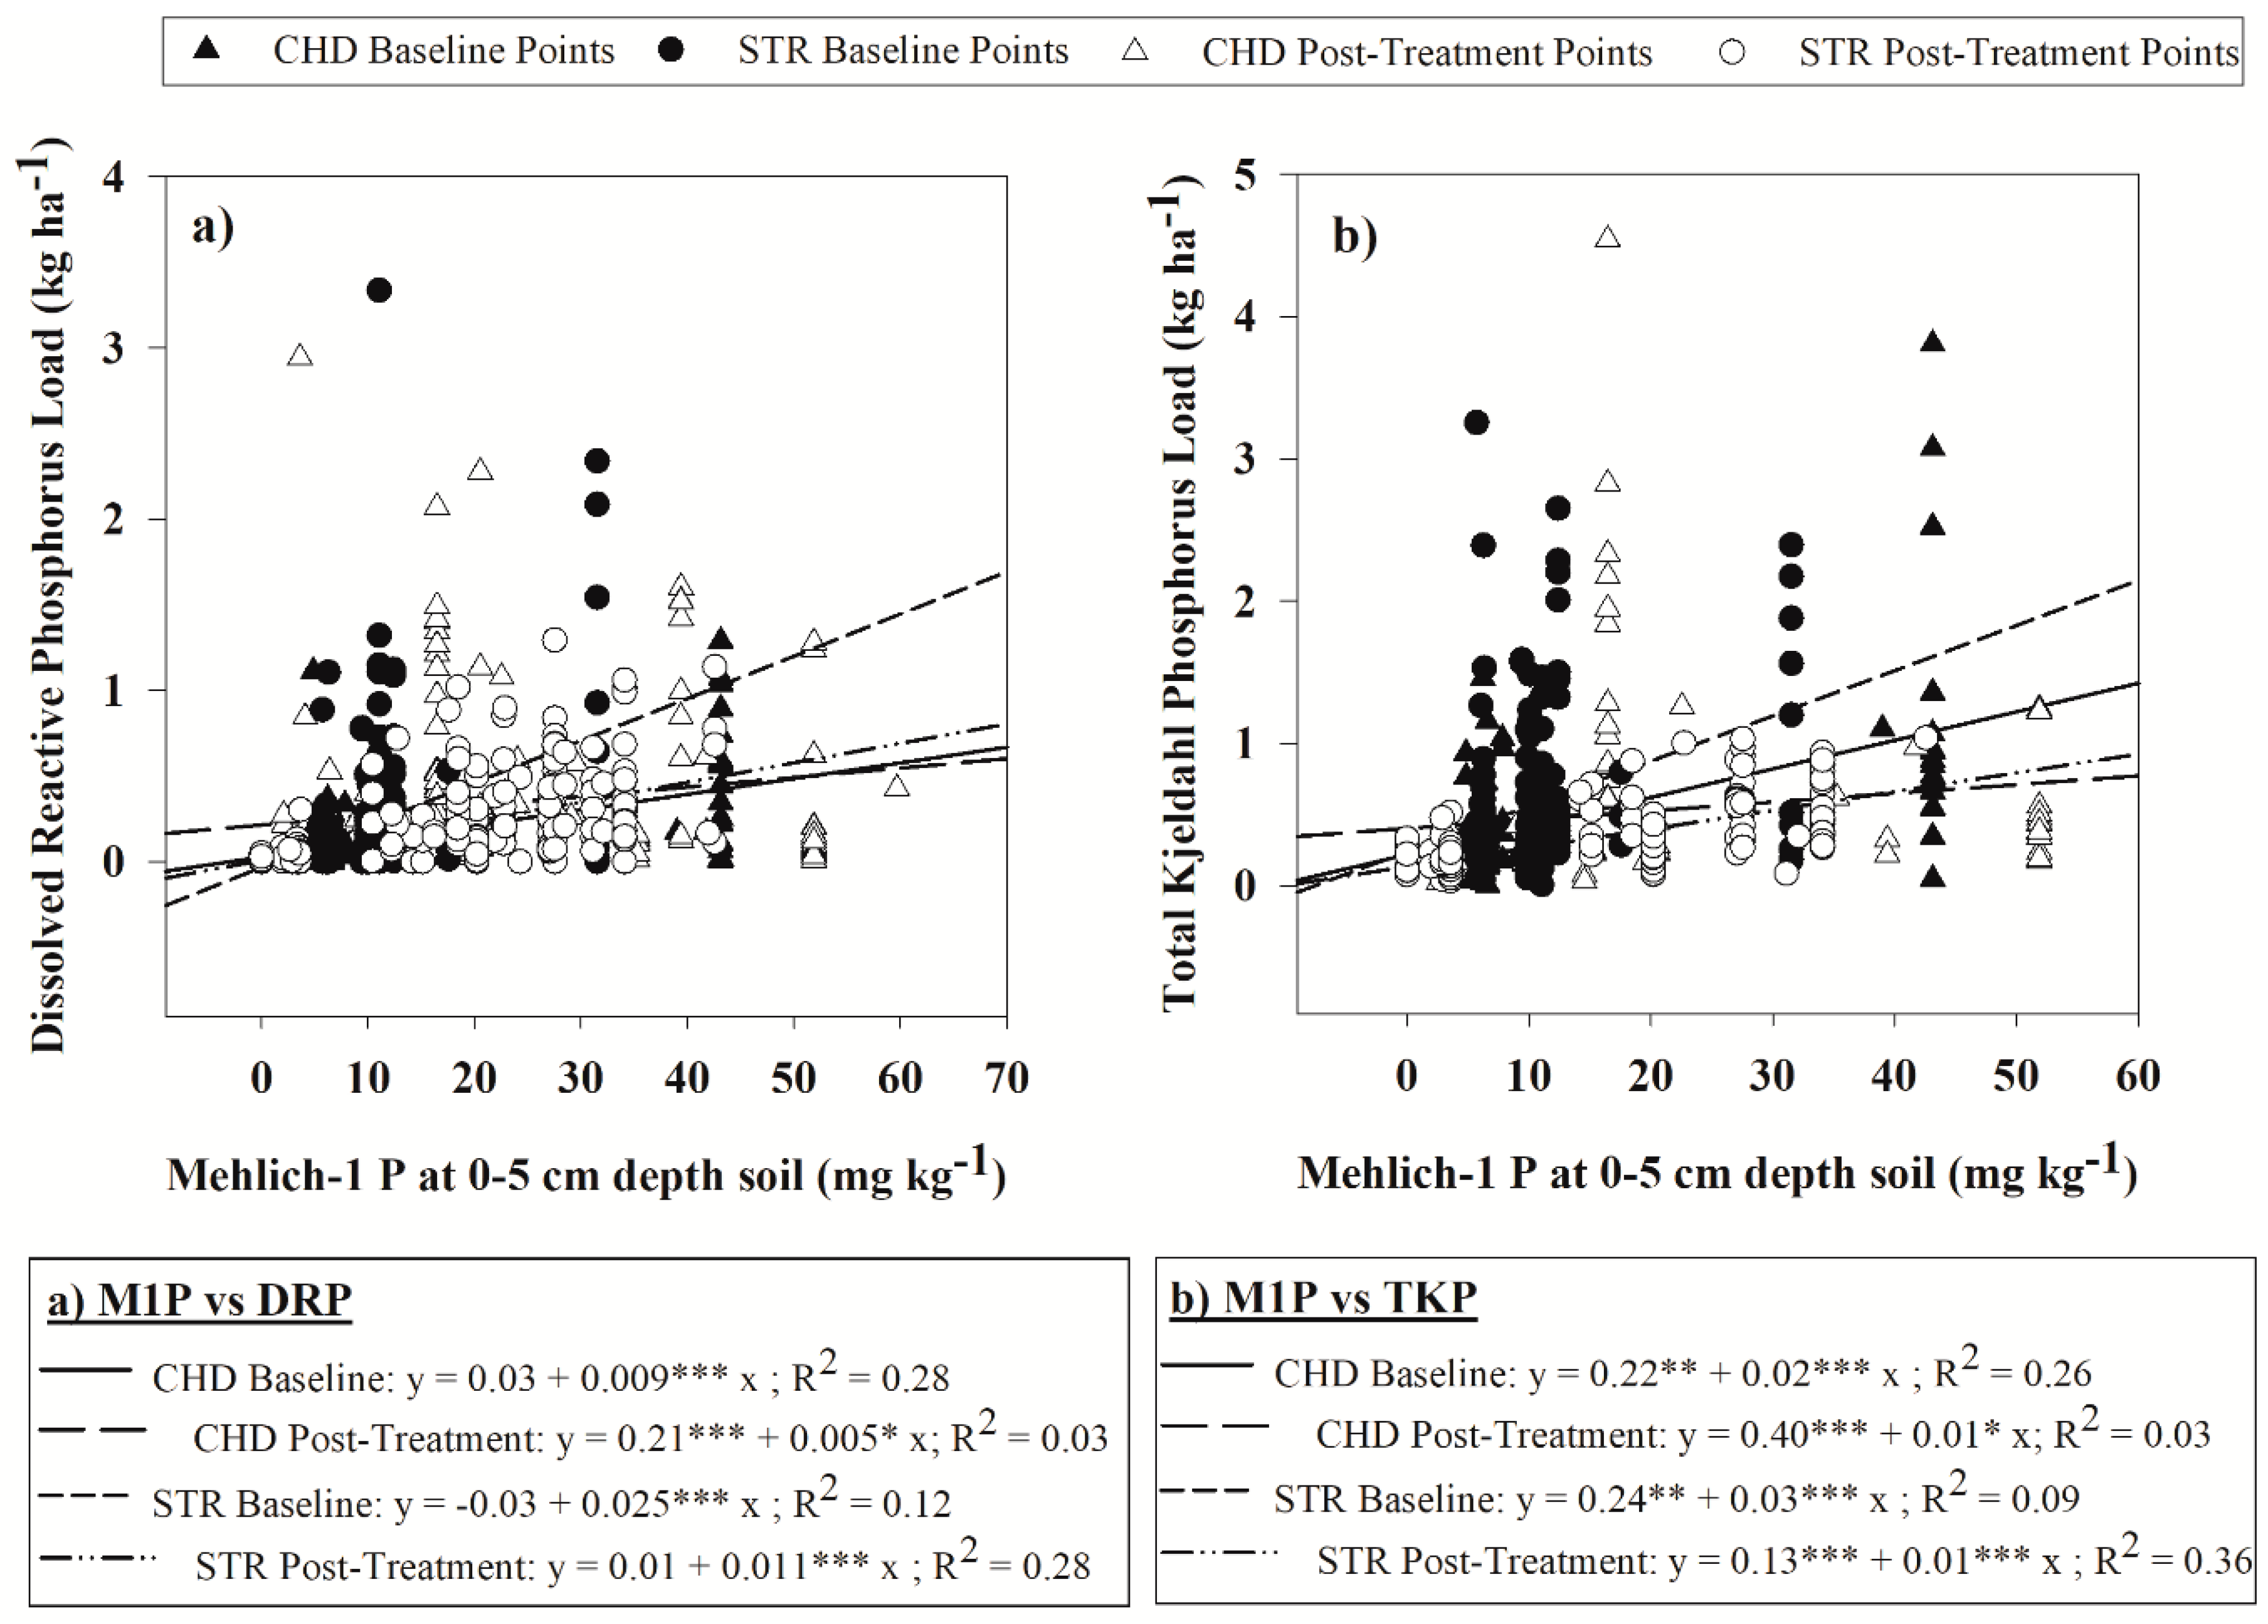
3.5. Relationship between Soil Phosphorus and Phosphorus in Runoff

The relationship between M1P, the plant available fraction of soil P and DRP and TKP loads in surface runoff was studied for CHD and STR grazing treatments over a three-year study period. We found that M1P at 0–5 cm depth was significantly correlated with DRP load in runoff water for both grazing treatments during both sampling dates (Figure 5). As for DRP loads, regression slopes derived from the relationship, DRP versus M1P (0–5 cm soil depth), during Baseline and Post-Treatment were compared using a simple regression model. No differences in the slopes were indicated for CHD pastures between Baseline and Post-Treatment, while the slope in STR pasture was significantly lower for Post-Treatment as compared to Baseline.
Similar relationships between the M1P in soil and TKP in runoff water were studied for the two grazing systems during the two sampling dates. Results revealed significant positive correlation between the soil P and TKP in runoff water. Comparison of regression slopes for the two sampling periods indicated that the slopes were three-fold and two-fold lower during Post-Treatment as compared to Baseline in STR and CHD, respectively. Load of DRP in runoff water per the amount of M1P found in the soil was near half during Post-Treatment sampling compared to Baseline in STR. The intercept of lines relating soil P with TKP loads was significant for both treatments during the Baseline and Post-Treatment samplings. Positive intercept values suggest that the source of total P, other than M1P, could be organic matter at the soil surface [39], in our case, very likely dung and hay residues.
Transport of different P fractions in runoff and interactions with soil P, in exclusion and non-exclusion areas, provide additional insights into loss and transport mechanisms, especially in areas with high P transport potential. P application in areas with high P transport potential should be avoided [40]. More explicitly, areas of high P transport potential need to be managed to reduce P losses in runoff [15]. These would include: (1) steep areas close to streams and prone to erosion, (2) low-lying areas close to the streams, (3) concentrated flow-paths, and (4) high elevation areas with greater slopes. Exclusions placed in areas with high P transport potential can help reduce the P loss from these areas. In our study, exclusions at low-lying areas aided in the retention of particulate P and its vertical movement deeper into the rhizosphere. Vegetation in the exclusions served as buffers that interrupted the direct interaction of runoff water with the soil and slowed runoff water down, therefore facilitating deposition of particulate P. Furthermore, allowance of flash grazing of these areas resulted in continued use of these areas as grazing lands, while still reducing the amount of time cattle were present in the vulnerable areas causing chronic, direct deposition of manure. Vegetated exclusions acted as buffers and provided opportunity for the P in runoff to settle and infiltrate 10 cm into the soil while also reducing the amount of particulate P lost in runoff.

4. Conclusions

After three years of application of STR grazing system, soil P in the 0–5 and 5–10 cm depths increased significantly compared to historically continuously grazed systems that had hay-feeding and watering at the same locations yearly. The CHD grazing system with hay distribution at different locations also increased soil P. In STR pastures, exclusions increased soil P at 0–5 and 5–10 cm depths in Post-Treatment showing retention of P and reduction in total P losses in runoff water. Exclusions also provided added benefits of forage availability during drought, and reduced interaction of animals with vulnerable low-lying locations in pastures. Combining rotational grazing (every 5 to 10 days) and lure management of cattle with movable equipages aided in recycling of soil P to less vulnerable high-lying portions of the pastures, which was demonstrated by hotspot analysis. Hotspots of soil P prevalent at vulnerable areas during the baseline period moved to higher locations in STR pastures allowing greater retention of P. With the increase in soil P, DRP losses increased in both treatments, however, less occurrence of larger P losses during extreme events in the STR treatment suggests that STR grazing systems could be more resistant to extreme weather events. TKP losses were reduced significantly with CHD and STR grazing management systems as they ensured distribution of P in areas less vulnerable to loss in runoff. Hence, CHD and STR grazing managements present considerable potential to retain P for forage use rather than being exported to aquatic systems. Further research is needed to determine the effectiveness of these management practices on pastures fertilized with broiler litter and in other landscapes beyond the Georgia Piedmont.

Supplementary Materials

The following are available online at https://0-www-mdpi-com.brum.beds.ac.uk/2571-8789/4/4/66/s1, Figure S1: Spatial distribution of change in Mehlich-1 phosphorus (change mg kg−1 = 2018 raster−2015 raster) at Eatonton location. Figure S2: Difference and DEM of Watkinsville pastures: Spatial distribution of change in Mehlich-1 phosphorus (change mg kg−1 = 2018 raster–2015 raster) at Watkinsville location.

Author Contributions

Conceptualization, D.F.; methodology, D.F. and A.S.; formal analysis, A.S.; investigation, A.S., D.F., S.D., and A.M.; writing—original draft preparation, A.S.; writing—review and editing, A.S., D.F., and M.C.; funding acquisition, D.F. All authors have read and agreed to the published version of the manuscript.

Funding

This research was funded by NRCS-USDA, Conservation Innovation Grant. Grant number 69-3A75-14-251.

Acknowledgments

The authors are grateful to NRCS-USDA for their assistance with the first order soil survey, and to the Sustainable Agriculture Laboratory team, and Charles Trumbo at the University of Georgia for their support in lab and in field.

Conflicts of Interest

The authors declare no conflict of interest.

References

  1. Sharpley, A. Managing agricultural phosphorus to minimize water quality impacts. Sci. Agric. 2016, 73, 1–8. [Google Scholar] [CrossRef]
  2. Rothwell, S.A.; Doody, D.G.; Johnston, C.; Forber, K.J.; Cencic, O.; Rechberger, H.; Withers, P.J.A. Phosphorus stocks and flows in an intensive livestock dominated food system. Resour. Conserv. Recycl. 2020, 163, 105065. [Google Scholar] [CrossRef]
  3. McDowell, R.W.; Nash, D.M.; Robertson, F. Sources of phosphorus lost from a grazed pasture receiving simulated rainfall. J. Environ. Qual. 2007, 36, 1281–1288. [Google Scholar] [CrossRef] [PubMed]
  4. Chapin, F.S.; Matson, P.A.; Vitousek, P.M. Nutrient cycling. In Principles of Terrestrial Ecosystem Ecology; Springer: New York, NY, USA, 2011; pp. 259–296. [Google Scholar] [CrossRef]
  5. Tian, J.; Boitt, G.; Black, A.; Wakelin, S.; Condron, L.M.; Chen, L. Accumulation and distribution of phosphorus in the soil profile under fertilized grazed pasture. Agric. Ecosyst. Environ. 2017, 239, 228–235. [Google Scholar] [CrossRef]
  6. McLaren, T.I.; Smernik, R.J.; Simpson, R.J.; McLaughlin, M.J.; McBeath, T.M.; Guppy, C.N.; Richardson, A.E. The chemical nature of organic phosphorus that accumulates in fertilized soils of a temperate pasture as determined by solution 31P NMR spectroscopy. J. Plant Nutr. Soil Sci. 2017, 180, 27–38. [Google Scholar] [CrossRef]
  7. Dodd, R.J.; Sharpley, A.N. Recognizing the role of soil organic phosphorus in soil fertility and water quality. Resour. Conserv. Recycl. 2015, 105, 282–293. [Google Scholar] [CrossRef]
  8. During, C.; Weeda, W.C. Some effects of cattle dung on soil properties, pasture production, and nutrient uptake: I. Dung as a source of phosphorus. N. Z. J. Agric. Res. 1973, 16, 423–430. [Google Scholar] [CrossRef]
  9. Coleman, T.L.; Eke, A.U.; Bishnoi, U.R.; Sabota, C. Nutrient losses in eroded sediment from a limited-resource farm. Field Crop. Res. 1990, 24, 105–117. [Google Scholar] [CrossRef]
  10. Vadas, P.A.; Gburek, W.J.; Sharpley, A.N.; Kleinman, P.J.; Moore, P.A., Jr.; Cabrera, M.L.; Harmel, R.D. A model for phosphorus transformation and runoff loss for surface-applied manures. J. Environ. Qual. 2007, 36, 324–332. [Google Scholar] [CrossRef] [Green Version]
  11. Butler, D.M.; Franklin, D.H.; Ranells, N.N.; Poore, M.H.; Green, J.T., Jr. Ground cover impacts on sediment and phosphorus export from manured riparian pasture. J. Environ. Qual. 2006, 35, 2178–2185. [Google Scholar] [CrossRef]
  12. Yoshitake, S.; Soutome, H.; Koizumi, H. Deposition and decomposition of cattle dung and its impact on soil properties and plant growth in a cool-temperate pasture. Ecol. Res. 2014, 29, 673–684. [Google Scholar] [CrossRef]
  13. Hirata, M.; Sugimoto, Y.; Ueno, M. Return of dung to bahiagrass (Paspalum notatum Flugge) pasture by dairy cattle. Jpn. J. Grassl. Sci. 1990, 35, 350–357. [Google Scholar] [CrossRef]
  14. Franzluebbers, A.J.; Poore, M.H.; Freeman, S.R.; Rogers, J.R. Soil-surface nutrient distributions in grazed pastures of North Carolina. J. Soil Water Conserv. 2019, 74, 571–583. [Google Scholar] [CrossRef] [Green Version]
  15. Sharpley, A.; Helmers, M.J.; Kleinman, P.; King, K.; Leytem, A.; Nelson, N. Managing crop nutrients to achieve water quality goals. J. Soil Water Conserv. 2019, 74, 91A–101A. [Google Scholar] [CrossRef] [Green Version]
  16. Haygarth, P.M.; Jarvis, S.C. Soil derived phosphorus in surface runoff from grazed grassland lysimeters. Water Res. 1997, 31, 140–148. [Google Scholar] [CrossRef]
  17. Zhang, R.; Li, M.; Yuan, X.; Pan, Z. Influence of rainfall intensity and slope on suspended solids and phosphorus losses in runoff. Environ. Sci. Pollut. Res. 2019, 26, 33963–33975. [Google Scholar] [CrossRef] [PubMed]
  18. Miller, J.J.; Curtis, T.; Chanasyk, D.S.; Willms, W.D. Influence of cattle trails on runoff quantity and quality. J. Environ. Qual. 2017, 46, 348–355. [Google Scholar] [CrossRef]
  19. Shigaki, F.; Sharpley, A.; Prochnow, L.I. Rainfall intensity and phosphorus source effects on phosphorus transport in surface runoff from soil trays. Sci. Total Environ. 2007, 373, 334–343. [Google Scholar] [CrossRef]
  20. Bilotto, F.; Vibart, R.; Mackay, A.; Costall, D. Modelling long-term changes in soil phosphorus and carbon under contrasting fertiliser and grazing management in New Zealand hill country. J. N. Z. Grassl. 2019, 81, 171–178. [Google Scholar] [CrossRef]
  21. Nellesen, S.; Kovar, J.; Haan, M.; Russell, J. Grazing management effects on stream bank erosion and phosphorus delivery to a pasture stream. Can. J. Soil Sci. 2011, 91, 385–395. [Google Scholar] [CrossRef]
  22. Kurz, I.; O’Reilly, C.D.; Tunney, H. Impact of cattle on soil physical properties and nutrient concentrations in overland flow from pasture in Ireland. Agric. Ecosyst. Environ. 2006, 113, 378–390. [Google Scholar] [CrossRef]
  23. Malan, J.A.C.; Flint, N.; Jackson, E.L.; Irving, A.D.; Swain, D.L. Offstream watering points for cattle: Protecting riparian ecosystems and improving water quality? Agric. Ecosyst. Environ. 2018, 256, 144–152. [Google Scholar] [CrossRef]
  24. Pilon, C.; Moore, P.A.; Pote, D.H.; Pennington, J.H.; Martin, J.W.; Brauer, D.K.; Raper, R.L.; Dabney, S.M.; Lee, J. Long-term effects of grazing management and buffer strips on soil erosion from pastures. J. Environ. Qual. 2017, 46, 364–372. [Google Scholar] [CrossRef] [PubMed]
  25. Dubeux, J.C.; Sollenberger, L.E. Nutrient cycling in grazed pastures. In Management Strategies for Sustainable Cattle Production in Southern Pastures; Academic Press: Cambridge, MA, USA, 2020; pp. 59–75. [Google Scholar] [CrossRef]
  26. Hendricks, T.; Franklin, D.; Dahal, S.; Hancock, D.; Stewart, L.; Cabrera, M.; Hawkins, G. Soil carbon and bulk density distribution within 10 Southern Piedmont grazing systems. J. Soil Water Conserv. 2019, 74, 323–333. [Google Scholar] [CrossRef]
  27. Mehlich, A. Determination of P, Ca, Mg, K, Na, and NH4. N. Carol. Soil Test Div. 1953, 23–89. [Google Scholar]
  28. Murphy, J.; Riley, J.P. A modified single solution method for the determination of phosphate in natural waters. Anal. Chim. Acta 1962, 27, 31–36. [Google Scholar] [CrossRef]
  29. Jirka, A.M.; Carter, M.J.; May, D.; Fuller, F.D. Ultramicro semiautomated method for simultaneous determination of total phosphorus and total Kjeldahl nitrogen in waste waters. Environ. Sci. Technol. 1976, 10, 1038–1044. [Google Scholar] [CrossRef]
  30. Cronshey, R.G.; Roberts, R.T.; Miller, N. Urban hydrology for small watersheds (TR-55 Rev.). In Hydraulics and Hydrology in the Small Computer Age; ASCE: Reston, VA, USA, 1985; pp. 1268–1273. [Google Scholar]
  31. Getis, A.; Ord, J.K. The analysis of spatial association by use of distance statistics. Geogr. Anal. 1992, 24, 189–206. [Google Scholar] [CrossRef]
  32. Ord, J.K.; Getis, A. Local spatial autocorrelation statistics: Distributional issues and an application. Geogr. Anal. 1995, 27, 286–306. [Google Scholar] [CrossRef]
  33. Harmel, R.D.; Smith, D.R.; Haney, R.L.; Dozier, M. Nitrogen and phosphorus runoff from cropland and pasture fields fertilized with poultry litter. J. Soil Water Conserv. 2009, 64, 400–412. [Google Scholar] [CrossRef] [Green Version]
  34. Kissel, D.; Sonon, L. Soil Test Handbook for Georgia. Georgia Cooperative Extension Service; Special Bulletin 62; College of Agricultural and Environmental Sciences, University of Georgia: Athens, GA, USA, 2015; p. II-13A. [Google Scholar]
  35. Aarons, S.R.; O’Connor, C.R.; Gourley, C.J.P. Dung decomposition in temperate dairy pastures. I. Changes in soil chemical properties. Soil Res. 2004, 42, 107–114. [Google Scholar] [CrossRef] [Green Version]
  36. Subedi, A.; Franklin, D.; Dahal, S.; Cabrera, M. Strategic grazing management effects on loss-on-ignition carbon and bulk density in soil and total suspended sediments, carbon in sediment, and dissolved organic carbon in runoff water. J. Environ. Qual. 2020. under review. [Google Scholar]
  37. Cabrera, M.L.; University of Georgia, Athens, GA, USA. Personal communication, 2020.
  38. Ryan, M.H.; Tibbett, M.; Lambers, H.; Bicknell, D.; Brookes, P.; Barrett-Lennard, E.G.; Ocampo, C.; Nicol, D. Pronounced surface stratification of soil phosphorus, potassium and sulfur under pastures upstream of a eutrophic wetland and estuarine system. Soil Res. 2017, 55, 657–669. [Google Scholar] [CrossRef]
  39. Schroeder, P.D.; Radcliffe, D.E.; Cabrera, M.L.; Belew, C.D. Relationship between soil test phosphorus and phosphorus in runoff: Effects of soil series variability. J. Environ. Qual. 2004, 33, 1452–1463. [Google Scholar] [CrossRef] [Green Version]
  40. Sharpley, A.N.; Daniel, T.; Gibson, G.; Bundy, L.; Cabrera, M.; Sims, T.; Stevens, R.; Lemunyon, J.; Kleinman, P.; Parry, R. Best Management Practices to Minimize Agricultural Phosphorus Impacts on Water Quality. ARS-163 2006; USDA-ARS: Washington, DC, USA, 2006.
Figure 1. Maps showing; (a) Eatonton and (b) Watkinsville study sites with concentrated flow paths, pasture boundaries (CHD: continuous grazing with hay distribution, and STR: strategic grazing), runoff collectors, exclusions, and sampling locations (black dots).
Soilsystems 04 00066 g001
Figure 2. Hotspots of Mehlich-1 phosphorus (M1P) concentrations at 0–5, 5–10, and 10–20 cm soil depths during Baseline sampling (2015; (ac)) and Post-Treatment (2018; (df)) at the Eatonton pastures.
Soilsystems 04 00066 g002
Figure 3. Hotspots of Mehlich-1 phosphorus (M1P) concentrations at 0–5, 5–10, and 10–20 cm soil depths during Baseline sampling (2015; (ac)) and Post-Treatment (2018; (df)) at the Watkinsville pastures.
Soilsystems 04 00066 g003
Figure 4. Comparison of dissolved reactive phosphorus (DRP). (a) DRP concentrations (mg L−1), (b) DRP loads (kg ha−1), (c) total Kjeldahl phosphorus (TKP) concentrations (mg L−1), and (d) TKP loads (kg ha−1) from Baseline (2015) to 2017 and 2018 in continuous grazing with hay distribution (CHD) and strategic grazing (STR) pastures. Upper-case letters denote comparison between sampling years for individual treatment (example: CHD, 2015 vs. CHD, 2017 vs. CHD, 2018) and lower-case letters denote comparison between CHD and STR treatments for individual sampling periods (example: CHD, 2015 vs. STR, 2015). Different letters denote significance at 0.05 level.
Soilsystems 04 00066 g004
Figure 5. Relationship of (a) dissolved reactive phosphorus (DRP) load and (b) total Kjeldahl phosphorus (TKP) in runoff water and Mehlich-1 Phosphorus (M1P) in 0–5 cm depth soil compared between Baseline (2015) and Post-Treatment (2016–2018) sampling dates in continuous grazing with hay distribution (CHD) and strategic (STR) grazing treatments. *, **, and *** represent statistical significance at ≤0.05, ≤0.01, and ≤0.001, respectively.
Soilsystems 04 00066 g005
Table 1. Area and number of soil sampling points in areas of interest (AOI) and matrix (50 m grid) for pastures at Eatonton and Watkinsville locations. Pasture abbreviations indicated locations relative to each other within each research location (ENE is east northeast, ENW is east northwest, etc.). Treatments are strategic grazing (STR) or continuous-grazing-with-hay-distribution (CHD).
PasturesTreatmentArea (ha)Number of Sampling Points
AOIMatrix
Eatonton Beef Research Unit, Eatonton, Putnam county
ENESTR21.531274
ENWCHD18.421464
ESECHD17.961164
ESWSTR17.981062
JPC, Watkinsville, Oconee county
WNESTR15.061170
WNWCHD16.971872
WSECHD18.41955
WSWSTR11.441012
Table 2. Soil classifications of Eatonton and Watkinsville study pastures.
LocationSoil Series (% Area)ClassTextureSlopeDrainage
EatontonDavidson (60%)Fine, kaolinitic, thermic, Rhodic KandiudultsLoam to Clay Loam2–15%Well Drained
Wilkes (17%)Loamy, mixed, active, thermic, shallow Typic HapludalfsLoam to Sandy Loam10–25%Well Drained
Iredell (12%)Fine, mixed, active, thermic Oxyaquic Vertic HapludalfsSandy Loam<6%Moderately Well Drained
Enon (11%)Fine, mixed, active, thermic Ultic HapludalfsFine Sandy Loam2–25%Well Drained
WatkinsvilleCecil (60%)Fine, kaolinitic, thermic Typic KanhapludultsSandy Loam0–25%Well Drained
Pacolet (40%)Fine, kaolinitic, thermic Typic KanhapludultsSandy Clay Loam15–25%Well Drained
Table 3. Median Mehlich-1 phosphorus (M1P) in 2015 (Baseline) and 2018 (Post-Treatment) sampling dates in continuous grazing with hay distribution (CHD) and strategic grazing (STR) pastures.
DepthMedian CHD, 2015Median CHD, 2018Median STR, 2015Median STR, 2018
cmmg P kg−1
0–52.4Bb14.7Aa3.1Ba15.1Aa
5–102.7Ba5.4Aa2.4Bb3.9Ab
10–202.2Aa2.3Aa2.1Aa1.6Aa
Medians separated by different upper-case letters denote significant difference between sampling dates within treatments (i.e., CHD, 2015, compared to CHD, 2018). Medians separated by different lower-case letters denote significant difference between treatments on the same sampling date (i.e., CHD, 2015, compared to STR, 2015). Difference is at 0.1 level of significance.
Table 4. Median Mehlich-1 phosphorus (M1P) in exclusions and non-exclusions in 2015 (Baseline) and 2018 (Post-Treatment) in strategic grazing (STR) pastures.
DepthNon-ExclusionsExclusions
2015201820152018
cmmg P kg−1
0–52.58B 1a 212.79Ab3.48Ba17.89Aa
5–102.28Aa2.97Ab2.6Ba5.76Aa
10–202.14Aa1.41Ba2.03Aa4.12Aa
1 Medians separated by different upper-case letters denote significant difference between sampling dates in either non-exclusion (Non-Exclusions, 2015 vs. Non-Exclusion, 2018) or exclusion (Exclusions, 2015 vs. Exclusion, 2018). 2 Medians separated by lower-case letters denote significant difference between non-exclusion and exclusion at individual sampling dates (Non-Exclusions, 2015 vs. Exclusions, 2015). Difference is at 0.05 level of significance.
Publisher’s Note: MDPI stays neutral with regard to jurisdictional claims in published maps and institutional affiliations.

