
Heavy Metals Contamination of Urban Soils—A Decade Study in the City of Lisbon, Portugal
by
 , and
, and
Hugo Félix Silva
1,2,3 ,
,
Nelson Frade Silva
1,2,3,
Cristina Maria Oliveira
2 and
Manuel José Matos
1,3,4,* 1
ISEL-ADEQ, Área Departamental de Engenharia Química do Instituto Superior de Engenharia de Lisboa, Rua Conselheiro Emídio Navarro, 1, 1059-007 Lisboa, Portugal
2
Centro de Química Estrutural, Faculdade de Ciências, Universidade de Lisboa, Campo Grande, 1749-016 Lisboa, Portugal
3
CIEQB, Instituto Superior de Engenharia de Lisboa, Rua Conselheiro Emídio Navarro, 1, 1059-007 Lisboa, Portugal
4
IT, Instituto de Telecomunicações, IST, Avenida Rovisco Pais, 1049-001 Lisboa, Portugal
*
Author to whom correspondence should be addressed.
Soil Syst. 2021, 5(2), 27; https://0-doi-org.brum.beds.ac.uk/10.3390/soilsystems5020027
Submission received: 10 March 2021
/
Revised: 6 April 2021
/
Accepted: 9 April 2021
/
Published: 13 April 2021
(This article belongs to the Special Issue Assessment and Remediation of Soils Contaminated by Potentially Toxic Elements (PTE))
Abstract
:There is an intense and continuous growth of the world population living in cities. This increase in population means an increase in car traffic, an increase in new constructions and an increase in the production of waste that translates into an intensive use of land, particularly in terms of soil contaminants. Among other environmental contaminants, toxic metals, such as lead (Pb), cadmium (Cd), nickel (Ni) and chromium (Cr) represent a public health problem. In this study the content of toxic metals in Lisbon’s (Portugal) soils was determined. The study was conducted over approximately a decade in six city locations, with a total of about 700 samples. Each site has different urban characteristics: traffic zone, residential area, urban park and mixed areas. The study allowed to verify the heterogeneity of metal content values in the city soils and their dependence on local traffic. Metal contents were determined by graphite furnace atomic absorption spectroscopy (GFAAS). For each site the geo-accumulation index, pollution factor, degree of contamination, pollution load index and ecological risk factor were calculated. The mean concentrations of Cd, Cr, Ni and Pb in soils were 0.463, 44.0, 46.6 and 5.73 mg/kg of dry soil, respectively. In the last year of the study the values were 0.417, 51.5, 62.4 and 8.49 mg/kg of dry soil, respectively. Cd and Ni exceeded the typical content values of these metals in the earth’s crust, indicating their anthropogenic origin. The correlation analysis revealed a significant correlation between Cr and Ni, Cd and Ni and Cd and Pb contents in the city soils. Regarding the results obtained in this long monitoring campaign, Lisbon’s soils can be considered as having low levels of pollution by these metals.
1. Introduction
The population living in urban areas has been continuously increasing in the last few decades [1,2] and it is estimated by the United Nations that nowadays the majority of people lives in urban areas, not only in Europe but also in less developed countries [3]. Urban environments have then become extremely important in what human health and wellbeing is concerned. Urban soils are a fundamental component of urban ecosystems contributing directly or indirectly to the general quality of life of cities’ inhabitants. They play an important role in many processes such as in the cycling of elements, filtration of water, supporting plants and some built infrastructures. However, soils are very often contaminated by the anthropogenic activities like vehicle traffic or industrial activities [4,5].
Different anthropogenic sources, just like industry, energy production and fossil fuels combustion in vehicle traffic, release to the atmosphere pollutants containing heavy metals that can contribute to the contamination of soils by dry or wet deposition [6,7]. Heavy metals, such as Pb, Zn, Cr, Ni or Cd, are the most frequently studied inorganic contaminants in urban soils and can be linked to adverse health hazard effects [8,9,10] since they cannot be decomposed by micro-organisms having a long-term toxicity for plants, animals and humans. High concentrations of heavy metals have been identified in many studies of urban soils, especially Pb [11] due to the use of leaded petrol [12,13]. With regulations like the one banning leaded petrol [14], emissions from single vehicles have been reduced, although this effect could be compensated by the worldwide increasing road traffic [15,16]. Emissions resulting from vehicle traffic are mostly caused by wear of vehicular components like break lining, tire wear off and exhaust, as well as from incomplete fuel combustion, fuel additives or oil leaking from vehicles [17].
Due to the importance of the quantitative identification of potential sources of heavy metals in soils, source apportionments for these metals concentrations have been performed by principal component analysis (PCA) and positive matrix factorization (PMF) models. These models assume significant correlations of compounds derived from the same sources [18,19]. Moreover, some indexes are fairly used to evaluate the degree of heavy metal pollution in the soil. The most common one is the enrichment factor (EF) [18,20,21] but others, namely the geo-accumulation index (Igeo) [20], the contamination factor (Cf) [22,23,24], the pollution load index (PLI) [21,22] or the ecological risk factor [23,24] are also widely used.
In cities, soil pollution is important due to the health risks of its inhabitants. Many particulate pollutants in the air are originated in soil and its composition and size determine its impact on health. In this work, soils from a set of carefully chosen different locations in the city were sampled from 2003 to 2011 and heavy metals contents (Pb, Cr, NI and Cd) were analyzed by GFAAS (graphite furnace atomic absorption spectrometry). The metals under study were considered due to their negative effects on human health and are therefore metals that are subject to surveillance in the European regulation of atmospheric pollution [25] and pollution of soils and groundwater [26]. Results are discussed in terms of the level of contamination of these soils as well as pollution and ecological risks associated with that contamination.
2. Materials and Methods
2.1. Sampling Sites
Soil samples were collected from six different sites in the city of Lisbon. Lisbon is the capital city of Portugal with about half a million inhabitants and 2–2.5 millions of commuters every day. Since industrial activity is almost inexistent in the city, the main anthropogenic source of air and soil pollution relies on vehicle traffic.
The sampling sites (Figure 1) were chosen taking as criteria the level of automotive traffic, the population density, and the topology of the site. The existence of a high population density is important in order to reduce the health risk due to soil pollution, in particular from its use in urban gardens or parks. The topology of the site is critical to interpret whether the dispersion of the pollutants is favored in each location.
The characteristics of each location are: CE1—City Entrance in Belém (GPS: 38.69562, –9.19930)—one of the city entrances with an open topology and characterized by a high traffic intensity as well as a high population density; CE2—City Entrance in Calçada de Carriche (38.72653, –9.14992)—another city entrance, with a valley topology and a steep slope of entrance in the city. It is also characterized by a high traffic intensity and a high population density; UH—Urban Highway of Segunda Circular (38.75796, –9.16339)–a city circular road with urban highway characteristics. Moreover, it is characterized by an open topology and a very high traffic intensity; CC—City Center at Marquês de Pombal (38.78163, –9.16551)—it has a valley topology and is a high traffic, as well as a high population density site; RA—Residential Area (38.75741, –9.11784)—in the neighborhood of Olivais with open topology and a low traffic intensity; CP—City Park of Monsanto (38.73387, –9.17786)—a small sloping mountain and the major city green park. It has a low traffic intensity and no residential population or buildings.
2.2. Sampling Procedure
Soil sampling was performed according to ASTM E1727-04/05, Sampling and analysis of soil, part IIIa recommendations [27]. Soil sampling was carried out in November of each year. Samples were collected following a concentric profile around a tree in which leaves were also collected for analysis. The soils were collected according to the four cardinal points (north, south, east and west) at 1, 3 and 5 m radius circle. The total area covered by this systematic sampling procedure was 100 m2. Soil samples were collected at a depth of 20 cm, using plastic (PVC) tubes with 3.5 cm in diameter and stored in black plastic sampling bags. Sample handling was always performed with plastic instruments in order to ensure non-contamination of the soils by metals from usual sampling tools. Each collected sample was identified with a label encoding information of the sampled site, year, cardinal point and distance to the tree, in order to ensure full traceability of the samples. A total of 648 soil samples were collected in the six sampling sites of the city and for nine years.
2.3. Sample Preparation
In the laboratory, soil samples were dried for 12 h in an oven at about 50 °C, followed by manual cleaning using a plastic tweezer to remove roots, stones, glasses, snails, earthworms and insects. Thereafter samples were sieved for 20 min on a 2 mm nylon sieve using a Retsch AS200 shaker (Retsch, Düsseldorf, Germany). Only the fraction of soil with particles size less than 2 mm was taken. The resulting sample was homogenized and divided by the quartile method into four parts.
Two portions of each quartile were dried at 105 °C, for 24 h in porcelain capsules. After complete drying, soils were stored in desiccants until grinding. Grinding was performed on a Retsch S100 ball mill of agate grinding jars and agate balls for 5 min at 400 rpm. After milling, the diameter of the soil particles was less than 1 μm. About 50 cm3 of each of the 12 samples from each local and each year were stored and used as the composite sample of that local and that year. Two portions of the composite sample, of about 100 g each, were used to perform the duplicate analysis of the studied metals.
2.4. Soil Characterization
Composite samples of the first (2004) and last (2011) years, from each site were characterized in terms of pH, conductivity, humidity and organic matter content.
The procedure for pH measurement was conducted according to ISO 10390:2015 [28] and involved the preparation of a 10 g of soil in 25 mL of CaCl2, 0.01 M suspension, followed by pH measurement with a calibrated pH meter. For conductivity measurement a 20 g of soil in 100 mL of ultrapure water suspension was used. The humidity of the samples was determined according to ISO 11465:1993 [29] with the samples to be heated at 105 °C until constant weight. The humidity was then calculated by the weight difference between the initial and the dried sample. The determination of organic matter according to European Standard CEN/TC [30] involved heating and calcining the samples at 550 °C for the complete destruction of organic matter. This procedure was performed after the determination of sample humidity and the samples were calcined until constant weight. The organic matter contents were calculated by the weight difference between the dried and the calcined samples.
2.5. Metals Determination
For the determination of the metals under study in soils, 2 g of each sample were subjected to an acidic digestion process as described in ISO 11466:2010 [31]. The extraction of the metal content was conducted with aqua-regia, using a conventional heating process (open sand bath system) at (120 ± 10) °C. The residue from the acidic digestion was filtrated using a cellulose filter and diluted to a final volume of 100 mL with ultrapure water (18.2 MΩ cm).
Each metal content in the soil samples was determined by GFAAS, in a Thermo Elemental SOLAAR, Suite M5 Spectrometer, equipped with an automatic sampler FS95 and a graphite furnace GF95, controlled by SOLAAR software, v.11.2.
2.6. Evaluation of Environmental Risks—Pollution and Ecological Index Models
Determining the concentration of toxic metals in soil is not enough to assess the state of soil pollution. It is common to use several indexes to estimate the degree of soil pollution and the ecological risk of the soil for humans and biota. The most important are the enrichment and contamination factors, the pollution and geo accumulation indexes and the ecological risk factor. These indexes are presented and explained below according to their original definition in the references cited for each one.
2.6.1. Geo-Accumulation Index (Igeo)
The Geo-accumulation index (Igeo) is calculated with the formula proposed by Förstner and Müller [32]. This relationship (Equation (1)) is used to assess the degree of contamination of soil and water by metals.
In Equation (1) CM represents the concentration of the metal in the soil and CB represents the background concentration of that same metal in unpolluted soils.
According to Förstner and Müller [32], Igeo values are categorized into seven contamination classes ranging from Class 0 (Igeo < 0) classified as “uncontaminated” until Class 6 (Igeo > 5) classified as “extremely contaminated”.
It should be noted that Igeo value greater than 6 is an indication of soils with 100 times the metal concentration considered as background value, a very high pollution by the metal under study.
2.6.2. Contamination Factor (Cf)
The contamination factor defined almost simultaneously by Tomlinson et al. [22] and Hakanson [23] was used to measure levels of metal pollution in sediments in lakes. However, these factors were widely adopted for the calculation of pollution indexes also in soil. The factor is defined as the ratio between the metal concentration in the soil (CM) and the reference concentration of that same metal in unpolluted soil (Cb), the background values or preindustrial reference values (Equation (2)).
Considering the calculated index, soils can be classified according to the contamination levels proposed by Hakanson [23] from “low contamination” (Cf < 1) to “very high contamination” (Cf ≥ 6).
2.6.3. Degree of Contamination (Cd)
The degree of contamination (Cd), also defined by Hakanson [23], represents the sum of the contamination factors. While the contamination factor represents the individual contribution of each metal, the degree of contamination considers all the n polluting metals in a given location, and is defined by Equation (3):
The classification used for this factor was also proposed by Hakanson [23] and goes from “low degree of contamination” for Cd < 8 to “very high degree of contamination” for Cd ≥ 32 indicating serious anthropogenic pollution.
2.6.4. Pollution Load Index (PLI)
The Pollution load index (PLI) proposed by Tomlinson et al. [22] measures the overall degree of contamination in the sample and is often used to calculate the degree of soils pollution and other polluted ecosystems. For a site or zone, it is calculated using Equation (4):
Adapting the concept defined for the calculation of PLI for an estuary, the PLI for a city can be obtained using the PLI of each zone (Equation (5)).
2.6.5. Ecological Risk Factor (Er) and Global Potential Ecological Risk (RI)
The ecological risk factor (Er) proposed by Hakanson [23] is used to assess the ecological risk of an element in the soil and can be obtained using Equation (6):
where is the contamination factor of element i and is the toxic response factor of element i. The toxic response factors for Cd, Cr, Ni and Pb are 30, 2, 5, 5, respectively [23].
Er values proposed by Hakanson [23] are divided in five ranges from “low potential ecological risk” for Er < 40 to “very high ecological risk” when Er > 320. The sum of the individual potential risks () gives the global potential ecological risk (RI) for the soil (Equation (7)).
Originally, the global ecological risk was a diagnostic tool for water pollution control but presently it has been used with success for assessing quality of sediments and soils contaminated by heavy metals [33,34,35,36]. The classification of the global ecological risk (RI), according to Hakanson [23], varies from “low global ecological risk” (RI < 150) to “very high global ecological risk” (RI > 600).
2.7. Quality Control and Quality Assurance
Analyses were performed carrying out quality assurance and quality control procedures to provide high analytical precision. Special care was taken to minimize cross-contamination, contamination of glass material. Additionally, all efforts were made to minimize contamination from air.
The GFAAS operating conditions were optimized for each metal using reference metal standard solutions, CertiPUR® from Merck (Darmstadt, Germany). Sample concentrations were determined using calibration curves evaluated in terms of linearity and sensitivity, according to the obtained correlation coefficient and slope, respectively. Limits of detection and quantification for each metal were determined. The validity of the calibration curves was performed daily using control standards prepared using CertiPUR® standards from Merck in the same acid matrix used for soil samples. For the control standards the same procedure analysis used for real samples was applied. Two control standards were used to test the precision of the calibration curve of each metal in two points: ~25% and 75% of the linear range. The precision of the calibration curve was maintained between 2% and 5% and never higher than 8%.
The extraction method was validated through a soil certified reference material (BCR CRM-142R Light Sandy Soil) from IRMM (Institute for Reference Materials and Measurements). The reference soil was subjected to the same acid digestion procedure as the soil samples and the recovery percentage values of the CRM were 93% for Pb, 106% for Cd, 93% for Ni and 0% for Cr (since the CRM did not contain chromium).
All samples were digested and analyzed in duplicate, and the final content was always considered as the average value of six measurements made in repeatability conditions.
2.8. Statistical Analysis
The software SPSS® v22.0 from IBM Corp. was used to perform a correlation analysis between the content of each metal in the different sites and the several years studied. Principal component analysis (PCA) was carried out with Varimax rotation with Kaiser normalization, in order to verify the existence of relationships between metal contents in soils analyzed in different city sites over the studied years [37].
3. Results and Discussion
3.1. Soil Characterization
Composite soil samples of the years 2004 and 2011, from each site, were characterized in terms of pH, conductivity, humidity and organic matter content. The values obtained are shown in Table 1.
When comparing both years, the values of pH, organic matter and electrical conductivity are identical. The main difference is found in the humidity values, as they depend directly on the rain on the days before sampling and not on annual precipitation. The paired t-test performed between each of the variables and for the two years, showed that all data pairs are statistically significant (p = 0.05) with the exception of humidity data.
3.2. Soil Metals Contents
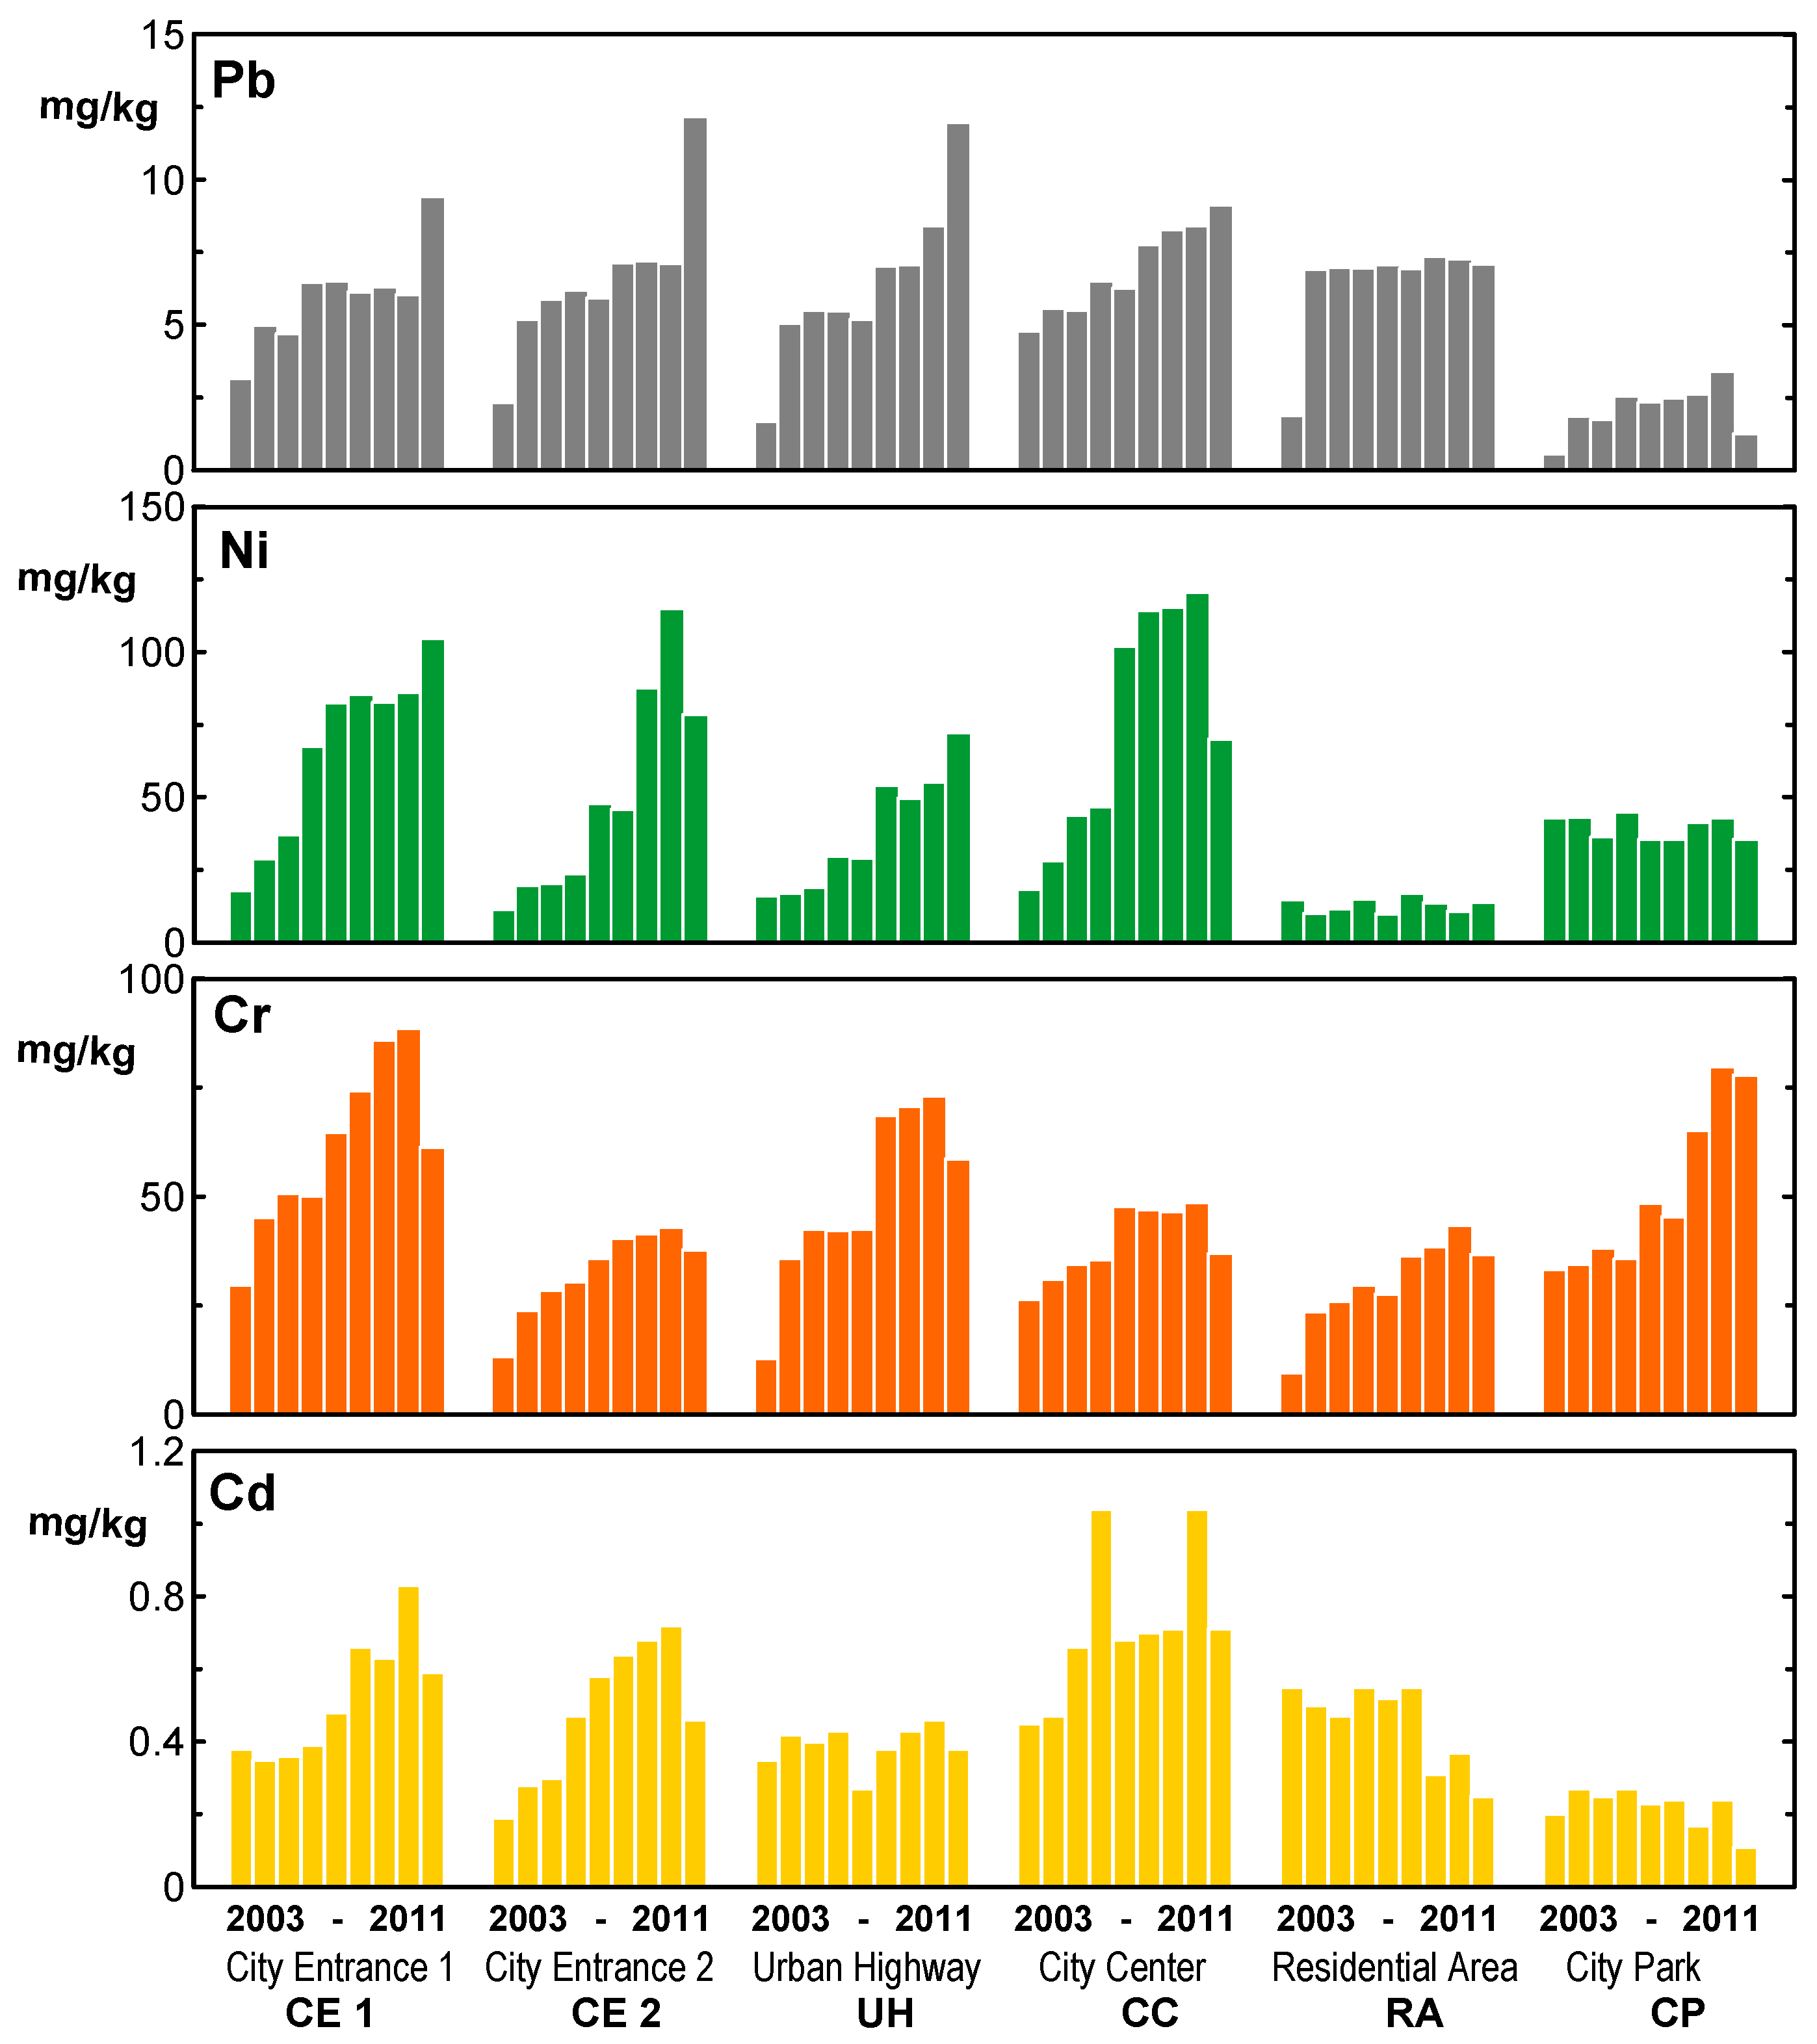
Metal content values of the sampled soils in the different city sites are presented in Table 2. Overall, and for most metals there is an increase in their content in soils over the years, except for two sites, residential area (RA) and city park (CP). Detailing the analysis of the data for each metal it was found that cadmium levels increased at the entrances (EC1 and EC2) and in the city center (CC), registering however a slight decrease in these places in the last year of sampling. In the urban highway (UH) the levels are stable, showing a decrease over the years in the residential area and in the city park, although being smaller the decreasing trend in these locations. the values for each metal content in each sampled site over the years are shown in Figure 2.
Chromium levels exhibited, in all sampled sites, an overall increase between 2003 and 2010 and a slight decrease in the last year (2011). Nickel and lead showed a growing trend of their content in the soils over the years except for the residential area and the city park. In these two places the levels remained stable over time. For nickel, however, two sites (CE2 and CC) presented a decrease in 2011.
The decrease in the levels of some metals in the last year of sampling may be directly linked to the decrease in car traffic in the city of Lisbon. In fact, a serious economic crisis began in 2010 in Portugal, which was reflected in the decline of economic activity and in the increase in unemployment with less people moving around the city, either in private or corporate vehicles, or in public transports.
Table 2 also shows the average annual contents for each metal in the city (values in bold), obtained from the average values of each metal in all locations and for each year.
Figure 3 shows an increasing trend in the levels of the various metals in different places over the years except for the last year of sampling and for Cr, Cd and Ni. The average metal values observed over the years of this campaign are close to 0.46 mg/kg for Cd, 44 mg/kg for Cr, 46 mg/kg for Ni and 5.7 mg/kg for Pb. These values represent moderate metal pollution in the soils of Lisbon as also revealed by the calculated environmental and ecological risk indexes presented below. Other authors [38], present identical results to this study observing low levels of these metals in the soils of Lisbon. The city soils can be used for agriculture, in particular for urban gardens, without significant risk of contamination for the vegetables growing there.
It is presented in Table 3 the mean, minimum and maximum values of the studied metals content from several studies all around the world, which were used to compare with the values obtained in the present work. Except for lead, the average values for each metal shown in Table 2 are within the limits indicated for the crust. Pb has a higher value in the soils of the studied cities, probably due to emissions from burning leaded gasoline throughout many decades. The values of the metal levels in the soils reveal the reality of each city in terms of anthropogenic emissions, namely the existence of manufacturing facilities and the burning of fossil fuels, both from heating and car traffic. Moreover, the baseline values of metals soil content at each site are important but not available in all or in most cases. Additionally, it must be emphasized that the analytical techniques that allow the determination of metal concentration levels in soils, GFAAS and ICP-MS (inductively coupled plasma mass spectrometry) among others, were only developed and implemented in the decades of 1970s and 1980s. At that time, soils already presented reasonable levels of anthropogenic pollution due to many years of industrialization and low environmental protection by state regulation.
3.3. Pollution and Ecological Indexes
In order to estimate the degree of soil pollution and the ecological and environmental risk of Lisbon soils, the most important indexes to assess the level of pollution and ecological risk were calculated: geo-accumulation (Igeo), contamination factor (Cf), degree of contamination (Cd), pollution load index (PLI), ecological risk factor (Er) and global ecological risk (RI). The authors had no knowledge or information concerning any past published values for the levels of metals in Lisbon soils in unpolluted conditions.
In the absence of background values, one of the solutions often used is to consider the estimated values for the earth’s crust as a background. The crust values are global values that are intended to represent the average composition of the crust based not on global and systematic measurements but on values resulting from the combination of several studies. There is obviously an over-representation of countries and regions in which studies were carried out, in comparison to less studied areas. In the specific case of Lisbon, the values proposed for the crust are higher than some of the metal contents found. This shows that the values of the crust cannot be used as reference values in this study. Table 4 presents some values from literature taken as reference values for the concentration of metals in soils and earth’s continental crust.
It should also be noted that the soils of Lisbon have a reasonable geological diversity [62] including regions with volcanic soils, alluvion soils, medium Cretacic and from Miocenic periods. The sampling sites CC, RA and UH are in a Miocenic formation (sand, clay and limestone). The CP and CE1 are in an antique volcanic zone and the CE2 site is located in a calcaric cambisols zone. However, the reasonable antiquity of Lisbon as a city (more than twenty centuries) and therefore a recipient of anthropogenic pollution for many centuries, as well as the frequent works that take place in cities involving soil movement, prevent the unambiguous geological classification of the soils of each of the studied areas.
To overcome the limitation of not knowing the background values and being unable to use the crust values method above mentioned, an established statistical method was used to estimate background values for metals in the various locations studied in the city of Lisbon. On this subject, several authors [63,64] emphatically refer to the impossibility of obtaining exact or even reasonably values for the background values of metals (and other pollutants) in soils and other environmental compartments. Among the estimation methods referred by Reimann [65], the iterative 2s-technique was chosen because it is the method that best adapted to the available amount of data. This method is also referred by the authors as the one that presents the most reasonable degree of approximation to real values [66]. The obtained values are shown in Table 5 and were used to calculate the pollution indexes and ecological indexes.
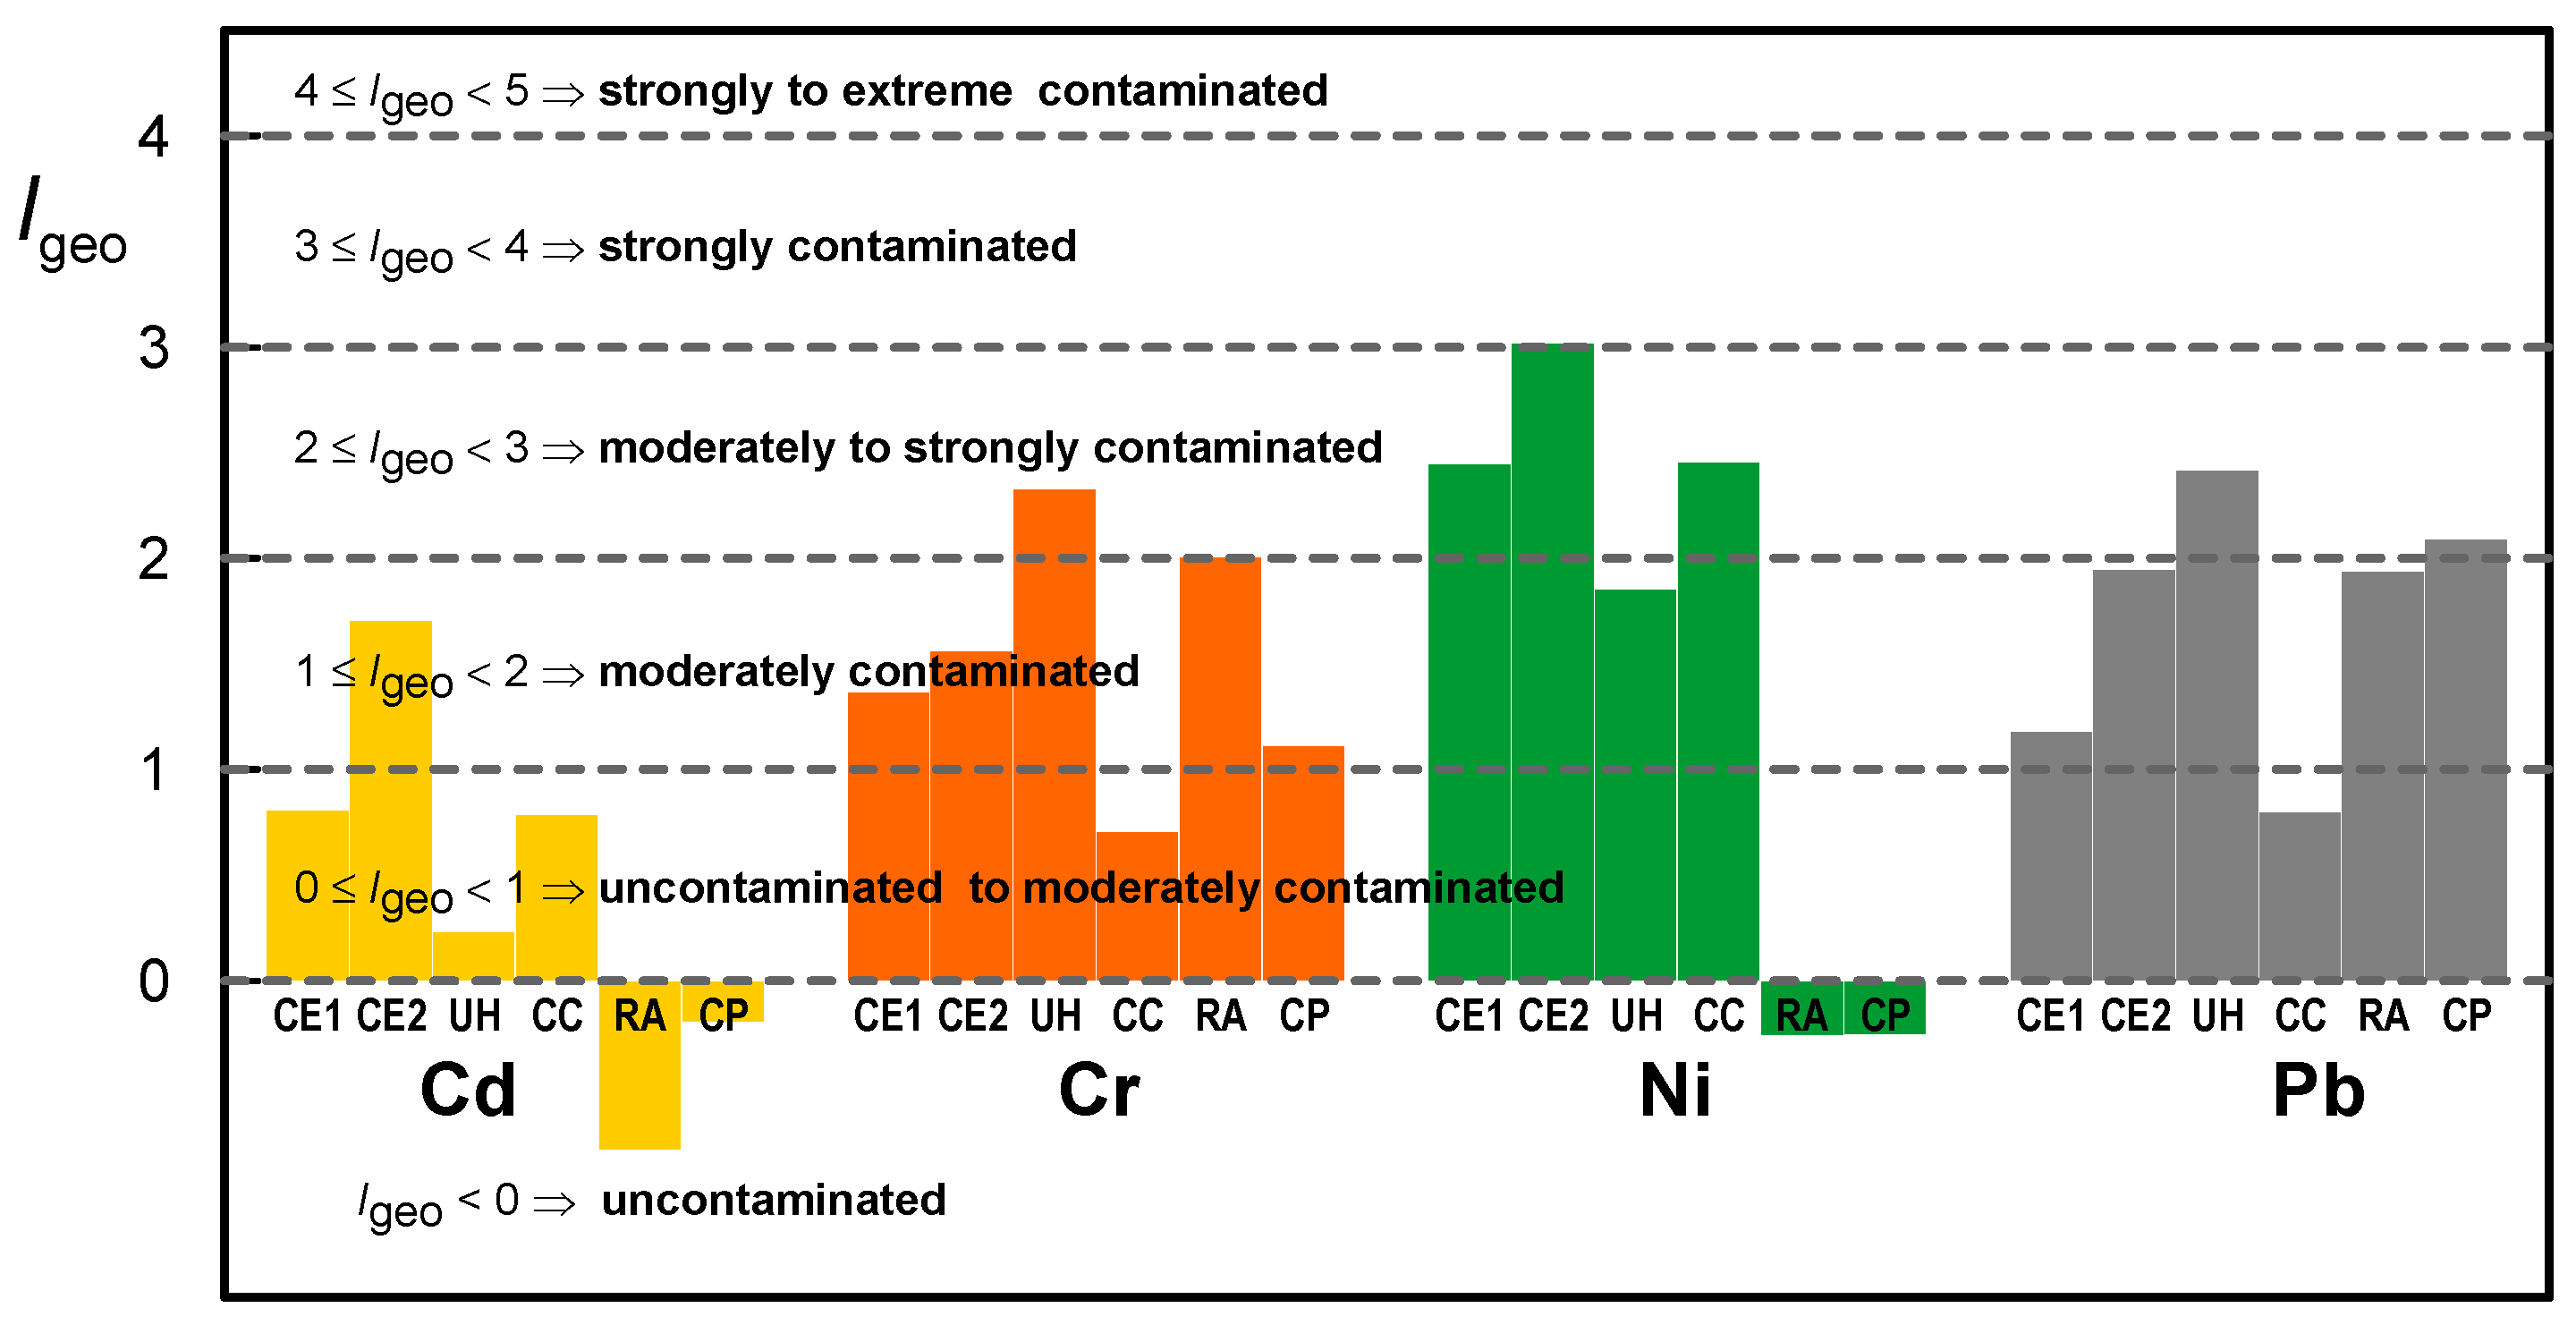
Results of Igeo calculated values are presented in Figure 4. Ni shows the highest values followed by Cr and Pb. Ni exhibits moderate levels of contamination at all sites except in residential area (RA) and the city park (CP), both classified as “uncontaminated”. Higher values of Igeo for Ni were found in the soils next to the city entrance 2 (CE2). For Pb and Cr the Igeo index have classifications between “uncontaminated” and “moderately contaminated”. Regarding the values of Igeo for Cd, this metal reveals an “uncontaminated” contamination class in UH, RA and CP and an “uncontaminated to moderately” class in the city entrances (CE1, CE2) and at the city center (CC).
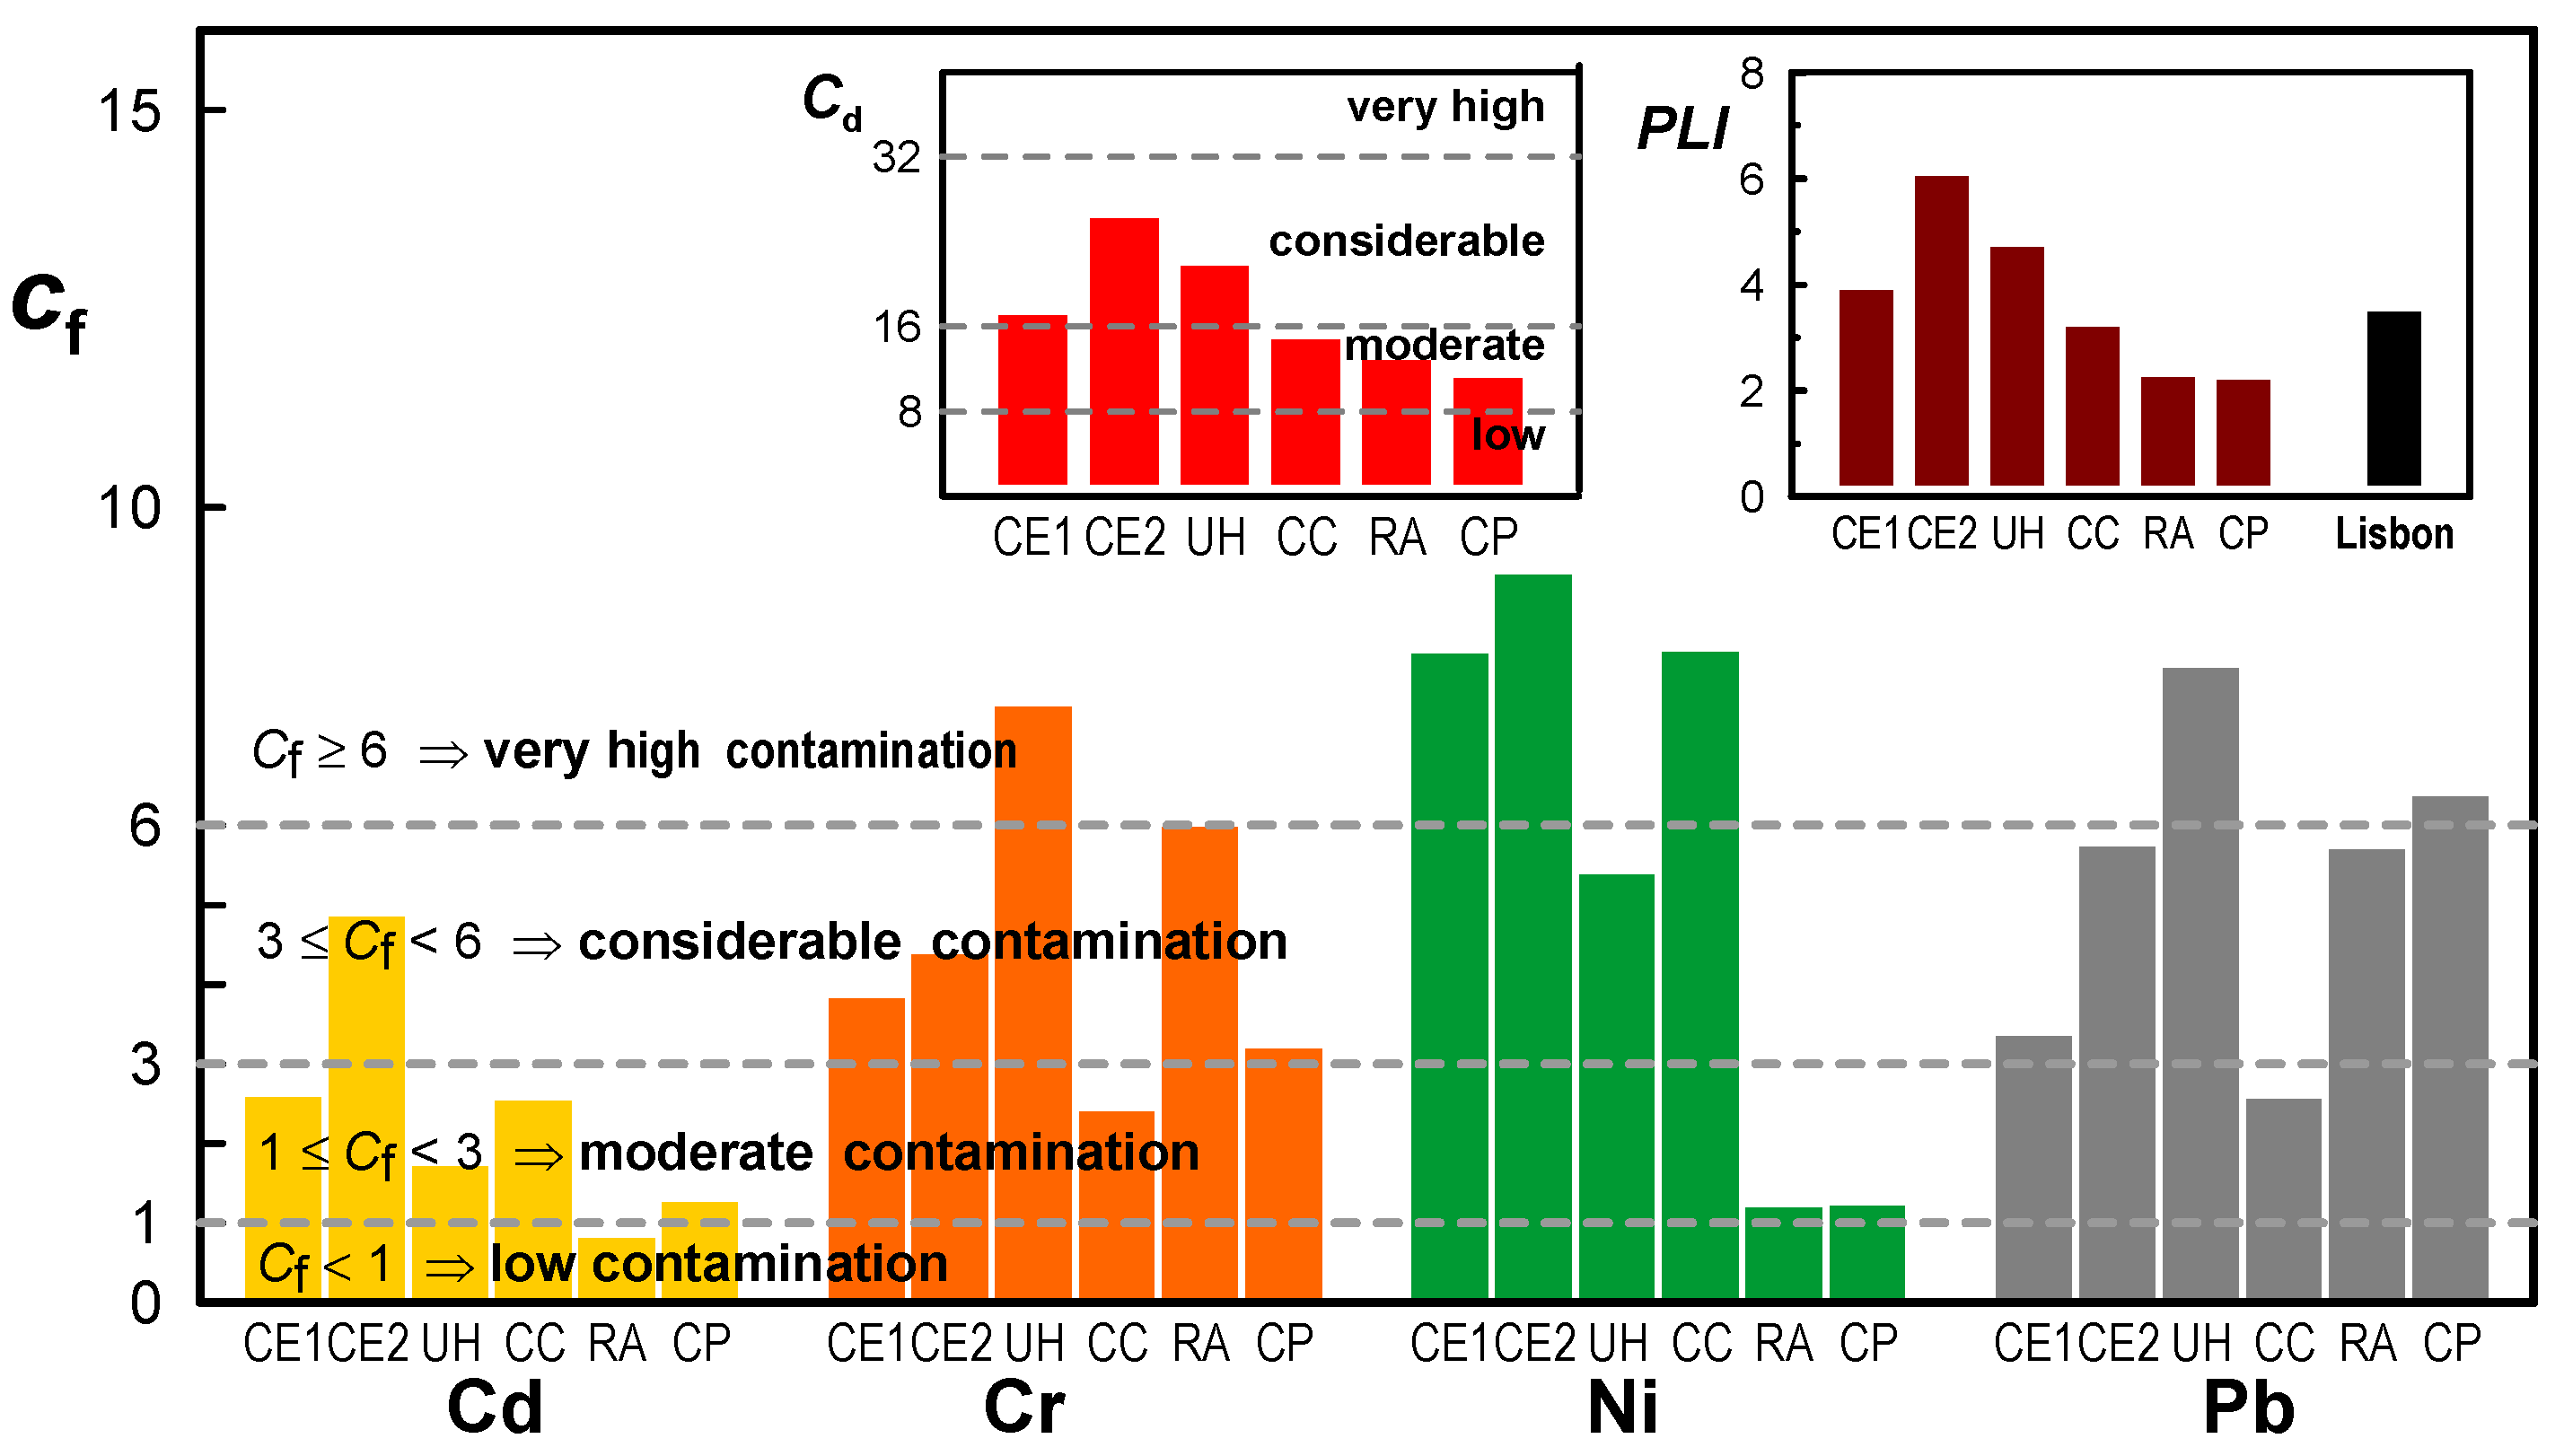
The values for the Contamination factor (Cf) are shown in Figure 5. Nickel presents a “very high contamination” level in three sites, city entrances (CE1, CE2) and city center (CC). The residential area (RA) and the city park (CP) present values in the “moderate contamination” level but very close of the “low contamination” level. Pollution by Cr and Pb also presents some places with a “very high contamination” level, namely in urban highway (UH). It should be noted that contamination by these metals in the city park and residential area is also reasonable. Cd has low values for this index with only one of the city entrances (CE2) showing a “moderate contamination” level.
A global view of pollution in the city of Lisbon can be given by the indexes that include the contribution of different metals: degree of contamination (Cd) and pollution load index (PLI). The Cd and PLI indexes are important because they considered all the analyzed metals in the soil and not only an individual metal. The insert graphs in Figure 5 show the results for these two indexes. The values of Cd and PLI have a quite similar profile for the various studied locals. These global indexes reveal a great accumulation of metals in the city entrances (CE1 and CE2) and in the urban highway (UH) and a little less in the city center (CC). The residential area (RA) and the city park (CP) were the less polluted places. The PLI calculated for Lisbon, according to Equation (5), presented a value of 1.6 which represents a “moderate pollution” value for the whole city.
The obtained values for these different pollution indexes (Igeo, Cf, Cd and PLI) follow the expected behavior, showing that the city entrances and the urban highway had the highest pollution load, followed by the city center. On the other hand, the residential area and the city park had lower pollution values.
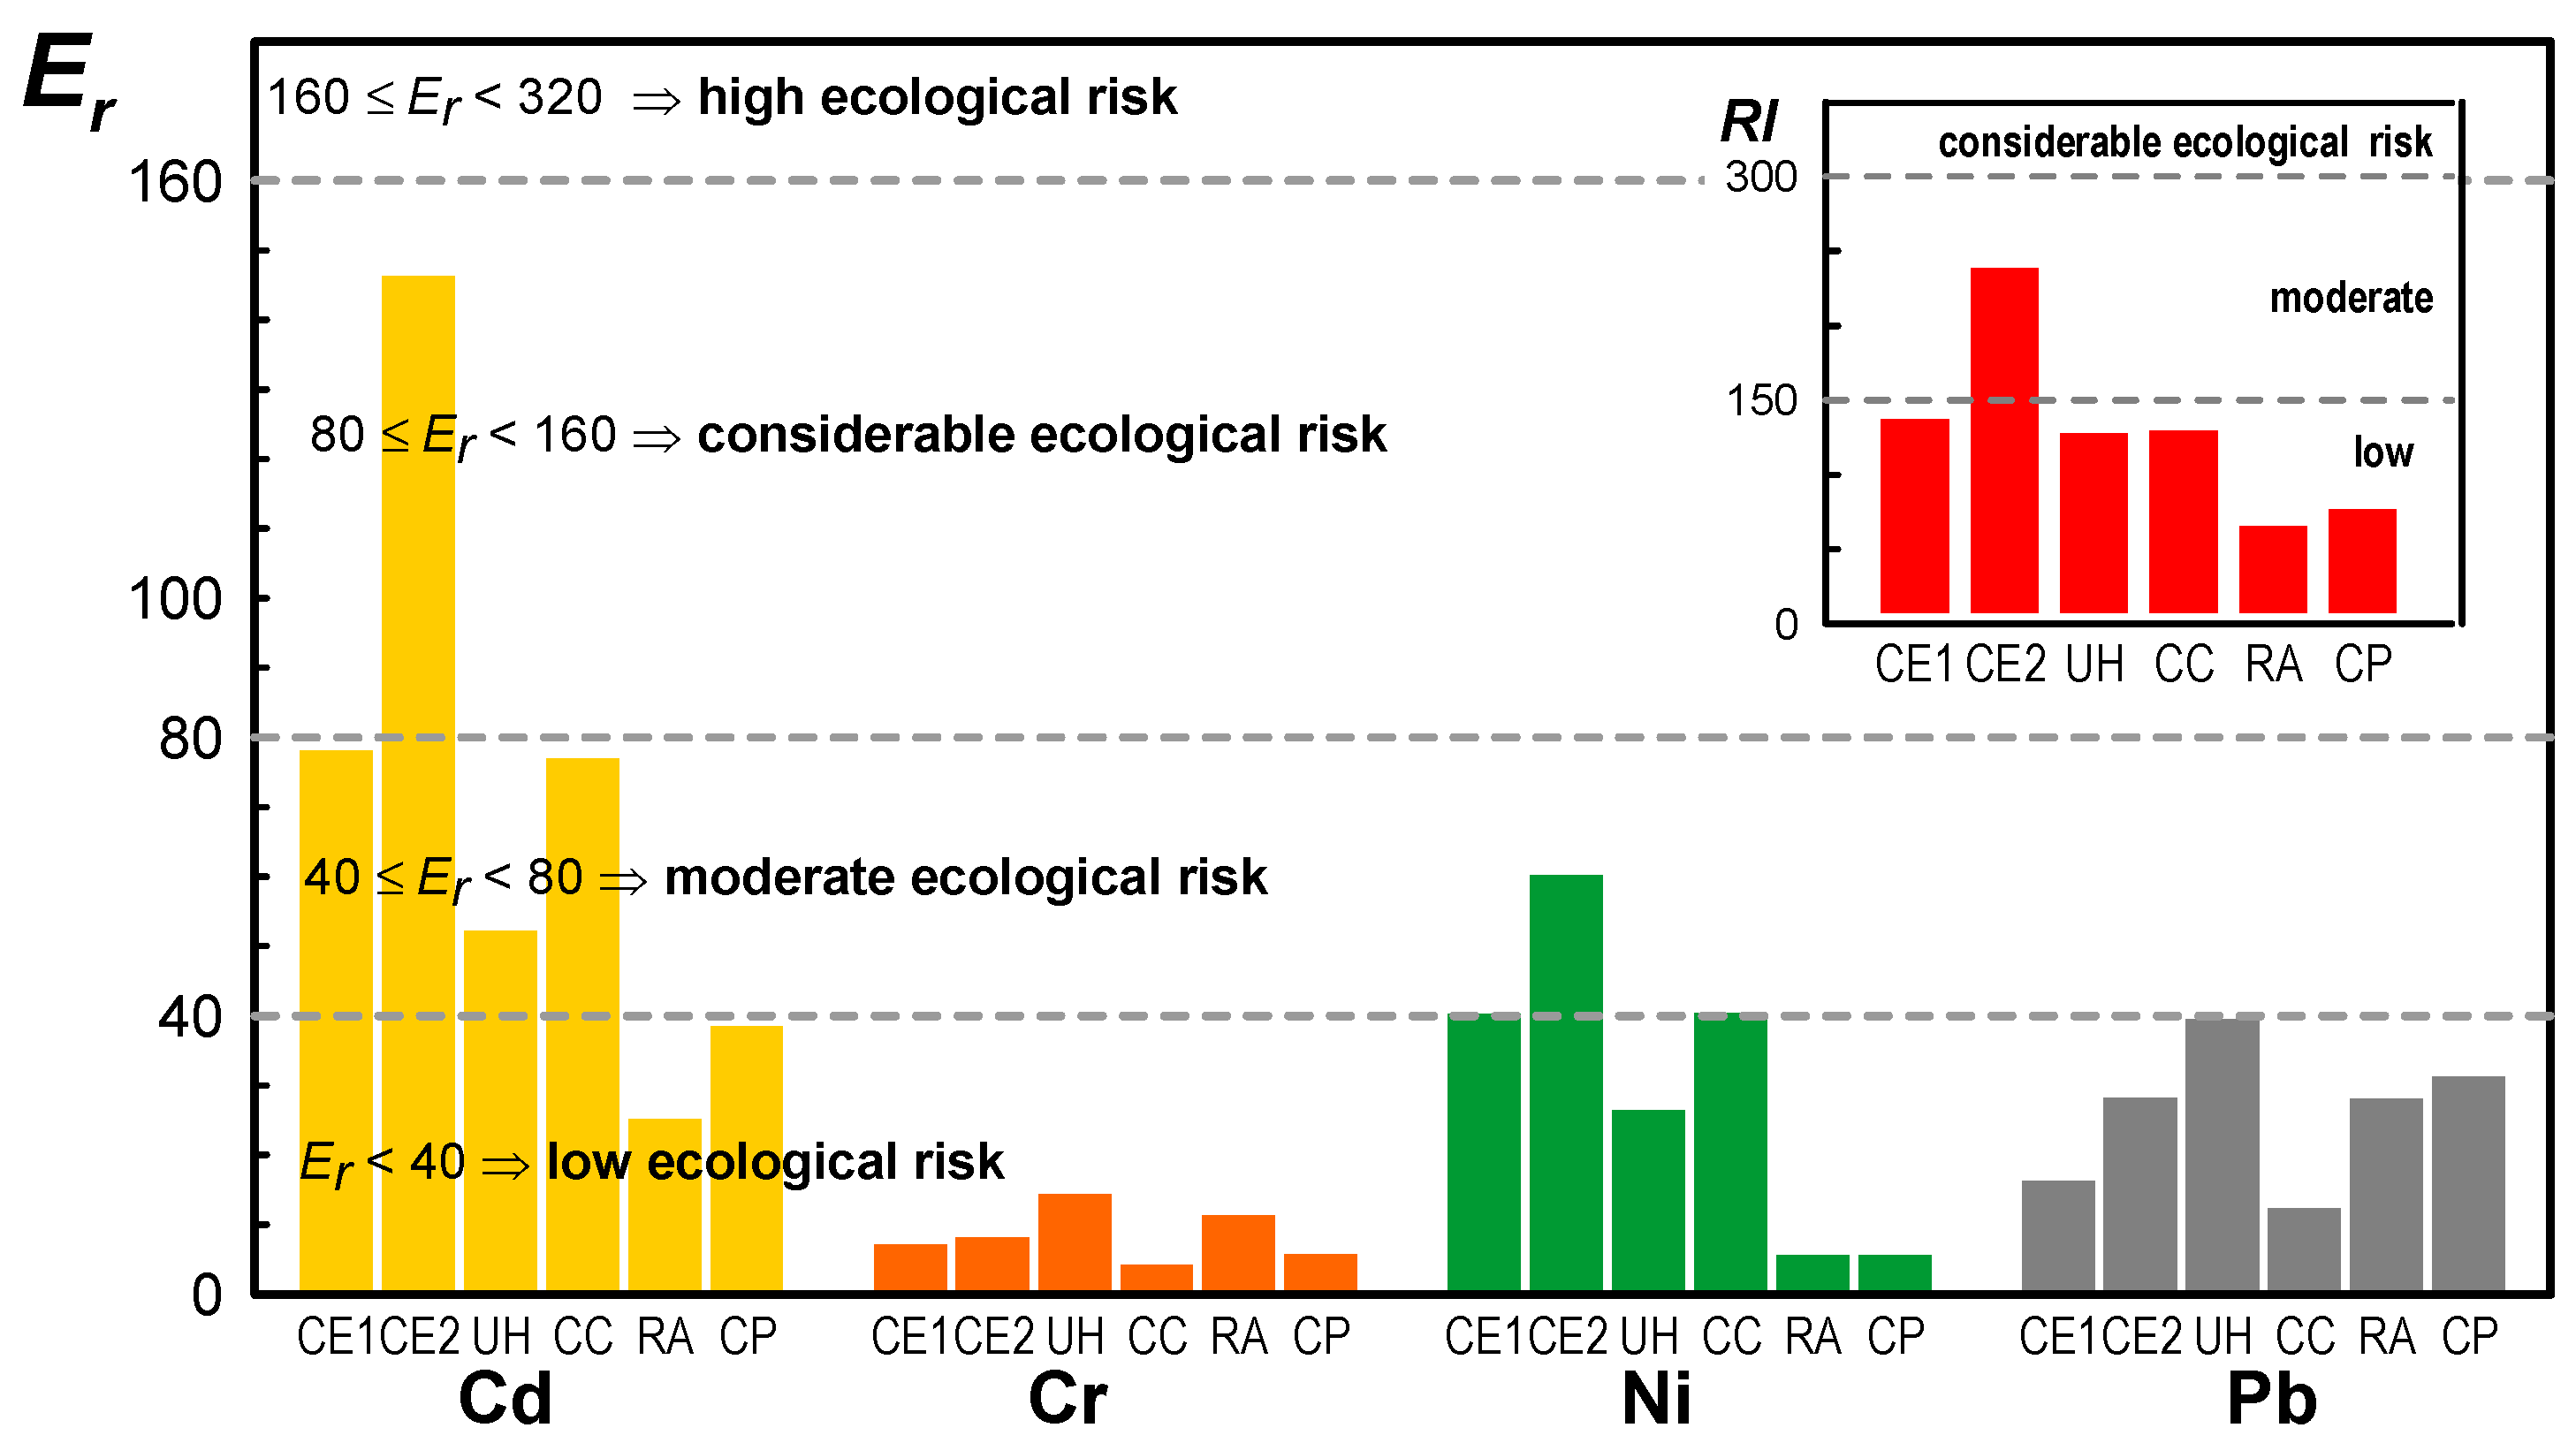
The calculated values for the ecological risk factor (Er) and global potential ecological risk (RI) are shown in Figure 6.
The Er index presents higher values of risk for cadmium resulting from the greater toxic response factor attributed to this metal. The values of Er for cadmium are higher for the CE2 site with values classified as “considerable ecological risk”. For the remaining locations, the ecological risk is moderate and is even considered as “low ecological risk” for the RA and CP locations. For Ni and Pb, the values of Er vary between “low” and “moderate ecological risk”. For Cr the values of this index are also classified as “low ecological risk” but with globally lower values than Ni and Pb.
The RI values are shown in the insert graph of Figure 6. Moreover, for this risk factor that takes into account the various metals, CE2 is the site with the highest risk but only classified as “moderate ecological risk”. The entrance to the city (CE1), the urban highway (UH) and the city center (CC) have a “low” but close to “moderate ecological risk”. The city park (CP) and residential area (RA) locations have the lowest values of this ecological risk index.
Recent work [67] shows the usefulness of the various indexes for the classification of soil pollution. The use of indices makes possible to compare the soil pollution from different locations based on their initial state. However, the authors stress the necessary precaution in the use of soil pollution indexes. Other factors than the initial and final metal contents are relevant, including the geological structure of the soil that affects pH, a determining factor in the bioavailability of the elements.
Despite the fact that the present study was focused on these four dangerous metals, there is for sure contamination by other metals in the soils of Lisbon. This contamination certainly increases the pollution and composite ecological indexes, namely Cd, PLI and RI as these indexes consider the contribution of different metals and reflect the accumulated health risk of all metals in the soils. In fact, the metals considered are the most toxic and those that must be monitored in the soil according to the European Directive [68], except for mercury and arsenic.
3.4. Data Correlation and Principal Component Analysis
Significant correlations with p = 0.01 were obtained for the following pairs of metals: (Ni, Cr), (Ni, Cd), (Ni, Pb) and (Pb, Cd). In other words, Ni is positively correlated with all other metals and in addition to that, only the correlation between Pb and Cd is verified. The pairs (Cr, Pb) and (Cr, Cd) do not present a significant correlation.
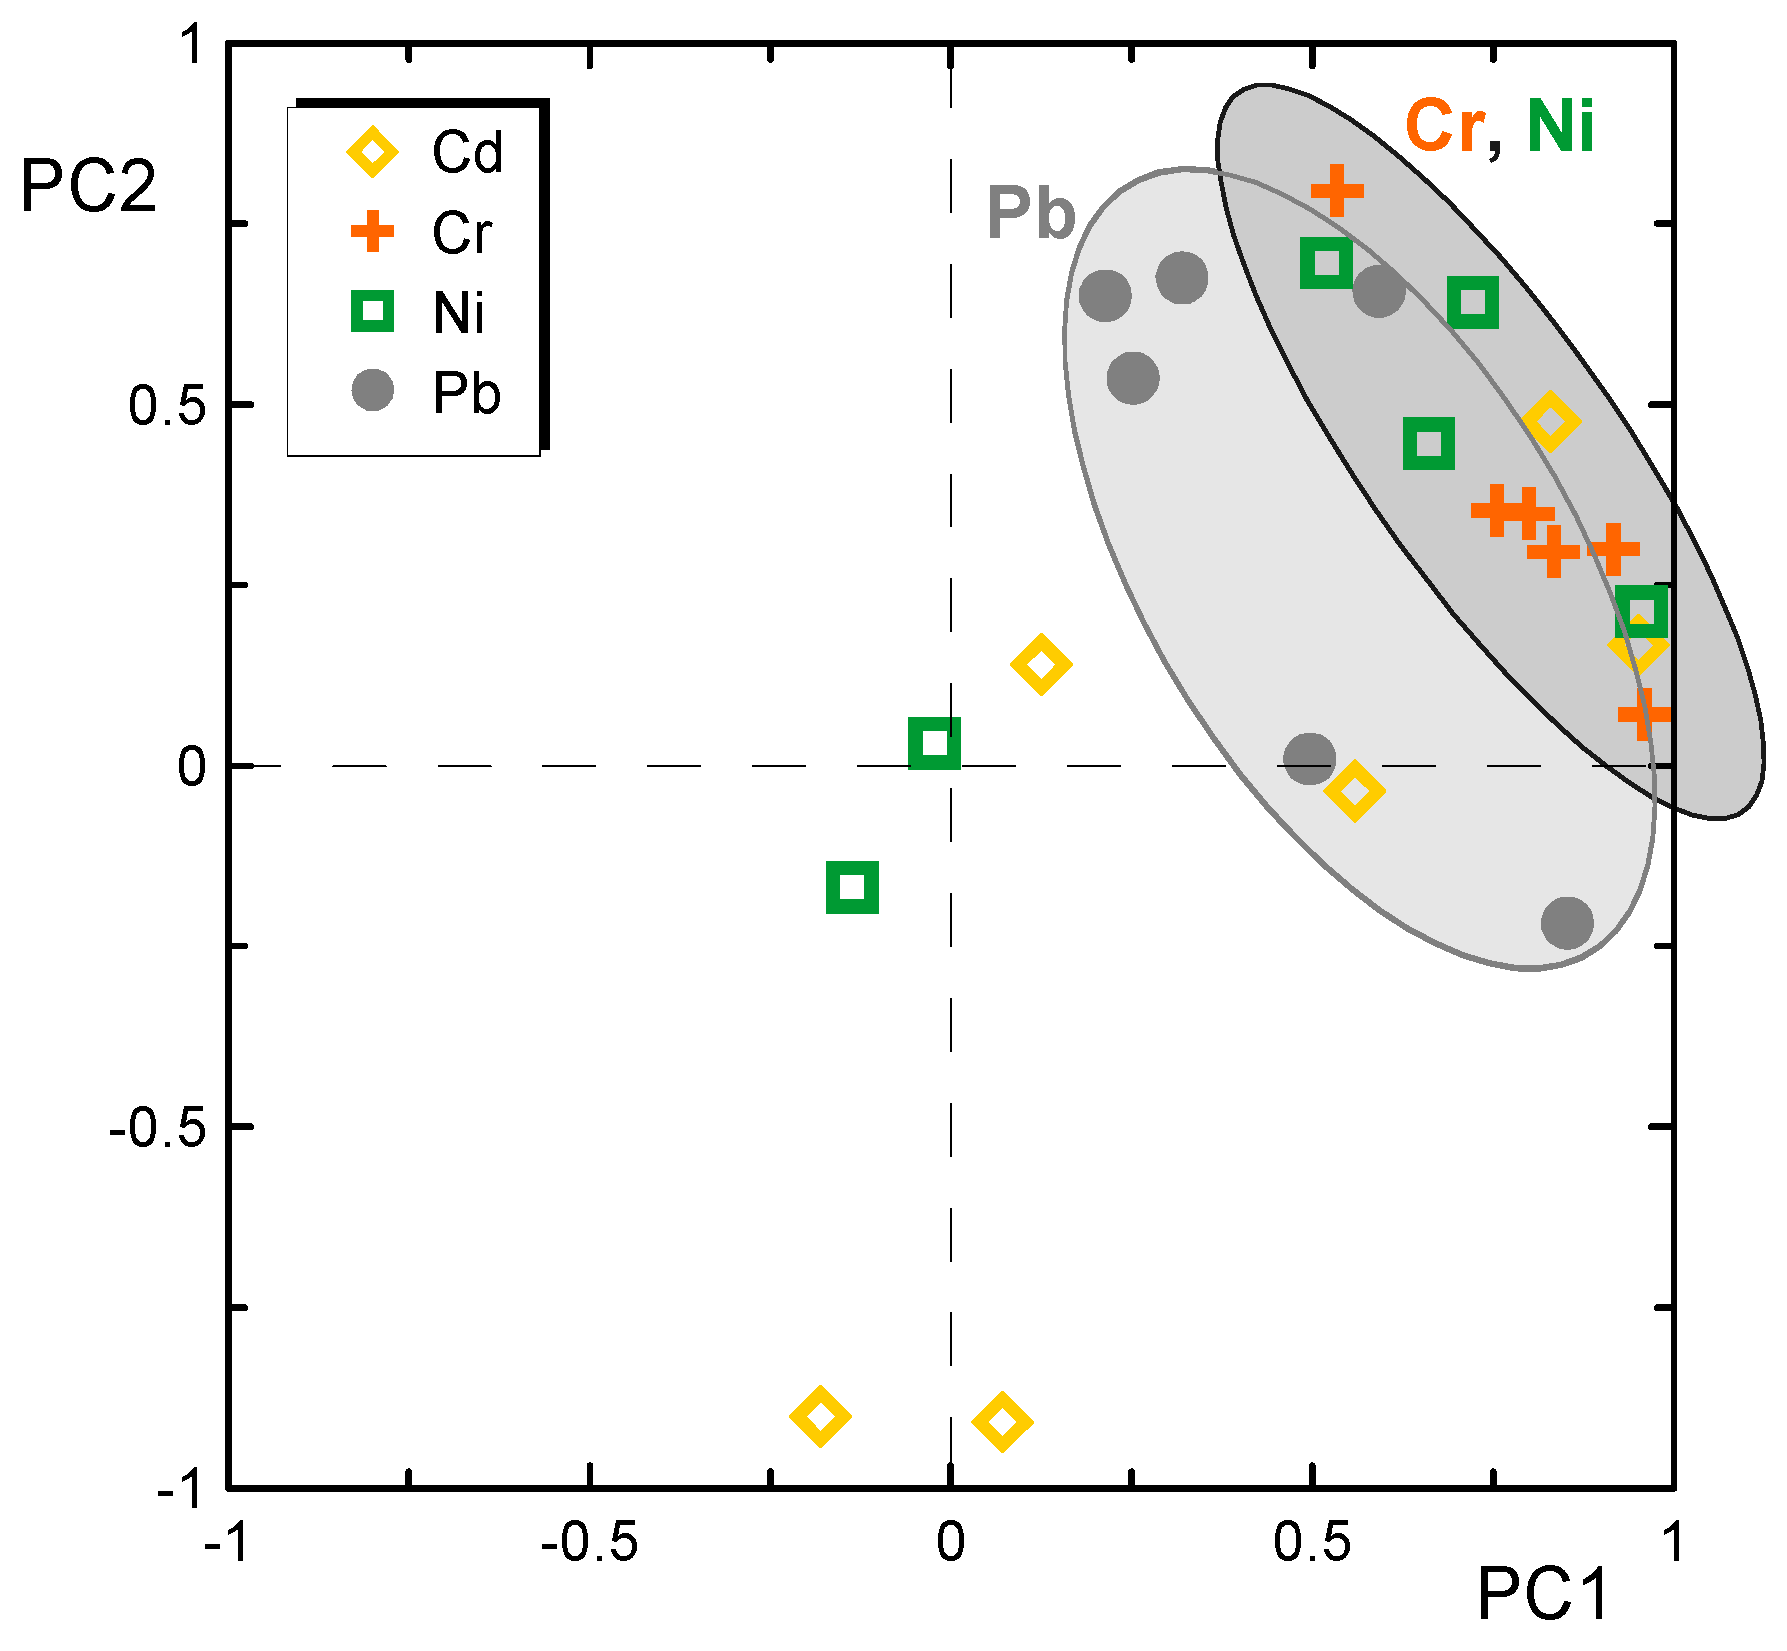
For the principal component analysis (PCA), the levels of metals in the soil in each location of the city and in each year were considered. It was intended to verify the existence of a relationship between metals, that is, variations in soil metal concentrations that exhibit similar behaviors, in time or in different places in the city. From the data, three main principal components were extracted that explain 78% of the total variance of the results. The first factor (PC1) is responsible for 58% of the variance, PC2 for 11% and PC3 for 8%.
Figure 7 shows the data obtained for PCA analysis, PC1 vs. PC2. The grouping of sites with a high correlation in Cr, Ni and Pb concentrations is evident. These sites are located at the entrances to the city, establishing a clear link between the levels of these metals in the soil and vehicle traffic. In addition to those locations, the city center and the urban highway are also part of this set. The third factor (PC3), a factor that explains only a small variance of the global system, may explain the conjoint variation of Pb and Ni in the city entrances and in the urban highway.
Authors such as Imperato et al. [69], Andersson et al. [70], Meza-Montenegro et al. [71], Pant and Harrison [72] and Moaref et al. [73] stressed out that the origin of anthropogenic pollution in cities without large industrial facilities (like Lisbon) is mainly due to car traffic. The principal source of lead was, during the past, the leaded fuels. Nowadays lead is still present in soils despite its drastic reduction due to the abolition of added lead gasoline. The main sources of Cr and Ni are the vehicle braking system and tire wear. However, these two elements also have a strong relationship with parent material. Several studies have detected this trend [40]. So, for Cd and Ni there will be two source contributions, the natural one due to the lithogenic contribution and the anthropogenic one, originated from car traffic pollution.
4. Conclusions
In this work, levels of Cd, Cr, Ni and Pb in the soils of six sites with different vehicle traffic characteristics were monitored in Lisbon for a period of about ten years. To our knowledge, this is the longest soil monitoring program carried out in the city of Lisbon. Time wise, in many of the other studies referenced in this work the monitoring periods for soil contamination by toxic metals are typically only one to two years, making this study one of the longest. For each location, 12 samples were collected each year, bringing up 72 samples per year and a total of 648 soil samples. When compared with values obtained for other cities (Table 3), the data in the monitoring period revealed a reasonable low concentration of metals studied. However, these low values of metals in soils are consistent in the nine years of this study. It should be noted that many of the values listed in Table 3 are single values, obtained generally in a given year and in the weather conditions observed for that year.
The evolution of the levels of metals over the years and in the various places in the city has typically grown, with the exception of the last year. In most locations, the year 2011 showed a decrease in the content of metals in soils. When looking at the average levels for each year, involving all locations, a downward trend in this last year of the campaign is spotted. In 2011 the economic crisis had important impacts on economic activity and this impact was reflected in the circulation of fewer vehicles and, consequently, fewer emissions. That results in a decrease of observed metals in the soil, showing the unequivocal main origin of these pollutants: automotive traffic.
Looking at the levels of metals in each location in the city, the residential area and the city park have the lowest levels of toxic metals in soils, as expected. Exception is noted for Cr in which for those two places the levels are identical to the rest of the city. Still for the same locations, the levels of Cd, Ni and Pb have been maintained or decreased over the years. Cr grew each year, except in 2011. The determination of the pollution indexes (Igeo, Cf, Cd, PLI) underlined this global conclusion with values indicating that the most serious levels of contamination are connected to locations with great traffic density, namely the city entrances, the city center and the urban highway.
Ecological indexes, Er and RI, also revealed a low or moderate ecological risk except Cd in CE2. When considering the RI, in which the joint effect of the metals is considered, moderate ecological risk values are also achieved in CE2. The remaining sites presented a low or moderate level of ecological risk. This index also confirms that the lowest values of potential ecological risk are found in the residential and city park areas.
The low values of metal contents found are also positive for the many urban agriculture projects that are being developed in Lisbon. The municipality has encouraged this practice with the construction of several urban vegetable garden parks throughout the city. This practice should be accompanied by periodic analyzes of soils and plants, as metal levels, even when low, may be transferred from the soil to the plants. It will also be important to follow the pH of the soils and their content in organic matter, which are essential factors in the bioavailability of metals.
Considering that these metals may affect human health by the ingestion of contaminated food (among other forms), the results obtained in this work lead to the conclusion that as the city of Lisbon presents low values of these metals in its soils, it also has a very low potential to affect the health of its inhabitants, workers and visitors.
Author Contributions
Conceptualization M.J.M.; data curation H.F.S., M.J.M.; formal analysis H.F.S.; funding acquisition M.J.M., C.M.O.; investigation H.F.S., N.F.S.; methodology H.F.S., M.J.M.; project administration M.J.M., C.M.O.; resources M.J.M., C.M.O.; software M.J.M.; supervision; validation H.F.S.; visualization M.J.M.; roles/writing—original draft H.F.S., N.F.S.; writing—review and editing C.M.O., M.J.M., N.F.S. All authors have read and agreed to the published version of the manuscript.
Funding
This research was funded by Fundação para a Ciência e a Tecnologia (FCT) through projects UID/QUI/00100/2013 and UIDB/QUI/00100/2020.
Institutional Review Board Statement
Not applicable.
Informed Consent Statement
Not applicable.
Data Availability Statement
The data collected, the results of the chemical and physical analysis and the main results obtained, may be requested to the authors. They will be provided, free of charge or not, depending on its future use.
Conflicts of Interest
The authors declare no conflict of interest.
References
- Antrop, M. Landscape change and the urbanization process in Europe. Landsc. Urban Plan. 2004, 67, 9–26. [Google Scholar] [CrossRef]
- Pouyat, R.V.; Trammell, T.L.E. Chapter 10—Climate change and urban forest soils. Dev. Soil Sci. 2019, 36, 189–211. [Google Scholar] [CrossRef]
- UN. 2018. Available online: https://population.un.org/wup/Publications/Files/WUP2018-PopFacts_2018-1.pdf (accessed on 21 November 2020).
- Grigoratos, T.; Samara, C.; Voutsa, D.; Manoli, E.; Kouras, A. Chemical composition and mass closure of ambient coarse particles at traffic and urban-background sites in Thessaloniki, Greece. Environ. Sci. Pollut. Res. 2014, 21, 7708–7722. [Google Scholar] [CrossRef] [PubMed]
- Wang, M.; Liu, R.; Chen, W.; Peng, C.; Markert, B. Effects of urbanization on heavy metal accumulation in surface soils. J. Environ. Sci. 2018, 64, 328–334. [Google Scholar] [CrossRef] [PubMed]
- Gulan, L.; Milenkovic, B.; Zeremski, T.; Milic, G.; Vuckovic, B. Persistent organic pollutants, heavy metals and radioactivity in the urban soil of Priština city, Kosovo and Metohija. Chemosphere 2017, 171, 415–426. [Google Scholar] [CrossRef] [PubMed]
- Soleimani, M.; Amini, N.; Sadeghian, B.; Wang, D.; Fang, L. Heavy metals and their source identification in par-ticulate matter (PM2.5) in Isfahan city, Iran. J. Environ. Sci. 2018, 72, 166–175. [Google Scholar] [CrossRef]
- Jaishankar, M.; Tseten, T.; Anbalagan, N.; Mathew, B.B.; Beeregowda, K.N. Toxicity, mechanism and health effects of some heavy metals. Interdiscip. Toxicol. 2014, 7, 60–72. [Google Scholar] [CrossRef] [Green Version]
- Yadav, I.C.; Devi, N.L.; Singh, V.K.; Li, J.; Zhang, G. Spatial distribution, source analysis and health risk assess-ment of heavy metals contamination in house dust and surface soil from four major cities of Nepal. Chemosphere 2019, 218, 1100–1113. [Google Scholar] [CrossRef]
- Yuan, X.; Xue, N.; Han, Z. A meta-analysis of heavy metals pollution in farmland and urban soils in China over the past 20 years. J. Environ. Sci. 2021, 101, 217–226. [Google Scholar] [CrossRef]
- Guagliardi, I.; Cicchella, D.; de Rosa, R.; Buttafuoco, G. Assessment of lead pollution in topsoils of a southern Italy area: Analysis of urban and peri-urban environment. J. Environ. Sci. 2015, 33, 179–187. [Google Scholar] [CrossRef]
- Wilkins, D.A. The measurement of tolerance to edaphic factors by means of root growth. New Phytol. 1978, 80, 623–633. [Google Scholar] [CrossRef]
- European Commission DG Environment. Soil Contamination: Impacts on Human Health, Science for Environment Policy, 2013, Issue 5. Available online: http://ec.europa.eu/science-environment-policy (accessed on 22 January 2021).
- Directive 98/70/EC, European Parliament and of the Council. Relating to the quality of petrol and diesel fuels and amending Council Directive 93/12/EEC. Off. J. L 1998, 350, 58–68.
- Migon, C.; Jourdan, E.; Nicolas, E.; Gentili, B. Effects of reduced leaded fuel consumption on atmospheric lead behavior. Chemosphere 1994, 28, 139–144. [Google Scholar] [CrossRef]
- Tomtom. 2019. Available online: https://www.tomtom.com/en_gb/traffic-index/ (accessed on 15 December 2020).
- Werkenthin, M.; Kluge, B.; Wessolek, G. Metals in European roadside soils and soil solution-A review. Environ. Pollut. 2014, 189, 98–110. [Google Scholar] [CrossRef] [PubMed]
- Jiang, Y.; Chao, S.; Liu, J.; Yang, Y.; Chen, Y.; Zhang, A.; Cao, H. Source apportionment and health risk assessment of heavy metals in soil for a township in Jiangsu Province, China. Chemosphere 2017, 168, 1658–1668. [Google Scholar] [CrossRef]
- Liu, J.; Liu, Y.J.; Liu, Y.; Liu, Z.; Zhang, A.N. Quantitative contributions of the major sources of heavy metals in soils to ecosystem and human health risks: A case study of Yulin, China. Ecotoxicol. Environ. Saf. 2018, 164, 261–269. [Google Scholar] [CrossRef]
- Barbieri, M. The importance of Enrichment Factor (EF) and Geoaccumulation Index (Igeo) to evaluate the soil contamination. J. Geol. Geophys. 2016, 5, 237. [Google Scholar] [CrossRef]
- Wu, J.; Lu, J.; Li, L.; Min, X.; Luo, Y. Pollution, ecological-health risks and sources of heavy metals in soil of the northeastern Qinghai-Tibet Plateau. Chemosphere 2018, 201, 234242. [Google Scholar] [CrossRef]
- Tomlinson, D.L.; Wilson, J.G.; Harris, C.R.; Jeffrey, D.W. Problems in the assessment of heavy-metal levels in estuaries and the formation of a pollution index. Helgol. Mar. Res. 1980, 33, 566–575. [Google Scholar] [CrossRef] [Green Version]
- Hakanson, L. An ecological risk index for aquatic pollution control. A sedimentological approach. Water Res. 1980, 14, 975–1001. [Google Scholar] [CrossRef]
- Varol, M.; Sunbul, M.R.; Aytop, H.; Yılmaz, C.H. Environmental, ecological and health risks of trace elements and their sources in soils of Harran Plain, Turkey. Chemosphere 2020, 245, 125592. [Google Scholar] [CrossRef] [PubMed]
- Directive 2008/50/EC, European Parliament and of the Council. On ambient air quality and cleaner air for Europe. Off. J. L 2008, 152, 1–44.
- Directive 2010/75/EU, European Parliament and of the Council. On industrial emissions (integrated pollution prevention and control). Off. J. L 2010, 334, 17–119.
- Gallaert, G.; Cools, N.; Delanote, V.; De Vos, B.; Groenemans, R.; Langouche, D.; Roskams, P.; Scheldeman, X.; Mechelen, L.V.; Ranst, E.V. Sampling and Analysis of Soil–Manual on Methods and Criteria for Harmonized Sampling, Assessment, Monitoring and Analysis of the Effects of Air Pollution on Forests, 4th ed.; UNECE: Hamburg, Germany, 2003. [Google Scholar]
- ISO 10390. Soil Quality—Determination of pH; ISO: Genebra, Switzerland, 2015. [Google Scholar]
- ISO 11465. Soil quality—Determination of Dry Matter and Water Content on a Mass Basis–Gravimetric Method; ISO: Genebra, Switzerland, 1993. [Google Scholar]
- CEN/TC. Chemical Analyses—Determination of Dry Matter and Water Content on a Mass Basis in Sediment, Sludge, Soil, and Waste—Gravimetric Method; CEN: Brussels, Belgium, 2003. [Google Scholar]
- ISO 11466. Soil Quality—Extraction of Trace Elements Soluble in Aqua Regia; ISO: Genebra, Switzerland, 2010. [Google Scholar]
- Förstner, U.; Müller, G. Concentrations of heavy metals and polycyclic aromatic hydrocarbons in river sediments: Geochemical background, man’s influence and environmental impact. GeoJournal 1981, 5, 417. [Google Scholar] [CrossRef]
- Baltas, H.; Sirin, M.; Gökbayrak, E.; Ozcelik, A.E. A case study on pollution and a human health risk assessment of heavy metals in agricultural soils around Sinop province, Turkey. Chemosphere 2020, 241, 125015. [Google Scholar] [CrossRef] [PubMed]
- Mazurek, R.; Kowalska, J.; Gąsiorek, M.; Zadrożny, P.; Jozefowska, A.; Zaleski, T.; Kepka, W.; Tymczuk, M.; Orłowska, K. Assessment of heavy metals contamination in surface layers of Roztocze National Park forest soils (SE Po-land) by indices of pollution. Chemosphere 2016, 168, 839–850. [Google Scholar] [CrossRef]
- Liu, K.; Li, C.; Tang, S.; Shang, G.; Yu, F.; Li, Y. Heavy metal concentration, potential ecological risk assessment and enzyme activity in soils affected by a lead-zinc tailing spill in Guangxi, China. Chemosphere 2020, 251, 126415. [Google Scholar] [CrossRef]
- Kumar, V.; Sharma, A.; Kaur, P.; Singh Sidhu, G.P.; Bali, A.S.; Bhardwaj, R.; Thukral, A.K.; Cerda, A. Pollution assessment of heavy metals in soils of India and ecological risk assessment: A state-of-the-art. Chemosphere 2019, 216, 449–462. [Google Scholar] [CrossRef]
- Massart, D.L.; Vandeginste, B.G.M.; Deming, S.N.; Michotte, Y.; Kaufman, L. Chemometrics: A Textbook (Data Handling in Science and Technology); Fifth Impression 2003; Elsevier Science: Amsterdam, The Netherlands, 1988. [Google Scholar]
- Leitão, T.E.; Cameira, M.R.; Costa, H.D.; Pacheco, J.M.; Henriques, M.J.; Martins, L.L.; Mourato, M.P. Environmental quality in urban allotment gardens: Atmospheric deposition, soil, water and vegetable assessment at Lisbon city. Water Air Soil Pollut. 2018, 229, 31. [Google Scholar] [CrossRef]
- Argyraki, A.; Kelepertzis, E. Urban soil geochemistry in Athens, Greece: The importance of local geology in controlling the distribution of potentially harmful trace elements. Sci. Total Environ. 2014, 482, 366–377. [Google Scholar] [CrossRef]
- Ajmone-Marsan, F.; Biasioli, M.; Kralj, T.; Grčman, H.; Davidson, C.M.; Hursthouse, A.S.; Madrid, L.; Rodrigues, S. Metals in particle-size fractions of the soils of five European cities. Environ. Pollut. 2008, 152, 73–81. [Google Scholar] [CrossRef]
- Zheng, Y.; Chen, T.; He, J. Multivariate geostatistical analysis of heavy metals in topsoils from Beijing, China. J. Soils Sediments 2008, 8, 51–58. [Google Scholar] [CrossRef]
- Birke, M.; Rauch, U. Urban Geochemistry: Investigations in the Berlin Metropolitan area. Environ. Geochem. Health 2000, 22, 233–248. [Google Scholar] [CrossRef]
- Guillén, M.T.; Delgado, J.; Albanese, S.; Nieto, J.M.; Lima, A.; de Vivo, B. Heavy metals fractionation and multi-variate statistical techniques to evaluate the environmental risk in soils of Huelva township (SW Iberian Peninsula). J. Geochem. Explor. 2012, 119–120, 32–43. [Google Scholar] [CrossRef]
- Christoforidis, A.; Stamatis, N. Heavy metal contamination in street dust and roadside soil along the major national road in Kavala’s region, Greece. Geoderma 2009, 151, 257–263. [Google Scholar] [CrossRef]
- Mitchell, R.; Spliethoff, H.M.; Ribaudo, L.N.; Lopp, D.M.; Shayler, H.A.; Marquez-Bravo, L.G.; Lambert, V.T.; Ferenz, G.S.; Russell-Anelli, J.M.; Stone, E.B.; et al. Lead (Pb) and other metals in New York City community garden soils: Factors influencing contaminant distributions. Environ. Pollut. 2014, 187, 162–169. [Google Scholar] [CrossRef] [PubMed] [Green Version]
- Tijhuis, L.; Brattli, B.; Sæther, O. A geochemical survey of topsoil in the city of Oslo, Norway. Environ. Geochem. Health 2002, 24, 67–94. [Google Scholar] [CrossRef]
- Manta, D.S.; Angelone, M.; Bellanca, A.; Neri, R.; Sprovieri, M. Heavy metals in urban soils: A case study from the city of Palermo (Sicily), Italy. Sci. Total Environ. 2002, 300, 229–243. [Google Scholar] [CrossRef]
- Nogueira, T.A.R.; Abreu-Junior, C.H.; Alleoni, L.R.F.; He, Z.; Soares, M.R.; Vieira, C.S.; Lessa, L.G.F.; Capra, G.F. Background concentrations and quality reference values for some potentially toxic elements in soils of São Paulo state, Brazil. J. Environ. Manag. 2018, 221, 10–19. [Google Scholar] [CrossRef] [PubMed] [Green Version]
- Shi, G.; Chen, Z.; Xu, S.; Zhang, J.; Wang, L.; Bi, C.; Teng, J. Potentially toxic metal contamination of urban soils and roadside dust in Shanghai, China. Environ. Pollut. 2008, 156, 251–260. [Google Scholar] [CrossRef]
- Linde, M.; Bengtsson, H.; Öborn, I. Concentrations and pools of heavy metals in urban soils in Stockholm, Sweden. Water Air Soil Pollut. 2001, 1, 83–101. [Google Scholar] [CrossRef]
- Cachada, A.; Dias, A.C.; Pato, P.; Mieiro, C.; Rocha-Santos, T.; Pereira, M.E.; Ferreira da Silva, E.; Duarte, A.C. Major inputs and mobility of potentially toxic elements contamination in urban areas. Environ. Monit. Assess. 2013, 185, 279–294. [Google Scholar] [CrossRef]
- Costa, C.; Reis, A.P.; Silva, E.F.; Rocha, F.; Patinha, C.; Dias, A.C.; Sequeira, C.; Terroso, D. Assessing the control exerted by soil mineralogy in the fixation of potentially harmful elements in the urban soils of Lisbon, Portugal. Environ. Earth Sci. 2012, 65, 1133–1145. [Google Scholar] [CrossRef]
- Fleischer, M. Recent Estimates of the Abundances of the Elements in the Earth’s Crust; U.S. Geological Survey: Washington, DC, USA, 1953; Volume 285.
- Vinogradov, A.P. The Geochemistry of Rare and Dispersed Chemical Elements in Soils, 2nd ed.; Consultants Bureau: New York, NY, USA, 1959. [Google Scholar]
- Taylor, S.R. Abundance of chemical elements in the continental crust: A new table. Geochim. Cosmochim. Acta 1964, 28, 1273–1285. [Google Scholar] [CrossRef]
- Mason, B.; Moore, C.B. Principles of Geochemistry, 4th ed.; John Wiley Sons: New York, NY, USA, 1966. [Google Scholar]
- Parker, R.L. Data of Geochemistry. Chapter D. Composition of the Earth’s Crust, 6th ed.; United States Government Printing Office: Washington, DC, USA, 1967.
- Wedepohl, K.H. The composition of the continental crust. Geochim. Cosmochim. Acta 1995, 59, 1217–1232. [Google Scholar] [CrossRef]
- Adriano, D.C. Trace Elements in Terrestrial Environments: Biogeochemistry, Bioavailability and Risks of Metals, 2nd ed.; Springer: New York, NY, USA, 2001. [Google Scholar]
- Reimann, C.; Siewers, U.; Tarvainen, T.; Bityukova, L.; Eriksson, J.; Giucis, A.; Gregorauskiene, V.; Lukashev, V.K.; Matinian, N.N.; Pasieczna, A. Agricultural Soils in Northern Europe: A Geochemical Atlas; Schweizerbart Science Publishers: Stuttgart, Germany, 2003. [Google Scholar]
- Kabata-Pendias, A. Trace Elements in Soils and Plants, 4th ed.; Taylor Francis Group: Boca Raton, FL, USA; London, UK; New York, NY, USA, 2011. [Google Scholar]
- Moitinho de Almeida, F. Carta Geológica do Concelho de Lisboa, Folha 1, 2, 3 e 4, Escala 1:10 000; Serviços Geológicos de Portugal: Lisbon, Portugal, 1986. [Google Scholar]
- Matschullat, J.; Ottenstein, R.; Reimann, C. Geochemical background—Can we calculate it? Environ. Geol. 2000, 39, 990–1000. [Google Scholar] [CrossRef]
- Reimann, C.; Filzmoser, P. Normal and lognormal data distribution in geochemistry:death of a myth. Consequences for the statistical treatment of geochemical and environmental data. Environ. Geol. 2000, 39, 1001–1014. [Google Scholar] [CrossRef]
- Reimann, C.; Filzmoser, P.; Garrett, R.G. Background and threshold: Critical comparison of methods of determination. Sci. Total Environ. 2005, 346, 1–16. [Google Scholar] [CrossRef]
- Reimann, C.; Garrett, R.G. Geochemical background—Concept and reality. Sci. Total Environ. 2005, 350, 12–27. [Google Scholar] [CrossRef]
- Korzeniowska, J.; Krąż, P. Heavy Metals Content in the Soils of the Tatra National Park Near Lake Morskie Oko and Kasprowy Wierch—A Case Study (Tatra Mts, Central Europe). Minerals 2020, 10, 1120. [Google Scholar] [CrossRef]
- Directive 86/278/EEC of the Council. On the protection of the environment, and in particular of the soil, when sewage sludge is used in agriculture. Off. J. L 1986, 181, 0006–0012.
- Imperato, M.; Adamo, P.; Arienzo, M.; Naimo, D.; Stanzione, D.; Violante, P. Spatial distribution of heavy metals in urban soils of Naples city (Italy). Environ. Pollut. 2003, 124, 247–256. [Google Scholar] [CrossRef]
- Andersson, M.; Ottesen, R.T.; Langedal, M. Geochemistry of urban surface soils—Monitoring in Trondheim, Norway. Geoderma 2010, 156, 112–118. [Google Scholar] [CrossRef]
- Meza-Montenegro, M.; Gandolfi, A.J.; Santana-Alcántar, M.E.; Klimecki, W.T.; Aguilar-Apodaca, M.G.; Río-Salas, R.D.; De la O-Villanueva, M.; Gómez-Alvarez, A.; Mendivil-Quijada, H.; Valencia, M.; et al. Metals in residential soils and cumulative risk assessment in Yaqui and Mayo agricultural valleys, northern Mexico. Sci. Total Environ. 2012, 433, 472–481. [Google Scholar] [CrossRef] [PubMed]
- Pant, P.; Harrison, R.M. Estimation of the contribution of road traffic emissions to particulate matter concentra-tions from field measurements: A review. Atmos. Environ. 2013, 77, 78–97. [Google Scholar] [CrossRef]
- Moaref, S.; Sekhavatjou, M.S.; Alhashemi, A.H. Determination of trace elements concentration in wet and dry atmospheric deposition and surface soil in the largest industrial city, southwest of Iran. Int. J. Environ. Res. 2014, 8, 335–346. [Google Scholar] [CrossRef]
Figure 1.
Soil sampling sites in the city of Lisbon.

Figure 2.
Metal content (Pb, Ni, Cr and Cd) in each sampled site over the years of the campaign (2003–2011).
Figure 2.
Metal content (Pb, Ni, Cr and Cd) in each sampled site over the years of the campaign (2003–2011).

Figure 3.
Boxplot of the evolution of metal content in soils over the years of the study.

Figure 4.
Igeo values calculated for each metal (Pb, Ni, Cr and Cd) in each sampled site.

Figure 5.
Contamination factor (Cf) values for each metal, in each sampling site. Insert: values of degree of contamination (Cd) and pollution load index (PLI) with the values obtained for each sampling site and the global PLI calculated for the city of Lisbon.
Figure 5.
Contamination factor (Cf) values for each metal, in each sampling site. Insert: values of degree of contamination (Cd) and pollution load index (PLI) with the values obtained for each sampling site and the global PLI calculated for the city of Lisbon.

Figure 6.
Values of the ecological risk factor (Er) and the global potential ecological risk (RI).

Figure 7.
Principal component analysis plot of the soil samples (PC1 and PC2).


Table 1.
Soil characteristics in two years of sampling.
| Year | Rainfall (mm) | Humidity (%) | Organic Mat. (%) | Conductivity (μS/cm) | pH |
|---|---|---|---|---|---|
| 2004 | 553 | 0.79 ± 0.05 | 7.11 ± 1.74 | 316 ± 46 | 7.41 ± 0.16 |
| 2011 | 1045 | 4.28 ± 0.16 | 9.58 ± 2.44 | 328 ± 43 | 7.34 ± 0.17 |
Table 2.
Metal content (mg/kg) values for each sampling site and each year, minimum (Min), maximum (Max), mean (Mean) values and relative standard deviation of the mean (RSD %). Expanded uncertainty values (U), for 95% confidence level, are shown in the last column.
Table 2.
Metal content (mg/kg) values for each sampling site and each year, minimum (Min), maximum (Max), mean (Mean) values and relative standard deviation of the mean (RSD %). Expanded uncertainty values (U), for 95% confidence level, are shown in the last column.
| Metal | Site | Year | |||||||||||||
|---|---|---|---|---|---|---|---|---|---|---|---|---|---|---|---|
| 2003 | 2004 | 2005 | 2006 | 2007 | 2008 | 2009 | 2010 | 2011 | Min | Max | Mean | RSD (%) | U | ||
| Cd | CE 1 | 0.38 | 0.35 | 0.36 | 0.39 | 0.48 | 0.66 | 0.63 | 0.83 | 0.59 | 0.35 | 0.83 | 0.52 | 32 | ±0.05 |
| CE 2 | 0.19 | 0.28 | 0.30 | 0.47 | 0.58 | 0.64 | 0.68 | 0.72 | 0.46 | 0.19 | 0.72 | 0.48 | 40 | ±0.07 | |
| UH | 0.35 | 0.42 | 0.40 | 0.43 | 0.27 | 0.38 | 0.43 | 0.46 | 0.38 | 0.27 | 0.46 | 0.39 | 14 | ±0.04 | |
| CC | 0.45 | 0.47 | 0.66 | 1.04 | 0.68 | 0.70 | 0.71 | 1.04 | 0.71 | 0.45 | 1.04 | 0.72 | 29 | ±0.07 | |
| RA | 0.55 | 0.50 | 0.47 | 0.55 | 0.52 | 0.55 | 0.31 | 0.37 | 0.25 | 0.25 | 0.55 | 0.45 | 25 | ±0.06 | |
| CP | 0.20 | 0.27 | 0.25 | 0.27 | 0.23 | 0.24 | 0.17 | 0.24 | 0.11 | 0.11 | 0.27 | 0.22 | 24 | ±0.04 | |
| Year average | 0.35 | 0.38 | 0.41 | 0.53 | 0.46 | 0.53 | 0.49 | 0.61 | 0.42 | 0.35 | 0.61 | 0.46 | 18 | ±0.14 | |
| Cr | CE 1 | 29.8 | 45.3 | 50.7 | 50.1 | 64.7 | 74.3 | 85.9 | 88.5 | 61.3 | 29.8 | 88.5 | 61.2 | 32 | ±1.6 |
| CE 2 | 13.3 | 23.8 | 28.6 | 30.4 | 35.7 | 40.4 | 41.5 | 43.1 | 37.7 | 13.3 | 43.1 | 32.7 | 30 | ±0.9 | |
| UH | 12.8 | 35.8 | 42.5 | 42.1 | 42.4 | 68.6 | 70.7 | 73.1 | 58.6 | 12.8 | 73.1 | 49.6 | 40 | ±1.6 | |
| CC | 26.3 | 31.0 | 34.4 | 35.6 | 47.8 | 47.0 | 46.6 | 48.6 | 36.9 | 26.3 | 48.6 | 39.4 | 21 | ±0.9 | |
| RA | 9.6 | 23.6 | 25.9 | 29.7 | 27.6 | 36.4 | 38.5 | 43.5 | 36.7 | 9.6 | 43.5 | 30.2 | 34 | ±0.9 | |
| CP | 33.3 | 34.4 | 38.2 | 35.8 | 48.4 | 45.4 | 65.2 | 79.9 | 77.9 | 33.3 | 79.9 | 50.9 | 37 | ±1.8 | |
| Year average | 20.9 | 32.3 | 36.7 | 37.3 | 44.4 | 52.0 | 58.1 | 62.8 | 51.5 | 20.9 | 62.8 | 44.0 | 31 | ±3.3 | |
| Ni | CE 1 | 17.8 | 28.7 | 37.0 | 67.5 | 82.4 | 85.3 | 82.7 | 86.0 | 104.6 | 17.8 | 104.6 | 65.8 | 46 | ±2.5 |
| CE 2 | 11.4 | 19.6 | 20.2 | 23.7 | 47.8 | 45.9 | 87.7 | 114.9 | 78.5 | 11.4 | 114.9 | 50.0 | 72 | ±2.3 | |
| UH | 16.0 | 16.8 | 19.1 | 29.6 | 29.0 | 53.9 | 49.6 | 55.3 | 72.1 | 16.0 | 72.1 | 37.9 | 54 | ±2.1 | |
| CC | 18.2 | 28.2 | 43.7 | 46.7 | 102.0 | 114.3 | 115.4 | 120.4 | 70.0 | 18.2 | 120.4 | 73.2 | 55 | ±2.3 | |
| RA | 14.7 | 10.1 | 11.6 | 14.9 | 9.8 | 16.9 | 13.6 | 10.6 | 13.7 | 9.8 | 16.9 | 12.9 | 19 | ±1.3 | |
| CP | 42.8 | 43.2 | 36.3 | 44.9 | 35.4 | 35.4 | 41.5 | 42.8 | 35.5 | 35.4 | 44.9 | 39.8 | 10 | ±1.2 | |
| Year average | 20.2 | 24.4 | 28.0 | 37.9 | 51.1 | 58.6 | 65.1 | 71.7 | 62.4 | 20.2 | 71.7 | 46.6 | 42 | ±4.9 | |
| Pb | CE 1 | 3.2 | 5.0 | 4.7 | 6.5 | 6.5 | 6.1 | 6.3 | 6.0 | 9.4 | 3.2 | 9.4 | 6.0 | 28 | ±0.2 |
| CE 2 | 2.3 | 5.2 | 5.9 | 6.2 | 5.9 | 7.1 | 7.2 | 7.1 | 12.2 | 2.3 | 12.2 | 6.6 | 39 | ±0.2 | |
| UH | 1.7 | 5.1 | 5.5 | 5.5 | 5.2 | 7.0 | 7.1 | 8.4 | 12.0 | 1.7 | 12.0 | 6.4 | 44 | ±0.2 | |
| CC | 4.8 | 5.6 | 5.5 | 6.5 | 6.3 | 7.8 | 8.3 | 8.4 | 9.1 | 4.8 | 9.1 | 6.9 | 22 | ±0.2 | |
| RA | 1.9 | 6.9 | 7.0 | 7.0 | 7.1 | 6.9 | 7.4 | 7.3 | 7.1 | 1.9 | 7.4 | 6.5 | 27 | ±0.2 | |
| CP | 0.6 | 1.9 | 1.7 | 2.6 | 2.3 | 2.5 | 2.6 | 3.4 | 1.3 | 0.6 | 3.4 | 2.1 | 40 | ±0.1 | |
| Year average | 2.4 | 4.9 | 5.1 | 5.7 | 5.5 | 6.2 | 6.5 | 6.8 | 8.5 | 2.4 | 8.5 | 5.7 | 29 | ±0.4 | |
Table 3.
Metal content (mg/kg) mean, minimum (min) and maximum (max) values from different places all around the world.
Table 3.
Metal content (mg/kg) mean, minimum (min) and maximum (max) values from different places all around the world.
| City, Country | Cd | Cr | Ni | Pb | Reference | ||||
|---|---|---|---|---|---|---|---|---|---|
| Mean | (Min–Max) | Mean | (Min–Max) | Mean | (Min–Max) | Mean | (Min–Max) | ||
| Athens, Greece | 0.4 | (0.1–3.5) | 163 | (43–1586) | 111 | (27–727) | 77 | (3–2764) | [39] |
| Aveiro, Portugal | - | 59 | (15–83) | 39 | (13–57) | 44 | (17–64) | [40] | |
| Beijing, China | 0.148 | (0.01–0.971) | 35.6 | (7.00–228.2) | 27.8 | (2.80–168.9) | 28.6 | (5.00–116.6) | [41] |
| Berlin, Germany | 0.68 | (nd-20.3) | 30 | (nd-168) | 10.1 | (nd-44.5) | 133 | (nd-1490) | [42] |
| Glasgow, U.K. | - | 17 | (6–37) | 16 | (6–33) | 24 | (8–42) | [40] | |
| Huelva, Spain | 0.81 | (0.02–20.3) | 31.7 | (3–112.1) | 16.1 | (0.9–48.7) | 135.2 | (7.22–5469) | [43] |
| Kavala, Greece | 0.2 | (nd-1.2) | 232.4 | (50–692) | 67.9 | (25–267) | 387 | (75–2500) | [44] |
| Ljubljana, Slovenia | - | 41 | (24–66) | 39 | (30–56) | 40 | (30–57) | [40] | |
| New York, EUA | <0.4 | (<0.4–3.1) | 12.8 | (3.2–366.1) | 10 | (<2.8–38) | 102 | (11–2455) | [45] |
| Oslo, Norway | 0.41 | (0.06–3.10) | 32.5 | (2.85–224) | 28.4 | (2.23–232) | 55.6 | (<5–1000) | [46] |
| Palermo, Italy | 0.68 | (0.27–1.86) | 34 | (12–100) | 17.8 | (7.0–38.6) | 202 | (57–682) | [47] |
| São Paulo, Brazil | 0.1 | (0.04–0.22) | 37 | (15–90) | 36 | (11–67) | 10 | (4–23) | [48] |
| Shanghai, China | 0.52 | (0.19–3.66) | 107.9 | (25.5–233) | 31.14 | (4.95–65-70) | 70.69 | (13.7–192) | [49] |
| Stockholm, Sweden | 0.16 | (0.02–0.25) | 35 | (6–25) | 16 | (2.1–27.8) | 19 | (2.4–32) | [50] |
| Torino, Italy | - | - | 14 | (2–25) | 20 | (4–35) | 25 | (8–44) | [40] |
| Lisbon, Portugal | - | - | 38 | (1.0–172) | 43 | (2.0–209) | 89 | (4.8–561) | [51] |
| Lisbon, Portugal | 0.23 | (0.01–1.28) | 48 | (6.8–201) | 42 | (4.3–194) | 114 | (4.7–305) | [52] |
| Lisbon, Portugal | - | - | 35.3 | (12.2–121) | 23.9 | (8.0–95) | 33.9 | (1.0–110) | [38] |
| Lisbon, Portugal | 0.41 | (0.11–1.04) | 51.5 | (9.61–88.5) | 62.4 | (9.77–120.4) | 8.5 | (0.55–12.2) | This study |
| Average | 0.396 | (nd–20.3) | 55.6 | (nd–1586) | 34.6 | (nd–727) | 84.1 | (nd–5469) | |
Table 4.
Typical metal content in earth’s continental crust and in soil (mg/kg).
| Medium | Reference | Metal | |||
|---|---|---|---|---|---|
| Cd | Cr | Ni | Pb | ||
| Crust | [53] | 0.1–5 | 200–380 | 20–8 | 16–30 |
| Crust | [54] | 0.13 | 83.0 | 58.0 | 16.0 |
| Soils | 0.50 | 200.0 | 40.0 | 10.0 | |
| Urban Soils | 0.90 | 80.0 | 33.0 | 54.5 | |
| Crust | [55] | 0.2 | 100 | 75 | 12.5 |
| Crust | [56] | 0.2 | 100 | 75 | 13 |
| Crust | [57] | 0.13–0.5 | 83–370 | 58–200 | 12.5–20 |
| Crust | [58] | 0.102 | 35 | 18.6 | 17 |
| Crust | [59] | 0.02–6 | 125 | 2–500 | 10–50 |
| Soils | 0.01–2 | 40 | 17–50 | 2–30 | |
| Agriculture Soils | [60] | - | 32 | 10 | 17 |
| Crust | [61] | - | 126–185 | 20 | 14–15 |
| Soils | 0.02–14 | 60 | 29 | 27 | |
| Earth’s Crust Range | 0.01–6 | 35–380 | 8–500 | 2–50 | |
Table 5.
Calculated background values (mg/kg) for each sampling site according to the iterative 2s-technique, proposed in [65].
Table 5.
Calculated background values (mg/kg) for each sampling site according to the iterative 2s-technique, proposed in [65].
| Cd | Cr | Ni | Pb | |
|---|---|---|---|---|
| CE1 | 0.260 | 20.3 | 11.1 | 21.3 |
| CE2 | 0.127 | 9.21 | 7.69 | 15.3 |
| UH | 0.240 | 8.94 | 10.9 | 11.4 |
| CC | 0.317 | 18.0 | 12.4 | 32.9 |
| RA | 0.360 | 6.57 | 10.1 | 12.6 |
| CP | 0.133 | 22.9 | 31.8 | 3.77 |
Publisher’s Note: MDPI stays neutral with regard to jurisdictional claims in published maps and institutional affiliations. |
© 2021 by the authors. Licensee MDPI, Basel, Switzerland. This article is an open access article distributed under the terms and conditions of the Creative Commons Attribution (CC BY) license (https://creativecommons.org/licenses/by/4.0/).
Share and Cite
MDPI and ACS Style
Silva, H.F.; Silva, N.F.; Oliveira, C.M.; Matos, M.J. Heavy Metals Contamination of Urban Soils—A Decade Study in the City of Lisbon, Portugal. Soil Syst. 2021, 5, 27. https://0-doi-org.brum.beds.ac.uk/10.3390/soilsystems5020027
AMA Style
Silva HF, Silva NF, Oliveira CM, Matos MJ. Heavy Metals Contamination of Urban Soils—A Decade Study in the City of Lisbon, Portugal. Soil Systems. 2021; 5(2):27. https://0-doi-org.brum.beds.ac.uk/10.3390/soilsystems5020027
Chicago/Turabian StyleSilva, Hugo Félix, Nelson Frade Silva, Cristina Maria Oliveira, and Manuel José Matos. 2021. "Heavy Metals Contamination of Urban Soils—A Decade Study in the City of Lisbon, Portugal" Soil Systems 5, no. 2: 27. https://0-doi-org.brum.beds.ac.uk/10.3390/soilsystems5020027