Quantification and Verification of Cardiorespiratory Fitness in Adults with Prehypertension


1
Department of Kinesiology and Nutrition Sciences, School of Integrated Health Sciences, University of Nevada Las Vegas, Las Vegas, NV 89154, USA
2
Department of Epidemiology and Biostatistics, School of Public Health, University of Nevada Las Vegas, Las Vegas, NV 89154, USA
*
Author to whom correspondence should be addressed.
Sports 2021, 9(1), 9; https://0-doi-org.brum.beds.ac.uk/10.3390/sports9010009
Submission received: 1 December 2020
/
Revised: 2 January 2021
/
Accepted: 6 January 2021
/
Published: 11 January 2021
(This article belongs to the Special Issue Exercise Physiology: New Frontiers for Exercise Testing and Prescription)
Abstract
:Background: Low cardiorespiratory fitness is associated with increased risk of hypertension and atherosclerosis in adults with prehypertension. The purpose of this study was to quantify cardiorespiratory fitness and to examine the utility of supramaximal constant-load verification testing for validating maximal oxygen uptake (VO2max) attainment in adults with prehypertension. Methods: Eleven adults (four women) with prehypertension (22.5 ± 2.9 y; body mass index (BMI): 24.6 ± 3.2 kg·m2) underwent an incremental exercise test followed 15 min later by a verification test at 105% of maximal work rate on a cycle ergometer. Results: There was no statistical difference in VO2 between the incremental (2.23 ± 0.54 L·min−1) and verification tests (2.28 ± 0.54 L·min−1; p = 0.180). Only three out of eleven participants had a higher VO2 during the verification when compared with the incremental test. If the verification test had not been conducted, one participant would have been incorrectly classified as having low cardiorespiratory fitness based on incremental test results alone. Conclusions: Verification testing validates the attainment of VO2max and can potentially reduce the over-diagnosis of functional impairment (i.e., deconditioning) in adults with prehypertension.
1. Introduction
Prehypertension affects one in three adults in the United States [1] and is associated with an increased risk of hypertension [2] as well as cardiovascular morbidity and mortality [3]. Low cardiorespiratory fitness in adults with prehypertension is associated with an increased risk of hypertension [4] and atherosclerosis [5]. Previous studies that have examined the associations between cardiorespiratory fitness and health outcomes in adults with prehypertension have typically quantified cardiorespiratory fitness relative to body weight (i.e., as mL·min−1·kg−1) or metabolic equivalents (MET) or treadmill test duration, and they have used treadmill as the mode of exercise for fitness assessments [4,6,7,8,9,10]. While treadmill testing per se may not affect maximal oxygen uptake (VO2max) levels, the use of exercise test duration from a treadmill protocol as a surrogate for VO2max can negatively influence performance in individuals who carry excess body weight [11]. These traditional methods of quantifying cardiorespiratory fitness could inaccurately underestimate fitness levels in individuals with overweight or obesity, who are also at increased risk of high blood pressure [12], and can confound the associations between cardiorespiratory fitness and negative health outcomes [13]. Both the American Thoracic Society (ATS) [14] and the American Heart Association (AHA) [15] recommend quantifying cardiorespiratory fitness as a percent of predicted VO2max, where predicted VO2max is calculated based on ideal body weight. This approach can reduce the underestimation of cardiorespiratory fitness in overweight and obese individuals [16].
Cardiopulmonary exercise testing provides an assessment of VO2max or the highest amount of oxygen that can be delivered by the cardiorespiratory system and utilized by the skeletal system. Hill and Lupton first suggested in 1923 that VO2max represented a point during a graded exercise test where VO2 failed to increase despite an increase in work rate (WR) [17]. Since then, the demonstration of a VO2 plateau has become an essential marker for the achievement of VO2max. Unfortunately, over 40 % of individuals do not achieve a VO2 plateau during a graded exercise test despite achieving VO2max [18]. To overcome this limitation, verification testing has been increasingly recommended for validating the achievement of VO2max from an incremental or graded exercise test in lieu of a VO2 plateau [18]. However, the verification testing approach has not been previously evaluated in adults with prehypertension, who could benefit from the accurate measurements of cardiorespiratory fitness and consequently the accurate prediction of chronic disease risk.
The purpose of this study was to quantify cardiorespiratory fitness based as a percent of predicted VO2max and to examine whether a supramaximal constant-load verification test validates the attainment of VO2max from an incremental test in adults with prehypertension. Based on published data in recreationally trained adults [19] and adults with obesity [20], we hypothesized that there would be no difference between incremental and verification test VO2 in adults with prehypertension.
2. Materials and Methods
The Valdosta State University Institutional Review Board approved this study (Protocol number: IRB-03344-2016), and all participants provided written, informed consent. All participants were 18–30-year-old, healthy, non-smoking adults with a body mass index (BMI) between 20–30 kg·m−2. Participants with cardiovascular, renal, or metabolic disease were excluded [21]. Height and weight were measured using calibrated scales. Resting blood pressure (BP) was measured once in each arm to confirm a difference of <10 mm Hg between arms. Thereafter, three BP measurements were taken in the left arm on two separate days using an automated monitor (SunTech Tango M2 stress test monitor, SunTech Medical, Morrisville, NC, USA) [22]. All participants had a resting systolic BP between 120–139 or a resting diastolic BP between 80–89 mm Hg, which met the definition of “prehypertension” at the time of study design [22]. Participants were asked to avoid caffeine and exercise for 24 h and food for 3 h prior to all study visits.
2.1. Incremental Test
The incremental test was performed on an electronically braked cycle ergometer (Ergoline VIAsprint 150P, Bitz, Germany). Participants completed a two-min warm-up at 30 Watt (W) for women and 40 W for men. WR was increased in the third minute to 40 W for women and 50 W for men. Thereafter, WR was increased by 20 W for women and 25 W for men every minute until volitional exhaustion. Participants were asked to maintain cadence between 60–70 rpm, but were allowed to increase cadence at higher WR, although they were not allowed to exceed a cadence of 100 rpm. The test was stopped when participants were unable to maintain a cadence of 50 rpm for five consecutive seconds despite encouragement.
2.2. Verification Test
The verification test was performed at least 15 min after the incremental exercise test. The verification test was completed at 105% of the maximal WR from the incremental test until volitional exhaustion. The participants warmed up by cycling for 2 min at 30 W for women or 40 W for men. WR was increased to 105% maximal WR immediately after the warm-up, and participants were encouraged to pedal at a cadence of their choice between 60–100 rpm for as long as possible. The test was stopped when participants were unable to maintain a cadence of 50 rpm for five seconds despite encouragement.
2.3. Measurements
Participants were fitted with an oronasal mask connected to a standard non-rebreathing valve (Hans Rudolph, Shawnee, KS, USA). Minute ventilation (VE) and gas exchange (VO2 and carbon dioxide production, VCO2) were measured with a metabolic measurement system and reported as 20-s averages (TrueOne 2400, Parvo Medics, Sandy, UT, USA). A standard three-point calibration was performed before each test or every 4 h per manufacturer recommendations. Heart rate (HR) was measured continuously (Polar Electro Inc., Bethpage, NY, USA). Ratings of perceived breathlessness (RPB; Borg 0–10 scale) and ratings of perceived exertion (RPE; Borg 6–20 scale) were assessed every min [23]. The highest VO2 from the incremental or verification test was accepted as VO2max.
2.4. Data Management
Data from each test were processed as explained below:
- Attainment of VO2 plateau during the incremental test: For each incremental test, an assessment was made regarding the achievement of a VO2 plateau [24,25]. First, we completed a regression of the VO2 and WR relationship after excluding the first and last minute of data. Next, we calculated the “expected” increase in VO2 from the penultimate to the final stage using the VO2/WR regression. Finally, achievement of VO2 plateau was accepted when the difference between measured VO2 between the penultimate and final stage was less than 50% of the “expected” increase.
- Difference in VO2 between incremental and verification tests: To evaluate whether the highest VO2 during the verification test truly exceeded the highest incremental VO2, we calculated the “expected” verification VO2 at 105% of maximum WR using the VO2/WR regression from the incremental test as stated above. If the measured verification VO2 was equal to or exceeded the “expected” verification VO2, we concluded that the participant achieved a higher VO2 during the verification test.
- Time taken to reach highest VO2 during the verification test: Segmental regression analyses were conducted in Prism 8 (version 8.4.2, GraphPad Software, San Diego, CA, USA) to estimate the time at which the VO2 reached a “plateau” during the verification test. A similar assessment was conducted in Microsoft Excel (version 2011, Microsoft, Redmond, WA, USA) using visual inspection of the VO2 (L·min–1) versus time (s) plot to compare the two methods (i.e., Prism 8 vs. visual inspection in Excel).
- Quantification of cardiorespiratory fitness: VO2max was predicted for each participant using equations from Hansen and Wasserman, with age of 30 years used for adults younger than 30 years [16]:
Men:
Ideal weight (kg) = 0.79 × Height (cm) − 60.7
If actual weight equaled or exceeded ideal weight:
VO2max = 0.0337 × Height (cm) − 0.000165 × Age × Height (cm) − 1.963 + 0.006 × Weight (actual − ideal)
If actual weight was less than ideal weight:
VO2max = 0.0337 × Height (cm) − 0.000165 × Age × Height (cm) − 1.963 + 0.014 × Weight (actual − ideal)
Women:
Ideal weight (kg) = 0.65 × Height (cm) − 42.8
VO2max = 0.001 × Height (cm) × (14.783 − 0.11 × Age) + 0.006 × Weight (actual − ideal)
Percent predicted VO2max was calculated as measured/predicted × 100. For % predicted VO2max, >84% was considered normal based on ATS recommendations [14].
2.5. Data Analyses
With an effect size of 1.069 based on previously published data [25] and an alpha of 0.05, a sample size of 11 participants would be able to detect a difference between incremental and verification VO2 using a Wilcoxon signed-rank test with a power of 0.87. Mann–Whitney U tests were used to compare sex differences. Wilcoxon signed-rank tests were used to compare differences in variables between maximal and verification tests. Fisher’s exact test was used to examine proportional differences between sexes. Kendall’s tau-b (τb) was used to examine associations between variables. Analyses were completed with SPSS software (version 27, IBM, Armonk, NY, USA). In this study, p < 0.05 was considered statistically significant.
3. Results
Participant characteristics are shown in Table 1. Six participants were normal weight (BMI 18.5–24.9 kg·m−2) and five were overweight (BMI 25–29.9 kg·m−2). Women had higher diastolic blood pressure when compared with men (Table 1). WRmax was higher in men when compared with women (Table 1).
3.1. Incremental Test
Seven participants (64%) achieved a VO2 plateau during the incremental exercise test (Table 2). Three out of four women did not achieve a VO2 plateau during the incremental test, although their peak HR and respiratory exchange ratio (RER) were high, which indicated that they were approaching exhaustion (Table 2). One out of seven men did not achieve a VO2 plateau. This participant had the highest BMI in the group, and his HR and RER responses indicate that he may have experienced fatigue prior to achieving VO2max (Table 2).
3.2. Verification Test
The verification test duration for participants in this study was 127 ± 20 s (see individual responses in Table 2). Estimates for time taken to reach a plateau during the verification test from Prism 8 and visual inspection in Excel were not statistically different (59 ± 13 and 60 ± 13 s; p = 0.929; Wilcoxon signed-rank test), suggesting that both methods can be used to determine the presence of a VO2 plateau in a verification test. The minimum duration of the verification test in this study was 96 s, which was above the maximum time taken to attain a VO2 plateau from both Prism 8 (72 s) and visual inspection methods (80 s). VO2max (L·min−1) was significantly correlated with verification test duration (τb = 0.636, p = 0.006). The difference in VO2 between incremental and verification tests was not significantly correlated with the verification test duration (τb = 0.309, p = 0.186).
3.3. Incremental vs. Verification Test
Only three out of eleven participants (27%) had a higher VO2 during the verification test when compared with the incremental test based on the “expected” VO2 from the VO2/WR regression. For one participant, the difference between incremental and verification test VO2 was 144 mL·min−1, despite achieving a VO2 plateau during the incremental test (Table 2). However, the other two participants did not achieve a VO2 plateau during the incremental test and had differences of 213 mL·min−1 and 252 mL·min−1 between the incremental and verification test VO2.
On average, respiratory exchange ratio (RER), calculated as VCO2/VO2, was higher during the incremental when compared with the verification test (Table 3). RER increases during high-intensity exercise due to bicarbonate buffering of hydrogen ions (i.e., metabolic acidosis), which increases the rate of CO2 production out of proportion to O2 consumption [16]. There were no statistically significant differences for VO2, VCO2, VE, HR, or breathing pattern between the incremental and verification tests (Table 3).
3.4. Quantification of Cardiorespiratory Fitness
Using the highest VO2 (% predicted) from either the incremental or verification test, we found that two out of eleven participants had below normal levels of cardiorespiratory fitness (i.e., VO2max ≤ 84% predicted; Table 2). If the verification test had not been conducted, one more participant would have been incorrectly classified as having below normal cardiorespiratory fitness (i.e., VO2max ≤ 84% predicted) based on incremental test results alone (Table 2). This participant had not achieved a VO2 plateau during the incremental test.
3.5. Predictors of Maximal Oxygen Uptake
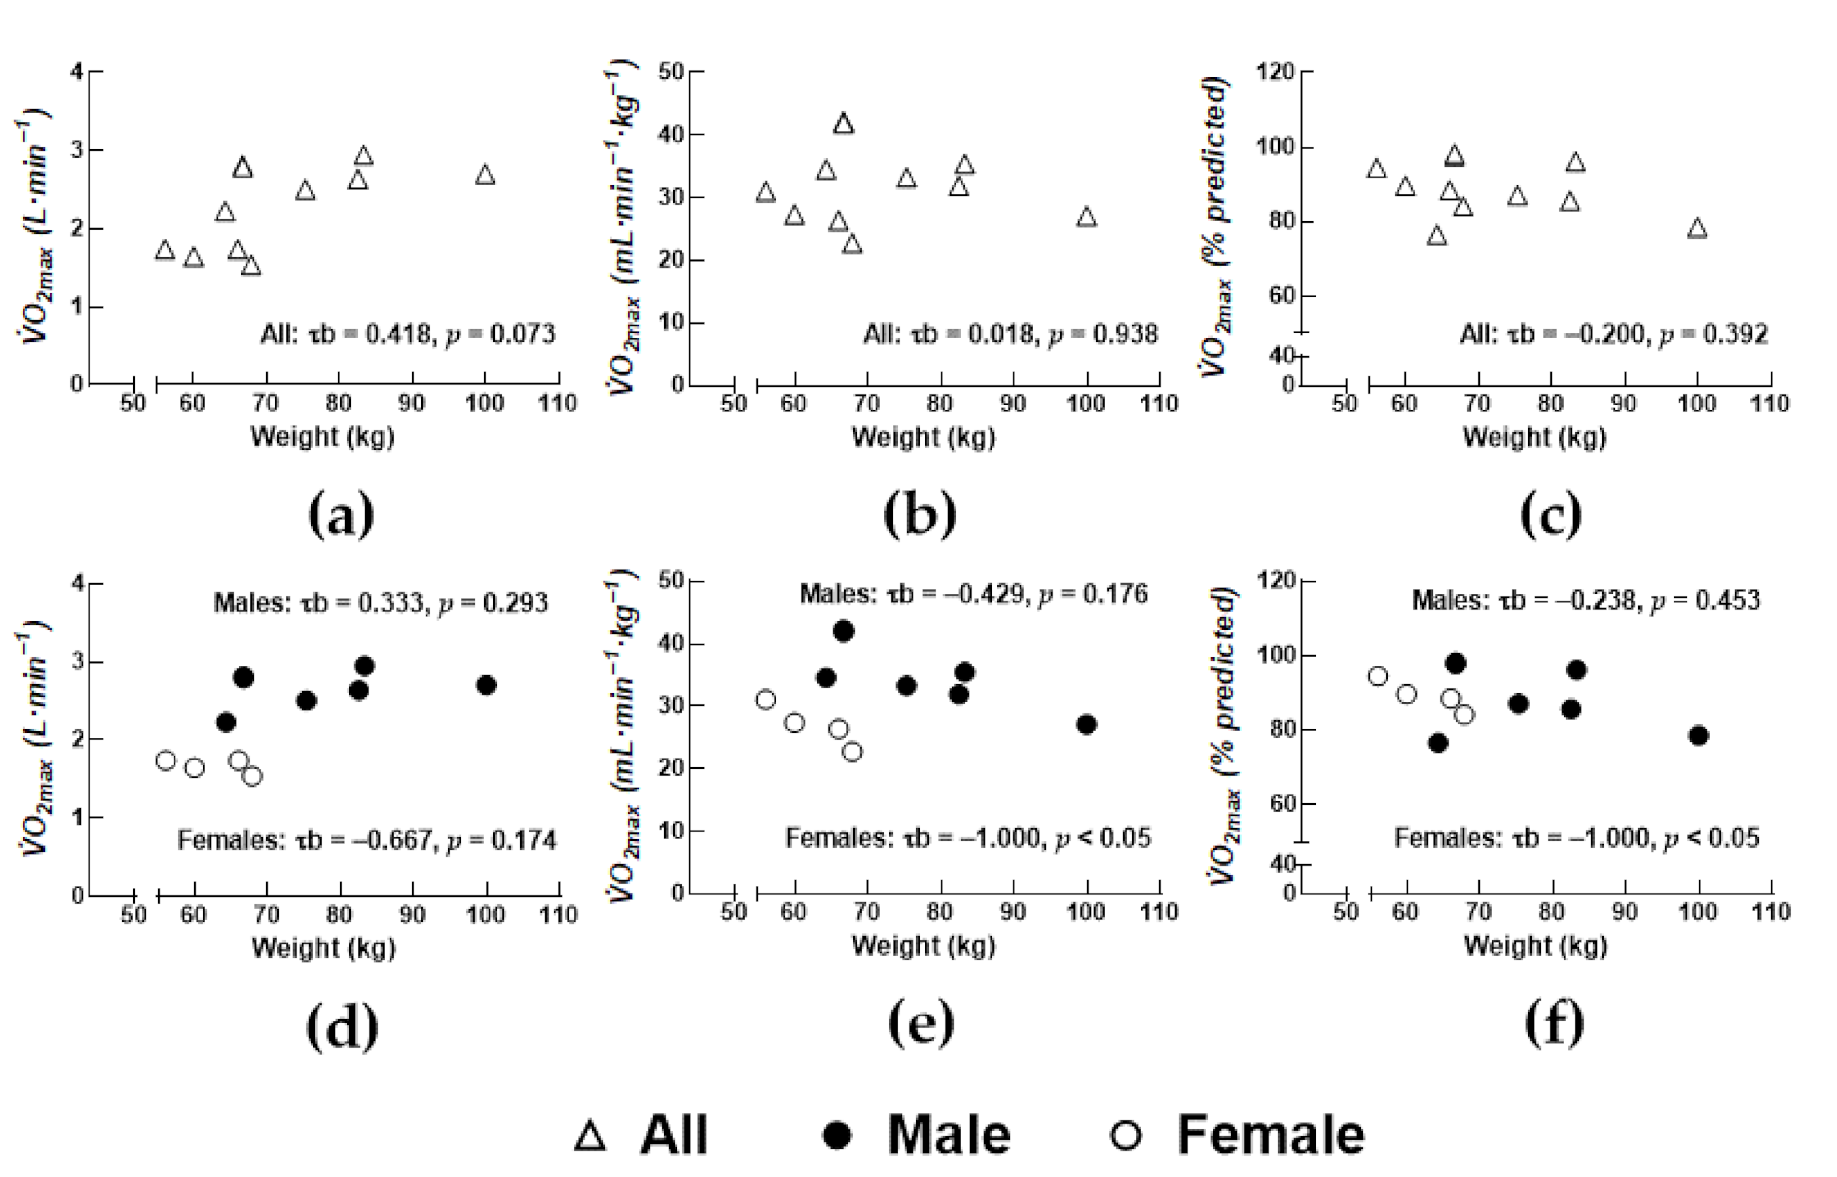
Total body mass tended to be associated with absolute VO2max in all participants (Figure 1; p = 0.073). There were no significant associations between cardiorespiratory fitness (i.e., VO2max quantified as % predicted) and age, anthropometrics, or blood pressure in the total study sample. Cardiorespiratory fitness was inversely associated with total body mass in women (Figure 1f).
4. Discussion
A two-step protocol that includes both incremental and verification testing for the measurement of VO2max can confirm the attainment of VO2max in adults with prehypertension. Relying on the incremental test alone could underestimate true VO2max in ≈27% of individuals and could result in misdiagnosing individuals with prehypertension as “deconditioned”. From a methodological standpoint, 80 s represented the longest duration taken for participants to reach a VO2 plateau during a supramaximal constant-load verification test completed at 105% of WRmax.
Accurate assessments of VO2max are critical to risk prediction models in epidemiology as well as for assessing changes in cardiorespiratory fitness after exercise interventions. Therefore, studies in relatively healthy populations who are not at risk of a “symptom-limited” exercise test [26] should consider a two-step protocol that can be completed during a single visit for confirming VO2max. In this study, a two-step protocol was successfully completed in 11 young adults with prehypertension. We reported a higher verification VO2 when compared with incremental VO2 in three out of eleven participants.
To determine if there is a meaningful difference in VO2 between incremental and verification tests, researchers must consider VO2 measurement error, which is estimated at 40 mL·min−1 for the Parvo Medics TrueOne 2400 [27], and also consider the possibility that a participant may have terminated the incremental test prior to achieving VO2max. The present study predicted the expected VO2 at maximal and supramaximal WRs from the individual participants’ VO2/WR regression and then compared the measured difference between incremental and verification VO2 against the predicted difference. Had this approach not been used in the present study, seven out of eleven participants would have been identified with having a higher verification when compared with incremental VO2. For four of these seven participants, the difference between incremental and verification tests ranged from 2 to 73 mL·min−1. Alternatively, Midgley et al. [28] considered a ≤2% difference between incremental and verification VO2 as a criterion for verifying VO2max based on the measurement error in determining VO2. Had the present study used the 2% criterion, one additional participant with the 73 mL·min−1 difference (≈4%) would have had a higher verification VO2 when compared with the incremental VO2.
Four out of eleven participants, three of whom were women, did not achieve a VO2 plateau during the incremental test in this study. This is consistent with other reports that have demonstrated a failure to achieve a VO2 plateau even when true VO2max is achieved in healthy men [24,29,30]. Day et al. [24] noted the absence of a VO2 plateau during an incremental test in 83% of 71 men. This was similar to results by Rossiter et al. [29] in a smaller sample, where five out of seven men demonstrated no plateau (i.e., 71.4%). Poole et al. [30] noted the absence of a VO2 plateau in three out of eight male subjects (i.e., 38.5%). Sidney and Shephard [31] reported that 79% of men and 75% of women, ages 60–83 years, who gave a good effort during the incremental test, achieved a VO2 plateau (defined as a ≤2mL·min−1·kg−1 increase in VO2 with an increase in WR). Based on the very limited sample of women in the present study, it is difficult to speculate if sex differences exist with respect to VO2 plateau achievement in prehypertensive adults. However, it should be noted that the original concept of the VO2 plateau was derived from multiple constant-load tests and a plateau was accepted when VO2 did not differ between two consecutive tests with differing WR [24]. Therefore, a VO2 plateau requirement in a ramp test does not mimic the original concept. In two of the four participants who did not achieve a VO2 plateau during the incremental test, true VO2max had been achieved, while in the other two, the verification test yielded a higher VO2max. The secondary criteria for VO2max, which include the achievement of >85% of age-predicted maximum heart rate and an RER of >1.15, were present in three out of four participants who did not achieve a VO2 plateau and in two out of three participants who achieved their VO2max during the verification test. Taken together, these results agree with findings from Poole et al. [30] and the subsequent recommendation of rejecting secondary criteria to validate VO2max from incremental exercise tests.
The selected WR during the verification test must be sustainable for a sufficient duration such that VO2 kinetics allow for the achievement of VO2max [18]. Wilkerson et al. [32] reported a decrease in test duration from 100% to 110% to 120% of VO2max but did not report significant differences in VO2 (% peak) between these exercise sessions. In the present study, all participants achieved a VO2 plateau 80 s into the verification test. However, for two participants, verification VO2 was at least 2% lower than incremental VO2, which suggests that oxygen delivery or utilization was likely limited prior to achievement of VO2max during the verification test in these participants.
Midgley et al. [28] reported that in four men who had a higher verification VO2 when compared with incremental VO2, all four had achieved a VO2 plateau during the incremental test. In the present study, of the three participants who had a higher verification VO2 when compared with incremental VO2, only one had achieved a VO2 plateau during the incremental test. It is apparent, from these limited findings, that the achievement of a VO2 plateau during the incremental test does not preclude a higher verification VO2. The three participants with a higher verification VO2 when compared with incremental VO2 in the present study exhibited a slightly longer verification test duration (142 ± 19 s) when compared with the eight participants without a higher verification VO2 (121 ± 19 s; p = 0.133; Mann–Whitney U test). A longer test duration could potentially explain the higher verification VO2. However, it is also possible that faster VO2 kinetics during the verification test as well as a priming effect from the previous incremental test [33] allowed for the attainment of VO2max during the verification test but not during the incremental test for these three participants.
The average VO2max in the current study of 88.8 ± 7.4% predicted is consistent with estimates of 89.7 ± 25.7% predicted from Jung et al. in 377 adults with prehypertension [34]. As noted in the introduction, quantifying VO2max relative to body weight can significantly underestimate cardiorespiratory fitness in overweight and obese individuals, in whom metabolically inactive fat mass is unable to utilize oxygen during exercise [13,35]. It may be prudent to adopt the approach of quantifying cardiorespiratory fitness as a percent of predicted based on ideal body weight to get an unbiased estimate of cardiorespiratory fitness [13,14,15]. Although the current project was not a large epidemiological study, it does provide an accurate assessment of cardiorespiratory fitness that is not confounded by body mass in prehypertensive normal-weight and overweight men and women. These results are important for future work in the area of cardiorespiratory fitness, underlying comorbidities, and disease risk prediction.
This study had a small sample size and an uneven sex distribution, which precluded the analysis of sex differences. Furthermore, comparisons by overweight status were also not possible due to limited sample size. Finally, the AHA removed the term “prehypertension” towards the end of 2017. The new AHA guidelines classify systolic BP between 120 and 129 mm Hg and diastolic BP below 80 mm Hg as “elevated” BP and systolic BP between 130 and 139 mm Hg or diastolic BP between 80 and 89 mm Hg as stage 1 hypertension [36]. Based on this new definition, nine participants in this study would be classified with “elevated” BP and two with stage 1 hypertension. Despite these limitations, this study has several strengths, which include the confirmation of VO2max using a verification test in adults with prehypertension, careful examination of individual test data for attainment of a VO2 plateau, and the quantification of VO2max based on ideal body weight in normal-weight and overweight prehypertensive men and women.
5. Conclusions
Our data confirms that verification testing is feasible, validates the attainment of VO2max, and can potentially reduce the over diagnosis of functional impairment (i.e., deconditioning) in adults with prehypertension. Clinicians and researchers who routinely evaluate cardiorespiratory fitness in adults with prehypertension could consider verification testing as well as the quantification of cardiorespiratory fitness as a percent of predicted based on ideal body weight to achieve an unbiased and accurate estimate of cardiorespiratory fitness. This approach could help identify prehypertensive adults with low cardiorespiratory fitness who would benefit from exercise interventions to increase cardiorespiratory fitness and to reduce the risk of developing hypertension and cardiovascular disease.
Author Contributions
Conceptualization, D.M.B.; methodology, D.M.B. and L.-C.C.; validation, D.M.B.; formal analysis, L.-C.C. and D.M.B.; investigation, D.M.B.; data curation, D.M.B.; writing—original draft preparation, D.M.B.; writing—review and editing, L.-C.C.; visualization, D.M.B.; project administration, D.M.B.; funding acquisition, D.M.B. All authors have read and agreed to the published version of the manuscript.
Funding
This research received no external funding. This research was supported by internal funding (i.e., a faculty research support grant from Valdosta State University).
Institutional Review Board Statement
The study was conducted according to the guidelines of the Declaration of Helsinki, and approved by the Institutional Review Board of Valdosta State University (Protocol number: IRB-03344-2016).
Informed Consent Statement
Informed consent was obtained from all subjects involved in the study.
Data Availability Statement
The data presented in this study are available on request from the corresponding author.
Acknowledgments
Undergraduate students Kristopher Dawson, Bradley Collins, and Aubrey Sweeney assisted with data collection and management.
Conflicts of Interest
The authors declare no conflict of interest. The funders had no role in the design of the study; in the collection, analyses, or interpretation of data; in the writing of the manuscript, or in the decision to publish the results.
References
- Nwankwo, T.; Yoon, S.S.; Burt, V.; Gu, Q. Hypertension among adults in the United States: National Health and Nutrition Examination Survey, 2011–2012. In NCHS Data Brief; US Department of Health and Human Services, Centers for Disease Control and Prevention, National Center for Health Statistics: Hyattsville, MD, USA, 2013; pp. 1–8. [Google Scholar]
- Vasan, R.S.; Massaro, J.M.; Wilson, P.W.; Seshadri, S.; Wolf, P.A.; Levy, D.; D’Agostino, R.B. Antecedent blood pressure and risk of cardiovascular disease: The framingham heart study. Circulation 2002, 105, 48–53. [Google Scholar] [CrossRef] [PubMed]
- Greenland, P.; Knoll, M.D.; Stamler, J.; Neaton, J.D.; Dyer, A.R.; Garside, D.B.; Wilson, P.W. Major risk factors as antecedents of fatal and nonfatal coronary heart disease events. J. Am. Med. Assoc. 2003, 290, 891–897. [Google Scholar] [CrossRef] [PubMed] [Green Version]
- Faselis, C.; Doumas, M.; Kokkinos, J.P.; Panagiotakos, D.; Kheirbek, R.; Sheriff, H.M.; Hare, K.; Papademetriou, V.; Fletcher, R.; Kokkinos, P. Exercise capacity and progression from prehypertension to hypertension. Hypertension 2012, 60, 333–338. [Google Scholar] [CrossRef] [PubMed] [Green Version]
- Kim, D.; Park, W. The inverse relationship between cardiorespiratory fitness and intima-media thickness with prehypertensive middle-aged women. Tohoku J. Exp. Med. 2017, 243, 283–288. [Google Scholar] [CrossRef] [Green Version]
- Kokkinos, P.; Pittaras, A.; Manolis, A.; Panagiotakos, D.; Narayan, P.; Manjoros, D.; Amdur, R.L.; Singh, S. Exercise capacity and 24-h blood pressure in prehypertensive men and women. Am. J. Hypertens. 2006, 19, 251–258. [Google Scholar] [CrossRef] [Green Version]
- Kokkinos, P.; Pittaras, A.; Narayan, P.; Faselis, C.; Singh, S.; Manolis, A. Exercise capacity and blood pressure associations with left ventricular mass in prehypertensive individuals. Hypertension 2007, 49, 55–61. [Google Scholar] [CrossRef] [Green Version]
- Kokkinos, P.; Myers, J.; Doumas, M.; Faselis, C.; Manolis, A.; Pittaras, A.; Kokkinos, J.P.; Singh, S.; Fletcher, R.D. Exercise capacity and all-cause mortality in prehypertensive men. Am. J. Hypertens. 2009, 22, 735–741. [Google Scholar] [CrossRef] [Green Version]
- Wagner, E.N.; Hong, S.; Wilson, K.L.; Calfas, K.J.; Rock, C.L.; Redwine, L.S.; von Känel, R.; Mills, P.J. Effects of caloric intake and aerobic activity in individuals with prehypertension and hypertension on levels of inflammatory, adhesion and prothrombotic biomarkers-secondary analysis of a randomized controlled trial. J. Clin. Med. 2020, 9, 655. [Google Scholar] [CrossRef] [Green Version]
- Tadic, M.; Cuspidi, C.; Backovic, S.; Kleut, M.; Ivanovic, B.; Scepanovic, R.; Iracek, O.; Celic, V. High-normal blood pressure, functional capacity and left heart mechanics: Is there any connection? Blood Press. 2014, 23, 315–321. [Google Scholar] [CrossRef]
- Phillips, D.; Stickland, M.; Lesser, I.; Petersen, S. The effects of heavy load carriage on physiological responses to graded exercise. Eur. J. Appl. Physiol. 2016, 116, 275–280. [Google Scholar] [CrossRef]
- Garrison, R.J.; Kannel, W.B.; Stokes, J., III; Castelli, W.P. Incidence and precursors of hypertension in young adults: The framingham offspring study. Prev. Med. 1987, 16, 235–251. [Google Scholar] [CrossRef]
- Lorenzo, S.; Babb, T.G. Quantification of cardiorespiratory fitness in healthy nonobese and obese men and women. Chest 2012, 141, 1031–1039. [Google Scholar] [CrossRef] [PubMed] [Green Version]
- American Thoracic Society; American College of Chest Physicians. ATS/ACCP statement on cardiopulmonary exercise testing. Am. J. Respir. Crit. Care Med. 2003, 167, 211–277. [Google Scholar] [CrossRef] [PubMed]
- Guazzi, M.; Arena, R.; Halle, M.; Piepoli, M.F.; Myers, J.; Lavie, C.J. 2016 focused update: Clinical recommendations for cardiopulmonary exercise testing data assessment in specific patient populations. Circulation 2016, 133, e694–e711. [Google Scholar] [CrossRef] [PubMed] [Green Version]
- Wasserman, K.; Hansen, J.E.; Sue, D.Y.; Stringer, W.W.; Whipp, B.J. Principles of Exercise Testing and Interpretation: Including Pathophysiology and Clinical Applications, 5th ed.; Lippincott Williams and Wilkins: Philadelphia, PA, USA, 2005; pp. 160–182. [Google Scholar]
- Hill, A.; Lupton, H. Muscular exercise, lactic acid, and the supply and utilization of oxygen. Q. J. Med. 1923, 62, 135–171. [Google Scholar] [CrossRef]
- Poole, D.C.; Jones, A.M. Measurement of the maximum oxygen uptake VO2max: VO2peak is no longer acceptable. J. Appl. Physiol. 2017, 122, 997–1002. [Google Scholar] [CrossRef]
- Kirkeberg, J.M.; Dalleck, L.C.; Kamphoff, C.S.; Pettitt, R.W. Validity of 3 protocols for verifying VO2max. Int. J. Sports Med. 2011, 32, 266–270. [Google Scholar] [CrossRef]
- Sawyer, B.J.; Tucker, W.J.; Bhammar, D.M.; Gaesser, G.A. Using a verification test for determination of VO2max in sedentary adults with obesity. J. Strength Cond. Res. 2015, 29, 3432–3438. [Google Scholar] [CrossRef]
- Riebe, D.; Franklin, B.A.; Thompson, P.D.; Garber, C.E.; Whitfield, G.P.; Magal, M.; Pescatello, L.S. Updating ACSM’s recommendations for exercise preparticipation health screening. Med. Sci. Sports Exerc. 2015, 47, 2473–2479. [Google Scholar] [CrossRef] [Green Version]
- Chobanian, A.V.; Bakris, G.L.; Black, H.R.; Cushman, W.C.; Green, L.A.; Izzo, J.L.; Jones, D.W.; Materson, B.J.; Oparil, S.; Wright, J.T.; et al. The Seventh Report of the Joint National Committee on Prevention, Detection, Evaluation, and Treatment of High Blood Pressure—The JNC 7 Report. J. Am. Med. Assoc. 2003, 289, 2560–2572. [Google Scholar] [CrossRef]
- Borg, G.A. Psychophysical bases of perceived exertion. Med. Sci. Sports Exerc. 1982, 14, 377–381. [Google Scholar] [CrossRef] [PubMed]
- Day, J.R.; Rossiter, H.B.; Coats, E.M.; Skasick, A.; Whipp, B.J. The maximally attainable VO2 during exercise in humans: The peak vs. maximum issue. J. Appl. Physiol. 2003, 95, 1901–1907. [Google Scholar] [CrossRef] [PubMed] [Green Version]
- Bhammar, D.M.; Stickford, J.L.; Bernhardt, V.; Babb, T.G. Verification of maximal oxygen uptake in obese and nonobese children. Med. Sci. Sports Exerc. 2017, 49, 702–710. [Google Scholar] [CrossRef] [PubMed] [Green Version]
- Green, S.; Askew, C. VO2peak is an acceptable estimate of cardiorespiratory fitness but not VO2max. J. Appl. Physiol. 2018, 125, 229–232. [Google Scholar] [CrossRef] [Green Version]
- Crouter, S.E.; Antczak, A.; Hudak, J.R.; DellaValle, D.M.; Haas, J.D. Accuracy and reliability of the ParvoMedics TrueOne 2400 and MedGraphics VO2000 metabolic systems. Eur. J. Appl. Physiol. 2006, 98, 139–151. [Google Scholar] [CrossRef]
- Midgley, A.W.; McNaughton, L.R.; Carroll, S. Verification phase as a useful tool in the determination of the maximal oxygen uptake of distance runners. Appl. Physiol. Nutr. Metab. 2006, 31, 541–548. [Google Scholar] [CrossRef]
- Rossiter, H.; Kowalchuk, J.; Whipp, B. A test to establish maximum O2 uptake despite no plateau in the O2 uptake response to ramp incremental exercise. J. Appl. Physiol. 2006, 100, 764–770. [Google Scholar] [CrossRef]
- Poole, D.C.; Wilkerson, D.P.; Jones, A.M. Validity of criteria for establishing maximal O2 uptake during ramp exercise tests. Eur. J. Appl. Physiol. 2008, 102, 403–410. [Google Scholar] [CrossRef]
- Sidney, K.H.; Shephard, R.J. Maximum and submaximum exercise tests in men and women in the seventh, eighth, and ninth decades of life. J. Appl. Physiol. Respir. Environ. Exerc. Physiol. 1977, 43, 280–287. [Google Scholar] [CrossRef]
- Wilkerson, D.P.; Koppo, K.; Barstow, T.J.; Jones, A.M. Effect of work rate on the functional ‘gain’of Phase II pulmonary O2 uptake response to exercise. Respir. Physiol. Neurobiol. 2004, 142, 211–223. [Google Scholar] [CrossRef]
- Jones, A.M.; Wilkerson, D.P.; Burnley, M.; Koppo, K. Prior heavy exercise enhances performance during subsequent perimaximal exercise. Med. Sci. Sports Exerc. 2003, 35, 2085–2092. [Google Scholar] [CrossRef] [PubMed]
- Jung, M.-H.; Ihm, S.-H.; Lee, D.-H.; Chung, W.-B.; Jung, H.O.; Youn, H.-J. Prehypertension is associated with early complications of atherosclerosis but not with exercise capacity. Int. J. Cardiol. 2017, 227, 387–392. [Google Scholar] [CrossRef] [PubMed]
- Buskirk, E.R.; Taylor, H.L. Maximal oxygen intake and its relation to body composition, with special reference to chronic physical activity and obesity. J. Appl. Physiol. 1957, 11, 72–78. [Google Scholar] [CrossRef]
- Whelton, P.K.; Carey, R.M.; Aronow, W.S.; Casey, D.E.; Collins, K.J.; Himmelfarb, C.D.; DePalma, S.M.; Gidding, S.; Jamerson, K.A.; Jones, D.W. 2017 ACC/AHA/AAPA/ABC/ACPM/AGS/APhA/ASH/ASPC/NMA/PCNA guideline for the prevention, detection, evaluation, and management of high blood pressure in adults: A report of the American College of Cardiology/American Heart Association Task Force on Clinical Practice Guidelines. J. Am. Coll. Cardiol. 2018, 71, e127–e248. [Google Scholar] [PubMed]
Figure 1.
Relationship between total body mass and (a) absolute maximal oxygen uptake (VO2max), (b) relative VO2max, and (c) VO2max quantified as % predicted for all study participants. Relationship between total body mass and (d) absolute VO2max, (e) relative VO2max, and (f) VO2max quantified as % predicted for women and men. τb: Kendall’s tau-b.


Table 1.
Participant characteristics reported as mean ± SD.
| Variable | All (N = 11) | Men (N = 7) | Women (N = 4) | p |
|---|---|---|---|---|
| Age (year) | 22.5 ± 2.9 | 21.7 ± 2.4 | 23.8 ± 3.4 | 0.447 |
| Height (cm) | 170.4 ± 8.3 | 174.4 ± 5.5 | 163.4 ± 8.1 | 0.047 |
| Weight (kg) | 71.7 ± 12.6 | 77.0 ± 12.7 | 62.5 ± 5.5 | 0.059 |
| BMI (kg·m2) | 24.6 ± 3.2 | 25.2 ± 3.2 | 23.6 ± 3.5 | 0.450 |
| Normal weight/Overweight | 6/5 | 3/4 | 3/1 | 0.545 |
| Resting HR (beats/min) | 75 ± 7 | 73 ± 6 | 79 ± 8 | 0.155 |
| Resting systolic BP (mm Hg) | 125 ± 4 | 126 ± 3 | 124 ± 5 | 0.250 |
| Resting diastolic BP (mm Hg) | 75 ± 5 | 73 ± 3 | 79 ± 5 | 0.037 |
| Maximum work rate (Watt) | 206 ± 42 | 232 ± 24 | 160 ± 16 | 0.007 |
BMI: body mass index; HR: heart rate; BP: blood pressure.
Table 2.
Individual data from the incremental (Incr) and verification (Ver) tests.
| Sex | BMI (kg·m−2) | Incr VO2 (L·min−1) | Ver VO2 (L·min−1) | Ver VO2 > Incr VO2 | Incr VO2 Plateau | Incr HR (% Pred) | Incr RER | Ver Duration (s) | VO2max (% Pred) |
|---|---|---|---|---|---|---|---|---|---|
| F | 20.6 | 1.74 | 1.73 | No | No | 98 | 1.39 | 96 | 94.53 |
| F | 21.9 | 1.67 | 1.74 | No | No | 93 | 1.42 | 103 | 88.49 |
| F | 23.3 | 1.43 | 1.64 | Yes | No | 97 | 1.44 | 122 | 89.69 * |
| F | 28.5 | 1.54 | 1.54 | No | Yes | 84 | 1.47 | 121 | 84.17 |
| M | 20.7 | 2.22 | 2.12 | No | Yes | 89 | 1.33 | 139 | 76.62 |
| M | 22.3 | 2.67 | 2.82 | Yes | Yes | 91 | 1.28 | 107 | 97.77 |
| M | 22.8 | 2.77 | 2.79 | No | Yes | 95 | 1.37 | 115 | 98.26 |
| M | 26.8 | 2.46 | 2.51 | No | Yes | 91 | 1.54 | 150 | 87.07 |
| M | 27.2 | 2.64 | 2.57 | No | Yes | 89 | 1.39 | 145 | 85.62 |
| M | 27.6 | 2.95 | 2.93 | No | Yes | 96 | 1.42 | 157 | 96.24 |
| M | 29.1 | 2.46 | 2.71 | Yes | No | 79 | 1.15 | 137 | 78.56 |
F: female; M: male; BMI: body mass index; VO2: oxygen uptake; HR: heart rate; pred: predicted; RER: respiratory exchange ratio; max: maximum; * this participant would have been incorrectly classified as below normal for cardiorespiratory fitness if the verification test had not been completed.
Table 3.
Measurements from the incremental and verification tests reported as mean ± SD (N = 11).
| Variable | Incremental Test | Verification Test | p |
|---|---|---|---|
| VO2 (L·min−1) | 2.23 ± 0.54 | 2.28 ± 0.54 | 0.213 |
| VO2 (mL·min−1·kg−1) | 31.56 ± 6.65 | 32.22 ± 6.26 | 0.213 |
| VO2 (% predicted) | 86.06 ± 8.52 | 88.13 ± 8.04 | 0.248 |
| VCO2 (L·min−1) | 3.07 ± 0.94 | 2.81 ± 0.77 | 0.091 |
| RER | 1.38 ± 0.10 | 1.21 ± 0.13 | 0.010 |
| VE (L·min−1) | 87.47 ± 22.16 | 84.04 ± 23.20 | 0.374 |
| HR (beats·min−1) | 180 ± 11 | 180 ± 7 | 0.646 |
| HR (% predicted) | 91.04 ± 5.92 | 91.05 ± 3.24 | 0.646 |
| VT (L) | 2.32 ± 0.63 | 2.33 ± 0.71 | 0.534 |
| fB (breaths·min−1) | 38 ± 7 | 37 ± 9 | 0.477 |
| RPE * | 17.2 ± 1.3 | 17.0 ± 1.5 | 0.414 |
| RPB * | 5.5 ± 1.8 | 5.3 ± 2.1 | 0.705 |
VO2: oxygen uptake; VCO2: carbon dioxide production; RER: respiratory exchange ratio; VE: ventilation; HR: heart rate; VT: tidal volume; fB: breathing frequency; RPE: ratings of perceived exertion; RPB: ratings of perceived breathlessness; * N = 7 because RPB and RPE were not collected during the verification test for four participants.
Publisher’s Note: MDPI stays neutral with regard to jurisdictional claims in published maps and institutional affiliations. |
© 2021 by the authors. Licensee MDPI, Basel, Switzerland. This article is an open access article distributed under the terms and conditions of the Creative Commons Attribution (CC BY) license (http://creativecommons.org/licenses/by/4.0/).
Share and Cite
MDPI and ACS Style
Bhammar, D.M.; Chien, L.-C. Quantification and Verification of Cardiorespiratory Fitness in Adults with Prehypertension. Sports 2021, 9, 9. https://0-doi-org.brum.beds.ac.uk/10.3390/sports9010009
AMA Style
Bhammar DM, Chien L-C. Quantification and Verification of Cardiorespiratory Fitness in Adults with Prehypertension. Sports. 2021; 9(1):9. https://0-doi-org.brum.beds.ac.uk/10.3390/sports9010009
Chicago/Turabian StyleBhammar, Dharini M., and Lung-Chang Chien. 2021. "Quantification and Verification of Cardiorespiratory Fitness in Adults with Prehypertension" Sports 9, no. 1: 9. https://0-doi-org.brum.beds.ac.uk/10.3390/sports9010009
Note that from the first issue of 2016, this journal uses article numbers instead of page numbers. See further details here.