Article

Gender Differences in Zinc and Copper Excretion in Response to Co-Exposure to Low Environmental Concentrations of Cadmium and Lead

1
National Research Centre for Environmental Toxicology, The University of Queensland, Coopers Plains, Brisbane 4108, Australia
2
Kidney Disease Research Collaborative, Centre for Health Service Research, The University of Queensland Translational Research Institute, Woolloongabba, Brisbane 4102, Australia
3
School of Biomedical Sciences, The University of Queensland, Brisbane 4072, Australia
4
NHMRC Centre of Research Excellence for CKD.QLD, UQ Health Sciences, Royal Brisbane and Women’s Hospital, Brisbane 4029, Australia
5
Department of Laboratory Medicine, Chulalongkorn University Faculty of Medicine, Bangkok 10330, Thailand
6
Department of Nephrology, Princess Alexandra Hospital, Brisbane 4075, Australia
*
Author to whom correspondence should be addressed.
Submission received: 24 November 2020 / Revised: 15 December 2020 / Accepted: 22 December 2020 / Published: 30 December 2020
(This article belongs to the Special Issue Responses and Defense Mechanisms against Toxic Metals)

Abstract

:
Disruption of the homeostasis of zinc (Zn) and copper (Cu) has been associated with nephrotoxicity of cadmium (Cd). Herein, we report the results of a cross sectional analysis of urinary excretion of Zn, Cu, Cd and lead (Pb) in 392 Thais (mean age 33.6) living in an area of low-level environmental exposure to Cd and Pb, reflected by the respective median Cd and Pb excretion rates of 0.44 and 1.75 μg/g creatinine. Evidence for dysregulation of Zn and Cu homeostasis has emerged together with gender differentiated responses. In men, excretion rates for Zn and Cu were increased concomitantly, and their urinary Zn-to-Cu ratios were maintained. In women, only Cu excretion rose, causing a reduction in urinary Zn-to-Cu ratios. Only in women, urinary Zn-to-Cu ratios were associated with worse kidney function, assessed by estimated glomerular filtration rate (eGFR) (β = −7.76, p = 0.015). Only in men, a positive association was seen between eGFR and body iron stores, reflected by serum ferritin (β = 5.32, p = 0.030). Thus, co-exposure to Cd and Pb may disrupt the homeostasis of Zn and Cu more severely in women than men, while urinary Zn-to-Cu ratios and body iron stores can serve as predictors of an adverse effect of co-exposure to Cd and Pb.

1. Introduction

Environmental exposure to cadmium (Cd) and lead (Pb) is widespread as these toxic metals are present in virtually all foodstuffs and they are released into the atmosphere by volcanic emissions and combustion of fossil fuel and biomass [1]. For the general population, staple foods rice, potatoes, wheat and other cereal grains are the most significant dietary sources, and numerous epidemiological studies argue that there are no tolerable intake levels of Cd [1]. Total diet studies reported that Cd and Pb intake rates, among average consumers in the U.S., were 4.63 and 1.7–5.3 μg/day, respectively [2,3]. A dose-response relationship between ingested amounts of Cd and risk of chronic kidney disease (CKD) has been observed in a Chinese population study in which Cd intake levels of 23.2, 29.6 and 36.9 μg/day were associated with 1.73-, 2.93- and 4.05-fold increments of CKD risk, compared with a Cd intake level of 16.7 μg/day [4]. Of concern, the Cd intake level associated with 73% increase in risk of CKD among Chinese subjects is 40% of an established tolerable intake level for Cd [5]. This finding argues that nephrotoxicity of Cd may occur at Cd intake levels much lower than previously estimated and the risk of nephrotoxicity of Cd has largely been underestimated. Supporting these arguments are cross sectional studies that observed an association between enhanced CKD risk and low environmental exposure to Cd in Spain [6], Korea [7] and the U.S. [8,9,10,11].
It has long been recognized that co-exposure to Cd and Pb is a common scenario seen in many countries, including the U.S. [12,13,14,15], Canada [16], Taiwan [17] and Korea [18]. Half of the participants, aged ≥6 years in the U.S. National Health and Nutrition Examination Surveys (NHANES) 2007–2012 were found to have blood or urinary levels of Cd and Pb above population median levels [12]. Notably, however, a few studies have investigated nephrotoxicity of Cd under co-exposure conditions. In one study, the risk of CKD was found to be increased further in those who had blood Cd and blood Pb in the highest quartiles, compared with those in the lowest quartiles [8]. A Korean study suggested that co-exposure of Cd with Pb may permit nephrotoxicity when exposure levels of Cd were insufficient to cause toxicity [19]. In a Belgian study, Cd-induced injury to kidney tubular epithelial cells, evident from excretion of N-acetyl-β-d-glucosaminidase, became apparent in only those who had blood Pb above the 75th percentile level [20].
The present study investigated potential kidney effects of concurrent exposure to Cd and Pb, focusing on zinc (Zn) and copper (Cu) homeostasis, given the known contribution of kidneys to the homeostasis of various metals [21,22]. Based on our previous works [23,24], we postulate that Cd exposure causes a dysregulation of the homeostasis of metals in kidney tubular epithelial cells through induction of a stress-response mechanism involving metallothionein (MT) and heme oxygenase-1 (HO-1). Few studies have investigated urine Cd excretion in relation to Zn and Cu in human subjects. In early works, increased Cu excretion was noted in Japanese subjects with high Cd exposure [25,26,27]. A similar effect has later been observed in Australians, Thais and Koreans whose environmental exposure to Cd was markedly lower than those in Japanese studies [28,29,30]. However, the clinical relevance of the Cd-induced metal dysregulation remains unclear. Therefore, we evaluated associations of co-exposure to Cd and Pb with urinary excretion of Zn, Cu, urinary Zn-to-Cu ratios and estimated glomerular filtration rate (eGFR), a clinical kidney function measure.

2. Materials and Methods

2.1. Study Subjects

A cross-sectional analysis was conducted using data from 197 women and 195 men who lived in Bangkok. All study subjects were apparently healthy and had no history of occupational exposure to metals. The health status of participants was confirmed by a physical examination and urinary and blood chemistry parameters. Other exclusion criteria were pregnancy, breast-feeding and a hospital record or physician’s diagnosis of advanced chronic disease. Smoking, diabetes, hypertension, regular use of medication, educational level, occupation, family health history and anthropometric data were obtained from questionnaires. Diabetes was defined as fasting plasma glucose levels ≥126 mg/dL or physician’s prescription of anti-diabetic medication. Hypertension was defined as systolic blood pressure ≥140 mmHg, or diastolic blood pressure ≥90 mmHg, physician diagnosis or prescription of anti-hypertensive medications.

2.2. Specimen Collection, Blood Chemistry Profiles and eGFR Calculation

Blood samples were collected within 1 h after drinking 300 mL of water following an overnight fast. Urine samples were collected within 3 h of blood sampling. Urine and blood samples were transported on ice to the Department of Laboratory Medicine, Chulalongkorn University Hospital, where plasma samples were prepared for routine chemistry by using an automated system. The assay for plasma and urinary creatinine concentrations was based on the Jaffe reaction, while the plasma ferritin assay was based on an electrochemiluminescence immunoassay (Boehringer Mannheim Elecsys 1010, Roche Diagnostics GmbH, Mannheim, Germany). The eGFR was calculated by using the CKD-EPI equations [31]. The male eGFR = 141 × [serum creatinine/0.9]Y × 0.993age, where Y = −0.411 if serum creatinine ≤0.9 mg/dL, Y = −1.209 if serum creatinine >0.9 mg/dL. The female eGFR = 144 × [serum creatinine/0.7]Y × 0.993age, where Y = −0.329 if serum creatinine ≤0.7 mg/dL, Y = −1.209 if serum creatinine >0.7 mg/dL. The CKD-EPI equation is the best estimation of GFR when the GFR of the subjects are in the normal range, as in this study. It was developed to address the shortcoming of the Modification of Diet in Renal Disease (MDRD) study that systematically underestimated normal values of GFR [31].

2.3. Analysis of Urinary Metal Concentrations

Aliquots of urine, with 5 mL per aliquot, were shipped on dry ice and kept frozen throughout the shipment period to the National Research Centre for Environmental Toxicology, Australia, where they were stored at −80 °C for later analysis. Urinary concentrations of Zn, Cu, Cd and Pb were determined with inductively-coupled plasma/mass spectrometry (ICP/MS, Agilent 7500, Agilent Technologies, Santa Clara, CA, USA), which had been calibrated with multi-element standards (EM Science, EM Industries, Inc., Paterson, NJ, USA). Quality assurance and control were conducted with simultaneous analyses of samples of the reference urine Lyphochek® (Bio-Rad, Gladesville, New South Wales, Australia), which contained low- and high-range Cd and Pb levels. A coefficient of variation value of 2.5% was obtained for Cd and Pb in the reference urine. The low limit of detection (LOD) was 0.05 µg/L for urinary Cd and 0.03 µg/L for urinary Pb. The urine samples containing Cd and Pb levels below the LOD were assigned as the LOD divided by the square root of two. Fifty-eight subjects (14.8%) had urinary Cd levels below the LOD, while 26 subjects (6.6%) had urinary Pb levels below the LOD.

2.4. Statistical Analysis

Data were analyzed with SPSS 17.0 (SPSS Inc., Chicago, IL, USA, 2008). The Pearson chi-squared test was used to compare the percentages of women, men, smoking status and low body iron store status across three exposure profiles: low, moderate and high exposure to Cd and Pb. The Kruskal–Wallis test was used to determine mean differences across exposure profiles. The one-sample Kolmogorov–Smirnov test was used to examine departure from a normal distribution of continuous variables, and a base-10 logarithmic transformation was applied to the variables that showed rightward skewing. Logistic regression analysis was used to derive the prevalence odds ratio (POR) for three outcomes, namely high urinary Zn and Cu concentrations, and low urinary Zn-to-Cu ratios across exposure profiles. Association of each exposure outcome with exposure levels and independent variables were evaluated with a generalized linear model (GLM) analysis. The independent variables incorporated in the GLM analysis were age, serum ferritin, blood urea nitrogen (BUN), gender and smoking. To correct for the variation in urine dilution, urinary creatinine concentration ([cr]u) was incorporated as an independent variable in all regression model analyses [32]. The means for urinary concentrations of Zn, Cu and urinary Zn-to-Cu ratios were determined with the univariate analysis of variance adjusted for covariates and potential confounders. The p-values ≤0.05 for two-sided tests were assumed to indicate statistical significance.

3. Results

3.1. Exposure Profiles and Demographic Data

To create Cd and Pb co-exposure profiles, the respective medians for creatinine adjusted urine Pb (EPb/Ecr) and Cd (ECd/Ecr) of 1.75 and 0.44 μg/g creatinine were used (Table 1). Low exposure was defined as EPb/Ecr and ECd/Ecr ≤ its respective median, while high exposure was defined as EPb/Ecr and ECd/Ecr ≥ its respective median. Moderate exposure was defined as only EPb/Ecr or ECd/Ecr ≥ its respective median. Of 392 study subjects (195 men, 197 women), 114 (29.1%), 167 (42.6%) and 111 (28.3%) were found to have low exposure to both Pb and Cd, high exposure to Pb or Cd, and high exposure to Pb and Cd, respectively. For simplicity, these profiles were described as low, moderate and high exposure to Pb and Cd, respectively.
The percentage of smokers across three exposure profiles was similar (p = 0.328) as were the means for BMI (p = 0.647) and eGFR (p = 0.909). The low exposure group was the youngest (mean age 29.9), while the moderate- and the high-exposure groups were 3.9 and 4.8 years older (mean age 33.8 and 34.7) (p < 0.001). In the low exposure profile, men were overrepresented (74.6%), whereas women were overrepresented in the high exposure profile (67.6%) (p < 0.001). The low exposure group had the highest mean serum ferritin of 108 μg/L, while the high exposure group had the lowest mean serum ferritin of 77 μg/L. The means for serum ferritin were different across three exposure profiles (p = 0.020).
The three groups had similar means for urinary Cu concentrations ([Cu]u) (p = 0.183) as did the means for urinary Zn concentrations ([Zn]u) (p = 0.121). However, the three groups had different means for urinary Zn-to-Cu molar ratios ([Zn]u/[Cu]u) (p < 0.001). The low exposure group had the highest mean [Zn]u/[Cu]u ratio of 31.6, whereas the high exposure group had the lowest mean [Zn]u/[Cu]u ratio of 22.3. The means for EPb and ECd differed across three exposure groups. There were also differences in the means for the following parameters: BUN (p = 0.021), serum creatinine (p <0.001), urinary concentration of creatinine ([cr]u) (p = 0.004).

3.2. Logistic Regression Analysis of Exposure Outcomes

To link Pb and Cd co-exposure profiles to measured outcomes that included high [Zn]u, high [Cu]u, and low [Zn]u/[Cu]u ratios, a multivariable logistic regression analysis was used (Table 2). The high [Zn]u was defined as the 90th percentile level or above as was the high [Cu]u. The low [Zn]u/[Cu]u ratio was defined as the 25th percentile level or below. The 90th percentile levels for [Zn]u and [Cu]u were respectively 9 and 0.28 µM, while the 20th percentile level for[Zn]u/[Cu]u ratio was 20.
For each outcome examined, age, serum ferritin and BUN, [cr]u were continuous independent variables, while gender, smoking and exposure were categorical independent variables. The prevalence odds ratio (POR) for high [Zn]u was associated with [cr]u (p < 0.001) and the high- exposure profile (POR 3.92, 95% CI: 1.09, 14.1, p = 0.036). The POR for high [Cu]u was associated with [cr]u (p < 0.001), the moderate-exposure profile (3.47, 95% CI: 1.22, 9.84, p = 0.020), and the high-exposure profile (POR 8.61, 95% CI: 2.31, 32.2, p = 0.001). Distinctively, the POR for low [Zn]u/[Cu]u ratios was not associated with [cr]u but showing associations with female gender (p < 0.001), smoking (p = 0.013), the moderate-exposure profile (POR 1.90, 95% CI:1.07, 3.35, p = 0.028), and the high-exposure profile (POR 2.59, 95% CI: 1.17, 5.75, p = 0.019).

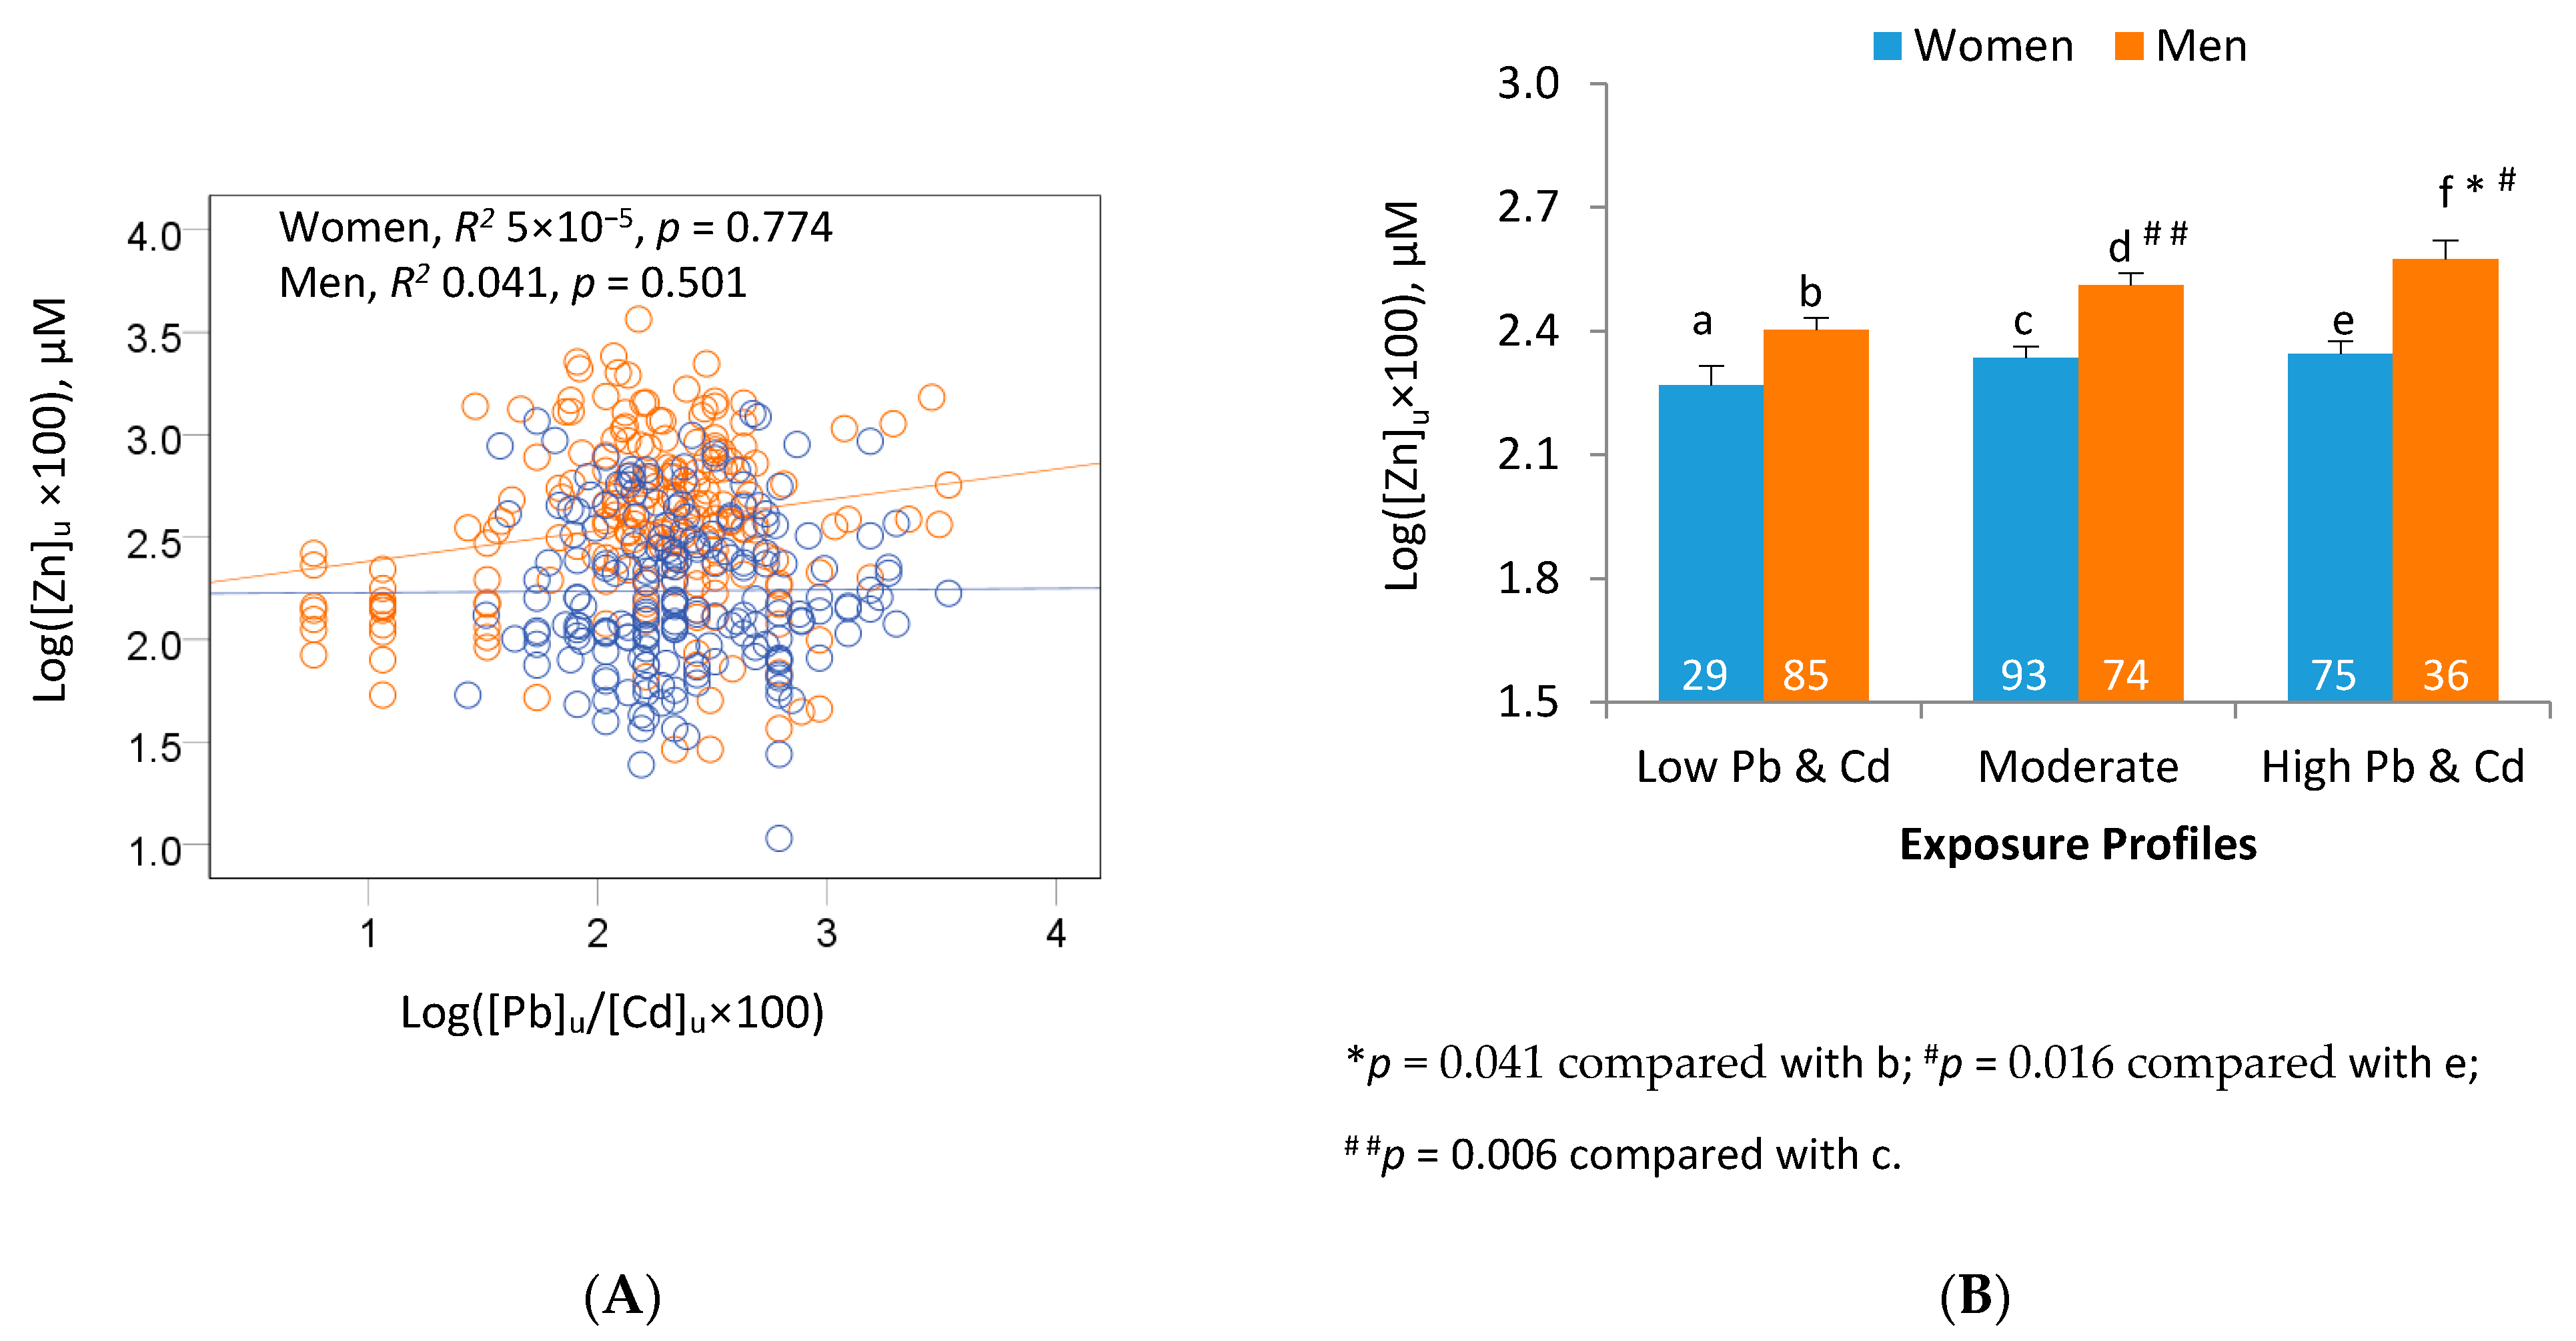
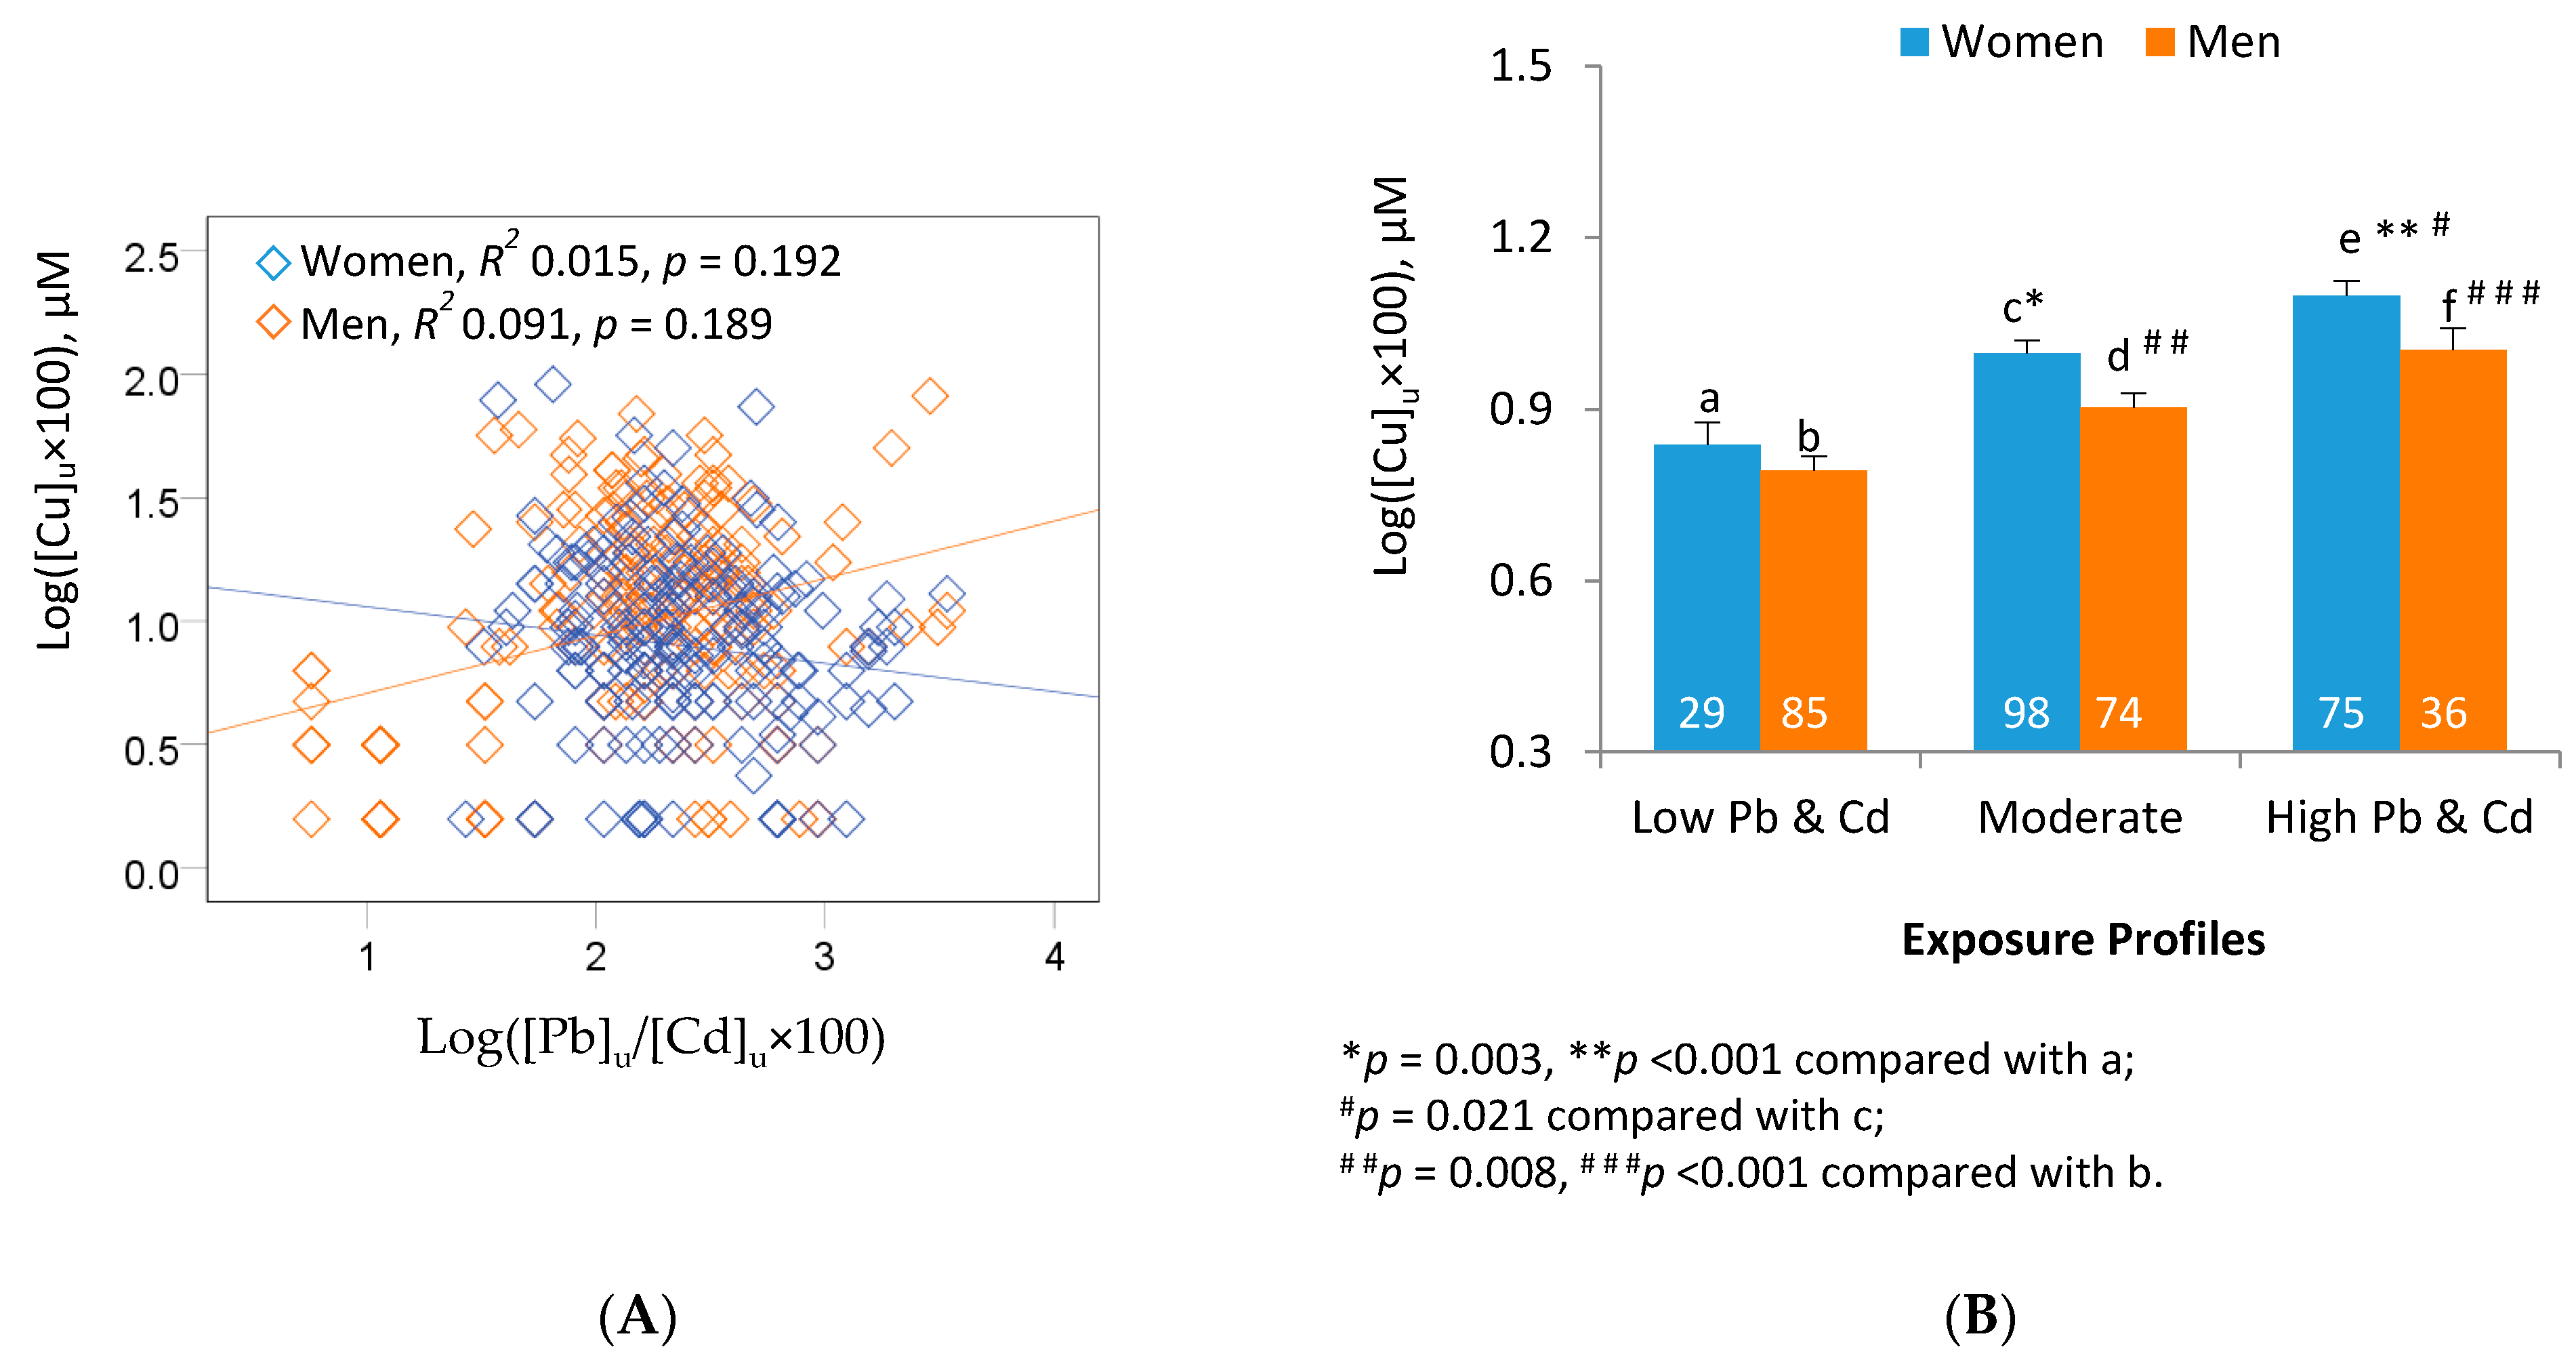
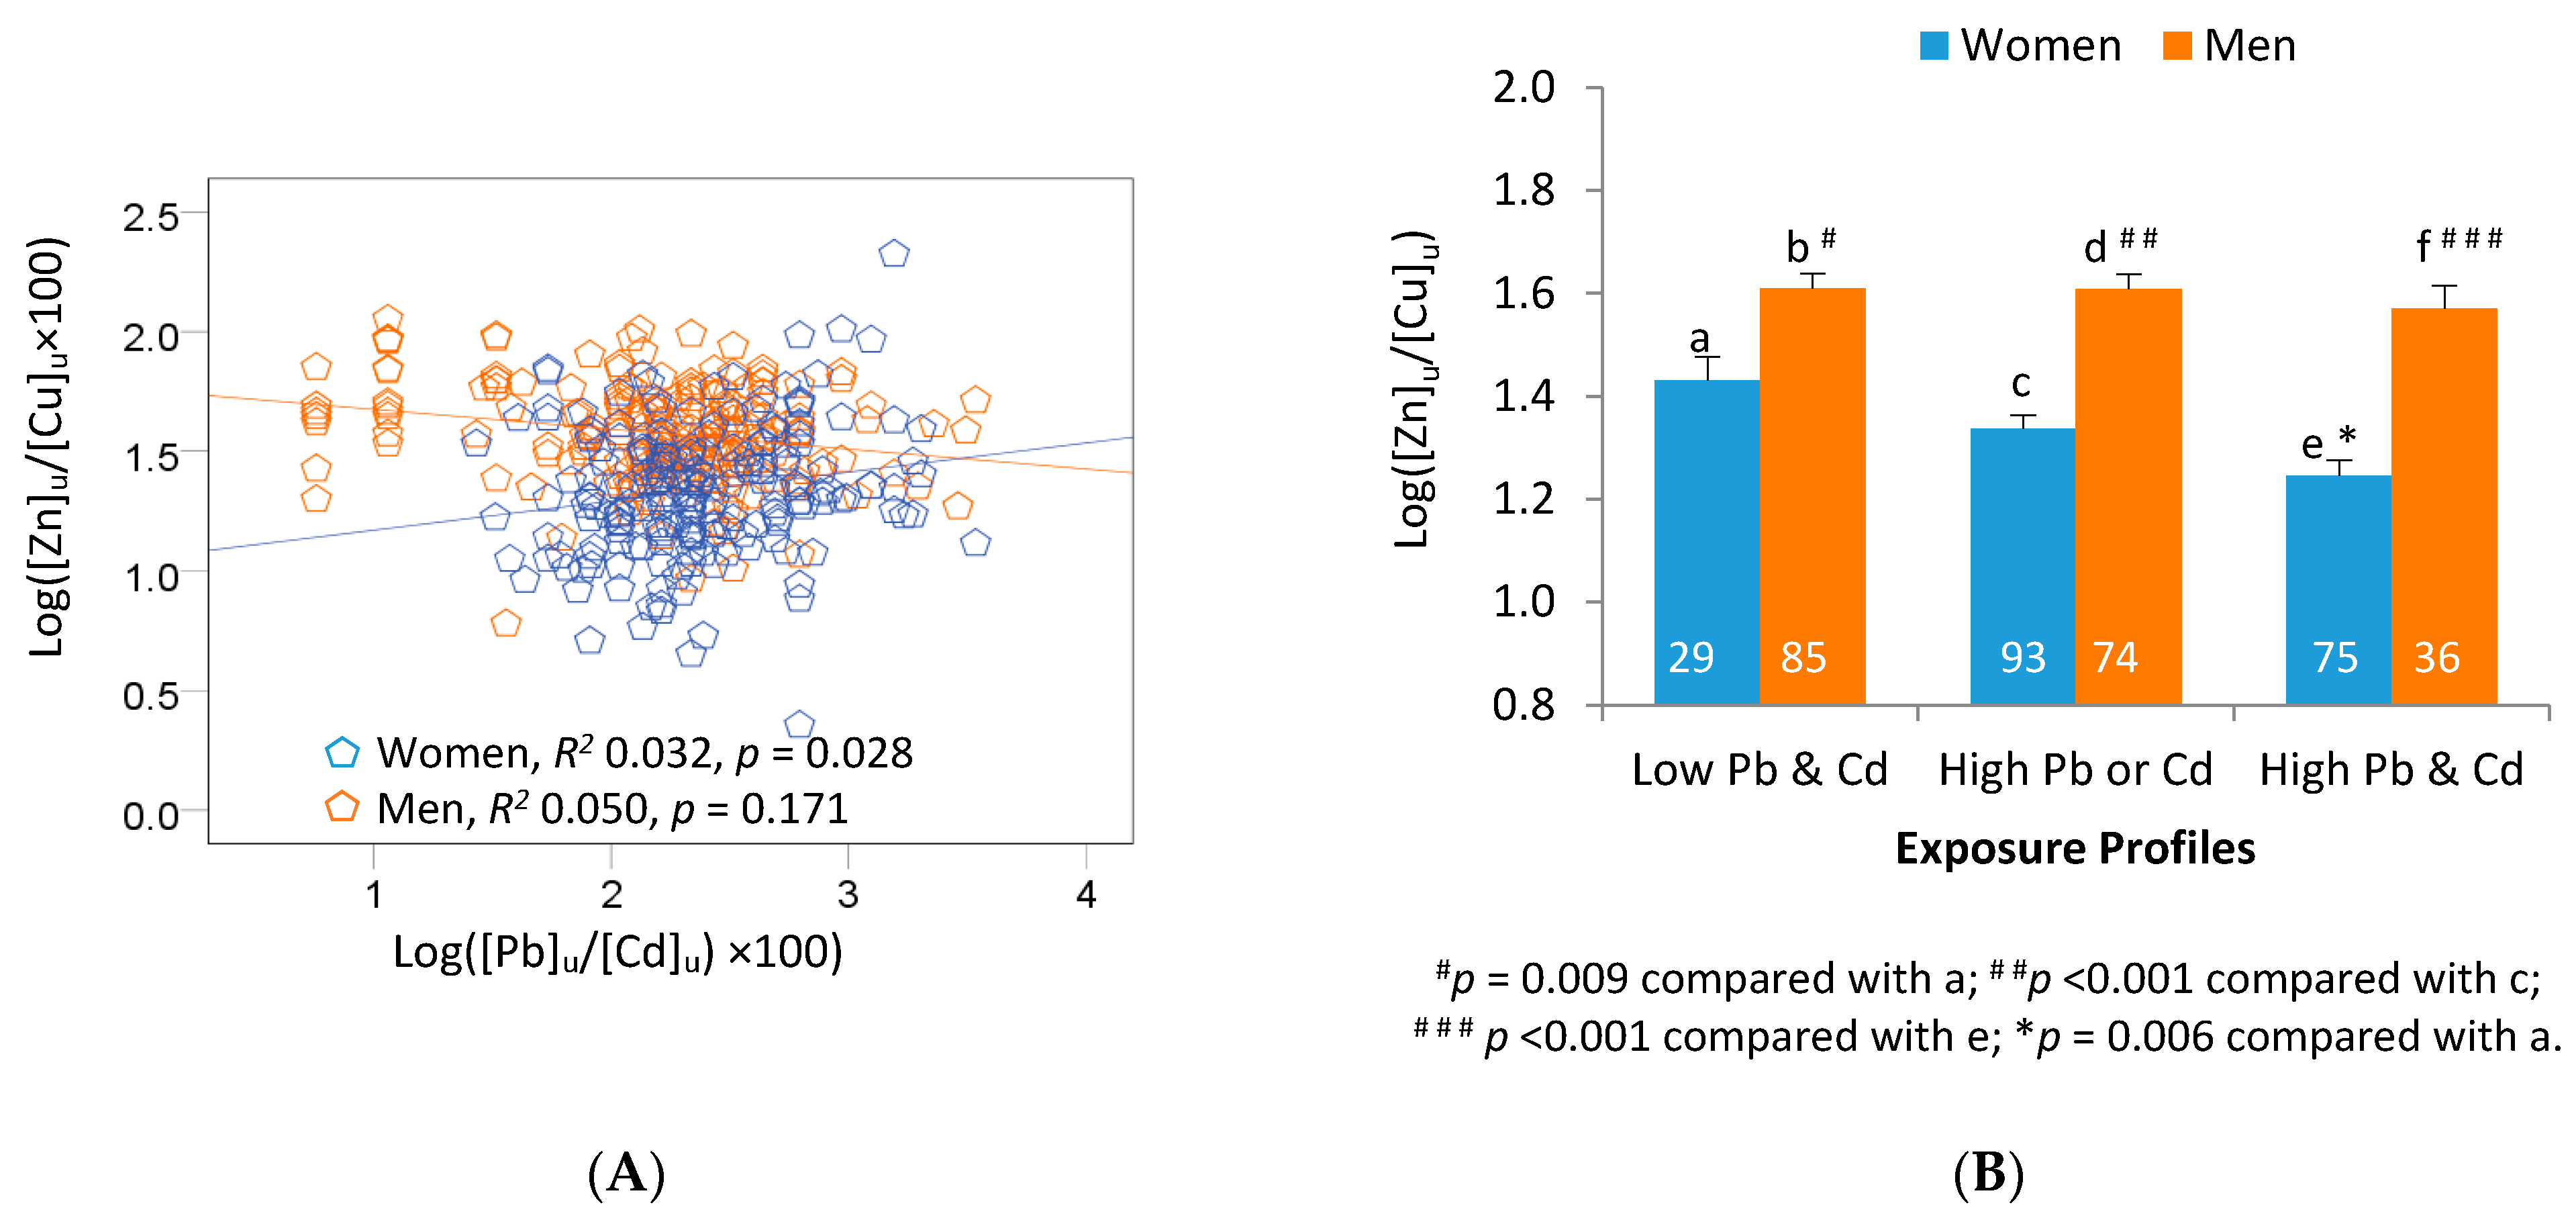
3.3. Regression Modelling and Univariate Analysis of Exposure Outcomes

In a generalized linear model (GLM) analysis (Table 3), each exposure outcome was a dependent variable with age, serum ferritin, BUN, [cr]u, [Cd]u, [Pb]u, gender and smoking as covariates/factors (Table 3). To correct for variability in urinary dilution, [cr]u was incorporated in a model as a covariate. Each individual outcome ([Zn]u, [Cu]u and [Zn]u/[Cu]u ratio) showed associations with gender, [cr]u, [Pb]u and ]Cd]u, but none showed an association with smoking, age or serum ferritin. The respective β and p-value for associations of [Pb]u with [Zn]u, [Cu]u and [Zn]u/[Cu]u ratios were 0.118 (p < 0.001), 0.208 (p < 0.001) and −0.090 (p = 0.005), respectively. These β values were all higher than those describing associations of [Cd]u with [Zn]u, [Cu]u and [Zn]u/[Cu]u ratios of 0.074 (p = 0.040), 0.154 (p < 0.001) and −0.080 (p = 0.023), respectively. Of three outcomes, [Cu]u showed a positive association with BUN (β = 0.227, p = 0.015).
Figure 1A presents scatterplots of [Zn]u against [Pb]u/[Cd]u ratios in men and women. Figure 1B presents bar graphs representing mean values for [Zn]u in men and women across three exposure groups. The mean [Zn]u values were adjusted for age,[cr]u, serum ferritin and BUN. Men with the high exposure profile had higher mean [Zn]u than those with low exposure (p = 0.041). Distinct from men, the differences in mean [Zn]u values among women in three exposure profiles were insignificant. Of interest, the means [Zn]u in men with moderate and high exposure profiles were higher than women of the same moderate (p = 0.006) and high exposure profiles (p = 0.016). However, the mean [Zn]u values for women and men with low exposure profiles were similar.
Figure 2A present scatterplots of [Cu]u against [Pb]u/[Cd]u ratios. Figure 2B presents bar graphs representing adjusted mean values for [Cu]u in men and women across three exposure groups. The mean [Cu]u values were adjusted for age, [cr]u, serum ferritin, and BUN. Means for [Cu]u rose in both men and women across three exposure profiles. In women, higher mean [Cu]u values were seen in those with high (p < 0.001) and moderate exposure profiles (p = 0.003), compared with low exposure profile. Mean [Cu]u in women with high exposure profile was also higher than that of moderate exposure profile (p = 0.021). In men, [Cu]u rose in high (p < 0.001) and moderate exposure profiles (p = 0.008), compared with low exposure profile. Differences in [Cu]u in men and women were statistically insignificant.
Figure 3A presents scatterplots of [Zn]u/[Cu]u ratio against [Pb]u/[Cd]u ratios in women and men. Figure 3B presents bar graphs representing mean values for [Zn]u/[Cu]u, in men and women across three exposure groups. The mean [Zn]u/[Cu]u ratios were adjusted for age,[cr]u, serum ferritin and BUN. Means for [Zn]u/Cu]u ratios among men in three exposure profiles were similar. A decrease in [Zn]u/[Cu]u ratio was seen in women with a high exposure profile, compared with a low exposure profile (p = 0.006). Intriguingly, the mean [Zn]u/[Cu]u in women was lower than men of the same exposure profile: low exposure (p = 0.009), moderate exposure (p < 0.001) and high exposure groups (p < 0.001).

3.4. Regression Models of Kidney Function as Estimated Glomerular Filtration Rate (eGFR)

To link exposure-related outcomes measured to kidney dysfunction, we undertook GLM analysis that included eGFR as the dependent variable together with a set of independent variables/factors (Table 4). In model A, the independent variables were age, serum ferritin, BUN, [cr]u, [Zn]u, [Cu]u, [Pb]u/[Cd]u, gender, and smoking. In model B, the independent variables were similar to those in model A with an exception that [Zn]u and [Cu]u were entered as a [Zn]u/[Cu]u ratio.
In all subjects (model A), eGFR did not show any association with [Pb]u/[Cd]u ratio (p = 0.640), while showing inverse associations with age (β = −0.70, p < 0.001), BUN (β = −17.7, p = 0.002), and [cr]u (β = −7.44, p = 0.025). In addition, eGFR showed a positive association with [Cu]u (β = 9.33, p = 0.002) in an analysis including all subjects. In men, higher eGFR was associated with higher [Cu]u (β = 9.52, p = 0.050) and higher serum ferritin levels (β = 4.97, p = 0.041). In women, eGFR showed a positive association with [Cu]u (β = 8.88, p = 0.031) while showing inverse associations with [Zn]u (β = −7.04, p = 0.050) and BUN (β = −21, p = 0.007).
In all subjects (model B), eGFR did not show an association with [Pb]u/[Cd]u (p = 0.528) or [cr]u (p = 0.081), but it did show inverse associations with age (β = −0.69, p < 0.001), BUN (β = −17.3, p = 0.002), and [Zn]u/[Cu]u ratio (β = −6.43, p = 0.009). Lower eGFR values were associated with [Zn]u/[Cu]u ratio (β = −7.76, p = 0.015) and BUN (β = −20.5, p = 0.007) only in women, while higher eGFR values were associated with higher serum ferritin levels in men (β = 5.32, p = 0.030).

4. Discussion

In this study of a Thai population living in Bangkok, exposure to environmental Cd and Pb was described as low, moderate or high, based on the median values for creatinine adjusted urine Pb and Cd of 1.75 and 0.44 μg/g creatinine, respectively. The median Pb excretion rate for the Thai subjects fell between the 90th and 95th percentiles (1.49–1.97 μg/g creatinine) of Pb excretion rates recorded for the U.S. general population, while the median Cd excretion was close to the 75th percentile (0.41 μg/g creatinine) [33]. These Cd and Pb exposure levels were comparable with those reported for various populations, including the U.S., Canada, Taiwan and Korea [12,13,14,15,16,17,18]. However, the percentage of high exposure to Cd and Pb in our study subjects of 28.3% was lower than the 50% recorded for participants in NHANES 2007–2012, aged ≥6 years [12].
By a logistic regression analysis, the high exposure profile was associated, respectively, with 3.92-, 8.61- and 2.59-fold increases in the POR for high Zn excretion (p = 0.036), high Cu excretion (p = 0.001) and reduced urinary Zn-to-Cu ratios (p = 0.019), compared with the low exposure to Cd and Pb (Table 2). In univariate analysis, differences between men and women in excretion of Zn and Cu were apparent (Figure 1, Figure 2 and Figure 3). Across three exposure profiles, the means for urinary Zn-to-Cu ratios were lower in women than men. In men, their urinary Zn-to-Cu ratios were maintained across exposure profiles because excretion of Zn and Cu increased proportionally. In women, however, Cu excretion rose across three exposure profiles, but Zn excretion did not increase concomitantly, causing a reduction in urinary Zn-to-Cu ratio. Likewise, Cu excretion was notably higher in Japanese women with itai-itai disease, compared with women in a control group, but Zn excretion was not increased by Cd exposure in either group [26]. In a study that examined another form of stress as artificially low gravity, simultaneous increases in Zn and Cu excretion were observed in men [34]. In an experimental study, high urinary Cu excretion seen in Wilson’s disease, a genetic disorder resulting in excessive hepatic Cu accumulation, was a mechanism to remove Cu through upregulation of a 2kDa small copper carrier (SCC) that transports Cu to kidneys [35]. Like MT, SCC has a small mass and is filtered by glomeruli [35].
Zn-Cu dysregulation and gender differences have previously been documented. In a Thai study, Cd exposure was associated with an elevation of serum Cu-to-Zn ratios [29]. In study of 299 healthy Croatian men 20–55 years of age, Cd exposure was associated with depressed serum Zn levels [36]. In a Belgian population study (959 men and 1018 women, 20–80 years of age) high exposure to Cd was associated with low serum Zn that persisted after subjects with occupational exposure to metals were excluded [37]. The mean serum Zn in Belgian women was lower than that of men (12.6 versus 13.1 μM). Likewise, Canadian women had lower mean serum Zn than men (18.4 versus 21 μM), but they had higher mean for serum Cu (20.7 μM) than men (17.8 μM) [38].
We attributed deranged Zn-Cu homeostasis observed in the present study to Cd-induced cellular expression of MT, especially in liver and kidney proximal tubular epithelial cells. In theory, up to seven atoms of Zn2+ or Cd2+ or 12 atoms of Cu2+ can be sequestered per molecule of MT, and metal-MT complexes are designated as Zn7MT, Cd7MT or Cu12MT [39,40]. In an experimental study, however, several species of mixed metal complexes such as Cd3Cu3ZnMT, Cd4CuZn2MT and Cd6CuMT were formed [39]. Unlike Cd, Pb lacks the propensities to induce cellular expression of MT [41,42], but it has particularly high binding affinity for MT isoform 3 (MT-3) [43], expressed prominently in the distal tubule of the kidney [44,45]. Of interest, MT-3 exhibits higher affinity for Cu than MT-1 and MT-2 [46]. In one recent study, the genetic variants of MT were associated with the variability in urinary excretion of Cd, Zn and Cu [47].
An effect of Cd on the homeostasis of Zn and Cu in liver and kidneys has been noted in Australian autopsy study [28], while experimental studies using rats observed effects of Cd on Zn and Cu contents in livers and kidneys together with iron (Fe) [48,49]. An effect of Cd on Fe content in the kidneys of Cd-treated rats may reflect a consequence of increased degradation of heme due to Cd-induced HO-1 expression. Intriguingly, Pb exposure is known to cause a reduction in heme biosynthesis by inhibiting the enzyme delta-aminolevulinic acid dehydratase (δ-ALAD), a rate-limiting step enzyme that requires Zn as a co-factor [50]. Anemia associated with high exposure to Pb is attributable to an inadequate amount of heme for hemoglobin production, resulting from the inhibition of δ-ALAD possibly through Zn displacement by Pb [39,50].
A lack of an association between eGFR and urinary Zn-to-Cu ratios in men was not unexpected, given that urinary Zn-to-Cu ratios among men across three exposure profiles were maintained (Figure 3). In men, eGFR did show a positive association with an indicator of body iron stores, serum ferritin (β = 5.32, p = 0.030), thereby suggesting serum ferritin as a factor that opposes GFR reduction in men. In women, however, eGFR did not show an association with serum ferritin (p = 0.725). Most intriguingly, an inverse association between eGFR and urinary Zn-to-Cu ratios (β = −7.76, p = 0.015) was seen only in women. Thus, disruption of nutritionally essential metals in kidneys could be a mechanism underlying nephrotoxicity of exposure to Cd and Pb. To the best of our knowledge, for the first time, evidence for dysregulated Zn-Cu homeostasis has been linked to a clinically relevant adverse outcome (eGFR) of co-exposure to Cd and Pb. These results were also expected because levels of serum ferritin among women were universally lower than men, and lower serum ferritin in women has been associated with higher rates of Cd absorption and accumulation in kidneys [51,52,53]. In a study of kidney transplant donors, the rate of kidney Cd accumulation in non-smokers was 3.9 μg/g kidney wet weight for every 10-year increase in age and it increased by 13% to 4.5 μg/g kidney wet weight for every 10-year increase in age in women with low iron stores (serum ferritin ≤ 20 μg/L) [51]. Urinary Cd excretion rates among Thai women who had low iron stores were 3–4 times higher, compared with those of similar age whose iron stores were within a normal range [52]. In another study, urinary Cd excretion rates were higher in Bangladeshi women who had low iron stores, but adequate zinc status, compared with those who had both low Fe and Zn status [53].

5. Conclusions

Environmental Cd exposure among our subjects was low to moderate, based on the median, 75th, 90th and 95th percentile levels of urinary Cd as 0.44, 0.76, 1.16 and 1.39 μg/g creatinine, respectively. Of further note, the highest urinary Cd excretion rate as 3.84 μg/g creatinine did not exceed a conventional threshold limit for nephrotoxicity of 5.24 μg/g creatinine [5]. Herein, however, these Cd exposure levels were associated with evidence for disrupted Zn-Cu homeostasis in kidneys. This dysregulated Zn-Cu homeostasis showed an inverse association with eGFR only in women. In contrast, a positive association of eGFR with serum ferritin (an indicator of body iron stores) was seen only in men whose Zn-Cu homeostasis was maintained under Cd and Pb co-exposure conditions. These data argue strongly that women are predisposed to an adverse effect when they are exposed to these toxic metals, as are those who have low status of Fe and/or Zn. Thus, it can be concluded that low body iron store status and reduced urinary Zn-to-Cu ratios, a sign of deranged Zn-Cu homeostasis, may serve as predictors of kidney function deterioration due to chronic exposure to Cd and Pb. The strategy for preventing or mitigating Cd toxicity should include minimization of environmental exposure, adequate intake of Zn and maintenance of the body status of iron.

Author Contributions

S.S., D.A.V., P.U. and G.C.G. conceptualized and formulated study protocols. P.U. obtained ethical institutional clearance, recruited participants and organized the collection of biologic specimens and their shipment for metal analysis by the ICP/MS in Australia. S.S. prepared an initial draft of a manuscript. D.A.V. and G.C.G. provided intellectual input and revised the manuscript. All authors have read and agreed to the published version of the manuscript.

Funding

This research project received no external funding.

Institutional Review Board Statement

The Institutional Ethical Committee, Chulalongkorn Medical Faculty Hospital, Chulalongkorn University, Bangkok, Thailand, approved the study protocol (Approval No. 142/2544, 5 October 2001).

Informed Consent Statement

All participants took part in the study after giving written informed consent.

Data Availability Statement

Data is contained within the article.

Acknowledgments

This work was partially supported by the Chulalongkorn University Medical Faculty, Bangkok, Thailand and the Commission for Higher Education, Thailand Ministry of Education. Additionally, it was supported with resources of the National Research Centre for Environmental Toxicology and Department of Nephrology, Princess Alexandra Hospital, and the Centre for Kidney Disease Research, The University of Queensland Faculty of Medicine and Translational Research Institute.

Conflicts of Interest

The authors have declared no potential conflicts of interest.

References

  1. Satarug, S.; Gobe, C.G.; Vesey, D.A.; Phelps, K.R. Cadmium and lead exposure, nephrotoxicity, and mortality. Toxics 2020, 8, 86. [Google Scholar] [CrossRef] [PubMed]
  2. Kim, K.; Melough, M.M.; Vance, T.M.; Noh, H.; Koo, S.I.; Chun, O.K. Dietary cadmium intake and sources in the US. Nutrients 2018, 11, 2. [Google Scholar] [CrossRef] [PubMed] [Green Version]
  3. Gavelek, A.; Spungen, J.; Hoffman-Pennesi, D.; Flannery, B.; Dolan, L.; Dennis, S.; Fitzpatrick, S. Lead exposures in older children (males and females 7–17 years), women of childbearing age (females 16–49 years) and adults (males and females 18+ years): FDA total diet study 2014-16. Food Addit. Contam. Part A Chem. Anal. Control. Expo. Risk Assess. 2020, 37, 104–109. [Google Scholar] [CrossRef] [PubMed]
  4. Shi, Z.; Taylor, A.W.; Riley, M.; Byles, J.; Liu, J.; Noakes, M. Association between dietary patterns, cadmium intake and chronic kidney disease among adults. Clin. Nutr. 2017, 5614, 31366–31368. [Google Scholar] [CrossRef] [PubMed]
  5. Food and Agriculture Organization of the United Nations (FAO) World Health Organization (WHO) Summary and Conclusions. In Proceedings of the Joint FAO/WHO Expert Committee on Food Additives Seventy-Third Meeting, Geneva, Switzerland, 8–17 June 2010; Available online: http://www.who.int/foodsafety/publications/chem/summary73.pdf (accessed on 24 November 2020).
  6. Grau-Perez, M.; Pichler, G.; Galan-Chilet, I.; Briongos-Figuero, L.S.; Rentero-Garrido, P.; Lopez-Izquierdo, R.; Navas-Acien, A.; Weaver, V.; García-Barrera, T.; Gomez-Ariza, J.L.; et al. Urine cadmium levels and albuminuria in a general population from Spain: A gene-environment interaction analysis. Environ. Int. 2017, 106, 27–36. [Google Scholar] [CrossRef]
  7. Myong, J.P.; Kim, H.R.; Baker, D.; Choi, B. Blood cadmium and moderate-to-severe glomerular dysfunction in Korean adults: Analysis of KNHANES 2005−2008 data. Int. Arch. Occup. Environ. Health 2012, 85, 885–893. [Google Scholar] [CrossRef]
  8. Navas-Acien, A.; Tellez-Plaza, M.; Guallar, E.; Muntner, P.; Silbergeld, E.; Jaar, B.; Weaver, V. Blood cadmium and lead and chronic kidney disease in US adults: A joint analysis. Am. J. Epidemiol. 2009, 170, 1156–1164. [Google Scholar] [CrossRef] [PubMed] [Green Version]
  9. Ferraro, P.M.; Costanzi, S.; Naticchia, A.; Sturniolo, A.; Gambaro, G. Low level exposure to cadmium increases the risk of chronic kidney disease: Analysis of the NHANES 1999–2006. BMC Public Health 2010, 10, 304. [Google Scholar] [CrossRef] [PubMed] [Green Version]
  10. Madrigal, J.M.; Ricardo, A.C.; Persky, V.; Turyk, M. Associations between blood cadmium concentration and kidney function in the U.S. population: Impact of sex, diabetes and hypertension. Environ. Res. 2018, 169, 180–188. [Google Scholar] [CrossRef] [PubMed]
  11. Zhu, X.J.; Wang, J.J.; Mao, J.H.; Shu, Q.; Du, L.Z. Relationships between cadmium, lead and mercury levels and albuminuria: Results from the National Health and Nutrition Examination Survey Database 2009−2012. Am. J. Epidemiol. 2019, 188, 1281–1287. [Google Scholar] [CrossRef]
  12. Shim, Y.K.; Lewin, M.D.; Ruiz, P.; Eichner, J.E.; Mumtaz, M.M. Prevalence and associated demographic characteristics of exposure to multiple metals and their species in human populations: The United States NHANES, 2007–2012. J. Toxicol. Environ. Health A 2017, 80, 502–512. [Google Scholar] [CrossRef] [PubMed]
  13. Buser, M.C.; Ingber, S.Z.; Raines, N.; Fowler, D.A.; Scinicariello, F. Urinary and blood cadmium and lead and kidney function: NHANES 2007–2012. Int. J. Hyg. Environ. Health 2016, 219, 261–267. [Google Scholar] [CrossRef] [PubMed] [Green Version]
  14. Wang, W.; Schaumberg, D.A.; Park, S.K. Cadmium and lead exposure and risk of cataract surgery in U.S. adults. Int. J. Hyg. Environ. Health 2016, 219, 850–856. [Google Scholar] [CrossRef] [PubMed] [Green Version]
  15. Jin, R.; Zhu, X.; Shrubsole, M.J.; Yu, C.; Xia, Z.; Dai, Q. Associations of renal function with urinary excretion of metals: Evidence from NHANES 2003–2012. Environ. Int. 2018, 121, 1355–1362. [Google Scholar] [CrossRef] [PubMed]
  16. Saravanabhavan, G.; Werry, K.; Walker, M.; Haines, D.; Malowany, M.; Khoury, C. Human biomonitoring reference values for metals and trace elements in blood and urine derived from the Canadian Health Measures Survey 2007–2013. Int. J. Hyg. Environ. Health 2017, 220, 189–200. [Google Scholar] [CrossRef] [PubMed] [Green Version]
  17. Liao, K.W.; Pan, W.H.; Liou, S.H.; Sun, C.W.; Huang, P.C.; Wang, S.L. Levels and temporal variations of urinary lead, cadmium, cobalt, and copper exposure in the general population of Taiwan. Environ. Sci. Pollut. Res. Int. 2019, 26, 6048–6064. [Google Scholar] [CrossRef] [PubMed]
  18. Kim, N.S.; Ahn, J.; Lee, B.K.; Park, J.; Kim, Y. Environmental exposures to lead, mercury, and cadmium among South Korean teenagers (KNHANES 2010–2013): Body burden and risk factors. Environ. Res. 2017, 156, 468–476. [Google Scholar] [CrossRef]
  19. Lim, H.; Lim, J.A.; Choi, J.H.; Kwon, H.J.; Ha, M.; Kim, H.; Park, J.D. Associations of low environmental exposure to multiple metals with renal tubular impairment in Korean adults. Toxicol. Res. 2016, 32, 57–64. [Google Scholar] [CrossRef] [Green Version]
  20. Hambach, R.; Lison, D.; D’Haese, P.C.; Weyler, J.; De Graef, E.; De Schryver, A.; Lamberts, L.V.; van Sprundel, M. Co-exposure to lead increases the renal response to low levels of cadmium in metallurgy workers. Toxicol. Lett. 2013, 222, 233–238. [Google Scholar] [CrossRef] [Green Version]
  21. King, J.C.; Shames, D.M.; Woodhouse, L.R. Zinc homeostasis in humans. J. Nutr. 2000, 130, 1360S–1366S. [Google Scholar] [CrossRef] [Green Version]
  22. Thévenod, F.; Lee, W.-K.; Garrick, M.D. Iron and cadmium entry into renal mitochondria: Physiological and toxicological implications. Front. Cell Develop. Biol. 2020, 8, 848. [Google Scholar] [CrossRef] [PubMed]
  23. Boonprasert, K.; Ruengweerayut, R.; Aunpad, R.; Satarug, S.; Na-Bangchang, K. Expression of metallothionein isoforms in peripheral blood leukocytes from Thai population residing in cadmium-contaminated areas. Environ. Toxicol. Pharmacol. 2012, 34, 935–940. [Google Scholar] [CrossRef] [PubMed]
  24. Boonprasert, K.; Satarug, S.; Morais, C.; Gobe, G.C.; Johnson, D.W.; Na-Bangchang, K.; Vesey, D.A. The stress response of human proximal tubule cells to cadmium involves up-regulation of haemoxygenase 1 and metallothionein but not cytochrome P450 enzymes. Toxicol. Lett. 2016, 249, 5–14. [Google Scholar] [CrossRef] [PubMed] [Green Version]
  25. Tohyama, C.; Mitane, Y.; Kobayashi, E.; Sugihira, N.; Nakano, A.; Saito, H. The relationships of urinary metallothionein with other indicators of renal dysfunction in people living in a cadmium-polluted area in Japan. J. Appl. Toxicol. 1988, 8, 15–21. [Google Scholar] [CrossRef]
  26. Nogawa, K.; Yamada, Y.; Honda, R.; Tsuritani, I.; Kobayashi, E.; Ishizaki, M. Copper and zinc levels in serum and urine of cadmium-exposed people with special reference to renal tubular damage. Environ. Res. 1984, 33, 29–38. [Google Scholar] [CrossRef]
  27. Nakajima, M.; Kobayashi, E.; Suwazono, Y.; Uetani, M.; Oishi, M.; Inaba, T.; Kido, T.; Shaikh, Z.A.; Nogawa, K. Excretion of urinary cadmium, copper, and zinc in cadmium-exposed and non-exposed subjects, with special reference to urinary excretion of beta2-microglobulin and metallothionein. Biol. Trace Elem. Res. 2005, 108, 17–31. [Google Scholar] [CrossRef]
  28. Satarug, S.; Baker, J.R.; Reilly, P.E.; Moore, M.R.; Williams, D.J. Changes in zinc and copper homeostasis in human livers and kidneys associated with exposure to environmental cadmium. Hum. Exp. Toxicol. 2001, 20, 205–213. [Google Scholar] [CrossRef]
  29. Satarug, S.; Nishijo, M.; Ujjin, P.; Moore, M.R. Chronic exposure to low-level cadmium induced zinc-copper dysregulation. J. Trace Elem. Med. Biol. 2018, 46, 32–38. [Google Scholar] [CrossRef]
  30. Eom, S.Y.; Yim, D.H.; Huang, M.; Park, C.H.; Kim, G.B.; Yu, S.D.; Choi, B.S.; Park, J.D.; Kim, Y.D.; Kim, H. Copper-zinc imbalance induces kidney tubule damage and oxidative stress in a population exposed to chronic environmental cadmium. Int. Arch. Occup. Environ. Health 2020, 93, 337–344. [Google Scholar] [CrossRef] [Green Version]
  31. Levey, A.S.; Stevens, L.A.; Schmid, C.H.; Zhang, Y.; Castro, A.F., III; Feldman, H.I.; Kusek, J.W.; Eggers, P.; Van Lente, F.; Greene, T.; et al. A new equation to estimate glomerular filtration rate. Ann. Intern. Med. 2009, 150, 604–612. [Google Scholar] [CrossRef]
  32. Barr, D.B.; Wilder, L.C.; Caudill, S.P.; Gonzalez, A.J.; Needham, L.L.; Pirkle, J.L. Urinary creatinine concentrations in the U.S. population: Implications for urinary biologic monitoring measurements. Environ. Health Perspect. 2004, 113, 192–200. [Google Scholar] [CrossRef] [PubMed] [Green Version]
  33. Crinnion, W.J. The CDC fourth national report on human exposure to environmental chemicals: What it tells us about our toxic burden and how it assists environmental medicine physicians. Altern. Med. Rev. 2010, 15, 101–108. [Google Scholar] [PubMed]
  34. Heacox, H.N.; Gillman, P.L.; Zwart, S.R.; Smith, S.M. Excretion of zinc and copper increases in men during 3 weeks of bed rest, with or without artificial gravity. J. Nutr. 2017, 147, 1113–1120. [Google Scholar] [CrossRef] [PubMed] [Green Version]
  35. Gray, L.W.; Peng, F.; Molloy, S.A.; Pendyala, V.S.; Muchenditsi, A.; Muzik, O.; Lee, J.; Kaplan, J.H.; Lutsenko, S. Urinary copper elevation in a mouse model of Wilson’s disease is a regulated process to specifically decrease the hepatic copper load. PLoS ONE 2012, 7, e38327. [Google Scholar] [CrossRef]
  36. Pizent, A.; Jurasović, J.; Telisman, S. Serum calcium, zinc, and copper in relation to biomarkers of lead and cadmium in men. J. Trace Elem. Med. Biol. 2003, 17, 199–205. [Google Scholar] [CrossRef]
  37. Thijs, L.; Staessen, J.; Amery, A.; Bruaux, P.; Buchet, J.P.; Claeys, F.; De Plaen, P.; Ducoffre, G.; Lauwerys, R.; Lijnen, P. Determinants of serum zinc in a random population sample of four Belgian towns with different degrees of environmental exposure and body burden. Environ. Health Perspect. 1993, 98, 251–258. [Google Scholar] [CrossRef]
  38. Clark, N.A.; Teschke, K.; Rideout, K.; Copes, R. Trace element levels in adults from the west coast of Canada and associations with age, gender, diet, activities, and levels of other trace elements. Chemosphere 2007, 70, 155–164. [Google Scholar] [CrossRef]
  39. Petering, D.H. Reactions of the Zn proteome with Cd2+ and other xenobiotics: Trafficking and toxicity. Chem. Res. Toxicol. 2017, 30, 189–202. [Google Scholar] [CrossRef]
  40. Krężel, A.; Maret, W. The functions of metamorphic metallothioneins in zinc and copper metabolism. Int. J. Mol. Sci. 2017, 18, 1237. [Google Scholar] [CrossRef] [Green Version]
  41. Takeda, K.; Fujita, H.; Shibahara, S. Differential control of the metal-mediated activation of the human heme oxygenase-1 and metallothionein IIA genes. Biochem. Biophys. Res. Commun. 1995, 207, 160–167. [Google Scholar] [CrossRef]
  42. Yu, J.; Fujishiro, H.; Miyataka, H.; Oyama, T.M.; Hasegawa, T.; Seko, Y.; Miura, N.; Himeno, S. Dichotomous effects of lead acetate on the expression of metallothionein in the liver and kidney of mice. Biol. Pharm. Bull. 2009, 32, 1037–1042. [Google Scholar] [CrossRef] [PubMed] [Green Version]
  43. Carpenter, M.C.; Shami Shah, A.; DeSilva, S.; Gleaton, A.; Su, A.; Goundie, B.; Croteau, M.L.; Stevenson, M.J.; Wilcox, D.E.; Austin, R.N. Thermodynamics of Pb(ii) and Zn(ii) binding to MT-3, a neurologically important metallothionein. Metallomics 2016, 8, 605–617. [Google Scholar] [CrossRef] [PubMed]
  44. Garrett, S.H.; Sens, M.A.; Todd, J.H.; Somji, S.; Sens, D.A. Expression of MT-3 protein in the human kidney. Toxicol. Lett. 1999, 105, 207–214. [Google Scholar] [CrossRef]
  45. Sabolić, I.; Skarica, M.; Ljubojevic, M.; Breljak, D.; Herak-Kramberger, C.M.; Crljen, V.; Ljubešić, N. Expression and immunolocalization of metallothioneins MT1, MT2 and MT3 in rat nephron. J. Trace Elem. Med. Biol. 2018, 46, 62–75. [Google Scholar] [CrossRef] [PubMed] [Green Version]
  46. Vašák, M.; Meloni, G. Mammalian metallothionein-3: New functional and structural insights. Int. J. Mol. Sci. 2017, 18, 1117. [Google Scholar] [CrossRef] [PubMed] [Green Version]
  47. Adams, S.V.; Barrick, B.; Freney, E.P.; Shafer, M.M.; Makar, K.; Song, X.; Lampe, J.; Vilchis, H.; Ulery, A.; Newcomb, P.A. Genetic variation in metallothionein and metal-regulatory transcription factor 1 in relation to urinary cadmium, copper, and zinc. Toxicol. Appl. Pharmacol. 2015, 289, 381–388. [Google Scholar] [CrossRef] [Green Version]
  48. Zhang, D.; Gao, J.; Zhang, K.; Liu, X.; Li, J. Effects of cadmium poisoning on Zn, Cu, Fe, Ca and metallothionein in liver and kidney of rats. Biol. Trace Elem. Res. 2012, 149, 57–63. [Google Scholar] [CrossRef]
  49. Prozialeck, W.C.; Lamar, P.C.; Edwards, J.R. Effects of sub-chronic Cd exposure on levels of copper, selenium, zinc, iron and other essential metals in rat renal cortex. Toxicol. Rep. 2016, 3, 740–746. [Google Scholar] [CrossRef] [Green Version]
  50. Phillips, J.D. Heme biosynthesis and the porphyrias. Mol. Genet. Metab. 2019, 128, 164–177. [Google Scholar] [CrossRef]
  51. Barregard, L.; Fabricius-Lagging, E.; Lundh, T.; Mölne, J.; Wallin, M.; Olausson, M.; Modigh, C.; Sallsten, G. Cadmium, mercury, and lead in kidney cortex of living kidney donors: Impact of different exposure sources. Environ. Res. 2010, 110, 47–54. [Google Scholar] [CrossRef]
  52. Satarug, S.; Ujjin, P.; Vanavanitkun, Y.; Baker, J.R.; Moore, M.R. Influence of body iron store status and cigarette smoking on cadmium body burden of healthy Thai women and men. Toxicol. Lett. 2004, 148, 177–185. [Google Scholar] [CrossRef] [PubMed]
  53. Kippler, M.; Ekström, E.C.; Lönnerdal, B.; Goessler, W.; Åkesson, A.; El Arifeen, S.; Persson, L.Å.; Vahter, M. Influence of iron and zinc status on cadmium accumulation in Bangladeshi women. Toxicol. Appl. Pharmacol. 2007, 222, 221–226. [Google Scholar] [CrossRef] [PubMed]
Figure 1. Relationships of urine zinc, urine Pb-to-Cd ratios and exposure profiles. Scatterplots in (A) relate log ([Zn]u × 100), μg/L to log ([Pb]u/[Cd]u × 100) in women and men. The linear regression coefficients of (R2) and p-values are provided. Bar graphs in (B) representing means for log([Zn]u × 100) ± standard error of mean (S.E.) in women and men in three exposure profiles. Numbers of subjects are provided for all groups. The means are adjusted for age, [cr]u, serum ferritin, and BUN [32]. The GM (SD) of ECd in the low-, moderate- and high-exposure groups are 0.23 (0.12), 0.40 (0.38) and 0.86 (0.55) μg/g creatinine. The corresponding GM (SD) of EPb are 0.84 (0.56), 1.48 (1.51) and 2.79 (3.25) μg/g creatinine, respectively.
Stresses 01 00002 g001
Figure 2. Relationships of urine copper, urine Pb-to-Cd ratios and exposure profiles. Scatterplots in panel (A) relate log ([Cu]u × 100), μg/L to log ([Pb]u/[Cd]u × 100) in women and men. The linear regression coefficients of (R2) and p-values are provided. Bars in panel (B) represent means for Cu excretion ± standard error of mean (S.E.) in women and men in three exposure profiles. Numbers of subjects are provided for all groups. The means are adjusted for age, [cr]u, serum ferritin, and BUN. The GM (SD) of EPb in the low-, moderate- and high-exposure groups are 0.84 (0.56), 1.48 (1.51) and 2.79 (3.25) μg/g creatinine, while the corresponding GM (SD) of ECd 0.23 (0.12), 0.40 (0.38) and 0.86 (0.55) μg/g creatinine, respectively.
Stresses 01 00002 g002
Figure 3. Relationships of urine Zn-to-Cu ratios, urine Pb-to-Cd ratios and exposure profiles. Scatterplots in panel (A) relate log ([Zn]u/[Cu]u × 100) to log ([Pb]u/[Cd]u × 100) in women and men. The linear regression coefficients of (R2) and p-values are provided. Bars in panel (B) represent adjusted means for urinary Zn-to-Cu ratio ± S.E. in women and men in three exposure profiles. Numbers of subjects are provided for all groups. The means are adjusted for age, [cr]u, serum ferritin, and BUN. The GM (SD) of EPb in the low-, moderate- and high-exposure groups are 0.84 (0.56), 1.48 (1.51) and 2.79 (3.25) μg/g creatinine, while the corresponding GM (SD) of ECd 0.23 (0.12), 0.40 (0.38) and 0.86 (0.55) μg/g creatinine, respectively.
Stresses 01 00002 g003
Table 1. Study subjects grouped by profiles of co-exposure to cadmium and lead.
ParametersAll Subjectsa Cd and Pb Co-Exposure Profilesp-Values
N 392Low, n 114Moderate, n 167High, n 111
% Men49.774.644.332.4 <0.001
% Smoking24.729.822.822.5 0.328
% b Low body iron stores 13.08.814.415.3 0.272
Age, years33.6 ± 9.629.9 ± 7.933.8 ± 9.737.4 ± 9.6<0.001
c Body mass index, kg/m222.9 ± 3.6622.7 ± 3.1322.7 ± 3.6423.5 ± 4.190.647
d eGFR, mL/min/1.73 m2 105 ± 14105 ± 12105 ± 14105 ±140.909
Serum ferritin, μg/L 89 ± 134108 ± 13186 ± 14177 ± 1260.020
BUN, mg/dL 11.1 ± 2.8511.7 ± 2.8311.0 ± 2.8810.6 ± 2.760.021
[Creatinine]s, mg/dL0.82 ± 0.160.89 ± 0.150.81 ± 0.160.76 ± 0.16<0.001
[Creatinine]u, mg/dL59.5 ± 68.473.5 ±79.856.5 ± 65.751.7 ± 54.80.004
[Zn]u, μM2.50 ± 4.362.83 ± 4.272.47 ± 4.732.25 ± 3.850.121
[Cu]u, μM0.09 ± 0.130.08 ± 0.110.09 ± 0.150.10 ± 0.120.183
[Zn]u/[Cu]u ratio28.6 ± 21.836.1 ± 25.128.8 ± 20.9 22.3 ± 16.5<0.001
[Pb]u, nM4.31 ± 8.362.99 ± 5.184.02 ± 5.876.96 ± 12.50.001
[Cd]u, nM2.25 ± 6.091.51 ± 2.592.03 ± 4.963.95 ± 9.02<0.001
[Pb]u/[Cd]u1.92 ± 4.561.98 ± 2.771.99 ± 6.331.76 ± 1.220.058
EPb/Ecr, μg/g creatinine1.50 ± 2.160.84 ± 0.561.48 ± 1.512.79 ± 3.25<0.001
ECd/Ecr, μg/g creatinine0.42 ± 0.470.23 ± 0.120.40 ± 0.380.86 ± 0.55<0.001
a Low exposure was defined as EPb/Ecr and ECd/Ecr ≤ its respective median of 1.75 and 0.44 μg/g creatinine. Moderate exposure was defined as only EPb/Ecr or ECd/Ecr ≥ its respective median. High exposure was defined as EPb/Ecr and ECd/Ecr ≥ its respective median.b Low body iron stores is defined as serum ferritin ≤30 μg/L. c Data for body mass index are from 177 subjects (86 women, 91 men), while all other data are from 392 subjects (197 women, 195 men). d Egfr = estimated glomerular filtration rate. BUN = blood urea nitrogen. eGFR numbers are arithmetic mean ± standard deviation (SD). For all other continuous variables, numbers are geometric mean (GM) ± SD. p ≤ 0.05 indicates mean differences or % differences across three exposure profiles, based on Kruskal–Wallis test or the Pearson chi-square test, respectively.
Table 2. The prevalence odds ratios for aberrant excretion of urine zinc and copper and urine zinc-to-copper ratios.
Independent Variables[Zn]u > 9 μM[Cu]u > 0.28 μM[Zn]u/[Cu]u Ratios < 20
POR (95%CI)pPOR (95%CI)pPOR (95%CI)p
Age, years1.00 (0.95, 1.05)0.9391.04 (0.98, 1.09)0.1610.98 (0.96, 1.01)0.276
[Ferritin]s, μg/L0.80 (0.25, 2,64)0.7200.43 (0.12, 1.48)0.1790.95 (0.49, 1.84)0.880
BUN, mg/dL3.60 (0.06, 223)0.5430.06 (0.001, 4.44)0.1960.34 (0.03, 4.04)0.393
[cr]u, mg/dL0.002 (0.000, 0.02)<0.0010.001 (0.000, 0.01)<0.0011.28 (0.59, 2.80)0.535
Gender0.30 (0.07, 1.24)0.0961.42 (0.35, 5.70)0.62067.2 (8.81, 513)<0.001
Smoking1.72 (0.63, 4.68)0.2881.17 (0.38, 3.57)0.78213.6 (1.72, 107)0.013
Exposure profiles
  LowReferent Referent Referent
  Moderate0.98 (0.35, 2.73)0.9673.47 (1.22, 9.84)0.0201.90 (1.07, 3.35)0.028
  High3.92 (1.09, 14.1)0.0368.61 (2.31, 32.2)0.0012.59 ((1.17, 5.75)0.019
POR = prevalence odds atio; 95% CI = 95% confidence interval; [Zn]u 9μM corresponds to the 90th percentile. [Cu]u 0.28 μM corresponds to the 90th percentile. [Zn]u/[Cu]u ratio of 20 corresponds to the 25th percentile. p ≤ 0.05 indicates statistically significant increments of POR, compared with a respective referent. [x]u = urinary concentration of x; [x]s = serum concentration of x; [cr]u = urine concentration of creatinine; BUN = blood urea nitrogen.
Table 3. Regression model analysis of aberrant excretion of zinc and copper.
Independent VariablesLog [Zn]u, µMLog [Cu]u, µMLog [Zn]u/[Cu]u Molar Ratio
a β (95%CI)pβ (95%CI)pβ (95%CI)p
Age (years)0.000 (−0.003, 0.002)0.7860.002 (0.000, 0.004)0.149−0.002 (−0.005, 0.001)0.147
[Ferritin]s, µg/L−0.012 (−0.08, 0.05)0.7000.041 (−0.01, 0.09)0.117−0.053 (−0.12, 0.01)0.095
BUN, mg/dL0.095 (−0.13, 0.32)0.4140.227 (0.04, 0.41)0.015−0.132 (−0.36, 0.09)0.249
Log [cr]u, mg/dL0.684 (0.56, 0.80)<0.0010.560 (0.46, 0.66)<0.0010.123 (0.004, 0.24)0.043
Log [Pb]u, nM0.118 (0.06, 0.18)<0.0010.208 (0.16, 0.26)<0.001−0.090 (−0.15, −0.03)0.005
Log [Cd]u, nM0.074 (0.004, 0.14)0.0400.154 (0.10, 0.21)<0.001−0.080 (−0.15, −0.01)0.023
Gender0.177 (0.10, 0.25)<0.001−0.067 (−0.13, −0.01)0.0240.244 (0.17, 0.32)<0.001
Smoking−0.041 (−0.11, 0.03)0.237−0.051 (−0.10, 0.003)0.0660.010 (−0.06, 0.08)0.768
a β is derived from a generalized linear regression model analysis that indicates an association between each dependent variable with individual independent variables and factors listed in the first column. p ≤ 0.05 identify statistically significant associations. [x]u = urinary concentration of x; [x]s = serum concentration of x; cr = creatinine; BUN = blood urea nitrogen.
Table 4. Regression models comparing parameters associated with eGFR in women and men.
Models Covariates/FactorseGFR, mL/min/1.73m2
All Subjects, N 392Women, n 197Men, n 195
a β (95% CI)p-Valueβ (95% CI)p-Valueβ (95% CI)p-Value
Model A
Age (years)−0.70 (−0.83, −0.57)<0.001−0.58 (−0.76, −0.41)<0.001−0.87 (−1.06, −0.68)<0.001
[Ferritin]s, µg/L1.43 (−1.67, 4.54)0.366−0.77 (−4.82, 3.28)0.7094.97 (0.21, 9.73)0.041
BUN, mg/dL−17.7 (−28.7, −6.67)0.002−21 (−36.3, −5.82)0.007−11.5 (−27.4, 4.38)0.155
Log [cr]u, mg/dL−7.44 (14.0, −0.92)0.025−2.37 (−11.4, 6.66)0.607−12.9 (−22.3, −3.47)0.007
Log [Zn]u−4.65 (−9.95, 0.65)0.086−7.04 (−14.1, 0.01)0.050−1.06 (−9.36, 7.25)0.803
Log [Cu]u9.33 (3.29, 15.4)0.0028.88 (0.79, 17.0)0.0319.52 (−0.02, 19.1)0.050
Log ([Pb]u/[Cd]u)0.58 (−1.85, 3.02)0.6402.36 (−1.87, 6.60)0.274−0.26 (−3.32, 2.80)0.867
Smoking −1.07 (−4.36, 2.22)0.523n/an/a−0.69 (−3.90, 2.53)0.675
Gender−2.85 (−6.53, 0.82)0.128n/an/an/an/a
Model B
Age (years)−0.69 (−0.82, −0.56)<0.001−0.58 (−0.75, −0.40)<0.001−0.84 (−1.04, −0.65)<0.001
Serum ferritin, µg/L1.58 (−1.53, 4.69)0.318−0.73 (−4.77, 3.32)0.7255.32 (0.53, 10.1)0.030
BUN, mg/dL−17.3 (−28.3, −6.24)0.002−20.5 (−35.6, −5.49)0.007−12.8 (−28.8, 3.19)0.117
Log [cr]u, mg/dL−3.04 (−6.47, −0.38)0.081−0.75 (−5.87, 4.37)0.773−4.46 (−9.10, 0.18)0.060
Log ([Zn]u/[Cu]u)−6.43 (−11.2, −1.62)0.009−7.76 (−14.0, −1.52)0.015−3.92 (−11.8, 3.98)0.331
Log ([Pb]u/[Cd]u)0.78 (−1.65, 3.21)0.5282.44 (−1.79, 6.66)0.2580.05 (−3.03, 3.13)0.975
Smoking −1.46 (−4.72, 1.80)0.379n/an/a−1.37 (−4.54, 1.81)0.399
Gender−3.08 (−6.75, 0.60)0.101n/an/an/an/a
a β is derived from a generalized linear regression model analysis to indicates an association between each dependent variable with individual independent variables and factors listed in the first column. n/a = not applicable; p ≤ 0.05 identify statistically significant associations.
Publisher’s Note: MDPI stays neutral with regard to jurisdictional claims in published maps and institutional affiliations.

