Article

The Impact of Chronic Stress and Eating Concern on Acylated Ghrelin Following Acute Psychological Stress in Healthy Men

by
Christine Fahrngruber-Velasquez
,
Kalina Duszka
* and
Jürgen König
Department of Nutritional Sciences, Institute of Life Sciences, University of Vienna, Althanstrasse 14, 1090 Vienna, Austria
*
Author to whom correspondence should be addressed.
Submission received: 22 January 2021 / Revised: 25 February 2021 / Accepted: 1 March 2021 / Published: 9 March 2021
(This article belongs to the Section Animal and Human Stresses)

Abstract

:
Stress, mood, and eating behavior play an important role in appetite and weight regulation. In particular, ghrelin, as the only known orexigenic hormone, has been suggested to be an influential mediator in food intake responses to stress. The exact role of ghrelin in the hypothalamic–pituitary–adrenal axis is still unknown and further challenged by the psychological aspects of stress and eating behavior. This study aimed to assess the effect of chronic stress and subjective concern about eating on acute stress-induced changes in acylated ghrelin. In a 2-day study, sixteen healthy male participants were confronted with a stressful situation as well as a control situation. Additional measurements of heart rate, subjective hunger ratings, and subjective mood ratings were made to assess successful acute stress induction. The linear mixed model approach revealed a significant effect of acute stress on acylated ghrelin for a study-day*chronic-stress interaction (p < 0.001). Concern about eating did not affect acylated ghrelin levels after acute stress exposure. The significant interaction showed that lower chronic stress exposure was associated with a stronger acylated ghrelin response after acute stress exposure versus control condition. At the same time, participants with higher chronic stress exposure showed a blunted acylated ghrelin response after acute stress exposure compared to the control situation. Our findings indicate that chronic stress exposure can influence acylated ghrelin response after acute stress encounters, possibly affecting subsequent food intake and explaining the often diverse outcome in measurements of acute stress responses.

1. Introduction

Stress levels have been increasing over time in the Western population [1] The impact of chronic and acute psychosocial stress is known to influence perceived hunger, eating behavior, food choice, and energy intake [2,3]. Therefore, stress is considered as one of the common risk factors for obesity, metabolic diseases, and consequently, cancer [4,5,6]. Furthermore, stress-signaling neurotransmitters and mediators have been shown to directly contribute to cancer development [7,8]. The link between stress and food consumption is important to notice, considering the overlap between the pathways including the hypothalamic–pituitary–adrenal (HPA) axis that regulate stress and feeding responses [9]. One of its stimulators of secretion is acylated ghrelin (AG), which is the only known orexigenic hormone. Produced by neuroendocrine cells in the stomach and activated through acylation by the gut enzyme ghrelin O-acyl transferase (GOAT), it is capable of influencing short-term appetite regulation [10,11]. Increases in ghrelin plasma levels under acute and chronic psychosocial stress have been demonstrated in animal and human studies [12,13,14]. The type of stressor is decisive of the direction of ghrelin response. Metabolic and psychological stressors increase ghrelin blood levels while acute physical stressors decrease them. To what extent acute and chronic psychological stressors influence eating behavior is still a matter of investigation [15].
Eating behavior is also influenced by mood, emotions, and associated stress-coping mechanisms [16,17,18]. Research of eating behaviors and eating disorders often categorizes study participants into eating types, which are commonly restrained, emotional, and external eaters, although the concept of this categorization may be misleading. A meta-analysis by Evers et al., (2018) revealed that only restrained eaters show an actual increase in food consumption due to acute psychological stress [19]. In line with these findings, Bongers and Jansen (2016) reviewed that especially emotional eating questionnaires capture general concern about eating (i.e., overeating, pressure to eat healthily) rather than eating in response to emotions [20]. Most studies inconsistently report actual food intake and emotion induction in laboratory or real-life experiments. Therefore, results of eating behavior questionnaires may only be valid if scores either turn out very high or a combination of the right mood state (i.e., sadness or anger) with the right food cue (i.e., chocolate, chips) occurs in an individual [20]. A division into eating types may be futile. Consequently, a broader division into concerned and unconcerned (or less-concerned) eaters seems more advantageous [20].
Therefore, as multiple internal and external factors influence the desire to eat as well as the type and amount of food consumed, current studies should embrace multiple biological and psychological measures for a comprehensive insight into eating habits. To further explore the relationship between hunger and stress, we examined the effect of an acute psychosocial stressor on acylated ghrelin in male subjects of regular chronic stress exposure and concerned or unconcerned eating behavior. Heart rate, subjective hunger, and emotions were recorded to validate the psychosocial stressor used to induce acute stress. We hypothesized that chronically lower stressed individuals would display lower ghrelin results than higher stressed individuals. In addition, assessment and consideration of chronic stress exposure and eating behavior would yield different results than just assessment of acute stress response.

2. Results

2.1. Demographic Parameters

Sixteen healthy subjects (range 19–28 years) participated in the study. All participants were non-smokers, had various study backgrounds, declared less than 30 h work/week, and less than 10 h exercise/week. Half of the participants were accustomed to regular breakfast consumption. The average resting metabolic rate was calculated using the Mifflin–St. Jeor equation [21] (Table 1).

2.2. Baseline Eating Behavior Parameters

Analysis of the 24 h recalls showed that there was no significant difference between energy (Z = −0.72, p = 0.47; Table 1) and macronutrient intake (carbs: Z = −0.21, p = 0.84, fat: Z = −0.47, p = 0.64, protein: Z = −0.67, p = 0.50) for participants on both days preceding each study day.
Results of the Dutch Eating Behavior Questionnaire (DEBQ) showed that participants had significantly higher scores in the external eating scale versus the restrained eating (t(15) = −5.67, p < 0.001) and emotional eating scale (t(15) = −8.84, p < 0.001). There were no significant relationships between subscales (Table 2).
In line with the classification detailed in the methods section, 10 participants were considered less-concerned eaters and six participants were considered concerned eaters.
Additionally, no significant differences were found for ratings of hunger at baseline (08:00 a.m.) and at time point 3 (before starting testing) on either test or control day (baseline VAS: Z = −1.16, p = 0.24; time point 3: Z = −0.31, p = 0.75) (Table 1, Figure 1).

2.3. Baseline Psychological Parameters

Results from the Trier Inventory of Chronic Stress (TICS) analysis showed that eight participants were on the lower end (“low chronic stress”) of a normal, non-pathological chronic stress range, and eight participants were on the higher end (“high chronic stress”). There was no difference in stress exposure for working and non-working participants (F(1,14) = 1.24, p = 0.28) and for concerned and less-concerned eaters (F(1,14) = 0.00, p = 0.94) (Table 3).
Baseline ratings of positive and negative emotions (at 08:00 a.m.) on the study days were not significantly different for negative affect (Z = −1.22, p = 0.22), but they were significant for positive affect (Z = −2.67, p = 0.008) (Table 1). On average, participants rated the beginning of the test day 0.46 (±0.19) points higher than the beginning of the control day. Similarly, on both days, ratings before the start of testing (time point 3) were not significantly different for NA (Z = −1.35, p = 0.108) but for PA (Z = −2.17, p = 0.03). Participants were on average 0.33 (±017) times more positive before starting the test situation than the control situation (Table 1, Figure 2).

2.4. Change of Eating Behavior Parameters

There was no statistically significant difference in the overall area under the curve (AUC) for VAS hunger scores on test or control day (t (15) = 0.81, p = 0.43). When split into pre- and post-test phase (pre: time points 1–3, post: time points 4, 6, 8), both phases showed significant differences. During the pre-test phase, the VAS AUC for the control day was significantly higher than for the test day (t (14) = 2.21, p = 0.04). Seemingly, the difference was mainly caused by lower satiety ratings of the breakfast on the test day compared with the control day. Contrary, during the post-test phase, the VAS AUC for the test day was significantly higher than for the control day (t (16) = 2.23, p = 0.04) (Figure 1). We did not find any correlations between hunger ratings and AG values at any time point.

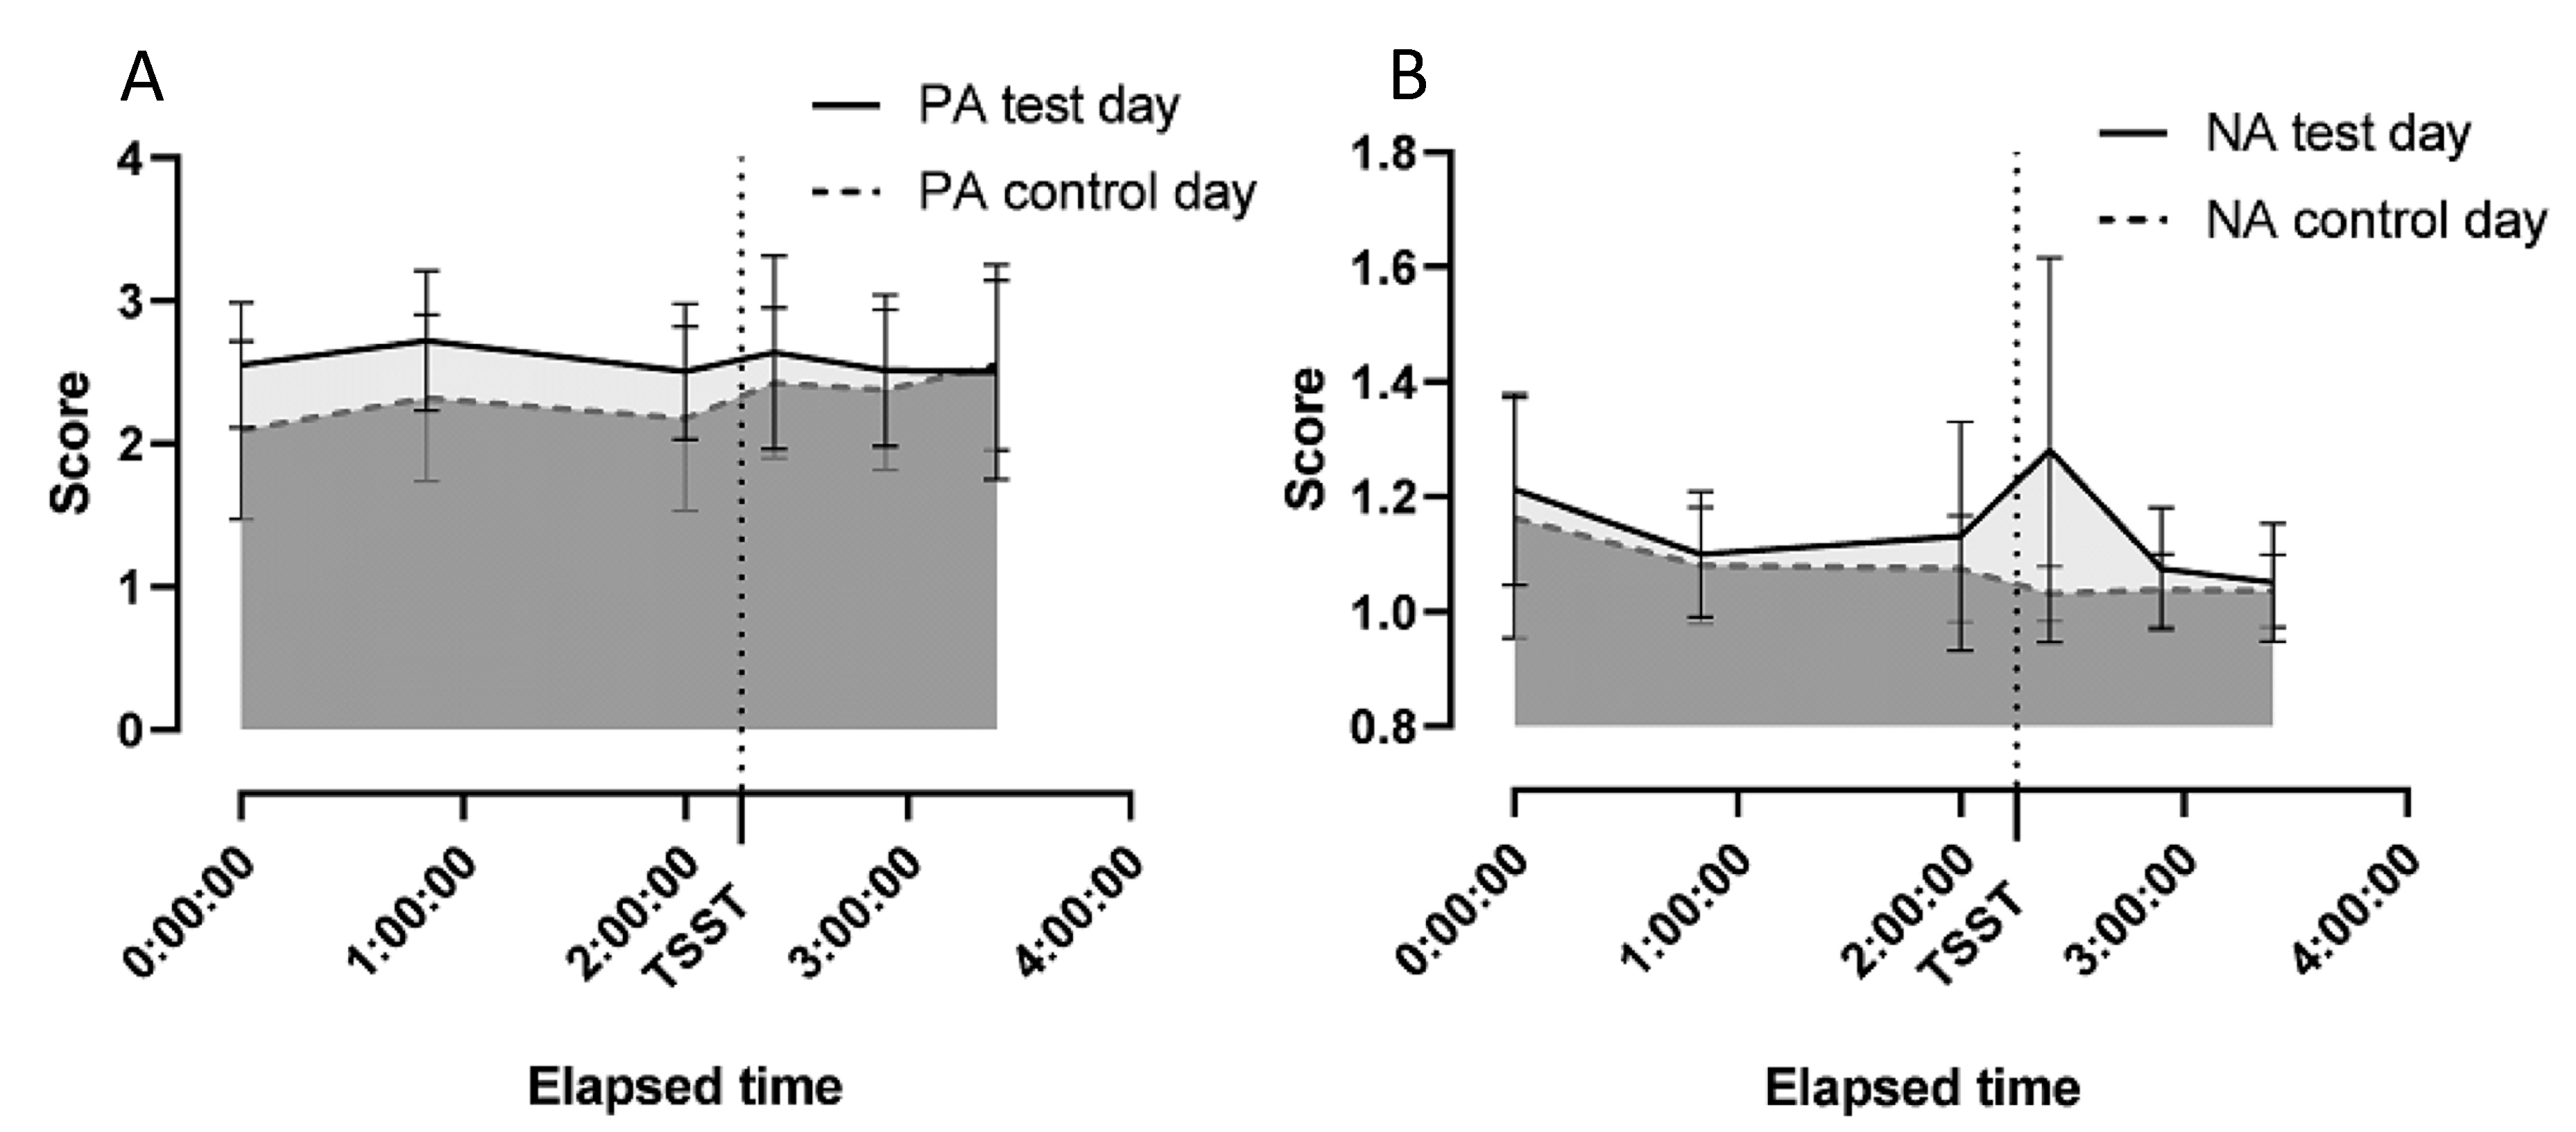
2.5. Change of Psychological Parameters

Overall, ratings of positive affect were higher than ratings of negative affect, and ratings on the test day were higher than ratings on the control day (Figure 2). There was a significant difference in AUC for negative affect (Z = −2.79, p = 0.005) but not for positive affect (t(15) = 1.60, p = 0.13) between the test and control day.

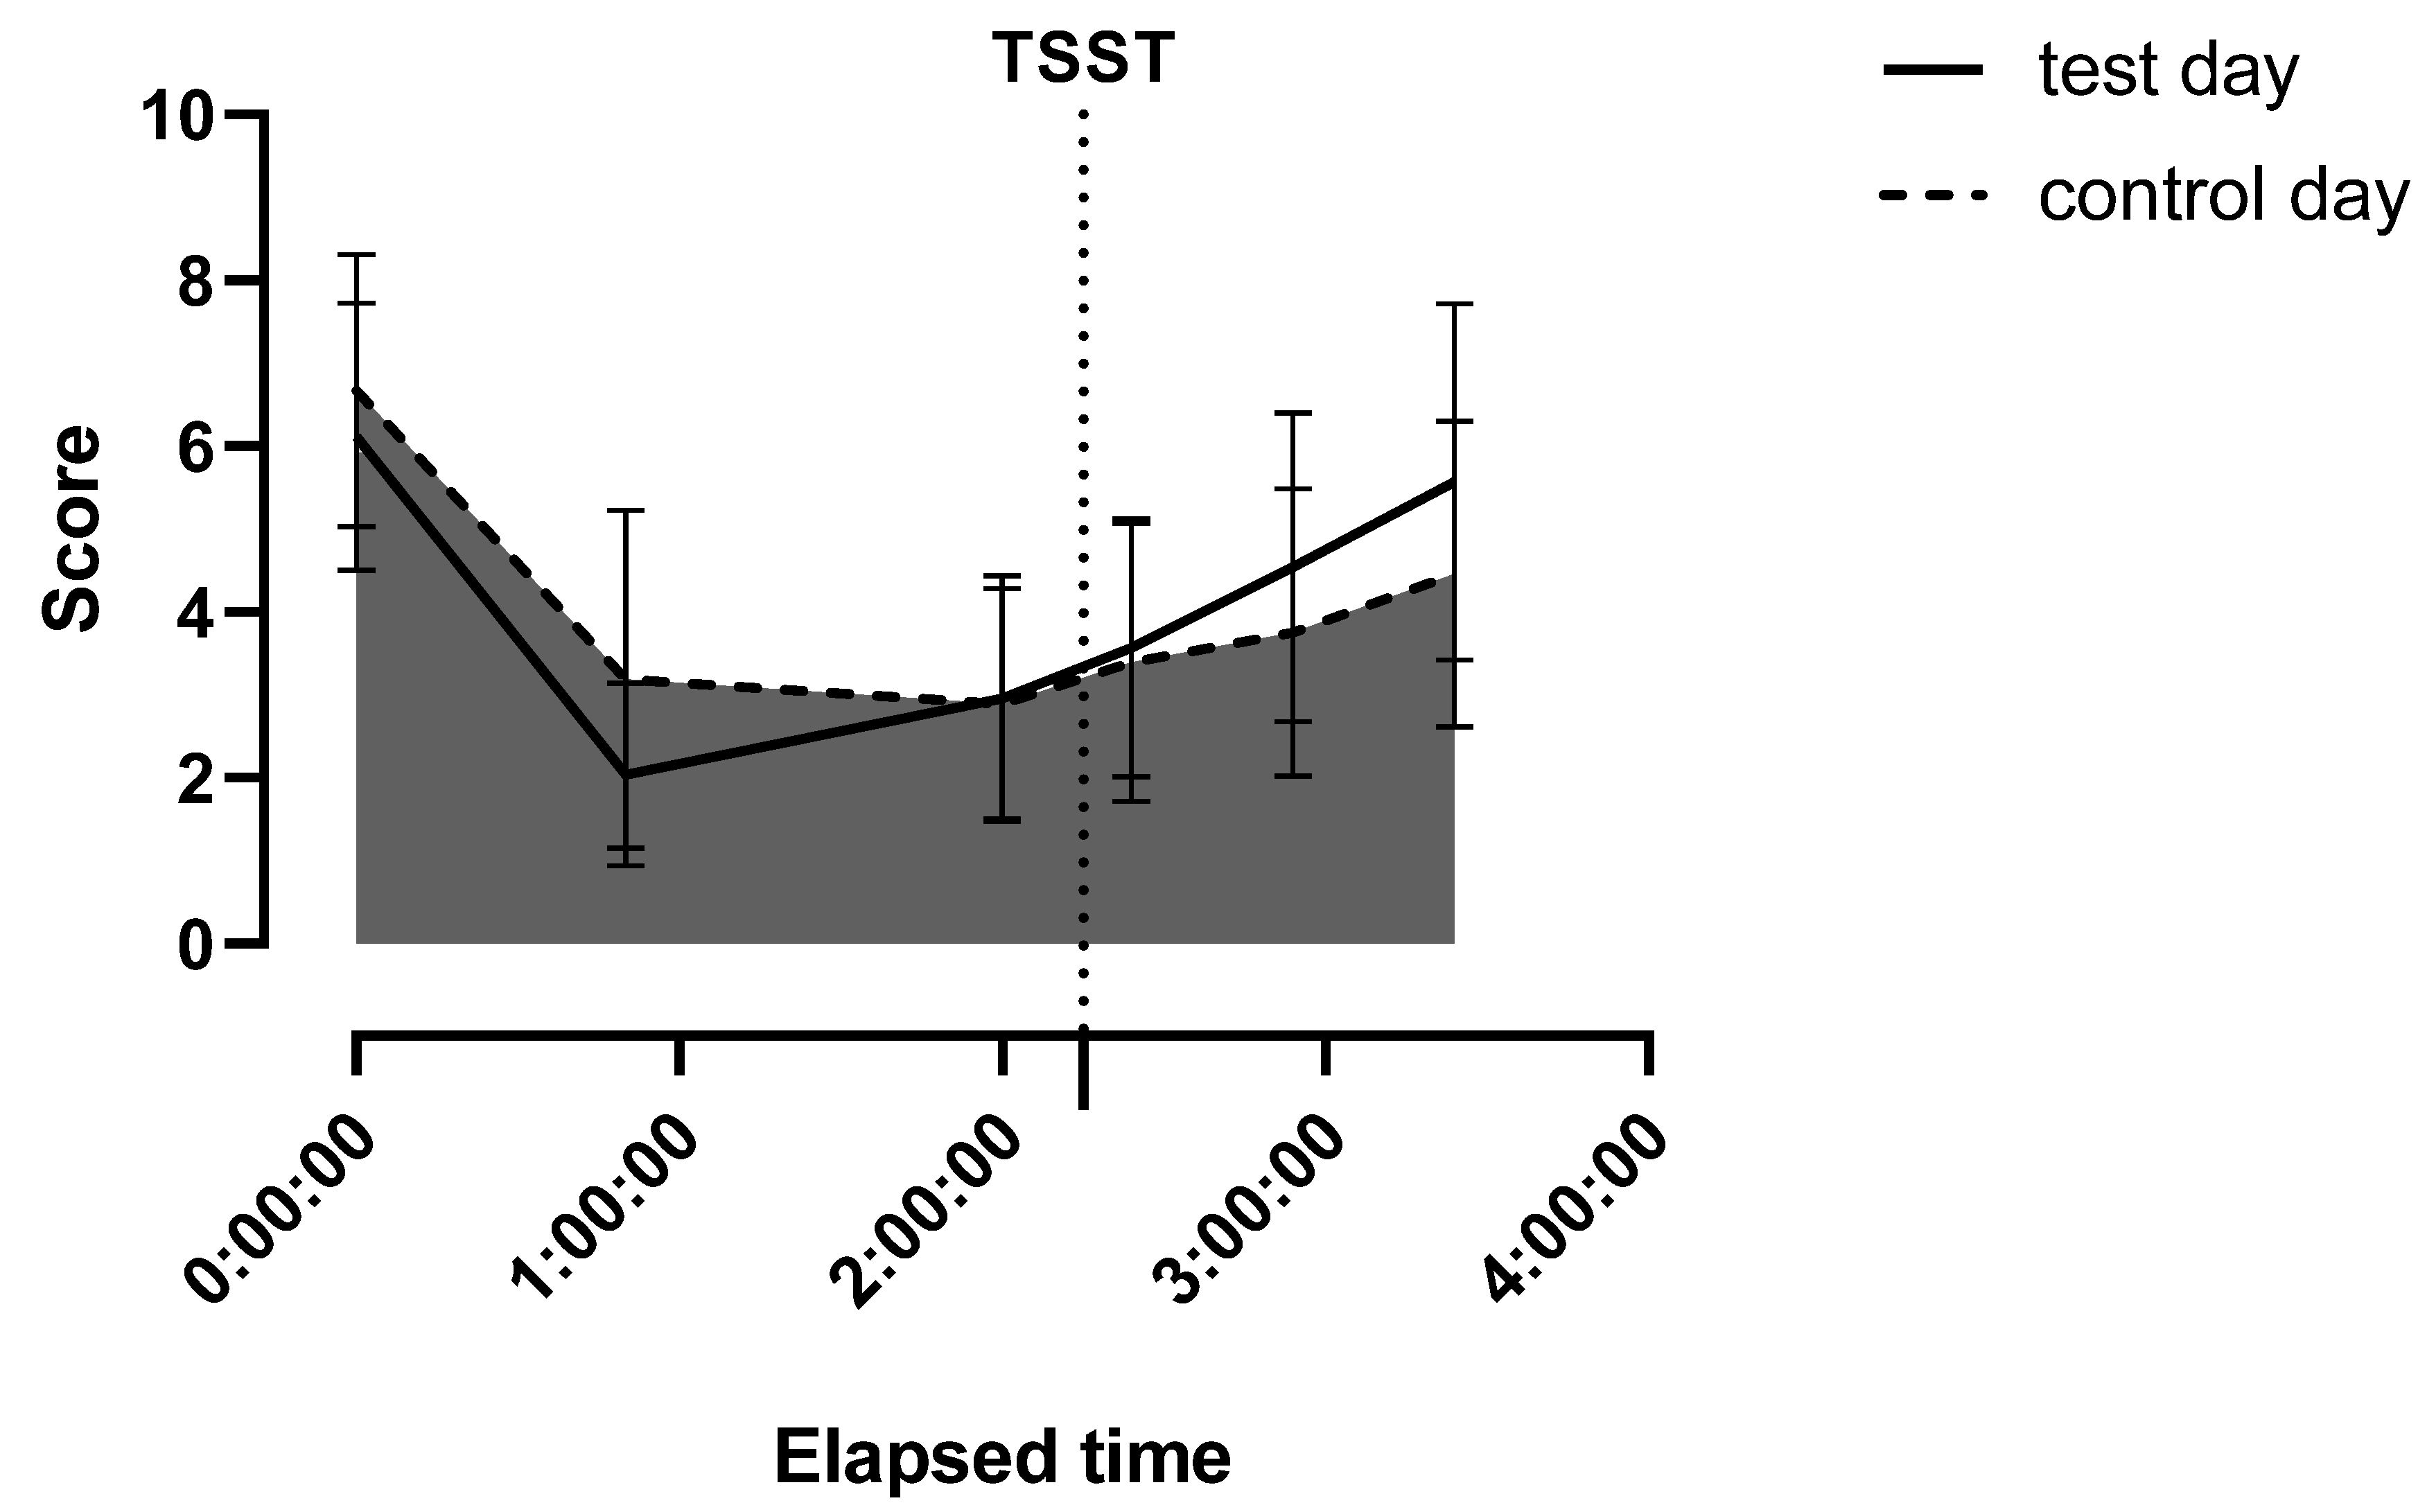
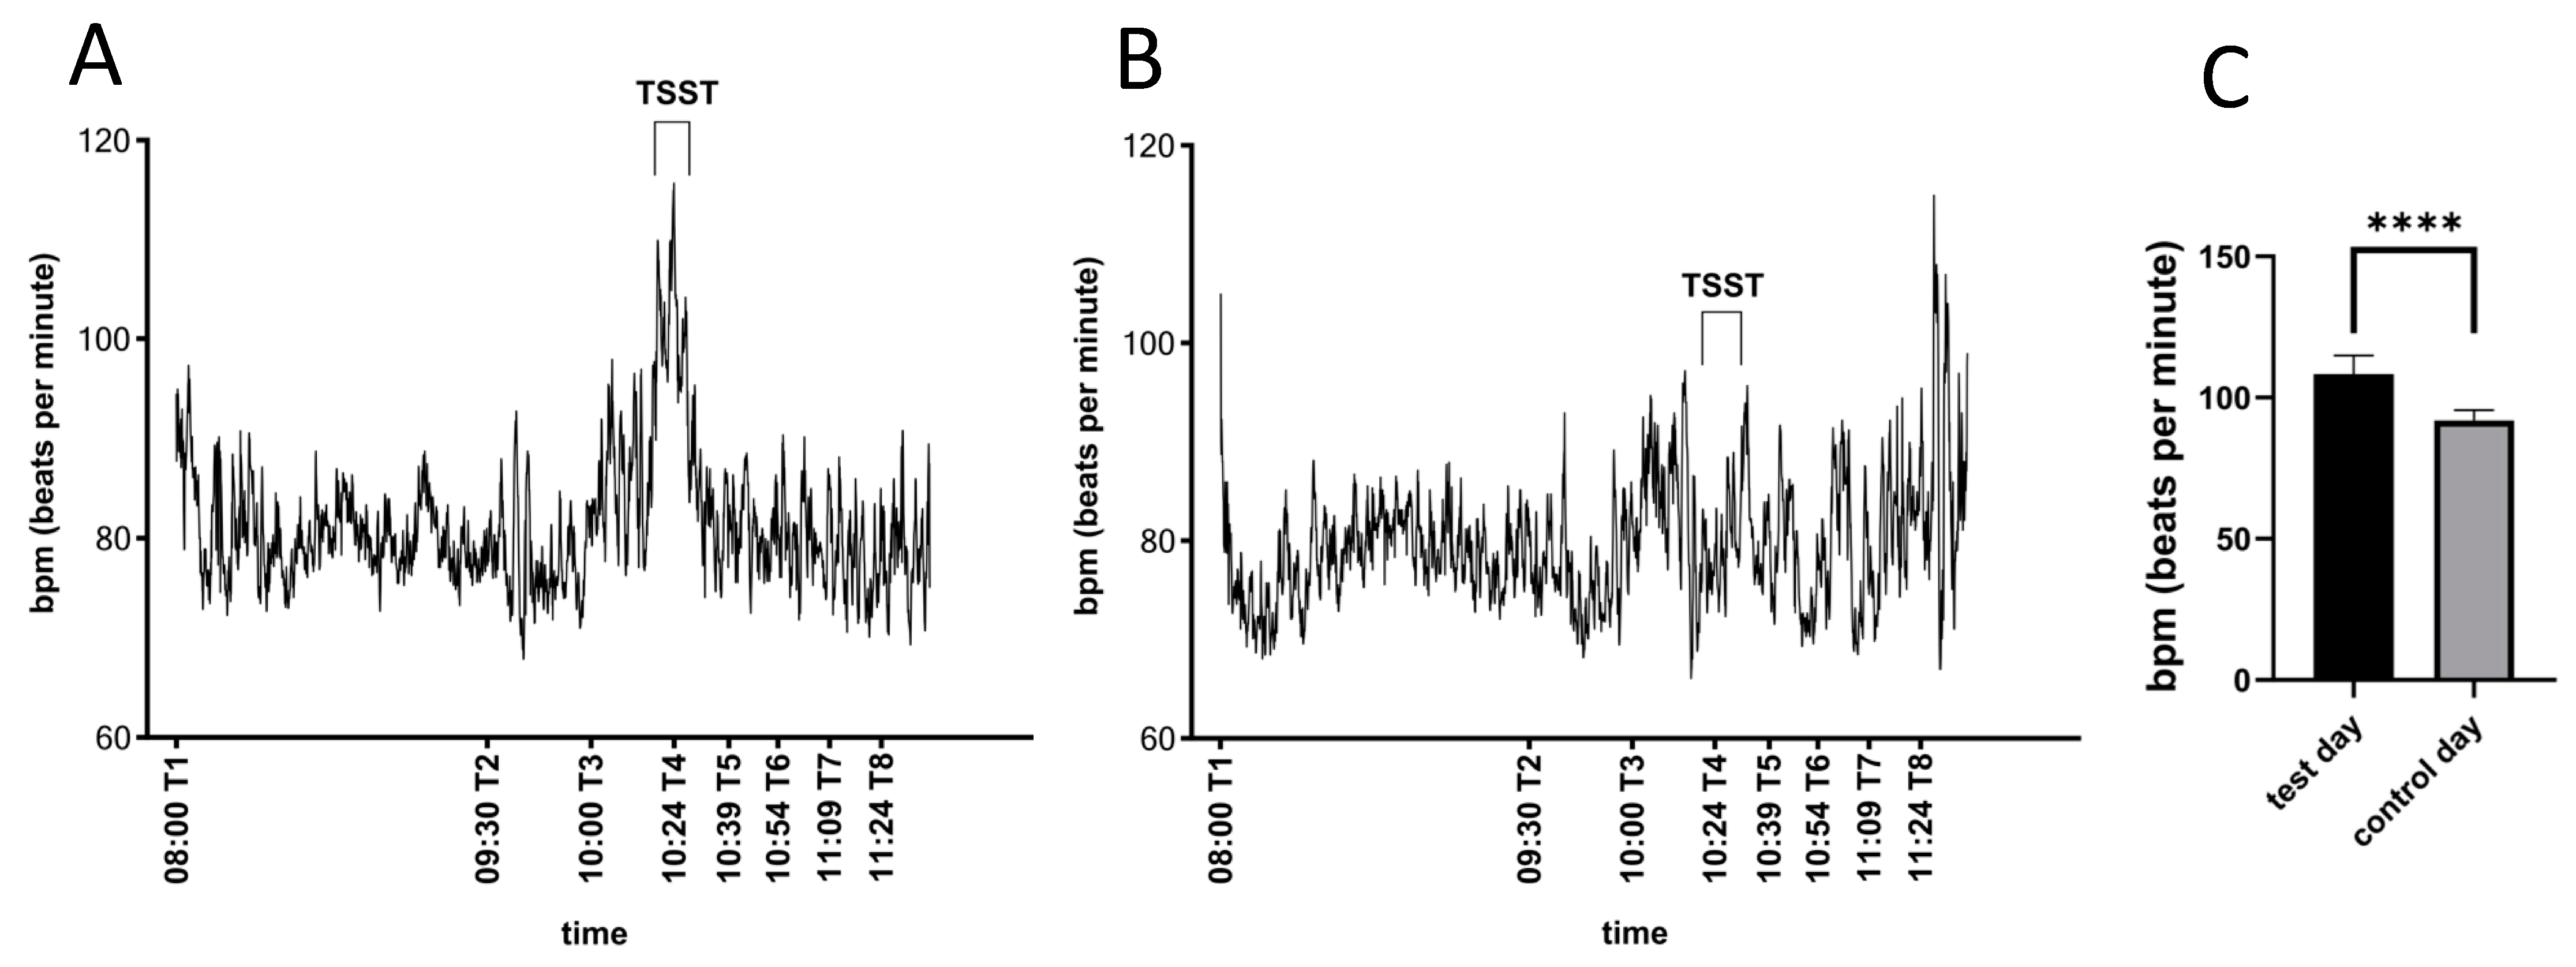
2.6. Change of Physiological Parameters

The Trier Social Stress Test (TSST-G) had a significant influence on heart ratings during testing. The AUC for the stress situation was larger (M = 1003, SD = 10.5) than the one for the control situation (M = 851, SD = 8.97). There was a significant difference in heart rate between the test and control day, Z = −9.10, p < 0.0001 (Figure 3A,B). The average heart rate during the TSST-G was 108.3 ± 6.67 bpm and 91.93 ± 3.62 bpm during the control-TSST-G (Figure 3C).

2.7. Effect of the TSST-G on Acylated Ghrelin

Figure 4 shows the acylated ghrelin values as measured according to the stress group on the test and control day. Table 4 lists the estimated acylated ghrelin levels as calculated by the linear mixed model. The estimates describe the influence of the respective participant’s characteristics on AG levels after stress or control testing. For n = 16 participants, 80 observations per day were used for linear mixed model (LMM) analysis. A significant effect on acylated ghrelin levels was found for the study-day*chronic-stress interaction (F(1,31.30) = 28.72; p < 0.001). There was no effect for the study-day*eating-concern interaction (p = 0.32). The study-day*chronic-stress interaction revealed that participants with lower chronic stress had higher estimated acylated ghrelin levels after acute stress exposure on the test day than participants with higher chronic stress levels. On the control day, estimated acylated ghrelin levels inverted, with participants with lower chronic stress showing lower acylated ghrelin levels than participants with higher chronic stress levels.

3. Discussion

The objective of this study was to elucidate the effect of acute psychosocial stress on the active form of the orexigenic hormone ghrelin. It also took into account the psychological factors of chronic stress exposure and eating behavior. We found that the level of chronic stress exposure but not the consideration of eating behavior affected acylated ghrelin levels after an acute stress encounter. There was a significant interaction for study-day*chronic-stress in our estimation model. Elevated chronic stress exposure was shown to lead to lower acylated ghrelin levels after an acute stress encounter than after facing a more relaxed situation. Contrary to this, individuals dealing with lower chronic stress exposure in their daily lives had higher acylated ghrelin levels after the stressful condition than the control condition. Our findings indicate that lower chronic stress exposure gave way to a stronger acute stress response in acylated ghrelin, while elevated chronic stress levels blunted acylated ghrelin response to the stressor. The opposite effect occurred on the control day with chronically lower stressed participants displaying lower acylated ghrelin levels than participants with higher chronic stress levels. Therefore, our results suggest that prolonged stress may lead to changes in acylated ghrelin response. It likely pictures changes in the threshold of stress induction. However, it may also indicate altered ghrelin sensitivity and adjustment of the active ghrelin levels to the current threshold of the sensitivity of ghrelin receptors. To our knowledge, no other study has assessed the effect of chronic and acute stress in humans on acylated ghrelin levels. Only one long-term study in humans reported results for total ghrelin levels and chronic stress exposure so far. Chao et al., (2017) assessed chronic stress level and total ghrelin in 339 adults, who were comparable in age and BMI to our sample, but predominantly female, over a 6-month period [22]. Results indicated that total ghrelin levels were associated with food cravings and reward-driven eating behaviors, but no significant relationship was found between chronic stress level and total ghrelin. In general, the assessment of chronic stress in human subjects remains challenging due to the multi-level nature of stress. Few long-term studies have effectively assessed the effect of chronic stress on ghrelin or other food-intake-related hormones. At present, we cannot fully explain the current predictive outcome, as we could not relate other hormonal measurements relevant within the stress–hunger interaction complex to the changes in acylated ghrelin. However, a closer look at the ghrelin–cortisol relationship may be explanative toward the reaction of chronically stressed individuals. Cortisol administration in human subjects has previously been demonstrated to increase acylated ghrelin levels and subsequent snack intake [23,24]. Increased cortisol responsiveness in animal models also demonstrated a greater tendency for weight gain and obesity [25]. In humans, chronic stress exposure together with morning cortisol levels has been predictive of weight gain [22]. Moreover, chronically stressed individuals have been shown to increase palatable food consumption, notably when blunted cortisol responses are recorded in acute stress situations [26,27]. Generally, acute stress has been found to either increase overall food intake or constitute a greater preference for certain food characteristics (e.g., sweet vs. savory vs. salty) [28,29,30,31]. Results from rodent studies show that a varying food composition (fat vs. glucose) can lead to adaptations of the HPA axis response to chronic stress. By increasing palatable food consumption, a downregulation of the acute stress response occurs, which in turn leads to long-term weight gain [32,33]. Nonetheless, this relationship remains to be fully validated in human subjects [34].
To ensure a similar nutrient basis in our participants, 24 h recalls were recorded underlining a similar nutrient uptake on the days before testing. Participants consumed comparable energy and macronutrient levels before both study days and additionally received identical meal servings on study days. Participants showed a tendency for higher scores on the DEBQ external eating scale. Higher scores on the external eating scale have previously been linked to higher scores on the emotional eating scale in overweight children, normal to overweight adolescents, and women [35,36,37]. We failed to see a correlation between the external and emotional eating scale in our sample (p > 0.05). Higher scores in the external eating subscale were not predictive of higher ratings in emotional eating or vice versa.
Therefore, for further analysis, we took a broader approach to eating behavior classification, dividing our sample into concerned and unconcerned eaters, as suggested by Bongers and Jansen (2016) in their review [20]. Ultimately, concerned and unconcerned eaters did not display significantly different acylated ghrelin values after stress or control exposure. Despite eating concern not affecting acylated ghrelin levels in our sample, this aspect of eating behavior should not be disregarded. Another way to describe concerned eaters is to label them as “stress-eaters”. Research has demonstrated that stress-eaters tend to consume more food after or during stress encounters than non-stress eaters. They also tend to consume less healthy and more palatable foods [38,39,40]. Paired with other measures, this classification may lead to further information regarding food consumption.
As expected, exposure to the stress condition increased the heart rate in participants more than exposure to the control condition. This is in accordance with the published effects of the TSST, which successfully induced stress in our participants [26,41]. Ratings for positive and negative affect also developed similarly as in other published work [42,43,44]. Negative affect scored lower than positive affect. Furthermore, stress rather than control testing induced a short increase in negative feelings, with levels quickly returning to pre-testing values thereafter.
Subjective ratings of hunger were shown to increase stress further than the control day in our sample. Despite participants receiving the same meal serving on both days, breakfast seemed to be less satiating on the stress day rather than the control day. In comparison, after stress versus control exposure, participants reported slightly increased hunger feelings, which we associated with the stress encounter rather than positive arousal as recorded through positive affect scores. Therefore, we expected to see subjective hunger ratings to rise and fall following acylated ghrelin levels. This has also been shown in at least two other studies, after an overnight fast in individuals with Prader–Willi Syndrome [45], and trained men after exercise and resting conditions followed by meal consumption [46]. Contrary to our assumption, there was no correlation between hunger ratings and acylated ghrelin levels in our sample. Correlation analysis was based on only three overlapping acylated ghrelin and subjective hunger measurements. Therefore, it is possible we did not capture changes accordingly.
In summary, we have shown that acute psychological stress response in acylated ghrelin is affected by the level of chronic stress exposure, even within a normal, non-pathological sample. Chronic and acute stress exposure together drive the intensity and direction of the acylated ghrelin response. Despite apparent differences and yet unsettled metabolic pathway interactions, the combination of psychological and physiological factors driving eating behavior offers new insight into a complex matter. Future research is warranted to examine these responses in a larger cohort and in overweight or obese subjects, especially in the context of eating behavior disorders.

4. Methods

4.1. Subjects

Eighteen young males were recruited through local and social media advertising. Sixteen participants (age < 35 years, BMI < 25 kg/m2) completed the study. Exclusion criteria were regular smoking, chronic medical disease, medication, and any food allergies or intolerances. Subjects were asked to abstain from alcohol consumption and physical exercise before each study day. Participants were asked to arrive fasted and rested at 08:00 a.m. and to consume their last meal on the previous day before 10:00 p.m. Previous studies have reported gender differences and influence of the menstrual circle on acylated ghrelin levels [47,48,49]. Therefore, we chose to conduct our study on male subjects only. All participants signed an informed consent form and were compensated for their participation.

4.2. Trier Social Stress Test (TSST)

The TSST is a standardized procedure to induce psychosocial stress in a laboratory environment. It was first developed by Kirschbaum et al., (1993) to test participants individually and was later adapted to test groups (TSST-G) of up to 6 participants simultaneously [41,50]. In line with the single-person version, the TSST-G consists of two stress-inducing tasks. The two tasks are a free speech about personal qualifications during a fake job interview and performing serial subtractions.
The control version of the TSST-G requires participants to read aloud a scientific text and asks them to perform serial additions. We adapted the settings on the control day to reading aloud a short story and counting backwards.
Previously, repeated exposure to the TSST has been found to reduce endocrine responses [51,52,53]. As we cannot exclude habituation affecting AG response and as we aimed to assess hormonal changes due to an acute stressor, we decided not to randomize the study days. This approach was also taken because of the within-subject design. Exposure to the TSST-G occurred on the first study day, and exposure to the control-TSST-G occurred on the second study day. Both days were scheduled exactly one week apart. Participants were informed about the repeated review of their cognitive competencies during the study. Further task explanation was only provided on each day at arrival and the preparation phase of the TSST-G. Participants were not aware that the first study day would contain a stressful situation or that the second study day was a controlled setting.

4.3. Study Design

Figure 5 depicts the timetable for both study days. Participants were tested in groups of three at each appointment. Upon arrival, they were instructed to put on a fitness band and heart rate belt and were asked not to interact with each other. The subjects were seated facing away from each other in a waiting room.
The first blood sample was taken at 08:00 a.m., after which participants received a visual analog scale to rate their feelings of hunger (VAS) and the positive affect negative affect scale (PANAS). At 08:30 a.m., a standardized breakfast was served. Subjects were instructed to eat the whole portion within 20 min.
The participants received the second round of VAS and PANAS after breakfast. During the waiting period until the beginning of testing, participants were also asked to fill out a 24 h recall questionnaire to check their food intake of the previous day.
The second blood sampling took place one hour after breakfast, and the third sampling was right before entering a separate testing room to start the (control) TSST-G. Right after testing, a fourth blood sample was drawn. Participants returned to the waiting room and were handed VAS and PANAS three more times during the remaining time. Until dismissal, four more blood samples were collected in 15-min intervals. The Dutch Eating Behavior Questionnaire or Trier Inventory of Chronic Stress were handed out once during the remaining hour.
The study design was approved by the ethics committee of the University of Vienna.

4.4. Breakfast Composition

A standardized high-fat high-protein breakfast was served on both days, approximately 600 kcal (53% fat, 18% carbs, 29% protein). Tea was offered with breakfast; non-sparkling water was offered unlimited. The study design allotted 3.5 h between breakfast and the end of study participation. Study participation ended roughly around 11:30 a.m., which is close to regular lunchtime. To better capture changes in AG levels due to acute stress rather than due to increasing hunger around lunchtime, the described breakfast composition was chosen. Carbohydrates typically offer quick and abundant satiety at consumption, while meals high in protein and fat provide longer satiety in comparison [54,55].

4.5. 24 h Recalls

Participants were instructed to fill out a 24 h recall questionnaire as previously used in the Austrian Food Report (“Österreichischer Ernährungsbericht”) to document their meal, snack, and fluid consumption of the previous day [56]. A photobook containing pictures of different foods and drinks in varying portion sizes was handed out alongside the questionnaire to facilitate completion and memorization. The recalls were collected by a standardized protocol using the GloboDiet software. The GloboDiet software was developed by the International Agency for Research on Cancer (IARC) within the European Investigation into Cancer and Nutrition Study (EPIC-Study) to standardize the recording of dietary data [57]. The data collected were analyzed using the current German food composition database (Bundenslebensmittelschlüssel) with adaptions to local foods [58].

4.6. Trier Inventory of Chronic Stress (TICS)

The TICS questionnaire was used to assess levels of chronic stress and covers the span of the previous 3 months [59]. The TICS distinguishes nine specific chronic-stress scales on a 5-point Likert scale.
The questionnaire was handed out once during either the first or second appointment. To divert participants into stress groups, we followed the method proposed by Schwabe et al. (2008) [60]. First, raw TICS scores were summed over all nine scales. Next, a median-split was applied, and values below the median were assigned to the “low chronic stress” group, and values above the median were assigned to the “high chronic stress” group. Comparable to Schwabe et al., we also tested healthy participants displaying chronic stress scores within normal, non-pathological ranges. Accordingly, groupings refer to the median of the present study and do not indicate low and high chronic stress in an absolute sense.

4.7. Dutch Eating Behavior Questionnaire (DEBQ)

The German version of the DEBQ, “Fragebogen zum Ernährungsverhalten” (FEV), by Grunert (1989) was used to assess eating behavior—restrained, emotional, and external [61,62]. Each scale consists of 10 items and is rated on a 5-point Likert scale. DEBQ with internal consistency Cronbach’s α = 0.80–0.95, FEV with internal consistency Cronbach’s α = 0.86–0.90. The questionnaire was handed out once at the first or second test appointment.
To enable the categorization of participants into “concerned eaters” and “less-concerned eaters”, we performed a median-split of every subscale. Participants with two or more values above each subscales’ median were labeled as concerned eaters; otherwise, they were labeled as less-concerned eaters.

4.8. Positive and Negative Affect Scale (PANAS)

The German version of PANAS by Breyer and Bluemke (2016) was used to record emotions throughout the experiment [63,64]. The questionnaire consists of 10 items per scale. Internal consistency English version Cronbach’s α = 0.88 PA, 0.87 NA; German version Cronbach’s α = 0.86 PA and NA. Scoring is achieved by summing up and averaging the responding items per scale. Higher scores represent a greater extent of affect.

4.9. Heart Rate Measurement

Upon arrival on each study day, participants were instructed to strap on a fitness watch and heart rate (HR) belt according to the manufacturer’s instructions (Garmin FR70, Garmin Ltd., Kansas, KS, USA). The devices collected HR data in 5-s intervals during the whole testing period.
The accuracy of heart rate measurements to monitor stress induction during TSST has been proven previously [41,42,50]. Therefore, we selected 5 random subjects for paired HR measurements. In all measurements, increases in heart rate were visible at the times of blood sampling and during test and control situations on both days. An interval of 09:15 min during test and control exposure was chosen for all participants to offer an equal amount of data points for the calculation of the area under the curve.

4.10. Blood Sampling and Analysis

All blood sampling was done in a separate room by a medical doctor next to the waiting and testing rooms. To avoid stress induction due to repeated single-draw blood sampling, a venous catheter was inserted into participants’ non-dominant arm at the first sampling time until dismissal.
Blood samples were collected in 4 mL K3EDTA tubes (Greiner Bio-One, Kremsmünster, Austria; 1.2–2 mg EDTA/mL) and immediately aliquoted into chilled low binding microtubes (Sarstedt, Nümbrecht, Germany). For the measurement of acylated ghrelin, 10 μL aprotinin (5 mg/mL), 10 μL DPP-IV (10μL/mL), 10 μL EDTA (0.5 M, pH 7.85), and 10 μL 10% v/v HCl were added to whole blood aliquots. Then, aliquots were centrifuged (15 min, 10.000× g, 4 °C). Afterward, plasma was transferred to a new set of low binding microtubes, snap-frozen in liquid nitrogen, and stored at −80 °C until analysis. Acylated ghrelin was measured by ELISA (#EZGRA-88K, EMD Millipore, Billerica, MA, USA).

4.11. Data Analysis

Statistical analyses were performed using SPSS v26.0 (SPSS Inc., Chicago, IL, USA) and Prism v8.0 (GraphPad Software Inc., La Jolla, CA, USA). All area under the curve (AUC) values were calculated using the trapezoid method. A Wilcoxon signed-rank test was used to compare energy and macronutrient intake before study days and to compare the following values between study days: hunger ratings at arrival (8:00 a.m.) and before testing (time point 3), PANAS ratings at arrival (8:00 a.m.), AUCs of PANAS, and AUC of heart rate. A paired samples t-test was used to test for differences among DEBQ subscales. Pearson correlation was used to assess the relationship of DEBQ subscales among each other. One-way ANOVA was used to analyze stress exposure for levels of work commitment and eating concern and to compare AUC for VAS. A linear mixed model (LMM) was used for analyzing the effect of chronic stress exposure and eating concern on the changes in ghrelin levels after (control) TSST-G. The differential effects of chronic stress and eating concern were represented by interaction terms. Linear mixed-effects models allow for variability between participants (heterogeneity) while also adjusting for within-subject correlation. Day, chronic stress, eating concern, as well as study-day*chronic-stress and study-day*eating-concern interactions were entered as fixed effects in the model. Subject and intercept were entered as random effects. Model regression coefficients are reported together with their 95% CI. Unless indicated otherwise, results are given as mean ± SD. Results are considered statistically significant if p < 0.05.

Author Contributions

Conceptualization, C.F.-V., K.D., and J.K.; methodology, C.F.-V. and K.D.; analysis, C.F.-V.; data curation, C.F.-V.; writing—original draft preparation, C.F.-V.; writing—review and editing, K.D. and J.K.; visualization, C.F.-V.; supervision, J.K. All authors have read and agreed to the published version of the manuscript.

Funding

This research was funded by Hochschuljubiläumsstiftung der Stadt Wien, grant number H-268491/2016.

Institutional Review Board Statement

The study was conducted according to the guidelines of the Declaration of Helsinki, and approved by the Institutional Ethics Committee of the University of Vienna (reference number 00228, approved 23 March 2017).

Informed Consent Statement

Informed consent was obtained from all subjects involved in the study.

Data Availability Statement

Datasets are available on request. The raw data supporting the conclusions of this manuscript will be made available by the authors, without undue reservation, to any qualified researcher.

Acknowledgments

We thank Valerie Gallistl, Maja Konstantiniuk, Alessia Pedalino, and Romana Ruth for assisting with participant recruitment and data acquisition. We are also grateful to Open Access Funding by the University of Vienna.

Conflicts of Interest

The authors declare no conflict of interest.

References

  1. Almeida, D.M.; Charles, S.T.; Mogle, J.; Drewelies, J.; Aldwin, C.M.; Spiro, A.; Gerstorf, D. Charting adult development through (historically changing) daily stress processes. Am. Psychol. 2020, 75, 511–524. [Google Scholar] [CrossRef] [PubMed]
  2. Ulrich-Lai, Y.M.; Fulton, S.; Wilson, M.; Petrovich, G.; Rinaman, L. Stress exposure, food intake and emotional state. Stress 2015, 18, 381–399. [Google Scholar] [CrossRef] [PubMed]
  3. Sinha, R. Role of addiction and stress neurobiology on food intake and obesity. Biol. Psychol. 2018, 131, 5–13. [Google Scholar] [CrossRef]
  4. Sinha, R.; Jastreboff, A.M. Stress as a Common Risk Factor for Obesity and Addiction. Biol. Psychiatry 2013, 73, 827–835. [Google Scholar] [CrossRef] [PubMed] [Green Version]
  5. Yau, Y.H.; Potenza, M.N. Stress and eating behaviors. Minerva Endocrinol. 2013, 38, 255–267. [Google Scholar]
  6. De Pergola, G.; Silvestris, F. Obesity as a Major Risk Factor for Cancer. J. Obes. 2013, 2013, 1–11. [Google Scholar] [CrossRef] [Green Version]
  7. Barbieri, A.; Bimonte, S.; De Palma, G.; Luciano, A.; Rea, D.; Giudice, A.; Scognamiglio, G.; La Mantia, E.; Franco, R.; Perdonà, S.; et al. The stress hormone norepinephrine increases migration of prostate cancer cells in vitro and in vivo. Int. J. Oncol. 2015, 47, 527–534. [Google Scholar] [CrossRef] [PubMed] [Green Version]
  8. Barbieri, A.; Palma, G.; Rosati, A.; Giudice, A.; Falco, A.; Petrillo, A.; Petrillo, M.; Bimonte, S.; Di Benedetto, M.; Esposito, G.; et al. Role of endothelial nitric oxide synthase (eNOS) in chronic stress-promoted tumour growth. J. Cell. Mol. Med. 2011, 16, 920–926. [Google Scholar] [CrossRef] [PubMed]
  9. Nieuwenhuizen, A.G.; Rutters, F. The hypothalamic-pituitary-adrenal-axis in the regulation of energy balance. Physiol. Behav. 2008, 94, 169–177. [Google Scholar] [CrossRef] [PubMed]
  10. Kojima, M.; Kangawa, K. Ghrelin: Structure and Function. Physiol. Rev. 2005, 85, 495–522. [Google Scholar] [CrossRef]
  11. Kojima, M.; Hosoda, H.; Date, Y.; Nakazato, M.; Matsuo, H.; Kangawa, K. Ghrelin is a growth-hormone-releasing acylated peptide from stomach. Nat. Cell Biol. 1999, 402, 656–660. [Google Scholar] [CrossRef] [PubMed]
  12. Kristenssson, E.; Sundqvist, M.; Astin, M.; Kjerling, M.; Mattsson, H.; de la Cour, C.D.; Håkanson, R.; Lindström, E. Acute psychological stress raises plasma ghrelin in the rat. Regul. Pept. 2006, 134, 114–117. [Google Scholar] [CrossRef] [PubMed]
  13. Rouach, V.; Bloch, M.; Rosenberg, N.; Gilad, S.; Limor, R.; Stern, N.; Greenman, Y. The acute ghrelin response to a psychological stress challenge does not predict the post-stress urge to eat. Psychoneuroendocrinology 2007, 32, 693–702. [Google Scholar] [CrossRef] [PubMed]
  14. Chuang, J.-C.; Perello, M.; Sakata, I.; Osborne-Lawrence, S.; Savitt, J.M.; Lutter, M.; Zigman, J.M. Ghrelin mediates stress-induced food-reward behavior in mice. J. Clin. Investig. 2011, 121, 2684–2692. [Google Scholar] [CrossRef] [PubMed]
  15. Stengel, A.; Wang, L.; Taché, Y. Stress-related alterations of acyl and desacyl ghrelin circulating levels: Mechanisms and functional implications. Peptides 2011, 32, 2208–2217. [Google Scholar] [CrossRef] [Green Version]
  16. Macht, M. How emotions affect eating: A five-way model. Appetite 2008, 50, 1–11. [Google Scholar] [CrossRef] [PubMed]
  17. Evers, C.; Stok, F.M.; De Ridder, D.T.D. Feeding Your Feelings: Emotion Regulation Strategies and Emotional Eating. Pers. Soc. Psychol. Bull. 2010, 36, 792–804. [Google Scholar] [CrossRef] [Green Version]
  18. Taut, D.; Renner, B.; Baban, A. Reappraise the Situation but Express Your Emotions: Impact of Emotion Regulation Strategies on ad libitum Food Intake. Front. Psychol. 2012, 3, 359. [Google Scholar] [CrossRef] [Green Version]
  19. Evers, C.; Dingemans, A.; Junghans, A.F.; Boevé, A. Feeling bad or feeling good, does emotion affect your consumption of food? A meta-analysis of the experimental evidence. Neurosci. Biobehav. Rev. 2018, 92, 195–208. [Google Scholar] [CrossRef] [PubMed]
  20. Bongers, P.; Jansen, A. Emotional Eating Is Not What You Think It Is and Emotional Eating Scales Do Not Measure What You Think They Measure. Front. Psychol. 2016, 7. [Google Scholar] [CrossRef] [Green Version]
  21. Mifflin, M.D.; St Jeor, S.T.; Hill, L.A.; Scott, B.J.; Daugherty, S.A.; Koh, Y.O. A new predictive equation for resting energy expenditure in healthy individuals. Am. J. Clin. Nutr. 1990, 51, 241–247. [Google Scholar] [CrossRef]
  22. Chao, A.M.; Jastreboff, A.M.; White, M.A.; Grilo, C.M.; Sinha, R. Stress, cortisol, and other appetite-related hormones: Prospective prediction of 6-month changes in food cravings and weight. Obesity 2017, 25, 713–720. [Google Scholar] [CrossRef] [PubMed] [Green Version]
  23. George, S.A.; Khan, S.; Briggs, H.; Abelson, J.L. CRH-stimulated cortisol release and food intake in healthy, non-obese adults. Psychoneuroendocrinology 2010, 35, 607–612. [Google Scholar] [CrossRef] [PubMed] [Green Version]
  24. Azzam, I.; Gilad, S.; Limor, R.; Stern, N.; Greenman, Y. Ghrelin stimulation by hypothalamic–pituitary–adrenal axis activation depends on increasing cortisol levels. Endocr. Connect. 2017, 6, 847–855. [Google Scholar] [CrossRef] [PubMed] [Green Version]
  25. Hewagalamulage, S.; Lee, T.; Clarke, I.; Henry, B. Stress, cortisol, and obesity: A role for cortisol responsiveness in identifying individuals prone to obesity. Domest. Anim. Endocrinol. 2016, 56, S112–S120. [Google Scholar] [CrossRef]
  26. Tomiyama, A.J.; Dallman, M.F.; Epel, E.S. Comfort food is comforting to those most stressed: Evidence of the chronic stress response network in high stress women. Psychoneuroendocrinology 2011, 36, 1513–1519. [Google Scholar] [CrossRef] [Green Version]
  27. Tryon, M.; DeCant, R.; Laugero, K. Having your cake and eating it too: A habit of comfort food may link chronic social stress exposure and acute stress-induced cortisol hyporesponsiveness. Physiol. Behav. 2013, 114–115, 32–37. [Google Scholar] [CrossRef]
  28. Epel, E.; Lapidus, R.; McEwen, B.; Brownell, K. Stress may add bite to appetite in women: A laboratory study of stress-induced cortisol and eating behavior. Psychoneuroendocrinology 2001, 26, 37–49. [Google Scholar] [CrossRef]
  29. Zellner, D.A.; Loaiza, S.; Gonzalez, Z.; Pita, J.; Morales, J.; Pecora, D.; Wolf, A. Food selection changes under stress. Physiol. Behav. 2006, 87, 789–793. [Google Scholar] [CrossRef]
  30. Heatherton, T.F.; Herman, C.P.; Polivy, J. Effects of physical threat and ego threat on eating behavior. J. Pers. Soc. Psychol. 1991, 60, 138–143. [Google Scholar] [CrossRef]
  31. Habhab, S.; Sheldon, J.P.; Loeb, R.C. The relationship between stress, dietary restraint, and food preferences in women. Appetite 2009, 52, 437–444. [Google Scholar] [CrossRef]
  32. Tannenbaum, B.M.; Brindley, D.N.; Tannenbaum, G.S.; Dallman, M.F.; McArthur, M.D.; Meaney, M.J. High-fat feeding alters both basal and stress-induced hypothalamic-pituitary-adrenal activity in the rat. Am. J. Physiol. Content 1997, 273, E1168–E1177. [Google Scholar] [CrossRef] [PubMed]
  33. Ulrich-Lai, Y.M.; Christiansen, A.M.; Ostrander, M.M.; Jones, A.A.; Jones, K.R.; Choi, D.C.; Krause, E.G.; Evanson, N.K.; Furay, A.R.; Davis, J.F.; et al. Pleasurable behaviors reduce stress via brain reward pathways. Proc. Natl. Acad. Sci. USA 2010, 107, 20529–20534. [Google Scholar] [CrossRef] [Green Version]
  34. Harris, R.B.S. Chronic and acute effects of stress on energy balance: Are there appropriate animal models? Am. J. Physiol. Integr. Comp. Physiol. 2015, 308, R250–R265. [Google Scholar] [CrossRef] [Green Version]
  35. Snoek, H.M.; Engels, R.C.; van Strien, T.; Otten, R. Emotional, external and restrained eating behaviour and BMI trajectories in adolescence. Appetite 2013, 67, 81–87. [Google Scholar] [CrossRef]
  36. Jansen, A.; Nederkoorn, C.; Roefs, A.; Bongers, P.; Teugels, T.; Havermans, R. The proof of the pudding is in the eating: Is the DEBQ—External eating scale a valid measure of external eating? Int. J. Eat. Disord. 2010, 44, 164–168. [Google Scholar] [CrossRef] [PubMed]
  37. Hirsch, O.; Kluckner, V.J.; Brandt, S.; Moss, A.; Weck, M.; Florath, I.; Wabitsch, M.; Hebebrand, J.; Schimmelmann, B.G.; Christiansen, H. Restrained and External-Emotional Eating Patterns in Young Overweight Children–Results of the Ulm Birth Cohort Study. PLoS ONE 2014, 9, e105303. [Google Scholar] [CrossRef] [Green Version]
  38. Adam, T.C.; Epel, E.S. Stress, eating and the reward system. Physiol. Behav. 2007, 91, 449–458. [Google Scholar] [CrossRef] [PubMed]
  39. Groesz, L.M.; McCoy, S.; Carl, J.; Saslow, L.; Stewart, J.; Adler, N.; Laraia, B.; Epel, E. What is eating you? Stress and the drive to eat. Appetite 2012, 58, 717–721. [Google Scholar] [CrossRef] [Green Version]
  40. Kistenmacher, A.; Goetsch, J.; Ullmann, D.; Wardzinski, E.K.; Melchert, U.H.; Jauch-Chara, K.; Oltmanns, K.M. Psychosocial stress promotes food intake and enhances the neuroenergetic level in men. Stress 2018, 21, 538–547. [Google Scholar] [CrossRef] [PubMed]
  41. Kirschbaum, C.; Pirke, K.-M.; Hellhammer, D.H. The ‘Trier Social Stress Test’—A Tool for Investigating Psychobiological Stress Responses in a Laboratory Setting. Neuropsychobiology 1993, 28, 76–81. [Google Scholar] [CrossRef]
  42. Henze, G.-I.; Zänkert, S.; Urschler, D.F.; Hiltl, T.J.; Kudielka, B.M.; Pruessner, J.C.; Wüst, S. Testing the ecological validity of the Trier Social Stress Test: Association with real-life exam stress. Psychoneuroendocrinology 2017, 75, 52–55. [Google Scholar] [CrossRef] [Green Version]
  43. Pabst, S.; Brand, M.; Wolf, O.T. Stress effects on framed decisions: There are differences for gains and losses. Front. Behav. Neurosci. 2013, 7, 142. [Google Scholar] [CrossRef] [Green Version]
  44. Wemm, S.E.; Wulfert, E. Effects of Acute Stress on Decision Making. Appl. Psychophysiol. Biofeedback 2017, 42, 1–12. [Google Scholar] [CrossRef] [Green Version]
  45. DelParigi, A.; Tschöp, M.; Heiman, M.L.; Salbe, A.D.; Vozarova, B.; Sell, S.M.; Bunt, J.C.; Tataranni, P.A. High Circulating Ghrelin: A Potential Cause for Hyperphagia and Obesity in Prader-Willi Syndrome. J. Clin. Endocrinol. Metab. 2002, 87, 5461–5464. [Google Scholar] [CrossRef] [PubMed] [Green Version]
  46. Vatansever-Ozen, S.; Tiryaki-Sonmez, G.; Bugdayci, G.; Ozen, G. The Effects of Exercise on Food Intake and Hunger: Relationship with Acylated Ghrelin and Leptin. J. Sports Sci. Med. 2011, 10, 283–291. [Google Scholar] [PubMed]
  47. Abu-Farha, M.; Dehbi, M.; Noronha, F.; Tiss, A.; Alarouj, M.; Behbehani, K.; Bennakhi, A.; Elkum, N. Gender Differences in Ghrelin Association with Cardiometabolic Risk Factors in Arab Population. Int. J. Endocrinol. 2014, 2014, 1–8. [Google Scholar] [CrossRef] [PubMed]
  48. Barkan, A.L.; Dimaraki, E.V.; Jessup, S.K.; Symons, K.V.; Ermolenko, M.; Jaffe, C.A. Ghrelin Secretion in Humans Is Sexually Dimorphic, Suppressed by Somatostatin, and Not Affected by the Ambient Growth Hormone Levels. J. Clin. Endocrinol. Metab. 2003, 88, 2180–2184. [Google Scholar] [CrossRef] [Green Version]
  49. Sakao, Y.; Ohashi, N.; Sugimoto, M.; Ichikawa, H.; Sahara, S.; Tsuji, T.; Kato, A.; Fujigaki, Y.; Sugimoto, K.; Furuta, T.; et al. Gender Differences in Plasma Ghrelin Levels in Hemodialysis Patients. Ther. Apher. Dial. 2019, 23, 65–72. [Google Scholar] [CrossRef]
  50. Von Dawans, B.; Kirschbaum, C.; Heinrichs, M. The Trier Social Stress Test for Groups (TSST-G): A new research tool for controlled simultaneous social stress exposure in a group format. Psychoneuroendocrinology 2011, 36, 514–522. [Google Scholar] [CrossRef]
  51. Wüst, S.; Federenko, I.S.; Van Rossum, E.F.; Koper, J.W.; Hellhammer, D.H. Habituation of cortisol responses to repeated psychosocial stress—further characterization and impact of genetic factors. Psychoneuroendocrinology 2005, 30, 199–211. [Google Scholar] [CrossRef] [PubMed]
  52. Kirschbaum, C.; Prussner, J.C.; Stone, A.A.; Federenko, I.; Gaab, J.; Lintz, D.; Schommer, N.; Hellhammer, D.H. Persistent High Cortisol Responses to Repeated Psychological Stress in a Subpopulation of Healthy Men. Psychosom. Med. 1995, 57, 468–474. [Google Scholar] [CrossRef] [PubMed]
  53. Kudielka, B.M.; von Känel, R.; Preckel, D.; Zgraggen, L.; Mischler, K.; Fischer, J.E. Exhaustion is associated with reduced habituation of free cortisol responses to repeated acute psychosocial stress. Biol. Psychol. 2006, 72, 147–153. [Google Scholar] [CrossRef]
  54. Paddon-Jones, D.; Westman, E.; Mattes, R.D.; Wolfe, R.R.; Astrup, A.; Westerterp-Plantenga, M. Protein, weight management, and satiety. Am. J. Clin. Nutr. 2008, 87, 1558S–1561S. [Google Scholar] [CrossRef] [PubMed] [Green Version]
  55. Chambers, L.; McCrickerd, K.; Yeomans, M.R. Optimising foods for satiety. Trends Food Sci. Technol. 2015, 41, 149–160. [Google Scholar] [CrossRef] [Green Version]
  56. Rust, P.; Hasenegger, V.; König, J. Österreichischer Ernährungsberich 2017; Wien, Universität Wien und Bundesministerium für Gesundheit und Frauen: Vienna, Austria, 2017. [Google Scholar]
  57. Slimani, N.; Ferrari, P.; Ocké, M.; Welch, A.; Boeing, H.; Van Liere, M.; Pala, V.; Amiano, P.; Lagiou, A.; Mattisson, I.; et al. Standardization of the 24-h diet recall calibration method used in the European Prospective Investigation into Cancer and Nutrition (EPIC): General concepts and preliminary results. Eur. J. Clin. Nutr. 2000, 54, 900–917. [Google Scholar] [CrossRef] [PubMed]
  58. Hoffmann, I.; Hartmann, B.; Grotz, A.; Stang, K. Max Rubner-Institut-Bundesforschungsinstitut Für Ernährung und Lebensmittel (MRI) Bundeslebensmittelschlüssel (BLS)-Version 3.02 2010. Available online: https://www.nutritional-software.at/assets/downloads/550fe483/bls_3.0_handbuch.pdf (accessed on 8 October 2018).
  59. Schulz, P.; Schlotz, W.; Becker, P. Trierer Inventar Zum Chronischen Stress (TICS): Trier Inventory for Chronic Stress (TICS); Hogrefe: Göttingen, Germany, 2004. [Google Scholar]
  60. Schwabe, L.; Dalm, S.; Schächinger, H.; Oitzl, M.S. Chronic stress modulates the use of spatial and stimulus-response learning strategies in mice and man. Neurobiol. Learn. Mem. 2008, 90, 495–503. [Google Scholar] [CrossRef]
  61. van Strien, T.; Frijters, J.; Bergers, G.; Defares, P. The Dutch Eating Behavior Questionnaire (DEBQ) for assessment of restrained, emotional, and external eating behavior. Int. J. Eat. Disord. 1986, 5, 295–315. [Google Scholar] [CrossRef]
  62. Grunert, S. Ein Inventar zur Erfassung von Selbstaussagen zum Ernährungsverhalten. Diagnostica 1989, 31, 167–179. [Google Scholar]
  63. Watson, D.; Clark, L.A.; Tellegen, A. Development and validation of brief measures of positive and negative affect: The PANAS scales. J. Pers. Soc. Psychol. 1988, 54, 1063–1070. [Google Scholar] [CrossRef]
  64. Breyer, B.; Bluemke, M. Deutsche Version der Positive and Negative Affect Schedule PANAS (GESIS Panel); ZIS—GESIS Leibniz Institute for the Social Sciences: Mannheim, German, 2016. [Google Scholar] [CrossRef]
Figure 1. Results of the visual analogue scale (VAS) for hunger. Changes of hunger ratings on test and control day.
Stresses 01 00003 g001
Figure 2. Changes of positive and negative affect scale (PANAS) on test and control day. (A) Positive affect scale ratings. (B) Negative affect scale ratings.
Stresses 01 00003 g002
Figure 3. Average heart rate of participants. (A) The average heart rate of participants on the test day. (B) The average heart rate of participants on the control day. (C) The average heart rate during the TSST. Test day: 108.3 ± 6.67 bpm. Control day: 91.93 ± 3.62 bpm. n = 5; **** = p < 0.0001.
Stresses 01 00003 g003
Figure 4. Change of acylated ghrelin after TSST-G or control exposure according to stress group. (A) Mean acylated ghrelin (AG) of chronically high and low stressed participants on test day. (B) Mean AG of chronically high and low stressed participants on control day n = 16.
Stresses 01 00003 g004
Figure 5. Timetable of test and control day. T1–T8: Time points of sampling. BS: Blood sampling. Q1: VAS and PANAS, Q2: 24 h recalls, Q3: DEBQ, Q4: TICS. HR: heart rate. 24 h recalls: dietary recall of food and drinks consumed. PANAS: positive and negative affect scale.
Stresses 01 00003 g005
Table 1. Characteristics of the study population, n = 16.
Mean (SD)Test Day Mean (SD)Control Day Mean (SD)p Value
Age (years)23 (3)
BMI (kg/m2)22.5 (1.3)
Work (h/week)21 (11.31)
Sport (h/week)5.33 (4.19)
RMR (kJ/24 h)7326.90 (512.87)
EI on previous day (kJ/d) 10.831 (3.683)11.077 (4.774)NS
Basal VAS score 6.12 (1.61)6.67 (1.65)NS
Before testing, VAS score 2.96 (1.49)2.89 (1.39)NS
Basal PA score 2.55 (0.11)2.09 (0.16)0.008
Before testing, PA score 2.51 (0.47)2.18 (0.64)0.030
Basal NA score 1.21 (0.04)1.16 (0.05)NS
Before testing, NA score 1.13 (0.20)1.08 (0.09)NS
Heart rate during TSST-G (bpm; n = 5) 108 (16)92 (13)<0.0001
NS, not significant; RMR, resting metabolic rate; EI, energy intake; VAS, visual analogue scale for hunger; PA, positive affect; NA, negative affect; TSST-G, Trier Social Stress Test for groups.
Table 2. Mean results and correlations of Dutch Eating Behavior Questionnaire (DEBQ) subscales among participants, n = 16.
Mean (SD)p Value (Mean Comparison)Correlationp Value (Correlation)
Restrained Eating1.86 (0.48)<0.001 a0.20NS c
Emotional Eating1.73 (0.42)<0.001 b−0.39NS d
External Eating3.05 (0.52) 0.21NS e
a mean score external vs. restrained scale; b mean score external vs. emotional scale; c correlation restrained vs. emotional scale; d correlation emotional vs. external scale; e correlation external vs. restrained scale.
Table 3. Mean results of raw Trier Inventory of Chronic Stress (TICS) scores.
SSCSMedianp Value
Mean (n = 16)68.5
SD25.20
Median60.50
Working participants (n = 6) 62.00NS
Non-working participants (n = 10) 60.50
Concerned eaters (n = 6) 60.00NS
Less-concerned eaters (n = 10) 63.00
Table 4. Estimated marginal means of acylated ghrelin after TSST or control-TSST exposure according to the chronic stress level.
Test or Control DayChronic Stress ExposureEstimated Mean (SD)95% CI
Lower BoundUpper Bound
testlow129.67 (19.95)86.67172.66
high71.74 (23.15)22.70120.78
controllow99.15 (19.78)56.36141.94
high125.17 (21.79)78.18172.16
Publisher’s Note: MDPI stays neutral with regard to jurisdictional claims in published maps and institutional affiliations.

