Article

Evaluating Performance and Elucidating the Mechanisms of Collaborative Development within the Beijing–Tianjin–Hebei Region, China

1
Institute of Geographic Sciences and Natural Resources Research, Chinese Academy of Sciences, Beijing 100101, China
2
College of Resources and Environment, University of Chinese Academy of Sciences, Beijing 100049, China
3
Institute of Remote Sensing and Digital Earth, Chinese Academy of Sciences, Beijing 100101, China
*
Author to whom correspondence should be addressed.
Sustainability 2018, 10(2), 471; https://0-doi-org.brum.beds.ac.uk/10.3390/su10020471
Submission received: 24 December 2017 / Revised: 2 February 2018 / Accepted: 5 February 2018 / Published: 10 February 2018

Abstract

:
Elucidating the performance of collaborative development within the Beijing Tianjin Hebei (BTH) region and developing an understanding of mechanisms underlying this process are of paramount importance to regional sustainable development as well as for the realization of Chinese national strategy. Thus, utilizing socioeconomic data for 13 districts within the BTH region between 2000 and 2014, this study applies the Gini coefficient alongside the technique for order preference by similarity to an ideal solution (TOPSIS) method supported by the entropy weight model and impulse response functions in order to assess the performance of collaborative development in this region and elucidate underlying mechanisms. The results of this study reveal that collaborative development within the BTH region has tended to slowly increase over time, but with fluctuations. Although some progress has been made in promoting urbanization, constructing traffic networks, protecting the environment, and improving living standards, very significant expansion space nevertheless remains for further improvements. The collaborative development of this region has also been increasingly affected by globalization, with either the equalization of per capita fixed asset investment or fiscal expenditure exerting a definite impact. The results show that although the equalization of per capita fixed asset investment boosts collaborative development at the start of this process, it is likely to impede it over longer time scales, while the equalization of per capita fiscal expenditure will contribute to this process within the BTH region over both the short and long term. A number of policy suggestions are therefore proposed in this paper to promote smooth collaborative development of the BTH region, including optimizing investment structures and establishing an ecological compensation mechanism.

1. Introduction

Collaborative development is now seen as a worldwide phenomenon and considered of paramount importance to regional sustainable development. Incorporating growth pole, gradient transfer, and mutual dependence theories, a number of theories to regional development have suggested that collaborative development is not just the ultimate aim of regional development but is also an important means to achieve common prosperity [1,2,3]. Later, endogenous growth model [4,5], new economic geography [6], industrial cluster [7] and global value chain [8,9] were put forward and utilized to promote regional development. In general, existing studies have paid more attention to economic growth, and the majority of the research is national or international in scale. However, when it comes to the regional scale, collaborative development includes not only economic growth, but also social development, environmental improvement and progress in other aspects [10]. In most regions, however, especially within developing countries, attaining collaborative development seems to be more of a hope than reality at present; collaborative development of a national capital region (i.e., a capital city and its surrounding cities) will contribute to the enhancement of regional competition and will also serve as a good case study for other regions as these areas are national political centers. A great deal of research on these processes has therefore been carried out in capital regions around the world, and includes the 1944 Greater London Plan, the 1960 Plan d’Aménagement et D’Organisation Générale de la Région Parisienne, and the Japanese Capital Region Planning Act between 1950 and 1999. However, while notable achievements have been made in these research areas, deficiencies nevertheless remain [11,12]; it is noteworthy that the Beijing–Tianjin–Hebei region (BTH region) remains little studied even though this area encompasses the national capital region of the largest developing country in the world. The rapid development of both industrialization and urbanization has compressed the process of regional diffusion within the BTH region while simultaneously increasing the pressure on resources; environmental overload has also exacerbated regional conflicts which have resulted in local protection, market segmentation, and the development of administrative barriers as opposed to collaborative development amongst cities. These processes have all contributed to making the BTH region a typical example of an area with highly uneven levels of economic and social development. In order to address this, the Chinese government proposed a collaborative development strategy for the BTH region in 2014 that aimed to reduce regional differences and promote integration within this capital area. It is therefore essential to assess the performance of collaborative development of this region and scientifically evaluate mechanisms that underlie this process in order to ensure the realization of national strategy.
The process of collaborative development refers to the status of urban development in the context of coordination with surrounding agglomerations and cooperation between them to reach a win win situation. Scholars have therefore paid a great deal of attention to promoting collaborative development, as this process is indispensable to balanced regional development, and our understanding of this mechanism is being constantly enhanced over time. In general, collaborative development includes influences from the economy, the environment, energy, and population, for example; of these, the former has had a head start as a key component of the of the development of regional economic integration; one good example of this kind of development is the establishment of the Belgium–Luxembourg Economic Union in 1921 [13]. The subsequent 1973 oil crisis also greatly impacted the global economy and led to a number of research studies on the collaborative development of energy resources [14]. Economic development and energy consumption have led to increasingly serious environmental pollution which has, in turn, led people to re-examine the role played by the environment in collaborative development. Thus, following the 1987 proposal of the concept of sustainable development [15], achieving coordinated progress in the economy, energy, and the environment has received considerable attention, leading to economy–energy–environment (EEE)-based systems.
A large volume of research studies have therefore been undertaken to develop EEE system frameworks. These can be divided into two classes, the first of which utilizes computable general equilibrium (CGE) or input–output models (IO) to analyze mutual changes between the economy, energy, and the environment within this framework. In one study, Evrendilek et al. determined that rapid economic growth coupled with increases in energy consumption has led to environmental degradation in Turkey [16], while Albino et al. determined that enhanced EEE interactions should be implemented in tile manufacturing in order to improve the sustainable development of Sassuolo [17]. Similarly, Oliveira et al. established a comprehensive model to assess environmental burdens with respect to economic growth and energy consumption to aid decision-makers [18]; these workers developed a multi-sectoral EEE model using Portugal as a case study in order to analyze the interactive relationships between these factors to provide decision support for policymakers [19], while Allan et al. utilized a similar CGE model to explore the relationship between energy efficiency and use [20]. The second set of research studies in this area have aimed to dissect the relationship between EEE factors using econometric models; Duan et al., for example, constructed an EEE integrated model to simulate the impact of energy policies on technologies and were able to determine that a mixed policy combining both a carbon tax and subsidies promotes observable improvements in performance [21]. In a similar study, Chen et al. employed a panel co-integration and vector error-correction model to analyze the relationships amongst EEE factors and identified long-term associations between economic growth, energy consumption, and carbon dioxide emissions in all countries [22]. In contrast, however, few scholars have undertaken comprehensive evaluations of collaborative performance; in one example, Wang et al. assessed the degree of coordination between EEE factors in Shandong Province, China, and noted an increased level of relationship throughout their research period [23]. Although similar studies on the coordinated development of the EEE system within China have also been conducted in Anhui Province and in the Zhujiang Delta, for example [24,25,26], they have had a number of inevitable shortcomings. In particular, previous researchers have shown more interest in exploring the relationships within the EEE system itself, while at the same time paying limited attention to collaborative performance. Even though some scholars have gradually begun to consider population, society, resources, and other systems within their models, their relative importance for enhancing the performance of collaborative development has been little addressed [25,27]. Comprehensive and systematic research which addresses the main systems underlying collaborative development is therefore urgently needed, in particular as earlier work has normally taken the whole study area in its entirety to assess the performance of collaborative development using time-series data, ignoring regional heterogeneity. It is therefore necessary to utilize panel data to obtain results which reflect both regional heterogeneity and temporal variation, while the development of an appropriate evaluation method is also required to deal with these data.
In order to evaluate the performance of collaborative development, it is also necessary to determine the key mechanisms which enable the orderly progression of this process so that scientific advice can be provided to policymakers. However, as discussed above, researchers have often tended to investigate the impact of policy changes on subsystems rather than the whole of an entity [18,19,20,21], while studies based on CGE or IO models usually require large amounts of data, often difficult to obtain at the regional scale. Few researchers have therefore explored the nature of underlying mechanisms using alternative approaches. In one example, Wang et al. utilized principal factor analysis to discuss the variables which have affected coordinated development in Shandong Province; the results showed that both the economy and energy were key drivers of coordination performance while the environment acted as a limiting factor [23]. In further research, Yuan et al. used a panel regression model to demonstrate that environmental regulation can promote the coordinated development of EEE systems [28], Li et al. reviewed the driving forces, developmental status, and current problems facing collaborative development in China [29], Nygaard et al. discussed the role of spatial scale [30], and Li investigated the forces driving regional economic collaborative development nationally using the Haken model [31]. Previous studies have generally been more concerned with internal collaborations within systems, and have thus paid limited attention to mechanisms influencing the whole entity. Future research in this area should be focused more on factors influencing the performance of collaborative development at the regional scale so that both practical and feasible policies can be developed to enhance this process.
The aim of this paper is therefore to improve existing research in the following four aspects. In the first place, a comprehensive evaluation index system is developed which encompasses all the important elements of collaborative development at regional scale. Secondly, a new approach which combines use of the Gini coefficient and the technique for order preference by similarity to an ideal solution (TOPSIS) method is developed to assess the performance of collaborative development using panel data, enabling both regional differences and variation tendencies to be taken into account. Thirdly, a pulse response model is applied in this study to unearth the determinants of collaborative development, an approach which has seldom been utilized in previous work. Finally, the BTH capital region of China is evaluated as a case study in this research. Very significant regional differences are evident within the BTH area; although Beijing has become one of the most developed cities in China, 20 poverty-stricken counties are nevertheless still present within the surrounding area, some of which are even ranked as such at the national level. Collaborative development of the BTH region is therefore of great significance for local sustainable development and will also exert a marked effect as a demonstration to other areas. Research on the BTH to date, however, has tended to pay more attention to environmental pollution, especially within the atmosphere, and few studies have addressed the collaborative development of this region [32,33,34,35,36]. No comprehensive evaluation of the performance of collaborative development within the BTH region has so far been conducted; there is therefore an urgent need to strengthen research on the collaborative development of this region to ensure that the national developmental strategy is successfully realized.

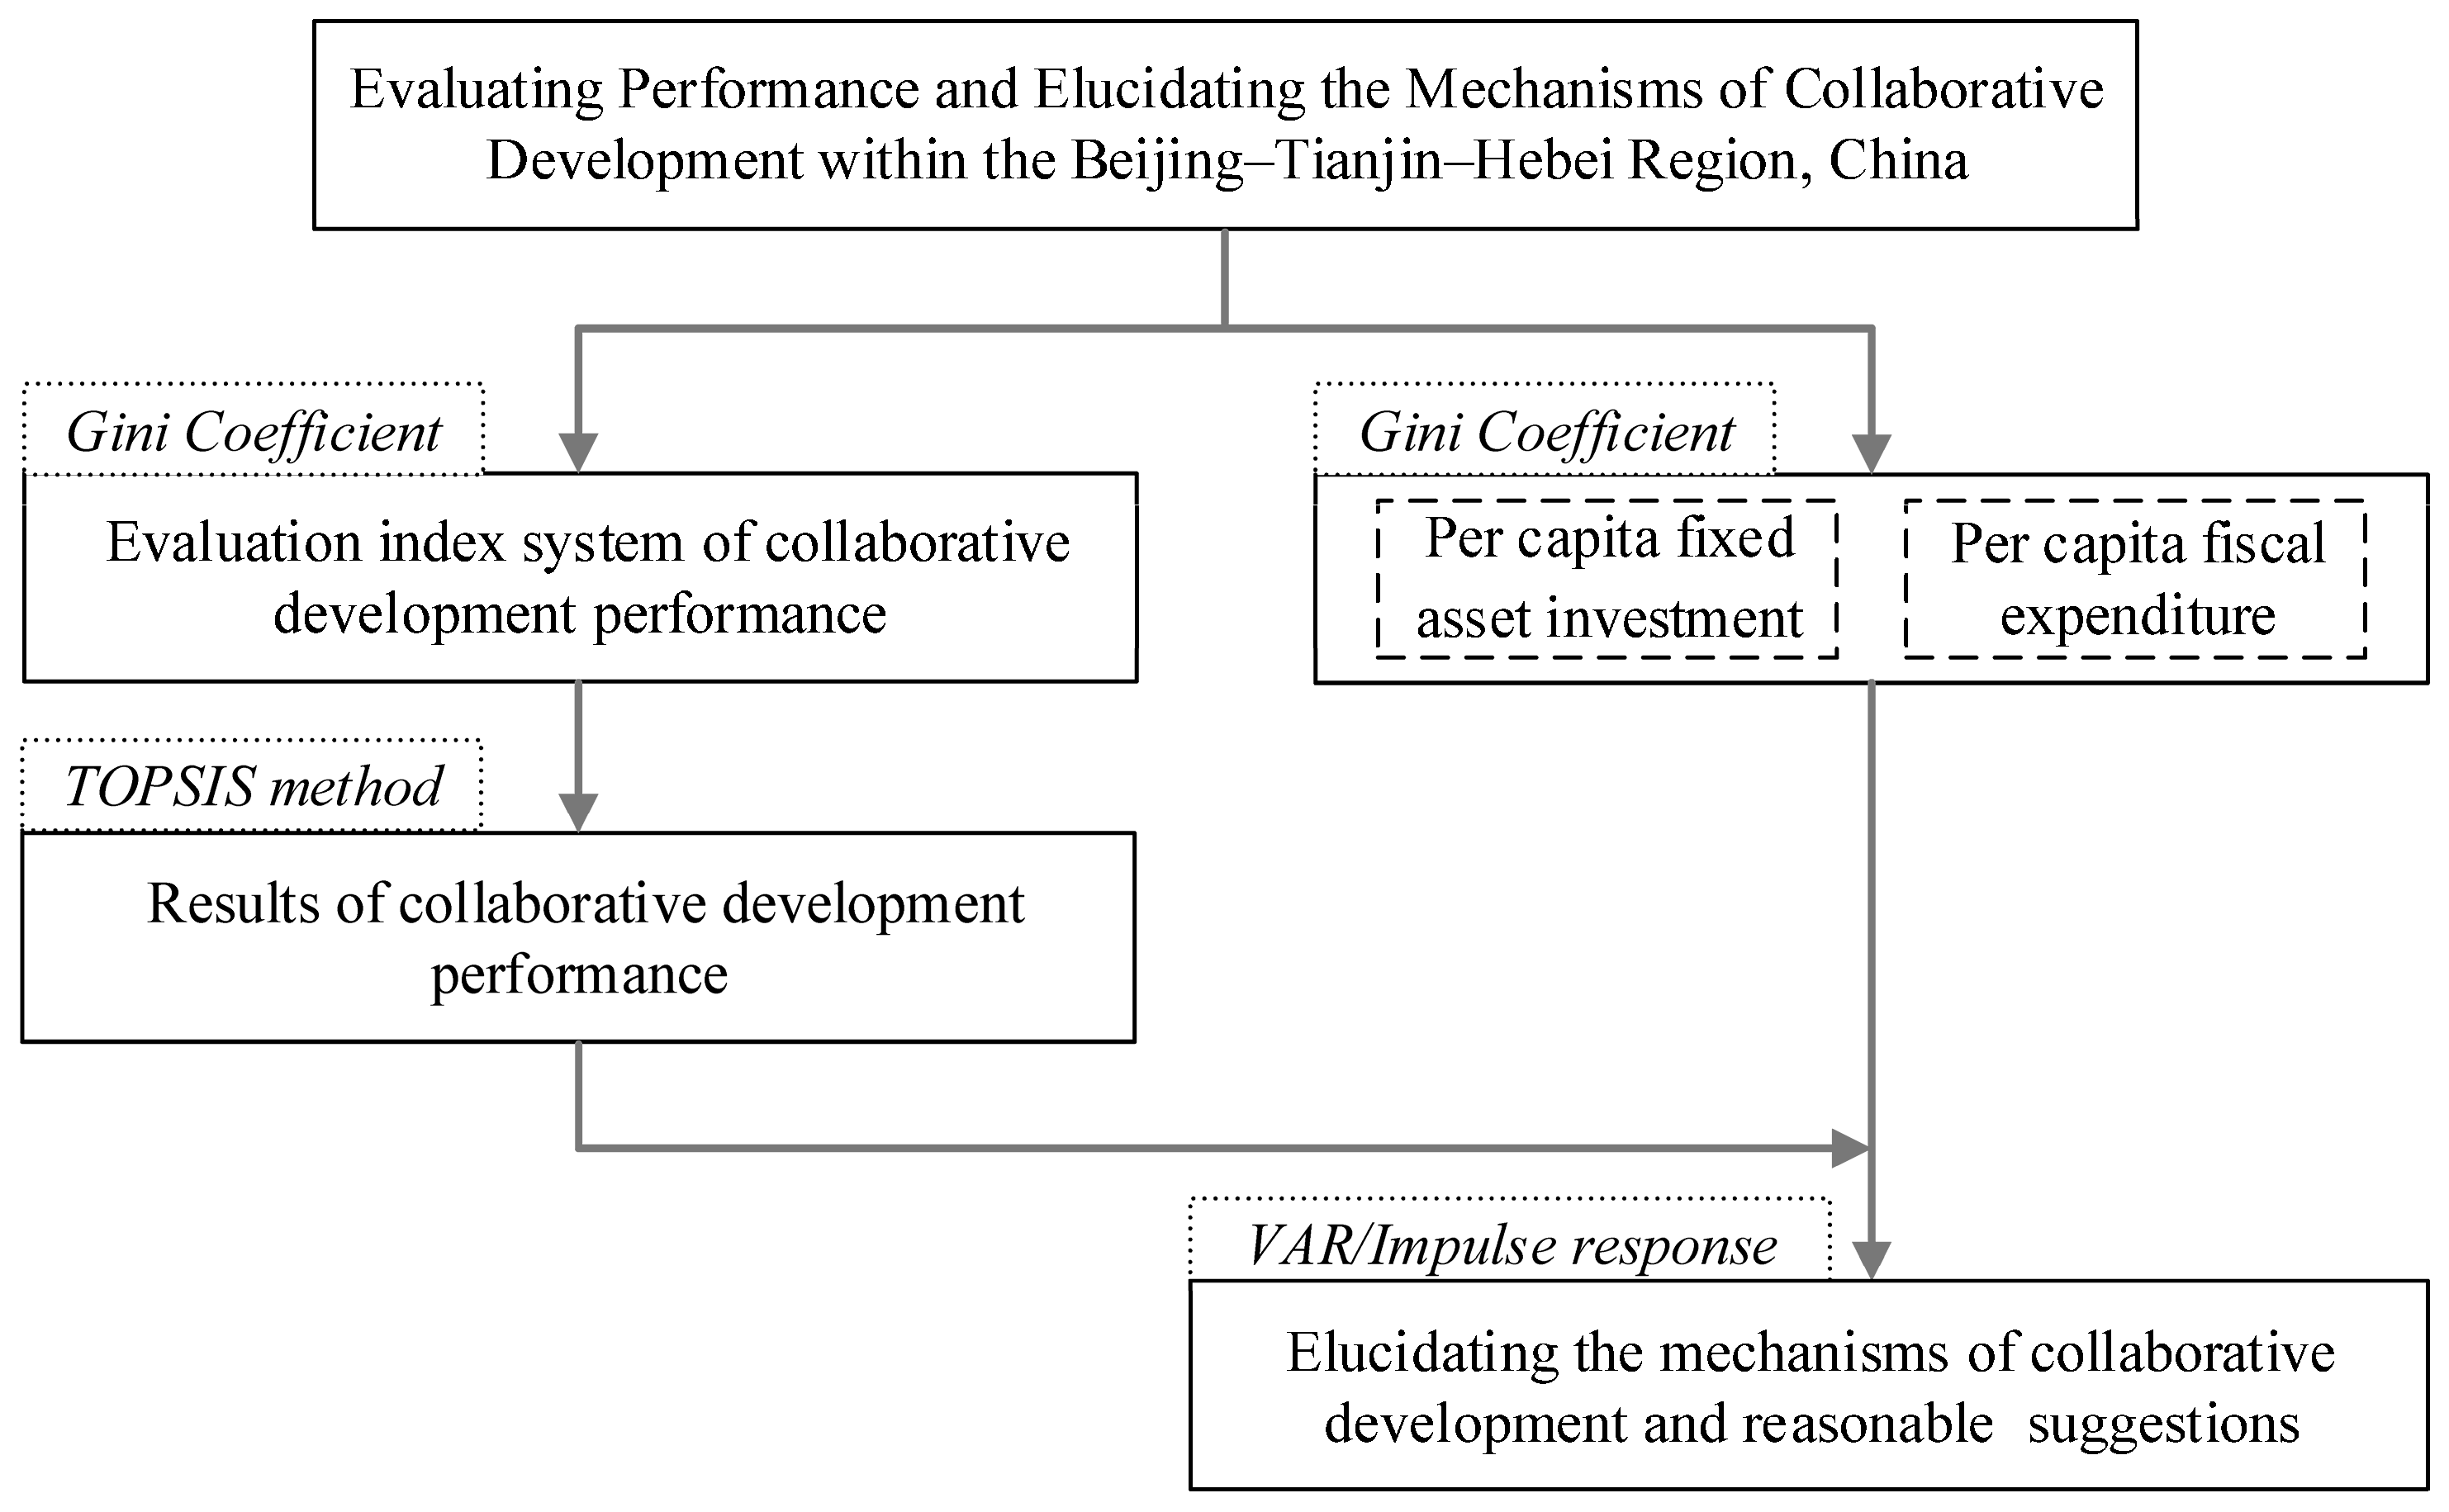
2. Materials and Methods

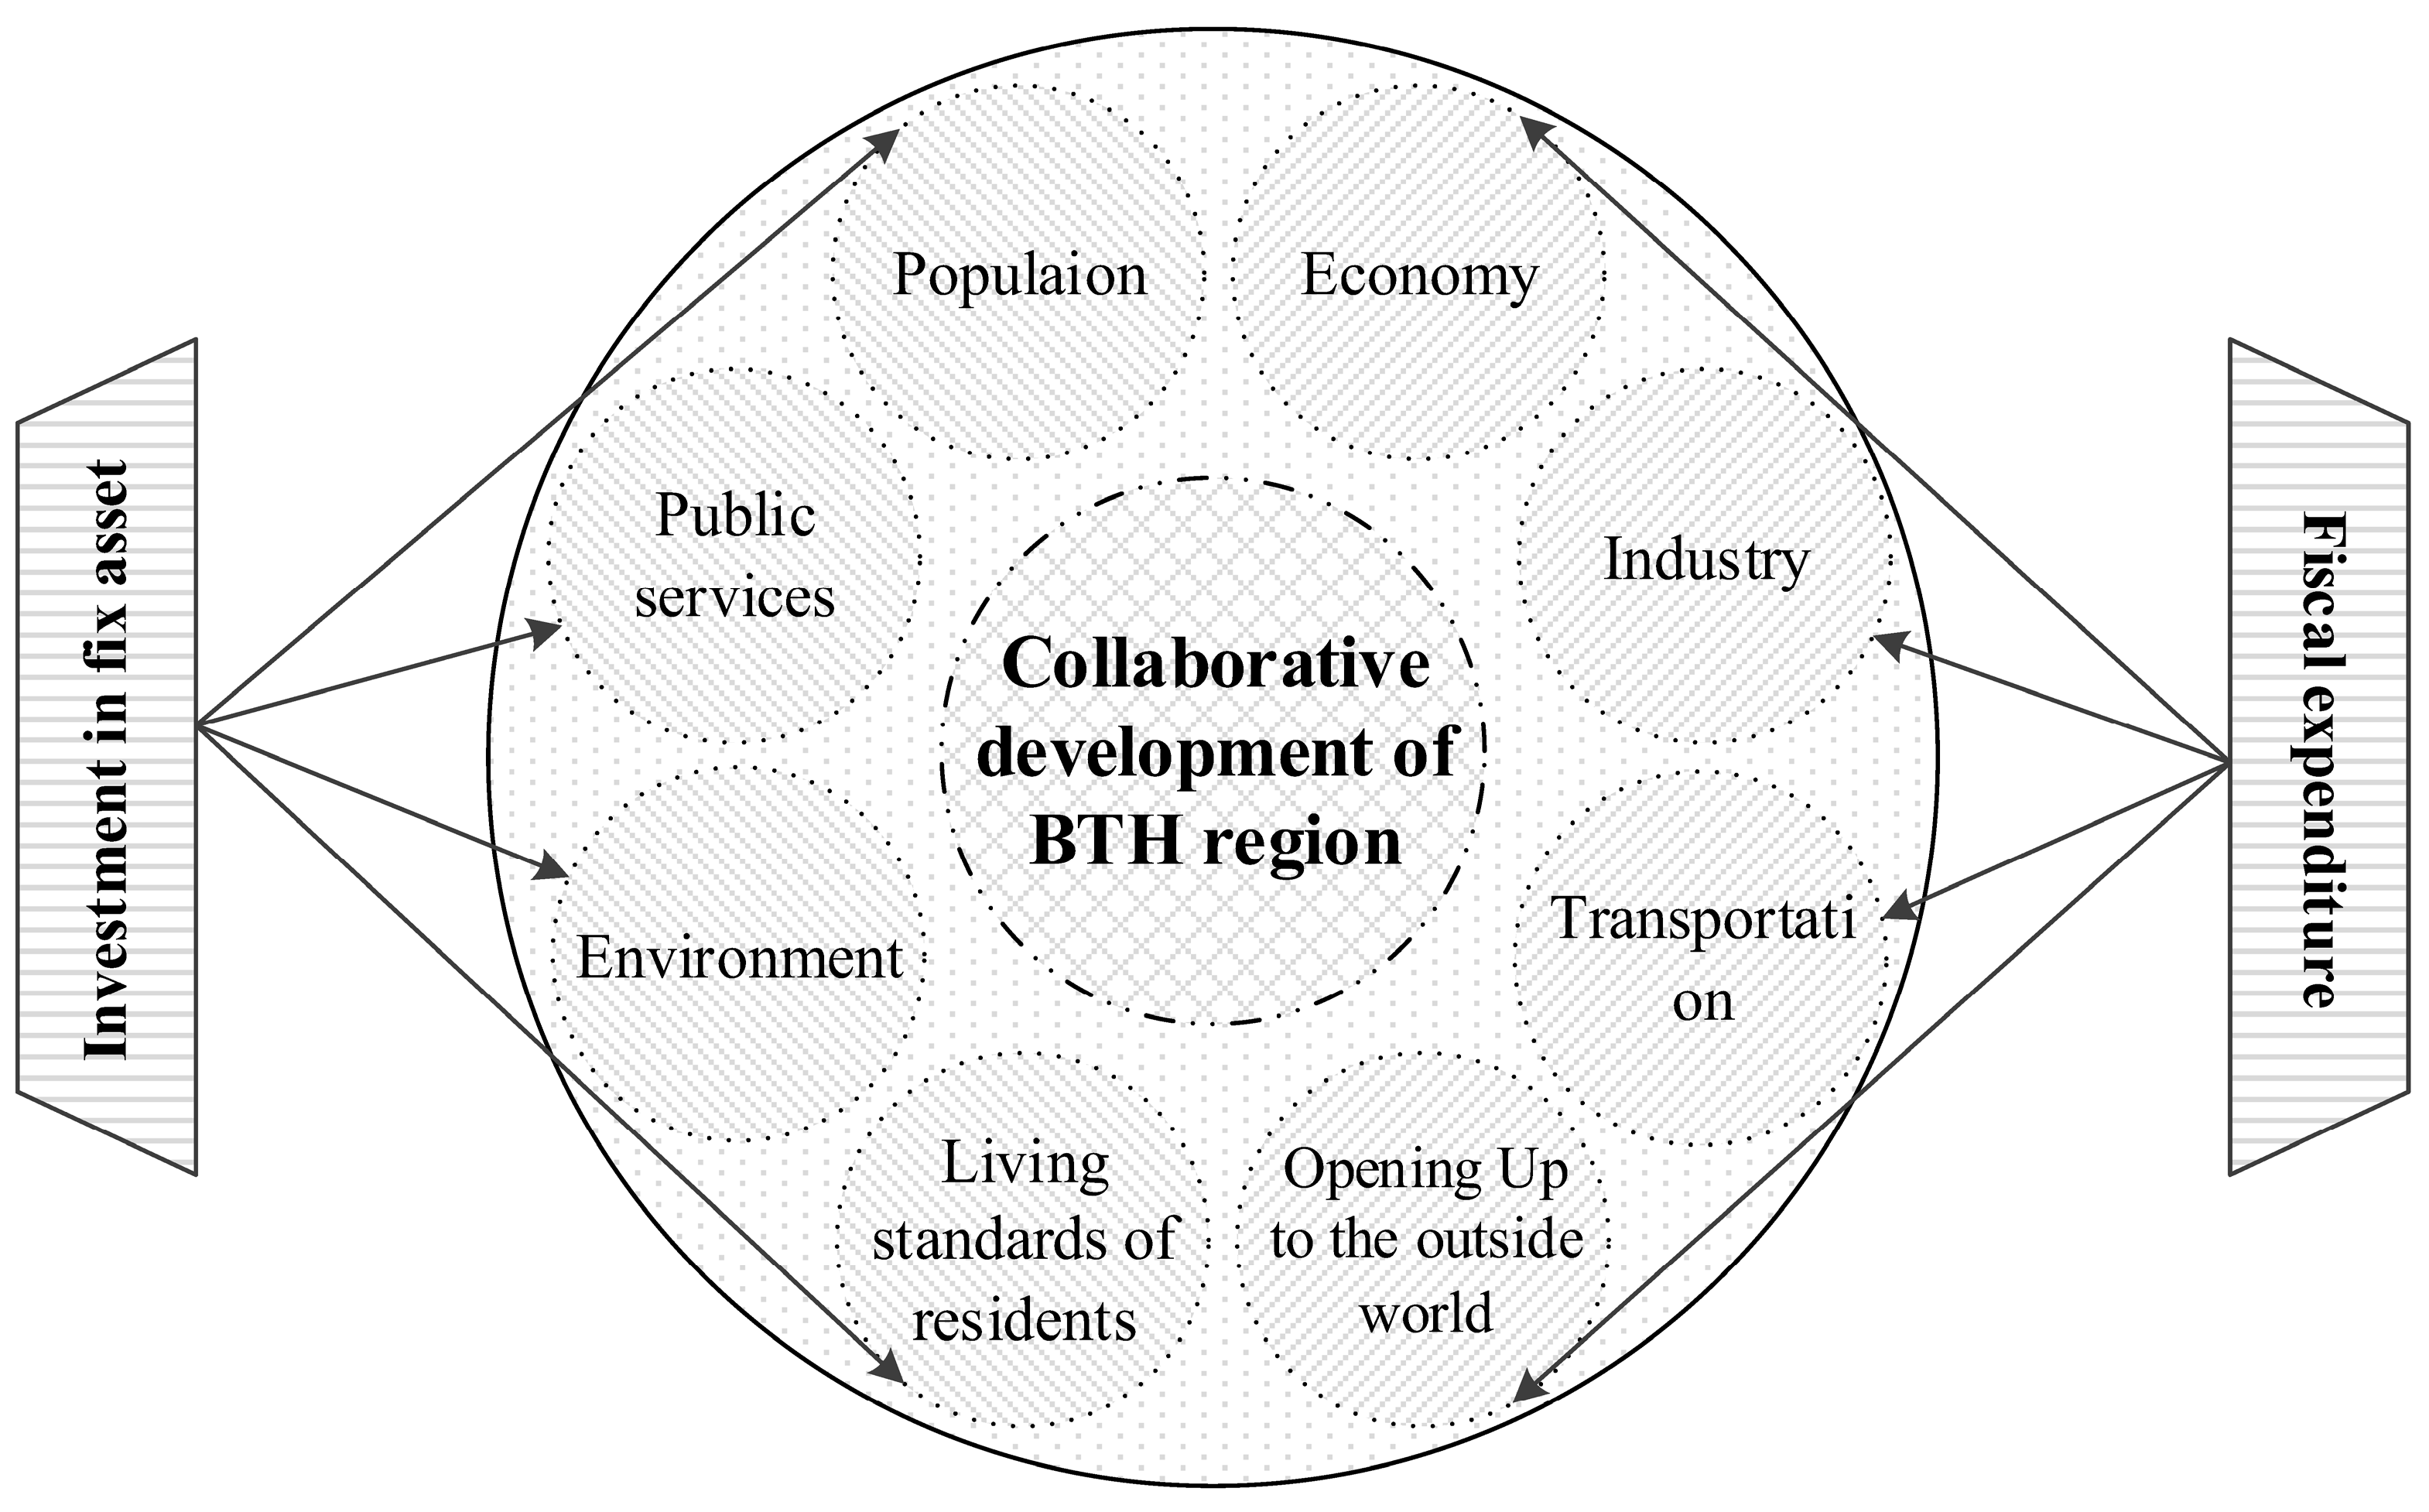
2.1. Framework for the Performance Assessment of Collaborative Development

On the basis of previous research, as well as an outline for the Collaborative Development of Beijing, Tianjin and Hebei Province that was published in 2015 by the Leading Group for Financial and Economic Affairs [37], it is noteworthy that the objectives for the collaborative development of the BTH region are to boost balanced population distribution, accelerate economic growth, optimize industrial structures, construct a traffic network, promote environmental quantity, equalize public services, improve living standards, and open the region to the outside world. A comprehensive index system for evaluating the performance of collaborative development within the BTH region is therefore proposed which includes the eight criteria: population, economy, industry, transportation, environment, public services, living standards of residents, and opening up to the outside world. Further, taking integrity, systematic nature, and data availability into account, 18 indicators of collaborative development were selected for analysis. The index system used in this study to evaluate the performance of collaborative development within the BTH region is presented in Table 1. It is further noteworthy that energy supply is not an important priority locally because the BTH region is supplied by the North China Grid, and both adjacent and surrounding areas are rich in coal resources; energy was therefore not included within the index system used in this study.
The mechanisms that control the performance of collaborative development and the factors that influence this process also need to scientifically analyzed, while the selection of such factors should also incorporate data availability and facilitate future policy formulation. It is generally the case that investment in fixed assets is one key factor that spurs economic growth, and can also significantly promote developments in industry, transportation, and opening up to the outside world [38,39,40]. The outline presented in the Collaborative Development of Beijing, Tianjin and Hebei Province report also identified fixed assets investment as the primary approach for promoting collaborative development. At the same time, fiscal expenditure represents another effective method of public administration by the government and can also significantly enhance collaborative developments in population, public services, and the environment, as well as the living standards of residents. To date, the importance of this factor has not been given the attention it deserves.
The mechanisms that connect collaborative development and the factors that influence this process are summarized in Figure 1. As discussed, collaborative development within the BTH region aims to enhance the population, the economy, industries, transportation, the environment, public services, and the living standards of residents, as well as to open the region to the outside world via investment in fixed assets and other financial expenditure. Thus, per capita fixed asset investment and fiscal expenditure were utilized in this study as the key factors influencing collaborative development in order to mitigate the impact of urban size. A flow chart showing the research process is seen in Figure 2. Gini coefficients were calculated using the R software, and the performance of collaborative development within the BTH region was calculated by TOPSIS method supported by the entropy weight model. The mechanisms underlying collaborative development were analyzed with vector auto regression (VAR) model and impulse response functions integrated in the Eviews.

2.2. Methods

2.2.1. The Gini Coefficient

The Gini coefficient is the most commonly applied inequality measure and is calculates using the ratio of the area that lies between a line at 45 degrees and the Lorenz curve that encompasses the total area under a line at 45 degrees [41], we used the Gini coefficient to evaluate indicator inequalities, as follows:
g = 1 2 n 2 μ i = 1 n j = 1 n | x i x j |
In this expression, the i suffixes denote prefectural-level divisions, while g denotes the Gini coefficient, x refers to the attribution of prefectural-level divisions, and n denotes the number of prefectural level cities. Thus, n = 13 in this paper, and μ denotes the mean value of indicators.

2.2.2. The TOPSIS Method Supported by Entropy Weight Model

The TOPSIS method was first proposed by Hwang and Yoon in 1981 [42], was further developed by Yoon in 1987 [43] and Hwang et al. in 1993 [44], and has become a widely recognized analytical technique for multi-criteria decisions [45]. On the basis of this approach, the best alternative is the one which has the shortest distance from the ideal solution and the longest distance from the worst solutions, usually measured as a Euclidean norm. Each criterion is weighted according to its importance to obtain more realistic conclusions, and an entropy weight model is adopted to determine objective values in order to avoid the influence of subjective factors on evaluation results. We utilized the TOPSIS method supported by the entropy weight model in six successive steps.
i. An evaluation matrix Cij was created using the Gini coefficients calculated in Equation (1). In this case, g denotes the Gini coefficients, while i and j refer to the year and criterion, respectively.
A Cij matrix should generally be normalized to eliminate the influence of incongruous dimensions. In this case, however, as the data of each evaluation index are Gini coefficients and thus have guaranteed dimensional unity, normalization was not carried out in this study in order to ensure interannual data comparability.
ii. Criterion weights were determined using the entropy weight model. The entropy value ej of each criterion Cj was expressed as follows:
e j = k i = 1 n f i j ln f i j
In this formula, f i j = c i j i = 1 n c i j ;   k = 1 ln m , m represents the number of years, and m = 15 here.
Thus, the weight of each criterion j is calculated as follows:
w j = 1 e j j = 1 n ( 1 e j )
iii. The weighted normalized decision matrix Rij was calculated as follows:
R = ( r i j ) m × n ,   r i j = w j · c i j
iv. As all the evaluation indices used in this study are negative, ideal (V+) and anti-ideal solutions (V) were defined as follows:
V j + = min ( r 1 j , r 2 j , , r n j ) ,   V j = max ( r 1 j , r 2 j , , r n j )
v. A Euclidean distance was calculated between the target alternative i and V+ as well as between i and V, as follows:
D i + = j = 1 m ( r i j v j + ) 2       ( j = 1 , 2 , , n ) D i = j = 1 m ( r i j v j ) 2       ( j = 1 , 2 , , n )
vi. The relative proximity to the anti-ideal solution was then calculated, as follows:
C i = D i D i + + D i     ( 1 i m )
In this case, a larger Cj value equates to a greater distance between i and the anti-ideal solution and therefore implies better performance for the former. In contrast, when Ci = 1, regional coordinated development has reached an ideal state, but when Ci = 0 developmental stages are either independent or are competing with each other.

2.2.3. Impulse Response Functions

Impulse response functions are regularly used in economics, and especially in macroeconomic modeling, to describe how the economy reacts to exogenous impulses over time. As these functions are often modeled in the context of vector auto regression (VAR), a model of this type is required before impulse response functions can be calculated [46]. A p-th order VAR with three variables, denoted as VAR(p), can be expressed as follows:
[ y 1 , t y 2 , t y 3 , t ] = [ c 1 c 2 c 3 ] + [ a 1 , 1 1 a 1 , 2 1 a 1 , 3 1 a 2 , 1 1 a 2 , 2 1 a 2 , 3 1 a 3 , 1 1 a 3 , 2 1 a 3 , 3 1 ] [ y 1 , t 1 y 2 , t 1 y 3 , t 1 ] + + [ a 1 , 1 p a 1 , 2 p a 1 , 3 p a 2 , 1 p a 2 , 2 p a 2 , 3 p a 3 , 1 p a 3 , 2 p a 3 , 3 p ] [ y 1 , t p y 2 , t p y 3 , t p ] + [ ε 1 , t ε 2 , t ε 3 , t ]
In this expression, y denotes variable vector, p is the lag order, ai is a 3 × 3 matrix that will be estimated, and εt is a 3 × 1 vector of disturbances which can be correlated with each other over the same time period while at the same time are unrelated to a hysteresis value but not to the variables on the right hand side of the equation.
Impulse response functions are therefore used in the VAR model to represent variable reactions to shocks hitting the system [47]. For example, VAR(1) can be expressed as follows:
[ y 1 , t y 2 , t y 3 , t ] = [ c 1 c 2 c 3 ] + [ a 1 , 1 1 a 1 , 2 1 a 1 , 3 1 a 2 , 1 1 a 2 , 2 1 a 2 , 3 1 a 3 , 1 1 a 3 , 2 1 a 3 , 3 1 ] [ y 1 , t 1 y 2 , t 1 y 3 , t 1 ] + [ ε 1 , t ε 2 , t ε 3 , t ]
In this expression, ai,t and ci are parameters to be estimated, while εi,t is a white-noise vector with the following properties:
{ E ( ε t ) = 0 ,   t var ( ε t ) = E ( ε t ε t ) = ( σ 1 2 0 0 σ 2 2 ) ,   t E ( ε t ε s ) = 0 ,   t s
Assuming that this system is active from period 0 and conforms with the precondition that x-1 = x-2 = z-1 = z-2 = 0, then if a given shock occurs such that Σ10 = 1, Σ20 = 0, then all values will be 0 within the same period (i.e., Σ1t = Σ2t = 0(t = 1, 2, …). This means that the shock will be passed through the system, and x0, x1, x2, x3, …, can be obtained by iterative calculation, referred to as the response function of x caused by the shock of x. Similarly, z0, z1, z2, z3, …, can also be calculated and is referred to as the response function of z caused by the shock of x.

3. Data and Description

3.1. Data Source

Coordinated development of the BTH region was initiated in 1976; at this time, the State Development Planning Commission of the PRC organized land planning of Beijing, Tianjin, and Tangshan (a prefectural-level city that was subordinated within Hebei Province). Later, in 2001, the Chinese ministry of construction developed and implemented the “Spatial planning of urban and rural areas in Beijing, Tianjin and North Hebei” program, which can be considered as the start of the coordinated development of the BTH region [48]. The study period considered in this paper is therefore between 2000 and 2014. Therefore, a balanced panel dataset of 13 prefecture-level divisions in BTH region for this time period were extracted from the China Statistical Yearbook, the China City Statistical Yearbook, and the China Statistical Yearbook for Regional Economy.

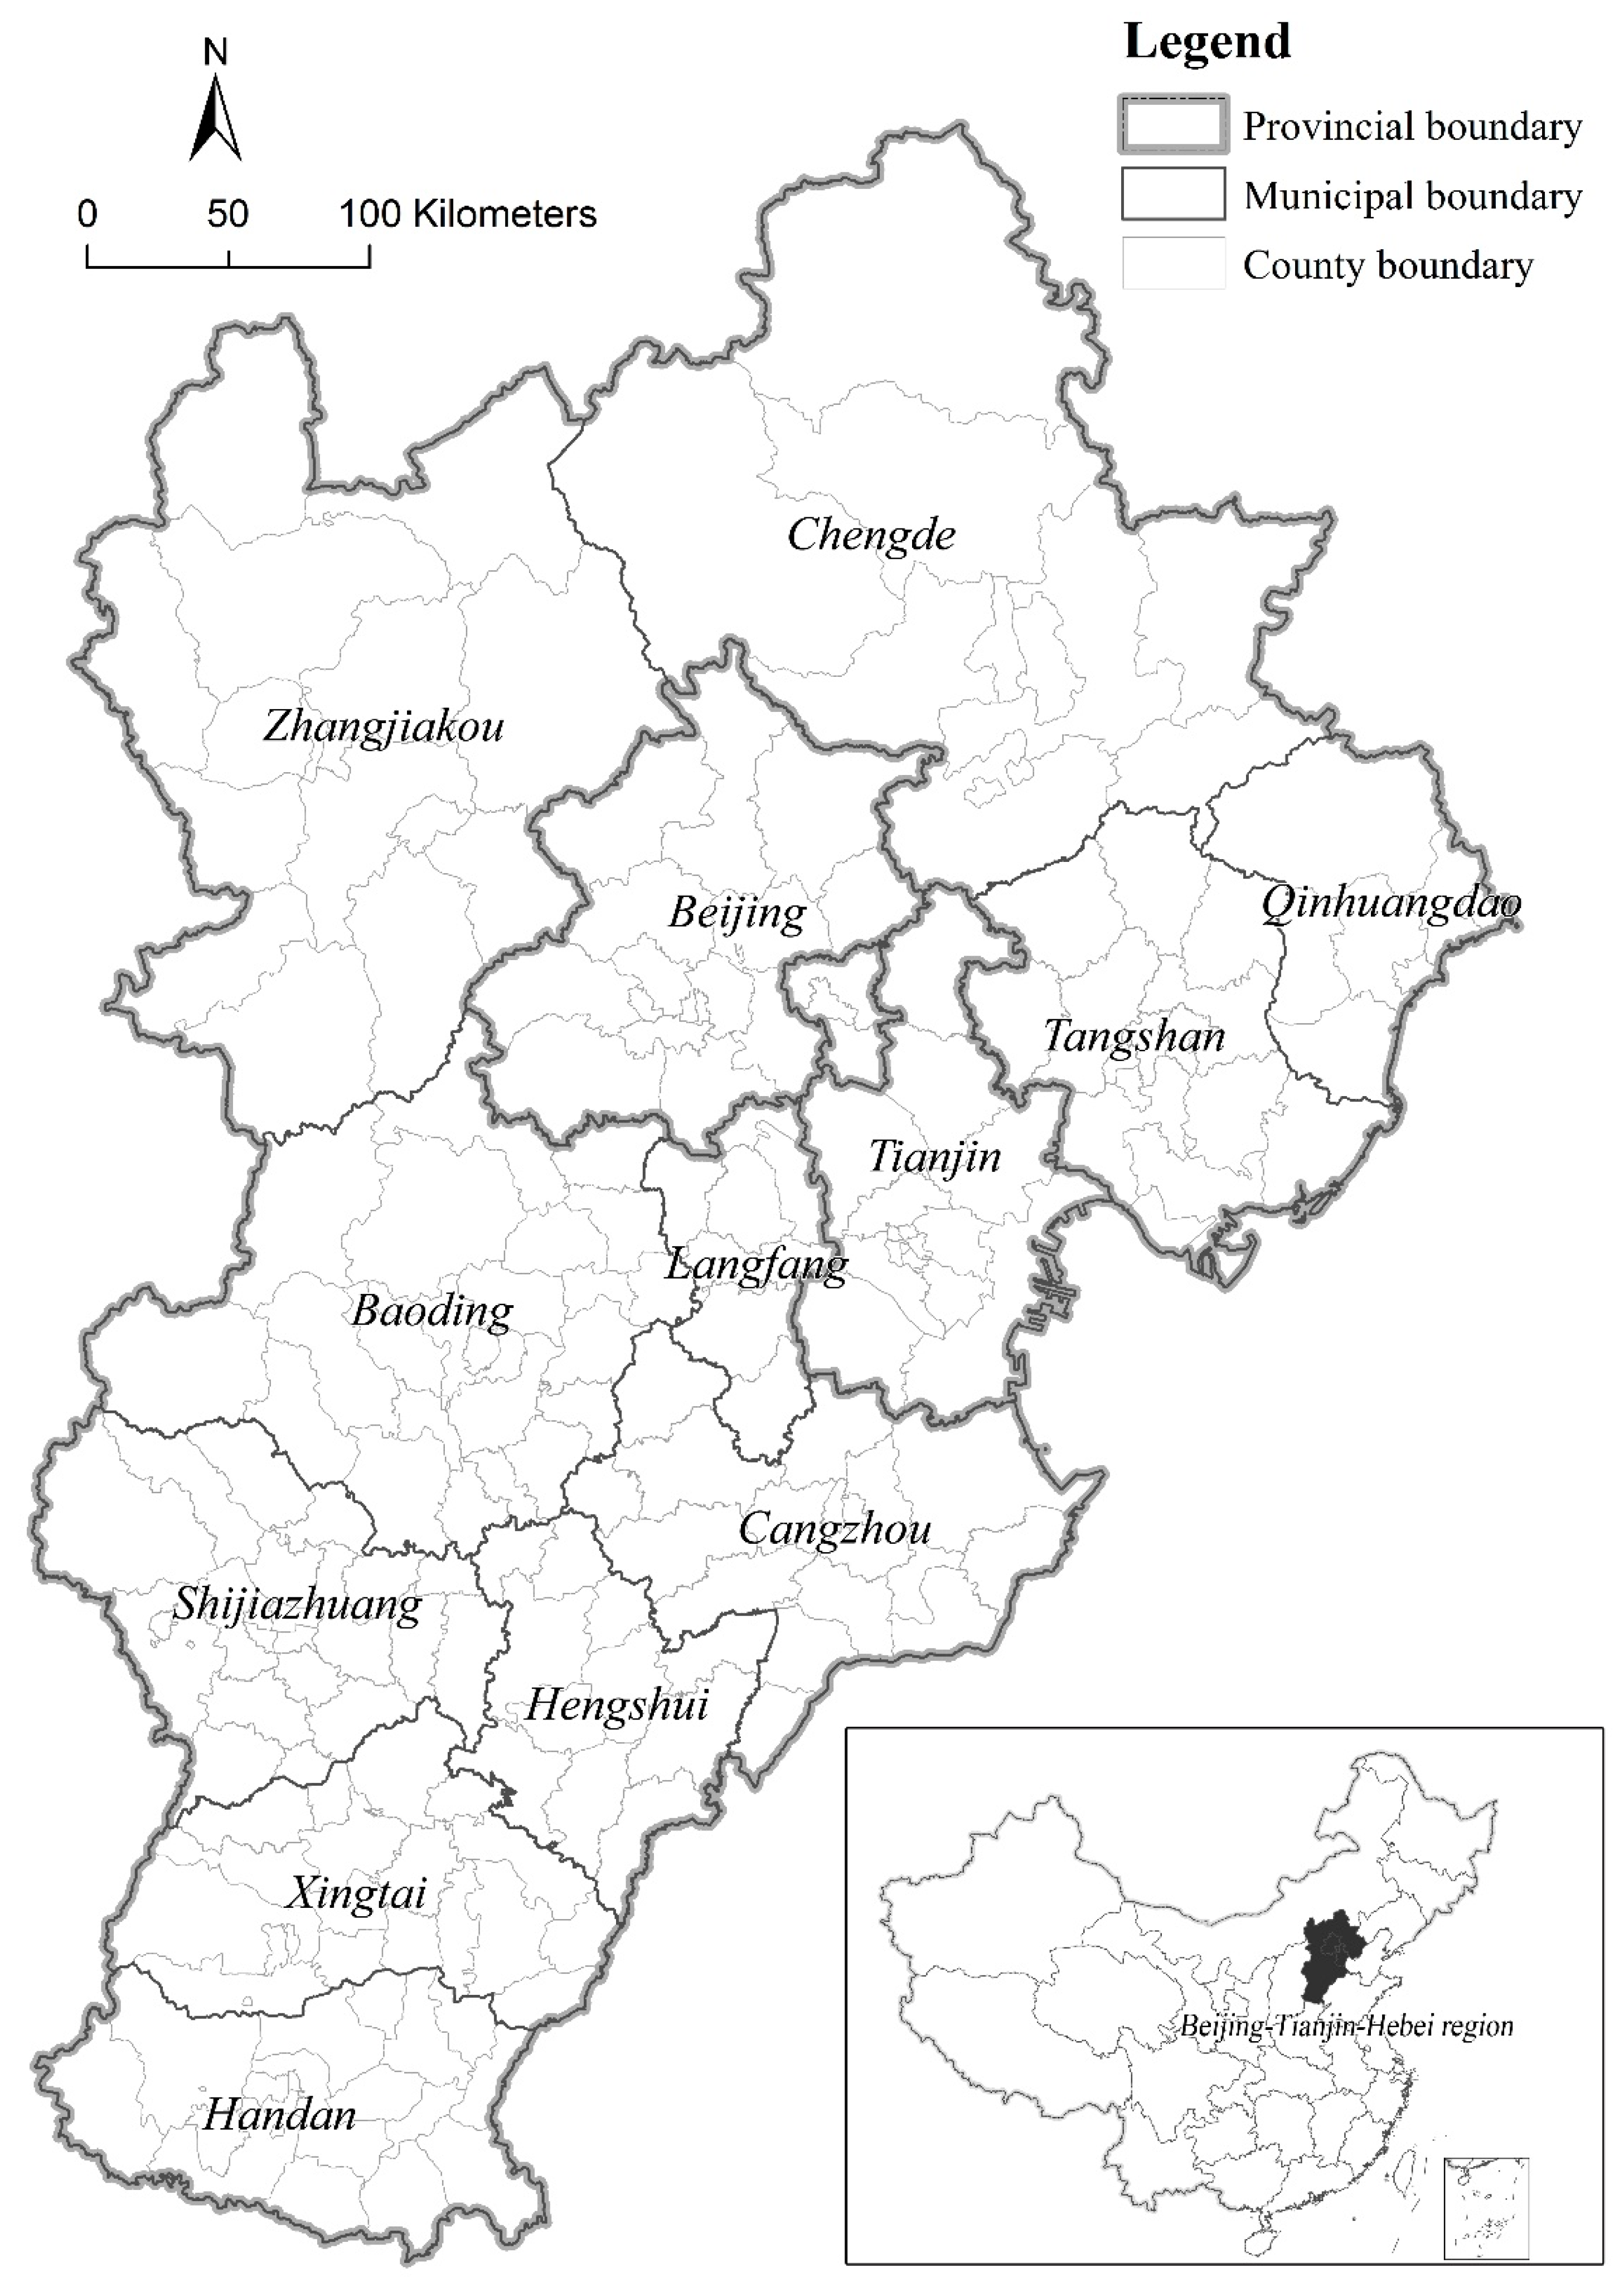
3.2. The General Situation in the Case Study Area

The BTH region is located in northern China, between latitude 36°01′–42°37′ and longitude 113°04′–119°53′ (Figure 3). This region is one of the three most developed metropolitan areas in China; the BTH region had a population of 109.92 million people in 2014, and covers an area of 216,756 square kilometers. This region generated 10.39% of Chinese gross domestic production (GDP) in 2014, about 6611 billion Yuan, and is ranked third out of the 19 urban agglomerations nationally. The urbanization rate of the BTH region reached 57.39% in 2014, which suggests it is still in an acceleration phase, while the proportions of primary, second, and tertiary industries are 5.69%, 41.00%, and 53.31%, respectively. More than half of the GDP of the BTH is comprised of tertiary industry, and the majority of this is attributable to the highly developed service industry of Beijing, a sector which generates 47.17% of the total tertiary industrial output of this region. Indeed, the bulk of the BTH region remains dominated by industry, especially heavy industry, which causes many environmental problems and negatively influences the living standards of residents, for example. Unbalanced levels of development are also widespread across the BTH region; in 2014, for example, Tianjin had the highest GDP per capita within this region (103,642 Yuan), 4.5 times higher than that seen in Xingtai. Similarly, the highest road network density is seen in Langfang, three times that seen in Chengde, while in terms of living standards, the disposable incomes of both urban and rural residents in Beijing are highest, about 2.2 times the level seen in Hengshui and 2.8 times the level in Chengde. Regional gaps are even greater in other fields; Tianjin, for example, is ranked highest in terms of the actual use of foreign investment, 126 times the level seen in Chengde, while Beijing is ranked first in terms of college students and licensed physicians per 10,000 of population, as well as in terms of the total value of imports and exports. In contrast, Zhangjiakou is ranked lowest, with the indicators only 1/46, 1/27, and 1/799 of those in Beijing. The BTH area is therefore suitable for use in this study because of the gradual execution of a collaborative developmental strategy that not only aims to reduce regional differences but also to provide a good example for other regions.

4. Results and Discussion

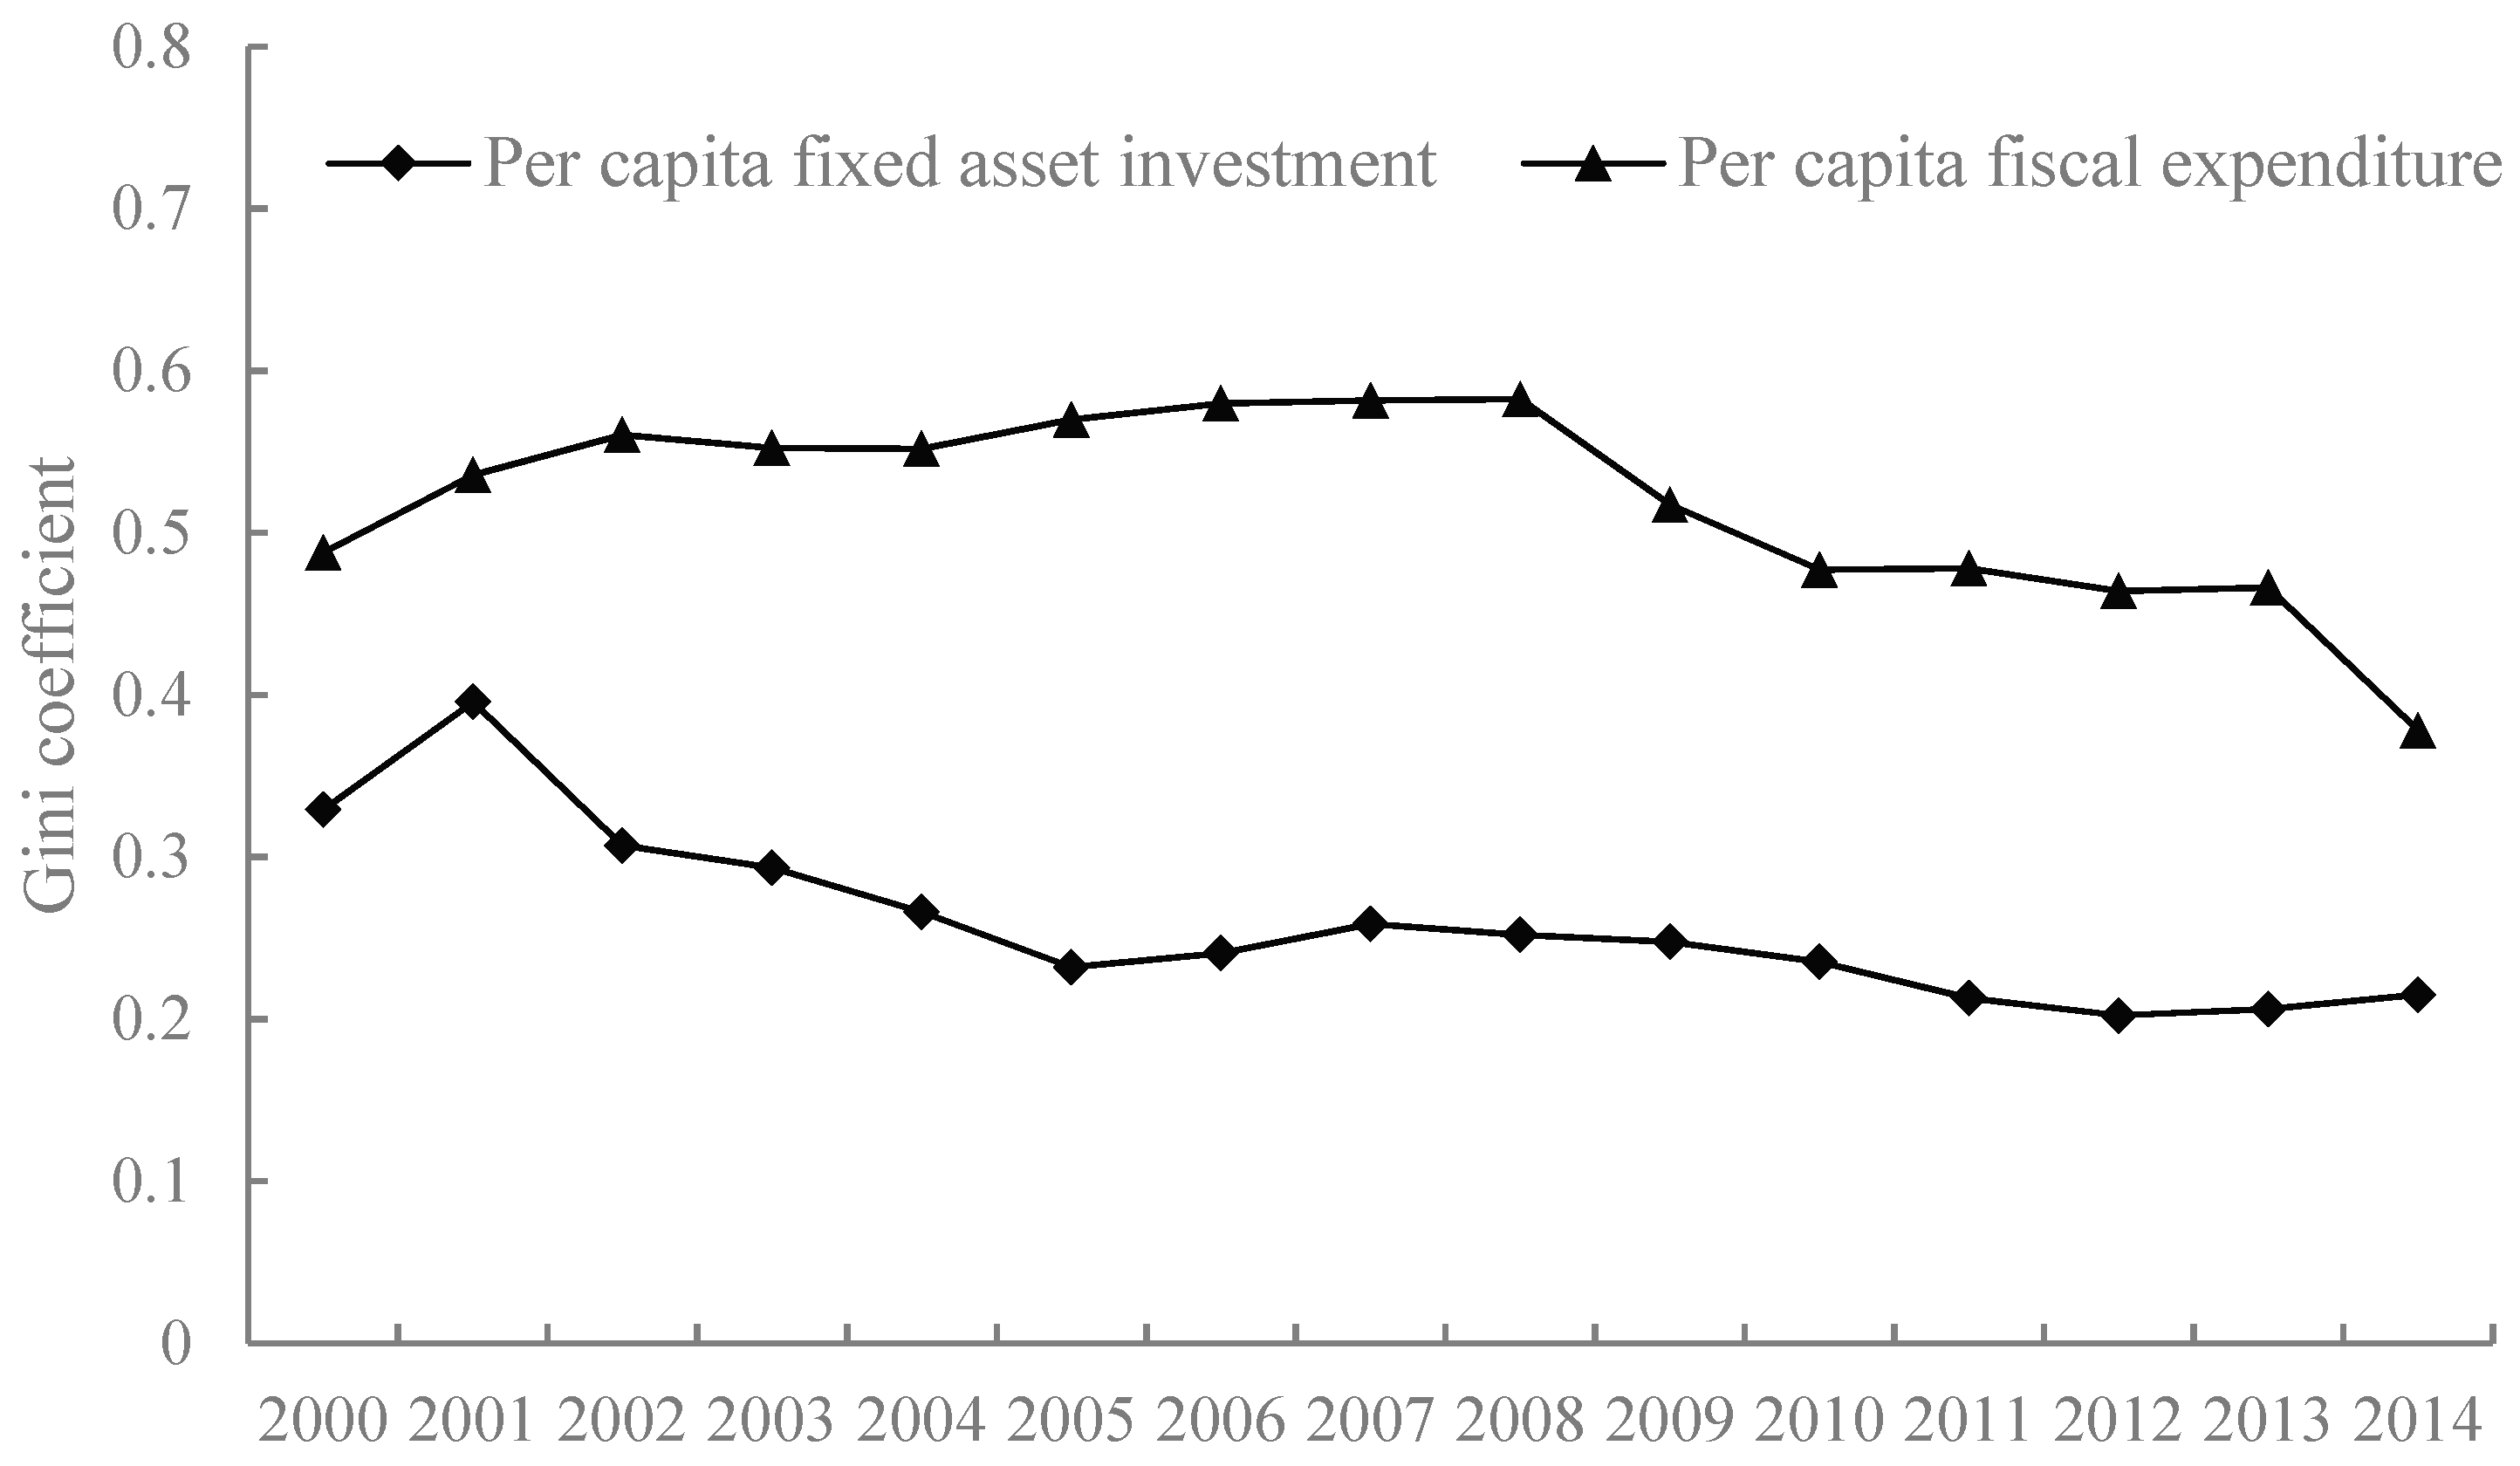
4.1. Gini Coefficient Analyses

Summary statistics for Gini coefficients calculated for collaborative developmental indicators between 2000 and 2014 are presented in Table 2. These data show that the total values of imports and exports have the largest Gini coefficients in terms of maximum, minimum, and average values, while economic growth rate scores lowest. Thus, following the guidelines of the United Nations Development Programme, we adopt a value of 0.2 as indicative of balanced development, a value of 0.4 as the margin of balanced development, and a value of 0.6 as indicative of extremely uneven development in order to classify Gini coefficient values between 2000 and 2014. The data presented in Table 2 show that urbanization rate, economic growth rate, the proportion of tertiary industry, road density, the comprehensive utilization rate of industrial solid waste, per capita disposable income of urban households, and the per capita disposable income of rural households have all reached a balanced state of development (as of 2014), while the total value of imports and exports and the total amount of utilized foreign investment remain in an extremely unbalanced state of development; the Gini coefficients for these variables were higher than 0.7, which can be explained by the fact that Beijing and Tianjin accounted for more than 90% of the total value of imports and exports and more than 80% of total utilized foreign investment in most years. These results imply that opening the BTH to the outside world still predominantly relies on these two gateway cities. At the same time, Gini coefficients for the number of college students per 10,000 of population also exceeded the 0.4 level, indicating that the allocation of higher educational resources within the BTH region is also very unbalanced and therefore not conducive to further collaborative development. The Gini coefficients of all remaining indicators fell between 0.2 and 0.4, indicating that their collaborative development should also be further improved; in terms of variable trends, population density gap, GDP per capita, economic growth rate, labor productivity in secondary industry, labor productivity in tertiary industry, and freight volume per capita among regions continued to increase over the course of the study period, while the urbanization rate gap, labor productivity in primary industries, road density, the comprehensive utilization rate of industrial solid waste, the number of licensed physicians per 10,000 of population, the total amount of utilized foreign investment, and the total value of imports and exports amongst regions gradually narrowed. Differences in remaining indicators amongst regions remained largely unchanged over the course of this study period.
The results of this study show that while some progress has been made in the collaborative development of the BTH regions in terms of promoting urbanization, constructing transportation infrastructure, protecting the environment, and improving the living standards of residents, progress in balancing population distribution, accelerating economic growth, optimizing industrial structures, and equalizing public services remained relatively slow or even decreased between 2000 and 2014. Although some collaborative developmental progress has been made in terms of opening this region up to the outside world, a great deal of potential nevertheless remains. Targeted policies are therefore urgently needed to promote the smooth progress of collaborative development within the BTH region.
As discussed previously, fixed asset investment and fiscal expenditure per capita were considered as factors influencing collaborative development and their Gini coefficients were calculated (Figure 4). A reduction in the Gini coefficients for these influencing factors is indicative of a gradually more balanced spatial distribution within the BTH region. Data show that the Gini coefficients of per capita fixed asset investment reached a maximum of 0.396 in 2001, before subsequently decreasing; this decline has slowed down in recent years and reveals that the collaborative development of fixed asset investment equalization started earlier, but has not developed very effectively more recently. In contrast, Gini coefficients of per capita fiscal expenditure tended to increase after 2000, reaching a maximum of 0.582 in 2008, before continuing to decrease to a minimum value of 0.378 in 2014. These data suggest that the equalization of fiscal expenditure started relatively late during the time period of this study, only received sufficient attention after 2008, and has developed rapidly in recent years, especially over the last two.

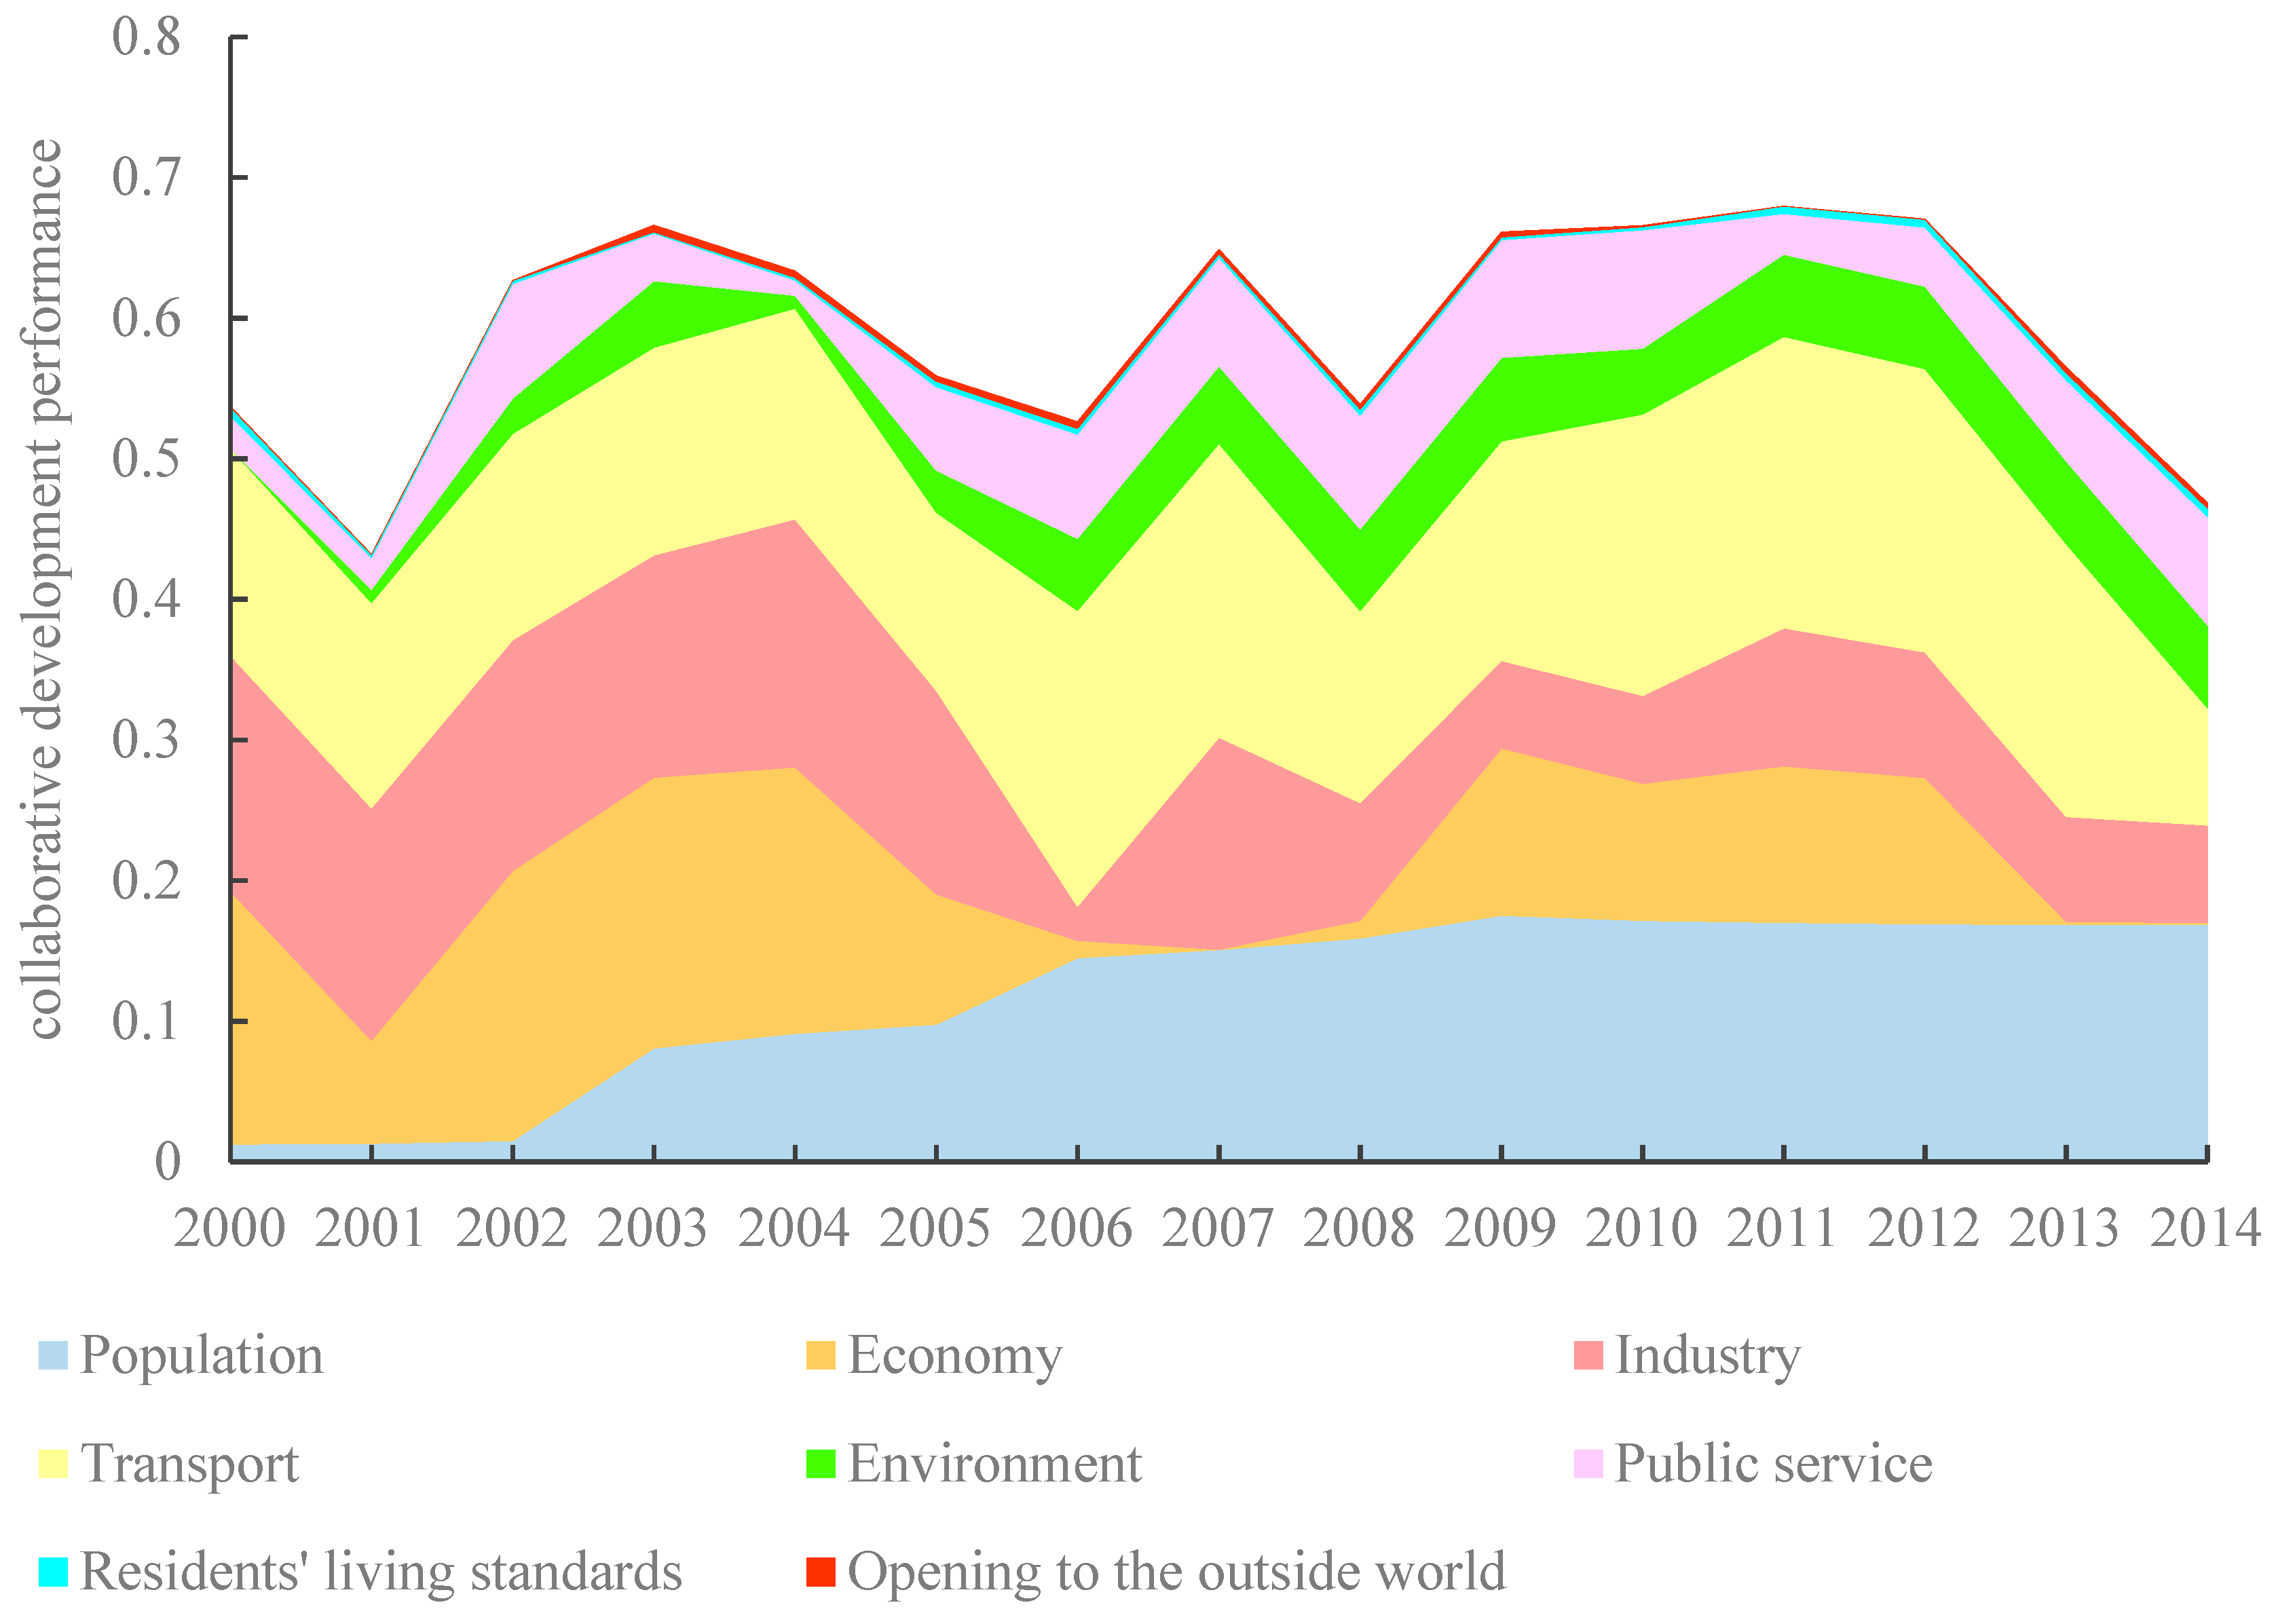
4.2. Evaluating the Performance of Collaborative Development

Gini coefficients for collaborative developmental indicators were calculated in this study and the entropy weight model was used to determine the weight of each indicator. This enabled application of the TOPSIS method to evaluate the collaborative developmental performance of the BTH region between 2000 and 2014 (Figure 5). The results show that the collaborative development performance score of the BTH region varied between 0.4 and 0.7 between 2000 and 2014. As discussed above, it is generally accepted that a score of less than 0.3 is indicative of the primary collaboration stage, a score between 0.3 and 0.6 is indicative of an intermediate collaboration stage, a score between 0.6 and 0.8 suggest the advanced collaboration stage, and a score greater than 0.8 is indicative of the highest stage of collaboration. On this basis, the BTH region can be roughly classified within the intermediate stage of collaboration, developing towards an advanced stage. This score for collaborative developmental performance nevertheless hit rock bottom (0.432) in 2001 before varying upwards, reaching a zenith of 0.680 in 2011, and then declining rapidly. Data show that the coordinated developmental performance of the BTH region had still not reached the highest collaborative stage even by 2014, which suggests that a large amount of expansion space is still available for this process.
The data presented in this paper also reveal some temporal volatility in the collaborative developmental performance of the BTH region, including remarkable declines in 2001, 2006, 2008, and 2014. These discrepancies can mainly be explained by poor economic and industrial subsystem performances; divergence in economic growth is the main explanation for the 2001 decrease, while differentiation in economic growth and GDP per capita as well as the unbalanced development of labor productivity contributed most to the 2006 decline. Similar scenarios were also seen in both 2008 and 2014, while the uneven economic and industrial development led to an overall poor collaborative developmental performance, largely the result of the 2008 global financial crisis and the 2012 European debt crisis. These results suggest that as globalization has deepened, the collaborative development of the BTH region has increasingly been affected by external conditions and therefore needs to strengthen its resistance to economic crises.

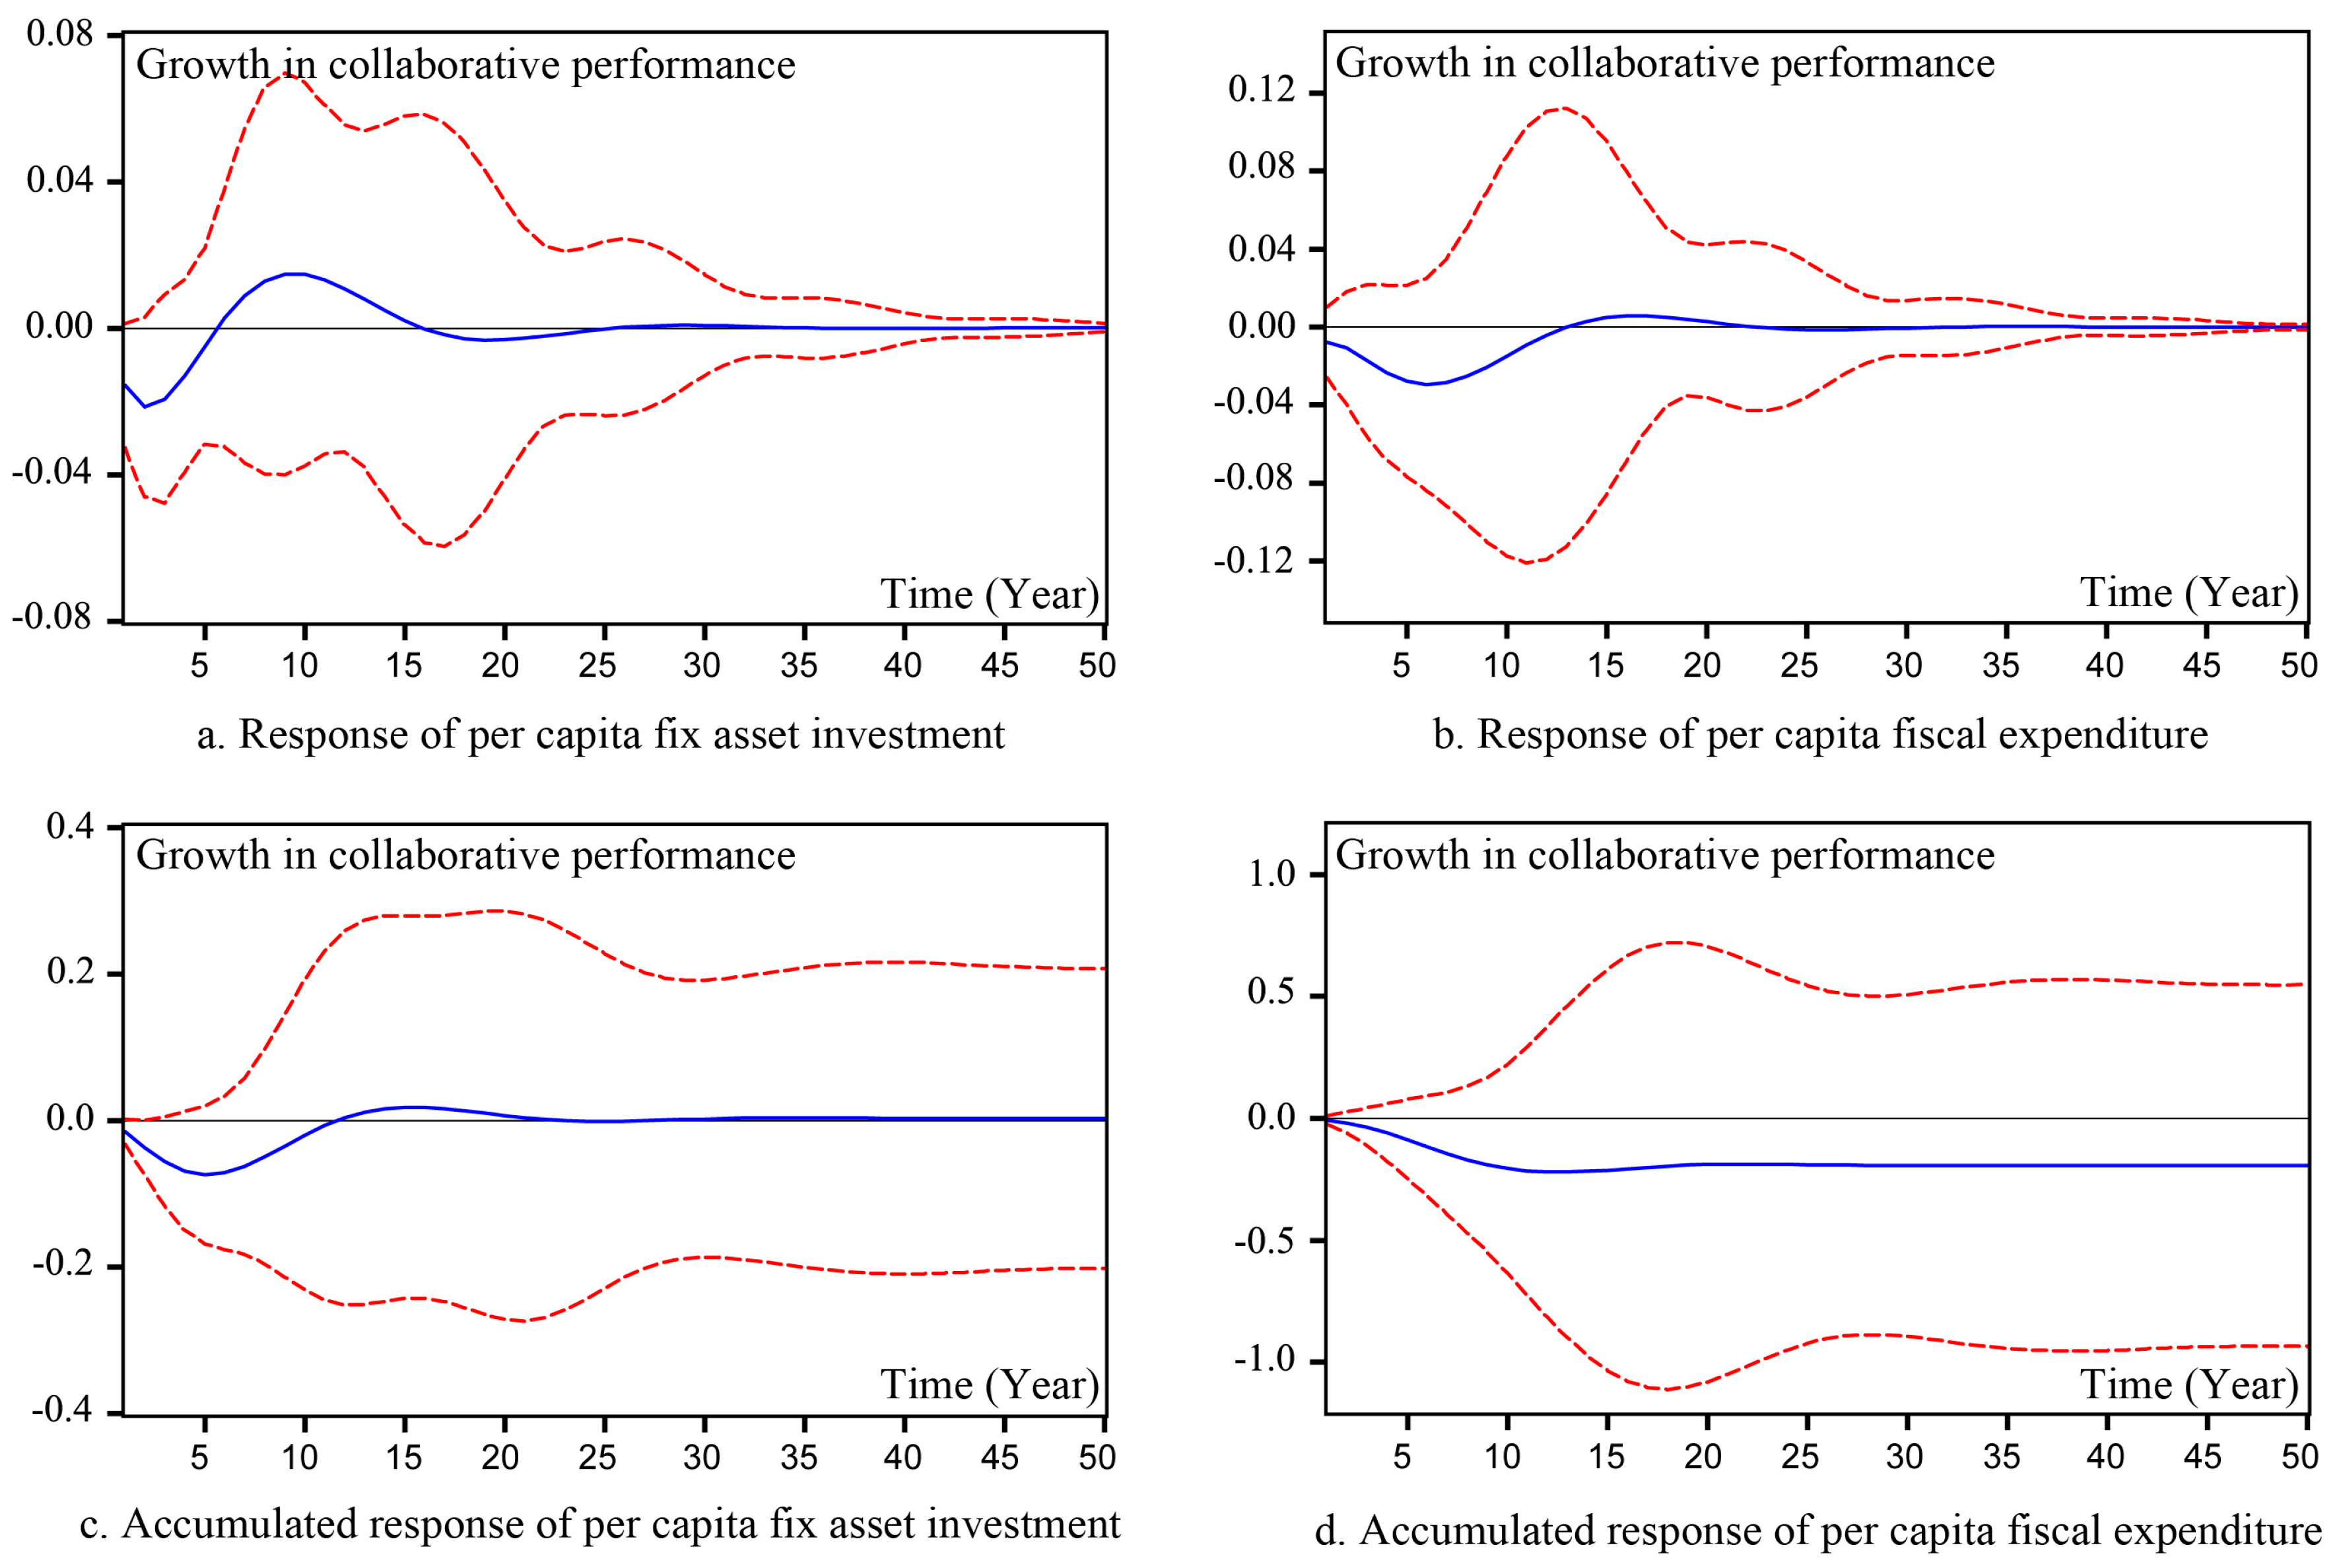
4.3. Analysis of Collaboration Development Mechanism

A three-variable VAR model was initially constructed to analyze collaborative developmental factors (i.e., investment in per capita fixed assets and fiscal expenditure) and development performance before impulse response functions were applied to elucidate the mechanisms of collaborative development. The unit root tests are performed and the results are displayed in Table 3. The results show that all variables are level stationary at the 0.05 level or higher [49]. In addition, to determine the lag order (p) of the VAR model is of great importance, results for six criteria are presented in Table 4, including the LR, FPE, and SC criteria, which all have p = 1 as their optimal lag order. We therefore constructed a three-variable VAR(1) model of collaborative developmental factors and performance. The Granger causality test was also performed (see Supporting Information Table S1). The results show that most of the variables are statistically insignificant. However, as Diebold said [50], the Granger causality test can only finds “predictive causality” other than “true causality”. In addition, since the independent variables will certainly have an influence on collaborative development performance as we described in Figure 1, the insignificance may result from the limitation of study period. The VAR model constructed in this study is still effective and can be trusted.
It is necessary to initially test the VAR model in order to ensure the effectiveness of impulse response results. However, the VAR model is only stable and response resul ts are only effective when the reciprocals of the modules of all unit roots are less than 1, within the unit circle. As the reciprocal of the maximum unit root module in this case was 0.218, module reciprocals for all unit roots were within the unit circle and therefore demonstrates that the stability of the VAR(1) model constructed for use in this study and its applicability for performing impulse response analyses. The estimation results of VAR(1) model is presented in Table 5. All models were significant at the 0.05 level, the VAR model constructed in this study is reliable. We therefore carried out an impulse response analysis using this VAR(1) model, setting the impact response period to 50 to reveal changes in impact trends (Figure 6).
The results presented in Figure 6 show that both investment in per capita fixed assets and fiscal expenditure exert significant impacts on the performance of collaborative development, conforming to a fluctuating curve which decays over time. Data show that during initial periods, both per capita investment in fixed assets and fiscal expenditure exerted a significantly negative impact on collaborative performance; in other words, the equalization of investment in per capita fixed assets and fiscal expenditure (i.e., decreasing Gini coefficients) has significantly improved the performance of collaborative development within the BTH region as predicted on the basis of theory. In contrast, investment in fixed assets per capita reached a maximum negative response point in terms of its effect on collaborative developmental performance in period 2, gradually advanced and became positive in period 6, attained a maximum positive response point in period 9, and then rapidly converged. This trend indicates that the equalization of per capita fixed asset investment significantly promoted the collaborative development of the BTH region during the first six time periods, and then hindered this process subsequently. A similar trend was seen in per capita fiscal expenditure, although this variable lagged behind per capita fixed asset investment, characterized by an impact curve that reached a maximum negative response point in period 6, continued to advance, became positive in period 14, and then attained its maximum positive response in period 17. In terms of accumulated response, the accumulated response of per capita fixed asset investment on the performance of collaborative development was positive, which means that the equalization of this variable has a negative effect on the collaborative developmental performance of the BTH region. At the same time, the fact that the accumulated response of per capita financial expenditure was negative suggests that the equalization of this variable significantly enhances the performance of collaborative development.
Regarding impulse response trends, it is clear that the equalization of per capita investment in fixed assets has tended to promote the sustainable collaborative development of the BTH region over short timescales, while also having a negative effect on this process over longer periods. There are several possible explanations for this, including in the first place that the spatial equalization of per capita investment in fixed assets will significantly enhance the economic output of all regions over short time periods. Over longer periods, however, the economic growth of megacities will be significantly faster than that of their smaller counterparts due to economies of scale, and this will lead to a gradual widening of the regional gap, as evidenced by the gradually increasing Gini coefficients of GDP per capita and economic growth rate. At the same time, excessive investment in some cities may lead to the formation of an industrial structure that is not suitable for its own resource endowments, further meaning that regional outputs cannot reach an appropriate level. One effect of this will be an overcapacity of regional manufacturing [51]. Secondly, the construction of transportation infrastructure is a key component of fixed asset investment; this means that the spatial equalization of per capita investment in fixed assets will significantly enhance the accessibility between cities within the BTH region. At the same time, however, convenient communications also facilitate further population concentration, move resources from less developed areas to megacities, and lead to performance reductions in collaborative development. This result is corroborated by a gradual increase in population-density Gini coefficients. In conclusion, the results of both impulse response analysis and the reality of collaborative development within the BTH region imply that boosting this process in this area via increasing fixed asset investment might not be the most optimal approach. In contrast, the equalization of financial expenditure currently takes priority over the equalization of fixed asset investments in promoting collaborative development. At the moment, collaborative developments in population, environment, public services, and the livelihoods of people are influenced to a greater extent by fiscal expenditure than by collaborative developments in the economy, industry, transportation, and opening up to the outside world which are all more significantly influenced by fixed asset investment. Meanwhile, the trajectories of both per capita investment in fixed assets and financial expenditure have experienced hysteresis; data show that the lag period for investments in fixed assets is two years, while the same period for financial expenditure is six years, suggesting that the influence of these factors takes time to have an influence on the promotion of collaborative development. Indeed, the hysteresis of fixed asset investments identified in this study may be related to the two-year construction period of most projects (i.e., plant construction) associated with fixed asset investment. In contrast, more time is needed for fiscal expenditure to have an effect on the collaborative development of population levels, the environment, public services, and the livelihoods of people. Addressing this issue is often tortuous and time-consuming.
In conclusion, although investment in fixed assets has been shown to exert a negative effect on collaborative development over long time scales, its role in promoting this process cannot be denied. Thus, because of the huge gaps in economic development that are seen between cities within the BTH region, it remains crucial to provide stimuli for the economic development of this area, especially the more economically deprived territories. Investment in fixed assets in the right places and within the right industries is therefore critical and of great importance, while the equalization of per capita fiscal expenditure should also be addressed as a matter of urgency, as this would significantly promote the collaborative development of population, the environment, public services, and the livelihoods of people; as a result, “excessive concentration” within megacities could be resolved.

5. Conclusions and Outlook

5.1. Conclusions

This goal of this study was to outline a comprehensive evaluation index system to assess the performance of collaborative development within the BTH region, based on an overall analysis of the concept of this process and via a comprehensive review of previous research. Thus, utilizing socioeconomic data from 13 districts within the BTH region for the period between 2000 and 2014, Gini coefficients and the TOPSIS method supported by an entropy weight model were employed in this study to assess collaborative developmental performance. We then utilized impulse response functions to analyze the mechanisms underlying the performance of collaborative development.
The results of this study reveal that collaborative development within the BTH region has tended to slowly increase over time, but with fluctuations. Remarkable declines nevertheless took place in 2001, 2006, 2008, and 2014, which can mainly be explained by international economic downturn “black swan events”, such as the 2008 financial crisis. Although some progress has been made in promoting urbanization, constructing traffic networks, protecting the environment, and improving living standards, very significant expansion space nevertheless remains for further improvements. The equalization of per capita fixed asset investment observably boosted collaborative development at the start of the study period, but impeded this process over the longer term because of the existence of economies of scale and other factors. In contrast, the equalization of per capita fiscal expenditure has contributed to the collaborative development of the BTH region over both short and long timescales. With these conclusions, the following policy suggestions are proposed to promote smooth collaborative development of the BTH region. In the first place, further efforts should be made to improve the performance of collaborative development, especially in terms of accelerating economic growth, optimizing industrial structures, opening up to the outside world, and improving the living standards of residents, while the stability of the BTH region should also be enhanced in order to better enable the capacity to withstand economic crises. Secondly, the spatial and industrial distributions of fixed asset investments should be optimized, while the efficiency of investment in cities and industries needs to be scientifically evaluated so that it can be used to provide a framework for this process. Thirdly, the role of fiscal expenditure in promoting collaborative development needs to be vigorously enhanced across the BTH region, and the equalization of this variable should be continually moved forward. Since the ability to make financial payments is closely related to the nature of the local economy, increasing financial capacity via ecological compensation is also of paramount importance, especially in more retrograde areas. The establishment and improvement of an appropriate ecological compensation mechanism (an institutional arrangement between the interests of the relevant parties in ecological conservation and environmental protection with administrative and market means) according to local conditions is therefore also an urgent requirement in the BTH region. Finally, because of the volatility and lag effects that result from the influence of these variables, effective collaboration between investment in fixed assets and fiscal expenditure will also be essential for steady collaborative development of the BTH region.
This study has academic value in terms of enriching regional collaborative development theory and research methodology. Firstly, an evaluation index system of collaborative development performance is established based on a thorough review of previous research as well as local conditions, which will conduce to the further improvement of regional collaborative development theory. Secondly, a new approach is provided to assess regional collaborative performance. With the Gini Coefficient and the TOPSIS method supported by the entropy weight model we can take spatial and temporal change into account in evaluating regional collaborative developmental performance. In other words, with this approach the regional collaborative developmental performance can be assessed using panel data, which is seldom applied in previous studies. Meanwhile, each indicator in the index system is common and easily accessible, which means the index system is of universal applicability and could be performed elsewhere. In addition, since we employed the entropy method in the determination of weight coefficient, the influence of man-made subjectivity is well avoided, and scholars can add indicators that they consider reasonable to make the index system more in line with local conditions. Lastly, the fixed assets investment and fiscal expenditure are two primary means of promoting collaborative development by the government in most areas. Hence, to explore the impact of the two variables on collaborative development performance and to propose policy recommendations accordingly is practical and effective, which can contribute to the promotion of collaborative development in other areas.

5.2. Limitations and Prospect

There are several limitations in this study. Firstly, the impulse response functions were employed to elucidate the collaborative development mechanisms. However, if the variables failed to meet the requirement of impulse response analysis (i.e., not stationary), then other methods would be necessary for analyzing the mechanisms. Secondly, the study period of this paper is from 2000 to 2015. Technically, the results can only reflect the performance and mechanism of collaborative development within BTH region during this period. Extending the study period and contrasting with other regions would contribute to the deep understanding of performance and mechanism of collaborative development. Thirdly, only one indicator is used to represent environment quality due to lack of data. The use of more indicators is probably important to improve the study, and hence more efforts need to be made on this. Furthermore, the intrinsic logic that connects collaborative indicators should be recognized and utilized. Generally, optimizing industrial structures and opening up this region to the outside world will both be conducive to speeding up economic growth, and will then also contribute to the equalization of public services as well as to a balanced population distribution. Mutual cooperation between indicators should also be promoted in order to create positive feedback that enhances the collaborative development of the BTH region as well as other areas.

Supplementary Materials

The following are available online at https://0-www-mdpi-com.brum.beds.ac.uk/2071-1050/10/2/471/s1, Table S1: Results of Granger causality test.

Acknowledgments

This work was supported by the Chinese National Nature Science Foundation Major Grant (Grant nos. 41590840, 41590842).

Author Contributions

Chuanglin Fang conceived and designed the experiments, Kui Luo contributed data collection and analysis tools; Kui Luo and Yunlong Kong analyzed the data; Chuanglin Fang, Kui Luo, Haoxi Lin and Yufei Ren wrote the paper.

Conflicts of Interest

The authors declare no conflict of interest.

References

  1. Perroux, F. Economic space: Theory and applications. Q. J. Econ. 1950, 64, 89–104. [Google Scholar] [CrossRef]
  2. Vernon, R. The product cycle hypothesis in a new international environment. Oxf. Bull. Econ. Stat. 1979, 41, 255–267. [Google Scholar] [CrossRef]
  3. Brookfield, H. Interdependent Development; Routledge: Abingdon, UK, 2012. [Google Scholar]
  4. Lucas, R.E., Jr. On the mechanics of economic development. J. Monetary Econ. 1988, 22, 3–42. [Google Scholar] [CrossRef]
  5. Romer, P.M. Increasing returns and long-run growth. J. Political Econ. 1986, 94, 1002–1037. [Google Scholar] [CrossRef]
  6. Krugman, P.R. Geography and Trade; MIT Press: Cambridge, MA, USA, 1993. [Google Scholar]
  7. Porter, M.E. Competitive Advantage of Nations: Creating and Sustaining Superior Performance; Simon and Schuster: New York, NY, USA, 2011; Volume 2. [Google Scholar]
  8. Humphrey, J.; Schmitz, H. Governance and Upgrading: Linking Industrial Cluster and Global Value Chain Research; Institute of Development Studies: Brighton, UK, 2000; Volume 120. [Google Scholar]
  9. Gereffi, G.; Humphrey, J.; Sturgeon, T. The governance of global value chains. Rev. Int. Political Econ. 2005, 12, 78–104. [Google Scholar] [CrossRef]
  10. Orenstein, D.E.; Shach-Pinsley, D. A comparative framework for assessing sustainability initiatives at the regional scale. World Dev. 2017, 98, 245–256. [Google Scholar] [CrossRef]
  11. Cottour, C.; Lelarge, P.; Milan, O. Une Brève Histoire de l’aménagement de Paris et sa Région; DREIF Paris: Paris, France, 2008. [Google Scholar]
  12. Abercrombie, P. Greater London Plan; University of London Press: London, UK, 1944; Available online: https://www.researchgate.net/publication/282815561_London_1944_Greater_London_Plan (accessed on 20 December 2017).
  13. Kreins, J.M. Histoire du Luxembourg, 3rd ed.; Presses Universitaires de France: Paris, France, 2003. (In French) [Google Scholar]
  14. Akins, J.E. The oil crisis: This time the wolf is here. Foreign Aff. 1973, 51, 462–490. [Google Scholar] [CrossRef]
  15. Brundtland, G.H. Report of the World Commission on Environment and Development: “Our Common Future”; United Nations: New York, NY, USA, 1987. [Google Scholar]
  16. Evrendilek, F.; Doygun, H. Assessing major ecosystem types and the challenge of sustainability in Turkey. Environ. Manag. 2000, 26, 479–489. [Google Scholar] [CrossRef] [PubMed]
  17. Albino, V.; Kuhtz, S. Enterprise input-output model for local sustainable development—The case of a tiles manufacturer in Italy. Resour. Conserv. Recycl. 2004, 41, 165–176. [Google Scholar] [CrossRef]
  18. Oliveira, C.; Antunes, C.H. A multiple objective model to deal with economy-energy-environment interactions. Eur. J. Oper. Res. 2004, 153, 370–385. [Google Scholar] [CrossRef]
  19. Oliveira, C.; Antunes, C.H. A multi-objective multi-sectoral economy-energy-environment model: Application to Portugal. Energy 2011, 36, 2856–2866. [Google Scholar] [CrossRef]
  20. Allan, G.; Hanley, N.; McGregor, P.; Swales, K.; Turner, K. The impact of increased efficiency in the industrial use of energy: A computable general equilibrium analysis for the United Kingdom. Energy Econ. 2007, 29, 779–798. [Google Scholar] [CrossRef]
  21. Duan, H.B.; Zhu, L.; Fan, Y. Modelling the evolutionary paths of multiple carbon-free energy technologies with policy incentives. Environ. Model. Assess. 2015, 20, 55–69. [Google Scholar] [CrossRef]
  22. Chen, P.Y.; Chen, S.T.; Hsu, C.S.; Chen, C.C. Modeling the global relationships among economic growth, energy consumption and CO2 emissions. Renew. Sustain. Energy Rev. 2016, 65, 420–431. [Google Scholar] [CrossRef]
  23. Wang, Q.S.; Yuan, X.L.; Cheng, X.X.; Mu, R.M.; Zuo, J. Coordinated development of energy, economy and environment subsystems-A case study. Ecol. Indic. 2014, 46, 514–523. [Google Scholar] [CrossRef]
  24. Li, H.D.; Wang, S.; Liu, Y. Evolution method and empirical research of regional synergetic development degree based on grey relational theory and distance collaborative model. Syst. Eng. Theory Pract. 2014, 34, 1749–1755. [Google Scholar]
  25. Wang, J.J. The evaluation and analysis of the coordination degree between economic and resources environment in Zhujiang Delta. J. Anhui Agric. Sci. 2011, 39, 2867–2869. [Google Scholar]
  26. Zhang, Z.Y.; Liu, L.; Tang, X.L.; Xu, L.P. Evaluation of coordinated development degree of urban human settlement environment and economic development—A case of Urumqi. J. Arid Land Resour. Environ. 2011, 25, 18–22. [Google Scholar]
  27. Oliveira, C.; Coelho, D.; Antunes, C.H. Coupling input-output analysis with multiobjective linear programming models for the study of economy-energy-environment-social (E3S) trade-offs: A review. Ann. Oper. Res. 2016, 247, 471–502. [Google Scholar] [CrossRef]
  28. Yuan, B.L.; Ren, S.G.; Chen, X.H. Can environmental regulation promote the coordinated development of economy and environment in China’s manufacturing industry?—A panel data analysis of 28 sub-sectors. J. Clean. Prod. 2017, 149, 11–24. [Google Scholar] [CrossRef]
  29. Li, Y.; Wu, F.L. The transformation of regional governance in China: The rescaling of statehood. Prog. Plan. 2012, 78, 55–99. [Google Scholar] [CrossRef]
  30. Nygaard, K.; Bosak, K. A critical assessment of the Mineral County Challenge: The role and implications of scale in collaborative development. J. Rural Stud. 2014, 34, 235–245. [Google Scholar] [CrossRef]
  31. Li, L.; Liu, Y. The driving forces of regional economic synergistic development in china: Empirical study by stages based on haken model. Geogr. Res. 2014, 33, 1603–1616. [Google Scholar]
  32. Leng, S.Y.; Zhai, Y.Z.; Jiang, S.J.; Lei, Y.; Wang, J.S. Water-environmental risk assessment of the Beijing-Tianjin-Hebei collaborative development region in China. Hum. Ecol. Risk Assess. 2017, 23, 141–171. [Google Scholar] [CrossRef]
  33. Wang, G.; Cheng, S.Y.; Li, J.B.; Lang, J.L.; Wen, W.; Yang, X.W.; Tian, L. Source apportionment and seasonal variation of PM2.5 carbonaceous aerosol in the Beijing-Tianjin-Hebei region of China. Environ. Monit. Assess. 2015, 187, 143. [Google Scholar] [CrossRef] [PubMed]
  34. Li, X.; Zhang, Q.; Zhang, Y.; Zheng, B.; Wang, K.; Chen, Y.; Wallington, T.J.; Han, W.J.; Shen, W.; Zhang, X.Y.; et al. Source contributions of urban pm2.5 in the beijing-tianjin-hebei region: Changes between 2006 and 2013 and relative impacts of emissions and meteorology. Atmos. Environ. 2015, 123, 229–239. [Google Scholar] [CrossRef]
  35. Bilal, M.; Nichol, J.E. Evaluation of modis aerosol retrieval algorithms over the Beijing-Tianjin-Hebei region during low to very high pollution events. J. Geophys. Res. Atmos. 2015, 120, 7941–7957. [Google Scholar] [CrossRef]
  36. Xiong, L.C.; Yu, C.; de Jong, M.; Wang, F.T.; Cheng, B.D. Economic transformation in the Beijing-Tianjin-Hebei region: Is it undergoing the environmental kuznets curve? Sustainability 2017, 9, 869. [Google Scholar] [CrossRef]
  37. LGFEA. The Outline of Collaborative Development of Beijing, Tianjin and Hebei Province. Available online: http://news.china.com.cn/node_7222674.htm (accessed on 10 October 2017).
  38. Cobb, C.W.; Douglas, P.H. A theory of production. Am. Econ. Rev. 1928, 18, 139–165. [Google Scholar]
  39. De Wulf, K.; Odekerken-Schroder, G.; Iacobucci, D. Investments in consumer relationships: A cross-country and cross-industry exploration. J. Mark. 2001, 65, 33–50. [Google Scholar] [CrossRef]
  40. Lakshmanan, T.R. The broader economic consequences of transport infrastructure investments. J. Transp. Geogr. 2011, 19, 1–12. [Google Scholar] [CrossRef]
  41. Gini, C. Variabilità e mutabilità. In Reprinted in Memorie di Metodologica Statistica; Pizetti, E., Salvemini, T., Eds.; Libreria Eredi Virgilio Veschi: Rome, Italy, 1912. [Google Scholar]
  42. Yoon, K.; Hwang, C.-L. Multiple Attribute Decision Making: Methods and Applications; Springer: Berlin, Germany, 1981. [Google Scholar]
  43. Yoon, K. A reconciliation among discrete compromise solutions. J. Oper. Res. Soc. 1987, 38, 277–286. [Google Scholar] [CrossRef]
  44. Hwang, C.-L.; Lai, Y.-J.; Liu, T.-Y. A new approach for multiple objective decision making. Comput. Oper. Res. 1993, 20, 889–899. [Google Scholar] [CrossRef]
  45. Sun, L.-Y.; Miao, C.-L.; Yang, L. Ecological-economic efficiency evaluation of green technology innovation in strategic emerging industries based on entropy weighted TOPSIS method. Ecol. Indic. 2017, 73, 554–558. [Google Scholar] [CrossRef]
  46. Sims, C.A. Macroeconomics and reality. Econ. J. Econ. Soc. 1980, 48, 1–48. [Google Scholar] [CrossRef]
  47. Lütkepohl, H. New Introduction to Multiple Time Series Analysis; Springer Science & Business Media: Berlin, Germany, 2005. [Google Scholar]
  48. Zhang, K.Y.; Cai, Z.B. The history review, limiting factors and future direction of the collaborative development of the Beijing-Tianjin-Hebei region (in Chinese). Hebei Acad. J. 2014, 34, 101–105. [Google Scholar]
  49. Dvouletý, O. Relationship between unemployment and entrepreneurship dynamics in the Czech Regions: A Panel VAR Approach. Acta Univ. Agric. Silvicult. Mendel. Brun. 2017, 65, 987–995. [Google Scholar] [CrossRef]
  50. Diebold, F.X. Elements of Forecasting; South-Western College Pub.: Nashville, TN, USA, 1998. [Google Scholar]
  51. Shen, G.; Chen, B. Zombie firms and over-capacity in Chinese manufacturing. China Econ. Rev. 2017, 44, 327–342. [Google Scholar] [CrossRef]
Figure 1. Mechanisms of collaborative development within the BTH region. (Source: author’s elaboration).
Sustainability 10 00471 g001
Figure 2. Flow chart of evaluation performance and elucidation the mechanisms of collaborative development within the BTH region. (Source: author’s elaboration). TOPSIS: technique for order preference by similarity to an ideal solution; VAR: vector auto regression.
Sustainability 10 00471 g002
Figure 3. Map to show the location of the BTH region. (Source: ArcGIS 10.2 (Environmental Systems Research Institute, Redlands, CA, USA), author’s elaboration).
Sustainability 10 00471 g003
Figure 4. Gini coefficients of the influencing factors. (Source: R software and Excel 2013, author’s elaboration, each indicator is calculated with the 13 districts of the BTH region).
Sustainability 10 00471 g004
Figure 5. Collaborative developmental performance of the BTH region. (Source: Excel 2013, author’s elaboration).
Sustainability 10 00471 g005
Figure 6. Impulse response analysis results. (Source: EViews software, author’s elaboration).
Sustainability 10 00471 g006
Table 1. The index system used in this study to evaluate the performance of collaborative development within the Beijing–Tianjin–Hebei (BTH) region.
TargetCriteriaIndicators
Evaluation index system of collaborative development performance for BTH regionPopulationPopulation density, Urbanization rate
EconomyGDP per capita, Economic growth rate
IndustryLabor productivity in the primary industry, Labor productivity in the second industry, Labor productivity in the tertiary industry, Proportion of tertiary industry in GDP
TransportationRoad density, Passenger volume per capita, Freight volume per capita
EnvironmentComprehensive utilization rate of industrial solid waste
Public servicesNumber of college students per 10,000 population, Number of licensed physicians per 10,000 population
Living standards of residentsPer capita disposable income of urban households, Per capita disposable income of rural households
Opening up to the outside worldTotal amount of Foreign Investment actually utilized, Total value of imports and exports
(Source: author’s elaboration).
Table 2. Basic summary statistics of indicator Gini coefficients during 2000–2014.
IndicatorsMaximumMinimumMeanObs.Tendency
Population density0.2980.2350.25915 Sustainability 10 00471 i001
Urbanization rate0.2940.1180.18415 Sustainability 10 00471 i002
GDP per capita0.2910.2440.27015 Sustainability 10 00471 i003
Economic growth rate0.1050.0330.07015 Sustainability 10 00471 i004
Labor productivity in the primary industry0.2670.1530.20415 Sustainability 10 00471 i005
Labor productivity in the second industry0.2800.1280.20615 Sustainability 10 00471 i006
Labor productivity in the tertiary industry0.2650.1640.21815 Sustainability 10 00471 i007
Proportion of tertiary industry in GDP0.1490.1020.13715 Sustainability 10 00471 i008
Road density0.2230.1380.16915 Sustainability 10 00471 i009
Passenger volume per capita0.3000.2190.26315 Sustainability 10 00471 i010
Freight volume per capita0.5920.1990.31115 Sustainability 10 00471 i011
Comprehensive utilization rate of industrial solid waste0.2620.1400.18115 Sustainability 10 00471 i012
Number of college students per 10,000 population0.4720.3570.41015 Sustainability 10 00471 i013
Number of licensed physicians per 10,000 population0.4640.2040.30715 Sustainability 10 00471 i014
Per capita disposable income of urban households0.1310.1140.12115 Sustainability 10 00471 i015
Per capita disposable income of rural households0.2110.1710.19315 Sustainability 10 00471 i016
Total amount of Foreign Investment actually utilized0.8050.6720.73915 Sustainability 10 00471 i017
Total value of imports and exports0.8580.8110.82515 Sustainability 10 00471 i018
(Source: R software (The R Foundation for Statistical Computing, Vienna, Austria), author’s elaboration, each indicator is calculated with the 13 districts of the BTH region).
Table 3. Results of unit root tests for the VAR model.
VariablesDickey–Fuller GLS (ERS)Augmented Dickey–FullerKwiatkowski–Philips–Schmidt–Shin
Collaborative development performance (Y)−2.456 **−3.253 **0.159 **
Gini Coefficient of per capita fixed asset investment (FI)−2.734 **−4.79 ***0.510 **
Gini Coefficient of per capita fiscal expenditure (FE)−2.890 **−2.484 **0.169 **
Note: *** is significance level at 1%; ** is significance level at 5%. (Source: Eviews software (Information Handling Services Markit, London, UK), author’s elaboration).
Table 4. Optimal lag order selected by the six criteria of the VAR model.
LagLogLLRFPEAICSCHQ
065.593NA1.32 × 10−8−9.630−9.499−9.656
188.97832.380 *1.54 × 10−9 *−11.843−11.321 *−11.950
298.1948.5062.04 × 10−9−11.876 *−10.963−12.064 *
Note: * is optimal lag order. (Source: Eviews software, author’s elaboration).
Table 5. Estimated VAR (1), 14 observations, standard errors are in parentheses.
VariablesCollaborative Development Performance (Y)Gini Coefficient of Per Capita Fixed Asset Investment (FI)Gini Coefficient of Per Capita Fiscal Expenditure (FE)
Y(−1)0.621(0.169)0.040
(0.240)(0.168)(0.172)
FI(−1)0.4290.6930.372
(0.201)(0.199)(0.204)
FE(−1)0.301(0.111)0.970
(0.244)(0.220)(0.225)
R−squared0.5650.6630.748
Adj. R−squared0.4940.5630.673
F−statistic5.2006.5729.914
(Source: Eviews software, author’s elaboration).

