Article

Dynamic Evolution of Regional Discrepancies in Carbon Emissions from Agricultural Land Utilization: Evidence from Chinese Provincial Data

1
College of Public Administration, Central China Normal University, Wuhan 430079, China
2
College of Public Administration, Huazhong University of Science and Technology, Wuhan 430074, China
*
Author to whom correspondence should be addressed.
Sustainability 2018, 10(2), 552; https://0-doi-org.brum.beds.ac.uk/10.3390/su10020552
Submission received: 4 January 2018 / Revised: 30 January 2018 / Accepted: 12 February 2018 / Published: 22 February 2018
(This article belongs to the Section Sustainable Agriculture)

Abstract

:
Agricultural land, as an important carbon source, has produced about 20% of carbon dioxide globally. The calculation and spatial-temporal distribution of carbon emissions resulting from agricultural land utilization (ALU) has attracted a great deal of attention from scholars. Most of the existing literature widely agrees that China’s carbon emissions from ALU showed significant regional discrepancies, but rarely pays attention to the evolutionary characteristics of the discrepancies. This study calculated the total carbon emissions from ALU based on six kinds of carbon emissions sources in the 31 provinces of mainland China, which showed obviously different characteristics in terms of their abundances of agricultural land resources, relative scarcities of production factors, levels of science and technology and economic prosperity. We then analyzed the evolutionary process and characteristics of regional discrepancies in carbon emissions from ALU at the national level and regional level with the method of kernel density estimation. The key results demonstrated the following: (1) The carbon emissions from ALU in the whole country and the eastern, central and western regions of China have increased sharply during the study period. From 2000 to 2015, the carbon emissions from ALU in the whole of China, the eastern region, central region, and western region were increased by 2626.11 (104 tons), 441.32 (104 tons), 1054.45 (104 tons), and 1130.3 (104 tons), respectively, with an average annual growth rate of 2.75%, 1.29%, 3%, and 4.35%, respectively; (2) The scale of carbon emissions from ALU showed significant spatial disparities at the regional and inter-provincial levels. From 2000 to 2015, the central region had the highest carbon emissions from ALU, while the eastern and western regions had the second and third highest carbon emissions; (3) The distribution curves of carbon emissions from ALU in the whole country and each region all moved in the right direction gradually during the study period, and the width of the curves increased, indicating the regional discrepancies of carbon emissions from ALU was expanding at different spatial scales. Distribution curves of carbon emissions from ALU in the eastern, central and western regions all showed a “multi-polar” differentiation phenomenon in 2000, while presented a “tri-polar”, “bipolar” and “multi-polar” division in 2015, respectively.

1. Introduction

Global warming caused by greenhouse gas (GHG) emissions has raised worldwide concern [1] and has become a major challenge to the sustainable development of human society and natural eco-systems [2]. Many countries, like China, Canada, and so on, have realized the threat of global warming and have taken a lot of measures to reduce GHG emissions and limit the rise of average global temperature [3,4,5]. However, the effect of mitigating GHG is not significant and the emissions have increases continuously [6,7]. Reducing GHG emissions has therefore become a hot topic worldwide.
It is generally believed that carbon dioxide (CO2) is a significant contributor to the accelerated global GHG emissions [8,9], among which a great proportion of emissions have come from anthropogenic activities, especially the overconsumption of coal, oil, natural gas and other fossil fuels [10]. In fact, the agricultural production activities based on agricultural land utilization (ALU), which is also a main source of carbon emissions in the atmosphere, have a great impact on the carbon cycle [5,11]. In Canada, the agricultural sector contributes approximately 20% to the total GHG emissions [5]. According to the Word Bank [12], agriculture practices including agricultural land conversion and agricultural land utilization have produced about 20% of carbon dioxide globally.
China, as a large agricultural country, has achieved rapid urbanization and agricultural economic development since its reform and opening-up policy in the late 1970s [13]. Especially, China now successfully feeds 20% of the world’s population with less than 10% of the world’s cultivated land. However, this high-speed development has consumed excessive resources and the environmental cost has been huge. From 1990 to 2010, China’s carbon emissions expanded from 2461 million tons to 8241 million tons [14], and now China is the largest carbon emitter in the world [14]. Considering nearly 17% of China’s carbon emissions are from agriculture [15] and the important status of China in the world, scholars from different countries have their eyes on agricultural carbon emissions in China. Their studies mainly concentrated on the calculation method [16,17], regional discrepancies [17,18,19], driving forces [17,18,19,20] and the reduction strategies [21,22] of carbon emissions from agricultural practices in different time and space standards. Xiong et al. [23] and Luo et al. [24] explored the relationship between agricultural carbon emissions and economic growth using data of Hotan prefecture and 30 Chinese provinces, respectively.
All the above studies have made a great contribution to the expansion of the research breadth and depth of carbon emissions. In fact, the main agricultural carbon sources, like the generation of agricultural waste, the extensive use of agricultural supplies and energy, the widespread planting of rice and the burning of biological tissue, are directly related to the activities of agricultural land utilization [25]. A number of studies have sought to explore the scale and distribution characteristics of the carbon emissions from ALU at different spatial scales in China. Li et al. [26] examined the carbon effects of ALU across China during 2000 to 2008 with correlation analysis. Wu and Wang [27] took the Pingdu county, Shandong Province, China, as the case example, and calculated the carbon emissions from ALU by selecting the main sources of emissions and establishing a measurement system for the sources during the period 1995–2013. Li [28] calculated the carbon emissions from ALU of China’s provinces between 1993 and 2010, and found that the average annual growth rates of carbon emissions from ALU in Inner Mongolia, Guangxi, Guizhou, Yunnan, Tibet, Qinghai, Ningxia and Xinjiang were 8.59%, 4.09%, 3.04%, 5.48%, 8.20%, 2.06%, 6.63% and 6.95%, respectively.
Due to the equality of natural resources, social and economic development in China [29], the regional discrepancies in China’s carbon emissions from ALU has been widely recognized by scholars, and some scholars have discussed the influencing factors that result in the discrepancies of carbon emissions from ALU in China [26,30]. However, to our knowledge, few studies exploring the evolutionary characteristics of the discrepancies of the carbon emissions from ALU. To bridge this gap, this study aims to investigate the dynamic evolution of regional discrepancies in carbon emissions from ALU at the national level and the three regional systems of China during the period 2000–2015. The results of this study will provide reference for the low-carbon utilization of agricultural land and the construction of ecological civilization. Methods applied in this study include the calculation model of carbon emissions from ALU and kernel density estimation. The rest of this study is organized as follows. Section 2 offers the methods adopted in this study and the data information. Section 3 describes the empirical results. Section 4 concludes this study and provides some policy recommendations.

2. Methods and Data

2.1. Calculation of the Carbon Emissions from ALU

Carbon emissions from ALU refers to the direct or indirect carbon emissions generated by agricultural production activities based on agricultural land resources. The development and utilization of cultivated land, garden, forest and grassland will all result in carbon emissions. Considering that forest and grassland mainly act as natural carbon sinks, while the proportion of garden is small [28]. Therefore, carbon emissions from ALU in this study mainly refer to the emissions from cultivated land utilization, which usually consists of the following three main parts according to the existing research [26,27,28]. The first is the carbon emissions from the use of chemical substances in the process of cultivated land utilization, including the chemical fertilizers, pesticides and agricultural film. The second is the carbon emissions from the energy consumption, such as the consumption of fossil fuels by agricultural machinery and electricity by agricultural irrigation. The third is the organic carbon loss caused by agricultural land cultivation and tillage.
According to IPCC [24], the total carbon emissions from ALU can be calculated by Equation (1):
E = i = 1 n E i = i = 1 n T i δ i
where E indicates the total carbon emissions from ALU, E i is the emissions from the i-th carbon source, T i represents the consumption (amount) of the i-th carbon source and δ i is the coefficient of the i-th carbon source. The carbon sources and coefficients of ALU are shown in Table 1.

2.2. Kernel Density Estimation

Kernel density estimation (KDE), developed by Mood [36] and Silverman [37], is a method of detecting the distribution of data. As one of the non-parametric test methods, the KDE is mainly used to estimate the probability density of random variables, and the continuous density curve is used to describe the distribution patterns of random variables. Compared with the parameter estimation method, KDE does not need to set the function form in advance, and has a good adaptability to the unknown distribution of estimation form. At present, the KDE has been widely used for the regional discrepancies in geographical or specific phenomenon. Suppose the density function of the random variable X is f ( x ) , and the probability density at point x can be estimated by Equation (2):
f ( x ) = 1 N h i = 1 N K ( X i x ¯ h )
where N is the number of observations, h is the bandwidth, K ( ) is the kernel function, which is a weighting function or smoothing transfer function, X i is the independent and identically distributed random variable, and x ¯ is the mean value. Choosing the appropriate bandwidth and kernel function is crucial for obtaining the optimal fitting results. When the data characteristic and kernel function are given, the larger the bandwidth, the smoother the density function curve, but the lower the estimation accuracy. On the contrary, if the bandwidth becomes smaller, the density function curve would be less smooth, but the estimation accuracy will increase [37]. In practice, the h is generally determined by its relationship with N , and they should satisfy Equation (3):
lim h N ( N ) = 0    lim N N h ( N ) = N
There are many types of kernel functions depending on the manifestation, such as Gaussian kernel function, Epanechnikov kernel function, triangular kernel function, quartic kernel function, and so on. However, the type of kernel function has little effect on the accuracy of the estimation result [38], which means that any available kernel function can be selected in the process of KDE. According to Burkhauser and Rovba [39], we can analyse the changes in the location, shape and extensibility of the horizontal distribution of carbon emissions from ALU by observing the graphs of KDE, so as to achieve the purpose of describing the dynamic evolution of carbon emissions from ALU. Specifically: (1) As the distribution curve of carbon emissions from ALU shift to the right (left) as a whole over time, the level of carbon emissions from ALU generally improved (decreased). (2) If the distribution of peak heights becomes flat (steep), the gap between carbon emissions from ALU is widening (narrowing). (3) Continual increase (decrease) in the number of peaks means there is a phenomenon of polarization (convergence) in the carbon emissions from ALU. As an important concept in economic geography, polarization refers to the imbalances in carbon emissions from ALU. The shape of “unimodal”, “bimodal”, “tri-modal” and “multi-modal” indicates a “unipolar”, “bipolar”, “tri-polar” and “multi-polar” differentiation phenomenon in carbon emissions from ALU, respectively. (4) The phenomenon of the increasing of the width of the peak or the location of the peak moved in the left direction means the gap increased, and decreased on the contrary. (5) The lengthening (shortening) distribution of the left and right tail means the increase (decrease) of the regional discrepancies of carbon emissions from ALU (Table 2).
According to the research of Fan and Wang [40], the Epanechnikov kernel function was selected in this study. Based on the calculation results of the carbon emissions from ALU, the kernel density distribution of the carbon emissions from ALU in the whole country and each region in the main years was plotted by Eviews 8.0 (IHS Markit Global, London, UK).

2.3. Data Sources

According to China’s 7th Five Year Plan and the disparities of economic development, China can be divided into eastern, central, and western regions [41]. The eastern region contains eleven provinces or municipalities, namely, Beijing, Tianjin, Hebei, Liaoning, Shanghai, Jiangsu, Zhejiang, Fujian, Shandong, Guangdong and Hainan. The central region contains eight provinces, that is, Shanxi, Jilin, Heilongjiang, Anhui, Jiangxi, Henan, Hubei and Hunan. The remaining twelve provinces, municipalities and autonomous regions belong to the western region, namely, Sichuan, Chongqing, Inner Mongolia, Guangxi, Guizhou, Yunnan, Tibet, Shaanxi, Gansu, Qinghai, Ningxia and Xinjiang. The area of agricultural land, the area of cultivated land, population and other important indicators in 2015 of each region are shown in Table 3 according to China Statistical Yearbook of 2016, which can help us to have a better understanding of the three regions.
The data of this study is mainly from China Rural Statistical Yearbook (2001–2016) (CRSY) (see Table 4). These yearbooks are compiled by the Rural Social and Economic Investigation Department of National Bureau of Statistics of the People’s Republic of China, and published by China Statistics Press.

3. Result Analysis

3.1. Descriptive Analysis of Carbon Emissions from ALU

We calculated the carbon emissions from ALU in China based on Equation (1) (see Table 5). Overall, a progressive increase in the carbon emissions from ALU in China was showed in Table 5 during the period 2000–2015. In 2000 and 2015, the total emissions in China were, respectively, 5232.83 (104 tons) and 7858.93 (104 tons), with an average annual growth rate of 2.75%. As the most populous country in the world, China is in great need of food and other agricultural products. This means that the development intensity of agricultural and carbon emissions from ALU in China will continue to be high if the demands of agricultural products are to be met [42].
In addition, as shown in Table 4, the scale of carbon emissions from ALU showed significant spatial disparities at the regional and inter-provincial levels. The carbon emissions from ALU in the eastern region, central region, and western region all increased continuously between 2000 and 2015, with an average annual growth rate of 1.29%, 3%, and 4.35%, respectively. The emissions in the central region were much higher than the other two regions throughout the study period, whose average emissions were 308.20 (104 tons), and the average carbon emissions from ALU in the eastern region and western region were 216.99 (104 tons), and 147.71 (104 tons), respectively. This distribution pattern is largely due to the combined effect of natural and socio-economic factors, which including agricultural land endowment, management level of agricultural inputs, economic development, agricultural technology development and the conditions of farmers themselves [43].
The spatial discrepancies of carbon emissions from ALU was also obvious from the perspective of each province. Also shown in Table 4, carbon emissions from ALU in Beijing and Shanghai were decreased during the study period, while other provinces all presented a trend of increasing with different growth rates. In addition, we can clearly see that the average emissions were lower in some developed provinces. In Beijing, Tianjin, and Shanghai, the average value of carbon emissions from ALU were only 21.68 (104 tons), 29.32 (104 tons), and 27.90 (104 tons), respectively. One possible interpretation for this phenomenon is that a more developed economy, more developed secondary and tertiary industries, and more efficient ways of using agricultural inputs [44], so that the resource consumption and pollutant emissions in the process of agricultural land utilization were relatively low. At the same time, China’s major agricultural provinces and grain producing areas, like Henan, Shandong, Jiangsu, Hebei, Hubei, Sichuan and Hunan, trend to have higher average carbon emissions and growth rates than other provinces. There was evidence that the utilization intensity of agricultural land in these provinces was usually higher because of their important role in China’s food security [45]. These areas still have the problem of high consumption and high emissions [28].

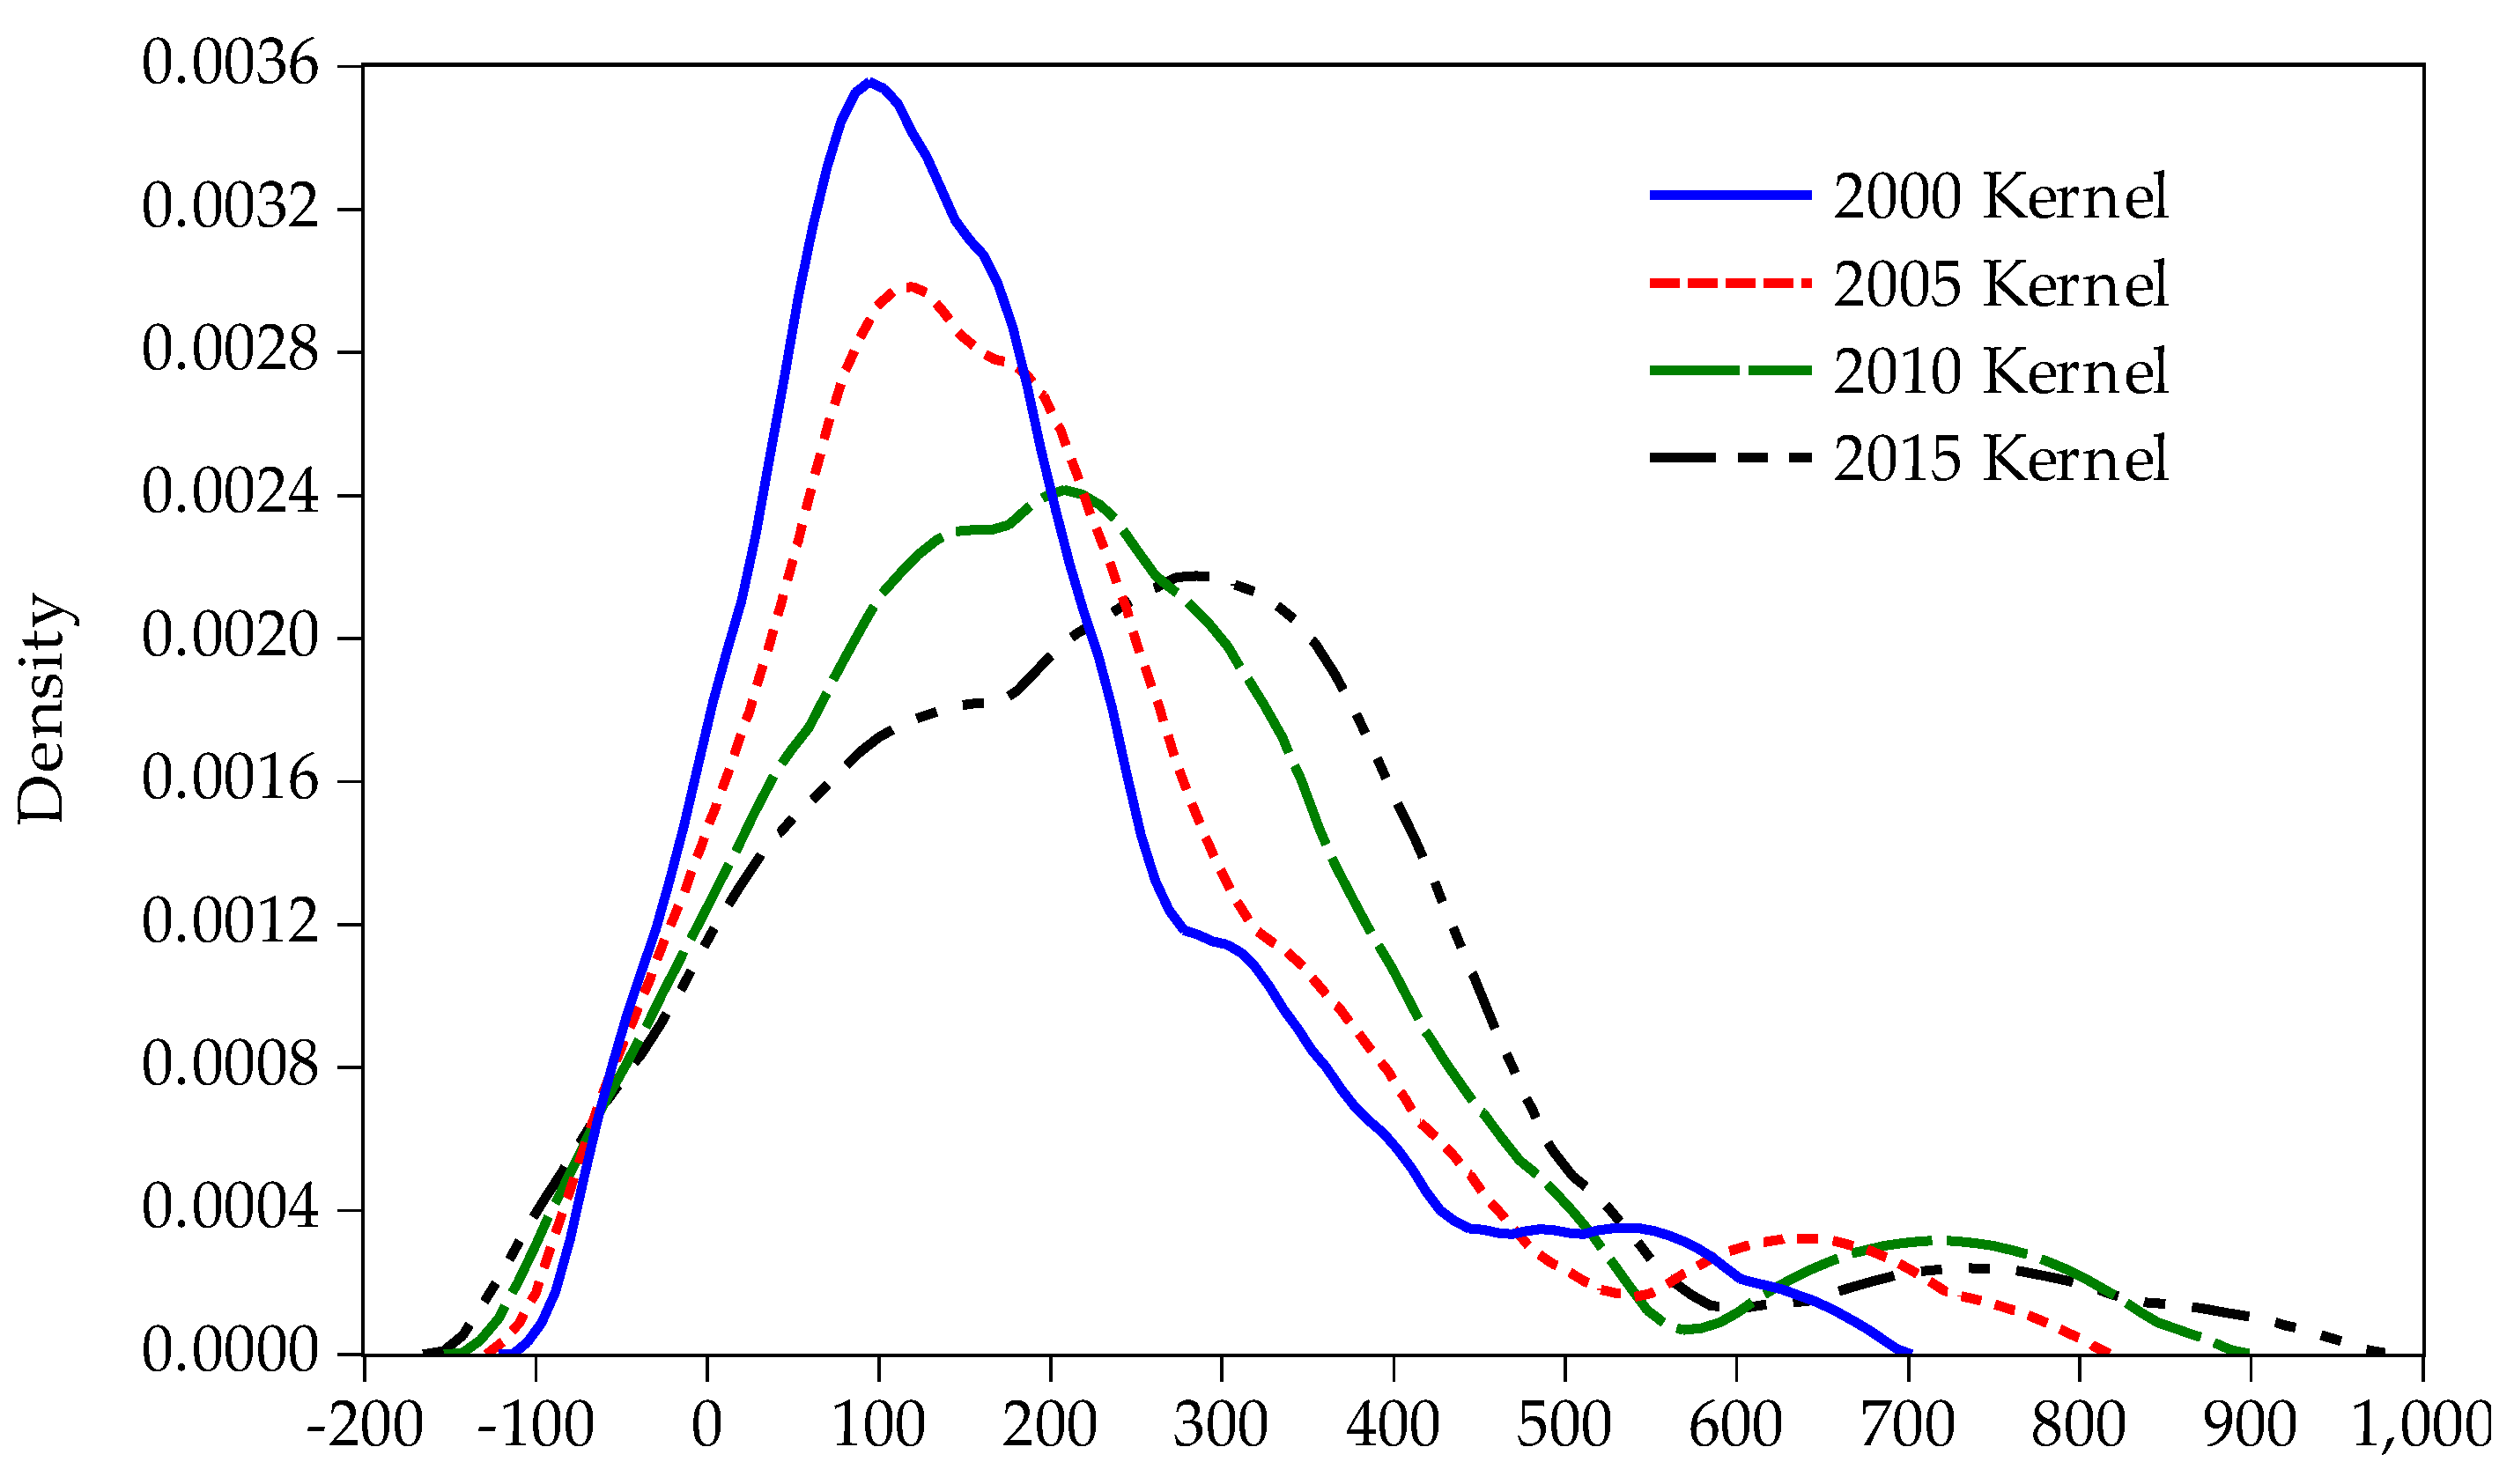
3.2. Evolution Characteristics of the Carbon Emissions from ALU for the Whole Country

As can be seen from Figure 1, the distribution of carbon emissions from ALU of 31 provinces in China has the following three characteristics. Firstly, the distribution curve of carbon emissions from ALU moved in the right direction during the study period, indicating that the amount of carbon emissions in each province increased gradually. The result also consistent with the findings in Li et al. [28], which finds that the average annual growth rate of China’s carbon emissions from agricultural land use being 2.47% from 2000 to 2008. Secondly, the height of the distribution curve’s peak has become much lower and the width has become much wider from 2000 to 2015, which means that the discrepancies of carbon emissions from ALU between different provinces expanded gradually. Thirdly, the distribution curves of carbon emissions from ALU in the whole country in 2000 and 2005 were in “multi-modal” shape, and presented “tri-modal” shape in 2010 and 2015. This phenomenon means that there may be “multi-polar” differentiation in China’s carbon emissions from ALU in 2000 and 2005 but “tri-polar” differentiation in 2010 and 2015.

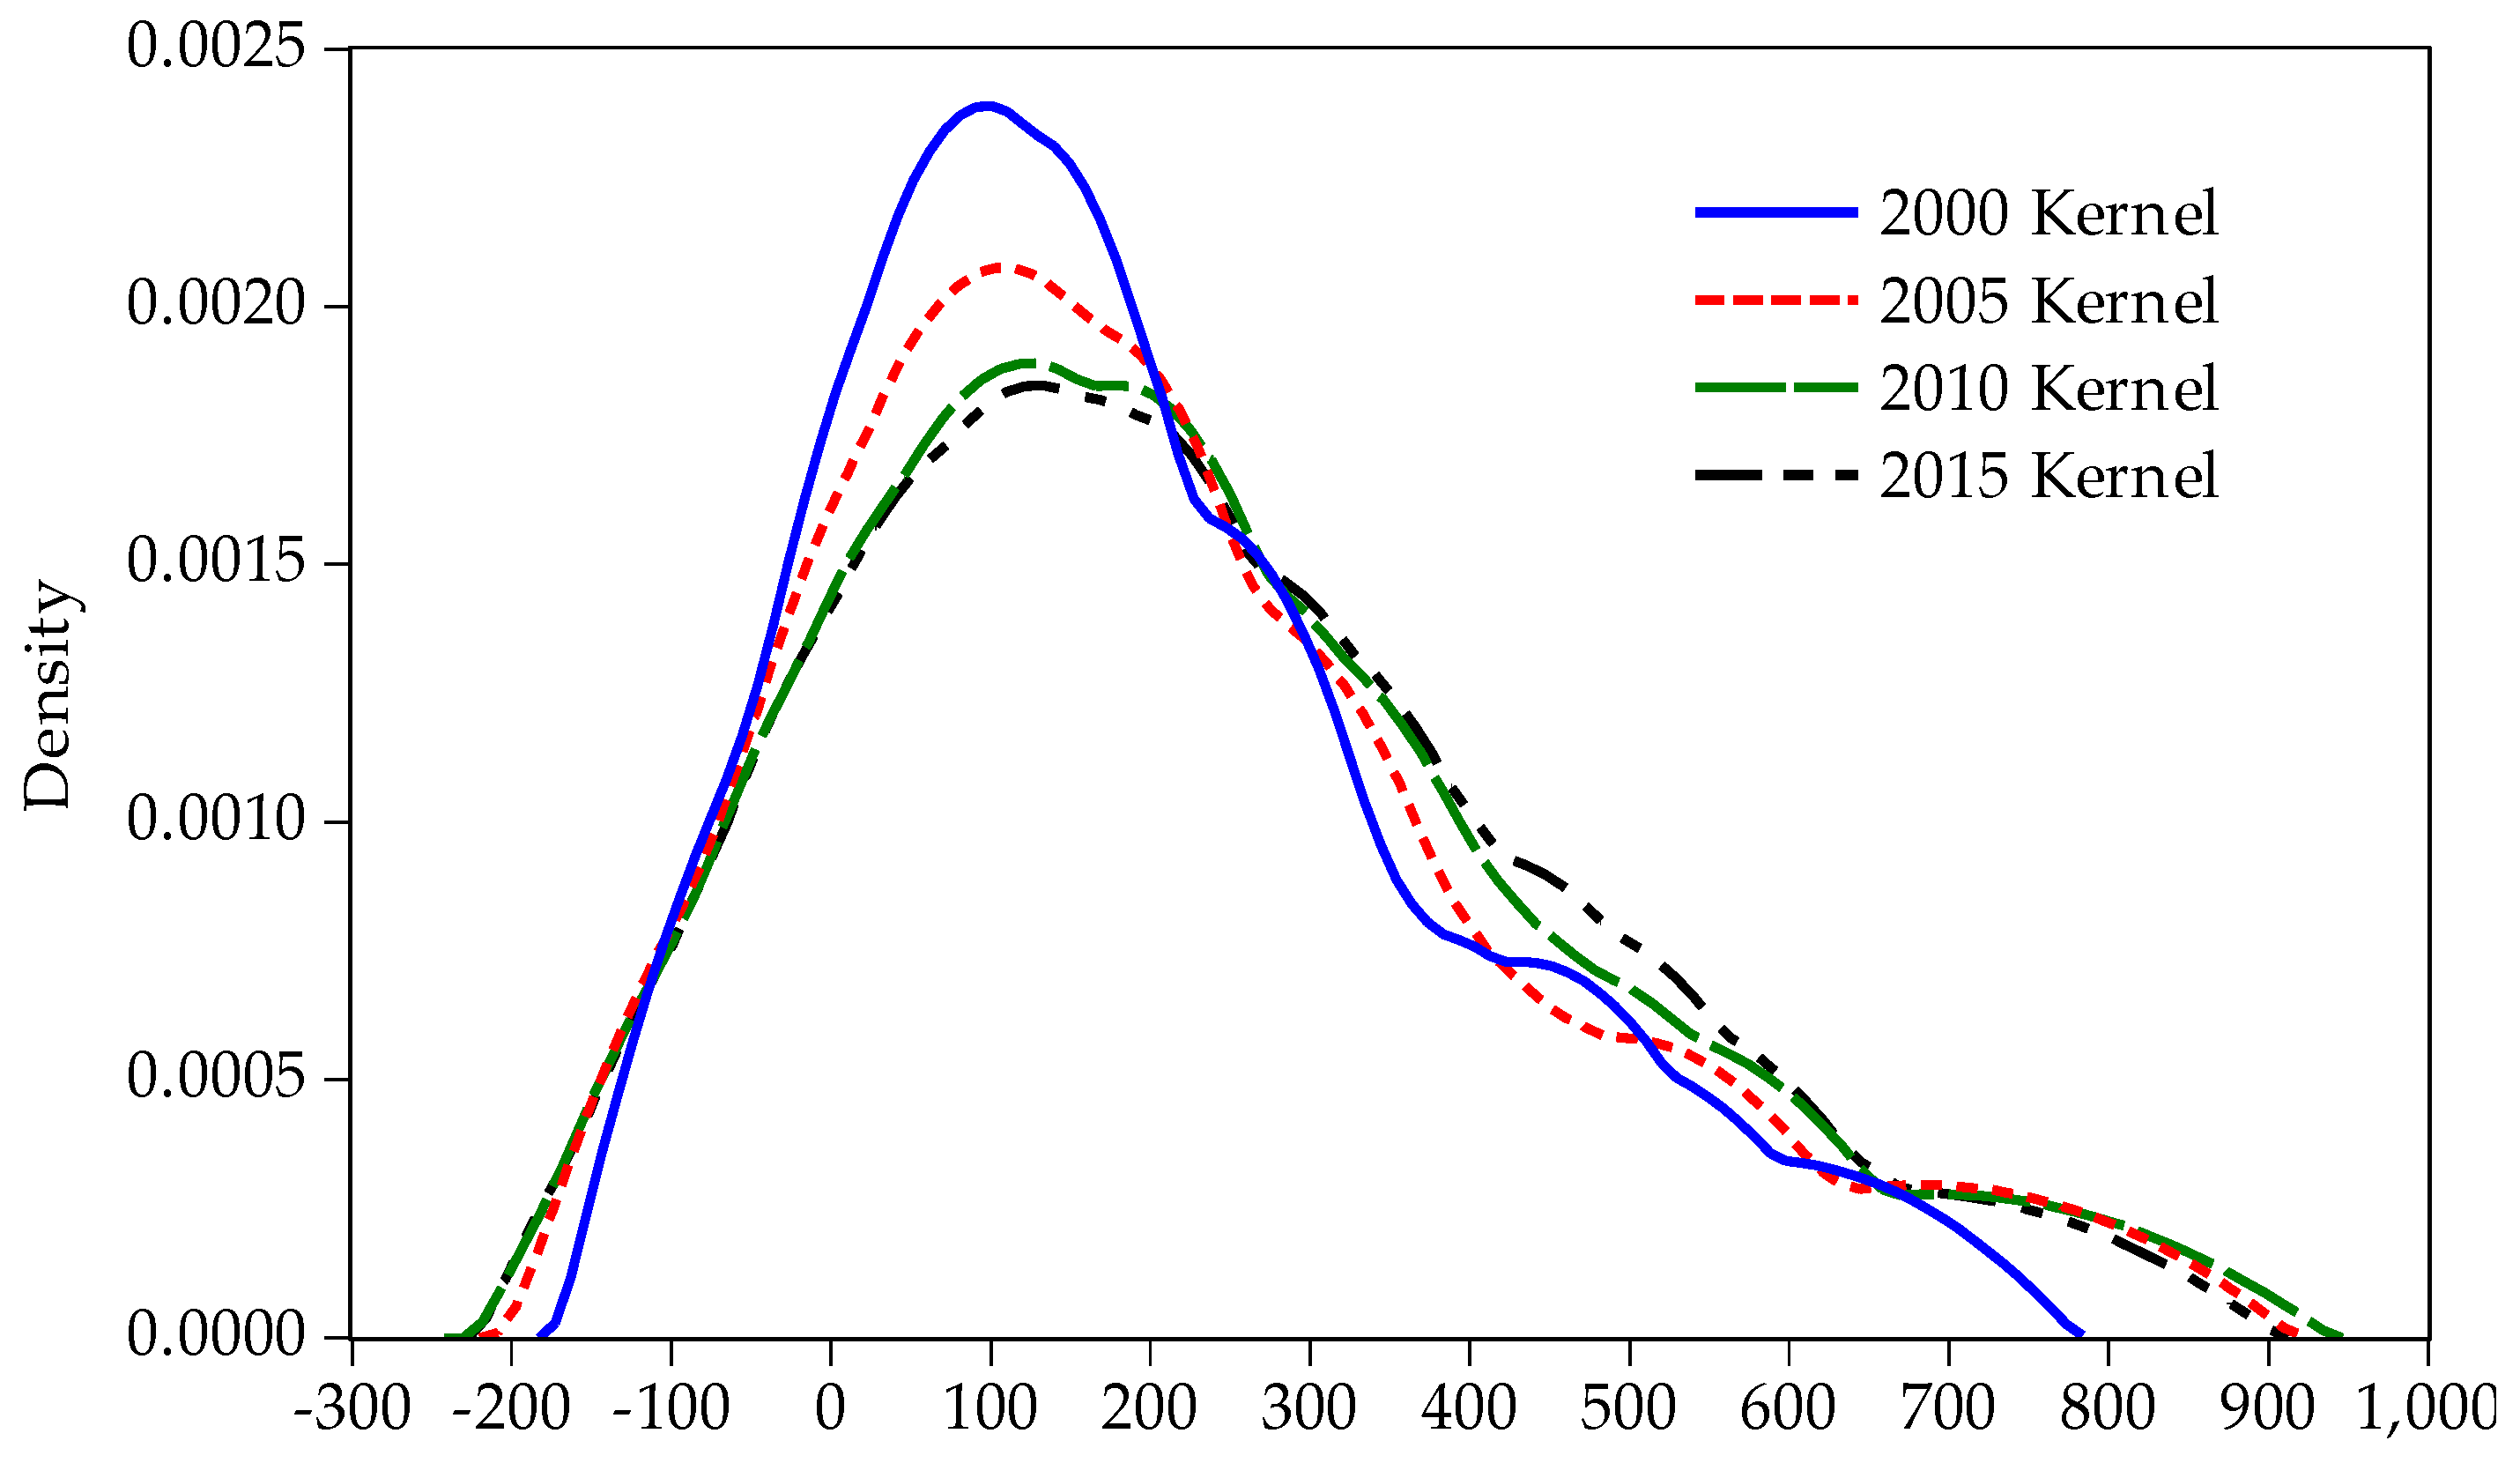
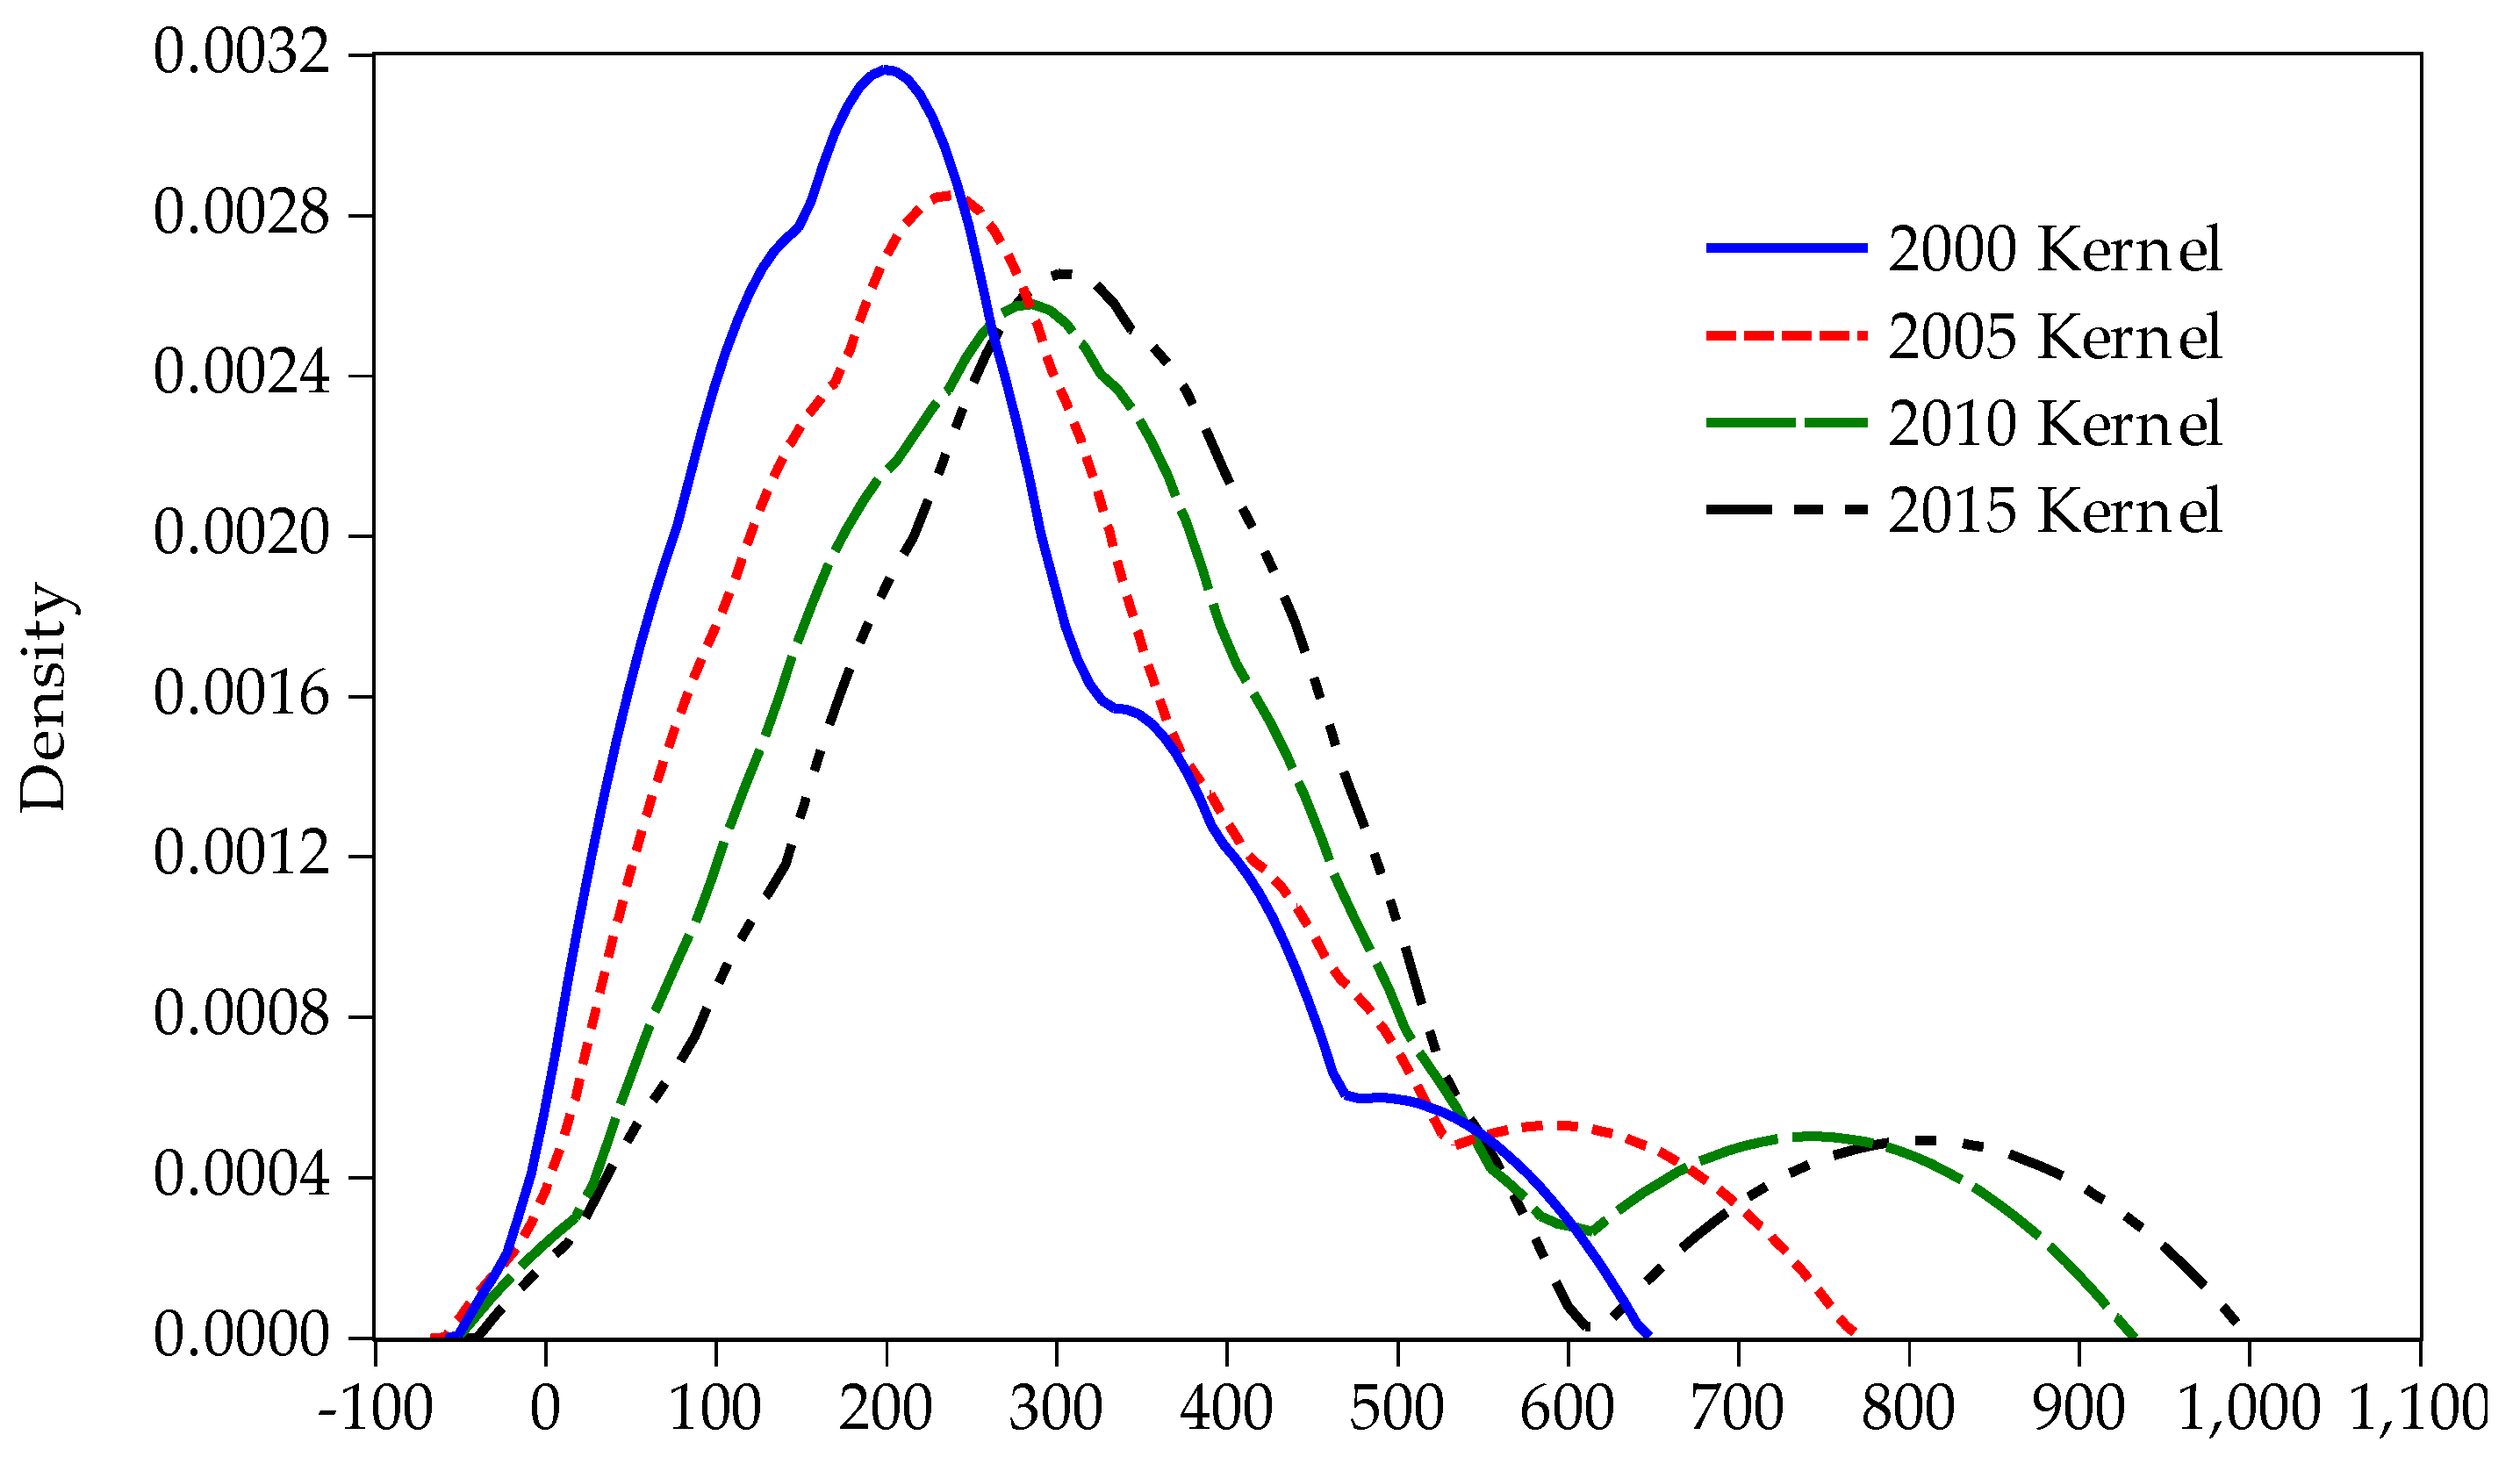
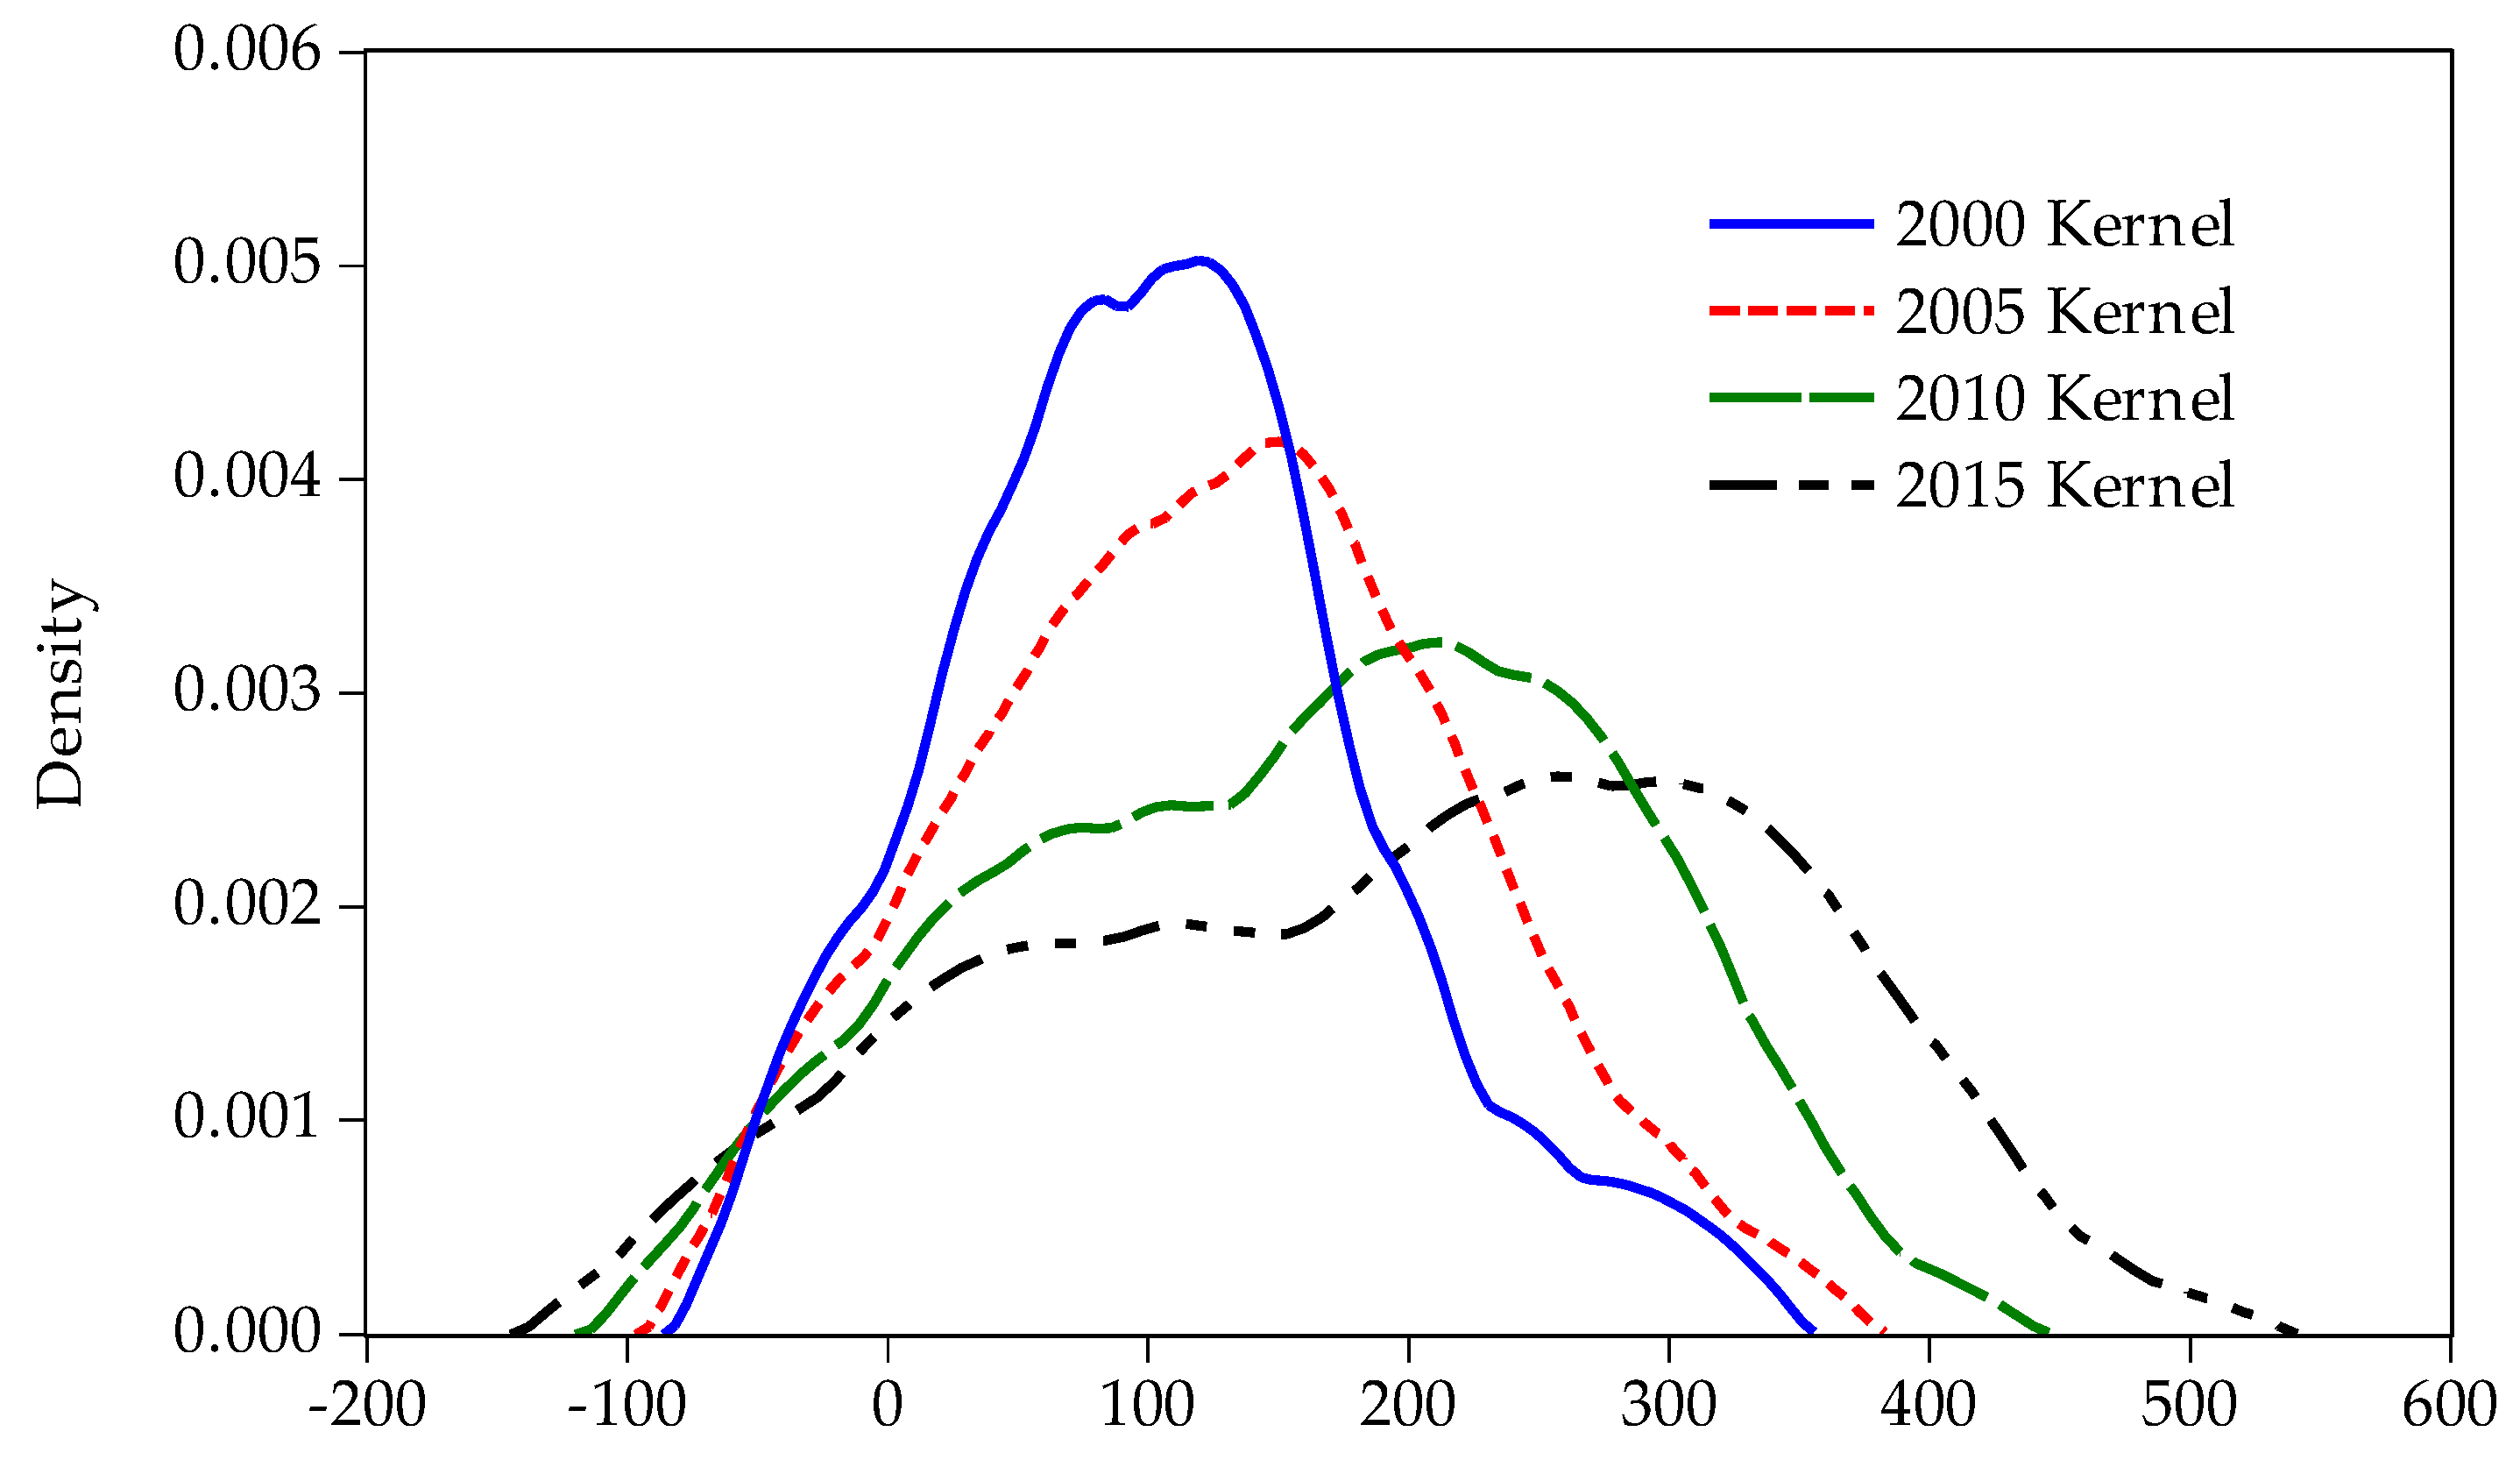
3.3. Regional Analysis of the Evolution Characteristics of the Carbon Emissions from ALU

As can be seen from Figure 2, the total carbon emissions from ALU of 11 provinces in the eastern region increased during the study period [15], with the discrepancies increased and accompanied by a phenomenon of “multi-polar” division. As shown in Figure 2, the center of the distribution curve of the eastern region moved in the right direction in the period 2000–2005, with the height of the peak decreased, indicating that the discrepancies in carbon emissions from ALU have increased during this period. From 2005 to 2010, the height of the peak continues to decrease, while the variation of the width of the distribution curve is not obvious. Compared with that in 2010, the right tail of the distribution curve in 2015 moved in the left direction slightly, which means that the degree of discrepancies in carbon emissions from ALU have decreased from 2010 to 2015. In 2000 and 2005, the distribution curve of carbon emissions from ALU in the eastern region were in “multi-modal” shape, with a clearly “multi-polar” differentiation trend. With time going by, eastern region has gradually switched from “multi-modal” into “tri-modal” distribution. In 2015, the distribution curve presented with a pattern of a main peak and two sub-peaks, indicating that the distribution of carbon emissions from ALU in this region demonstrated a “tri-polar” differentiation phenomenon.
Similar to the results of the whole country and the eastern region, the total carbon emissions from ALU in central region also showed an upward trend in 2000–2015 [17]. As can be seen from Figure 3, the peak value of the distribution curve in this region decreased evidently from 2000 to 2005, showed a marked decrease again between 2005 and 2010, and increased slightly from 2010 to 2015. The change of the peak value means that the discrepancies of carbon emissions from ALU in this region showed three stages of change, i.e., “increased, continued to increase and then decreased”, during the study period. From the change of the number of the peaks, the distribution pattern of the carbon emissions in central region has gradually switched from “multi-polar” to “bipolar” in the period 2000–2015. From Figure 3, we can clearly see that, the distribution curve consisted of a main peak and a sub-peak in 2015, and the density value corresponding to the main peak was much higher than that of the sub-peak.
As shown in Figure 4, during the period 2000–2015, the peak value of the distribution curve in the western region decreased continuously, and the width of the peak was increasing year by year, indicating that the degree of the discrepancies in the carbon emissions from ALU was increasing in this region. In 2010, the curve of the kernel density presented a pattern of bimodal distribution, and the polarization in 2015 is extremely obvious from Figure 4. The left value of the distribution curve moved in the left direction while the right value moved in the right direction from 2000 to 2015, indicating that the gap tends to expand among regional carbon emissions from ALU. As for the number of the peaks, distribution of carbon emissions from ALU in the western region showed fluidity with a “multi-polar” differentiation phenomenon in 2000, 2010 and 2015. In 2005, it presented a “unipolar” division phenomenon.

4. Conclusions and Policy Recommendations

4.1. Conclusions

Based on the data of 31 provinces in mainland China and the method of kernel density estimation, this study analyzed the spatial-temporal discrepancies of carbon emissions from ALU and its evolutionary characteristics from 2000 to 2015. The main conclusions are as follows.
(1) The carbon emissions from ALU in the whole China and the eastern, central and western regions of China have increased sharply during the study period. From 2000 to 2015, the carbon emissions from ALU in China increased by 2626.11 (104 tons), with an annual increase of 175.07 (104 tons) and an average annual growth rate of 2.75%. The total increase in the eastern, central, and western region were 441.32 (104 tons), 1054.45 (104 tons), and 1130.33 (104 tons), respectively, the average annual growth rates of which were 1.29%, 3%, and 4.35%, respectively. Carbon emissions from ALU of each province all demonstrated significant increasing trend, with the exception of Beijing and Shanghai. Shandong produced the largest carbon emissions from ALU, followed by Henan and Jiangsu, whose average carbon emissions were, respectively, 671.11 (104 tons), 661.26 (104 tons), and 403.40 (104 tons).
(2) The scale of carbon emissions from ALU showed significant spatial disparities at the regional and inter-provincial levels. Due to the differences of the abundances of agricultural land resources, the level of the economic development and the agricultural technology, etc., the regional discrepancy of China’s carbon emissions from ALU was obvious [43]. The central region, which is a concentrated distribution area of major agricultural provinces and major grain producing areas in China, has the highest carbon emissions from ALU throughout the study period. The average carbon emissions from ALU in the central, eastern and western regions were 308.20 (104 tons), 216.99 (104 tons) and 147.71 (104 tons), respectively. The emissions of the provinces in central region were much higher than other provinces.
(3) The regional discrepancies of carbon emissions from ALU were expanding and showed various degrees of polarization at different spatial scales. From the results of the kernel density estimation, the distribution curves of carbon emissions from ALU in the whole country and each region all moved in the right direction gradually during the study period, and the width of the curves increased. All these characteristics meant that the regional discrepancies of carbon emissions from ALU were expanding at different spatial scales. Density estimation has a strong internal mobility in the distribution of China’s carbon emissions from ALU, with a “tri-polar” differentiation trend. Three regions have different trends. The eastern region has gradually switched from “multi-polar” into “tri-polar” distribution during the period 2000–2015. The central region presented a “multi-polar” division in 2000, while a “bipolar” differentiation phenomenon appeared in 2015. Distribution of carbon emissions from ALU in the western region showed a “multi-polar” differentiation phenomenon in 2000, 2010 and 2015, and a “unipolar” division phenomenon in 2005.

4.2. Policy Recommendations

As the world’s major agricultural countries, China and the United States have similar GHG emissions currently. However, the carbon emissions from agricultural practices in the United States account for only 6.3% of their total carbon emissions [25], which is much lower than that of China’s 17%. How to achieve the orderly development of grain production and agricultural economy while realizing a low-carbon and green utilization of agricultural land resources has become a key issue for the Chinese government in the future [46]. In particular, the Chinese government should innovate ways and modes of ALU based on the current situation and the advantages of agricultural development of different regions so as to reduce the carbon emissions from ALU and improve the low-carbon efficiency of agricultural land utilization.
(1) The eastern region has the advantages of geographic location, economic development and agricultural technology innovation, which contribute to lower resource consumption and carbon emissions in the process of ALU [15,17]. For the provinces in this region, the key measure to reduce carbon emissions from ALU is to develop modern agriculture and ecological agriculture based on its various advantages. Another important way is to reduce the proportion of traditional agriculture and improve the versatility of agricultural production.
(2) The central region is a major agricultural production base in China and enjoys superior agricultural production conditions, which has made a great contribution to China’s food security and urbanization. However, the agricultural development in this region is largely dependent on the high-intensity development and utilization of agricultural land, especially the over investment in chemical fertilizers, pesticides, and other factors [28], thus resulting in the highest carbon emissions from 2000 to 2015. Therefore, improving the efficiency of agricultural production will be an effective means of carbon emission reduction for the provinces in this region. It is important to abandon this unsustainable agricultural land utilization model and follow the development path of “resource-saving” and “environment-friendly”.
(3) The agricultural production resources in the western region of China are relatively scarce, and the carbon emissions from ALU in the western region are much lower than that in the eastern and central regions. However, the low-carbon utilization of agricultural land resources in the western region is confronted with the dual constraint of small scale agricultural land and low productivity in agricultural inputs [14]. For the provinces in this region, it is necessary to speed up the process of agricultural land transfer and promote the transformation of agricultural production and management, which will ensure basic carbon emissions reduction from ALU.
Apart from the measures mentioned above, cultivating new-type professional farmers, constructing a low-carbon agricultural technology extension system and optimizing the structure of agricultural production are all effective ways to achieve the efficient and low-carbon utilization of agricultural land resources in China.

Acknowledgments

This study was financing by grants from the National 985 Project of Nontraditional Security at Huazhong University of Science and Technology, PR China, the National Natural Science Foundation of China (71673096; 41371522; 71774066; 41501589) and the Social Science and Humanity on Planning Fund of the Ministry of Education of China (17YJA790045).

Author Contributions

Xinhai Lu and Bing Kuang proposed and designed the study; Bing Kuang and Jing Han were accountable for data collecting and the interpretation of results; Bing Kuang and Jing Li wrote the paper; Xinhai Lu, Jing Han and Zuo Zhang were responsible for the further revision of this study; All authors have read and approved the final manuscript.

Conflicts of Interest

The authors declare no conflict of interest.

References

  1. Shi, Q.; Chen, J.D.; Shen, L.Y. Driving factors of the changes in the carbon emissions in the Chinese construction industry. J. Clean. Prod. 2017, 166, 615–627. [Google Scholar] [CrossRef]
  2. Intergovernmental Panel on Climate Change (IPCC). Contribution of Working Groups I, II and III to the Fifth Assessment Report of the Intergovernmental Panel on Climate Change; Climate Change 2014: Synthesis Report; Pachauri, R.K., Meyer, L.A., Eds.; IPCC: Geneva, Switzerland, 2014; 151p. [Google Scholar]
  3. Breetz, H.L. Regulating carbon emissions from indirect land use change (ILUC): U.S. and California case studies. Environ. Sci. Policy 2017, 77, 25–31. [Google Scholar] [CrossRef]
  4. Xu, H.Z.; Zhang, W.J. The causal relationship between carbon emissions and land urbanization quality: A panel data analysis for Chinese provinces. J. Clean. Prod. 2016, 137, 241–248. [Google Scholar] [CrossRef]
  5. Yadav, D.; Wang, J.Y. Modelling carbon dioxide emissions from agricultural soils in Canada. Environ. Pollut. 2017, 230, 1040–1049. [Google Scholar] [CrossRef] [PubMed]
  6. Xu, X.S.; Zhao, T.; Liu, N.; Kang, J.D. Changes of energy-related GHG emissions in China: An empirical analysis from sectoral perspective. Appl. Energy 2014, 132, 298–307. [Google Scholar] [CrossRef]
  7. Nikzad, R.; Sedigh, G. Greenhouse gas emissions and green technologies in Canada. Environ. Dev. 2017, 24, 99–108. [Google Scholar] [CrossRef]
  8. Houghton, R.A.; Hackler, J.L. Sources and sinks of carbon from land-use change in China. Glob. Biogeochem. Cycles 2003, 17, 1034–1047. [Google Scholar] [CrossRef]
  9. Sarmiento, J.L.; Gloor, M.; Gruber, N.; Beaulieu, C.; Jacobson, A.R.; Mikaloff Fletcher, S.E.; Pacala, S.; Rodgers, K. Trends and regional distributions of land ocean carbon sinks. Biogeosciences 2010, 7, 2351–2367. [Google Scholar] [CrossRef]
  10. Shuai, C.Y.; Shen, L.Y.; Jiao, L.D.; Wua, Y.; Tan, Y.T. Identifying key impact factors on carbon emission: Evidences from panel and time-series data of 125 countries from 1990 to 2011. Appl. Energy 2017, 187, 310–325. [Google Scholar] [CrossRef]
  11. Voicu, M.F.; Shaw, C.; Kurz, W.A.; Huffman, T.; Liu, J.G.; Fellows, M. Carbon dynamics on agricultural land reverting to woody land in Ontario, Canada. J. Environ. Manag. 2017, 193, 318–325. [Google Scholar] [CrossRef] [PubMed]
  12. World Bank. World Development Indicators: Agricultural Methane Emissions. Available online: http://data.worldbank.org/indicator/EN.ATM.METH.KT.CE (Accessed on 25 January 2018).
  13. Lau, L.J.; Zheng, H.H. How much slack was there in the Chinese economy prior to its economic reform of 1978. China Econ. Rev. 2017, 45, 124–142. [Google Scholar] [CrossRef]
  14. Hao, Y.; Chen, H.; Wei, Y.M.; Li, Y.W. The influence of climate change on CO2 (carbon dioxide) emissions: An empirical estimation based on Chinese provincial panel data. J. Clean. Prod. 2016, 131, 667–677. [Google Scholar] [CrossRef]
  15. Lin, B.Q.; Fei, R.L. Regional differences of CO2 emissions performance in China’s agricultural sector: A Malmquist index approach. Eur. J. Agron. 2015, 70, 33–40. [Google Scholar] [CrossRef]
  16. Gao, B.; Ju, X.T.; Zhang, Q.; Christie, P.; Zhang, F.S. New estimates of direct N2O emissions from Chinese croplands from 1980 to 2007 using localized emission factors. Biogeosci. Discuss. 2011, 8, 3011–3024. [Google Scholar] [CrossRef] [Green Version]
  17. Tian, Y.; Zhang, J.B.; He, Y.Y. Research on spatial-temporal characteristics and driving factor of agricultural carbon emissions in China. J. Integr. Agric. 2014, 13, 1393–1403. [Google Scholar] [CrossRef]
  18. Zhang, Y.; Fang, G. Research on spatial-temporal characteristics and affecting factors decomposition of agricultural carbon emission in Suzhou City, Anhui Province, China. Appl. Mech. Mater. 2013, 291–294, 1385–1388. [Google Scholar] [CrossRef]
  19. Xiong, C.; Yang, D.; Huo, J. Spatial-temporal characteristics and LMDI-based impact factor decomposition of agricultural carbon emissions in Hotan Prefecture, China. Sustainability 2016, 8, 262. [Google Scholar] [CrossRef]
  20. Tian, J.X.; Yang, H.L.; Xiang, P.G.; Liu, D.W.; Li, L. Drivers of agricultural carbon emissions in Hunan Province, China. Environ. Earth. Sci. 2016, 75, 121–138. [Google Scholar] [CrossRef]
  21. Yang, X.L.; Gao, W.S.; Zhang, M.; Chen, Y.Q.; Sui, P. Reducing agricultural carbon footprint through diversified crop rotation systems in the North China Plain. J. Clean. Prod. 2014, 76, 131–139. [Google Scholar] [CrossRef]
  22. Yao, Z.S.; Yan, G.X.; Zheng, X.H.; Wang, R.; Liu, C.Y.; Butterbach-Bahl, K. Reducing N2O and NO emissions while sustaining crop productivity in a Chinese vegetable-cereal double cropping system. Environ. Pollut. 2017, 231, 929–941. [Google Scholar] [CrossRef] [PubMed]
  23. Xiong, A.H.; Yang, D.G.; Huo, J.W.; Zhao, Y.N. The relationship between agricultural carbon emissions and agricultural economic growth and policy recommendations of low-carbon agriculture economy. Pol. J. Environ. Stud. 2016, 25, 2187–2195. [Google Scholar] [CrossRef]
  24. Luo, Y.S.; Long, X.L.; Wu, C.; Zhang, J.J. Decoupling CO2 emissions from economic growth in agricultural sector across 30 Chinese provinces from 1997 to 2014. J. Clean. Prod. 2017, 159, 220–228. [Google Scholar] [CrossRef]
  25. Johnson, J.M.; Franzluebbers, A.J.; Weyers, S.L.; Reicosky, D.C. Agricultural opportunities to mitigate greenhouse gas emissions. Environ. Pollut. 2007, 150, 107–124. [Google Scholar] [CrossRef] [PubMed]
  26. Li, J.J. Research on characteristics and driving factors of agricultural land carbon emission in provinces of minorities in China. China Popul. Resour. Environ. 2012, 22, 42–47. (In Chinese) [Google Scholar]
  27. Wu, J.F.; Wang, X.H. Dynamic changes in the carbon intensity and sustainability of farmland use: A case study in Pingdu County, Shandong Province, China. Acta Ecol. Sin. 2017, 37, 2904–2912. (In Chinese) [Google Scholar]
  28. Li, B.; Fu, S.Y.; Zhang, J.B.; Yu, H.S. Carbon functions of agricultural land use and economy across China: A correlation analysis. Energy Procedia 2011, 5, 1949–1956. [Google Scholar]
  29. Chen, A.; Groenewold, N. Regional equality and national development in China: Is there a trade-off. Growth Chang. 2011, 42, 628–669. [Google Scholar]
  30. Feng, T.T.; Yang, Y.S.; Xie, S.Y.; Dong, J.; Ding, L. Economic drivers of greenhouse gas emissions in China. Renew. Sustain. Enegy Rev. 2017, 78, 996–1006. [Google Scholar] [CrossRef]
  31. West, T.O.; Marland, G.A. Synthesis of carbon sequestration, carbon emissions, and net carbon flux in agriculture: Comparing tillage practices in the United States. Agric. Ecosyst. Environ. 2002, 91, 217–232. [Google Scholar] [CrossRef]
  32. Post, W.M.; Kwon, K.C. Soil carbon sequestration and land use change: Processes and potential. Glob. Chang. Biol. 2000, 6, 317–327. [Google Scholar] [CrossRef]
  33. Institute of Resource, Ecosystem and Environment of Agriculture in Nanjing Agricultural University (IREEA). Available online: http://ireea.njau.edu.cn/ch/DownShow.asp?ID=101 (Accessed on 5 November 2007).
  34. Dubey, A.; Lal, R. Carbon footprint and sustainability of agricultural production systems in Punjab, India and Ohio, USA. J. Crop Improv. 2009, 23, 332–350. [Google Scholar] [CrossRef]
  35. Wu, X.R.; Zhang, J.B.; Tian, Y.; Li, P. Provincial agricultural carbon emissions in China: Calculation, performance change and influencing factors. Resour. Sci. 2014, 36, 129–138. (In Chinese) [Google Scholar]
  36. Mood, A.M.; Graybill, F.A.; Boes, D.C. An Introduction to the Theory of Statistics; McGraw-Hill Book Company: New York, NY, USA, 1973. [Google Scholar]
  37. Silverman, B.W. Density Estimation for Statistics and Data Analysis. Chapman and Hall: London, UK, 1986. [Google Scholar]
  38. Kuang, B.; Lu, X.H.; Zhou, M.; Rao, Y.X. Analysis of spatial-temporal evolution of urban land economic density disparity in prefecture-level cities of China. Sci. Geogr. Sin. 2017, 37, 1850–1858. (In Chinese) [Google Scholar]
  39. Burkhauser, R.V.; Rovba, L. Income Inequality in the 1990s: Comparing the United States, Great Britain and Germany; Discussion Papers 576; Econstor: Berlin, German, 2006. [Google Scholar]
  40. Fan, D.; Wang, W.G. Industrial energy efficiency in China and driving factors based on a low carbon economy. Resour. Sci. 2013, 35, 1790–1800. (In Chinese) [Google Scholar]
  41. Xie, H.L.; Wang, W. Exploring the spatial-temporal disparities of urban land use economic efficiency in China and its influencing factors under environmental constraints based on a Sequential Slacks-Based Model. Sustainability 2015, 7, 10171–10190. [Google Scholar] [CrossRef]
  42. Yue, Q.; Xu, X.R.; Hillier, J.; Cheng, K.; Pan, G.X. Mitigating greenhouse gas emissions in agriculture: From farm production to food consumption. J. Clean. Prod. 2017, 149, 1011–1019. [Google Scholar] [CrossRef]
  43. Li, A.J.; Zhang, A.Z.; Zhou, Y.X.; Yao, X. Decomposition analysis of factors affecting carbon dioxide emissions across provinces in China. J. Clean. Prod. 2017, 141, 1428–1444. [Google Scholar] [CrossRef]
  44. Li, Z.W.; Zheng, X.G. Study on relationship between Sichuan agricultural carbon dioxide emissions and agricultural economic growth. Energy Procedia 2011, 5, 1073–1077. [Google Scholar]
  45. Lu, S.S.; Liu, Y.S.; Long, H.L.; Guan, X.H. Agricultural Production Structure Optimization: A Case study of major grain producing areas, China. J. Integr. Agric. 2013, 12, 184–197. [Google Scholar] [CrossRef]
  46. Xu, F.; Xiang, N.; Yan, J.J.; Chen, L.J.; Nijkamp, P.; Higano, Y. Dynamic simulation of China’s carbon emission reduction potential by 2020. Lett. Spat. Resour. Sci. 2015, 8, 15–27. [Google Scholar] [CrossRef]
Figure 1. The kernel density distribution of the carbon emissions from ALU in China (Note: X-axis represents the carbon emissions from ALU).
Sustainability 10 00552 g001
Figure 2. The kernel density distribution of the carbon emissions from ALU in the eastern region. (Note: X-axis represents the carbon emissions from ALU).
Sustainability 10 00552 g002
Figure 3. The kernel density distribution of the carbon emissions from ALU in the central region. (Note: X-axis represents the carbon emissions from ALU).
Sustainability 10 00552 g003
Figure 4. The kernel density distribution of the carbon emissions from ALU in the western region. (Note: X-axis represents the carbon emissions from ALU).
Sustainability 10 00552 g004
Table 1. Carbon emission coefficients of major carbon sources of agricultural land utilization (ALU).
Carbon SourcesCalculation MethodEmission CoefficientUnitReferencesData Sources
Chemical FertilizerConsumption of Chemical Fertilizers in Rural Areas0.8956kg C/kgWest and Marland [31]China Rural Statistical Yearbook (CRSY)
PesticideConsumption of Pesticides4.9341kg C/kgPost and Kwon [32]
Agricultural FilmConsumption of Plastic Film for Farm Use5.18kg C/kgIREEA [33]
Agricultural MachineryTotal Power of Agricultural Machinery0.18kg C/kWLi et al. [28]
Agricultural IrrigationEffective Irrigation Area25kg C/hm2Dubey and Lal [34]
TillageSown Area of Farm Crops312.6kg C/km2Wu et al. [35]
Table 2. The relationship between the distribution curve of density function and the degree of discrepancies.
Items DegreeHeight of the PeakWidth of the PeakLocation of the PeakNumber of PeaksThe Left TailThe Right Tail
IncreaseFlatIncreaseMove leftIncreaseLongerLonger
DecreaseSteepDecreaseMove rightDecreaseShorterShorter
Table 3. Main indicators of the eastern, central and western regions in 2015.
IndicatorsUnitNational TotalEastern RegionCentral RegionWestern Region
Area of Agricultural Land at Year-end103 hectares645,456.882,244.5138,790.3424,422
Area of Cultivated Land at Year-end103 hectares134,998.931,191.553,378.850,428.6
Population at Year-end104 persons137,46256,90143,05437,507
Gross Domestic Products100 million yuan722,767.9401,651.7176,097.3145,018.9
Gross Output of Agricultural Products100 million yuan57,63621,177.519,217.917,240.6
Per Capita Disposable Income of Rural Householdsyuan11,421.715,789.6110,940.558914.13
Output of Grain104 tons62,143.816,952.128,690.716,501
Crop Area Affected by Natural Disaster103 hectares21,770677866928300
Table 4. Descriptive statistics used in this study.
VariableMeanStandard Deviation
(SD)
SD/MeanMaxMinSamples
Consumption of Chemical Fertilizers in rural areas (104 t)165.867136.573,60.8234716.12.5496
Consumption of Pesticides (t)51,052.5543,354.2910.8492173,461583496
Consumption of Plastic Film for Farm Use (t)64,005.0962,057.4710.9696343,524128496
Total Power of Agricultural Machinery (104 kW)2608.9762656.1001.018113,35395.3496
Effective Irrigation Area (103 hm2)1899.1661453.4260.76535530.8137.4496
Sown Area of Farm Crops (103 hm2)5103.7063572.3960.700014,425173.7496
Table 5. Carbon emissions from ALU of China in main years (104 tons).
RegionProvince200020032006200920122015Average
Eastern RegionBeijing24.8223.7622.0321.7821.2016.7921.68
Tianjin22.3225.0431.2832.8331.2227.7529.32
Hebei325.84352.16386.44403.33417.59428.91387.46
Liaoning162.69169.68188.27215.61240.84244.92205.37
Shanghai34.6730.8929.2526.0923.3620.9827.90
Jiangsu392.08391.78406.36415.04408.44396.96403.40
Zhejiang133.90138.13146.20149.13150.51145.89144.77
Fujian150.31152.04164.51170.18170.96174.18163.56
Shandong581.67646.97718.27687.11688.51664.09671.11
Guangdong219.59244.48259.24287.53305.31316.51272.64
Hainan30.9840.5555.0573.1572,5383.2259.63
Central RegionShanxi105.56109.91121.98132.21149.45151.67128.59
Jilin133.85148.89177.89210.01245.52275.26199.56
Heilongjiang159.13165.14215.68257.48316.08331.27241.85
Anhui305.52337.54362.02386.80418.04423.85375.03
Jiangxi147.58149.85184.02199.31209.71210.11185.79
Henan487.40536.43618.55714.97775.35808.42661.26
Hubei313.42334.81364.29413.84430.80406.07378.56
Hunan235.96251.49289.77311.39336.25336.21294.96
Western RegionInner Mongolia97.32114.05153.50201.07230.05281.70177.78
Guangxi178.19205.81234.54259.36283.45300.35245.11
Chongqing86.5589.1299.04113.40119.74122.94105.63
Sichuan267.40265.09292.61319.02332.32331.91301.29
Guizhou81.5287.6096.42112.01122.16130.09103.82
Yunnan143.28166.57192.46222.93274.73302.46216.79
Tibet3.123.965.265.626.197.685.42
Shaanxi140.61148.64156.75191.84246.12241.37184.78
Gansu100.87112.96124.72149.67201.67226.83153.26
Qinghai8.578.368.8010.1212.6914.5810.43
Ningxia25.7928.0934.4640.9546.3347.1137.49
Xinjiang132.33147.95191.28240.68293.48388.85230.73
Total emissions in China5232.835627.756330.946974.467580.617858.93-

