Article

Three-Stage Data Envelopment Analysis of Agricultural Water Use Efficiency: A Case Study of the Heihe River Basin

1
Faculty of International Trade, Shanxi University of Finance and Economics, Taiyuan 030060, China
2
School of Economics and Management, Beijing Forestry University, Beijing 100083, China
3
Institute of Geographic Sciences and Natural Resources Research, Chinese Academy of Sciences, Beijing 100101, China
4
Center for Chinese Agricultural Policy, Chinese Academy of Sciences, Beijing 100101, China
5
University of Chinese Academy of Sciences, Beijing, 100049, China
*
Author to whom correspondence should be addressed.
Sustainability 2018, 10(2), 568; https://0-doi-org.brum.beds.ac.uk/10.3390/su10020568
Submission received: 3 December 2017 / Revised: 14 February 2018 / Accepted: 19 February 2018 / Published: 24 February 2018

Abstract

:
Aiming to inspect the water use-related situation in the Heihe River Basin, we used a three-stage data envelopment analysis to examine agricultural water use efficiency (WUE) and related issues in the Heihe River Basin from 2004 to 2012. This method calculates technical efficiency (TE), pure technical efficiency (PTE), and scale efficiency (SE). Results show that water use-related efficiency varies according to scale. TE and SE decreased in the study area, while PTE increased. This means that the effects of pure technology on improving overall technology are very limited, and scale adjustment is vitally important to the agricultural production area in the Heihe River Basin. The results provide recommendations for decision-makers to plan the efficient use of water resources in arid and semiarid areas; in addition, this method will contribute to calculations of water use-related efficiency.

1. Introduction

Water plays an important role in human life, societal development, and environmental sustainability [1,2,3,4]. According to a World Water Development report regarding serious climate change, water supply has become a major challenge, especially in arid and semiarid areas [5,6,7]. Currently, water shortage is the greatest problem in China, where the average water use per capita is 2200 m3 [8]. The distribution of water resources in the country has exacerbated a water crisis in northwestern China [9]. The central government has set a target that the entire nation will be poverty-free in 2020, which would severely restrict water use [10]. The acceleration of urbanization and population growth also brings challenges to water utilization [11,12]. Increasing water use efficiency (WUE) has become a vital step toward a more sustainable world [13]. As an important maize seed production area, the Heihe agricultural production area in Gansu Province is one of the most water-stressed parts of the country [14,15]. There, agricultural water use accounts for more than 85% of total socioeconomic water consumption [16]. Low water utilization may come from inadequate water infrastructure, and water scarcity has become a major issue in this area [17].
In this paper, we focus on water use-related efficiency; furthermore, this paper must determine the definition of agricultural water use efficiency. Agricultural water use efficiency refers to the minimum water consumption which can be realized theoretically, compared to the actual water consumption with the predefined input and output levels. We identified the relevant literature based on three requirements: Firstly, these studies included water use. Secondly, the main aim of these studies was to determine water use-related efficiency; the calculated technical efficiency can be divided into two parts: the mean pure technical efficiency (PTE) and the scale efficiency (SE). Thirdly, the main conclusion or the main purpose contributed to some improvement in methodology. Various studies have focused on how to calculate and improve WUE (Table 1) [18,19,20]. However, this research only concentrates on how to increase water use-related efficiency [21,22]. Many studies also calculated water use on a per capita or per GDP basis [23,24,25]. Water resource supply studies may give a basic description of water consumption.
There are many case studies that include multi-input, multi-output, and multi-decision questions [36,37]. Using data envelopment analysis (DEA) is very helpful in dealing with multi-input and multi-output questions [38,39]. DEA was proposed by Charnes et al. in 1973, and has become an efficient evaluation method [40]. This method is commonly used in water resource management [41,42]. Many researchers have been concerned with water-related issues [43,44]. Research on WUE solves water problems on different levels, linking WUE at different levels [45,46,47]. Based on previous studies, DEA can be more effective for analyzing water use than WUE = Y/W(ET) methods. The DEA method provides an economic calculation method that can involve different inputs and outputs. The DEA method has been used in different studies. Furthermore, various studies have summarized DEA as being the most representative methodology to evaluate efficiencies (including environmental and banking efficiencies). For example, WUE has been calculated for 31 Chinese provinces and the city of Wuhan over the period 1998–2008, and influence factors were determined [48,49]. Such research on WUE has strong effects on improving WUE. However, the DEA method assumes that inefficiency comes entirely from management, ignoring the external environment and random error [50]. We calculated WUE in the Heihe River basin using a three-stage DEA method, and found that water stress is a major problem in this area. This paper aims to determine the true reason for low water use efficiency (TE, PTE, SE).

2. Material and Methods

The Heihe River basin (Figure 1) (38°–42° N, 98°00′–101°30′ E) is the second largest inland river basin in the arid region of northwestern China, and forms a typical desert oasis zone [51]. The region extends from the northern base of the Qilian Mountains, through the Zhangye Basin in Gansu Province, to the Ejina Banner of Inner Mongolia [17,52]. However, some tributary rivers and mainstems have ceased to flow after long-term water resource exploitation. Three independent subsystems have formed in the east, middle and west parts. The east subsystem includes more than 20 rivers, including the mainstem of the Heihe and Liyuan rivers. The middle subsystem consists of the Maying and Fengle rivers. The west subsystem includes the Taolan and Hongshui rivers [53,54].
The study area includes oasis agriculture zones in the middle and downstream regions of the Heihe River in Gansu, and has been a local major agriculture development zone for many years [29]. It consists of Ganzhou and Suzhou districts; Gaotai, Shandan, Minle, Linze, and Jinta counties; and Sunan Yugur Autonomous County. A very important issue in this area is how to improve WUE. Thus, this paper mainly focuses on WUE using data from the Heihe River basin. Economic development in the basin largely depends on agricultural production, which is highly water-consuming. Statistics show that agriculture consumes the largest proportion of water resources in the basin, reaching about 92.31% of the total, of which irrigation water accounted for 89.73%, in 2011 (Figure 2). The water diversion policy has been complemented in the Heihe River Basin since 2000, which constrains water use for agricultural production in the middle reaches. Thus, it is urgent to improve the agricultural water use efficiency in this area. The study area is located in Gansu Province, and here the agricultural production is quite similar; maize comprises up to 85% of crops grown, alongside vegetables and other crops. Vegetable crops are used for daily food, while maize is produced for sale as well as food.
Based on the hypotheses and data availability, we collected data from the period 2004–2012 related to agricultural production from six counties and two districts in the midstream and downstream agriculture zones of the Heihe River basin. Except for data related to agricultural water use, all data were taken from Zhangye and Jiuquan statistical yearbooks. We used the DEA method to calculate technical efficiency. The inputs included labor force, investment in fixed assets, and planting; these variables all came from the Zhangye and Jiuquan statistical yearbooks. We did not include fertilizers, agrochemicals, etc., as input variables. Agricultural water resource quantity data were collected from the Center for Chinese Agricultural Policy, Chinese Academy of Sciences (Table 2).

2.1. Environmental Variables

Environmental variables refer to the influence factors of WUE, and these variables do not change over short periods. Thus, the variables are also called external variables. Based on prior research [46,47,48], we used local development, natural water endowment, and industrial structure as environmental variables. Specifically, we used per capita GDP to represent local development, which reflects government finance investment and expense capabilities. Generally, with economic development, there is more investment in infrastructure and WUE increases. We used water possession per person to represent the natural water endowment. Generally, if local people possess more water, their means of water consumption and water conservation consciousness weaken, and WUE declines. We used the proportion of primary industry to GDP to represent industrial structure. If this structure is more rational, the configuration of water consumption is more reasonable and therefore water resource efficiency is greater.

2.2. Methods

DEA is based on the concept of local efficiency. There may be several units awaiting evaluation, and each unit is a separate decision-making unit (DMU). According to calculations, we can determine whether the unit is efficient [55]. The calculation of DMU is within the interval (0, 1), with values closer to 1 indicating greater efficiency. If the efficiency is equal to 1, the DMU is the most efficient compared to other DMUs [56]. Efficiency comparison can be based on DEA. The method of a three-stage DEA is thus: the first stage uses a DEA method to calculate three related technologies; the second stage peels off the redundancy of input–output variables; while the third stage uses DEA to calculate the new efficiency. In the second stage, the stochastic frontier analysis (SFA) calculation uses redundancy as a variable [57,58,59,60]. Thus, a three-stage DEA is comprised of both DEA (first and third stages) and SFA (second stage) methods. Nonparametric techniques (DEA) provide a robust framework, and parametric techniques (SFA) are used to describe parametric function.
In the first stage, aimed at calculating the WUE given a fixed output, we used the BCC (Banker, Charnes and Cooper) input-oriented DEA model. DEA was used to measure agricultural WUE. With the goal of analyzing how to improve WUE with a fixed water supply amount, we used input-oriented DEA. When the efficiency value equals 1, the decision unit is on the production frontier, and the actual production value has no difference to the possible maximum value. An efficiency value <1 implies that there is still room for improvement for the decision unit. When the value of the efficiency reached 1, the WUE of the decision unit was higher. Supposing that there are N (= 1, 2, 3, ..., 8) decision units with I (= 1, 2, 3, ...) factors in T (= 1, 2, 3, ...) time periods, then J (= 1, 2, 3, ...) types of outputs are generated. For the input–output index, we used X and Y to represent input and output. Then, the input–output index of N counties (which equaled the decision unit) during various periods was designated x i , n t and y i , n t . If we set x i =   ( x 1 n , x 2 n , , x I n ) and y j = ( y 1 n , y 2 n , , y J n ) , the model is specified as follows.
{ min θ = V D n = 1 8 λ j X i + S = θ X 0 n = 1 8 λ j Y j + S + = Y 0 λ j 0 , N = 1 , , 8 S 0 , S + 0
Here, θ ( 0 < θ < 1 ) is the comprehensive technical scale efficiency, λ j is the weighting variable, S ( S     0 ) is the slack variable, S + ( S +     0 ) is the surplus variable, and ε is the Archimedes infinitesimal. The above equation is the DEA model based on constant scale returns; if θ = 1 , it means that the county attained the optimal water use situation on the frontier.
In the second stage, the traditional DEA could not identify whether inefficiency in the first stage of decision-making was caused by management inefficiency or external factors and random errors. Thus, in the second stage, the SFA model was used to eliminate environmental and random error factors, obtaining the input relaxation variable caused by management inefficiency. According to the model concept, the following SFA regression function was constructed.
S n i = f ( z i ; β n ) + ν n i + μ n i ; i = 1 , 2 , , I ; n = 1 , 2 , , N
where S n i is the relaxation value of the nth item of the ith decision-making unit; S i is the environmental variable and β n is its coefficient; ν n i + μ n i is a mixed error term and ν n i is random interference; and μ n i represents management inefficiency. Among these terms, ν ~ N ( 0 , σ ν 2 ) is the random interference term, symbolizing the influence of that interference on the relaxation variable; and μ is management inefficiency, showing the impact of management factors on the relaxation variables. We suppose that μ follows a normal distribution at zero cutoff, which is μ ~ N + ( 0 , σ μ 2 ) . The equation for separating random error from mixing error is
E ^ [ ν n i / μ n i + ν n i ] = S n i f ( z i ; β n ) E ^ [ μ n i / μ n i + ν n i ] ; i = 1 , 2 , , I ; n = 1 , 2 , , N
According to relevant research, the equation is
E ^ [ ν n i / μ n i + ν n i ] = σ * [ ϕ ( λ ε σ ) Φ ( λ ε σ ) + ( λ ε σ ) ]
Now,
σ * = σ μ σ ν σ ,   σ = σ μ 2 + σ ν 2 ,   λ = σ μ σ ν ,   ε = μ n i + ν n i ; i = 1 , 2 , , I ; n = 1 , 2 , , N
The second stage uses SFA methods to eliminate the influence of efficiency from environmental and random factors. To adjust all decision-making units in the same external environment, the equation is adjusted as
X n i A = X n i + [ max f ( z i ; β ^ n ) f ( z i ; β ^ n ) ] + [ max ( ν n i ) ν n i ] , i = 1 , 2 , , I ; n = 1 , 2 , , N
Here, X n i A stands for the adjusted inputs and X n i the unadjusted inputs; [ max f ( z i ; β ^ n ) f ( z i ; β ^ n ) ] is used to adjust the external environmental factors; [ max ( ν n i ) ν n i ] is for putting all decision-making units on the same level.
The third stage uses the adjusted input factors to calculate WUE. The exclusion of the external environment and random error factor makes the efficiency value more objective and accurate.
The calculated technical efficiency can be divided into two parts: mean pure technical efficiency and scale efficiency. The TE under the variate return scale (VRS) (PTE) presents the efficiency without considering the scale, and the TEVRS could change in the short-term. SE represents the scale of the agricultural farm, which could not change easily in the short-term.

3. Results

3.1. Agricultural Water Use Efficiency in the First Stage

The results reveal disparities between different areas regarding agricultural water-related efficiency. On average, from 2004 to 2012 (Table 3), the comprehensive efficiency in these areas varied substantially. The comprehensive efficiency of Minle was the highest, with a mean of 0.92. The efficiency of Sunan was the lowest, with a mean of only 0.19. From the standpoint of pure technical efficiency (PTE), the difference between counties was greatly reduced. Sunan had the highest PTE, over twice that of Suzhou. Regarding the scale of efficiency, Minle’s technical efficiency was five times greater than Sunan’s scale efficiency.
Regarding county-scale time difference (Figure 3), in 2004, the technical efficiency of Shandan and Minle was located on the frontier, which is equal to 1 (Figure 3a); while the technical efficiency of Jinta was the lowest. The pure technical efficiencies of Shandan, Minle, Sunan, and Jinta were equal to 1 (Figure 3b). The scale efficiencies of Shandan and Minle were also equal to 1 (Figure 3c). By 2012, the technical efficiency of Minle was equal to 1, and the pure technical efficiencies of Ganzhou, Sunan and Suzhou were equal to 1. The scale efficiencies of Ganzhou, Shandan, Minle, Sunan and Suzhou were equal to 1. The main reason for the changes is that the various efficiencies measured by our approach represent a relatively comparative concept. Between 2004 and 2012, the agricultural production area of the Heihe River basin substantially increased. In particular, agricultural production land reclamation entered a period of rapid development. Thus, the scale efficiency has increased, especially beginning in 2012. In addition to the five counties above, scale efficiency of the other counties was above 0.91 (Figure 3c), indicating that the scale of efficiency to enhance the space was smaller. The technical efficiency of Minle was on the frontier. Since the 12th Five-year Plan, Minle has been committed to transforming traditional to modern agriculture, and its industrial structure improved considerably, leading to an intensive and professional mode of agricultural production and management. Because of improvement in organization and socialization, the agricultural water resource efficiency of Minle also increased.

3.2. Agricultural Water Use Efficiency in the Second Stage

To establish the SFA equations, we used investment in fixed assets (Equation (1)), planting area (Equation (2)), agricultural labor force (Equation (3)), and agricultural water use (Equation (4)) as dependent variables; and local development, natural water endowment, and industrial structure as independent variables. To identify the effects clearly, we constructed 24 equations using progressive panel regression, and the equations according to 2012 data are listed in Table 4.
Results show that the T-value of the likelihood ratio of unilateral error is larger than the critical value of a mixed χ 2 distribution. Thus, the original hypothesis is rejected, indicating that the model is reasonable and suitable for regression analysis using SFA. Among them, if the value of γ = σ μ 2 σ μ 2 + σ ν 2 in the variables is close to 1, the effect of inefficiency on the relaxation variable in the mixed error term is dominant, and the effect of random error on the relaxation variable is very small. In constructing the model, it is seen that input redundancy can be regarded as the opportunity cost of each region. A positive regression coefficient shows that the explanatory variable is positively correlated with the relaxation variable, indicating that an increase in the explanatory variable is not conducive to a decrease in redundancy variables. When the regression coefficient is negative, an increase of the explanatory variables reduces the relaxation variable. Thus, an increase in the explanatory variables improves the efficiency of agricultural water resource utilization.
The regression coefficient of local development for the four relaxation variables was negative throughout the significance testing. This was mainly because in more developed areas, other industries made up a larger proportion than agriculture, and the proportion of agriculture in industry was small. This caused a weak water resource scale effect.
The regression coefficient of water resources endowment for the relaxation variable of fixed assets investment was negative throughout the significance testing. Water resources endowment had a positive effect on the other variables. This means that the increase of water resources endowment had a positive effect on the input to agricultural water resources, consistent with related research. In particular, the “resource curse” of certain scholars was strongly reflected.
The regression coefficient of the proportion of primary industry for the four relaxation variables was negative, meaning that the larger the proportion of primary industry, the stronger the scale effect. The increase in the proportion of primary industry generates more social capital to invest in primary industry, thereby improving water resource infrastructure and water resource efficiency.

3.3. Agricultural Water Use Efficiency in the Third Stage

After the adjustments, we used the same input–output variables as in the first stage, and the results show some differences. After adjustment (Figure 4), on average over the period 2004–2012, there were obvious differences in comprehensive efficiency across the areas. The technical efficiency (Figure 4a) of Ganzhou was maximal, with the mean equal to 0.45. The adjusted pure technical efficiencies of five counties were all above 0.91 (Figure 4b). The maximum scale efficiency was that of Ganzhou (Figure 4c).
Specifically, in 2012, the technical efficiency of Suzhou was the highest, reaching the frontier; i.e., an efficiency value = 1. The smallest technical efficiency value was that of Sunan. Compared with 2004, values for Sunan had not changed much overall, but its technical efficiency had clearly increased by a small amount. The pure technical efficiency of Sunan was >0.9 prior to 2012, and the scale efficiency difference was obvious, with an increase to 0.296 in 2012.

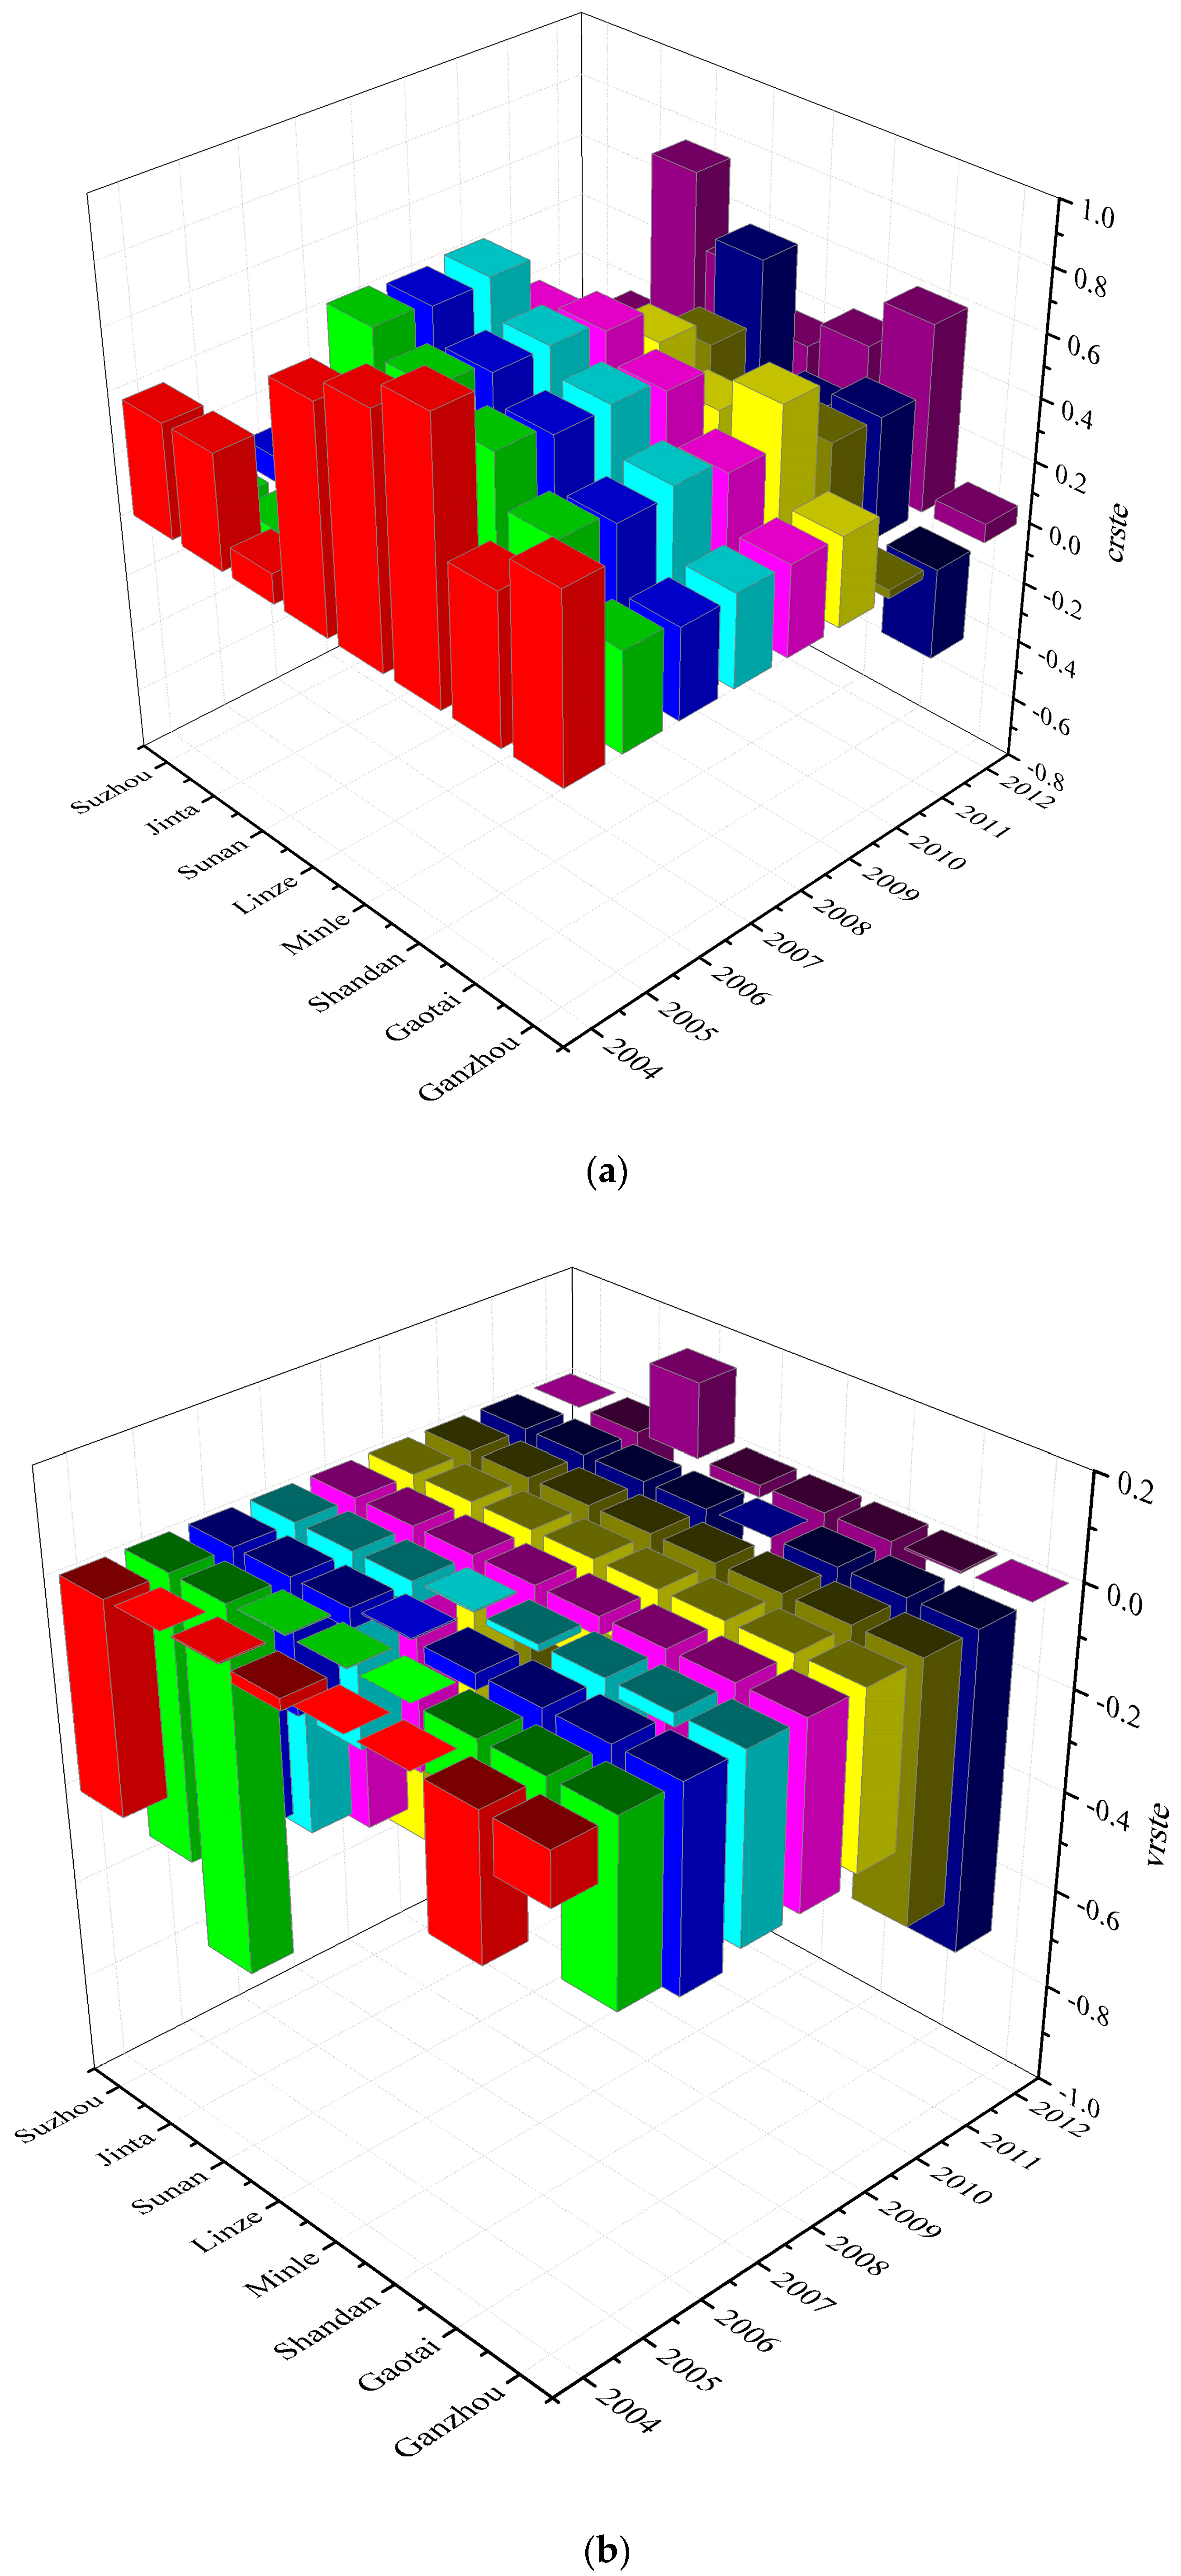
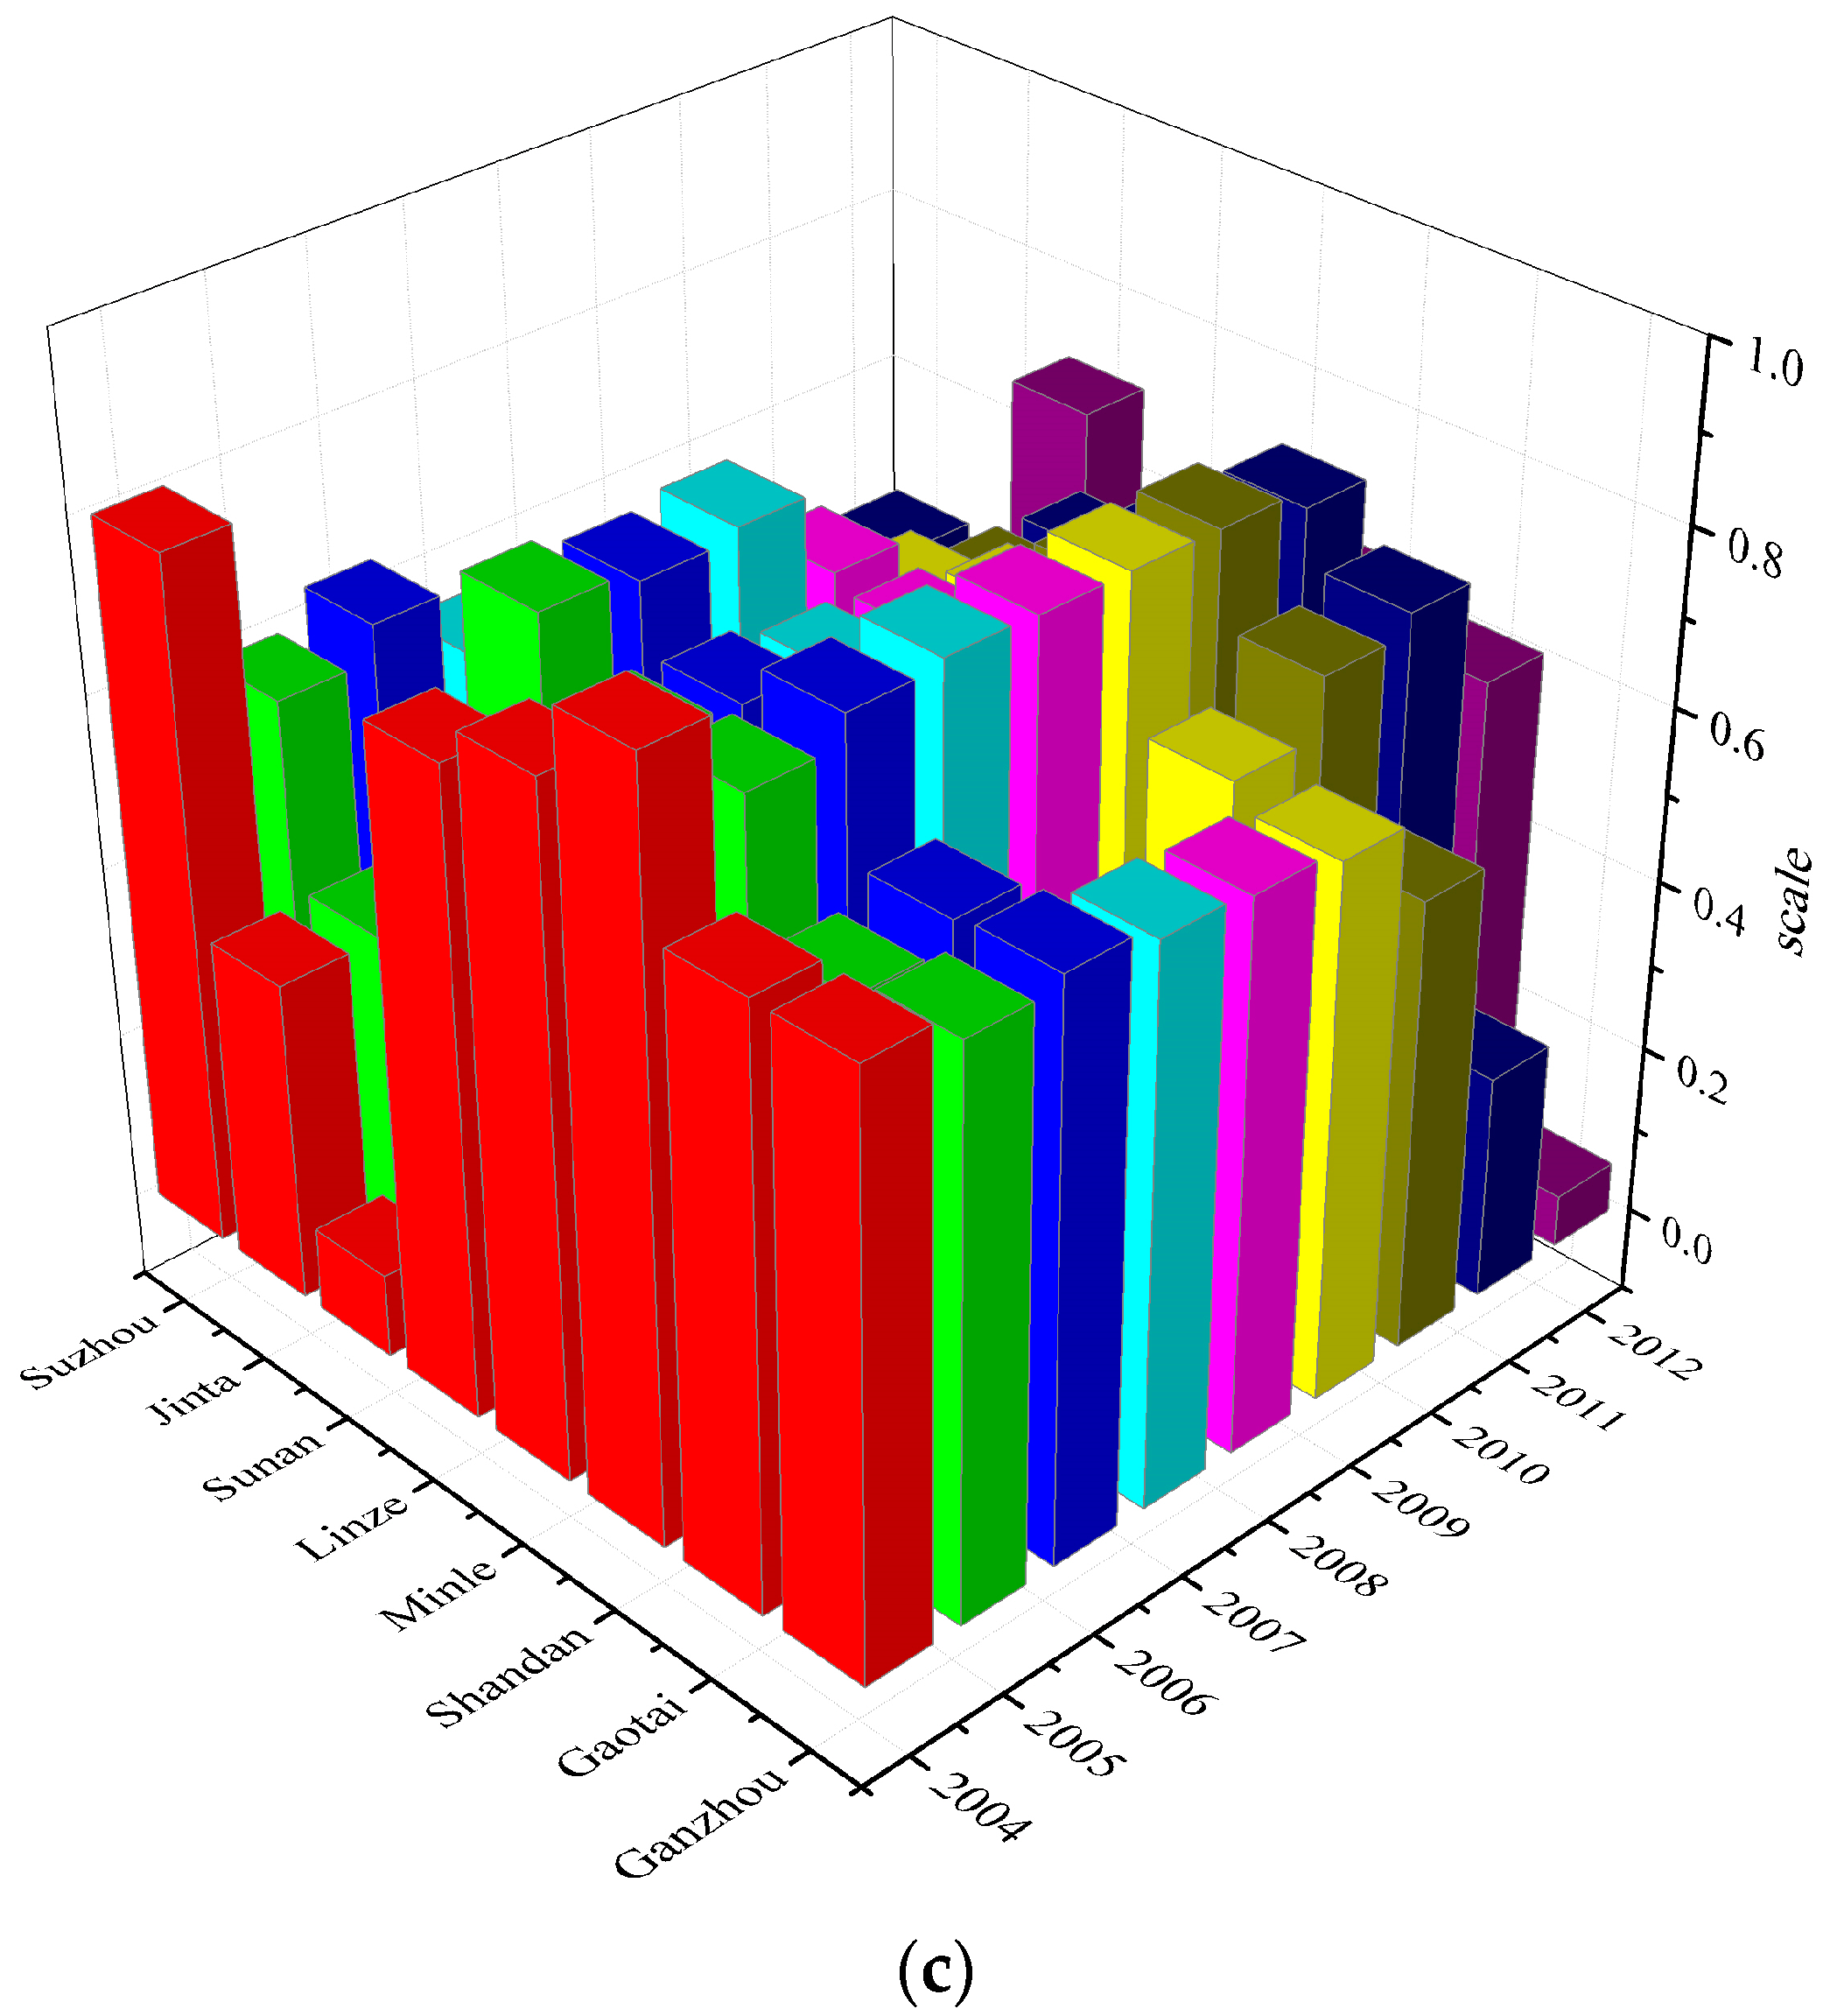
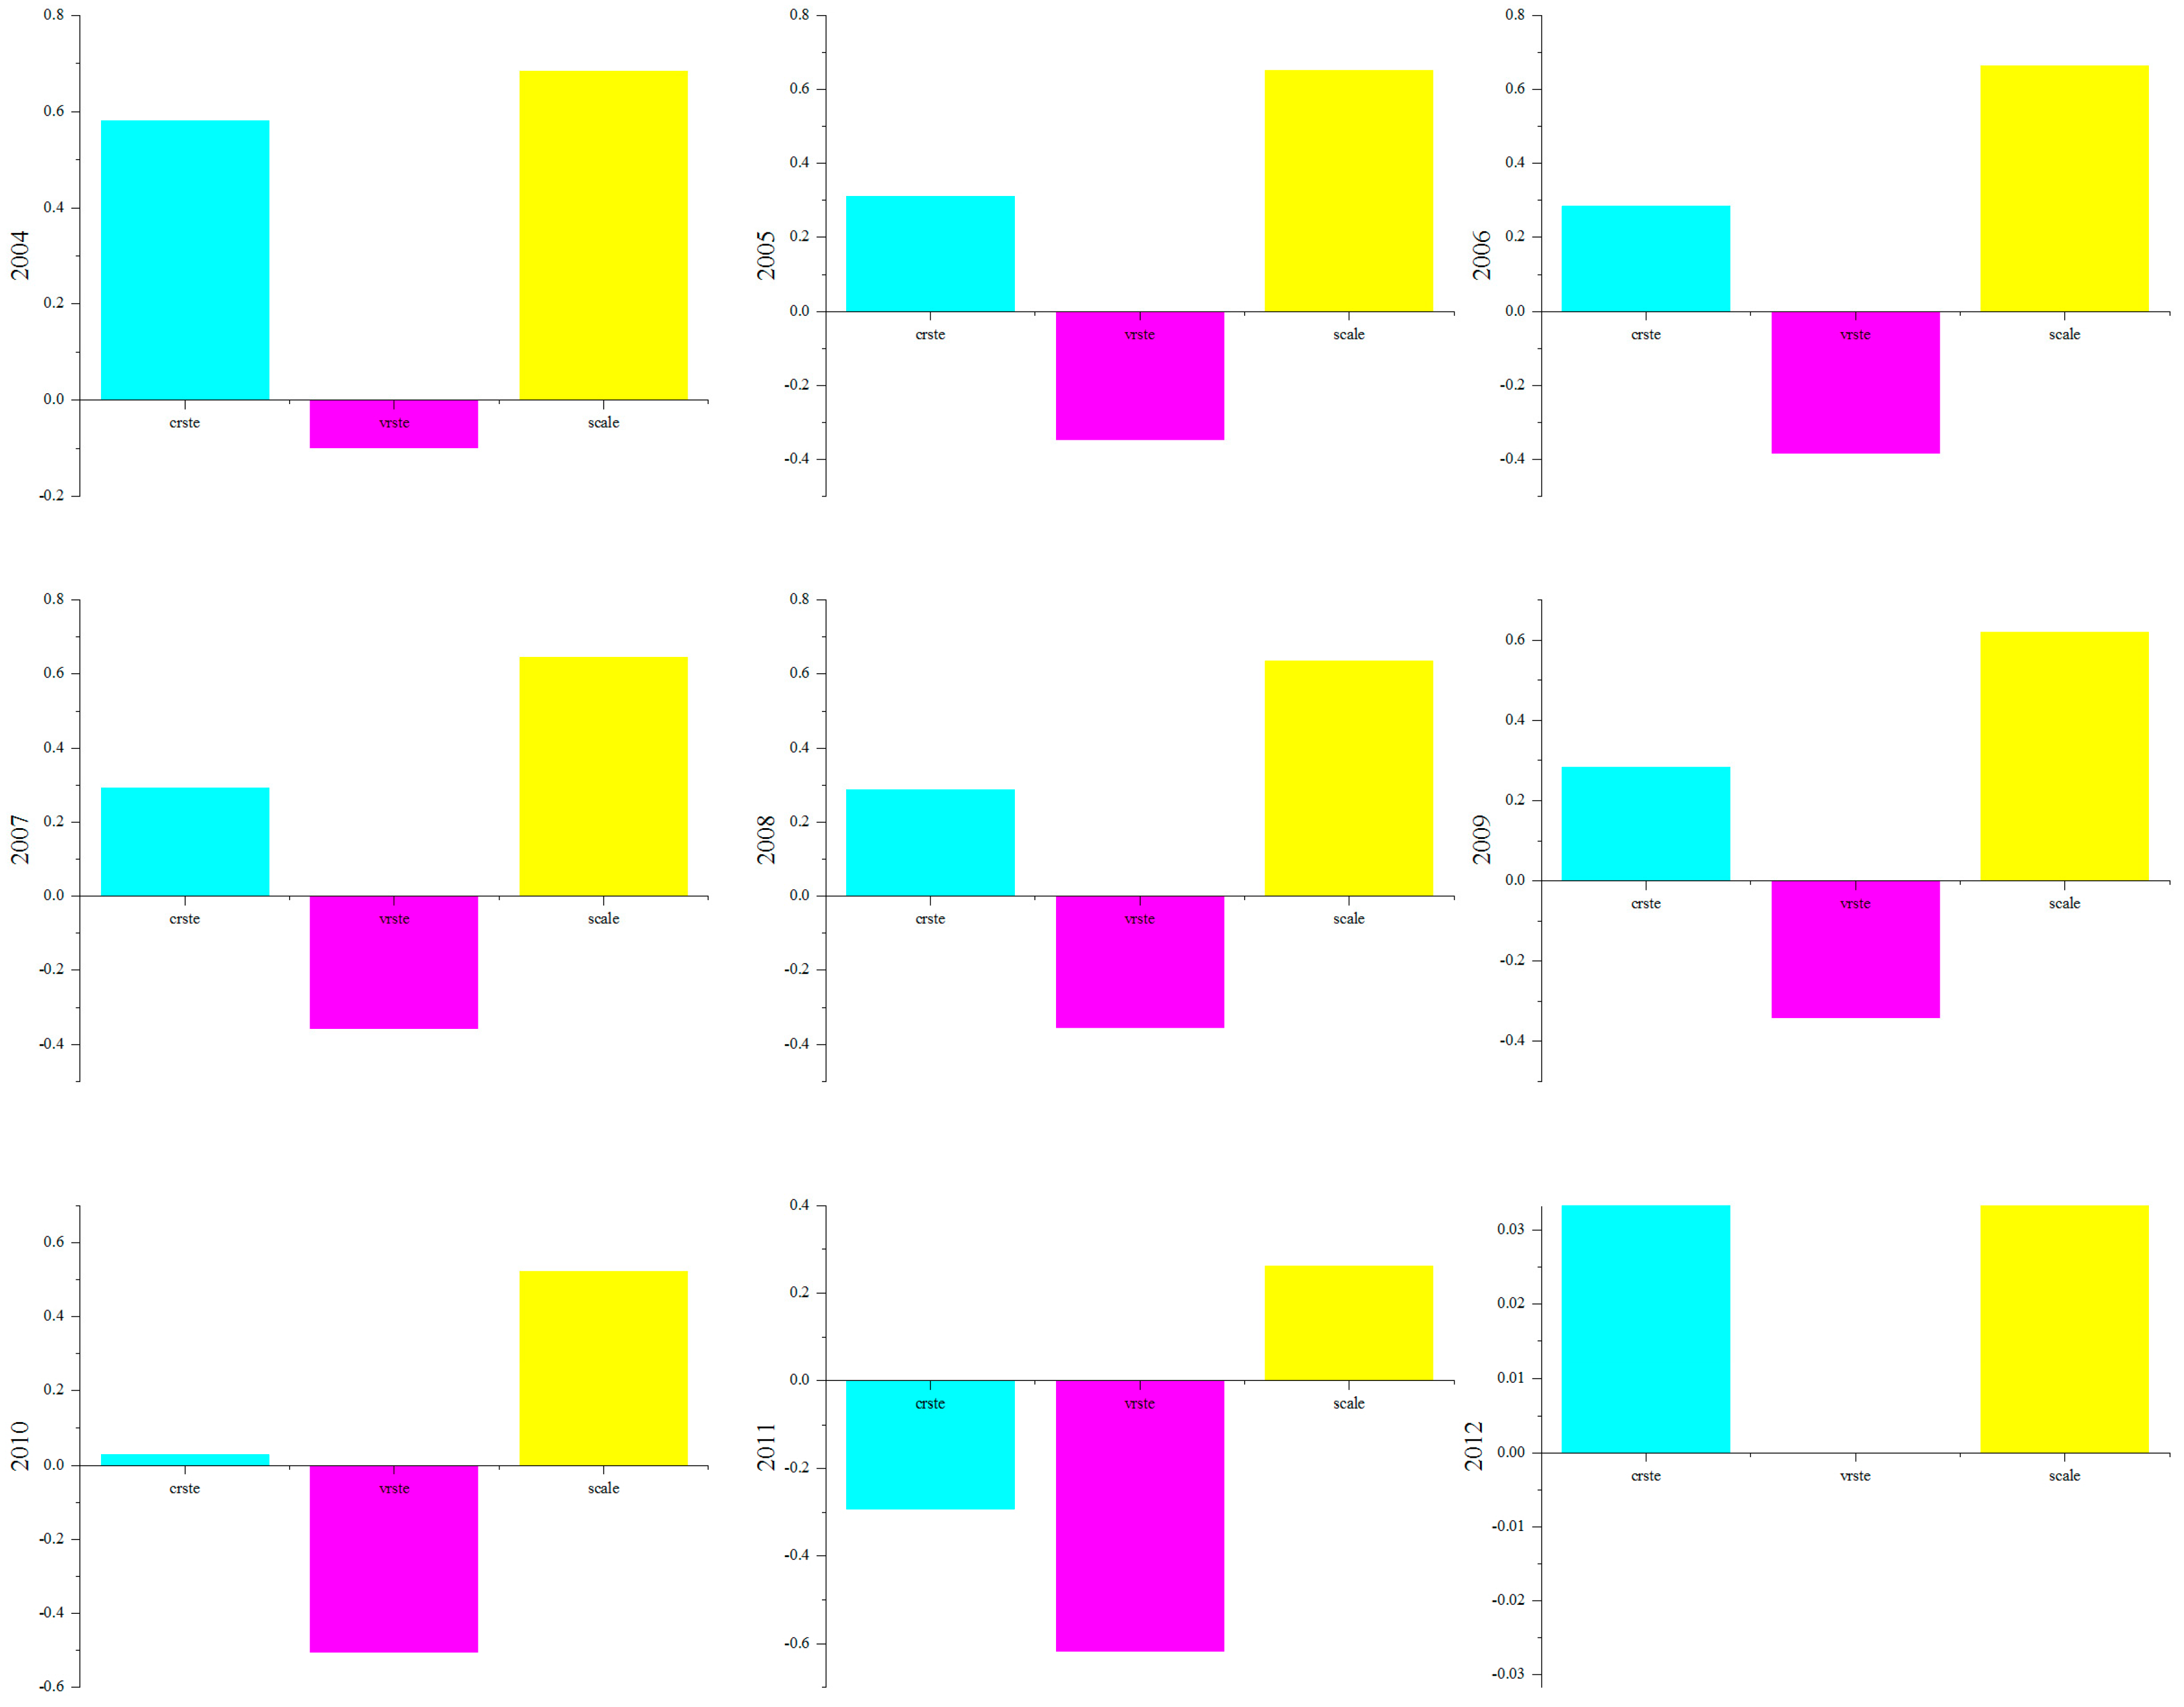
3.4. Agricultural Water Use Efficiency Change during 2004–2012

From a comprehensive viewpoint (Figure 5), technical efficiency of the counties declined significantly after eliminating the effects of environmental and stochastic factors. Regarding technical efficiency, the major change in performance was a declining trend (Figure 5a), in which Minle’s efficiency decreased the most. According to the estimated result, in 2007, Minle’s original and adjusted technical efficiency values had an obvious difference. As for Ganzhou in 2011, and Suzhou from 2007 to 2012, technical efficiency had an upward trend. In particular, for Suzhou, after elimination of the relevant effects of technical efficiency (Figure 5b), there was an upward trend over many years. For scale efficiency, in addition to Suzhou in 2011, the other counties had a downward trend (Figure 5c).
Thus, according to the study, the technical efficiency in the study is overestimated (except for the year of 2011). It is also evident that the pure technical efficiency is underestimated, as the PTE values in the study area are almost all above 0.85 (Figure 4b), thus meaning that the possibility for agricultural water conservation on the technical level is almost nil. The overestimation mainly comes from the scale efficiency, thus meaning that enlarging the scale could improve the technical efficiency; however, considering the water restriction, the area could not be too large.
To elucidate changes of different counties in detail, we took Ganzhou District as an example (Figure 6). Here, we could precisely see the difference before and after adjustment. It is seen that after adjustment of the technical and scale efficiencies of agricultural production, those efficiencies showed a declining trend, while the pure technical efficiency had an upward trend. In 2012, changes of scale efficiency led to all technical efficiency changes, i.e., in the first stage of the estimation, scale efficiency was overestimated. This means that the region’s agricultural scale efficiency did not seriously affect agricultural water resources efficiency.
The changes in Ganzhou County vividly depict the changes overall. The technical efficiency is overestimated from 2004 to 2012, except in 2011; the difference in 2011 may be due to that year’s drought. It is evident that the scale efficiency is overestimated in Ganzhou County.

4. Discussions and Conclusions

In this work, a three-stage DEA was used to analyze the efficiency of agricultural water resource utilization in the Heihe agricultural production area over the period 2004–2012. As a result of regional analysis, after exclusion of external environmental and random factors, regional agricultural water efficiency underwent great changes. Comprehensive technical efficiency and scale efficiency mainly manifested as overestimated trends, and pure technical efficiency had an underestimated trend. Therefore, the three-stage DEA could produce a better description of WUE in the Heihe agricultural production area. Based on the above conclusions, technology is not the main factor restricting the improvement of agricultural water resource efficiency in the region; the main restriction on the efficiency of agricultural water resources is the scale factor.
A favorable scale of agriculture has always been a focus of research, especially the resource-saving effect of operation at scale. There is serious water wastage in irrigation areas of China, and the ecological environment of general irrigation areas is relatively fragile. A reasonable irrigation scale will greatly improve the efficiency of agricultural water resources. Improvement in water efficiency of traditional agriculture is more focused on technical improvements, and studies have shown that the possibility for agricultural water conservation on the technical level is almost nil.
Comparing the water-related efficiency with findings from other studies, this paper solved the water-related questions in study areas, as this method has the advantage of being able to precisely calculate local water issues by using data from surveys or government collection. In this way, it will play a vital role in addressing these problems. Furthermore, this method could be used to calculate the national WUE in the near future. This method could calculate the economic performance of agricultural water use in a limited data situation, especially at the county level. The water use efficiency calculation is of vital importance to China, especially at the county level. In China, there are more than 1000 counties, encompassing 459 irrigated areas with different levels of irrigation technique. Improving water use efficiency is a very complex system task; the government aims to improve irrigation techniques, which may be important in some areas. However, using only this method could not truly save on water usage; we should convert our water saving method to water control rather that water resource control.
In the present work, owing to limitations of data acquisition, the change in regional agricultural water resource efficiency was studied for the period 2004–2012 only. In the future, input–output indicators will be an important component of the DEA model. Moreover, this paper focused on determining water use-related efficiency in this area at the county level only. At farmer-level production, the problem of not being able to manage water use efficiency—possibly due to illness—may also be encountered. If agricultural water use efficiency is calculated using only the economic model, it could not reflect this small-scale situation.

Acknowledgments

This research was financially supported by the major research plan of the National Natural Science Foundation of China (Grant No. 91425303; 91325302).

Author Contributions

Zhihui Li gave the overview of this paper, Xiangzheng Deng designed the paper, Xiaoxue Zhou and Nan Lin contributed to materials and data preparation, and Guofeng Wang wrote the paper.

Conflict of Interests

The authors declare no conflict of interest.

References

  1. Wallace, J. Increasing agricultural water use efficiency to meet future food production. Agric. Ecosyst. Environ. 2000, 82, 105–119. [Google Scholar] [CrossRef]
  2. Susskind, L. Water and democracy: New roles for civil society in water governance. Int. J. Water Resour. Dev. 2013, 29, 666–677. [Google Scholar] [CrossRef]
  3. Pimentel, D.; Houser, J.; Preiss, E.; White, O.; Fang, H.; Mesnick, L.; Barsky, T.; Tariche, S.; Schreck, J.; Alpert, S. Water Resources: Agriculture, the Environment, and Society. Bioscience 1997, 47, 97–106. [Google Scholar] [CrossRef]
  4. Garrick, D.; Hall, J.W. Water security and society: Risks, metrics, and Pathways. Annu. Rev. Environ. Resour. 2014, 39, 611–639. [Google Scholar] [CrossRef]
  5. Turral, H.; Burke, J.; Faures, J.M.; Faures, J.M. Climate Change, Water and Food Security; Food and Agriculture Organization of the United Nations: Rome, Italy, 2011; p. 204. [Google Scholar]
  6. Piao, S.; Ciais, P.; Huang, Y.; Shen, Z.; Peng, S.; Li, J.; Zhou, L.; Liu, H.; Ma, Y.; Ding, Y.; et al. The impacts of climate change on water resources and agriculture in China. Nature 2010, 467, 43–51. [Google Scholar] [CrossRef] [PubMed]
  7. Haddeland, I.; Heinke, J.; Biemans, H.; Eisner, S.; Flörke, M.; Hanasaki, N.; Konzmann, M.; Ludwig, F.; Masaki, Y.; Schewe, J.; et al. Global water resources affected by human interventions and climate change. Proc. Natl. Acad. Sci. USA 2014, 111, 3251–3256. [Google Scholar] [CrossRef] [PubMed]
  8. Zhao, X.; Liu, J.; Liu, Q.; Tillotson, M.R.; Guan, D.; Hubacek, K. Physical and virtual water transfers for regional water stress alleviation in China. Proc. Natl. Acad. Sci. USA 2015, 112, 1031–1035. [Google Scholar] [CrossRef] [PubMed]
  9. Cai, B.; Zhang, B.; Bi, J.; Zhang, W. Energy’s thirst for water in china. Environ. Sci. Technol. 2014, 48, 11760–11768. [Google Scholar] [CrossRef] [PubMed]
  10. Fisher, J.A.; Patenaude, G.; Giri, K.; Lewis, K.; Meir, P.; Pinho, P.; Rounsevell, M.D.A.; Williams, M. Understanding the relationships between ecosystem services and poverty alleviation: A conceptual framework. Ecosyst. Serv. 2014, 7, 34–45. [Google Scholar] [CrossRef]
  11. Lyons, W.B. Water and urbanization. Environ. Res. Lett. 2014, 9, 111002. [Google Scholar] [CrossRef]
  12. Moglia, M.; Perez, P.; Burn, S. Urbanization and Water Development in the Pacific Islands. Development 2008, 51, 49–55. [Google Scholar] [CrossRef]
  13. Olivier, F.C.; Singels, A. Increasing water use efficiency of irrigated sugarcane production in South Africa through better agronomic practices. Field Crop. Res. 2015, 176, 87–98. [Google Scholar] [CrossRef]
  14. Zhang, Q.; Liu, B.; Zhang, W.; Jin, G.; Li, Z. Assessing the regional spatio-temporal pattern of water stress: A case study in Zhangye City of China. Phys. Chem. Earth 2015, 79–82, 20–28. [Google Scholar] [CrossRef]
  15. Castro, V.W.; Heerink, N.; Shi, X.; Qu, W. Water savings through off-farm employment? China Agric. Econ. Rev. 2010, 2, 167–184. [Google Scholar] [CrossRef]
  16. Jiang, Y.; Xu, X.; Huang, Q.; Huo, Z.; Huang, G. Assessment of irrigation performance and water productivity in irrigated areas of the middle Heihe River basin using a distributed agro-hydrological model. Agric. Water Manag. 2015, 147, 67–81. [Google Scholar] [CrossRef]
  17. Lu, Z.; Wei, Y.; Xiao, H.; Zou, S.; Ren, J.; Lyle, C. Trade-offs between midstream agricultural production and downstream ecological sustainability in the Heihe River basin in the past half century. Agric. Water Manag. 2015, 152, 233–242. [Google Scholar] [CrossRef]
  18. Bravo-Ureta, B.E.; Solís, D.; López, V.H.M.; Maripani, J.F.; Thiam, A.; Rivas, T. Technical efficiency in farming: A meta-regression analysis. J. Product. Anal. 2007, 27, 57–72. [Google Scholar] [CrossRef]
  19. Fandika, I.R.; Kemp, P.D.; Millner, J.P.; Horne, D.; Roskruge, N. Irrigation and nitrogen effects on tuber yield and water use efficiency of heritage and modern potato cultivars. Agric. Water Manag. 2016, 170, 148–157. [Google Scholar] [CrossRef]
  20. Kifle, M.; Gebretsadikan, T.G. Yield and water use efficiency of furrow irrigated potato under regulated deficit irrigation, Atsibi-Wemberta, North Ethiopia. Agric. Water Manag. 2016, 170, 133–139. [Google Scholar] [CrossRef]
  21. Tari, A.F. The effects of different deficit irrigation strategies on yield, quality, and water-use efficiencies of wheat under semi-arid conditions. Agric. Water Manag. 2016, 167, 1–10. [Google Scholar] [CrossRef]
  22. Hu, C.; Ding, M.; Qu, C.; Sadras, V.; Yang, X.; Zhang, S. Yield and water use efficiency of wheat in the Loess Plateau: Responses to root pruning and defoliation. Field Crop. Res. 2015, 179, 6–11. [Google Scholar] [CrossRef]
  23. Fan, Y.; Wang, C.; Nan, Z. Comparative evaluation of crop water use efficiency, economic analysis and net household profit simulation in arid Northwest China. Agric. Water Manag. 2014, 146, 335–345. [Google Scholar] [CrossRef]
  24. Deng, X.-P.; Shan, L.; Zhang, H. Improving agricultural water use efficiency in arid and semiarid areas of China. Agric. Water Manag. 2006, 80, 23–40. [Google Scholar] [CrossRef]
  25. Miriti, J.M.; Kironchi, G.; Esilaba, A.O.; Heng, L.K.; Gachene, C.K.K.; Mwangi, D.M. Yield and water use efficiencies of maize and cowpea as affected by tillage and cropping systems in semi-arid Eastern Kenya. Agric. Water Manag. 2012, 115, 148–155. [Google Scholar] [CrossRef]
  26. Wei, Z.; Du, T.; Zhang, J. Carbon isotope discrimination shows a higher water use efficiency under alternate partial root-zone irrigation of field-grown tomato. Agric. Water Manag. 2016, 165, 33–43. [Google Scholar] [CrossRef]
  27. Wu, Y.; Jia, Z.; Ren, X. Effects of ridge and furrow rainwater harvesting system combined with irrigation on improving water use efficiency of maize (Zea mays L.) in semi-humid area of China. Agric. Water Manag. 2015, 158, 1–9. [Google Scholar] [CrossRef]
  28. Tolk, J.A.; Evett, S.R.; Xu, W. Constraints on water use efficiency of drought tolerant maize grown in a semi-arid environment. Field Crop. Res. 2016, 186, 66–77. [Google Scholar] [CrossRef]
  29. Gadanakis, Y.; Bennett, R.; Park, J. Improving productivity and water use efficiency: A case study of farms in England. Agric. Water Manag. 2015, 160, 22–32. [Google Scholar] [CrossRef]
  30. Chen, R.; Cheng, W.; Cui, J. Lateral spacing in drip-irrigated wheat: The effects on soil moisture, yield, and water use efficiency. Field Crop. Res. 2015, 179, 52–62. [Google Scholar] [CrossRef]
  31. Abd El-Mageed, T.A.; Semida, W.M. Organo mineral fertilizer can mitigate water stress for cucumber. production (Cucumis sativus L.). Agric. Water Manag. 2015, 159, 1–10. [Google Scholar] [CrossRef]
  32. Pradhan, S.; Sehgal, V.K.; Das, D.K. Effect of weather on seed yield and radiation and water use efficiency of mustard cultivars in a semi-arid environment. Agric. Water Manag. 2014, 139, 43–52. [Google Scholar] [CrossRef]
  33. Rana, G.; Ferrara, R.M.; Vitale, D. Carbon assimilation and water use efficiency of a perennial bioenergy crop (Cynara cardunculus L.) in Mediterranean environment. Agric. For. Meteorol. 2016, 217, 137–150. [Google Scholar] [CrossRef]
  34. Ram, H.; Dadhwal, V.; Vashist, K.K. Grain yield and water use efficiency of wheat (Triticum aestivum L.) in relation to irrigation levels and rice straw mulching in North West India. Agric. Water Manag. 2013, 128, 92–101. [Google Scholar] [CrossRef]
  35. Xiao, G.; Zhang, F.; Qiu, Z. Response to climate change for potato water use efficiency in semi-arid areas of China. Agric. Water Manag. 2013, 127, 119–123. [Google Scholar]
  36. Lu, Y.; Zhang, X.; Chen, S.; Shao, L.; Sun, H. Changes in water use efficiency and water footprint in grain production over the past 35 years: A case study in the North China Plain. J. Clean. Prod. 2016, 116, 71–79. [Google Scholar] [CrossRef]
  37. Pointon, C.; Matthews, K. Reprint of: Dynamic efficiency in the English and Welsh water and sewerage industry. Omega 2016, 60, 98–108. [Google Scholar] [CrossRef]
  38. Liu, J.S.; Lu, L.Y.Y.; Lu, W.M.; Lin, B.J.Y. Data envelopment analysis 1978-2010: A citation-based literature survey. Omega 2013, 41, 3–15. [Google Scholar] [CrossRef]
  39. Atici, K.B.; Podinovski, V.V. Using data envelopment analysis for the assessment of technical efficiency of units with different specialisations: An application to agriculture. Omega 2015, 54, 72–83. [Google Scholar] [CrossRef] [Green Version]
  40. Cook, W.D.; Tone, K.; Zhu, J. Data envelopment analysis: Prior to choosing a model. Omega 2014, 44, 1–4. [Google Scholar] [CrossRef]
  41. Wang, G.; Chen, J.; Wu, F.; Li, Z. An integrated analysis of agricultural water-use efficiency: A case study in the Heihe River Basin in Northwest China. Phys. Chem. Earth Parts A/B/C 2015, 89–90, 3–9. [Google Scholar] [CrossRef]
  42. Li, Z.; Deng, X.; Wu, F.; Hasan, S.S. Scenario analysis for water resources in response to land use change in the middle and upper reaches of the Heihe River Basin. Sustainability 2015, 7, 3086–3108. [Google Scholar] [CrossRef]
  43. Descheemaeker, K.; Bunting, S.W.; Bindraban, P.; Muthuri, C.; Molden, D.; Beveridge, M.; van Brakel, M.; Herrero, M.; Clement, F.; Boelee, E.; et al. Increasing Water Productivity in Agriculture. Manag. Water Agroecosyst. Food Secur. 2013, 10, 104–123. [Google Scholar] [CrossRef]
  44. Boelens, R.; Vos, J. The danger of naturalizing water policy concepts: Water productivity and efficiency discourses from field irrigation to virtual water trade. Agric. Water Manag. 2012, 108, 16–26. [Google Scholar] [CrossRef]
  45. Wang, Z.; Deng, X.; Li, X.; Zhou, Q.; Yan, H. Impact analysis of government investment on water projects in the arid Gansu Province of China. Phys. Chem. Earth 2015, 79–82, 54–66. [Google Scholar] [CrossRef]
  46. Wu, F.; Zhan, J.; Güneralp, İ. Present and future of urban water balance in the rapidly urbanizing Heihe River Basin, Northwest China. Ecol. Modell. 2015, 318, 254–264. [Google Scholar] [CrossRef]
  47. Zhou, Q.; Wu, F.; Zhang, Q. Is irrigation water price an effective leverage for water management? An empirical study in the middle reaches of the Heihe River basin. Phys. Chem. Earth 2015, 89–90, 25–32. [Google Scholar] [CrossRef]
  48. Tang, J.; Folmer, H.; Xue, J. Technical and allocative efficiency of irrigation water use in the Guanzhong Plain, China. Food Policy 2015, 50, 43–52. [Google Scholar] [CrossRef]
  49. Du, N.; Ottens, H.; Sliuzas, R. Spatial impact of urban expansion on surface water bodies—A case study of Wuhan, China. Landsc. Urban Plan. 2010, 94, 175–185. [Google Scholar] [CrossRef]
  50. Li, K.; Lin, B. Impact of energy conservation policies on the green productivity in China’s manufacturing sector: Evidence from a three-stage DEA model. Appl. Energy 2016, 168, 351–363. [Google Scholar] [CrossRef]
  51. Cheng, G.; Li, X.; Zhao, W.; Xu, Z.; Feng, Q.; Xiao, S.; Xiao, H. Integrated study of the water-ecosystem-economy in the Heihe River Basin. Natl. Sci. Rev. 2014, 1, 413–428. [Google Scholar] [CrossRef]
  52. Geng, X.; Wang, X.; Yan, H.; Zhang, Q.; Jin, G. Land Use/Land Cover Change Induced Impacts on Water Supply Service in the Upper Reach of Heihe River Basin. Sustainability 2014, 7, 366–383. [Google Scholar] [CrossRef]
  53. Chen, D.; Jin, G.; Zhang, Q.; Arowolo, A.O.; Li, Y. Water ecological function zoning in Heihe River Basin, Northwest China. Phys. Chem. Earth Parts A/B/C 2016, 96, 74–83. [Google Scholar] [CrossRef]
  54. Zhang, L.; Nan, Z.; Yu, W.; Ge, Y. Modeling Land-Use and Land-Cover Change and Hydrological Responses under Consistent Climate Change Scenarios in the Heihe River Basin, China. Water Resour. Manag. 2015, 29, 4701–4717. [Google Scholar] [CrossRef]
  55. Song, W.; Zhang, Y. Expansion of agricultural oasis in the Heihe River Basin of China: Patterns, reasons and policy implications. Phys. Chem. Earth 2015, 89–90, 46–55. [Google Scholar] [CrossRef]
  56. Hoff, A. Second stage DEA: Comparison of approaches for modelling the DEA score. Eur. J. Oper. Res. 2007, 181, 425–435. [Google Scholar] [CrossRef]
  57. Estelle, S.M.; Johnson, A.L.; Ruggiero, J. Three-stage DEA models for incorporating exogenous inputs. Comput. Oper. Res. 2010, 37, 1087–1090. [Google Scholar] [CrossRef]
  58. Zhang, H.; Shen, G.; Jin, D. The eco-efficiency evaluation on petrochemical industry based on three-stage DEA model. Adv. Mater. Res. 2011, 219–220, 1468–1471. [Google Scholar]
  59. Sueyoshi, T.; Yuan, Y.; Goto, M. A Literature Study for DEA Applied to Energy and Environment. Energy Econ. 2016, 62, 104–124. [Google Scholar] [CrossRef]
  60. Bian, Y.; Yan, S.; Xu, H. Efficiency evaluation for regional urban water use and wastewater decontamination systems in China: A DEA approach. Resour. Conserv. Recycl. 2014, 83, 15–23. [Google Scholar] [CrossRef]
Figure 1. Agricultural production area in the Heihe River region.
Sustainability 10 00568 g001
Figure 2. The water consumption of different sectors in the Heihe River Basin in 2011.
Sustainability 10 00568 g002
Figure 3. Technical, pure technical, and scale efficiency in the Heihe agricultural area. (a) technical efficiency; (b) pure technical efficiency; (c) scale efficiency.
Sustainability 10 00568 g003aSustainability 10 00568 g003b
Figure 4. Adjusted technical, pure technical and scale efficiency in the Heihe agricultural area. (a) technical efficiency; (b) pure technical efficiency; (c) scale efficiency.
Sustainability 10 00568 g004aSustainability 10 00568 g004b
Figure 5. Differences in technical efficiency in the Heihe agricultural area before and after adjustment. (a) technical efficiency; (b) pure technical efficiency; (c) scale efficiency.
Sustainability 10 00568 g005aSustainability 10 00568 g005b
Figure 6. Difference in technical and scale efficiencies before and after adjustment in Ganzhou County.
Sustainability 10 00568 g006
Table 1. Methods used to determine water use efficiency (WUE) and mean WUEs reported in recent publications.
First Author Year Country Product(s)No. Obser.MethodMean Water Use Efficiency
Tari et al. [21]2016Anatoliawheat22WUE = Y/ET1.02–1.30 kg/m−3
Wei et al. [26]2016English/Welshall products10DEA0.91
Wu et al. [27]2016Chinawheat35WUE = Y/ET1.80 kg/m−3
Tolk [28]2016USAmaize260WUE = Y/ET2.23 kg/m−3
Kifle et al. [20]2016Ethiopiapotato8WUE = Y/ET1.6–2.86 kg/m−3
Fandika et al. [19]2015Agriapotato32WUE = Y/ET10.3 kg/ha.mm
Gadanakis et al. [29]2015Englandall products66DEA0.51
Chen et al. [30]2014Zimbabwemaize115WUE = Y/ET27.5 kg/ha.mm
EI-Mageed et al. [31]2014Chinaonion97WUE = Y/ET8.71 kg/m3
Fan et al. [23]2014ChinaWheat86WUE = Y/ET0.87 kg/m3
Pradhan et al. [32]2014IndiaWheat5WUE = Y/ET6.08 kg/ha.mm
Rana et al. [33]2013SpainChickpea18WUE = Y/W1.8–5.9 kg/ha.mm
Ram et al. [34]2013IndiaWheat15WUE = Y/W148 kg/ha.cm
Xiao et al. [35]2013Chinapotato11WUE = Y/ET8.6 kg/ha.mm
Note: DEA, Data Envelopment Analysis.
Table 2. Basic input–output information in the Heihe agricultural production area.
AreaAgricultural Production ValueAgricultural Water UseAgricultural Labor ForceInvestment in Fixed AssetsPlanting Area
Mean (10,000 RMB)SDMean (10,000 m3)SDMean (Persons)SDMean (10,000 RMB)SDMean (10,000 mu)SD
Ganzhou643,861325,43845,9226207324,4507630283,162193,48853.323.35
Gaotai181,45195,42920,8254331134,339246882,23756,83324.584.09
Shandan198,04281,27438,1814251145,26111,85884,22569,57135.353.1
Minle169,72376,39459,4646583210,166426979,44667,84358.342.26
Linze183,01995,15317,8243360125,41869189,84166,61519.742.72
Sunan90,21469,3164436173725,402559136,437121,8824.821.21
Jinta227,202157,28640,0302667113,5442978136,232167,77526.084.62
Suzhou681,796550,63569,91114,718225,0608308518,352504,63946.861.6
Table 3. First stage average agricultural water use efficiency from 2004 to 2012.
LocationTEPTEScale
Ganzhou0.65 0.67 0.98
Gaotai0.63 0.82 0.78
Shandan0.75 0.76 0.98
Minle0.92 0.92 1.00
Linze0.81 0.88 0.91
Sunan0.19 0.95 0.20
Jinta0.29 0.55 0.51
Suzhou0.38 0.42 0.87
Note: TE means technical efficiency; PTE means pure technical efficiency.
Table 4. Second stage: SFA analysis for 2012 data from the Heihe agricultural area.
VariablesEquation (1)Equation (2)Equation (3)Equation (4)
Constant24,490.60 *
(49,900.15)
0.30 *
(2.63)
2304.71 *
(14,517.76)
−1245.39 *
(−3501.62)
local development
(Per capita GDP)
32.19 *
(6.2)
0.00 ***
(0.00)
8.01 ***
(1.80)
1.15 **
(0.44)
Water resources endowment
(Per capita water resources)
−93.49 *
(110.92)
0.02 **
(0.01)
57.07 *
(32.27)
30.41 ***
(7.78)
Industrial structure
(The proportion of the primary industry)
−45,167.11 *
(78,599.98)
−2.52 *
(4.14)
−11,931.18 *
(22,867.58)
−4726.67 *
(5515.56)
σ 2 1011.0672.632216.43128.94
γ 0.990.770.680.64
Figures in parentheses are standard deviations of corresponding coefficients; ***, ** and * represent 1%, 5% and 10% significance levels, respectively.

