1. Introduction
The growing urbanization and lack of green spaces in cities have resulted in an increase in environmental pollution that produces negative effects, such as the formation of heat islands, loss of biodiversity, atmospheric pollution, and flooding [
1,
2,
3]. The quantity and severity of these effects depend on several factors, including geographical and climatic factors [
4,
5]. Climate change is one of the great challenges that humanity is currently facing [
6], and the government of Chile is committed to taking actions to reduce the emission of greenhouse gases by at least 20% by 2020 [
7]. Specifically, the Ministry of Environment, through the Department of Climate Change, has the mission of implementing public policies that ease sustainable development and create a low carbon economy for the country. In particular, the National Action Plan on Climate Change 2017–2022 (PANCC-II) [
7] is geared towards the effective implementation of measures identified as priorities that will increase the resilience of cities and promote the implementation of sustainable technologies.
The installation of green roofs falls within the possible technological solutions that can contribute to the sustainable development of cities [
8,
9]. This type of roof has a series of benefits from a social, economic, environmental and sustainable point of view, which is why they are considered an effective element for mitigating climate change [
10]. In addition, green roofs cause a decrease in the flow of surface runoff that circulates through cities during intense rainfall. This aspect is of particular interest for the objectives of this work.
The fast horizontal growth of urban surfaces in Latin American cities over the last two decades [
11], along with the winter rainfall that is characterized by concentrated rainfall events lasting a few days, is responsible for important environmental impacts, including floods in certain sectors and the collapse of rainwater evacuation networks [
12,
13]. In Chile, a large part of the urban area is waterproof, with only a small percentage of green areas where the rainwater can infiltrate. Hence, when there is intense precipitation during the winter in the central zone of the country, the rainwater evacuation infrastructure becomes saturated as water flows exceed the hydraulic capacity of the existing pipelines.
The objective of this work is the generation of a model based on green roofs that reduce urban runoff and therefore mitigate floods within certain conflictive sectors of the cities. Based on these roofs, this work establishes an operational framework for mitigation work action in the streets of Curicó, a city in the central region of Chile, and identifies a series of conflicting sectors when rain occurs. Based on the data collected on site and with the collaboration of public institutions, a hydrological model was created with rain estimates based on historical data, and the installation of different commercial green roofs was simulated for buildings close to the identified flood points. The simulations allow the identification of areas that should be permeabilized with green roofs to avoid flooding and reveal further useful information regarding subcatchment runoff, node data (inflow, flooding, water depth, etc.), groundwater summary and LIDs performance. The results show that the use of green roofs in these conflictive sectors produces a considerable reduction in the surface runoff, preventing saturation of these sectors and, therefore, floods during short but very intense rainfall events.
To this end, the rest of the paper is organized as follows. Background Section reviews the major contributions published on sustainable urban drainage systems (SUDS). Matherials and Methods Sectiondefines the areas of intervention (case studies) and formulates the model. Computer simulations with different rainfall intensities and different green roof areal coverages and layer configurations are analysed and later reported in Results Section. Discussion Section provides some insights and further analysis of the implications of the results. Finally, Conclusions Section summarizes the paper and makes suggestions for future work.
2. Background
Sustainable urban drainage systems (SUDS) are incorporated into the new strategies to boost the performance and the sustainable urban development of cities. Within these systems, roofs or green roofs involve the installation of a shallow plant substrate that allows the cultivation of plants. At present, the installation of green roofs entails many benefits, from both environmental and socio-economic perspectives. Consequently, many studies in the literature show that the installation of green roofs has a positive effect in terms of alleviating the negative effects associated with climate change.
Numerous studies have shown that the lack of green spaces increases the heat island effect in urban areas [
14,
15], while the installation of green roofs mitigates this negative effect by decreasing the temperature [
16,
17]. In this regard, green roofs insulate buildings from both heat and cold, thereby reducing the consumption of energy to cool or heat homes [
18]. Similarly, in cities with high levels of air pollution and high CO
2 emissions [
19], green roofs are a good way to alleviate these issues, as they retain toxic elements and plants filter dust and dirt. As an example, there is some research [
20,
21] that has measured short-term (annual) pollution reduction associated with the use of green roofs in cities such as Chicago and Toronto.
Finally, from a hydraulic perspective, green roofs mitigate the effects of urbanization in terms of soil infiltration conditions. Thus, the implementation of these systems improves rainwater retention conditions, delays rainwater arrival in storm drains, and allows evapotranspiration of stored water [
22,
23]; all these mitigation actions reduce surface runoff in cities and, therefore, reduce the likelihood of flooding [
24].
In addition, the general implementation of SUDS, particularly green roofs, can diminish the long-term unnecessary consumption of potable water in buildings through the use and reuse of rainwater retained in a green roof. This retained water can be used for WCs, the irrigation of green areas, washing floors and facades, etc. [
25,
26].
Hence, green roofs are used extensively in Europe and North America, and some countries have even introduced manuals [
27,
28] and laws that encourage the use of this technology. In Europe, cities such as Munich (Germany), Copenhagen (Denmark) and Paris (France) have laws that require the installation of green roofs for certain types of buildings [
29], while, in North America, Toronto (Canada) was the first city in the world to enforce a bylaw that all buildings over 2000 m
2 have between 20% and 60% green roofs. Similarly, US cities such as Portland and Minneapolis have already incorporated green roofs into their urban planning laws [
30].
In other continents, such as Australia [
31] and South America, green roofs are not widely utilized. However, countries such as Argentina and Chile are introducing policies and strong financial incentives to promote the adoption of more sustainable practices and technologies. In Chile, according to data from the Sustainable Urban Development Center (CEDEUS) [
32], it is estimated that incentive policies for sustainability have recently supported the installation of over sixty thousand square metres of green roofs. However, there are still no laws in Chile advising or offering incentives for their use.
Green roofs can be classified as extensive or intensive, depending on the type of vegetation and the depth of support needed [
33]. Extensive roofs have shallow soils (usually 7–10 cm) and are light, with vegetation that needs little to no maintenance (sedum, moss, turf, etc.). In contrast, intensive roofs have a deeper soil layer (greater than 14 cm) and allow a greater variety of plants to be cultivated. The plant types will determine the soil depth needed, together with the degree of irrigation intensity and the level of maintenance. Generally, and, in descending order, the layers that make up a green roof [
34,
35] are as follows:
Vegetation. This is the top part of the roof and consists of resistant and aesthetically pleasing vegetation. It must also provide physical constructive benefits (thermal insulation, acoustic protection, etc.) and ecological benefits (rain retention, air cleaning, etc.). Therefore, ideally, this vegetation is as dense as possible and is as uniform in height as possible.
Substrate. This is the layer that supports the vegetation and contains the roots and nutrient materials. In this regard, it is important that this layer has sufficient air volume to allow root penetration, as well as being sufficiently inert to prevent the excessive growth of vegetation or weed formation.
Filter. This layer prevents parts of the substrate from forming sludge as a result of rain infiltration to lower layers.
Drainage layer. The function of this layer is to avoid excessive water stagnation in the substrate that could be harmful to the vegetation.
Anti-root sheets. These are positioned such that they prevent damage to the roof waterproofing layers or the structure of the building.
Waterproofing sheet. This is independent of the anti-root sheet and is placed beneath it. Its main function is to seal the roof by diverting water to the drainage ducts.
Numerous researchers have studied the influence that each component can have on the efficiency of green roofs to retain water [
36]. For example, numerous studies have shown that the depth of the substrate influences the capacity for rainwater retention [
33,
37]. In relation to the geometric characteristics of a roof, some researchers have tried to establish relationships between the slope of the roof and the amount of runoff retained [
38,
39], while others have analysed the reduction in runoff according to the type of vegetation installed on the green roof [
40,
41,
42,
43]. This paper will contribute to those studies by proving empirically how much runoff water could be reduced by installing different types of green roofs around frequently flooded areas.
3. Materials and Methods
3.1. Problem Formulation and Data
As stated above, the steady growth of the Chilean population and urban areas has caused an increase in the surface runoff. In addition, it is important to highlight that Curicó, similar to most Chilean cities, not only receives rainwater from the city itself but also from the Andean Precordillera. This significantly increases the risk of floods [
44], with the current water management plans being obsolete and ineffective.
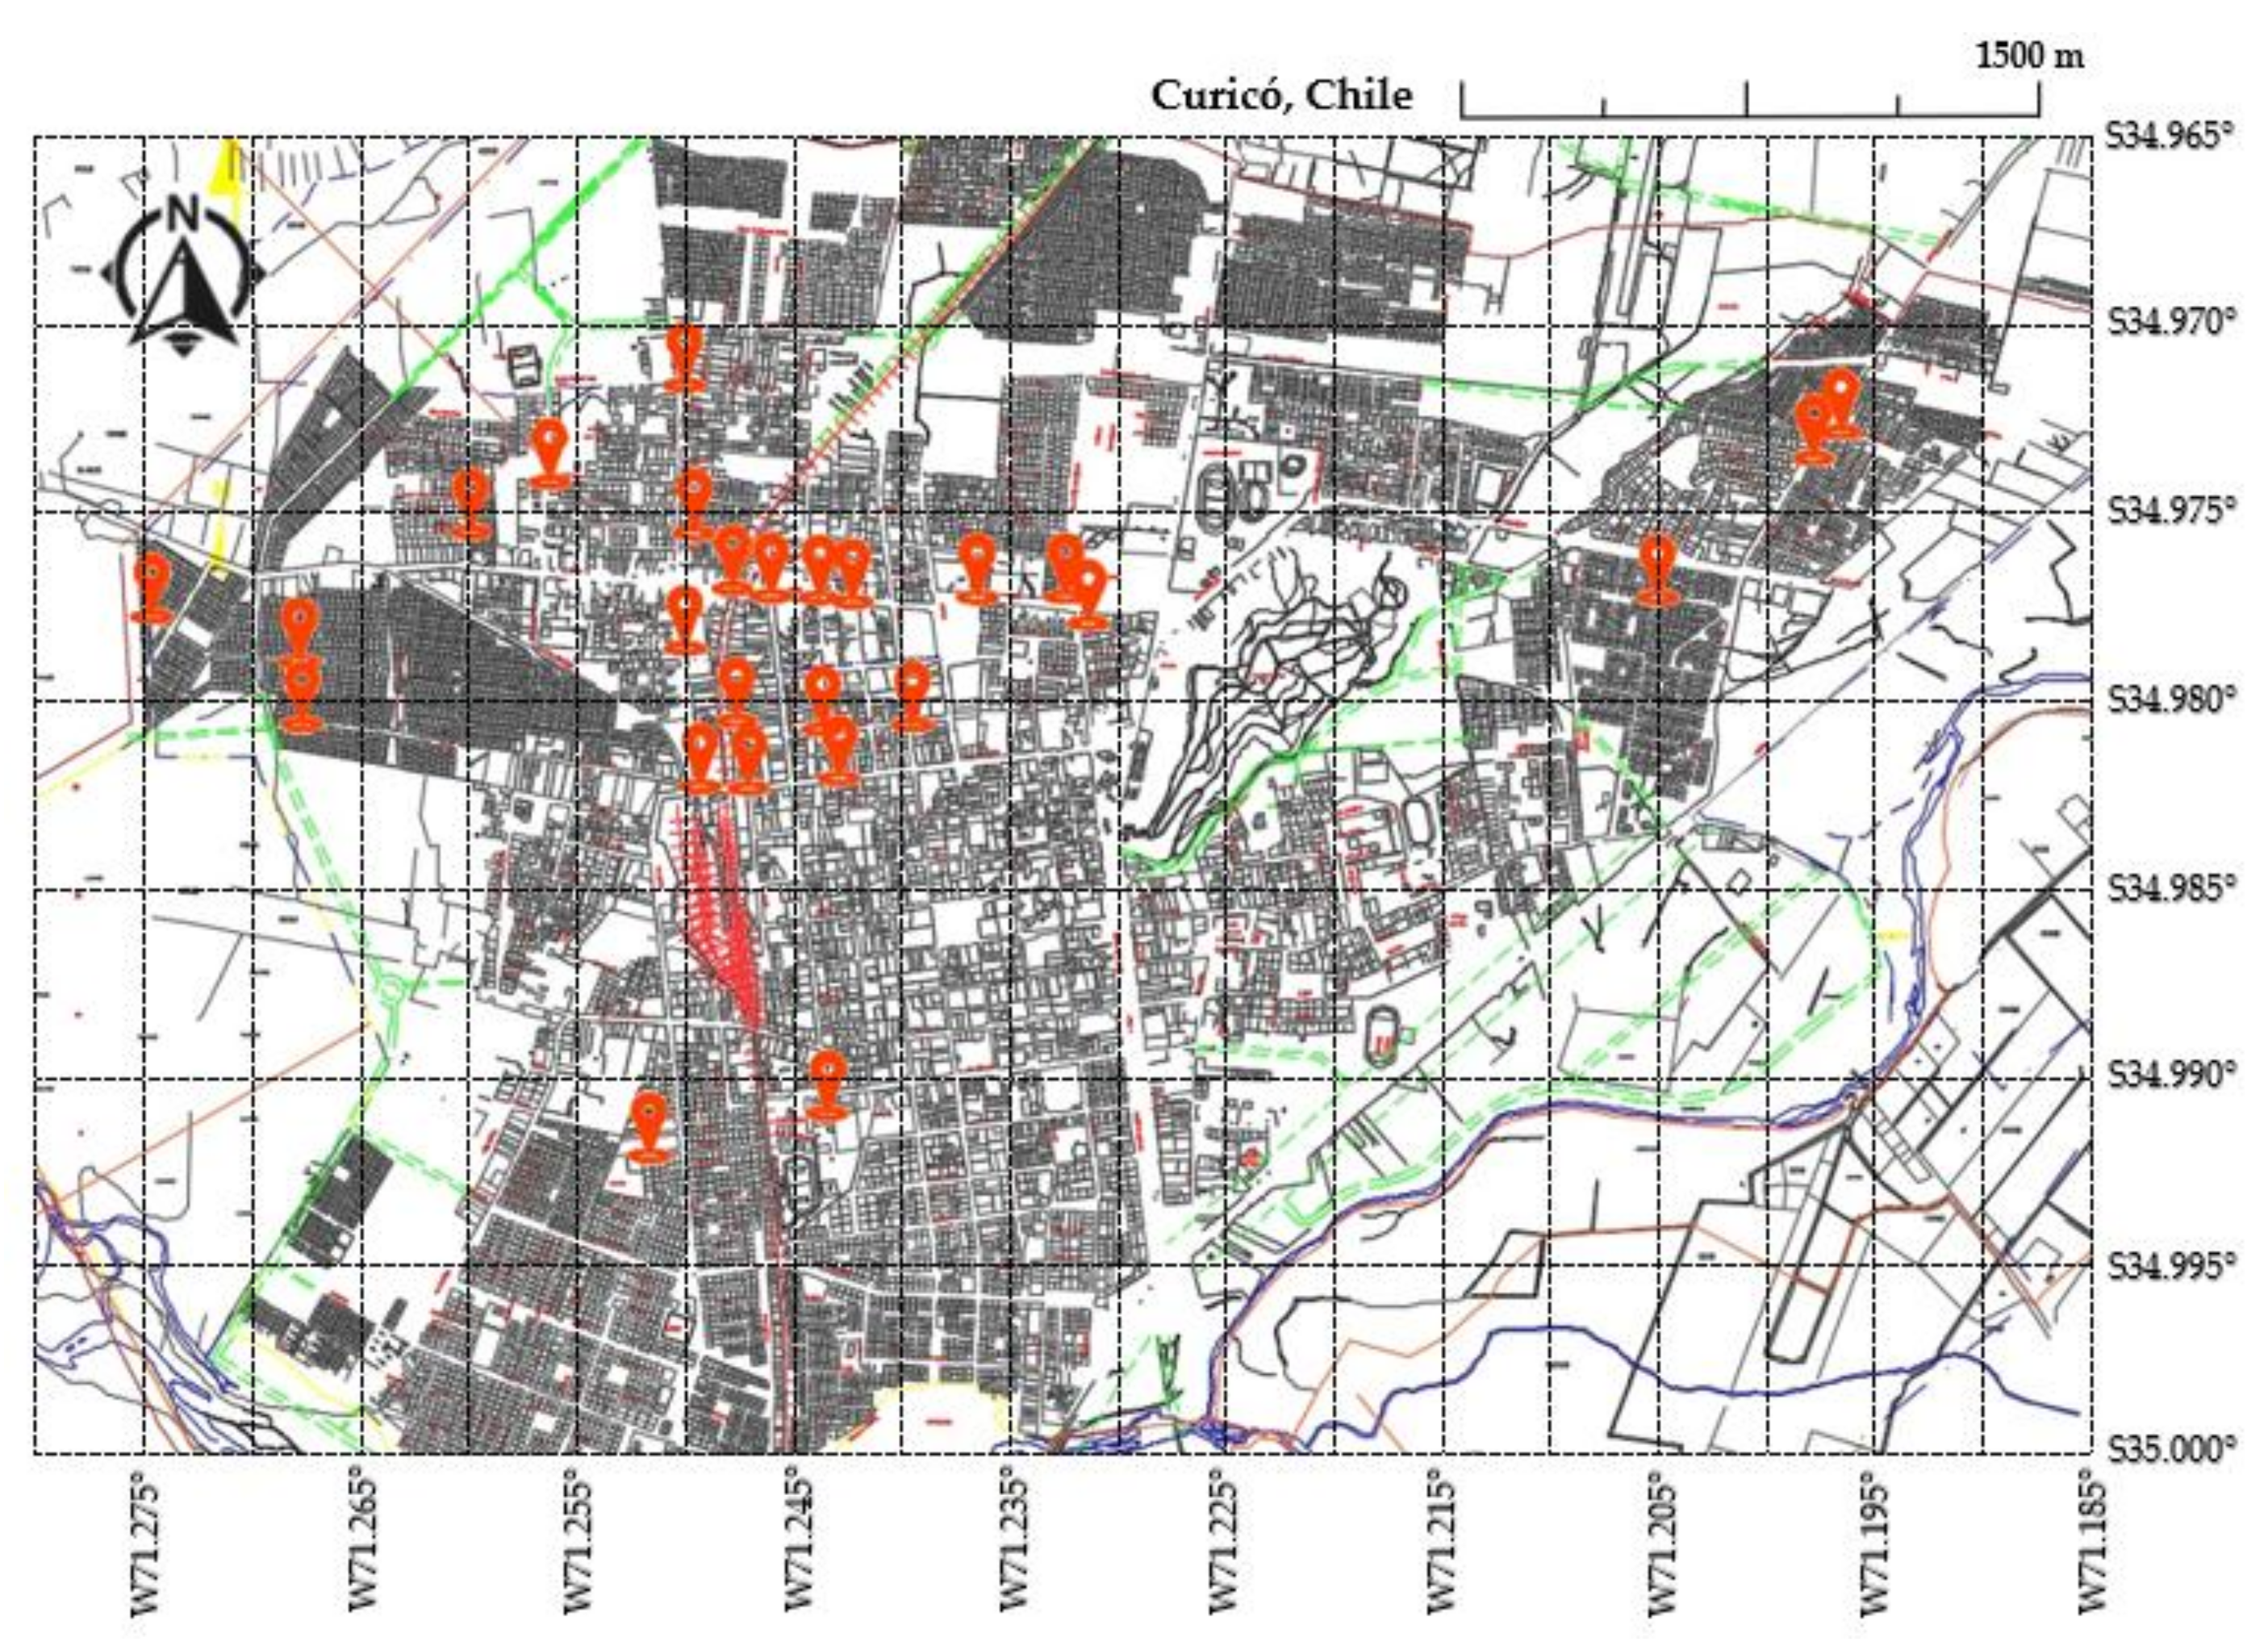
In 2017, based on information provided by the Directorate of Civil Protection (DCP) of Chile, up to 10 critical sectors were identified in Curicó regarding floods over short periods of time due to precipitation. It should be noted that the data provided by the DCP does not identify specific points, only sectors; consequently, there are no records that concretely demonstrate the places that are affected by floods. Therefore, for the development of this study, field inspections were performed to identify exactly which points in the city suffered from floods. These inspections were performed during the months of highest rainfall according to the historical records (May, June, July and August) and resulted in the identification of up to 27 critical points within the urban centre.
Figure 1 shows in detail the identified points at which some type of action may be required.
The usual solution for this type of incident is to replace the existing pipes with pipes of a larger diameter. Hence, the authorities have recently renovated and enlarged some of the main collection pipes in the city. As a result, there have been improvements in some parts of the identified sectors, but, elsewhere, flooding continues during periods of rain.
Given the impossibility of undertaking new construction work and/or remodelling the canals in a short period of time, this study proposes the installation of green roofs in nearby areas as a potential solution to, or alleviation of, the problem. From assessing the effectiveness of different green roof installation configurations, we will use hydrological modelling with SWMM. The proposed methodology aims to answer the following two questions:
What would happen if certain zones/neighbourhoods with critical flood points installed sustainable urban drainage systems (SUDS), namely, green roofs?
What is the efficiency of these systems? In other words, do they have sufficient capacity to prevent flooding at the critical points in the city of Curicó?
3.2. Programming Environment
Hydrological models can simulate rain-runoff transformation processes in basins that are represented as systems of interconnected hydrological and hydraulic components. This study uses SWMM, a simulation dynamic model developed by the Water Supply and Water Resources Division of the United States Environment Protection Agency (EPA). Particularly, the programme SWMM (which stands for Storm Water Management Model) is capable of solving hydraulic systems under three different conditions: steady flow, kinematic wave and dynamic wave [
45]. The robustness and reliability of the SWMM hydraulic calculation engine have been successfully tested since the early 1970s in thousands of international academic and professional projects.
EPA-SWMM can simulate both stormwater runoff and sanitary sewers, as well as discrete and continuous rainfall events. SWMM is free and open source. Therefore, it is possible to improve or customize it by creating and incorporating additional features [
46]. Finally, SWMM is periodically updated by the EPA, which is a renowned agency that provides support for drainage network design.
The latest version of this software (v. 5.1) allows the simulation of seven sustainable drainage techniques using low impact development (LID) controls, including green roofs. In the case of green roofs, the software considers these to be a variant of bioretention cells with a draining layer under the soil. This allows the evacuation of excess percolated water after a rain episode. Due to this feature, some authors have used SWMM to predict the potential influence of green roofs in urban areas. [
30,
47,
48].
3.3. Criteria for the Selection of Critical Points for the Model
From the information provided by the DCP and the on-site inspections, 27 critical points were identified as frequently suffering from floods in the event of rain. However, locations with reduced housing densification were discarded. The selection of flood points on which to perform the computational simulation were classified based on the following criteria:
Visual inspection. After a rain event, the areas where a larger amount of water is visible are those that require more urgent intervention.
Availability of space on roofs in the surrounding area. The greater the available area to implement green roofs is, the greater the probability of decreasing urban runoff to non-flood levels, since the amount of water retained could be potentially larger.
Slope on the existing roofs. Only buildings with a slope of up to 30% are considered in line with the green roof commercial models that will be introduced in the computational model.
Capacity and resistance of the chosen dwellings that would support the structural weight of a green roof. The installation of green roofs increases the inertial mass of a house; therefore, the selected homes must have foundations, walls, slabs, beams and chains of reinforced concrete and reinforced masonry. This ensures that the additional weight of a green roof does not exceed the resistance of the house after the addition of the new gravitational loads. However, it must be taken into account that the value of the load could change depending on variables such as the size of the roof, the type of vegetation, the depth of the substrate, and the water retention capacity of the vegetation and the organic soil.
After the first analysis and based on the previous classification criteria, six points were selected. This formed a fair representation of the whole city centre, as it comprises at least one point from all sectors affected by frequent floods, even in light rain events.
3.4. Physical Description of the Case Studies and Elaboration of the Computational Model
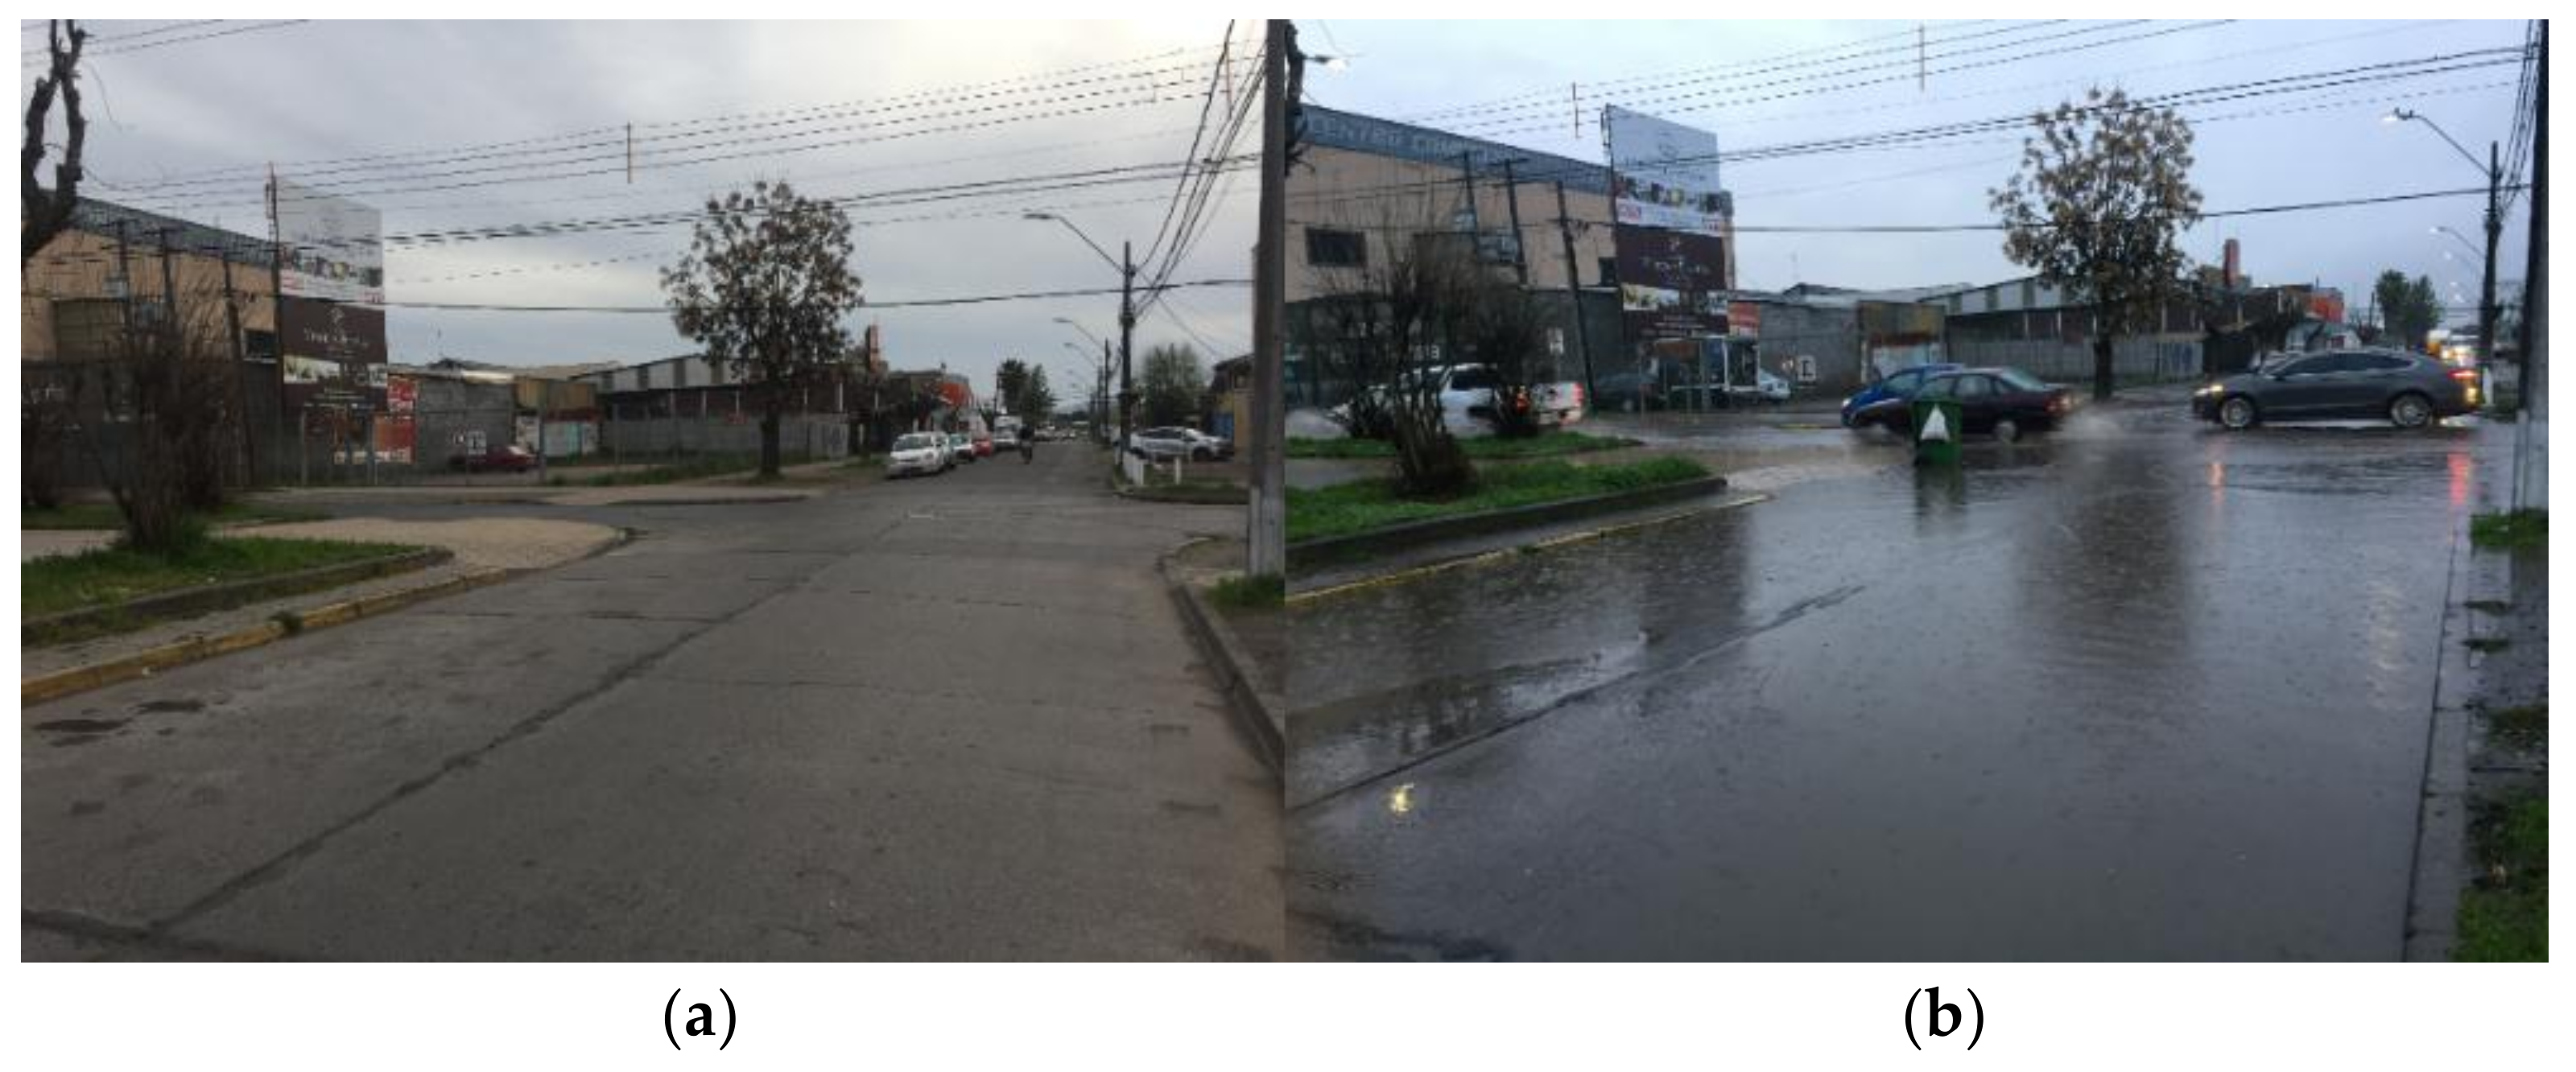
As detailed in the previous section, from all the identified critical points, six were chosen and computational models were built. The first case study is located between the streets Sargento Aldea and Yungay. This point is connected to the Aldea-Vidal collector of the Curicó unitary network. This intersection usually has problems related to the effective evacuation of rainwater.
Figure 2 shows the location of Case Study 1 on the left side on a “non-rainy day”. The right side shows a “rainy day”. This situation is repeated in other city sectors.
For the hydrological model setup, it is essential to collect information for the different parameters and variables. Some of the necessary data were acquired from the Rainy Water Master Plan of the city of Curicó and the Guide to Design and Specifications of Urban Infrastructure Elements, developed by the Department of Urban Works of the Ministry of Housing and Urban Development of Chile [
49].
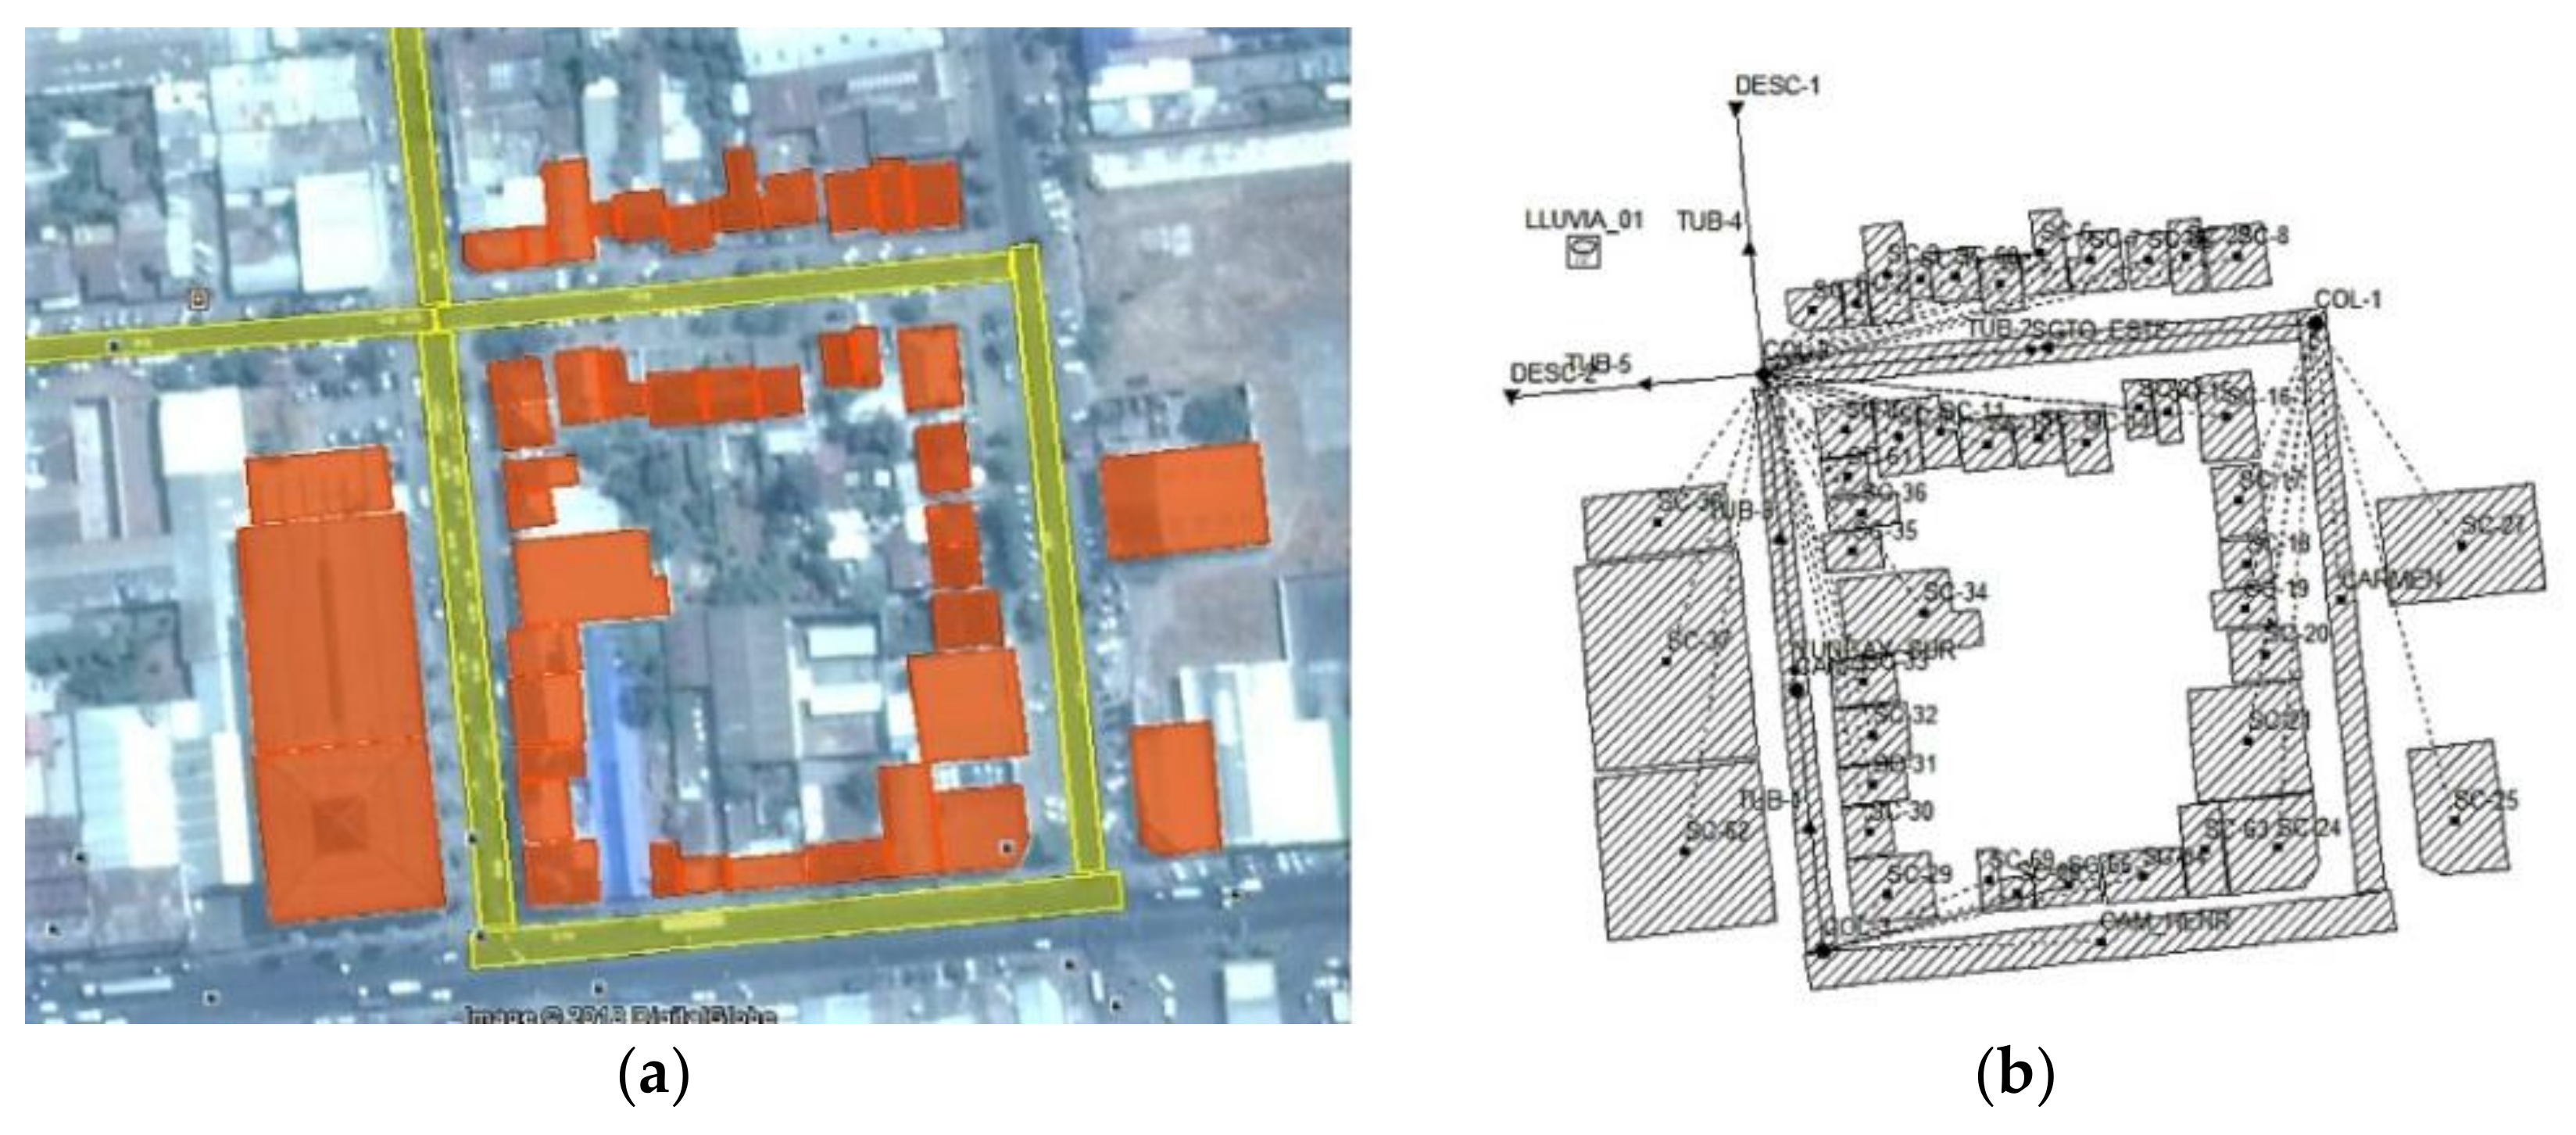
First, using free software applications such as Google Earth, all surfaces on which the installation of green roofs was feasible were identified, delimited and calculated. The outlines of each roof and the surrounding paved (waterproof) streets that contribute to the floods were also defined (
Figure 3a). In addition, it was necessary to determine the location of the connection and discharge nodes (collectors and inspection chambers), as well as parameters such as the bottom elevation (m), maximum depth (m), initial level (m) and flood area (m
2) for each node to be introduced into the model. Analogously, regarding the conductions (pipes), it was necessary to define the form of the conduction based on the diameter (mm), length (m), material, rugosity, slope (‰), height of entry (m), height of output (m), entrance level (m), exit level (m), initial flow (L/s) and maximum flow (L/s). Finally, for the pouring points (discharges), it was necessary to define the bottom level and the type of discharge.
The roofs on which the green roofs could be installed were introduced into the model as subbasins, where the collector to which they discharged needed to be defined, together with their area (Ha), width of the runoff water transport (m), slope (%), impermeable area (%), and the Manning coefficients (n) for the permeable and impermeable strata, which were taken from [
50].
Once all the information was collected, the hydrological model was built within the SWMM environment.
Figure 3b shows the hydrological design model created for the first case study, where the discharge nodes (collectors), existing ducts between nodes, pour points and rain gauges are defined. To create a rain event, the synthetic storm designed for the hydrological simulation is detailed in
Section 3.4.
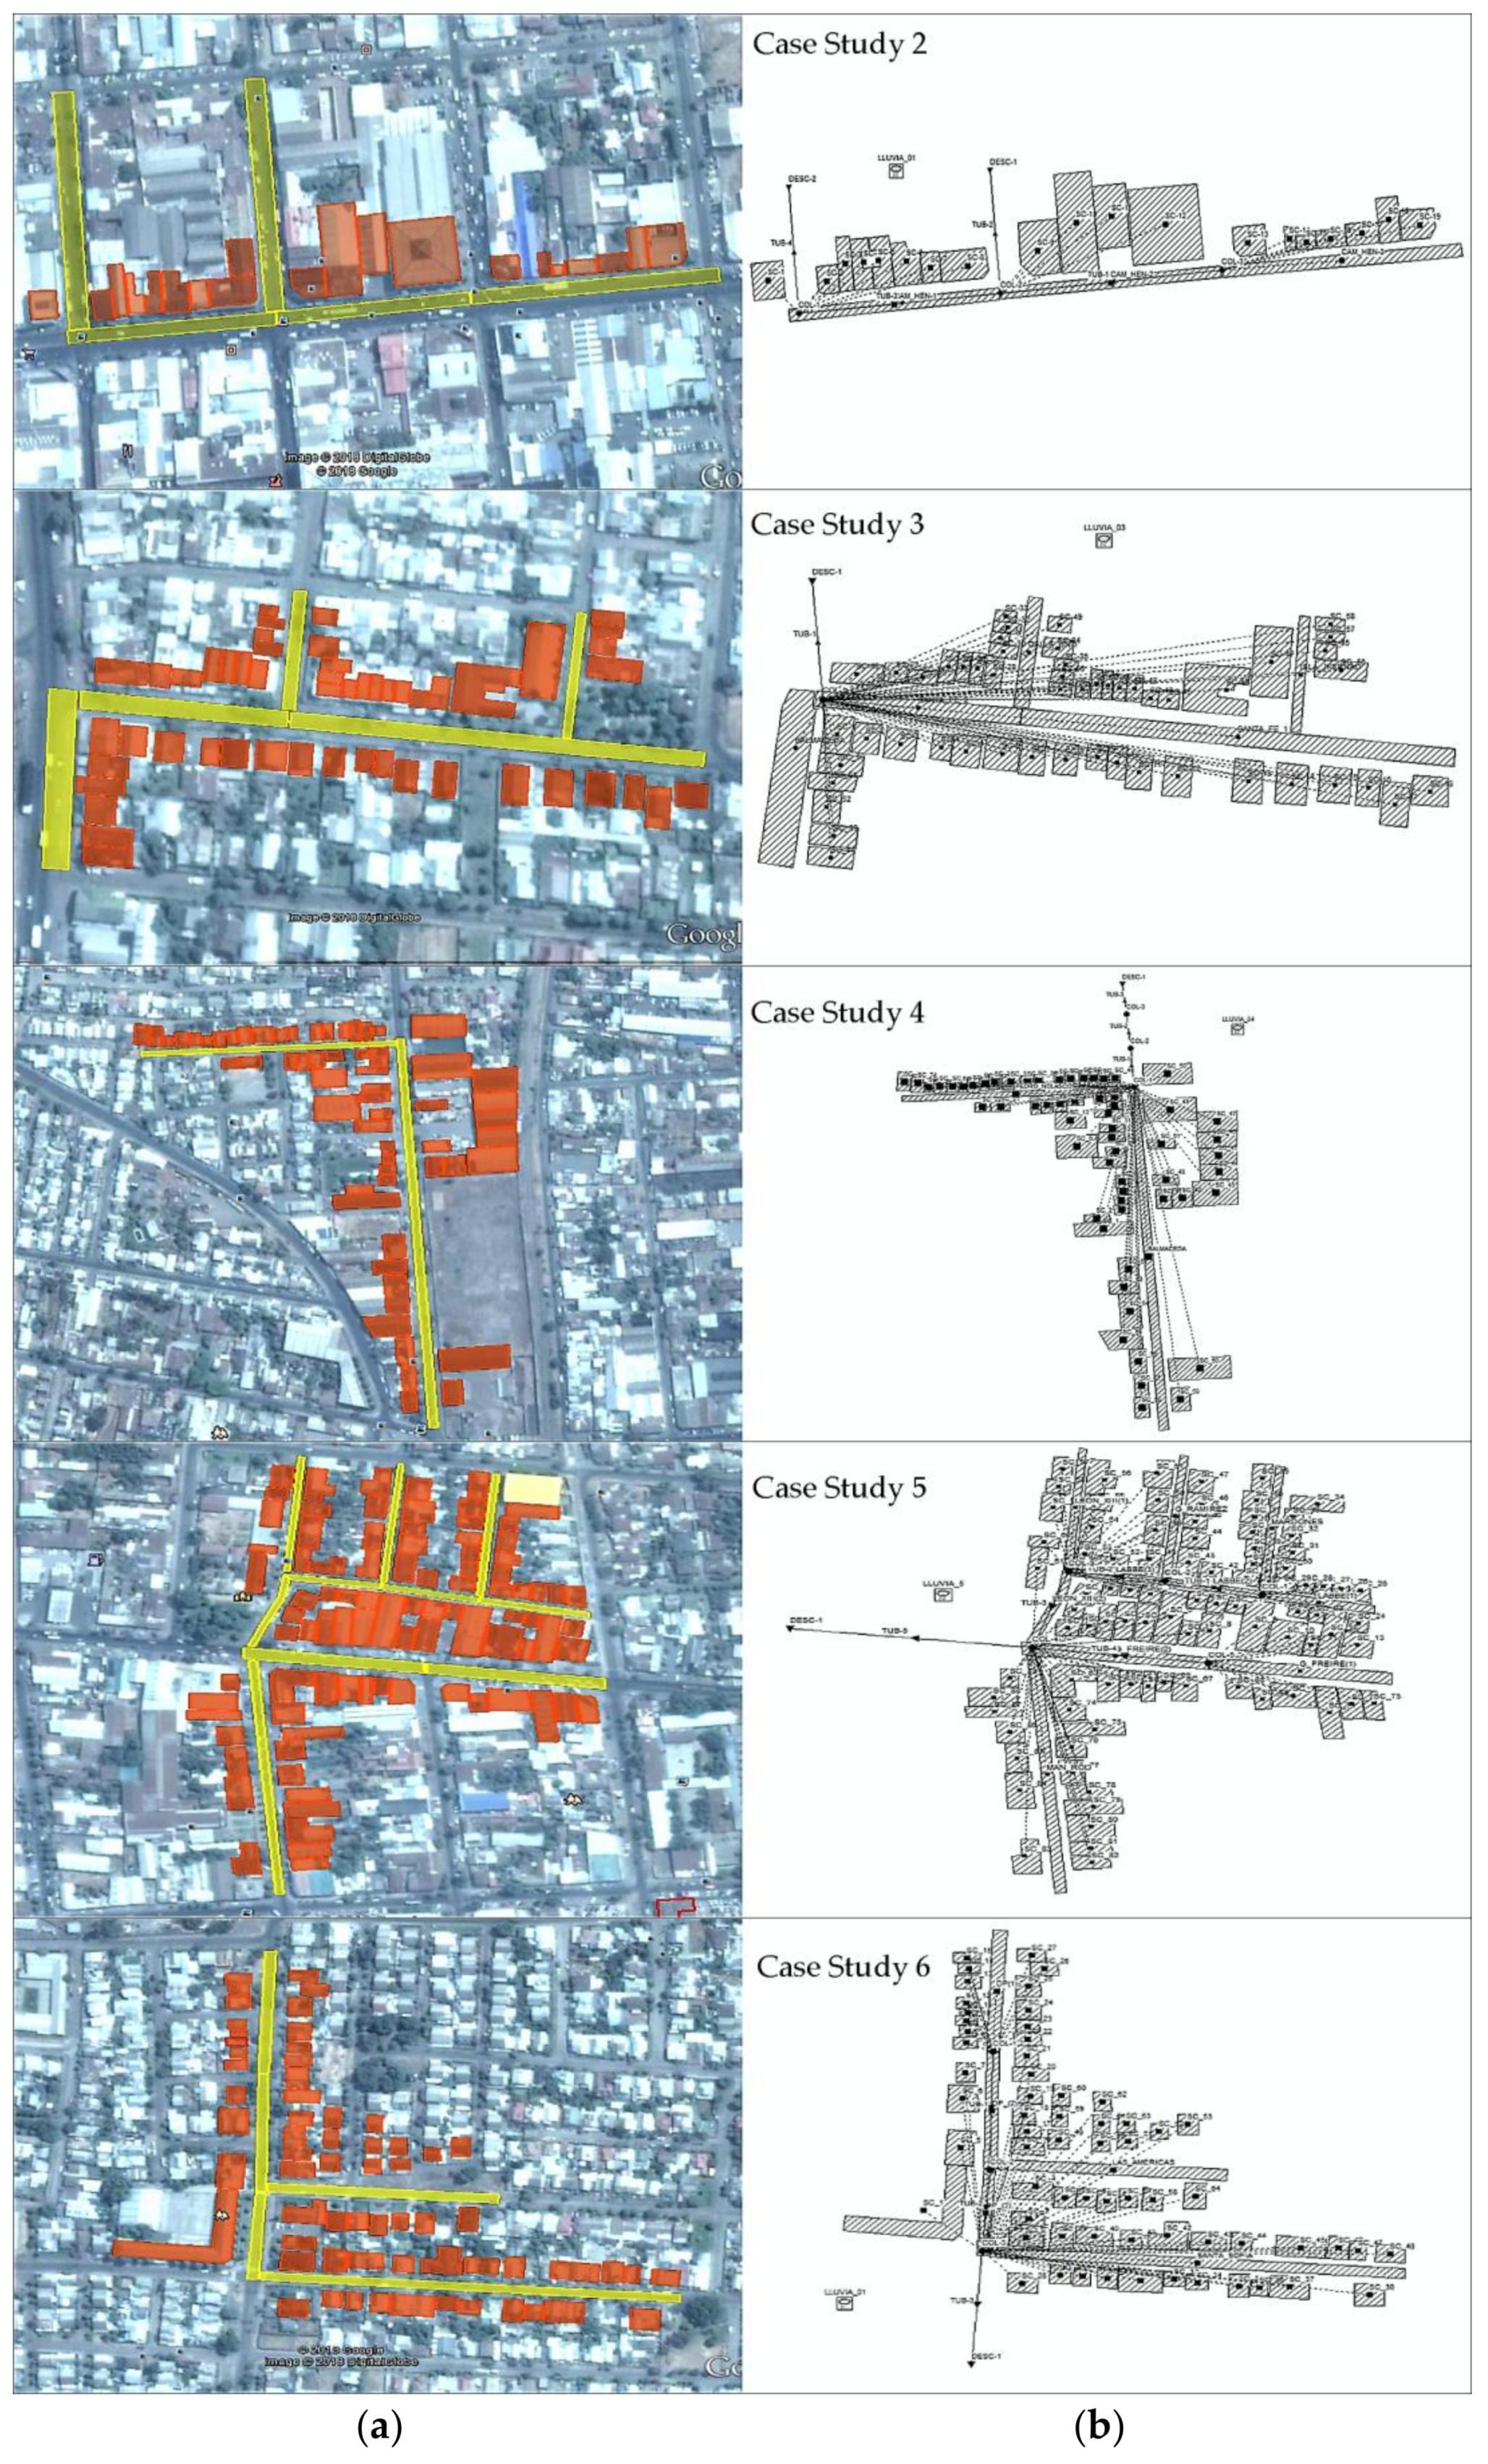
Similarly,
Figure 4 presents the remaining case studies and their corresponding hydrological models that were also built in SWMM.
3.5. Rainfall Records and Storm Design
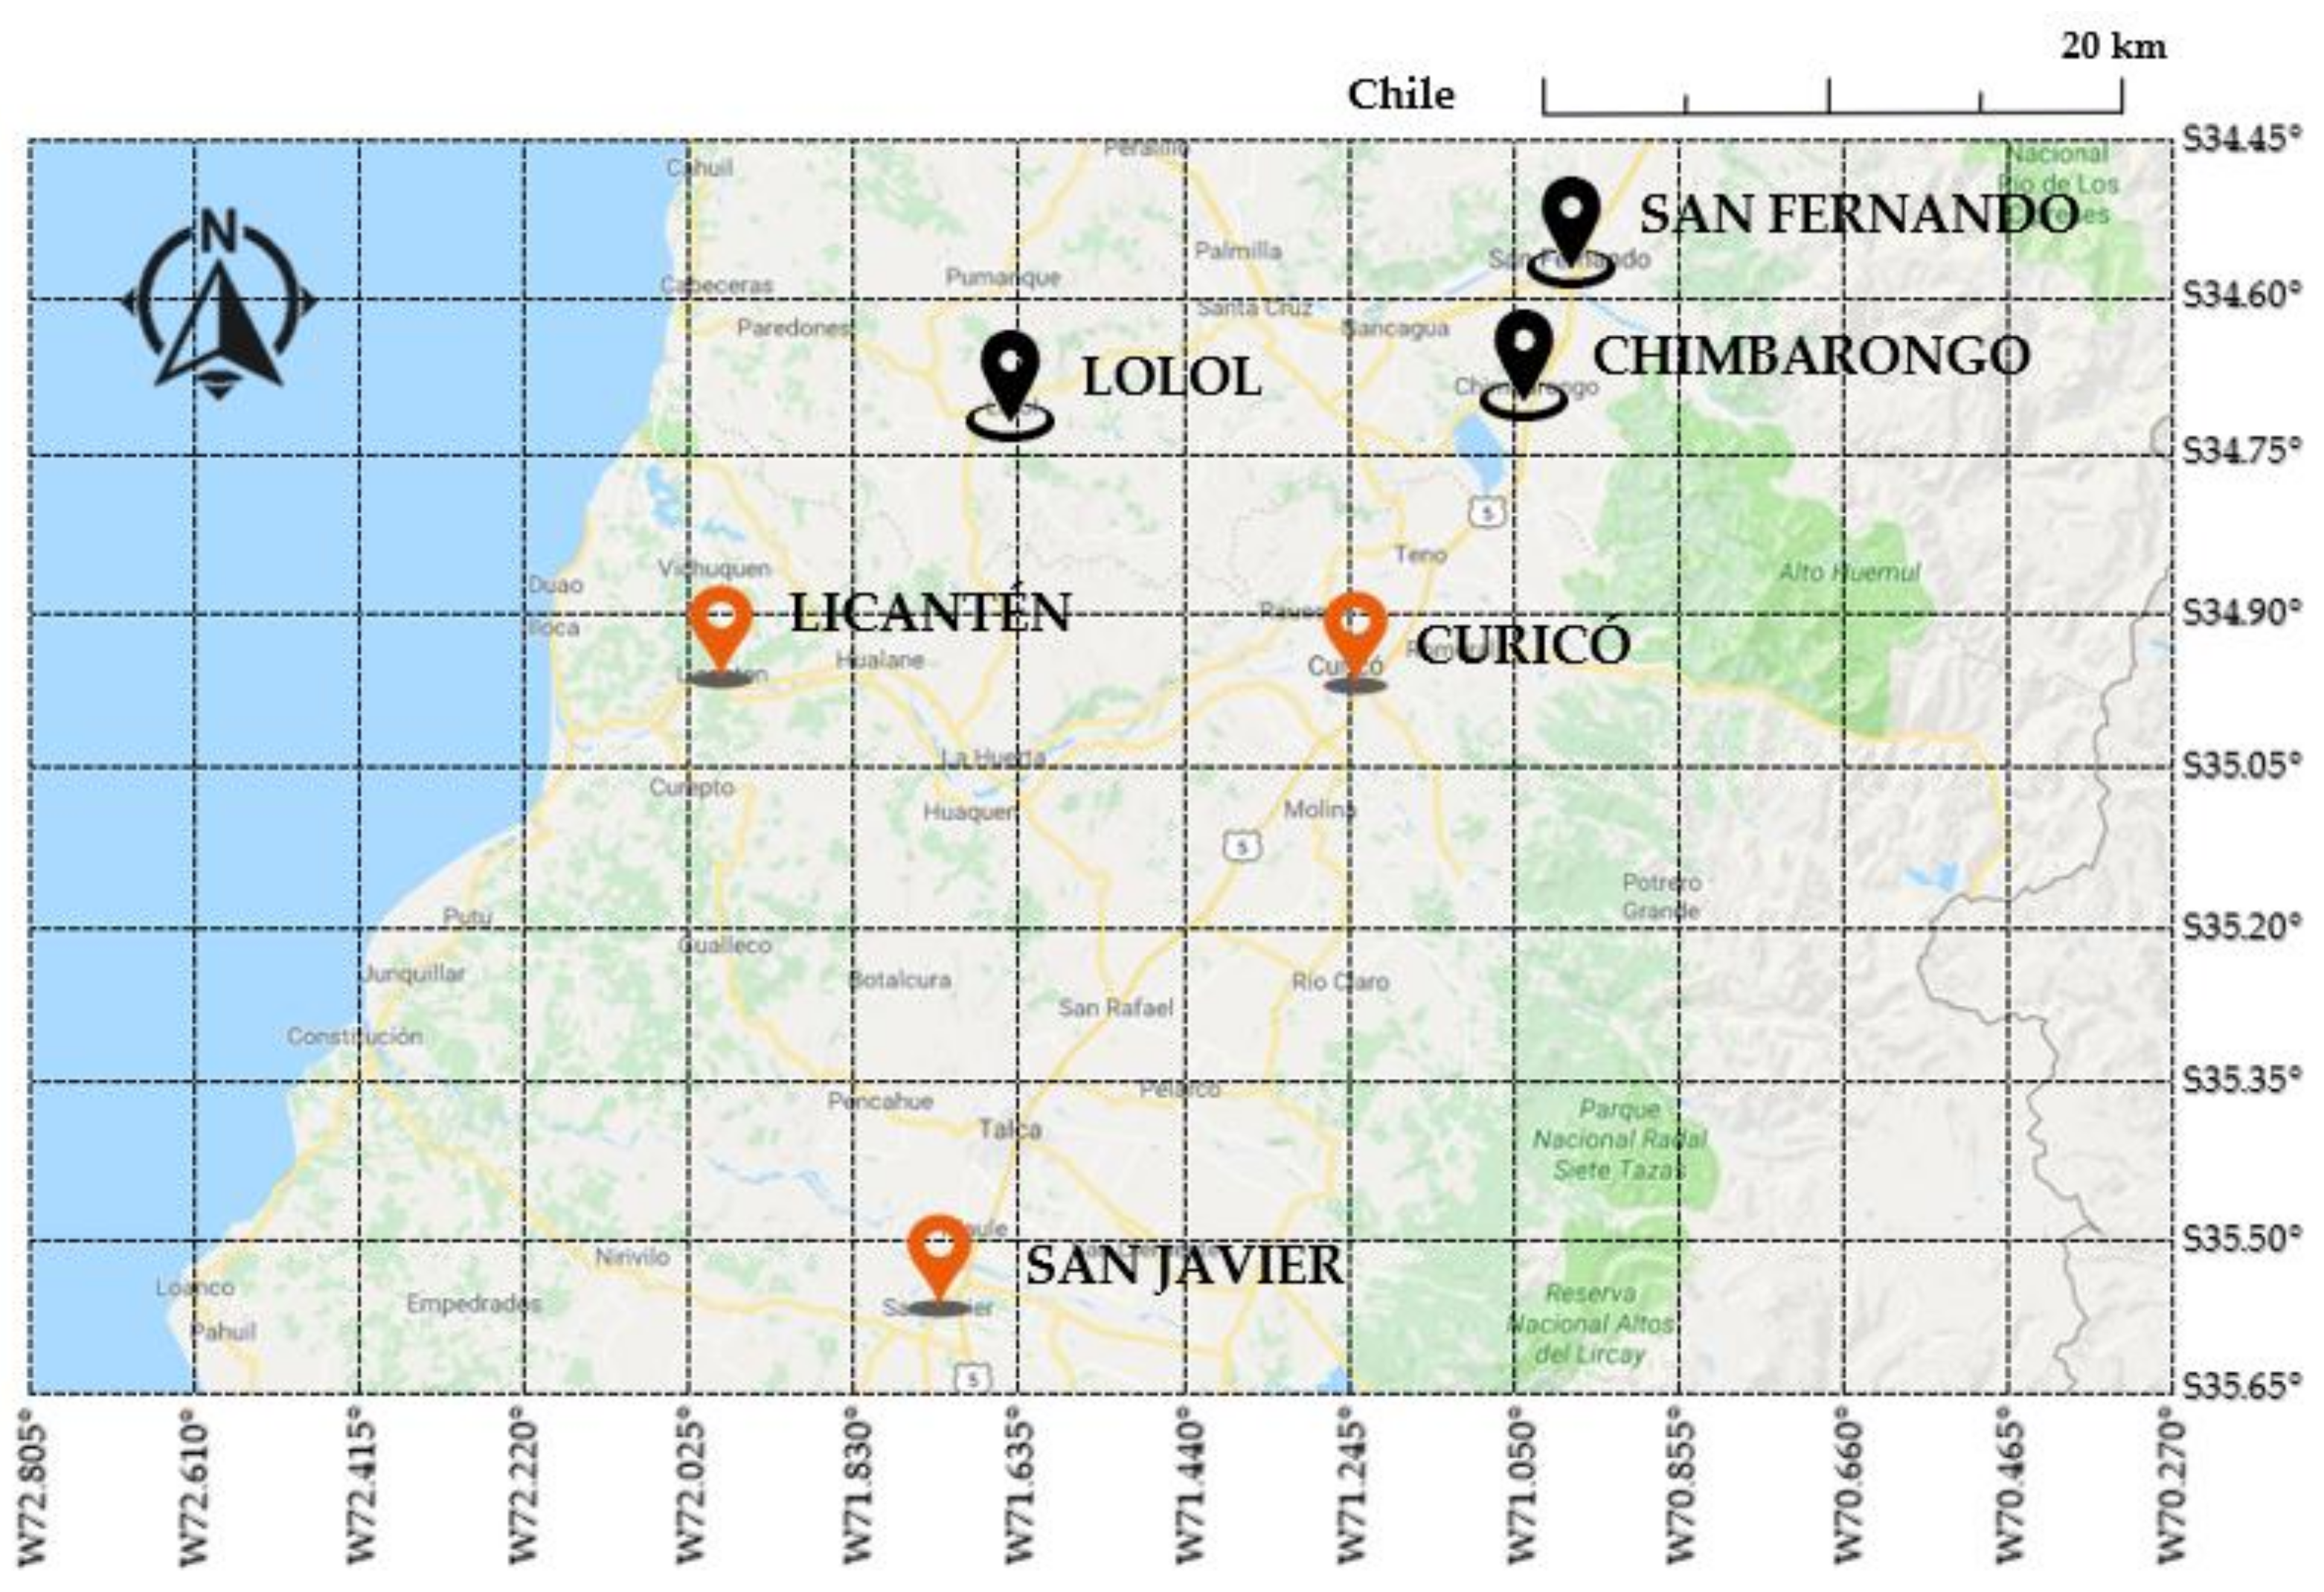
Initially, historical precipitation information from the Climatological Yearbooks of the Chilean Meteorological Directorate was considered. These include the historical records of six meteorological stations located in the VI region (San Fernando, Chimbarongo and Lolol) and in the VII region (Curicó, Licantén and San Javier) of Chile.
Figure 5 shows the location of the stations considered.
For this work, Thiessen polygons are the chosen method for estimating the average rainfall in the study area. This method assigns a weight to each rainfall station that is proportional to its area of influence. Once this weight was established, the calculation of the maximum weighted precipitation (mm) in 24 h for each month and year during the period considered was performed. Records up to the last twelve years were considered since several stations did not have registers prior to 2005. It is worth noting that it is not advisable to calculate return periods longer than three times the total time of the records available. This is due to the reduced accuracy that this calculation process entails. Consequently, the return period considered in this study was T = 30 years.
In addition, consideration was given to the location of the case studies (all of which were in the city of Curicó), as the data contained in the Curicó station could be used directly. However, the authors applied the methodology to the whole region, and other rainfall records from surrounding stations were also weighted. As a result,
Table 1 shows the maximum daily rainfall (mm) that could be expected in the study area.
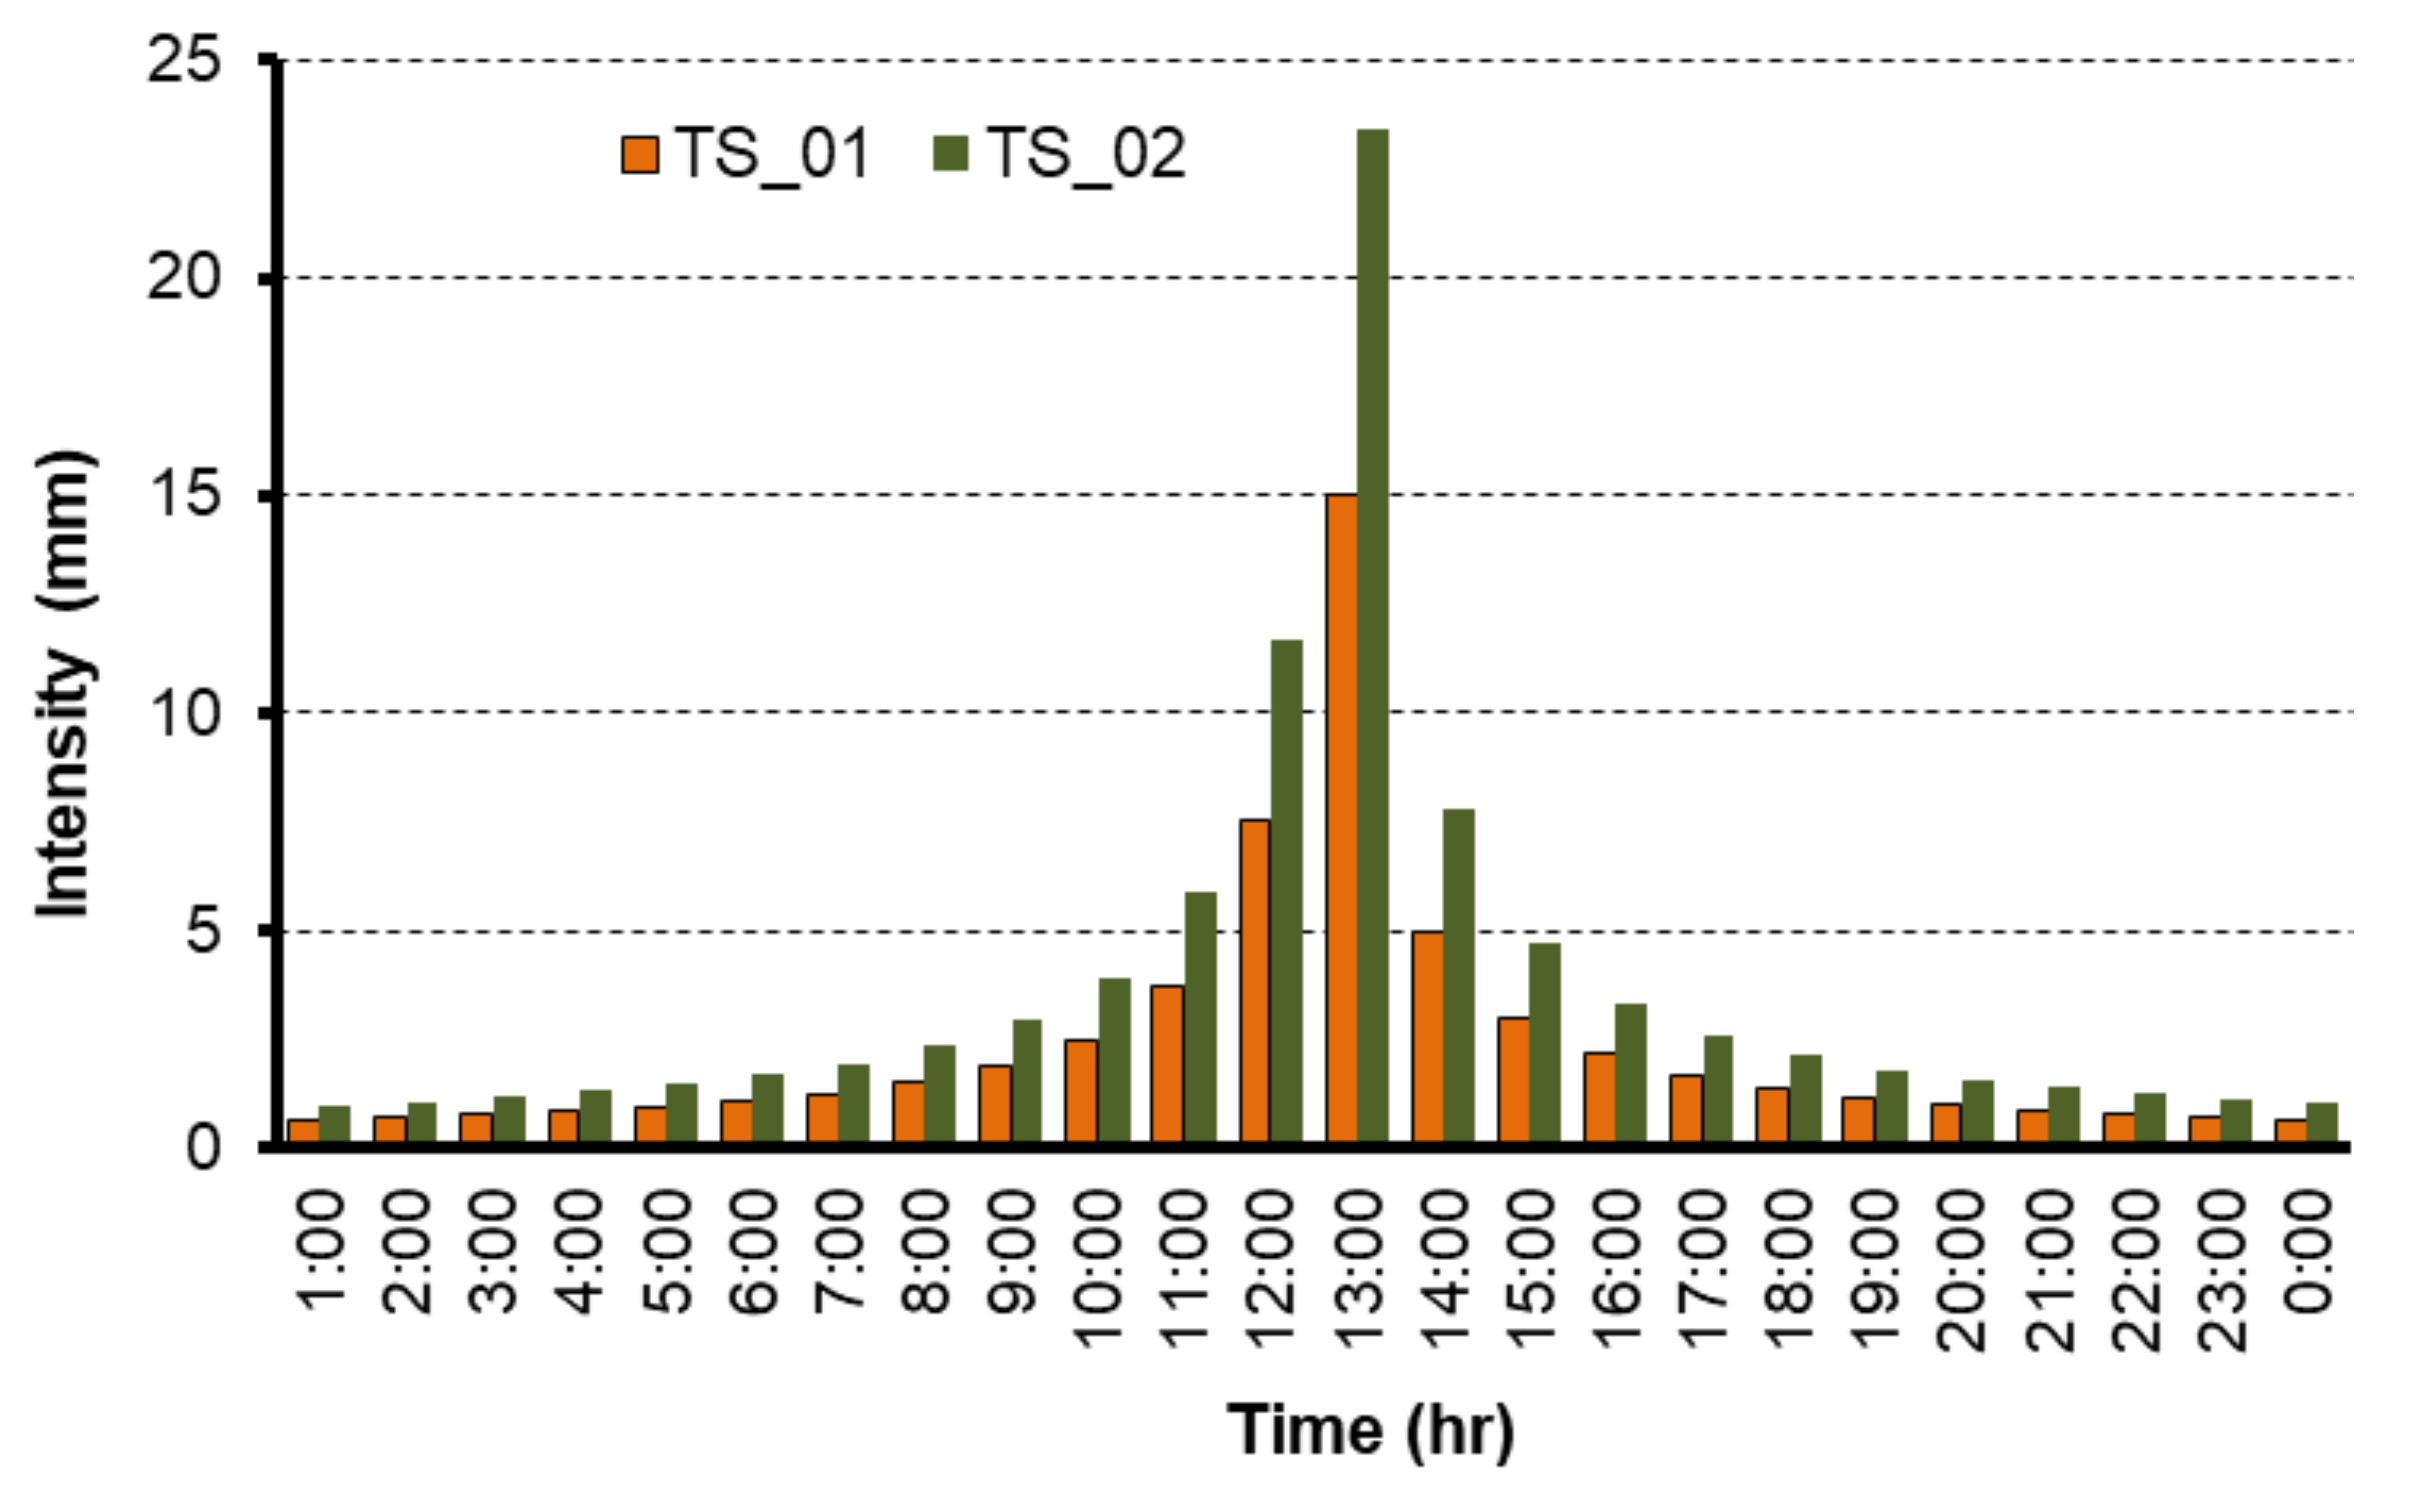
However, this information may not be enough to build a reliable model for the behaviour of green roofs during a rainfall event. The computational hydrological model requires a more detailed intensity description of a rain event. Normally, the concept of intensity is used to refer to a certain amount of precipitation registered in a given time, e.g., one hour or one minute. These average intensity values allow the classification of different precipitation events into five categories (weak, moderate, strong, very strong and torrential).
To determine the intensity of the rainfall where records are generally quite limited, the literature offers different statistical procedures, some of which are based on intensity–duration–frequency (IDF) curves. Therefore, IDF curves for each of the case studies were analysed under the effects of two different time series of precipitation. The first time series (TS_01) accumulates a maximum rainfall of 55.698 mm in 24 h, where in the hour of highest intensity 15 mm is recorded. This is a value corresponding to a moderately intense rainfall. The second time series (TS_02) accumulates 87.291 mm in 24 h, with 23.38 mm in the hour of highest intensity. This corresponds to a strong rain intensity. Both series correspond to the maximum precipitation values expected during the rainiest months of the year, where series TS_01 has been calculated considering a return period of 2 years, while series TS_02 considers a return period of 10 years; neither of the two series considers evaporation losses. For visualization purposes,
Figure 6 shows the two time series used.
3.6. Selection of the Appropriate Green Roof
Given the average socio-economic level of the region analysed, it is desirable if green roofs are economical and require little maintenance. In addition, due to the predominant type of buildings in the sectors of this study, it is necessary to install roofs with a 10–30% slope. Finally, shear forces increase with the slope of the roof. These forces should be transferred to the structure by means of strong perimeter borders or stable retention barriers. Hence, only extensive and semi-extensive green roofs were suitable.
For inclined roofs, the stability of the substrate and the retention of water requires special consideration. For this reason, the selection of plants and the methods of planting should be adjusted to the slope. The professional installation of an anti-root waterproofing and protective blanket with a large water retention capacity are also essential. In the particular case of the central region of Chile, the plant resilience must be observed, as, during the winter, the roofs will be subjected to strong winds and frosts, whereas in summer they will experience high levels of solar radiation.
With regard to maintenance, these types of roofs are usually constructed with plants that grow naturally without needing sowing and with little substrate thickness required. Once the vegetation covers 60–70% of the total area, maintenance work is reduced to two or three inspection visits per year. Maintenance work is also necessary when adventitious plants appear or when modifications are needed for the irrigation pattern.
The types of plants used on green roofs are usually a covering vegetation formed by native local plants. In each region, there are many native plants that are suitable for forming a natural carpet, although today it is very common to use different sedums, both herbaceous and aromatic.
Finally, computational simulations of the hydrological model resorted to three commercial green roof configurations, where the main properties (type of vegetation, slope, thickness of the substrate, thickness of the vegetation, thickness of the drainage layer, roughness coefficient, etc.) were provided by the green roof manufacturers.
Table 2 summarizes the main characteristics of each type of green roof implemented in the simulations.
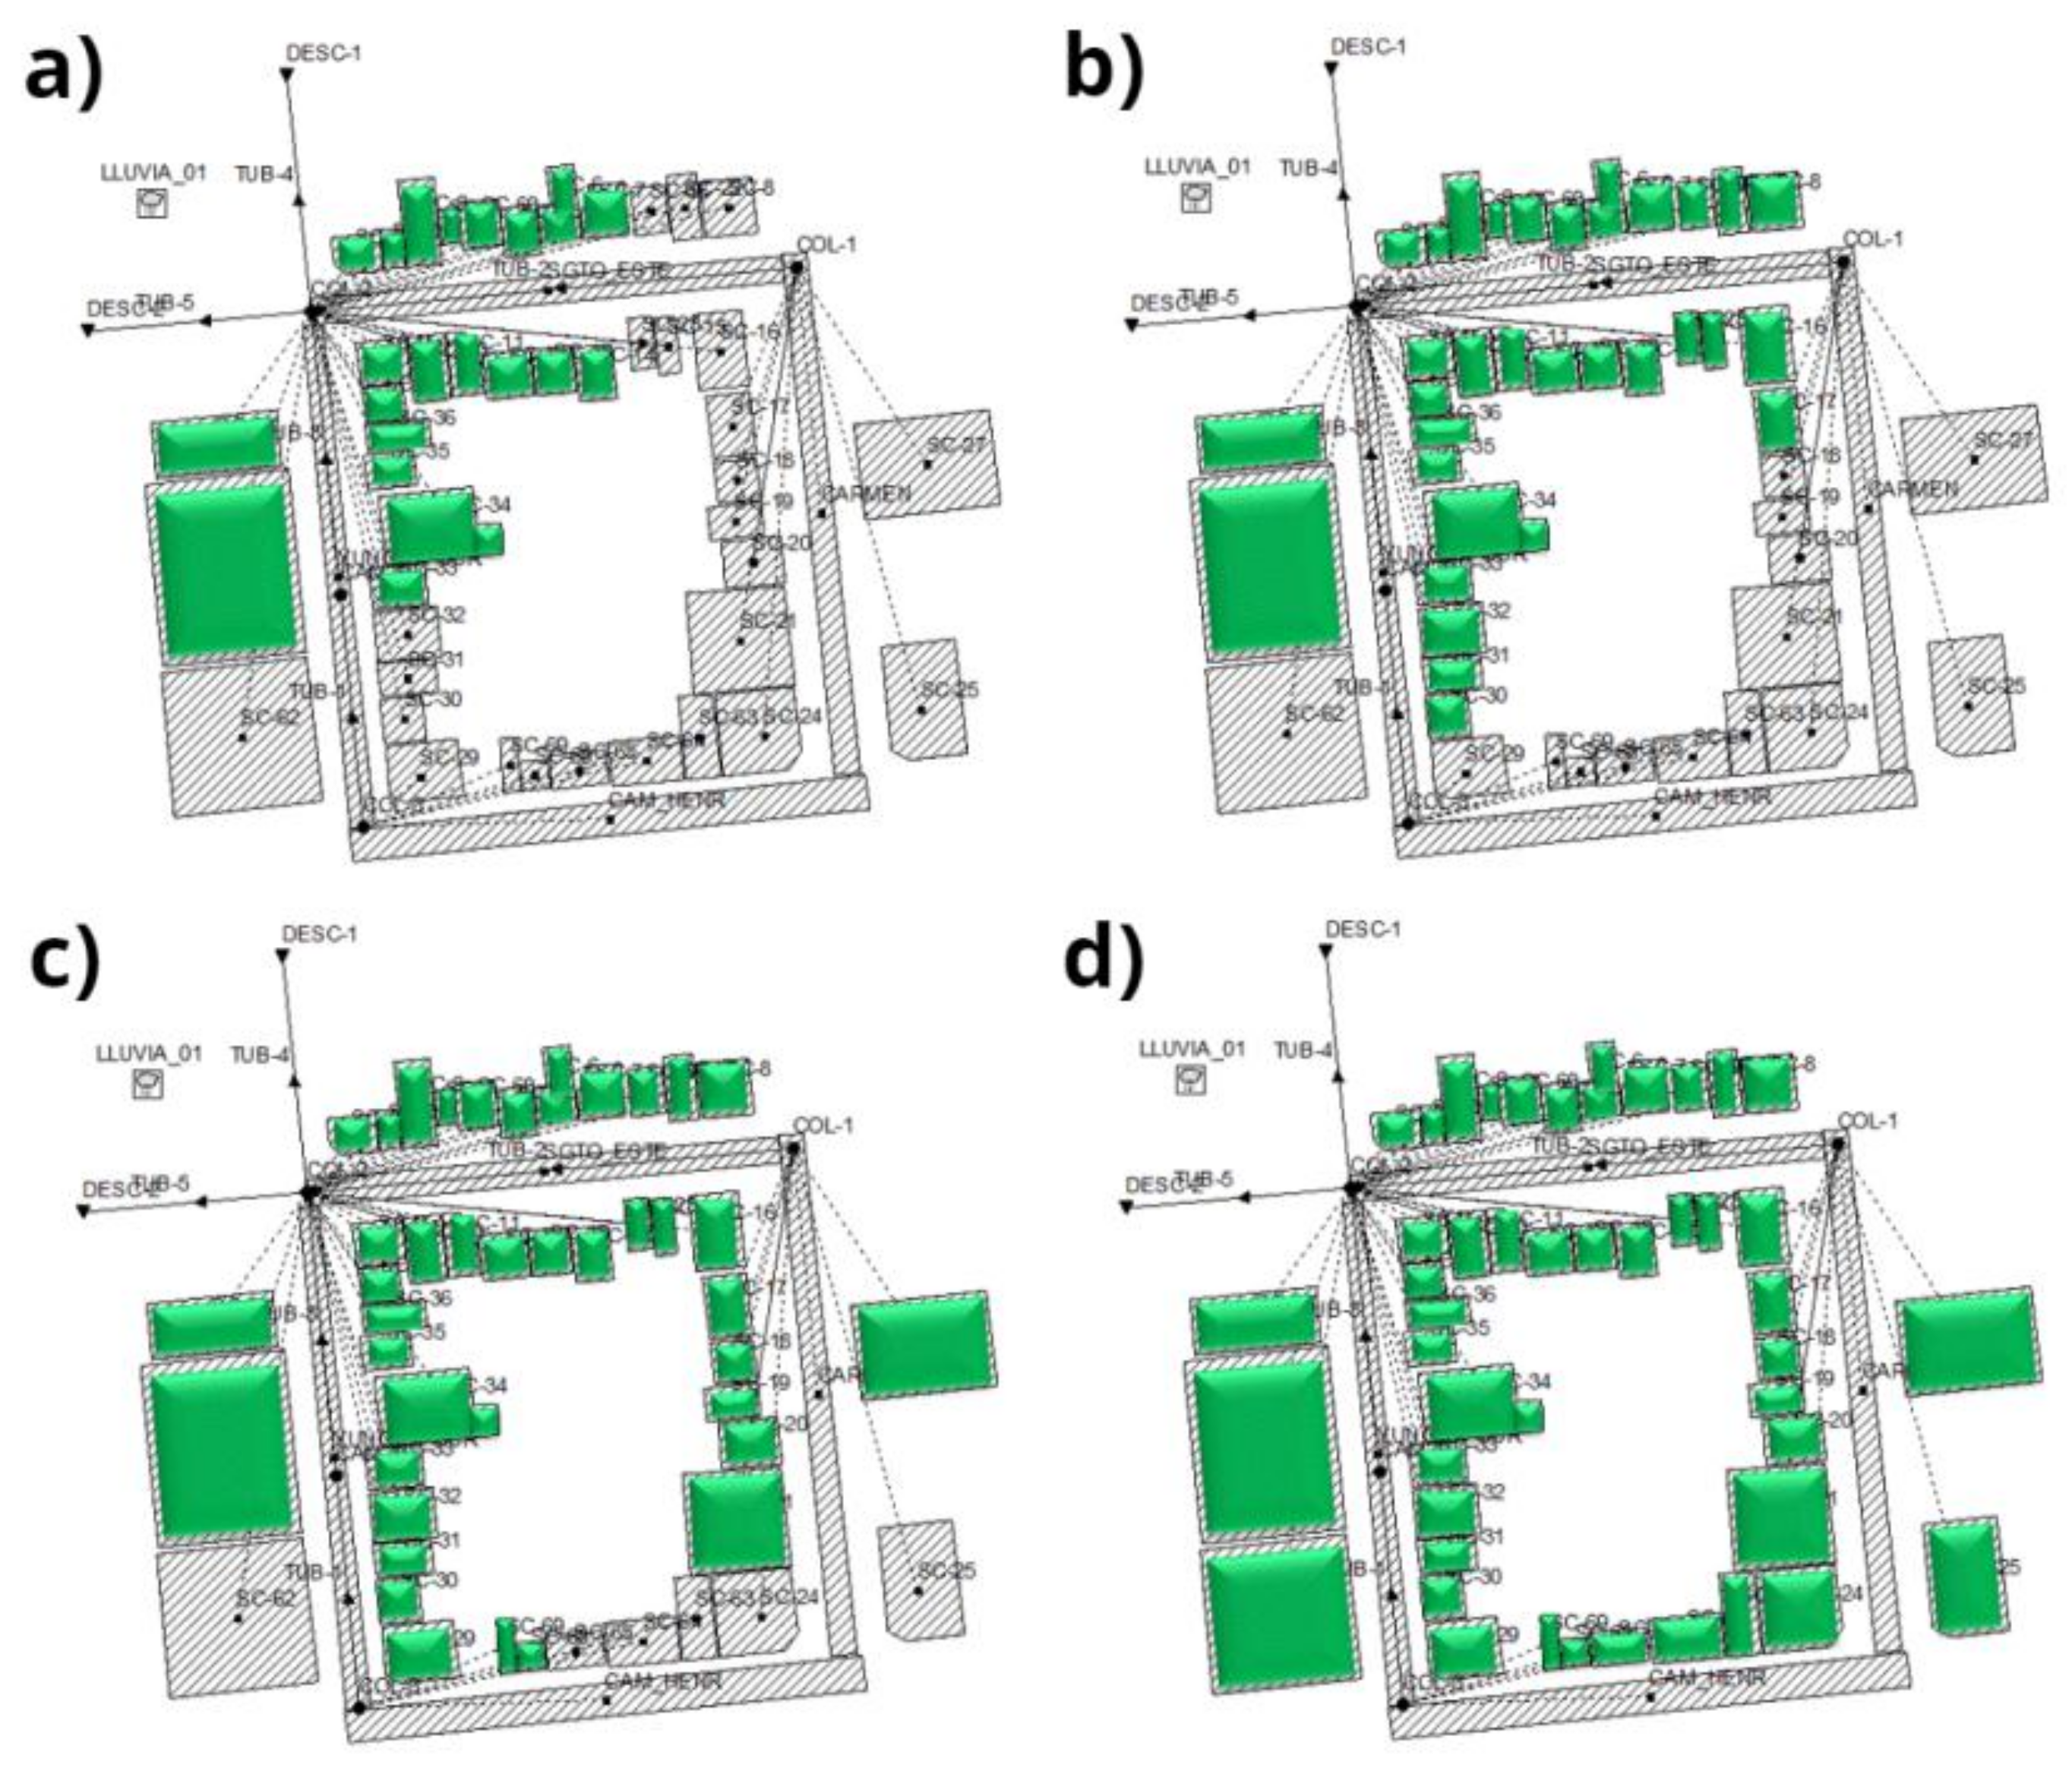
The use of LID modules within the SWMM project allowed the implementation of green roofs in the whole study area or in any desired combination and size of the selected subbasins. Each case study included four alternatives to verify the amount of surface runoff that could be reduced depending on the percentage of green area installed with respect to the total available area. For example, in Case Study 1, the analysed model considered the incorporation of green roofs to a total of 21, 31, 39 and 45 subbasins, equivalent to approximately 25%, 50%, 75% and 100% of the total area available. The green roof distribution area considered is shown in
Figure 7.
4. Results
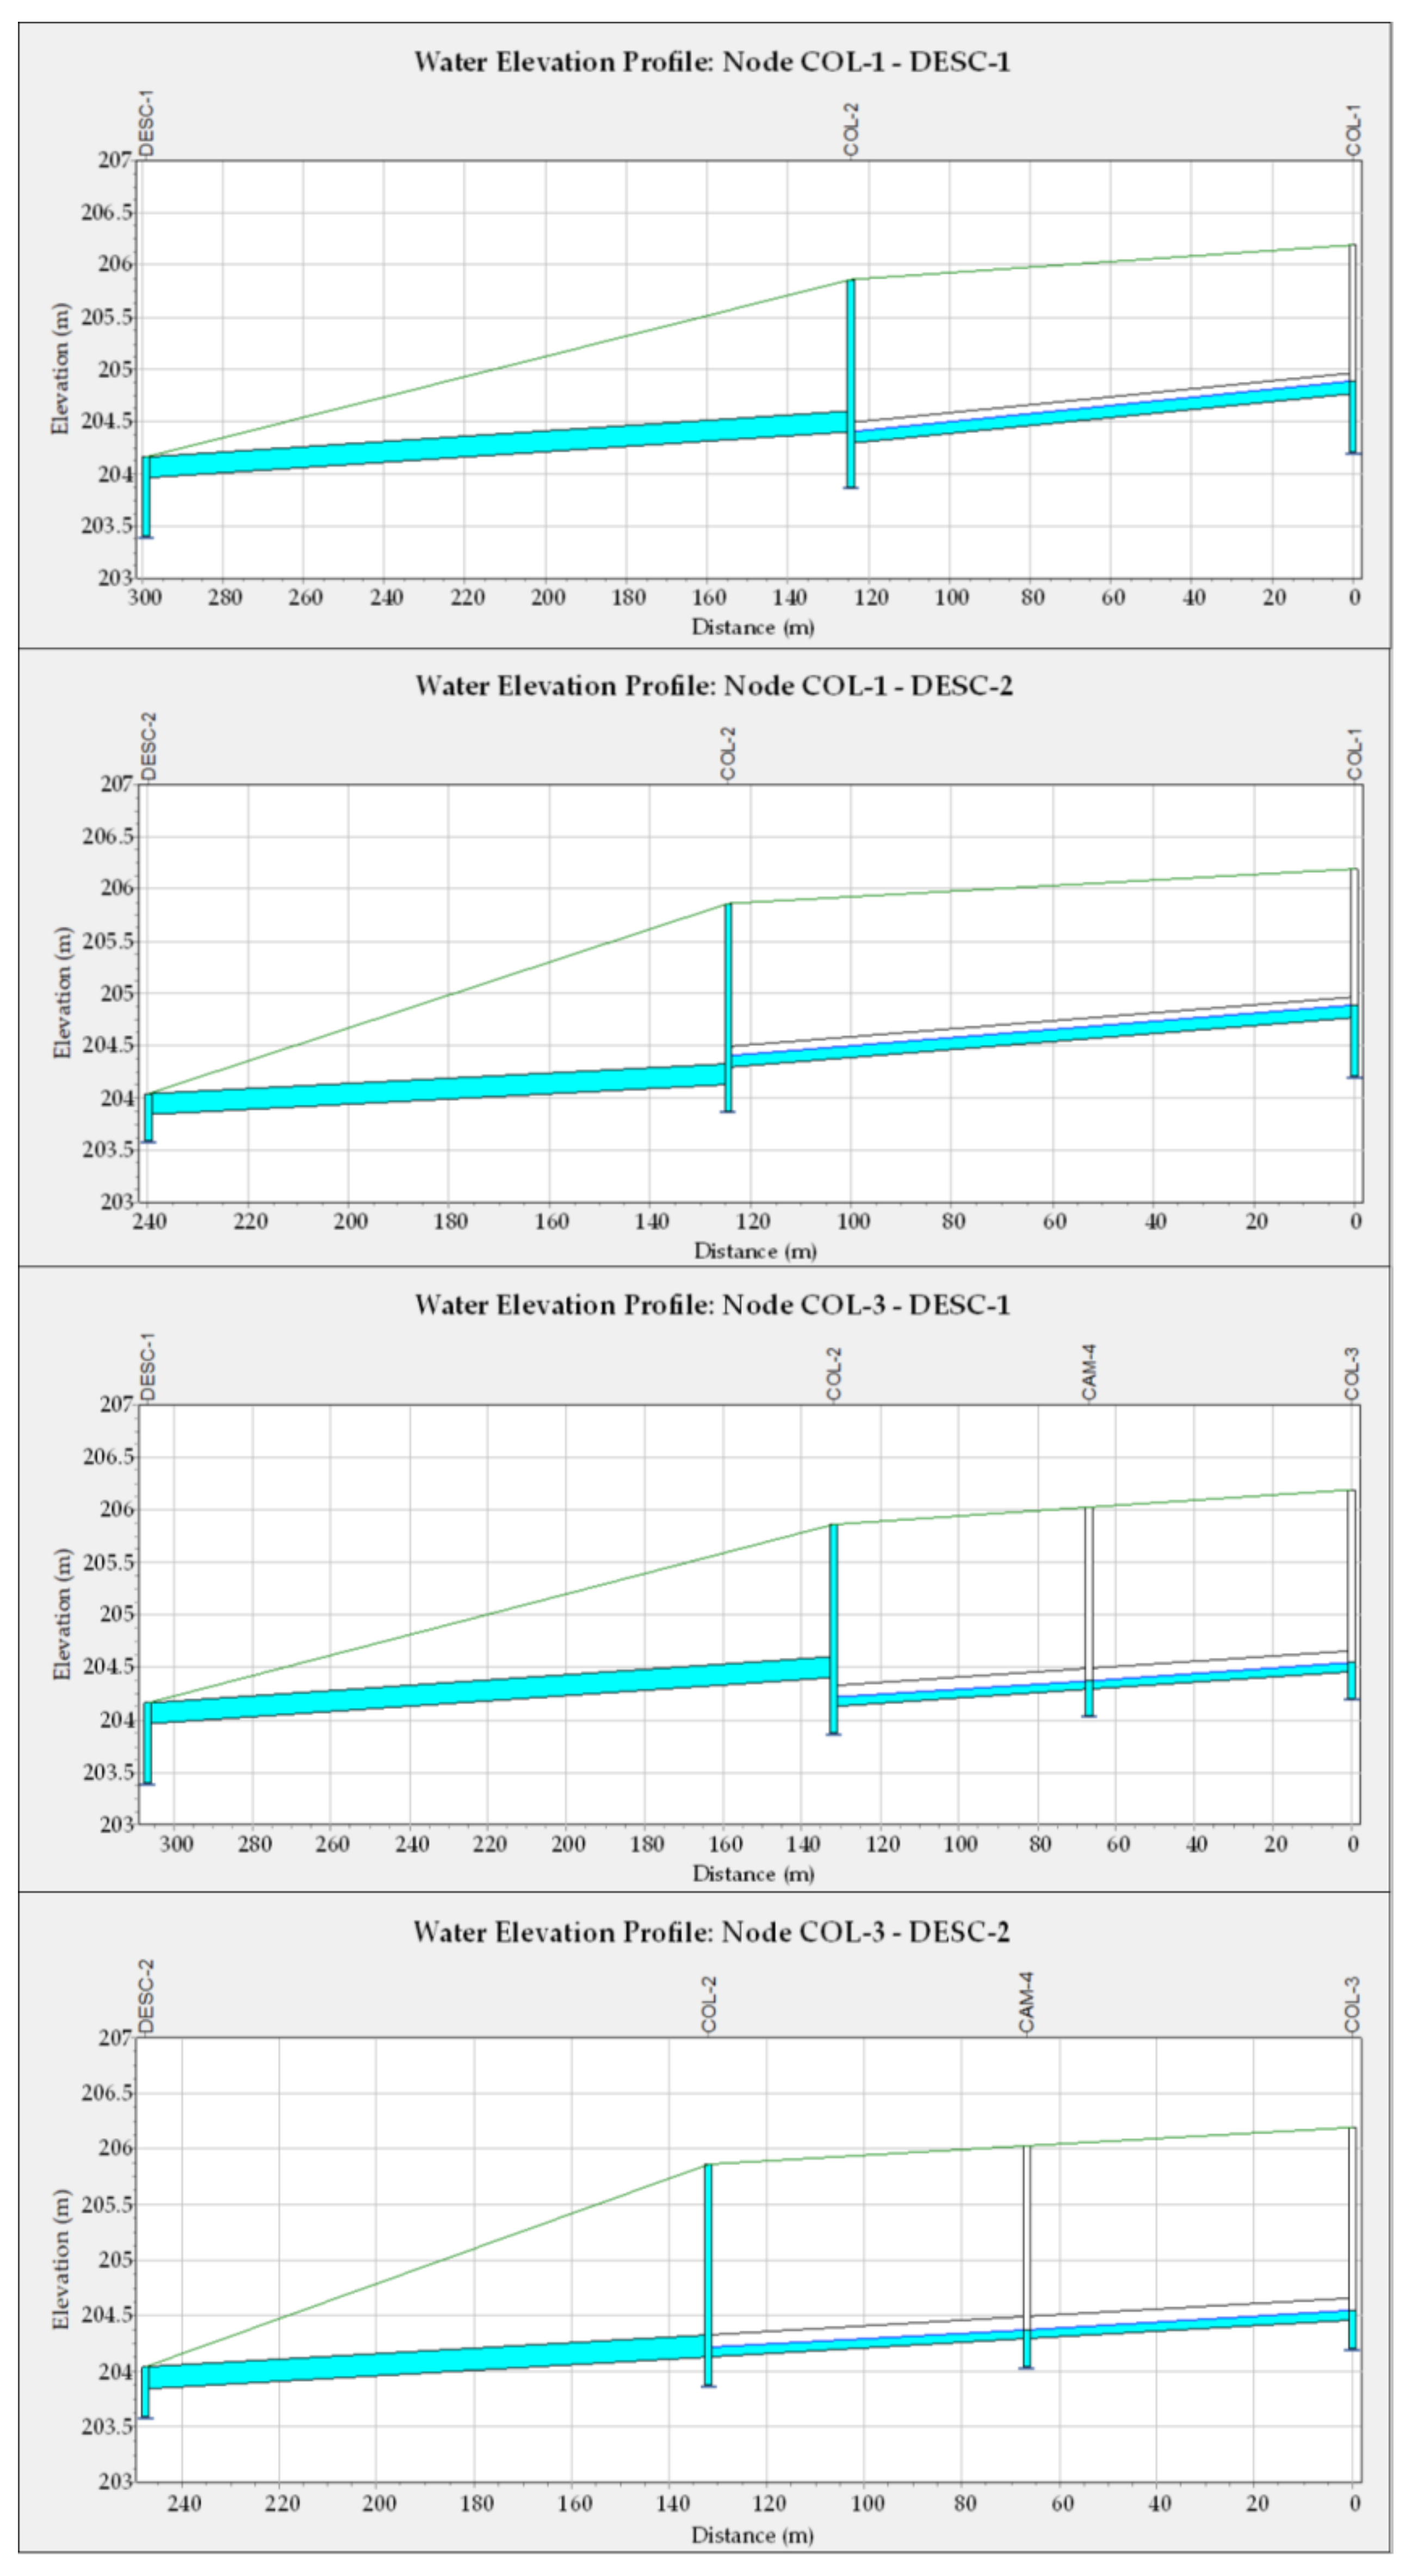
After setting up the model, the first simulation was run without including any modifications to the current situation. This was performed with the intention of verifying that the floods observed on site were replicated by the hydrological models that were built. The results obtained by SWMM correctly accounted for the floods in all case studies. For example, in Case Study 1, collector 2 (COL-2) receives runoff from four streets and two side collectors, and it has historically experienced problems with rainwater evacuation.
Figure 8 shows the longitudinal profile obtained for the different lines of action for this sector at time 15:00 under the precipitation event TS_01.
The results show the flooding of collector 2 as it was observed on site. When carrying out the simulation using the second time series precipitation (TS_02), flooding also occurred. Similar results were obtained for the remaining case studies.
Once the hydrological models were validated, they were modified to include the different commercial green roof options (as shown in
Table 2) for the available roof areas around each case study. Hence, all the abovementioned analyses were replicated for each green roof type, as described in
Table 2. It is worth noting that one of the objectives of this study was to determine how much green roof area is required to reduce the urban runoff to a level that prevents flooding.
It should be noted that the results did not consider evaporation losses since these were not considered relevant to the objectives of this research. However, due to the data provided by the public institutions, the results did consider the land infiltration capacity, which is dependent on variables such as soil type, topography, slope, soil thickness, etc. With all parameters already known, all simulations were run.
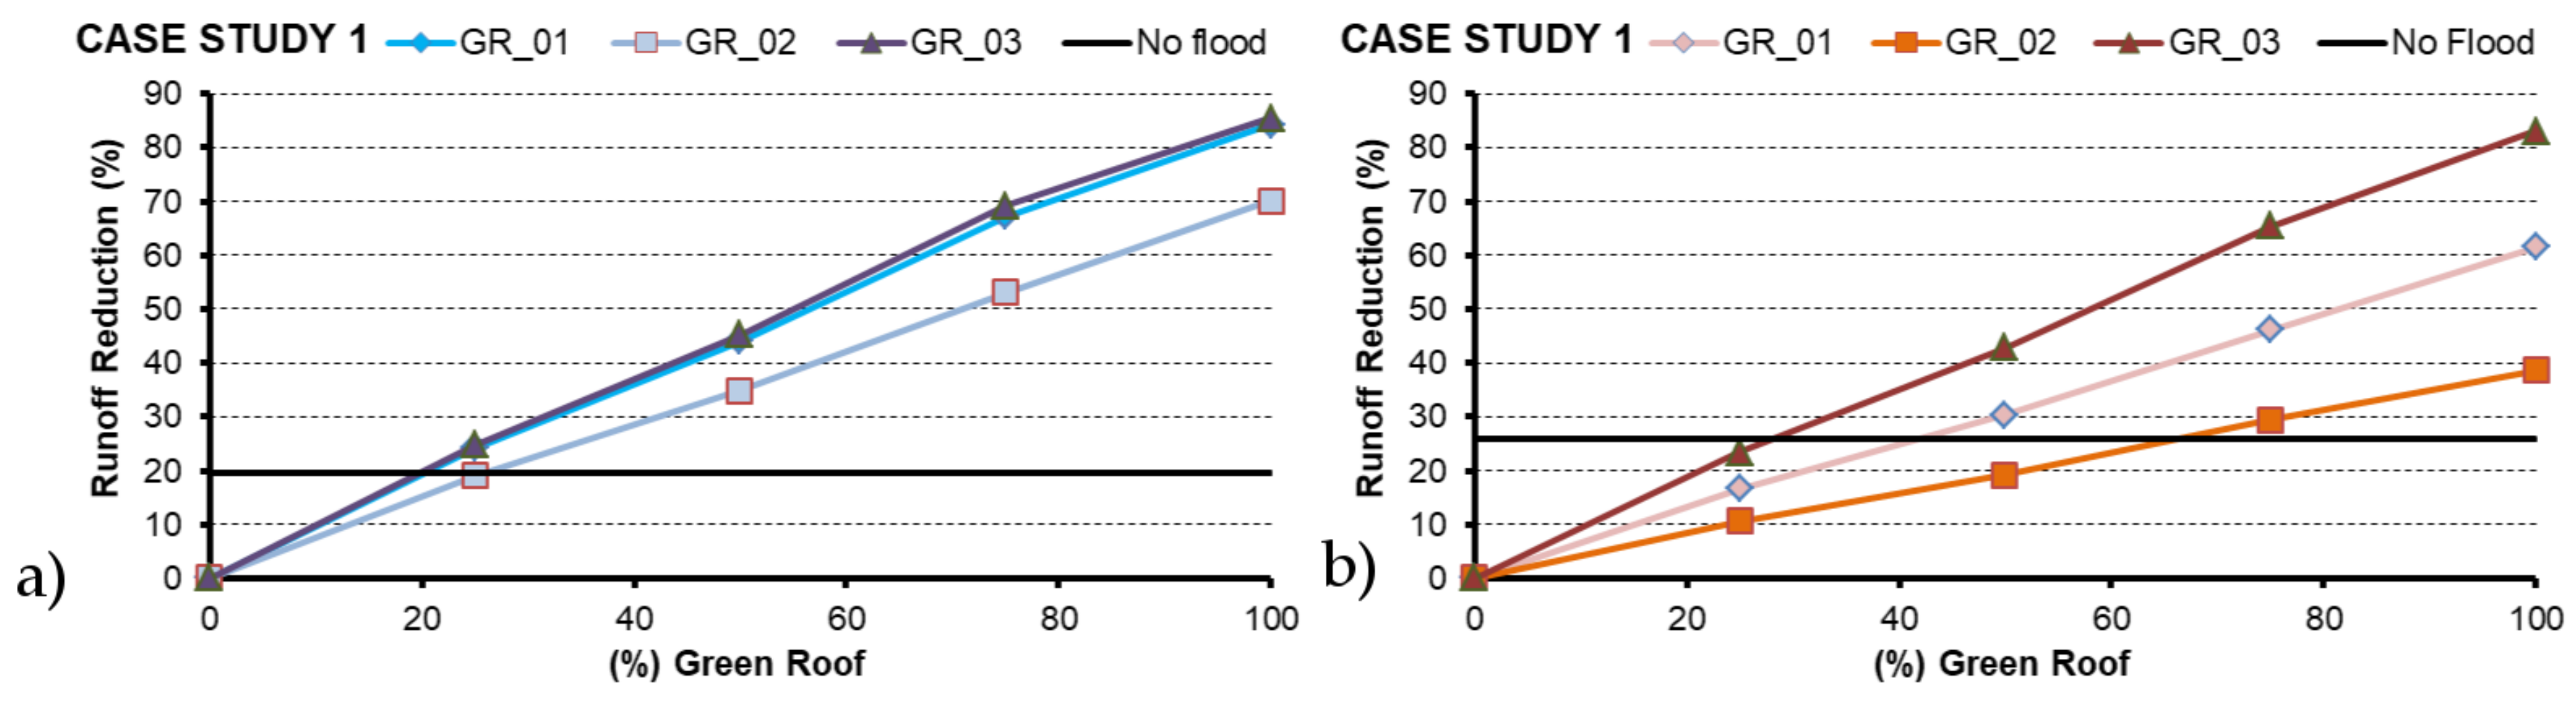
Figure 9 shows the runoff reduction (%) based on the green roof areal coverage in relation to the total area available for the first case study.
The figure evaluates the effectiveness of the three commercial green roof configurations for avoiding floods in Case Study 1 under two different precipitation intensity scenarios. The left side of the figure represents a moderately intense rain event (TS_01), while the right side represents a strong rain event (TS_02). In both scenarios, the black line represents the runoff reduction (%) that would be necessary to prevent flooding (19.53% for TS_01 and 25.92% for TS_02). The results show that, for the rain series TS_01, the three green roof configurations prevented a flood even when covering just 25% of the available roof surface. For the second rain event TS_02, with a higher intensity, it is necessary to increase the green roof surface to at least 40% for green roof configurations GR_01 and GR_03. For GR_02, it is necessary to increase the green roof area over 60%. In terms of the total green roof area that would be necessary to prevent floods during strong rain events, the total amount would correspond to approximately 4000 m2 in this case study.
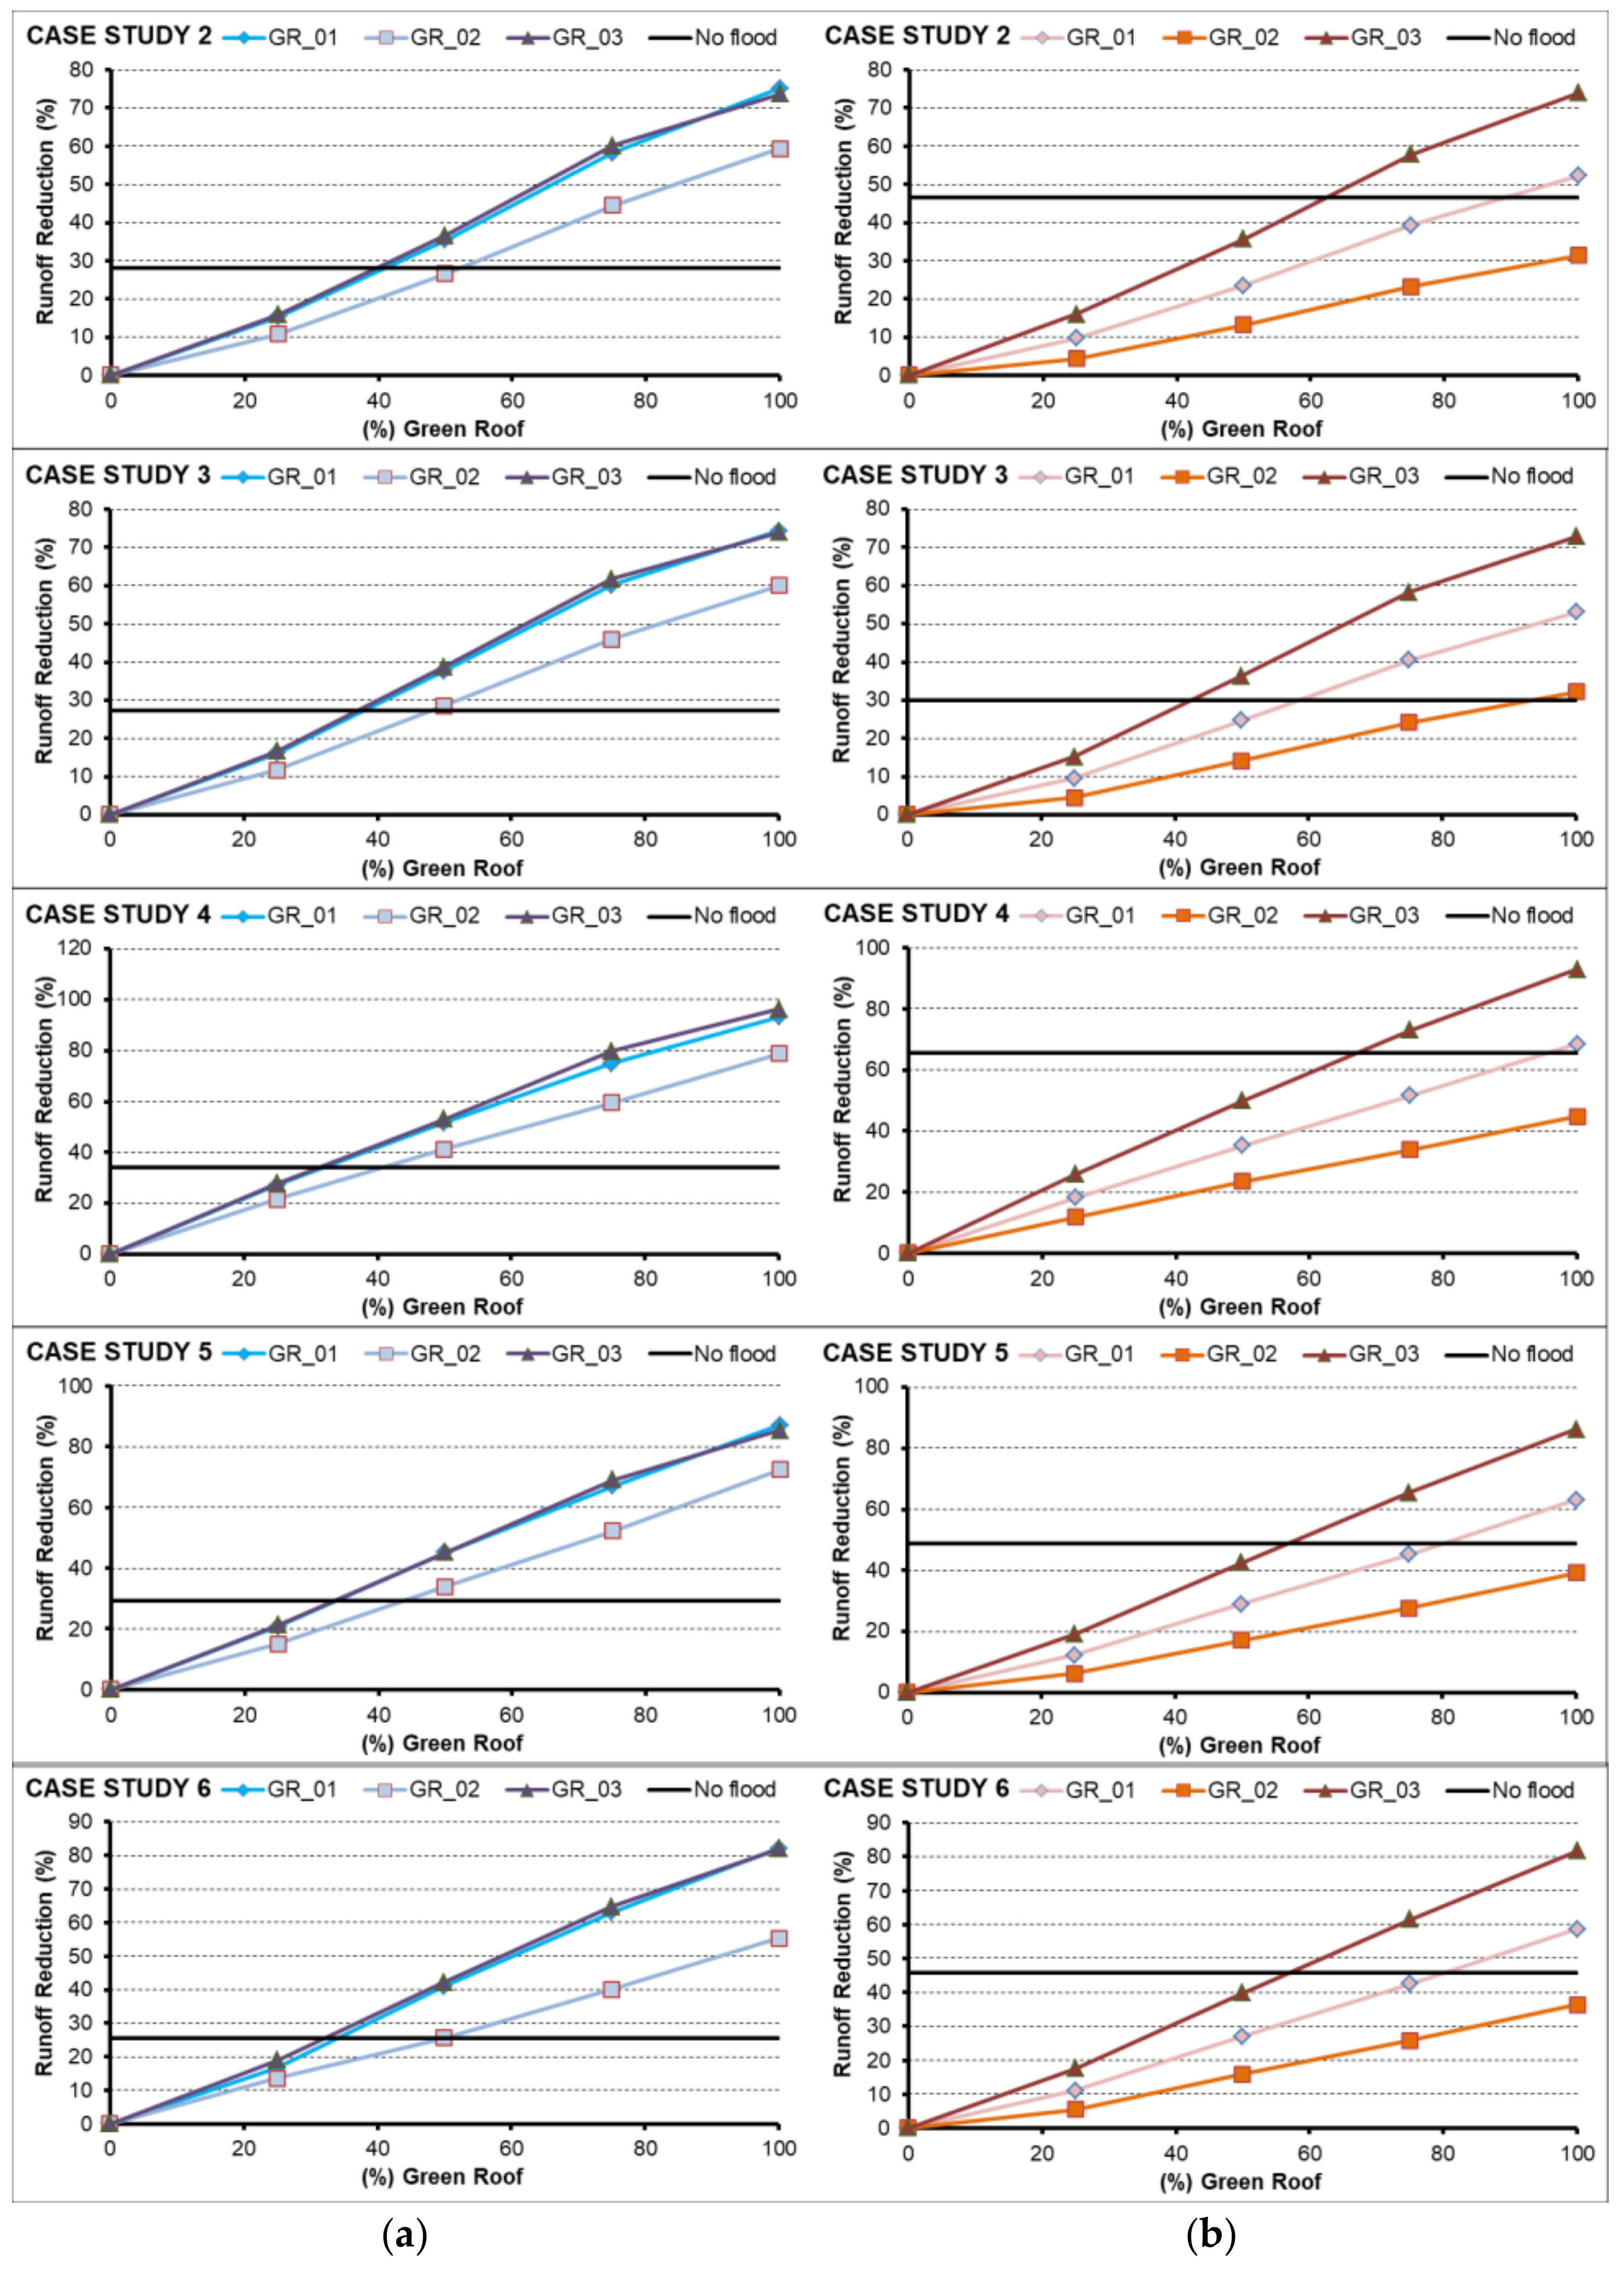
Carrying out the same analysis for the remaining case studies,
Figure 10 summarizes the green roof surface needed to prevent flooding in each of the critical sectors analysed in the model.
Note that the necessary runoff reduction to prevent flooding changes in each case study. Considering the individual behaviour of each green cover configuration tested, for the precipitation series with a lower intensity (left side), green roofs GR_01 and GR_03 behave very similarly. However, when increasing the rain intensity (right side of
Figure 10), GR_03 can retain a larger amount of water, and it reduces the runoff more than GR_01 and GR_02. In all case studies and rainfall series analysed, GR_02 yielded the worst results in terms of the reduction in urban runoff. This was probably due to its lower substrate.
When considering the green roof surface needed to mitigate flooding, the results show that for moderate intensity rainfall (left side), all the critical sectors avoid flooding if at least 50% of the available surrounding area is covered by green roofs. Conversely, for strong rain events (right side), not all types of green roofs could prevent flooding, even when occupying all the area available. In this regard, roof configuration GR_02 was not able to prevent flooding in four of the six case studies, even when covering 100% of the total available area. Therefore, for heavy rains, roof GR_03 was the best alternative. GR_03 was able to retain enough water to prevent flooding in all cases. However, it should be noted that some of the critical points studied required the implementation of green roofs in practically 100% of the total available area, which is probably not feasible in all cases for economic reasons. As a summary,
Table 3 shows the minimum green roof surface needed for all the case studies analysed.
Considering the constructive characteristics of the three roofs analysed, the results show how the thickness of the vegetation layer and the substrate significantly influence the water retention capacity. Roof GR_02 requires much more surface than the other two roofs to reduce the same runoff and prevent flooding. In contrast, roofs GR_01 and GR_03 offer a very similar performance during moderate rainfall events but differ in heavy precipitation events. In those cases, roof GR_03 performed much better. However, roof GR_03 also has some drawbacks. It requires more maintenance due to the type of vegetation utilized (semi-extensive roof). In addition, it is heavier (for structural purposes). Either factor might be limiting depending on the case.
5. Discussion
This work has proposed green roofs as a potential solution to the problem of flooding during the winter months in the central region of Chile. To evaluate this possibility, the retention properties of green roofs have been evaluated with SWMM. The last version of this programme created much anticipation since it has the capability of simulating the hydraulic performance of various types of LID practices, such as green roofs, porous pavements, and rain barrels.
Green roof models with SWMM have been reasonably tested for continuous rainfall–runoff simulation, and the results show that the software is able to successfully capture the long-term average storm-water management performance [
47,
48]. However, the programme assumes some simplifications in the model formulation. On the one hand, SWMM simulates the precipitation–runoff processes, but it does not simulate the detailed physical processes of SUDS. Hence, green roof properties such as initial water content, plant species, media properties, etc. are neglected. The actual input data are the precipitation intensity distribution and an estimation of the retention capacity of the green roof by means of surface characteristics (berm height, vegetation volume fraction, surface roughness and surface slope), soil characteristics (thickness, porosity, field capacity, conductivity, etc.), storage (thickness, void ratio, seepage rate, etc.), and drainage (flow coefficient, flow exponent and offset height). In addition, the parameters required for the simulation are numerous and sometimes difficult to obtain. Therefore, as SWMM does not directly consider the detailed physical processes, the results of the system hydrological response should be considered as mere estimates of the green roof performance.
Additionally, the proposed methodology has other limitations that deserve further attention. One might raise the question that runoff volume reduction depends on some factors, such as the precipitation characteristics, the vegetation, growth media, and roof slope. On the one hand, the total runoff volume will be largely determined by the total amount and intensity of precipitation. On the other hand, many studies agree that the soil type and its properties, including the type of vegetation, has a greater influence on green roof water retention capacity [
41,
42,
51]. In this sense, the type of vegetation commercially available for non-intensive green roofs is very limited, with grass or sedum being practically the only commercial options. Therefore, it is probably still necessary to perform further research while exploring further options.
Considering the precipitation characteristics, to perform representative computer simulations, it is essential to access detailed rainfall records. This would allow accurate estimates of the potential amount of rainwater that should be filtered/retained by green roofs. Normally, for large areas, spatial distribution methods are used to allow the extrapolation of information from few weather stations to larger spaces. This allows estimating the likely precipitation to be modelled. Some of the most common methods referred to in the literature are the arithmetic mean, Thiessen polygons, isohyets, etc. [
52]. Pizarro et al. [
53] compared different estimation methodologies and concluded that, for the Central Valley of Chile, there are no significant differences among these methodologies. Therefore, due to its simplicity, we chose the Thiessen polygons for estimating the average rainfall in the study areas.
Once the average rainfall was defined, a statistical procedure based on IDF curves was used to determine the rain intensity. In this sense, the literature reports that green roofs are able to retain 100% of the water from weak precipitation (<24.4 mm/day) [
54]. The percentage of retention decreases as the total precipitation increases. For this reason and for the sake of representativeness, this work has considered moderate (between 2 and 15 mm/h) and strong (between 15 and 30 mm/h) precipitation events. The results section shows how most green roofs have problems or cannot cope with strong rainfall. The inclusion of stronger (torrential) rain events was therefore ruled out, as it would have produced even more restrictive results.
Additionally, there is some literature recording changes in precipitation patterns related to climatic change both in Chile [
55] and in other countries [
56]. Most researchers agree with the following: (a) the precipitation in high latitudes has increased; (b) the precipitation in China and Australia has reduced; and (c) the variance in equatorial regions has increased [
57]. With this information, two scenarios are probably insufficient to represent future climate scenarios (RCP) and create an opportunity for further research. In this vein, Lin-Ye et al. [
58] proposed a methodology linking precipitation variables and large-scale climate indices, which will be worth exploring in subsequent research.
Regarding the expected results, the total volume reduction cannot be easily compared with previous studies, due to different conditions, properties and modelling assumptions. Despite these limitations, observed runoff volume reduction in the literature typically falls between 40% and 80% [
47,
54,
59,
60], so the overall results obtained in this work seem to be in accordance with previous research. However, practically all previous studies only analyse the capacity of green roofs considering that they occupy 100% of the available roof surface. This does not seem realistic. For this reason, this study has assessed the percentage that could be available in a real urban environment and the percentage that would have to be covered to prevent flood problems. This also forms a more realistic idea about the required economic investment.
Therefore, to evaluate the feasibility of the proposed solution, the economic factor must also be considered. The simplest and cheapest green roof configuration is the extensive green roof. Approximate costs usually vary between 55,000 and 65,000 CLP/m2 (75 to 95 EUR/m2) including waterproofing, drainage systems, substrate, vegetation and irrigation. Intensive covers, on the other hand, resemble gardens and are designed for recreational use. These are more expensive (starting from 110,000 CLP/m2 or 150 EUR/m2), so they were not considered in this analysis. From the analysis made in the results section and considering the installation of a semi-extensive cover (GR_03), it is possible to estimate that at least 60% of the available surface should be converted to green cover to prevent flooding from strong rain events. This involves installing between approximately 2400 m2 and 5000 m2 at each critical point. In monetary terms, this supposes a strong investment that normally could not be assured by private users alone.
Therefore, promoting green technologies should be a priority for developing countries such as Chile. However, the particular socio-economic conditions of each city/town sector require special attention when choosing the type of green roof to promote.
Finally, the energy-related economic benefits of green roofs are also well documented in the literature [
33,
56]. However, again, usually the high construction costs of green roofs dissuade many building owners. In Chile, incentive policies for the adoption of sustainable and energy-efficient technologies are slowly being implemented. However, for the time being, the lack of legislation on green roofs is causing many users to be unaware of their entitlement to request fiscal benefits after installation. Studies such as the one proposed here may help to raise awareness in the near future.
6. Conclusions
The growth in urban areas over the last two decades, along with the phenomenon of climate change, has led to pernicious effects on cities in terms of air quality, warming, flooding, etc. In Chile, significant urban development and the absence of green spaces has caused the rainwater evacuation infrastructure to be insufficient. This causes certain city sectors to frequently suffer rain-related floods during the winter season. Among the numerous socio-economic and environmental benefits provided by green roofs is the reduction in urban runoff, and this study proposes the use of green roofs to limit flooding in some of these affected sectors in cities of central Chile.
The proposed methodology, based on real data provided by public institutions, identifies a series of conflictive sectors in a city in the central zone of Chile (Curicó) and computationally simulates the application of green roofs in six case studies. The objective of this work is to define whether it is possible to control the flooding in some sectors through sustainable drainage systems. According to the results, it is possible to state the following:
- -
The installation of green roofs in critical sectors considerably reduces urban runoff. In the case of moderate rainfall, two of the three types of commercial green roofs (extensive GR_01 and semi-extensive GR_03) prevented flooding in all cases by installing green roofs in less than 50% of the available area.
- -
With more intense rainfall events, the green roof surface needed to control flooding is significantly higher. Specifically, roofs GR_01 and GR_03 needed to cover more than 60% of the total area available in practically all cases. The extensive roof GR_02 could not prevent flooding in four of the six case studies.
- -
In events with more intense precipitation, the semi-extensive roof (GR_03) works considerably better than the two extensive roofs (GR_01 and GR_03) but introduces additional inconveniences, such as a heavier weight or greater maintenance needs.
- -
From the results, it can be deduced that, among the three models of green roofs tested, roof GR_02 has the least retention capacity. This type of green roof has less substrate thickness and less vegetation layer thickness than the other two types. Hence, both parameters seem to be key when selecting a green roof for urban runoff reduction purposes.
To summarize, in general terms, it can be concluded that green roofs can effectively help control flooding in conflictive sectors of cities, at least for moderately intense rainfall events.

 ,
, 


