Evaluation of Sustainable Energy Security and an Empirical Analysis of China

1
Economics and Management School, Wuhan University, Wuhan 430072, China
2
Center for Complexity and Management Research, Wuhan University, Wuhan 430072, China
3
School of Economics, Wuhan University of Technology, Wuhan 430070, China
*
Author to whom correspondence should be addressed.
Sustainability 2018, 10(5), 1685; https://0-doi-org.brum.beds.ac.uk/10.3390/su10051685
Submission received: 4 April 2018
/
Revised: 17 May 2018
/
Accepted: 18 May 2018
/
Published: 22 May 2018
(This article belongs to the Special Issue Energy Security and Sustainability)
Abstract
:Energy security and sustainability are crucial factors for the development of China. The creation of an evaluation theoretical system of the energy has theoretical and practical significance that is important for ensuring the safe and sustainable development of energy security that matches the national development phase and reflects the sustainable development of national energy. Sustainable energy security must not only take into account the security of energy supply–demand in the long-term and short-term, it must also focus on the coordinated development between energy, the environment, and the economy in China. This paper proposes five dimensions of energy security (availability, accessibility, affordability, acceptability, and develop-ability) to construct China’s Sustainable Energy Security (CSES) evaluation index model. Based on the model, an empirical study of China’s energy security is carried out with data from 2005 to 2015, and dynamic changing trends are analyzed accordingly. The results indicate that availability and develop-ability are the most important weights in China’s Sustainable Energy Security index system, where availability shows a general downward trend, and develop-ability presents an inverted U-type trend, with its lowest point in 2011. From 2008 to 2012, China’s sustainable energy security had been at risk. Taking the year 2010 as the demarcation, two phases were obtained: before and after 2010, during which the level of China’s sustainable energy security first dropped, and then rose. However, compared with 2005, CSES level decreased by 28% in 2015 due to the decline of availability and accessibility. During 2005–2015, China’s energy security system had relative high scores in acceptability and develop-ability, while the sustained downward trend of availability is in need of more regulation.
1. Introduction
Energy sources provide the impetus for social and economic development, and energy security plays an indispensable role in national security [1]. Changes in politics and the economy both internally and externally have a profound impact on China’s energy system. Under the background of the global development of a low-carbon economy, China’s energy system has developed toward a low-carbon, clean, efficient, and safe direction as its economy has entered the New Normal, which represents an internationalized energy supply, slower energy consumption growth, an accelerated adjustment of the energy structure, an increased proportion of clean energy and other new normal situations. The frequent occurrence of terrorist attacks has led to an increase in global geopolitical risks, and the strong development of the shale gas revolution in the United States has impacted the energy market [2]; the global geopolitical risks have been rising, generating a shock in the energy market. The Middle East, North Africa, and the former Soviet Union are China’s top three oil import areas, constituting more than 40% of China’s crude oil supply in 2015 [3]. Since more than half of these areas are in the Middle East and North Africa, which are considered the regions with the highest geopolitical risk in the world, the impact of geopolitics on China’s energy security deserves special attention. At the same time, with the rapid economic growth, people have increasingly perceived that resource exhaustion and environmental issues have a serious influence on the survival and development of human beings [4]. According to Hubbert’s peak theory [5], fossil energy production will peak, and fossil energy will be exhausted in the near future, which in turn will lead to various unsustainable dangers of fossil energy development, such as increased prices of fossil energy. China’s social and economic development are characterized by huge energy consumption and a high proportion of coal in the energy mix, which results in serious negative externalities [6]. In order to reduce dependence on fossil fuels and mitigate climate change and environmental pollution, China has attached great importance to the development and utilization of renewable energy sources [7]. However, at present, grid-connecting issues, wind and light abandonment issues, and consumption issues related to renewable energy in China have yet to be resolved. Based on the grim situation of China’s energy system at this stage, the safety and sustainable development of the energy system is the primary goal for energy policy-makers, and it must be paid great attention.
SES (Sustainable Energy Security) refers to the “provisioning of uninterrupted energy services in an affordable, equitable, efficient, and environmentally benign manner” [8]. That is to say, it includes not only the harmonization and sustainability of energy, economic, social, and environmental development, but also the high efficiency and diversity of the energy system. China has entered into a new development era and established a scientific and reasonable energy security evaluation system that is of great theoretical and practical guiding significance that adapts to China’s current development mode. The goal of the developing trend of energy security under the new era is to ensure the safe and sustainable development of the energy system and give the rationale for the formulation of energy policy.
The rest of the paper is organized as follows. Section 2 provides a summary of previous literature on energy security definitions, indexes, and studies of China. Section 3 formulates China’s Sustainable Energy Security (CSES) Index. Section 4 constructs a CSES evaluation model and makes an empirical study within the time range of 2005–2014. Section 5 analyzes the results for China’s sustainable energy security and the effects of the indicators. Finally, Section 6 concludes and puts forward some countermeasures and suggestions.
2. Literature Review on Energy Security Definitions and Index
Over time, energy security has become a developing concept that varies from country to country. In the 1970s, the concept of energy security began to emerge; Willrich [9] firstly noted that “energy security is a matter of greatest concern to international politics”. Most of the earlier research focused on the security of oil resources; the reason was that for these sample countries, their energy security problems mainly concentrated on the risk of oil supply chain rupture. For example, the International Energy Agency (IEA), which was established after the first oil crisis in the 1970s, proposed a national energy security concept centered on “stabilizing crude oil supply and crude oil prices” [10]. Yergin [11] held that the goal of energy security was to guarantee sufficient and reliable energy supply at a reasonable price, as well as not harm the values and objectives of the main countries. This opinion is mainly for the purposes of the energy security of oil-importing countries. With the changes in the global energy structure and emerging concerns on the energy security of more countries, the meaning of energy security has expanded, and is not limited to oil and gas. Some researchers have gradually raised concerns about the security of coal, electricity, and the whole energy supply system. However, most of the literature in this field is mainly concerned with the relationship between supply and demand, which is from the “quantity” perspective. Löschel [1] establish ex-post and ex-ante indicators to assess the security of energy supply in several industrialized countries, and Scheepers [12] established the supply/demand index and the crisis capability index to assess the energy supply security for the EU. Considering the differences in energy systems between different countries and regions, scholars have assessed energy security at different levels and from different perspectives. Ret [13] evaluated the state of national energy security in Australia. Cherp et al. [14] and Hughes [15] evaluated global energy security, while the IEA [16] established a global short-term energy security model to assess the potential safety risks of global energy in the short term.
However, scholars realize that more factors should be considered in the long term. As Narula [17] presented, study on energy security is akin to three blind men groping an elephant, and it can be interpreted differently according to the perspective of the user, so different perspectives and tools need to be developed in order to comprehend the actual energy security. Cox [18] argues that domestic laws and international conventions aimed at reducing carbon dioxide emissions will fundamentally change the energy system. Therefore, he assesses the United Kingdom (UK) electricity system security in a low-carbon context, and finds that the high concentration ratio of electricity supply is not conducive to energy security in the UK, and the key to solving this problem is to stimulate the construction of electric power infrastructure. Turton and Barreto [19] argue that the security of energy supply driven by geopolitical developments and climate change are crucial dimensions of the long-term quest for a sustainable global energy system. Bollen and Hers [20] conducted an integrated assessment of interaction among the global economy, energy use, and the impacts of climate change, finding that there are multiple benefits of comprehensively considering climate change, air pollution, and energy security policies and exploiting the possible synergies among them. As a result of the extended considerations of energy security, some scholars have further enriched the meaning of energy security. There are some representative references. Cherp and Jewell [21] defined energy security as “low vulnerability of the vital energy systems”, arguing that climate policies can make energy supply, energy mix, and energy trade less dependent upon assumptions of fossil resource availability and gross domestic product (GDP) growth in the long term. Sovacool and Mukherjee [22] argued that energy security is a complex goal involving questions about how to equitably provide available, affordable, reliable, efficient, environmentally benign, properly governed, and socially acceptable energy services. Analogously, Muñoz et al. [23] held that energy security is a multidimensional and mutually interdependent concept comprising technical, economic, social, political, environmental, and geopolitical aspects. Recently, Narula [8] proposed the concept of Sustainable Energy Security (SES), defining it as the “provisioning of uninterrupted energy services in an affordable, equitable, efficient, and environmentally-benign manner”. To sum up, the current definitions of energy security are synthesized, and not only include the security of the energy system, but also the security of cooperative development between energy and the economy, the security of energy diplomacy, the security of climate, ecology, society, and other aspects. In other words, studies of comprehensive energy security have inseparable relationships with the economy, the environment, and society, which are developed from the energy supply and usage sides, “quantity” and “quality” perspectives, and time and space dimensions.
Most of the existing research has established an index system to evaluate energy security, because a single indicator cannot reflect the actual energy security situation. Hughes [24] proposed that the research on energy security issue should start from the 4Rs, that is: Review, Reduce, Replace, and Restrict. The Asia Pacific Energy Research Centre Report (AREPC) [25] defined energy security as the ability for an economy to get enough energy supply at a reasonable price and in a way that is timely, sustainable, and not harmful to the economy and society. Kruyt et al. [26] used 4A theory—which is developed by the AREPC, consisting of availability, accessibility, affordability, and acceptability—to conduct a detailed study on the single indicator and integrated indicators of energy-supply security in the long term. However, he argued that there is no ideal energy security indicator, because the definition of energy security is based on a certain background. Therefore, through the comprehensive consideration of “demand side” and “governance”, Sovacool [27,28] built an energy security index from the five dimensions of availability, affordability, efficiency, sustainability, and governance. On the basis of a review of the related literature about energy security between 2001–2015, Ang initially summarized seven dimensions of energy security [29], and other scholars before and after him also have deeply studied this issue. These dimensions include energy availability [30,31,32,33], infrastructure [34,35,36], energy prices [37,38], societal effects [39], environment [40,41,42,43], governance [44], and energy efficiency [45,46], which almost cover all of the aspects of the energy system. However, he points out that due to the different emphases of the existing research, not all of the metrics need to be included in any single research study. For energy security in developing countries, Narula [47] divided energy system into supply, conversion, distribution, and demand subsystems, and each subsystem was further evaluated by the four dimensions of SES: availability, affordability, efficiency, and acceptability, using quantitative metrics. Meanwhile, he stressed that the demand subsystem is the main driver to attain sustainable and secure energy security development for a country. Based on this result, he conducted a study on India’s energy demand system to assess the SES [48]. As a summary, since each country has different development modes, a different strategic focus, and different policy objectives at different periods, the energy security index should be adapted to specific countries or regions for different periods. Besides, national development objectives and planning indicators should be given full consideration.
Regarding China’s energy security, many scholars have made some achievements. Some scholars have provided studies from the perspective of an energy subsystem such as oil import security [49], gas supply security [50], and energy supply security [51]. Some others have evaluated from the view of an energy system, such as for example Cheng [52] as well as Odgaard and Delman [44], who analyzed China’s energy security situation from the perspectives of policy planning, energy consumption, and import, respectively. On energy security countermeasures, Bambawale and Sovacool [53] researched China’s energy security from the energy user point of view for the first time, concluding that the supply security of fossil fuels is the most important aspect of China’s energy security. Ren and Sovacool [42] pointed out that China should give priority to the development of low-carbon energy to improve energy security, and Wang and Liu [54] assessed the geopolitical characteristics of global climate change and energy security. Nevertheless, most of the above studies only focus on a certain aspect of energy security.
Recently, many scholars have carried out research on China’s energy security based on the comprehensive energy security concept. The evaluation results of Wu et al. [55] show that the policy of “China’s energy-saving and emission reduction” plays a significant role in improving energy security. By constructing a 4A quantitative evaluation model, Yao [37] conducted a comprehensive evaluation of China’s energy security over the past 30 years since the reform and opening up, finding that China’s energy security has not improved significantly in the past 30 years. In view of the above studies, they tried to evaluate the energy security of China from a comprehensive perspective, intending to address the one-focus issue of energy security. However, there are still many problems existing in the course of evaluation, which are represented mainly as a lack of consideration of the international relations and energy prices impacts, or an overemphasis on energy security purpose and negligence toward the coordinated development between the energy and economy, along with energy and the environment. Research on energy security under the view of comprehensive energy security is still developing. Confronted with rigorous challenges, China’s energy security must be assessed from the perspective of comprehensive energy security in order to ensure energy security and sustainable development. In addition, it is undeniable that the current research studies have important significance to promote the exploration of China’s energy security. However, there is still no systematic scientific research on the SES in China to provide support for government decision-making under the New Normal, and maintain energy security and sustainability in the context of coping with climate change and developing a low-carbon economy.
Based on the definition of SES by Narula [17], this paper establishes a framework for the CSES index that adapts to the New Normal in China from the perspective of ensuring energy security and sustainability. The framework is developed from the energy system itself, as well as interactions between energy and the economy, energy and the environment, and energy and society. Then, the Entropy–Weight Technique for Order Preference by Similarity to an Ideal Solution (TOPSIS) method, which is an objective evaluation method [56] that was used to build an evaluation model and assess China’s SES based on the data during 2005–2014. In this paper, the relative closeness degree of the indicators to the ideal solution to measure CSES level was calculated through finding the positive and negative ideal solutions in the evaluation sample. The evaluation criteria came from the evaluation system, which can truly reflect China’s sustainable energy security status and its changing trend.
3. China’s Sustainable Energy Security (CSES) Index
At present, China is in a critical transition period of a new era. Externally, it faces the emergency situation of the global low-carbon economic development and rising geopolitical risks. Domestically, fossil resources are being gradually depleted, and environmental carrying capacity has reached its peak, while renewable energy development is in its initial exploration stage, and is accompanied by increasing uncertainty. Energy system security and sustainable development are at risk. Therefore, it is necessary to build an energy security index adapted to China’s new period. The Energy Security proposed by Ang [29] and the Energy Sustainability Index proposed by the World Energy Council (WEC) [57] respectively focused on energy security and energy sustainability, but no indicator system has aimed at the evaluation of China’s Sustainable Energy Security. Therefore, based on the definition of Sustainable Energy Security raised by Narula [17], five dimensions (availability, accessibility, affordability, acceptability and develop-ability) were selected to construct China’s Sustainable Energy Security Index. After combining them with the indicators used by Ang [29] and WEC [57] and fully taking China’s actual conditions and development plans into consideration, China’s Sustainable Energy Security Index System was established.
Based on the definition of SES by Narula [8], five dimensions (availability, accessibility, affordability, acceptability, and develop-ability) are put forward in this paper. In selecting indicators, full consideration should be given to national planning indicators, such as energy intensity, carbon emission intensity, non-fossil energy consumption share, etc., which are included in the Five-Year Plan (FYP) [58]. Since China completed its “no population without access to electricity” goal in 2015, electricity availability is no longer a problem plaguing China, and the remaining indicators of the Energy Sustainability Index (including eight indicators: gross domestic product (GDP) per capita, industrial sector, TPEP/TPEC (total primary energy production/ total primary energy consumption), population with access to electricity, energy affordability, energy intensity, emission intensity, CO2 emissions per capita) developed by the WEC [57] can be applied to the CSES index. In view of the above analysis, according to principles of being objective, scientific, systematic, maneuverable, and utilizing the availability of data, 15 indicators are proposed to frame the CSES index, as shown in Table 1.
3.1. Availability ()
Availability reflects the possibilities of energy supply geographically. Energy endowments and exploration capacity are critical factors affecting the stability and sustainability of energy supply, and are the basis for ensuring sustainable energy security.
: TPEP per capita
Total primary energy production (TPEP) per capita, which is a positive indicator, represents a national energy supply capacity and the equality of resources. Total primary energy production data and population data are taken from the database of the National Bureau of Statistics (NBS) [59].
: Energy reserve-to-production ratio
The energy reserve-to-production ratio adopts the weighted average of the reserve-to-production ratio of main energy varieties, such as coal, oil, and natural gas, and the weight value is the corresponding variety’s share in the total primary energy supply. It reflects the energy resources available over time, so it is a positive indicator. The reserve-to-production ratio data is taken from “BP Statistical Review of World Energy” [60] from 2006 to 2016. Energy supply data of the main varieties and the total are taken from the database of the NBS [59].
: Energy self-sufficiency ratio
The energy self-sufficiency ratio uses the weighted average of the self-sufficiency ratio of energy varieties such as coal, oil, natural gas, and primary electricity power, and employs the variety’s share in total primary energy supply as the weight value. To ensure the harmonious and sustainable development of a country, it is essential to ensure adequate energy supply, so the energy self-sufficiency ratio is a positive indicator.
3.2. Accessibility ()
Accessibility reflects the possibilities of energy supply in the transport channel and geopolitical aspects. Energy infrastructure and relations between energy and society as well as politics are worthwhile to consider. The availability of energy infrastructure and the energy-importing countries’ political and economic conditions will affect the stability of the energy supply.
: Share of investment in fixed assets of energy
The share of investment in fixed assets of energy represent the investment share in fixed assets of energy industry among China’s total fixed assets investments. Investment in fixed assets of energy is of great significance for improving energy infrastructure, the energy production capacity, and the energy conversion rate. Therefore, it is a positive indicator. Investment data of fixed assets of energy industry and China’s total investment data in fixed assets are taken from the database of the NBS [59].
: Crude Oil Market Concentration Risk
Gupta [61] pointed out that geopolitical risk can be described as oil market concentration risk and market liquidity. The IEA [62] proposed energy security market concentration (ESMC) and the Energy Security Index (ESI) to measure market power in assessing interaction between energy security and climate policy. Crude oil is China’s major imported energy; thus, this paper takes the Crude Oil Market Concentration Risk (COMER COMCR) and Oil Market Liquidity (OML, see ) to reflect the influence of geopolitics on energy security:
where is the political risk coefficient of the importing country, and represents ‘s crude oil import share in China’s total crude oil supply. For , only the top six countries of China’s crude oil imports are included. For , the value of adopts a method published by the IEA, which is determined as a normalized weighted average of the Political Stability, Absence of Violence/Terrorism index and the Regulatory Quality Index, which was published in the 2016 Worldwide Governance Indicators Report by the World Bank [63] (see Table A1 and Table A2). Since a high score indicates a high energy-security risk, is a negative indicator. The crude oil import data used for this indicator comes from China Petrochemical Corporation’s database [64,65,66].
: Oil Market Liquidity
OML is a positive indicator, because a higher OML is conducive to reducing the risk of supply market concentration and improving energy security. World oil exports and China’s oil imports data are taken from the 2016 “BP Statistical Review of World Energy [60]”.
3.3. Affordability ()
Affordability reflects the possibilities of energy supply economically. The “provision of adequate and uninterrupted supply at reasonable prices” [11] is the earliest and primary meaning of energy security. The prices refer to both those of domestic energy and imported energy. In addition, personal paying ability also has a direct impact on energy affordability.
: Domestic fuel price fluctuation ratio
The domestic fuel price fluctuation ratio is calculated by the retail price index of fuel commodities from the database of the NBS (2005–2015) [59]. This paper regards the ratio in last year as the ratio of the base year. The greater the fluctuation of the domestic fuel price fluctuation ratio, the lower the stability of energy security, so it is a negative indicator.
: Crude oil price fluctuation ratio
Crude oil price is defined as average value of the Dubai, Brent, Nigerian Forcados, and West Texas Intermediate crude oil prices published on 2016 “BP Statistical Review of World Energy [60]”. Then, year-on-year growth is calculated. The oil price fluctuation ratio has a negative correlation with the stability of energy security, which is a negative indicator.
: GDP per capita
GDP per capita can reflect an individual’s ability to pay. The GDP per capita is a standard that measures the living standards of people in all countries. The higher the per-capita GDP, the stronger the ability to resist the negative impact of rising energy prices. GDP is the actual gross domestic product (GDP) at constant 2005 prices, as measured by the GDP and GDP index in the China Statistical Yearbook from 2005 to 2016 [59].
3.4. Acceptability ()
Acceptability reflects the impact of energy production and utilization on the economy and the environment. The main consideration is the relationship between energy, the economy, and the environment. With the increase of global extreme weather and the decline of air quality, people pay more attention to environmental issues. Energy structure changes from high carbon to low carbon, and energy utilization changes from low efficiency to high efficiency.
: Share of non-fossil energy consumption
Share of non-fossil energy consumption is the ratio of non-fossil energy consumption to TPEC, where TPEC represents total primary energy consumption. The development of non-fossil energy can enhance the energy-supply capacity and improve the safety and sustainability of the energy system, so it is a positive indicator. Non-fossil energy consumption data is taken from the database of the NBS [59].
: Energy intensity
Energy intensity has been widely used in energy security evaluation, and is equal to the ratio of TPEC to GDP. The decline in energy intensity indicates an increase in energy efficiency and has a positive effect on energy security, so it is a negative indicator.
: Carbon emission intensity
The development of the low-carbon economy is the consensus of all of the countries in the world today. Both from economic and ecological perspectives, the decline in carbon emission intensity is a sign of better energy security performance; thus, carbon emission intensity is a negative indicator. In the paper, CO2 emissions are considered to be entirely caused by energy consumption; the data is taken from the 2016 “BP Statistical Review of World Energy [60]”.
3.5. Develop-Ability ()
Develop-ability reflects the sustainable development capacity of the energy system in a low-carbon, clean, optimized mode, and is the most important performance of energy sustainability. Energy security condition reflects a past fait accompli, while energy security capacity is the foundation and necessary guarantee for future safety.
: TPEC per capita
TPEC per capita is the ratio of TPEC to the average population. Although China’s total energy consumption is large, it has a large population. Therefore, the more accurate index of energy consumption per capita is used to reflect individual energy consumption levels. The raise in TPEC will increase the risk of energy security, so it is a negative indicator.
: Carbon emission per unit energy consumption
Carbon emission per unit energy consumption is the ratio of emissions to TPEC. It reflects the relationship between energy structure and carbon emissions through the consumption of oil, gas, and coal for combustion, being a negative indicator.
: Energy diversification index
The Shannon–Weiner Index (SWI) is used to measure the diversification of energy consumption:
where represents the share of coal, oil, natural gas, and primary electricity power consumption in relation to total energy consumption. Since the diversification of energy consumption can reduce the vulnerability and insecurity of excessive dependence on an energy source, the energy diversification index is a positive indicator. Since the index framework of China’s Sustainable Energy Security is based on the Energy Sustainability Index by the WEC [57], therefore a column has been added in Table 1 to distinguish between CSES and the Energy Sustainability Index. “Common” represents a common indicator of both.
4. CSES Evaluation Modeling
4.1. Data Processing
Our study uses economic data, energy data, environmental data, and demographic data during 2005–2014. GDP data is the real value based on the 2005 GDP price index, and the unit is 100 million RMB. The unit for investment in the fixed assets of the energy industry and the total investment in fixed assets is 100 million RMB. The total primary energy production, total primary energy consumption, and the production and consumption of each energy type are based on a unit of 10,000 tons standard coals. China’s oil, crude oil imports, and the world’s oil exports are measured in oil equivalent units: 10,000 tons. Crude oil prices published by the “BP Statistical Review of World Energy [60]” are in USD/barrel. The international unit of CO2 emissions is one million tons, and this paper also uses one million tons as the unit for the purpose of dimensional unity. The unit for the population is 10,000. The energy reserve-to-production ratio, the retail price index of fuel commodities, and the political risk coefficient all are the relative number without a unit.
The raw values of each indicator were calculated according to the min–max method [67] (see Table A1). The min–max method is a commonly used method in the field of multiple attribute decision-making. This method takes the positive-type index as the evaluation direction, and deals with the negative-type index to make the indicators of different types play a consistent and similar role in the evaluation. The normalized values of each indicator are obtained through normalization processing (see Table 2). The normalization processing is as follows:
① Normalization equation of positive-type indicators:
② Normalization equation of negative-type indicators:
The min–max method is applied here; thus, the normalized value is scaled from 0 to1.
4.2. CSES Evaluation Modeling
The entropy weighting method is a common objective weighting method. It reflects the importance of indicators by calculating the difference between the numerical values of the objective indicators. The greater difference, the larger the weight, and vice versa. The entropy can accurately reflect the utility value of the indicator’s information to determine the weights, and the weights obtained by entropy have a higher reliability and accuracy than by a subjective weighting method. “Technique for Order Preference by Similarity to an Ideal Solution (TOPSIS)” is widely applied for decision-making in the multi-objective decision analysis linear programming. TOPSIS is a distance comprehensive evaluation method to evaluate, prioritize, and select the best solution in a set of discrete decision variables with a limited number of options, and it often applies the objective weights that are obtained by the entropy. It uses the relative distance as the evaluation standard, through calculating the relative distance of the evaluation value to the negative ideal solution. In this paper, the entropy weight method and the TOPSIS method are combined to establish the Entropy–Weight TOPSIS evaluation model. Its specific steps are as follows:
(1) Construct standardization decision matrix
The raw data (see Table A3) are processed by the normalization method, and the standardization decision matrix of each dimension is obtained and marked as .
(2) Calculate the weight of indicators
For each indicator in the same dimension, according to the entropy weighting method, it can be obtained that the weight set of dimension as follows:
where:
represents the entropy of indicator j. With , is the proportion of samples in time t in the j indicator. The information entropy represents the disorder degree of information, and the greater the information entropy, the smaller the contribution of the attribute index to the energy security evaluation. On the contrary, the greater the contribution will be.
(3) Form the weighted standardization decision matrix
(4) Calculate the ideal solution
The positive ideal solution () is the optimal value of an indicator; conversely, it is the negative ideal solution (). Specifically, Equation (9) is as follows:
(5) Calculate the distance
The calculation employs Euclidean distance:
(6) Calculate the approach degree
The approach degree value is in the range [0, 1]. The greater approach degree, the higher the CSES level. When the approach degree equals 1, the CSES level reaches its highest levels. On the contrary, when the approach degree reaches 0, the CSES is at its lowest level. According to the approach degree, the CSES level can be judged, see Equation (12):
5. Empirical Analysis and Discussion
According to the CSES model established in Section 4, the approach degree of sustainable energy security and the scores of the five dimensions can be calculated from 2005 to 2015 in China. The difference and change in the score of the five dimensions over the years reflect the situation and changing trends in China’s sustainable energy security.
5.1. Empirical Results of CSES
(1) Approach degree of dimensions
The weights of each indicator are calculated by Equation (6), and the ideal solutions are calculated by Equation (9), as shown in Table 3. The Euclidean distance of each indicator from the ideal solution is calculated by Equations (10) and (11). According to Equation (12), the approach degrees of dimensions are calculated, as shown in Table 4.
(2) CSES level
The approach degrees of dimensions are taken as the raw data to assess the target CSES level. That is, the standardization decision matrix of CSES is , is the normalized value of . The weight of each dimension is calculated according to Equation (6), with the same as above. The positive ideal solution and negative ideal solution are calculated by Equation (9). represents the distance between each dimension sample and the positive ideal solution. represents the distance between each dimension sample and the negative ideal solution. The approach degree of CSES in every year during 2005–2015, namely the CSES level, was calculated by Equation (12), as shown in Table 5.
5.2. Dimensional SES Analysis
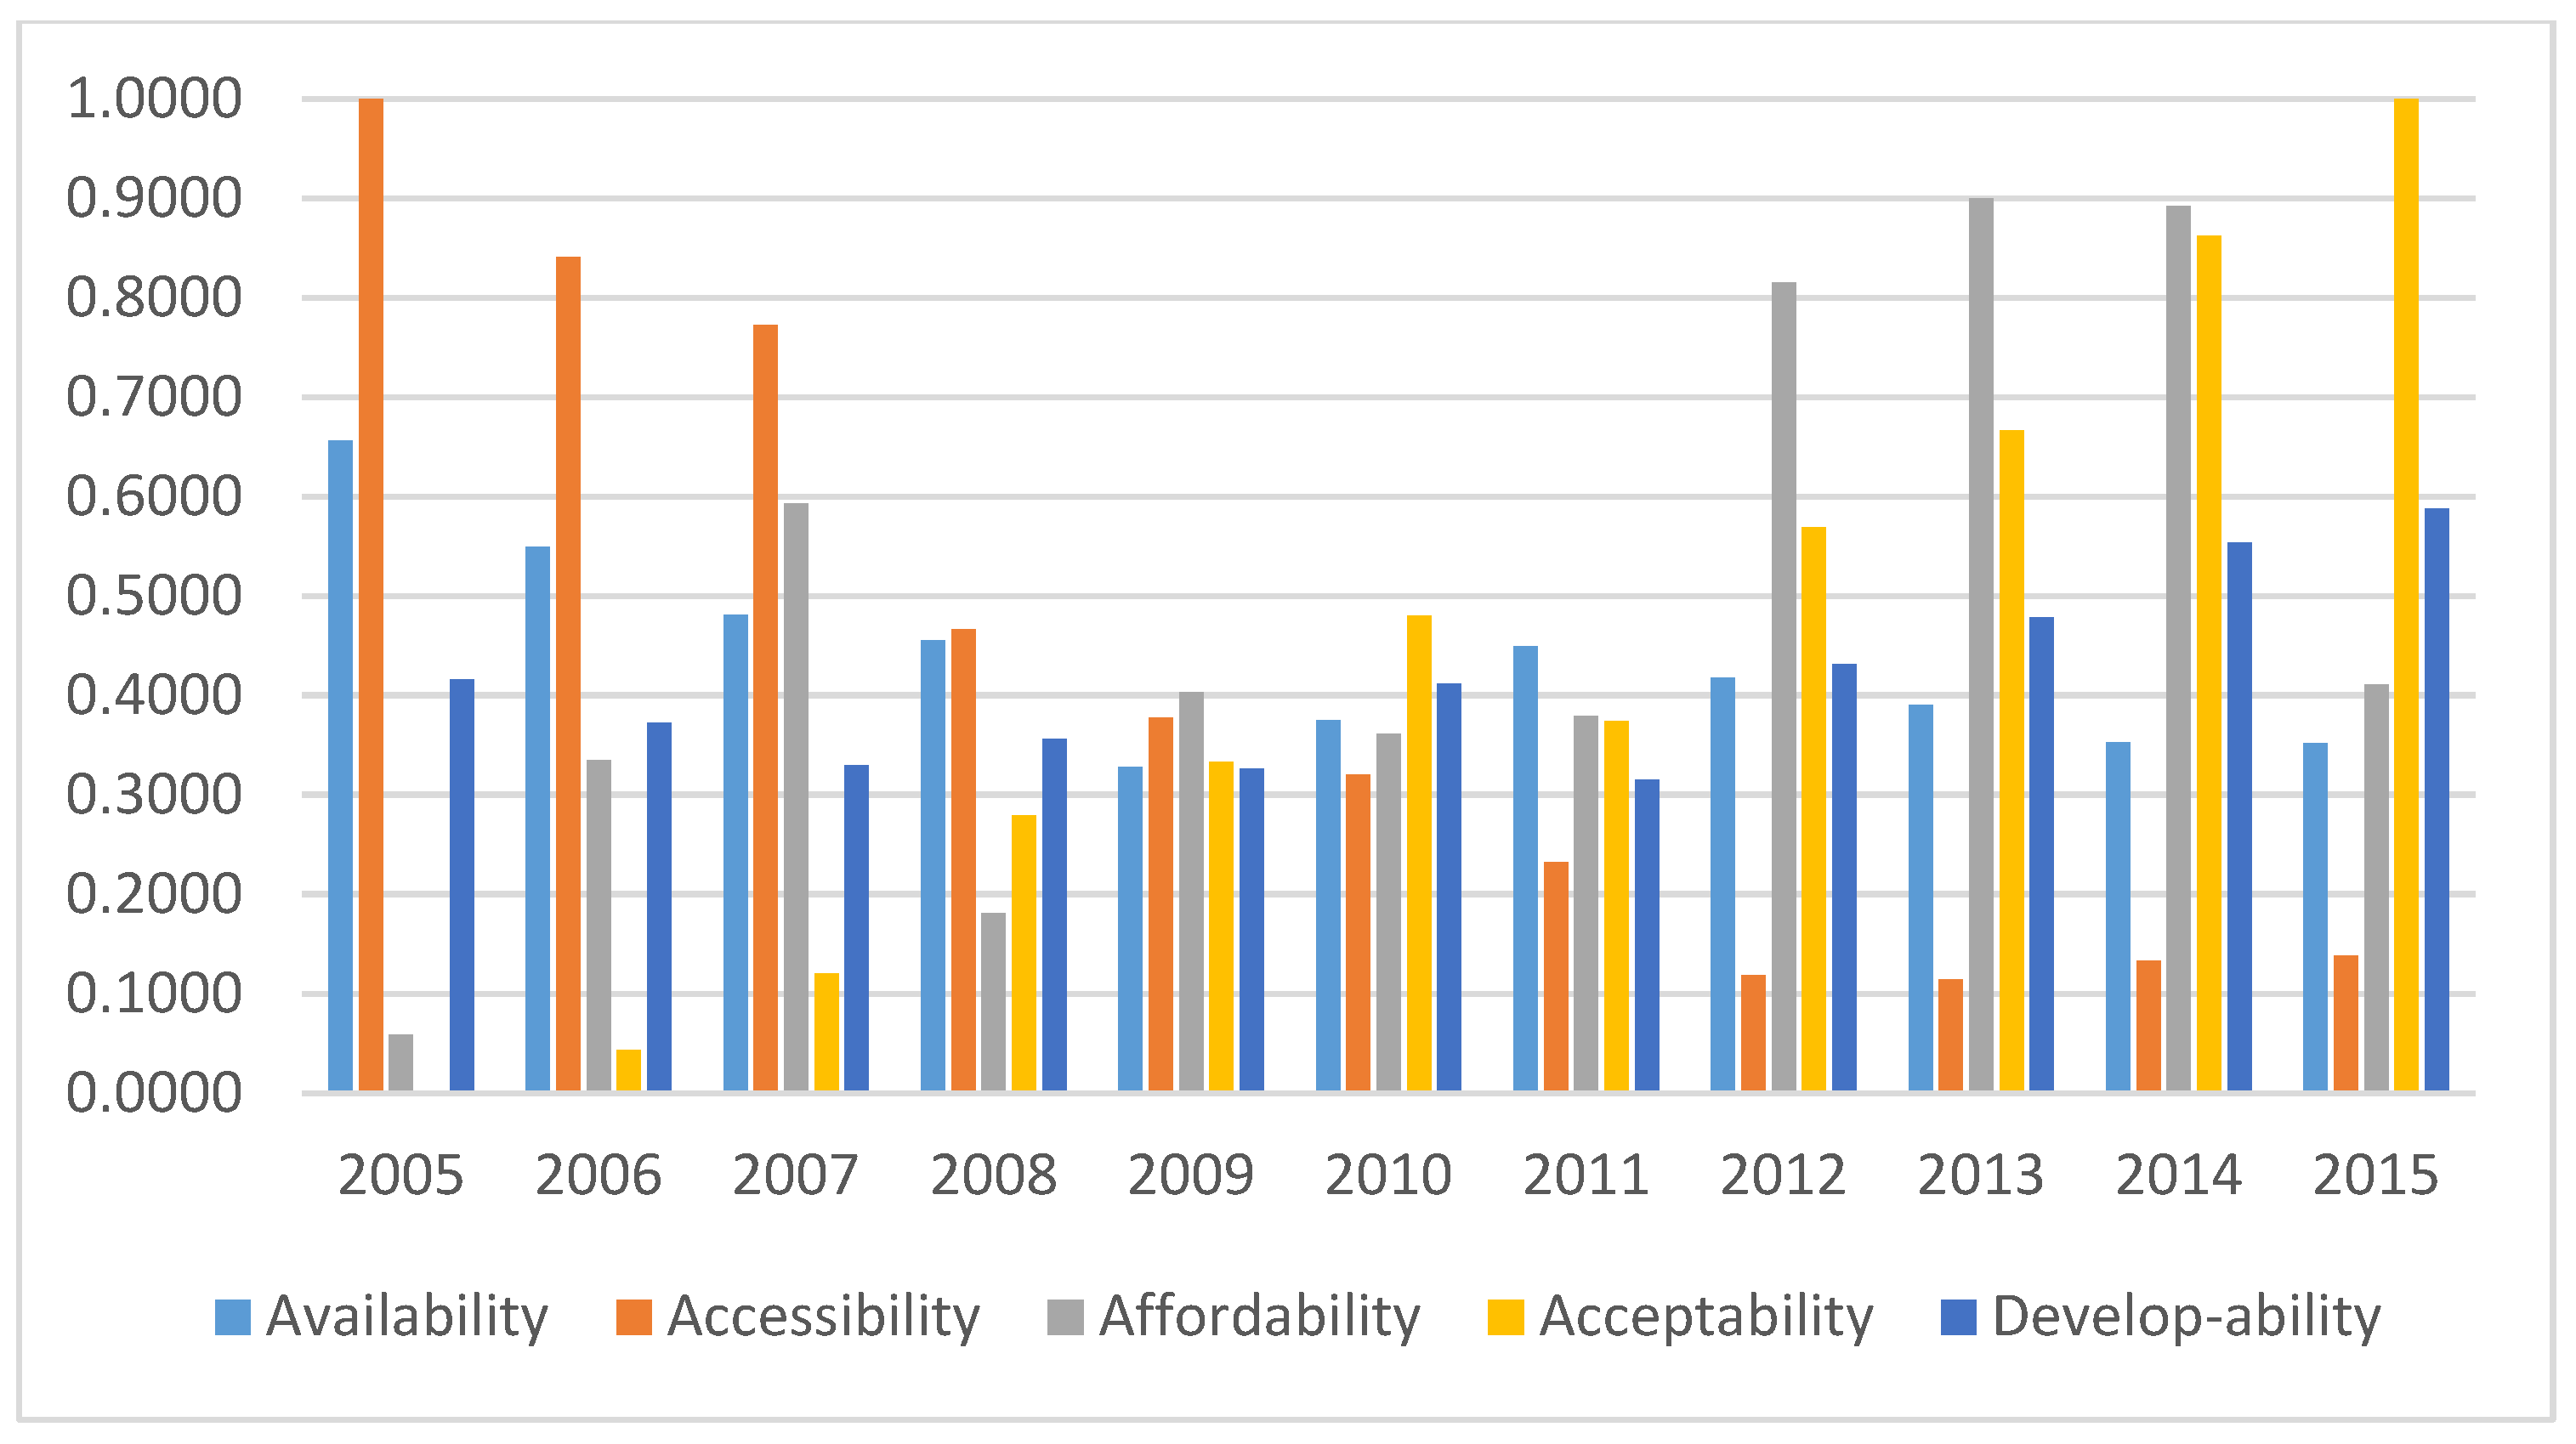
According to the above evaluation model, the five dimensions’ scores from 2005 to 2014 were measured, and the results are shown in Figure 1. The weights of availability and accessibility are relatively large, which indicates that the energy supply security has a great influence on the sustainable energy security.
(1) Availability: Taking the years of 2009 and 2011 as the demarcations, fluctuations in energy availability exhibit three stage characteristics during the period of 2005–2015. From 2005 to 2009, energy availability declined year by year. During 2009–2011, it rose continuously. Between 2011–2015, it declined again, but slowly. The decline of the first stage is due to the TPEP per capita growth rate being lower than the decline rate of the energy reserve-to-production ratio, and the weight of the energy reserve-to-production ratio being significantly higher than that of the TPEP per capita. The rise of the second stage is because of the steady rising of TPEP per capita and the energy self-sufficiency rate, and the decline rate of energy reserve-to-production ratio has been effectively restrained. The decline of the third phase is due to the energy self-sufficiency rate in 2011 showing a clear downward trend. From the scientific point of view, since the energy reserve-to-production ratio constantly decreased, and the permanent growth of the energy production and energy production per capita are difficult to maintain, if measures are not taken, China’s energy availability may develop in the negative direction. Consequently, actively developing alternative energy is imperative.
(2) Accessibility: During the evaluation period, energy accessibility presented a fluctuated downward trend. The declining share of fixed assets investment in energy year-by-year is the main reason leading to the negative performance of energy supply. External energy accessibility is affected by geopolitics, and geopolitical risks are increasingly prominent as indicated by the Oil Market Concentration Risk indicator and Oil Market Liquidity indicators. On the whole, China’s energy accessibility has shown a significant decline, to which special attention needs to be paid.
(3) Affordability: The volatility of affordability is high, mainly because the fluctuation and trend of domestic fuel price and international crude oil price cannot be determined. The affordability score was only 0.1809 in 2008; that was the lowest level during the study period, which was on account of the significantly increased domestic fuel price and international crude oil price in 2008 compared with 2007. During the period of 2009–2011, the affordability score remained in the warning status, fluctuating around 0.4000. In 2012, the affordability improved significantly, as the fluctuation in energy price was small, and GDP per capita showed an increase. Further, during the period between 2012–2014, the affordability score was maintained above 0.8000. However, the affordability score declined sharply in 2015 due to the crude oil price falling sharply coupled with large fluctuation in domestic fuel price. The good news is that GDP per capita has risen steadily, personal ability to pay has improved, and the country’s ability to deal with the risk of energy price fluctuations has been also improved; hence, the performance of affordability is getting better and better.
(4) Acceptability: Energy acceptability generally shows an upward trend. The significant increase in acceptability is due to the effective implementation of China’s energy policy. The development of clean energy has made China’s non-fossil energy consumption share increase steadily. With the gradual increase of research and development (R&D) investment and the use of new technology in the production process, China’s energy intensity has declined year by year. The implementation of the emission reduction policy has effectively controlled greenhouse gas emissions, and the acceptability of energy development has been significantly improved. There are dramatic advances in acceptability based on the above reasons. A sudden decline in acceptability showed in 2011 because of the remarkable decrease in the share of non-fossil energy consumption from 9.4% in 2010 to 8.4% in 2011, and a slight decline in carbon emission intensity resulted from the decline in the share of non-fossil energy consumption.
(5) Develop-ability: The harmonious development of energy, the economy, and the environment is one of the main objectives of China’s energy security. During the evaluation period, the diversity of energy consumption increased, and carbon emissions per unit of energy consumption reduced because of energy structure adjustment and optimization; accordingly, China’s energy develop-ability maintained upward trend on the whole. However, there was a sudden drop in 2011. The main reason is that the diversity of energy consumption in 2011 decreased compared with 2010, and the carbon emissions per unit of energy consumption increased by a certain extent, yet carbon emissions per unit of energy consumption presented a downtrend since 2006. Obviously, the diversity of energy consumption has an important contribution to the energy develop-ability.
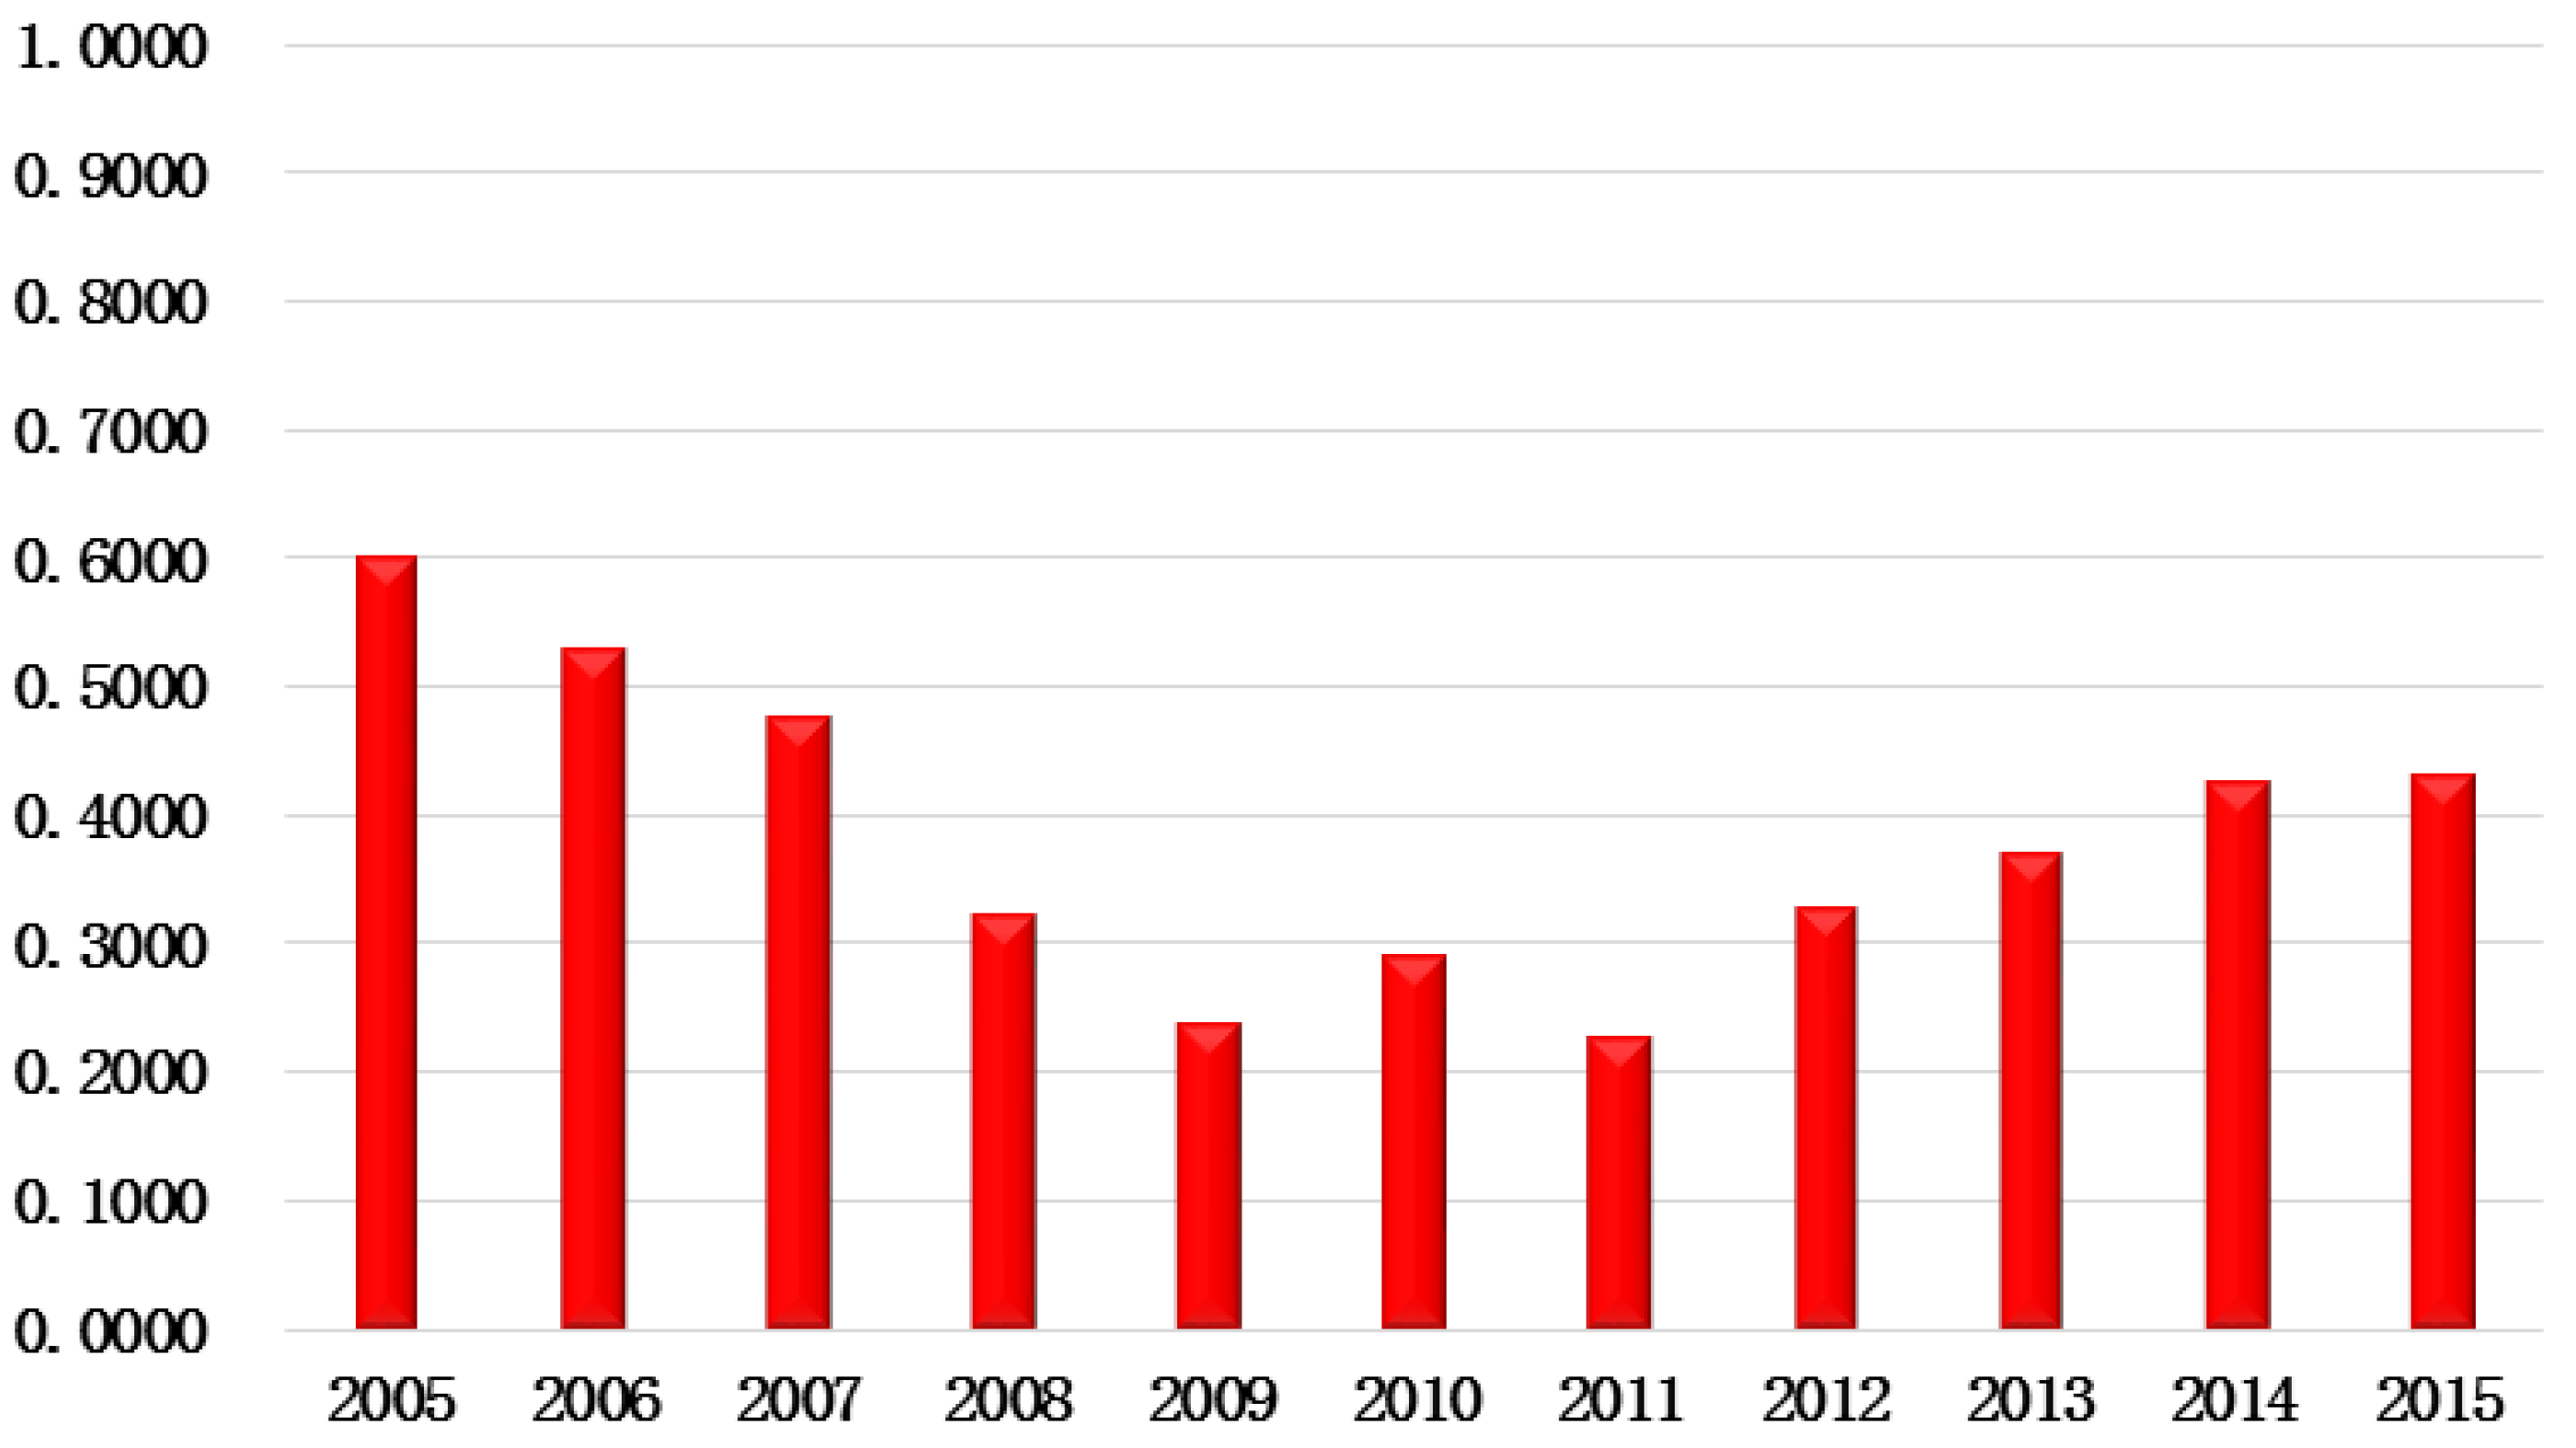
5.3. CSES Analysis
The changed trend in CSES during 2005–2015 is shown in Figure 2. The k-means clustering analysis method [68] is used to classify the CSES into three levels: danger, warning, and safety. Demarcation lines are 0.4276 and 0.5668; namely, China’s SES warning boundary is 0.4276, and its safety limit is 0.5668. China’s SES classification can be seen in Table 6.
As depicted in Figure 2, before 2010 and after 2010, both CSES levels in two periods presented downward trends, and then upward trends. Further, CSES levels increased continuously, although they have been in a warning state since 2011. CSES level fell by 28% in 2015 compared with 2005. Thus, China’s sustainable energy security situation is very grim.
Since 2005, China has attached great importance to environmental protection and energy security, and formulated a series of policies and development plans that are conducive to improving national energy security. In 2005, the first “Renewable Energy Utilization Law” [69] was made. Then, in 2006, in order to promote the rational use of renewable energy, the National Development and Reform Commission and other relevant departments formulated the “Implementation Plan for Energy Conservation Actions of Thousand Enterprises” [70]. In 2007, the National Development and Reform Commission issued the “Renewable Energy Medium-to-Long Development Plan” [71] to improve the policy environment and market mechanism of renewable energy. In view of the above polices, it can be seen from the acceptability and develop-ability that these published policies have had a certain role in improving energy security. However, during the period of 2005–2009, the availability and accessibility declined continuously. Under the combined effect, CSES level showed a downward trend from 2005 to 2009. In 2009, CSES level fell to 0.2376, because the synthetic effect of uncertain economic situation caused by the United States (U.S.) subprime mortgage crisis in 2008, weak crude oil demand, and declined crude oil price. After the World Climate Conference in Copenhagen in 2009, China set the 2020 carbon intensity target into its long-term development plan, and vigorously promoted carbon emission reduction measures. Thus, acceptability was rapidly improved; for example, CSES level in 2010 was 44% higher than in 2009. At the same time, the develop-ability also showed a big rise in 2010, so CSES level appeared to rise in 2010.
The “12th Five-Year Plan” [72] for consistently improving CSES level focused on promoting energy production, utilization reform, speeding up the energy intensity declining pace, and accelerating the adjustment of the energy structure. However, in the early period of the 12th FYP, the effect of the 12th FYP did not appear. Compared with 2010, the level of CSES declined in 2011; the reason is that the score of availability reduced as a result of the rising geopolitical risk, and the scores of acceptability and develop-ability also decreased in 2011. On the account of the issued “12th Five-Year Plan on Renewable Energy Development” [73] in 2012, which was aimed at further promoting the comprehensive development and utilization of renewable energy, the acceptability and the develop-ability showed a rapid upward trend, and the availability and accessibility almost remained constant since 2012. In particular, it should be noted that during the period of 2012–2014, the fluctuation of retail price of fuel commodities and international crude oil price was small, and the energy affordability obtained the highest score in the evaluation period. However, in 2015, the large fluctuation in energy prices directly led to a significant decline in the score of the affordability. As a result, the CSES level in 2015 was not higher than in 2014. During the “12th FYP” period, China’s SES developing trend was getting better, showing an upward trend year after year. It should not be neglected that the CSES level during this period is still in a state of alert, so it is necessary to continuously strengthen relevant safeguard measures.
From the above analysis, it can be seen that China’s sustainable energy security is facing more and more risks, the changes in reaction to the accident is large, the stability of energy security is easily affected, and China’s SES situation is not optimistic. In addition, energy policy has a certain effect on improving energy security, but it has a lag, since it will not immediately work. Since most of the measures are administrative orders, this results in significant short-term effects and lacks long-term effects. In order to ensure national energy security, China is promoting an energy revolution, and the 13th FYP energy plan [74] will place the development of clean energy and ensuring energy security as priority. As a result, CSES level is not expected to significantly deteriorate during the 13th FYP.
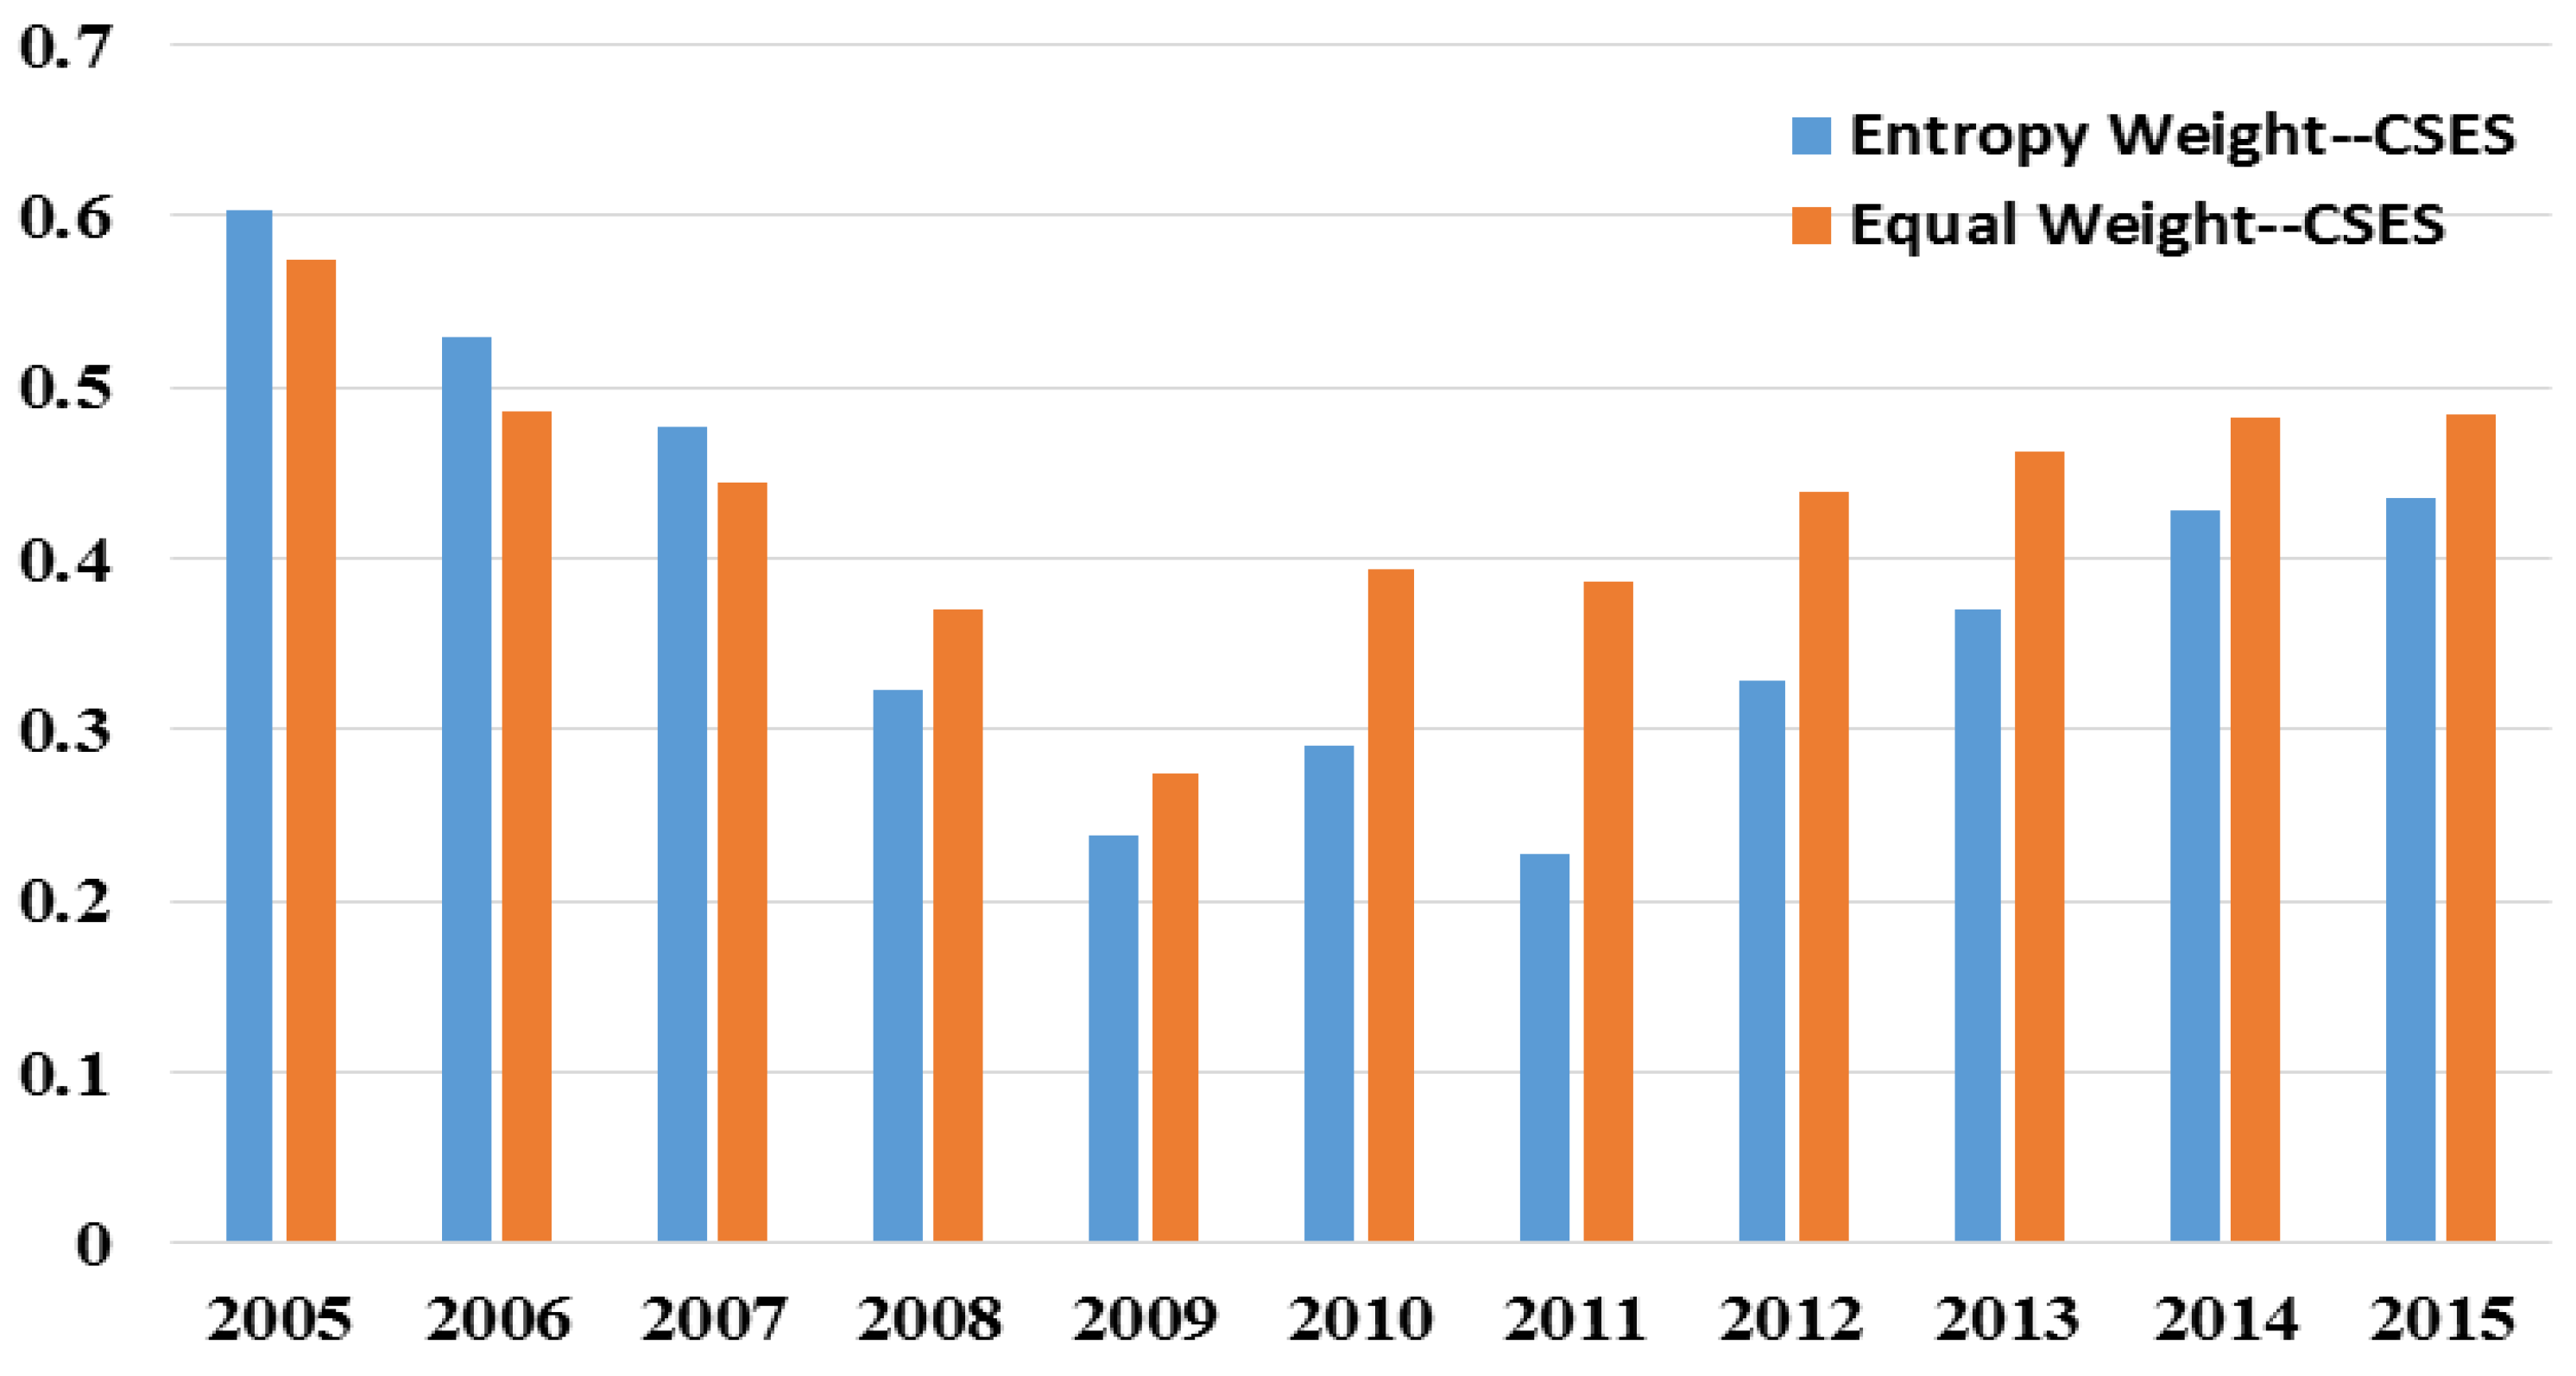
5.4. Sensitive Analysis
An alternative case where equal weights are assigned to each indicator within each dimension was considered. The equal-weight method is one of the most popular weighting methods used to evaluate energy security. The results are shown in Figure 3.
It can be seen that during 2005–2015, CSES has the same changing trend under both the entropy-weight model and the equal-weight model. Between them, during 2005–2009, CSES level is almost the same. While in 2010–2015, CSES level experienced a boost when the equal-weight model was adopted compared to an entropy-weight model, which can be attributed to the great change of the weights of the indicators within an acceptability dimension. In the acceptability dimension, the weight determined by the entropy-weight method gives more attention to the share of non-fossil energy. However, the reductions of energy intensity and carbon intensity are inseparable from the contribution of non-fossil energy, and national developing planning also attaches great emphasis to the development of non-fossil energy, so the entropy-weight method is more suitable for representing a realistic situation of China’s development. Therefore, it is known from the analysis that the entropy TOPSIS method has a good applicability in the evaluation of China’s sustainable energy security.
6. Conclusions
Against the background of global development of the low-carbon economy and China entering into a new era, this paper studies sustainable energy security in China. Firstly, five dimensions of energy security were put forward, namely: availability, accessibility, affordability, acceptability, and develop-ability. Then, China’s Sustainable Energy Security (CSES) index was constructed by fully taking policy targets and planning indicators into account. Finally, the Entropy–Weight TOPSIS method was used to establish the evaluation model, and the empirical study on CSES was carried out from 2005 to 2015. On the previous basis, from the perspective of policy evolution, the analysis of CSES developing trends and the effect of indicators were made. The results showed the following. (1) In 2005–2010 and 2010–2015, both CSES levels in these two periods presented a downward trend and then an upward trend, while CSES level decreased by 28% in 2015 compared with 2005 due to the decline of availability and accessibility. The main reason is that all of the indicators in the dimensions of availability and accessibility have worsened, except for TPEP per capita. From the view of availability, the energy reserve-to-production ratio took the largest weight (Table 3). However, due to the continuous exploitation of fossil energy for many years, China’s energy reserve-to-production ratio had fallen from 46.91% in 2005 to 28.89% in 2015. From the view of accessibility, with the continuous rise of energy imports in recent years, oil market liquidity has dropped significantly. (2) From 2005 to 2015, China had relatively high scores in acceptability and develop-ability; however, the availability showed a continuous decline, which demonstrates a need for more regulation.
In the current situation of China’s energy security, the relevant government departments should be advised to take the following measures for maintaining the goals of energy security and energy sustainability. (1) Continuing to optimize the energy structure, so as to maintain energy diversity and enhance energy sustainability. (2) Adhering to energy-saving emission reduction policies, strictly controlling the total amount of energy consumption, and actively developing clean energy, so as to strengthen the energy self-sufficiency ratio. (3) Cross energy cultural differences, and carry out international cooperation and energy diplomacy, so as to improve the ability to deal with geopolitical risks. (4) Improve the transport and consumption capacity of the clean energy, accelerate the establishment of delivery pipes, and enhance the unified control and management level of the grid so as to ensure that the power produced by clean energy will be delivered first. The development priority of regional clean energy should be determined according to local conditions. Distributed power generation should be developed vigorously, particularly in eastern regions where electricity is intensive with high electrical load. Moreover, replacements of electricity should be expanded to guarantee the sustainability of power supply.
Author Contributions
D.F. made great contributions to the conception of the study; Q.Y. and S.S. analyzed the data and wrote the manuscript; D.F. and Q.Y. helped to conduct the analysis with constructive opinions.
Acknowledgments
This research was financially supported by the National Natural Science Foundation of China (Grant No. 71725007, 71673210, 71774128, 91647119). The authors would like to thank the funded project for providing material for this research. We would also like to thank our anonymous reviewer for the valuable comments in developing this article.
Conflicts of Interest
The authors declare no conflicts of interest.
Appendix A

Table A1.
Raw Data of Political risk coefficient.
| Country Name | Indicator Name | 2005 | 2006 | 2007 | 2008 | 2009 | 2010 | 2011 | 2012 | 2013 | 2014 | 2015 |
|---|---|---|---|---|---|---|---|---|---|---|---|---|
| Saudi Arabia | Political Stability and Absence of Violence/Terrorism: Estimate | −0.25434 | −0.53787 | −0.50308 | −0.3729 | −0.50737 | −0.22437 | −0.46032 | −0.45108 | −0.40836 | −0.28137 | −0.54438 |
| Saudi Arabia | Political Stability and Absence of Violence/Terrorism: Number of Sources | 5 | 6 | 7 | 7 | 7 | 7 | 6 | 7 | 7 | 7 | 7 |
| Saudi Arabia | Regulatory Quality: Estimate | 0.110043 | −0.06067 | 0.042089 | 0.147119 | 0.179639 | 0.182917 | 0.028848 | 0.11283 | 0.08768 | −0.00658 | 0.030352 |
| Saudi Arabia | Regulatory Quality: Number of Sources | 5 | 6 | 7 | 7 | 7 | 7 | 6 | 7 | 7 | 7 | 7 |
| Saudi Arabia | Political risk coefficient | −0.07215 | −0.29927 | −0.23049 | −0.11289 | −0.16386 | −0.02073 | −0.21574 | −0.16913 | −0.16034 | −0.14397 | −0.25701 |
| Angola | Political Stability and Absence of Violence/Terrorism: Estimate | −0.89266 | −0.54058 | −0.69599 | −0.34998 | −0.3698 | −0.21676 | −0.36038 | −0.38092 | −0.38545 | −0.35117 | −0.59051 |
| Angola | Political Stability and Absence of Violence/Terrorism: Number of Sources | 5 | 6 | 5 | 5 | 6 | 7 | 7 | 6 | 7 | 7 | 6 |
| Angola | Regulatory Quality: Estimate | −1.28515 | −1.12009 | −1.02788 | −1.06312 | −1.01885 | −1.01777 | −1.07781 | −0.96191 | −1.04747 | −0.98259 | −0.90826 |
| Angola | Regulatory Quality: Number of Sources | 8 | 9 | 8 | 8 | 9 | 10 | 10 | 9 | 10 | 10 | 9 |
| Angola | Political risk coefficient | −1.1342 | −0.88828 | −0.90023 | −0.78884 | −0.75923 | −0.68794 | −0.7824 | −0.72952 | −0.77488 | −0.72259 | −0.78116 |
| Russian Federation | Political Stability and Absence of Violence/Terrorism: Estimate | −1.24998 | −0.90409 | −0.85799 | −0.76338 | −0.95118 | −0.9116 | −0.98772 | −0.82843 | −0.73596 | −0.94148 | −1.04905 |
| Russian Federation | Political Stability and Absence of Violence/Terrorism: Number of Sources | 7 | 8 | 8 | 8 | 8 | 8 | 9 | 9 | 9 | 9 | 9 |
| Russian Federation | Regulatory Quality: Estimate | −0.17498 | −0.41155 | −0.29228 | −0.39461 | −0.35306 | −0.36565 | −0.35848 | −0.34799 | −0.35948 | −0.40471 | −0.5224 |
| Russian Federation | Regulatory Quality: Number of Sources | 10 | 11 | 11 | 11 | 11 | 11 | 12 | 12 | 12 | 12 | 12 |
| Russian Federation | Political risk coefficient | −0.61763 | −0.61893 | −0.53048 | −0.54988 | −0.6049 | −0.59552 | −0.62815 | −0.55389 | −0.52083 | −0.63476 | −0.74811 |
| Iran, Islamic Rep. | Political Stability and Absence of Violence/Terrorism: Estimate | −0.81358 | −1.07868 | −0.98513 | −0.9789 | −1.55215 | −1.61736 | −1.4204 | −1.32779 | −1.25696 | −0.90568 | −0.90521 |
| Iran, Islamic Rep. | Political Stability and Absence of Violence/Terrorism: Number of Sources | 5 | 6 | 6 | 6 | 6 | 7 | 8 | 8 | 8 | 8 | 8 |
| Iran, Islamic Rep. | Regulatory Quality: Estimate | −1.28131 | −1.48396 | −1.61609 | −1.6315 | −1.7303 | −1.69539 | −1.5069 | −1.41459 | −1.48833 | −1.4626 | −1.28039 |
| Iran, Islamic Rep. | Regulatory Quality: Number of Sources | 7 | 8 | 8 | 8 | 7 | 7 | 8 | 8 | 8 | 8 | 9 |
| Iran, Islamic Rep. | Political risk coefficient | −1.08642 | −1.31027 | −1.34568 | −1.35181 | −1.64808 | −1.65637 | −1.46365 | −1.37119 | −1.37264 | −1.18414 | −1.10384 |
| Oman | Political Stability and Absence of Violence/Terrorism: Estimate | 0.916437 | 0.814122 | 0.902152 | 0.916323 | 0.799265 | 0.585745 | 0.416818 | 0.450662 | 0.449721 | 0.706509 | 0.694646 |
| Oman | Political Stability and Absence of Violence/Terrorism: Number of Sources | 5 | 5 | 6 | 6 | 7 | 7 | 7 | 7 | 7 | 7 | 7 |
| Oman | Regulatory Quality: Estimate | 0.529264 | 0.586188 | 0.624323 | 0.711747 | 0.536788 | 0.458108 | 0.335823 | 0.483197 | 0.481811 | 0.689745 | 0.582221 |
| Oman | Regulatory Quality: Number of Sources | 5 | 5 | 6 | 6 | 7 | 7 | 7 | 7 | 7 | 7 | 7 |
| Oman | Political risk coefficient | 0.72285 | 0.700155 | 0.763238 | 0.814035 | 0.668027 | 0.521927 | 0.376321 | 0.46693 | 0.465766 | 0.698127 | 0.638433 |
| Iraq | Political Stability and Absence of Violence/Terrorism: Estimate | −2.7179 | −2.81968 | −2.78831 | −2.47881 | −2.1857 | −2.2513 | −1.8392 | −1.93353 | −2.01934 | −2.48797 | −2.28699 |
| Iraq | Political Stability and Absence of Violence/Terrorism: Number of Sources | 5 | 5 | 5 | 5 | 4 | 5 | 5 | 6 | 6 | 6 | 6 |
| Iraq | Regulatory Quality: Estimate | −1.5079 | −1.40367 | −1.3234 | −1.14691 | −1.0061 | −1.05056 | −1.09238 | −1.2492 | −1.23853 | −1.24746 | −1.23289 |
| Iraq | Regulatory Quality: Number of Sources | 4 | 4 | 4 | 4 | 5 | 6 | 6 | 7 | 7 | 7 | 7 |
| Iraq | Political risk coefficient | −2.18012 | −2.19034 | −2.13724 | −1.88686 | −1.53037 | −1.59635 | −1.43185 | −1.56504 | −1.5989 | −1.82 | −1.7194 |
Note 1: Political Stability and Absence of Violence/Terrorism measures perceptions of the likelihood of political instability and/or politically-motivated violence, including terrorism. Estimate gives the country’s score on the aggregate indicator, in units of a standard normal distribution, i.e., ranging from approximately −2.5 to 2.5. Rule of Law captures perceptions of the extent to which agents have confidence in and abide by the rules of society, and in particular the quality of contract enforcement, property rights, the police, and the courts, as well as the likelihood of crime and violence. Estimate gives the country’s score on the aggregate indicator, in units of a standard normal distribution, i.e., ranging from approximately −2.5 to 2.5.
Table A2.
Normalized Value of Political risk coefficient.
| Year | Saudi Arabia | Angola | Russian Federation | Iran, Islamic Rep. | Oman | Iraq |
|---|---|---|---|---|---|---|
| 2005 | 0.485570225 | 0.273161 | 0.376474 | 0.282715 | 0.64457 | 0.063976 |
| 2006 | 0.44014666 | 0.322343 | 0.376213 | 0.237947 | 0.640031 | 0.061932 |
| 2007 | 0.453901193 | 0.319954 | 0.393905 | 0.230864 | 0.652648 | 0.072552 |
| 2008 | 0.477421916 | 0.342232 | 0.390024 | 0.229638 | 0.662807 | 0.122629 |
| 2009 | 0.467227036 | 0.348153 | 0.379019 | 0.170384 | 0.633605 | 0.193927 |
| 2010 | 0.495854954 | 0.362411 | 0.380896 | 0.168725 | 0.604385 | 0.18073 |
| 2011 | 0.456852807 | 0.343521 | 0.37437 | 0.207269 | 0.575264 | 0.213631 |
| 2012 | 0.466174746 | 0.354097 | 0.389222 | 0.225763 | 0.593386 | 0.186991 |
| 2013 | 0.467931784 | 0.345025 | 0.395834 | 0.225471 | 0.593153 | 0.18022 |
| 2014 | 0.471205088 | 0.355481 | 0.373049 | 0.263171 | 0.639625 | 0.136 |
| 2015 | 0.448597316 | 0.343768 | 0.350378 | 0.279233 | 0.627687 | 0.15612 |
For example, Political risk coefficient r for Saudi Arabia in 2015, the equation is as follows:
where, −2.5 and 2.5 are the upper and lower limits of political risk coefficient referring to the Note 1.
Table A3.
Raw Data of Indicators.
| Indexs | ||||||||||||||||
|---|---|---|---|---|---|---|---|---|---|---|---|---|---|---|---|---|
| Year | ||||||||||||||||
| Unit | Ton | % | % | % | % | % | % | % | 10^4 RMB | % | Ton/10^4 RMB | Ton/10^4 RMB | Ton | - | - | |
| 2005 | 1.7568 | 46.9195 | 0.9022 | 0.1150 | 0.0057 | 14.7484 | 15.4000 | 0.4265 | 1.4368 | 7.4000 | 1.4060 | 3.2590 | 2.0048 | 2.3179 | 0.8232 | |
| 2006 | 1.8670 | 43.5458 | 0.8816 | 0.1075 | 0.0068 | 13.5128 | 12.4000 | 0.2016 | 1.6107 | 7.4000 | 1.3674 | 3.1770 | 2.1851 | 2.3235 | 0.8290 | |
| 2007 | 2.0045 | 40.5944 | 0.8773 | 0.0998 | 0.0071 | 13.2969 | 4.2000 | 0.1060 | 1.8297 | 7.5000 | 1.3017 | 3.0140 | 2.3632 | 2.3154 | 0.8338 | |
| 2008 | 2.0943 | 37.3873 | 0.8952 | 0.0946 | 0.0099 | 12.3866 | 16.0000 | 0.3684 | 1.9962 | 8.4000 | 1.2216 | 2.8011 | 2.4203 | 2.2931 | 0.8618 | |
| 2009 | 2.1490 | 34.7470 | 0.8821 | 0.0867 | 0.0100 | 10.2898 | 7.3000 | 0.3683 | 2.1739 | 8.5000 | 1.1706 | 2.6800 | 2.5249 | 2.2894 | 0.8626 | |
| 2010 | 2.3333 | 32.1202 | 0.9052 | 0.0859 | 0.0104 | 8.9423 | 12.3000 | 0.2808 | 2.3934 | 9.4000 | 1.1357 | 2.5502 | 2.6960 | 2.2455 | 0.9101 | |
| 2011 | 2.5308 | 30.6829 | 0.9242 | 0.0740 | 0.0105 | 8.1850 | 11.1000 | 0.3429 | 2.6088 | 8.4000 | 1.1130 | 2.5154 | 2.8795 | 2.2599 | 0.8978 | |
| 2012 | 2.5990 | 29.0269 | 0.9205 | 0.0681 | 0.0117 | 7.7050 | 2.9000 | 0.0046 | 2.7993 | 9.7000 | 1.0718 | 2.3749 | 2.9773 | 2.2159 | 0.9325 | |
| 2013 | 2.6432 | 29.0313 | 0.9103 | 0.0650 | 0.0116 | 8.0102 | 0.1000 | 0.0117 | 3.0008 | 10.2000 | 1.0307 | 2.2618 | 3.0715 | 2.1944 | 0.9564 | |
| 2014 | 2.6525 | 28.0133 | 0.9022 | 0.0616 | 0.0114 | 7.4783 | 0.8000 | 0.0788 | 3.2049 | 11.3000 | 0.9811 | 2.1119 | 3.1211 | 2.1525 | 0.9905 | |
| 2015 | 2.6400 | 28.8979 | 0.8992 | 0.0579 | 0.0105 | 5.8880 | 12.3000 | 0.4709 | 3.4100 | 12.0000 | 0.9268 | 1.9730 | 3.1359 | 2.1288 | 1.0164 | |
References
- Löschel, A.; Moslener, U.; Rübbelke, D.T.G. Indicators of energy security in industrialized countries. Energy Policy 2010, 38, 1665–1671. [Google Scholar] [CrossRef]
- Auping, W.L.; Pruyt, E.; Jong, S.D.; Kwakkel, J.H. The geopolitical impact of the shale revolution: Exploring consequences on energy prices and rentier states. Energy Policy 2016, 98, 390–399. [Google Scholar] [CrossRef]
- British Petroleum (BP). Statistical Review of World Energy 2015; BP: London, UK, 2015. [Google Scholar]
- Xu, X.; Xu, X.; Chen, Q.; Che, Y. The research on generalized regional “resource curse” in China’s new normal stage. Resour. Policy 2016, 49, 12–19. [Google Scholar] [CrossRef]
- Hubbert, M.K. Nuclear energy and the fossil fuel. In American Petroleum Institute Drilling & Production Practice; American Petroleum Institute: Washington, DC, USA, 1956. [Google Scholar]
- Zhang, K.; Dearing, J.A.; Tong, S.L.; Hughes, T.P. China’s Degraded Environment Enters a New Normal. Trends Ecol. Evol. 2016, 31, 175–177. [Google Scholar] [CrossRef] [PubMed]
- Chen, D.; Cheng, C.Y.; Urpelainen, J. Support for Renewable Energy in China: A Survey Experiment with Internet Users. J. Clean. Prod. 2015, 112, 3750–3758. [Google Scholar] [CrossRef]
- Narula, K. Is sustainable energy security of India increasing or decreasing? Int. J. Sustain. Energy 2014, 33, 1054–1075. [Google Scholar] [CrossRef]
- Willrich, M. Energy and World Politics; Simon and Schuster: New York, NY, USA, 1978. [Google Scholar]
- Dmese, D.A.; Jose, S.N. Energy and Security; Cambradge Mass Ballinges: Cambridge, UK, 1988; pp. 27–32. [Google Scholar]
- Daniel, Y. Energy security in the 1990s. For. Aff. 1988, 67, 110–132. [Google Scholar]
- Scheepers, M.; Seebregts, A.; de Jong, J.; Maters, H. EU standards for energy security of supply. Gas 2007, 52, 67–75. [Google Scholar]
- Australian Government Department of Resources Energy and Tourism (RET). National Energy Security Assessment 2011 of Australia; RET: Canberra, Australia, 2011. [Google Scholar]
- Cherp, A. Global Energy Assessment—Toward a Sustainable Future; Cambridge University Press and the International Institute for Applied Systems Analysis: Cambridge, UK; Laxenburg, Austria, 2012. [Google Scholar]
- Hughes, L.; Phillip, Y.L. The politics of energy. Ann. Rev. Political Sci. 2013, 16, 449–469. [Google Scholar] [CrossRef]
- International Energy Agency (IEA). Measuring Short-Term Energy Security; International Energy Agency: Paris, France, 2011; Available online: https://webstore.iea.org/measuring-short-term-energy-security (accessed on 22 May 2018).
- Narula, K.; Reddy, B.S. Three blind men and an elephant: The case of energy indices to measure energy security and energy sustainability. Energy 2015, 80, 148–158. [Google Scholar] [CrossRef]
- Cox, E. Assessing Energy Security in a Lowcarbon Context: The Case of Electricity in the UK; SPRU Working Paper Series; Science and Technology Policy Research; University of Sussex: Brighton, UK, 2016. [Google Scholar]
- Turton, H.; Barreto, L. Long-term security of energy supply and climate change. Energy Policy 2006, 34, 2232–2250. [Google Scholar] [CrossRef]
- Bollen, J.; Hers, S.; Zwaan, B.V.D. An integrated assessment of climate change, air pollution, and energy security policy. SSRN Electron. J. 2009, 38, 4021–4030. [Google Scholar] [CrossRef]
- Cherp, A.; Jewell, J.; Vinichenko, V.; Bauer, N.; de Cian, E. Global energy security under different climate policies, GDP growth rates and fossil resource availabilities. Clim. Chang. 2016, 136, 1–12. [Google Scholar] [CrossRef]
- Sovacool, B.K.; Mukherjee, I. Conceptualizing and measuring energy security: A synthesized approach. Energy 2011, 36, 5343–5355. [Google Scholar] [CrossRef]
- Muñoz, B.; García-Verdugo, J.; San-Martín, E. Quantifying the geopolitical dimension of energy risks: A tool for energy modelling and planning. Energy 2015, 82, 479–500. [Google Scholar] [CrossRef]
- Hughes, L. The four ‘R’s of energy security. Energy Policy 2009, 37, 2459–2461. [Google Scholar] [CrossRef]
- Intharak, N.; Julay, J.H.; Nakanishi, S.; Aponte, A.A. A Quest for Energy Security in the 21st Century; Asia Pacific Energy Research Centre: Tokyo, Japan, 2007. [Google Scholar]
- Kruyt, B.; van Vuuren, D.P.V.; de Vries, H.J.M.; Groenenberg, H. Indicators for energy security. Energy Policy 2009, 37, 2166–2181. [Google Scholar] [CrossRef]
- Sovacool, B.K. Assessing energy security performance in the Asia Pacific, 1990–2010. Renew. Sustain. Energy Rev. 2013, 17, 5846–5853. [Google Scholar] [CrossRef]
- Sovacool, B.K. An international assessment of energy security performance. Ecol. Econ. 2013, 88, 148–158. [Google Scholar] [CrossRef]
- Ang, B.W.; Choong, W.L.; Ng, T.S. Energy security: Definitions, dimensions and indexes. Renew. Sustain. Energy Rev. 2015, 42, 1077–1093. [Google Scholar] [CrossRef]
- Newiadomsky, C.; Seeliger, A. Security of energy supply: Will it stand the test of climate change—And what will it cost? Electr. Eng. 2016, 98, 385–393. [Google Scholar] [CrossRef]
- Lee, S.; Yoon, B.; Shin, J. Effects of Nuclear Energy on Sustainable Development and Energy Security: Sodium-Cooled Fast Reactor Case. Sustainability 2016, 8, 979. [Google Scholar] [CrossRef]
- Cho, S.; Kim, J. An optimization-based planning of investment strategies for a renewable energy supply system from biomass utilization. Korean J. Chem. Eng. 2016, 33, 2808–2819. [Google Scholar] [CrossRef]
- Mišík, M. On the way towards the Energy Union: Position of Austria, the Czech Republic and Slovakia towards external energy security integration. Energy 2016, 111, 68–81. [Google Scholar] [CrossRef]
- Goldthau, A.; Sovacool, B.K. The uniqueness of the energy security, justice, and governance problem. Energy Policy 2012, 41, 232–240. [Google Scholar] [CrossRef]
- Jewell, J.; Cherp, A.; Riahi, K. Energy security under de-carbonization scenarios: An assessment framework and evaluation under different technology and policy choices. Energy Policy 2014, 65, 743–760. [Google Scholar] [CrossRef]
- Månsson, A.; Johansson, B.; Nilsson, L.J. Assessing energy security: An overview of commonly used methodologies. Energy 2014, 73, 1–14. [Google Scholar] [CrossRef]
- Yao, L.; Chang, Y. Energy security in China: A quantitative analysis and policy implications. Energy Policy 2014, 67, 595–604. [Google Scholar] [CrossRef]
- McCollum, D.; Bauer, N.; Calvin, K.; Kitous, A.; Riahi, K. Fossil resource and energy security dynamics in conventional and carbon-constrained worlds. Clim. Chang. 2014, 123, 413–426. [Google Scholar] [CrossRef]
- Sovacool, B.K.; Saunders, H. Competing policy packages and the complexity of energy security. Energy 2014, 67, 641–651. [Google Scholar] [CrossRef]
- Ren, J.; Sovacool, B.K. Quantifying, measuring, and strategizing energy security: Determining the most meaningful dimensions and metrics. Energy 2014, 76, 838–849. [Google Scholar] [CrossRef]
- Gracceva, F.; Zeniewski, P. A systemic approach to assessing energy security in a low-carbon EU energy system. Appl. Energy 2014, 123, 335–348. [Google Scholar] [CrossRef]
- Ren, J.; Sovacool, B.K. Prioritizing low-carbon energy sources to enhance China’s energy security. Energy Convers. Manag. 2015, 92, 129–136. [Google Scholar] [CrossRef]
- Kumar, S. Assessment of renewables for energy security and carbon mitigation in Southeast Asia: The case of Indonesia and Thailand. Appl. Energy 2016, 163, 63–70. [Google Scholar] [CrossRef]
- Odgaard, O.; Delman, J. China’s energy security and its challenges towards 2035. Energy Policy 2014, 71, 107–117. [Google Scholar] [CrossRef]
- Gunatilake, H.; Roland-Holst, D.; Sugiyarto, G. Energy security for India: Biofuels, energy efficiency and food productivity. Energy Policy 2014, 65, 761–767. [Google Scholar] [CrossRef]
- Kiriyama, E.; Kajikawa, Y. A multilayered analysis of energy security research and the energy supply process. Appl. Energy 2014, 123, 415–423. [Google Scholar] [CrossRef]
- Narula, K.; Reddy, B.S. A SES (sustainable energy security) index for developing countries. Energy 2016, 94, 326–343. [Google Scholar] [CrossRef]
- Narula, K.; Reddy, B.S.; Pachauri, S. Sustainable energy security for India: An assessment of energy demand sub-system. Appl. Energy 2017, 186, 126–139. [Google Scholar] [CrossRef]
- Zhang, H.Y.; Ji, Q.; Fan, Y. An evaluation framework for oil import security based on the supply chain with a case study focused on China. Energy Econ. 2013, 38, 87–95. [Google Scholar] [CrossRef]
- Shaikh, F.; Ji, Q.; Fan, Y. Evaluating China’s natural gas supply security based on ecological network analysis. J. Clean. Prod. 2016, 139, 1196–1206. [Google Scholar] [CrossRef]
- Geng, J.B.; Ji, Q. Multi-perspective analysis of China’s energy supply security. Energy 2014, 64, 541–550. [Google Scholar] [CrossRef]
- Cheng, J.Y.S. A Chinese view of China’s energy security. J. Contemp. China 2008, 17, 297–317. [Google Scholar] [CrossRef]
- Bambawale, M.J.; Sovacool, B.K. China’s energy security: The perspective of energy users. Appl. Energy 2011, 88, 1949–1956. [Google Scholar] [CrossRef]
- Wang, W.; Liu, Y. Geopolitics of global climate change and energy security. Chin. J. Popul. Resour. Environ. 2015, 13, 1–8. [Google Scholar] [CrossRef]
- Wu, G.; Liu, L.C.; Han, Z.Y.; Wei, Y.M. Climate protection and China’s energy security: Win-win or tradeoff. Appl. Energy 2012, 97, 157–163. [Google Scholar] [CrossRef]
- Ying, Q.U.; Liu, Y. Evaluating the low-carbon development of urban China. Environ. Dev. Sustain. 2016, 19, 1–15. [Google Scholar]
- World Energy Council. Energy Sustainability Index 2013; World Energy Council: London, UK, 2013. [Google Scholar]
- The State Council of the People’s Republic of China. Outline of the Thirteenth Year Plan for National Economy and Social Development in People’s Republic of China; The State Council of the People’s Republic of China: Beijing, China, 2016.
- National Bureau of Statistics (NBS). China Energy Statistics Yearbook; China Statistics Press: Beijing, China, 2005–2016.
- BP. BP Statistical Review of World Energy; BP: London, UK, 2016. [Google Scholar]
- Gupta, E. Oil vulnerability index of oil-importing countries. Energy Policy 2008, 36, 1195–1211. [Google Scholar] [CrossRef]
- International Energy Agency. Energy Security and Climate Policy-Assessing Interactions; OECD Publishing: Paris, France, 2007. [Google Scholar]
- World Bank. Worldwide Governance Indicators (WGI) Project; World Bank: Washington, DC, USA, 2015. [Google Scholar]
- Tian, C.R. China’s 2010 oil import/export. Int. Pet. Econ. 2011, 19, 15–25. [Google Scholar]
- Tian, C.R. China’s 2014 oil and gas import/export. Int. Pet. Econ. 2015, 23, 57–67. [Google Scholar]
- Tian, C.R. China’s 2015 oil import/export. Int. Pet. Econ. 2016, 24, 44–53. [Google Scholar]
- Xu, Z.S. Uncertain Multiple Attribute Decision Making: Methods and Applications; Tsinghua University Press: Beijing, China, 2004; pp. 134–151. (In Chinese) [Google Scholar]
- MacQueen, J.B. Some methods for classification and analysis of multi-variate observations. In Proceedings of the 5th Berkeley Symposium on Mathematical Statistics and Probability, Berkeley, CA, USA, 1967; University of California Press: Berkeley, CA, USA, 1967; pp. 281–297. [Google Scholar]
- The State Council of the People’s Republic of China. Renewable Energy Utilization Law; The State Council of the People’s Republic of China: Beijing, China, 2005.
- The State Council of the People’s Republic of China. Implementation Plan for Energy Conservation Actions of Thousand Enterprises; The State Council of the People’s Republic of China: Beijing, China, 2006.
- National Development and Reform Commission of China. Renewable Energy Medium-to-Long Development Plan; National Development and Reform Commission of China: Beijing, China, 2007.
- The State Council of the People’s Republic of China. The “Twelfth Five-Year” Development Plan for Renewable Energy; The State Council of the People’s Republic of China: Beijing, China, 2016.
- National Development and Reform Commission. 12th Five-Year Plan on Renewable Energy Development; National Development and Reform Commission: Beijing, China, 2012.
- National Development and Reform Commission. 13th Five-Year Plan on Energy Development; National Development and Reform Commission: Beijing, China, 2016.
Figure 1.
Sustainable Energy Security (SES) level of dimensions (2005–2015).

Figure 2.
China’s Sustainable Energy Security (SES) status during 2005–2015.

Figure 3.
Analysis results of indicators impact on CSES in 2015.

Table 1.
Framework of China’s Sustainable Energy Security (CSES) Index. GDP: gross domestic product; SWI: Shannon–Weiner Index; TPEC: total primary energy consumption; TPEP: total primary energy production.
Table 1.
Framework of China’s Sustainable Energy Security (CSES) Index. GDP: gross domestic product; SWI: Shannon–Weiner Index; TPEC: total primary energy consumption; TPEP: total primary energy production.
| Dimension | Indicator | Equation (per Year) | Effect | Common or Not |
|---|---|---|---|---|
| Availability () | TPEP per capita () | TPEP/Average population | Positive | Not |
| Energy reserve-to-production ratio () | Weighted average of reserve-to-production ratio of fossil energy | Positive | Not | |
| Energy self-sufficiency ratio () | Weighted average of self-sufficiency ratio of every kind of energy | Positive | Common | |
| Accessibility () | Share of investment in fixed assets of energy () | Investment in fixed assets of energy industry/China’s total investment in fixed assets | Positive | Not |
| Crude Oil Market Concentration Risk () | COMCR | Negative | Not | |
| Oil Market Liquidity () | World oil exports/China’s oil imports | Positive | Common | |
| Affordability () | Domestic Fuel price fluctuation ratio () | Fluctuation ratio of domestic retail price index of fuel goods | Negative | Not |
| Crude oil price fluctuation ratio () | Average crude oil price fluctuation ratio | Negative | Not | |
| GDP per capita () | GDP/Average population | Positive | Common | |
| Acceptability () | Share of non-fossil energy () | Non-fossil energy consumption/TPEC | Positive | Not |
| Energy intensity () | TPEC/GDP | Negative | Common | |
| Carbon emission intensity () | Negative | Common | ||
| Develop-ability () | TPEC per capita () | TPEC/Average population | Negative | Not |
| Carbon emission per unit energy consumption () | emissions/TPEC | Negative | Not | |
| Energy diversification index () | SWI | Positive | Not |
Table 2.
Normalized values of indicators.
| Year | |||||||||||||||
|---|---|---|---|---|---|---|---|---|---|---|---|---|---|---|---|
| 2005 | 0.0000 | 1.0000 | 0.5312 | 1.0000 | 1.0000 | 1.0000 | 0.0377 | 0.0952 | 0.0000 | 0.0000 | 0.0000 | 0.0000 | 1.0000 | 0.0287 | 0.0000 |
| 2006 | 0.1230 | 0.8216 | 0.0908 | 0.8694 | 0.8244 | 0.8606 | 0.2264 | 0.5774 | 0.0881 | 0.0000 | 0.0806 | 0.0637 | 0.8406 | 0.0000 | 0.0301 |
| 2007 | 0.2766 | 0.6654 | 0.0000 | 0.7333 | 0.7732 | 0.8362 | 0.7421 | 0.7825 | 0.1991 | 0.0217 | 0.2176 | 0.1905 | 0.6831 | 0.0416 | 0.0549 |
| 2008 | 0.3768 | 0.4958 | 0.3821 | 0.6425 | 0.2976 | 0.7334 | 0.0000 | 0.2197 | 0.2835 | 0.2174 | 0.3849 | 0.3560 | 0.6326 | 0.1561 | 0.1995 |
| 2009 | 0.4379 | 0.3562 | 0.1014 | 0.5048 | 0.2723 | 0.4968 | 0.5472 | 0.2200 | 0.3735 | 0.2391 | 0.4912 | 0.4502 | 0.5402 | 0.1752 | 0.2036 |
| 2010 | 0.6437 | 0.2172 | 0.5940 | 0.4909 | 0.2170 | 0.3447 | 0.2327 | 0.4076 | 0.4848 | 0.4348 | 0.5642 | 0.5512 | 0.3889 | 0.4004 | 0.4495 |
| 2011 | 0.8642 | 0.1412 | 1.0000 | 0.2814 | 0.1989 | 0.2592 | 0.3082 | 0.2744 | 0.5940 | 0.2174 | 0.6114 | 0.5783 | 0.2267 | 0.3265 | 0.3858 |
| 2012 | 0.9403 | 0.0536 | 0.9218 | 0.1774 | 0.0000 | 0.2051 | 0.8239 | 1.0000 | 0.6905 | 0.5000 | 0.6975 | 0.6875 | 0.1402 | 0.5526 | 0.5654 |
| 2013 | 0.9897 | 0.0538 | 0.7040 | 0.1238 | 0.0148 | 0.2395 | 1.0000 | 0.9848 | 0.7926 | 0.6087 | 0.7831 | 0.7754 | 0.0570 | 0.6633 | 0.6895 |
| 2014 | 1.0000 | 0.0000 | 0.5306 | 0.0633 | 0.0391 | 0.1795 | 0.9560 | 0.8408 | 0.8961 | 0.8478 | 0.8867 | 0.8920 | 0.0131 | 0.8783 | 0.8659 |
| 2015 | 0.9861 | 0.0468 | 0.4661 | 0.0000 | 0.1902 | 0.0000 | 0.2327 | 0.0000 | 1.0000 | 1.0000 | 1.0000 | 1.0000 | 0.0000 | 1.0000 | 1.0000 |
Table 3.
Weight and ideal solution of each indicator.
| Indicator | Weight | Positive Ideal Solution | Negative Ideal Solution |
|---|---|---|---|
| 0.2373 | 0.2373 | 0.0000 | |
| 0.4924 | 0.4924 | 0.0000 | |
| 0.2703 | 0.2703 | 0.0000 | |
| 0.2996 | 0.2996 | 0.0000 | |
| 0.4495 | 0.4495 | 0.0000 | |
| 0.2509 | 0.2509 | 0.0000 | |
| 0.3742 | 0.3742 | 0.0000 | |
| 0.3319 | 0.3319 | 0.0000 | |
| 0.2939 | 0.2939 | 0.0000 | |
| 0.4800 | 0.4800 | 0.0000 | |
| 0.2501 | 0.2501 | 0.0000 | |
| 0.2699 | 0.2699 | 0.0000 | |
| 0.3318 | 0.3318 | 0.0000 | |
| 0.3504 | 0.3504 | 0.0000 | |
| 0.3178 | 0.3178 | 0.0000 |
Table 4.
Approach degrees of dimensions.
| Year | Availability | Accessibility | Affordability | Acceptability | Develop-Ability |
|---|---|---|---|---|---|
| 2005 | 0.6560 | 1.0000 | 0.0589 | 0.0000 | 0.4161 |
| 2006 | 0.5490 | 0.8411 | 0.3352 | 0.0430 | 0.3727 |
| 2007 | 0.4813 | 0.7726 | 0.5926 | 0.1201 | 0.3299 |
| 2008 | 0.4560 | 0.4670 | 0.1809 | 0.2797 | 0.3560 |
| 2009 | 0.3282 | 0.3777 | 0.4035 | 0.3337 | 0.3263 |
| 2010 | 0.3753 | 0.3201 | 0.3616 | 0.4804 | 0.4117 |
| 2011 | 0.4495 | 0.2325 | 0.3795 | 0.3745 | 0.3151 |
| 2012 | 0.4182 | 0.1185 | 0.8155 | 0.5687 | 0.4314 |
| 2013 | 0.3909 | 0.1144 | 0.8997 | 0.6666 | 0.4786 |
| 2014 | 0.3528 | 0.1336 | 0.8925 | 0.8620 | 0.5536 |
| 2015 | 0.3520 | 0.1380 | 0.4113 | 1.0000 | 0.5878 |
Table 5.
CSES level during 2005–2015.
| Year | Level | ||
|---|---|---|---|
| 2005 | 0.2442 | 0.3715 | 0.6034 |
| 2006 | 0.2574 | 0.2901 | 0.5298 |
| 2007 | 0.2826 | 0.2584 | 0.4777 |
| 2008 | 0.3249 | 0.1551 | 0.3232 |
| 2009 | 0.3780 | 0.1178 | 0.2376 |
| 2010 | 0.3397 | 0.1400 | 0.2918 |
| 2011 | 0.3832 | 0.1132 | 0.2281 |
| 2012 | 0.3645 | 0.1789 | 0.3292 |
| 2013 | 0.3590 | 0.2113 | 0.3705 |
| 2014 | 0.3515 | 0.2635 | 0.4284 |
| 2015 | 0.3560 | 0.2730 | 0.4340 |
Table 6.
Classification of China’s SES value.
| Year | 2005 | 2006 | 2007 | 2008 | 2009 | 2010 | 2011 | 2012 | 2013 | 2014 | 2015 |
|---|---|---|---|---|---|---|---|---|---|---|---|
| Level | safety | safety | warning | danger | danger | danger | danger | danger | warning | warning | warning |
© 2018 by the authors. Licensee MDPI, Basel, Switzerland. This article is an open access article distributed under the terms and conditions of the Creative Commons Attribution (CC BY) license (http://creativecommons.org/licenses/by/4.0/).
Share and Cite
MDPI and ACS Style
Fang, D.; Shi, S.; Yu, Q. Evaluation of Sustainable Energy Security and an Empirical Analysis of China. Sustainability 2018, 10, 1685. https://0-doi-org.brum.beds.ac.uk/10.3390/su10051685
AMA Style
Fang D, Shi S, Yu Q. Evaluation of Sustainable Energy Security and an Empirical Analysis of China. Sustainability. 2018; 10(5):1685. https://0-doi-org.brum.beds.ac.uk/10.3390/su10051685
Chicago/Turabian StyleFang, Debin, Shanshan Shi, and Qian Yu. 2018. "Evaluation of Sustainable Energy Security and an Empirical Analysis of China" Sustainability 10, no. 5: 1685. https://0-doi-org.brum.beds.ac.uk/10.3390/su10051685
Note that from the first issue of 2016, this journal uses article numbers instead of page numbers. See further details here.