Article

An Integrated Multi-Criteria Decision Making Model and AHP Weighting Uncertainty Analysis for Sustainability Assessment of Coal-Fired Power Units

National Research Center for Thermal Power Engineering and Technology, North China Electric Power University, Changping District, Beijing 102206, China
*
Author to whom correspondence should be addressed.
Sustainability 2018, 10(6), 1700; https://0-doi-org.brum.beds.ac.uk/10.3390/su10061700
Submission received: 3 April 2018 / Revised: 12 May 2018 / Accepted: 18 May 2018 / Published: 23 May 2018
(This article belongs to the Special Issue Sustainable Energy Systems: From Primary to End-Use)

Abstract

:
The transformation of the power generation industry from coal-based to more sustainable energy sources is an irreversible trend. In China, the coal-fired power plant, as the main electric power supply facility at present, needs to know its own sustainability level to face the future competition. A hybrid multi-criteria decision making (MCDM) model is proposed in this paper to assess the sustainability levels of the existing Chinese coal-fired power units. The areal grey relational analysis (AGRA) method is involved in the hybrid model, and a combined weighting method is used to determine the priorities of the criteria. The combining weight fuses the fuzzy rough set (FRS) and entropy objective weighting method together with the analytic hierarchy process (AHP) subjective weighting method by game theory. Moreover, an AHP weighting uncertainty analysis using Monte Carlo (MC) simulation is introduced to measure the uncertainty of the results, and a 95 percent confidence interval (CI) is defined as the uncertainty measurement of the alternatives. A case study about eight coal-fired power units is carried out with a criteria system, which contains five aspects in an operational perspective, such as the flexibility, economic, environmental, reliability and technical criterion. The sustainability assessment is performed at the unit level, and the results give a priority rank of the eight alternatives; additionally, the uncertainty analysis supplies the extra information from a statistical perspective. This work expands a novel hybrid MCDM method to the sustainability assessment of the power generation systems, and it may be a benefit to the energy enterprises in assessing the sustainability at the unit level and enhance its ability in future sustainable development.

1. Introduction

Nowadays, people have realized the importance of the sustainability of energy utilization with the depletion of fossil fuel and global warming [1,2]. The expected way of future energy utilization is most likely mainly to be powered by renewable energy sources like hydropower, bioenergy, solar energy, wind power, geothermal power [3,4,5,6,7,8], etc. The sustainable development of the power industry plays an important role in the sustainable development of energy. Despite the rapid growth of renewable energy, coal-fired power generation still retains a large proportion of the whole power generation, especially in China. By the end of 2016, coal-fired power generation accounted for about 57 percent of the total installed power capacity [9], and the plants are still the main suppliers of electricity. Thus, the sustainability of the coal-fired power facility has an important impact on the sustainable utilization of energy.
In recent years, the coal-fired power plants in China have encountered some new challenges such as the generation share decreasing and utilization hours’ reduction caused by the transition to renewable energy and the irrational investment of commercial capital [10,11]. For example, the average utilization hours of the coal-fired power generation equipment (600 megawatts and above) were only 3786 h in the year 2016 [9]. That means the main power units have in the long-term a low-load operation condition. Actually, the level of operation and management of the coal-fired power plants has risen up to a relatively high standard today. Thus, the potential of reaching further energy savings and emission reductions, which will enhance the sustainability of the power generation facilities, is becoming smaller than ever before. Even so, some efforts have been made to improve the situation of sustainable development in the technical aspects, which contain the operational optimization of the unsteady state [12], deep heat recovery from boiler flue gas [13], emission control technologies [14,15,16,17,18], etc. However, the guiding role of the government’s policy is essential in the power generation alternation from coal-based to coal-free mode, such as the supply-side structural reform [19] and the Chinese 13th five-year energy development plan [20]. Therefore, it is necessary to make a reasonable assessment of the sustainability level of the coal-fired power plants. The appropriate policy suitable for the current level of sustainable development can reduce the unnecessary cost of the energy sustainable development process, on the one hand, such as the power over-investment [10,11], and on the other hand, it can optimize the sustainability of the overall energy generation system, such as enhancing the flexibility of the coal power units to accommodate more capacity of wind power and photovoltaic power [21,22].
There are several conventional methodologies that can be employed for the sustainability assessment, such as exergy [23,24], emergy [25,26], life cycle assessment (LCA) [27] and the multi-criteria decision making (MCDM) methods [28,29,30,31,32,33,34,35]. The MCDM method, which is particularly suitable for the evaluation or decision making of a complex system with multiple indicators, is widely used in the energy field. Many prevalent specific methods are available for sustainability assessment of thermal power plants, which include TOPSIS [36,37,38], AHP [39,40,41,42], the entropy method [43], the fuzzy method [41,44], the grey method [40,45], the rough set [46,47,48], set pair analysis (SPA) [26], etc. Sometimes, we use a hybrid model to take advantage of each classical theory. Grey relational analysis (GRA) is one of the branches of grey theory, which was introduced by Deng in 1982 [
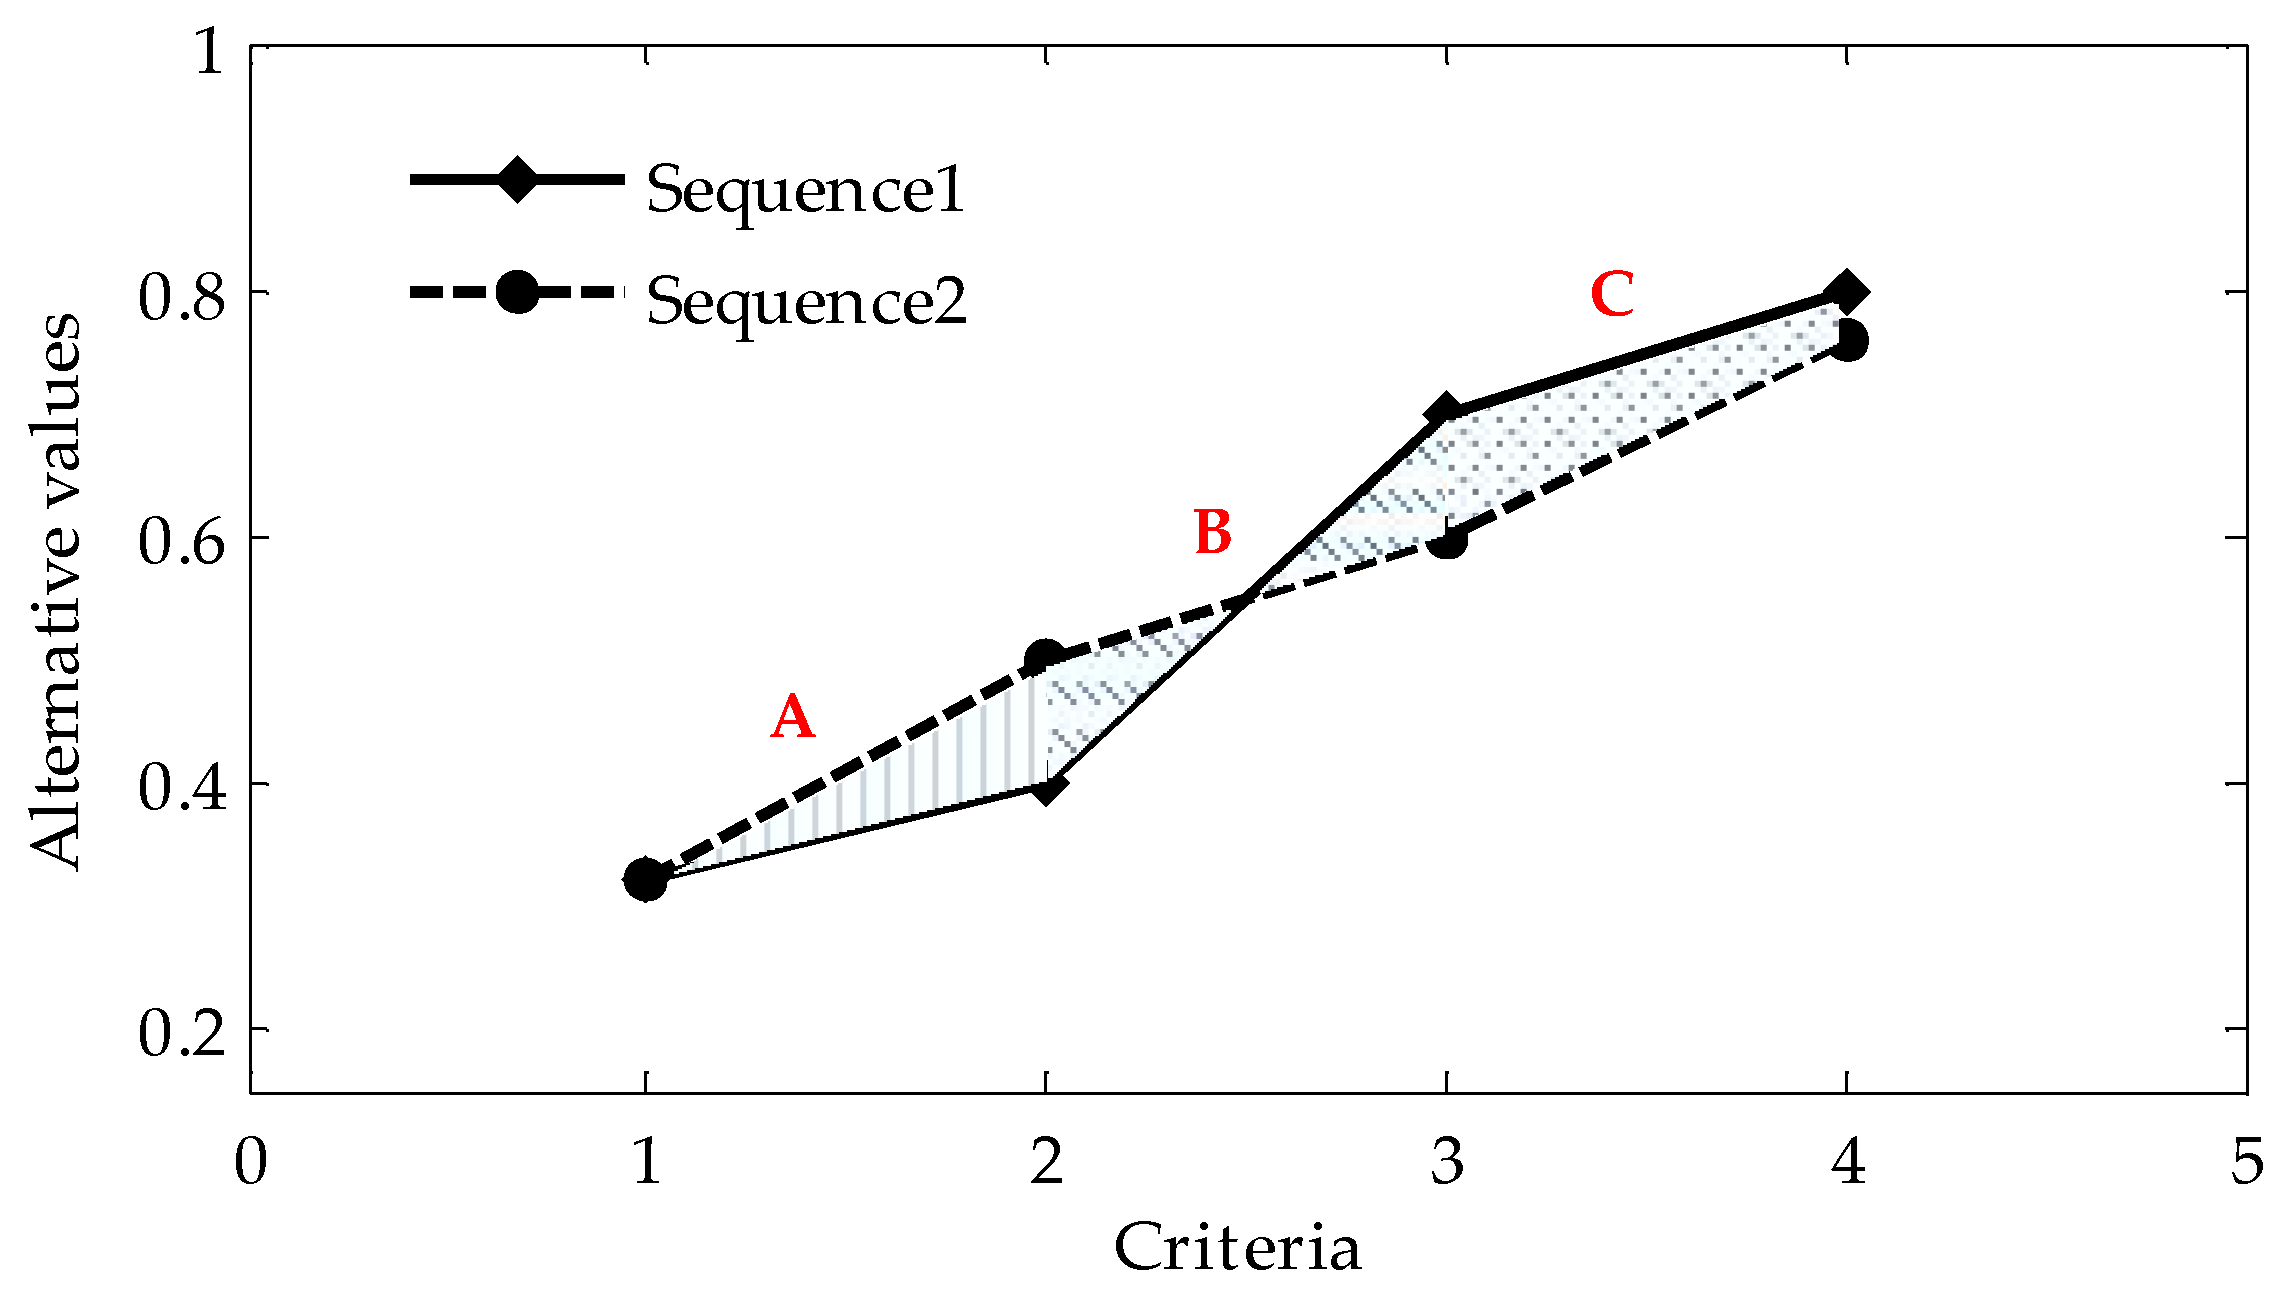
45]. The merit of the GRA is its insensitivity to the amount of raw data that usually has insufficient and poor information, and it can derive an unbiased estimate by determining the relationship of the data sequences. However, the conventional GRA only considers the linear relationship of alternatives of the same indicators using the grey relational coefficient number, and it is unable to measure the relationships between indicators. Thus, an improved evaluation method, areal grey relational analysis (AGRA), was developed to cope with the demand of the areal grey relational coefficient number of indices [49,50,51].
It is important to determine the weights of the criteria in the process of an MCDM method. Generally, the weighting methods can be divided into several categories such as subjective, objective and combination methods. The subjective weight needs the knowledge of experts. Except for the Delphi [30] method, AHP has been widely used as a subjective weighting method benefiting from its ability to quantify the qualitative factors by the hierarchical decomposition process [39,40,41]. For the objective weight determination, the entropy method is a typical principle to cope with the uncertainty of the index [41,44,52], and the CRITIC method can handle the relationship between indicators by introducing the linear correlation coefficient [53]. However, in the real world, the relationship between the data sequences is usually nonlinear and complex. Then, the rough set theory and fuzzy set theory can be employed to treat the nonlinear problem from different perspectives [46,47,48,54]. We usually use an integration weight based on various principles to achieve practical results. The weighting combination methods mainly utilize the rules of addition, multiplication [26], game theory [50,55,56], etc. Game theory is a practical way to get the optimum equilibrium solution among different kinds of weights with conflicts.
When performing the AHP method to determine the importance degree of criteria, the result is strongly affected by the expert’s knowledge and may vary significantly with different decision makers. One of the reasons is that the experts may be unfamiliar with some specific indices, so they cannot make a precise judgment in the pairwise comparison process. In order to overcome these problems, the Monte Carlo (MC) method was introduced in many works to promote the performance of the classical AHP method [57,58,59,60,61]. The stochastic-based AHP approach can give us more decision information from a statistical perspective.
For the sustainability assessment of an energy system, we usually establish the evaluation system considering the technical, economic, environmental and social factors [4,31,33,62]. There is no doubt that it is significant to discuss the sustainability of the energy system from a broad perspective with the consideration of the interaction with human society, but it is also worthy to research the sustainability of specific power generation systems from a smaller perspective, such as the sustainability evaluation of the coal-fired power unit at the equipment level. In order to obtain a reasonable evaluation of the power units, some performance indices such as economic, environmental and technical can be selected under the premise of device safety. For the existing coal-fired power units of China, improving their operational flexibility is the most practical option at present for the systematic sustainable energy transition [4,21,22].
In this paper, we develop a hybrid MCDM model to evaluate the sustainability of the coal-fired power units. The proposed model uses the AGRA method integrating a combined weight. We employ the AHP method to gather the knowledge of experts in the thermodynamic field, and we use the entropy technique to measure the uncertainties of the criteria. Moreover, the FRS is used to get an additional objective weight, and ultimately, the three weights (AHP, entropy, FRS-based) are combined with the optimizing method based on game theory. We also establish a multi-criteria evaluation system to perform the sustainability assessment at the power unit level, which considers five criterion categories including flexibility, economic, environmental, reliability and the technical index and with sub-criteria under every criterion category, respectively. Furthermore, in order to detect the uncertainty of the assessment results, a stochastic simulation work is performed based on the AHP method. A case study is also carried out with the sustainability assessment of eight coal-fired power units of a similar design generation capacity. We believe this work is beneficial to the sustainability of the total energy system and may provide some valuable references for the policy-making sectors.
The rest of the paper is organized as follows: In Section 2, we introduce the hybrid model that combines the AGRA method and some selected weighting methods (AHP, entropy and FRS weight). Section 3 introduces the MC-AHP method to develop the weight uncertainty analysis. Section 4 discusses a case study to illustrate the effectiveness of the evaluation model for the sustainability assessment of power units. Section 5 shows the results and discussions about the case research, and Section 6 draws out some conclusions. Additionally, the symbols used in this paper are listed in the Nomenclature Section.

2. The Integrated MCDM Model

This section introduces the proposed hybrid MCDM model used in the paper for the sustainability evaluation of coal-fired power units. The integrating model involves the areal-based grey theory, AHP, entropy, FRS and game theory. Different methods have their own advantages in dealing with the raw data from the different point of views. The details are briefly introduced as follows.

2.1. Areal Grey Relational Analysis Method

Grey system theory has been widely used in various fields because of its advantages of treating complex systems that have various interrelated indicators [45]. Although Deng’s GRA method, which was developed from grey system theory, is prevalent in multi-objective decision-making problems, it still can be improved in some aspects [28,40,63,64].
Suppose there are m kinds of evaluated criteria a j ( 1 j m ) and n kinds alternatives f i ( 1 i n ) ; they form a sample matrix X = ( x i j ) n × m , and X can be written as:
X = ( x i j ) n × m = f 1 f 2 f n [ x 11 x 12 x 1 m x 21 x 22 x 2 m x n 1 x n 2 x n m ] a 1 a 2 a m
Suppose there are two alternative sequences f i ,   f k ( 1 i , k n ) with the same criteria a j ( 1 j m ) ; the classical GRA method calculates the grey relational degree (GRD) of the two sequences by the absolute difference of the corresponding index values, in the format of | x i j x k j | . However, for the AGRA, one of the methods derived from the GRA [49,50,51], its GRD is calculated not only considering the absolute difference of the criteria, but also taking into account the geometric area between the adjacent indices. Generally speaking, AGRA theory determines the areal correlation degrees according to the similarity among the sequence curves like the GRA method. That means, the more similarity between two sequences, the higher the correlation degree will be. We assume an optimal criterion sequence as a reference, and then, we can determine the similarity of the indices between the selected alternatives and the reference one. The more the similarity between the two index sequences, the better the comprehensive performance of the alternatives investigated. The detailed procedure is introduced as follows.

2.1.1. Normalizing the Criteria

The criteria usually have different dimensions and magnitudes. Therefore, the normalizing procedure should be performed first. For the sample matrix X described in Equation (1), the following formulas can be used. For the criterion the bigger the better (or benefit attribute), it can be normalized as:
y i j = x i j min i ( x i j ) max i ( x i j ) min i ( x i j ) , ( 1 i n , 1 j m )
and for the criterion the smaller the better (or cost attribute), it can be normalized as:
y i j = max i ( x i j ) x i j max i ( x i j ) min i ( x i j ) , ( 1 i n , 1 j m )
where in Equations (2) and (3), max i ( x i , j ) and min i ( x i , j ) respectively mean the maximum and the minimum value of the row i , and Y = ( y i j ) n × m is the linear scale standardized matrix.

2.1.2. Calculating the Areal Grey Relational Coefficient Number

Take Figure 1 as an example: to calculate the areal grey relational coefficient values, the key step is to determine the area values between the alternative sequences (for instance, the solid line) and the reference one (for instance, the dotted line). The geometric figure made up by the two adjacent criteria of the two sequences may have the following cases: (A) triangle, (B) two lines intersecting, (C) trapezoid and (D) synthesized to one line. Obviously, the smaller the correlation area between the sequences is, the closer the two curves are, and then, the greater the correlation degree is, and vice versa. The extreme situation is the case of (D), that is to say, in that case, the two points of a criterion totally coincide with each other, and the grey relational degree is up to the biggest value of one.
For the normalized matrix Y = ( y i j ) n × m , set y 0 = { y 0 ( 1 ) , y 0 ( 2 ) , , y 0 ( m ) } as the reference sequence, where y 0 ( j ) = max ( y j ( i ) ) ,   ( 1 i n ,   1 j m ) , and the series y i , ( 1 i n ) is the comparison one. Set the horizontal distance of two adjacent criterion equal to one, then the areas s i j can be calculated with several cases depicted in the following steps.
First, we need to define a flag function f i ( j ) = F ( z i ( j ) ) , where z i ( j ) = y 0 ( j ) y i ( j ) . This function is used to judge the relative positions of the two curves, and it has the possible values:
{ f i ( j ) > 0 , z i ( j ) > 0 f i ( j ) = 0 , z i ( j ) = 0 f i ( j ) < 0 , z i ( j ) > 0   , ( 1 i n , 1 j m )
According to the geometric relationship, the calculation methods about the different areal shapes shown in Figure 1 can be summarized as six formulas:
s i j = { | ( y 0 ( 2 ) y i ( 2 ) ) × 1 | / 2 , f i ( j ) = f i ( 1 ) = 0 | ( y 0 ( j ) y i ( j ) + y 0 ( j + 1 ) y i ( j + 1 ) ) × 1 | / 2 , f i ( j ) × f i ( j + 1 ) > 0 ( | ( y 0 ( j ) y i ( j ) | × ( y i ( j ) j )   + | y 0 ( j + 1 ) y i ( j + 1 ) | × ( ( j + 1 ) y i ( j ) ) ) / 2 , f i ( j ) × f i ( j + 1 ) < 0 0 , f i ( j ) = f i ( j + 1 ) = 0 | ( y 0 ( j + 1 ) y i ( j + 1 ) ) × 1 | / 2 , f i ( j ) = 0   &   f i ( j + 1 ) 0 | ( y 0 ( j ) y i ( j ) ) × 1 | / 2 , f i ( j ) 0   &   f i ( j + 1 ) = 0
Second, for the j -th index of the i -th alternative, after the areas s i j obtained with Equation (5), the areal grey relational coefficient matrix can be obtained with the elements formulated as:
ξ i j = min i   min j { s i j } + ρ   max i   max j { s i j } s i j + ρ   max i   max j { s i j } ,   ( 1 i n , 1 j m )
where ξ i j is the areal grey relational coefficient of the j -th index of the i -th alternative. The factor ρ [ 0 ,   1 ] is the distinguishing coefficient like the GRA method, and we set it as 0.5.

2.1.3. Calculating the Areal Grey Relational Result Vector

Based on the methodology of AGRA and the indices’ weights W = ( w 1 , w 2 , , w m ) T , the final calculation model can be deduced as:
R = ξ · W = ( r 1 , r 2 , r n ) T
where r i = j = 1 m ξ i ( j ) · w j , ( 1 i n ,   1 j m ) , the vector R is the result of the evaluated alternatives, ξ is the areal grey relational coefficients matrix of the criteria and W is the weight of the evaluated criteria. According to the principle of maximum correlation, the evaluation alternative can be sorted, and the larger the r i , the better the alternative.

2.2. Selected Weighting Methods

In this subsection, some weighting methods are briefly introduced, including the FRS, entropy principle and AHP method, and we use game theory to combine these three weights to perform a trade-off of their benefits.

2.2.1. Fuzzy Rough Set Objective Weight

The datasets we face are usually incomplete, imprecise and inaccurate. To settle these problems, the rough set theory was developed by Pawlak in 1982, which can describe the rough data and dig out useful knowledge just based on the raw data themselves [65]. The rough set theory is usually used as a powerful tool of information reduction in the machine learning and data mining fields. However, the classical rough set is good at dealing with symbolic variables, and for the continuous numerical values, a key step of data discretization is needed. The problem is that the discrete methods are not uniform, and they may cause additional loss of information of the research data. Then, fuzzy set theory, proposed by Zadeh, was introduced to the classical rough set to overcome the weakness, and it forms the branch of the fuzzy rough set (FRS) method [46,47,48,54,66].
First, we introduce some basic concepts about the fuzzy equivalence relation according to the reference paper [66]. Let U be a nonempty universe of discourse and F ( U × U ) be the fuzzy power set on U × U . R is the fuzzy relation on U × U , if R ϵ F ( U × U ) , where R ( x , y ) measures the strength of the relationship between x ϵ U and y ϵ U . Then, the fuzzy relation R has the following properties. R is reflexive if R ( x , x ) = 1 for any x ϵ U , and R is T -transitive if R ( x , y ) T ( R ( x , z ) , R ( y , z ) ) for a triangular norm T and any x , y , z ϵ U . Furthermore, R is called a T -similarity relation if R is reflexive, symmetric and T -transitive. Specially, if T = m i n , then R is called a fuzzy equivalence relation.
Then, suppose a knowledge representation system S = ( U , A , V , f ) , where U is the collection of objects, A is the collection of properties, V = a A V a is the value range and f : U × A V is the information function. For a fuzzy set X , we define the lower and upper approximation operators based on a T -similarity relation R as:
{ R _ X ( x ) = inf y U   max { 1 R ( x , y ) ,   X ( y ) } R ¯ X ( x ) = sup   min { R ( x , y ) ,   X ( y ) } y U
where x ϵ U . The lower and upper approximation operators are used to determine the certainty degree and possibility degree of x that belong to X , respectively. Let P , Q A be a pair of fuzzy equivalence relations, then the positive region of Q set about P set is denoted as:
P O S P ( Q ) = X U / Q P _ X
For a criterion a j A , we define the dependence degree of a j on the criteria set A as:
γ a j ( A ) = | p o s a j ( A ) | / | U |
In order to measure the importance of the index a j , we first remove this criteria, then we can calculate the dependence degree of the rest criteria set A { a j } on A , the significance degree of the measured index can be obtained with the equation:
s i g A { a j } ( a j ) = 1 γ A { a j } ( A ) = 1 | p o s A { a j } ( A ) | / | U |
Finally, we normalize the significance degree, and the weight based on the FRS method is formed as:
w j f r s = s i g A { a j } ( a j ) j = 1 m s i g A { a j } ( a j )

2.2.2. Entropy Objective Weight

The entropy principle is usually used to measure the irreversible phenomenon of the motion state, and later, it was introduced into the information field to calculate the uncertainty of data series. The entropy weight we used in this work is according to some published literature [41,44,52]. Generally, the greater the amount of information, the less the uncertainty and the entropy will be, and vice versa. The steps of the method are introduced in the following briefly.
For the sample dataset with n kinds of alternatives and m kinds of criteria, which form as:
X = ( x i j ) n × m ,   i = 1 , 2 , , n ;   j = 1 , 2 , , m
First, we need to normalize the matrix X with the equation:
p i j = x i j / i = 1 n x i j ,   i = 1 , 2 , , n ;   j = 1 , 2 , , m
Second, we calculate the entropy of each criterion with the formula:
e j = i = 1 n p i j ln p i j ln n ,   j = 1 , 2 , , m
Finally, we get the entropy-based weigh of the criteria by using the following formula:
w j e n t = 1 e j j = 1 m ( 1 e j ) ,   j = 1 , 2 , , m

2.2.3. AHP Subjective Weight

The AHP method is becoming a more and more popular tool in dealing with the MCDM problems in recent years [39,40,41,42]. Although it has been disputed and has some insufficiencies in the calculation process, there is no doubt that it is a powerful approach to cope with the real-world complex evaluations or decision matters due to the ability to quantify some qualitative questions. Generally, the method reflects the procedures of people in working out a complex or messy scientific problem; that is, firstly decomposition, then judgment and finally synthesizing. Except for being used as an MCDM method to draw out the priority of the candidate alternatives, it can also be used as a weighting method just to give the prioritization of the criteria. The latter application we used in this paper is briefly introduced as follows in several steps according to the previous literature.
Step 1: For the established hierarchical decision system with m kinds of criteria, we use the classical Saaty’s comparison scale of 1–9 (see Table 1) to determine the pairwise comparison matrix A = ( a j k ) m × m for the decision makers.
Step 2: We standardize the comparison matrix A using the equation:
a ¯ j k = a j k / k = 1 m a j k ,   ( j , k = 1 , 2 , , m )
Then, we sum the elements of the matrix A ¯ = ( a ¯ j k ) m × m as columns, and get a vector w ¯ j :
w ¯ j = k = 1 m a ¯ j k ,   ( i = 1 , 2 , , m )
Furthermore, we normalize the vector w ¯ j , the criteria weight based on the AHP method terms, as:
w j a h p = w ¯ j / j = 1 m w ¯ j   , j = 1 , 2 , , m
Step 3: We verify the weight we obtained in Step 2. To validate the decision matrix of the AHP, the maximum feature value λ m a x is calculated by the formula:
λ max · w a h p = A · w a h p
then, the consistency ratio CR is used to check the consistency by comparing the random index values listed in Table 2, using the equation:
C R = C I / R I
where C I = ( λ m a x m ) / ( m 1 ) (m is the dimension of the comparison matrix) and RI is the random index. Finally, if the value CR is smaller than 0.1 , the results are assumed to pass the consistency check. Otherwise, we need to adjust the pairwise comparison matrix for the decision makers and recalculate it until the results pass the consistency check.

2.2.4. Weighting Combination by Game Theory

Game theory is a branch of modern mathematics and is a popular method in weight aggregation [50,55,56]. The key idea of the method is to minimize the deviation between weights by the mathematical programming method. In this work, we use this theory to get the optimum equilibrium solution among the selected criteria weights. The calculation steps can be summarized as follows.
Step 1: For l kinds of weights, they form a weight set W = { w 1 , w 1 , w l } . Then, a possible weight vector w with the form of an arbitrary linear combination may be expressed as:
w = j = 1 l α j w j T   ( α j > 0 )
where α j is the weight coefficient number.
Step 2: Calculate the weight coefficient α j with the following game theory model:
min | | j = 1 l α j w j T w i T | | 2   ( i = 1 , 2 , , l )
where l is the number of selected weights and w j is the possible weight of the weight set. Then, we solve the equation with the first-order derivation and have the formula as:
j = 1 l α j w i w j T = w i w i T
The equation can also be written in the expanded way:
[ w 1 · w 1 T w 1 · w 2 T w 1 · w l T w 2 · w 1 T w 2 · w 2 T w 2 · w l T w l · w 1 T w l · w 2 T w l · w l T ] [ α 1 α 2 α l ] = [ w 1 · w 1 T w 2 · w 2 T w l · w l T ]
Step 3: Then, the weight coefficient α j can be calculated by the Equation (24), and usually, the norm of vector α is not constantly equal to one; thus we need to normalize the vector using the formula:
α j * = α j / j = 1 l α j
Step 4: Finally, we obtain the integrated weight by the equation:
w * = j = 1 l α j * w j T

2.3. The Framework of the Integrated MCDM Model

Based on the methods we introduced above, we construct a hybrid MCDM model in this subsection. The sustainability assessment problems usually can be depicted using the hierarchical indicator system shown in Figure 2. The problem we faced can be divided into several categories, and we can describe every category with a criterion (or factor). Every criterion may have several sub-criteria (or indicators), and so on. The criteria are usually selected relying on the experiences of decision makers or estimators and are adjusted dynamically in practice. The proposed integrating MCDM model is illustrated in the following based on the indicator system in Figure 2.
The calculating method mainly includes two steps. The first step is to synthesize the information of n kinds of alternatives represented by the respective sub-criteria (SC-level). Specifically, for each criterion category ( m kinds), we use the FRS weighting method and entropy weighting method to get the objective weights and then use game theory to combine them. Then, based on the combined weight, we use the AGRA method to obtain the assessment results. This procedure is repeated for each criterion until we get m group sustainability results corresponding to each criterion. Then, the m group results form a new matrix (denoted as R C ). In the second step, we use the matrix obtained from the first step to calculate the final evaluation results of the criteria (C-level). Specifically, we use the FRS and entropy method to calculate the objective weights, and additionally, in this step, we performed the AHP method by experts to obtain the subjective weight, then we integrated the three weights by game theory again. At last, we reach the objective with the AGRA method synthesizing the R C and the corresponding weight factor. The flowchart of the whole algorithm is shown in Figure 3.
In the process of the two-fold calculation for sustainability assessment, we only use the AHP weight in the second step, i.e., when calculating the sub-criteria weights, we just used the objective weighting methods without the subjective experiences. We take this strategy mainly for the following reasons. The AHP process usually needs much expert knowledge to fulfill the pairwise comparison matrix and occasionally the subsequent adjustments if the matrix has not passed the consistency check. These additional difficulties will be obvious if there is a large number of the sub-criteria in each criterion category. Another reason is that, actually, some experts more easily give a reasonable decision value to the high-level index than to the bottom one. For example, they may easily make a reasonable judgment about the priority of the economic factor versus the environmental factor, but they may confuse the specific indicators subordinate to one of the criteria. One of the reasons is that sometimes, they are not familiar with all of the indicators due to their work usually focusing on different perspectives. Based on the above reasons, we only fuse the expert knowledge by AHP weights in the criteria-level calculation process. In this way, expert preference is ultimately reflected in the final result.

3. AHP Weighting Uncertainty Analysis

In this section, we introduce the weighting uncertainty analysis with the stochastic AHP method. Usually, the MC method is used in the AHP process to treat the imprecise or incomplete pairwise comparison matrix, which is the work that ought to be completed by the experts in the classical AHP method [57,58,60,
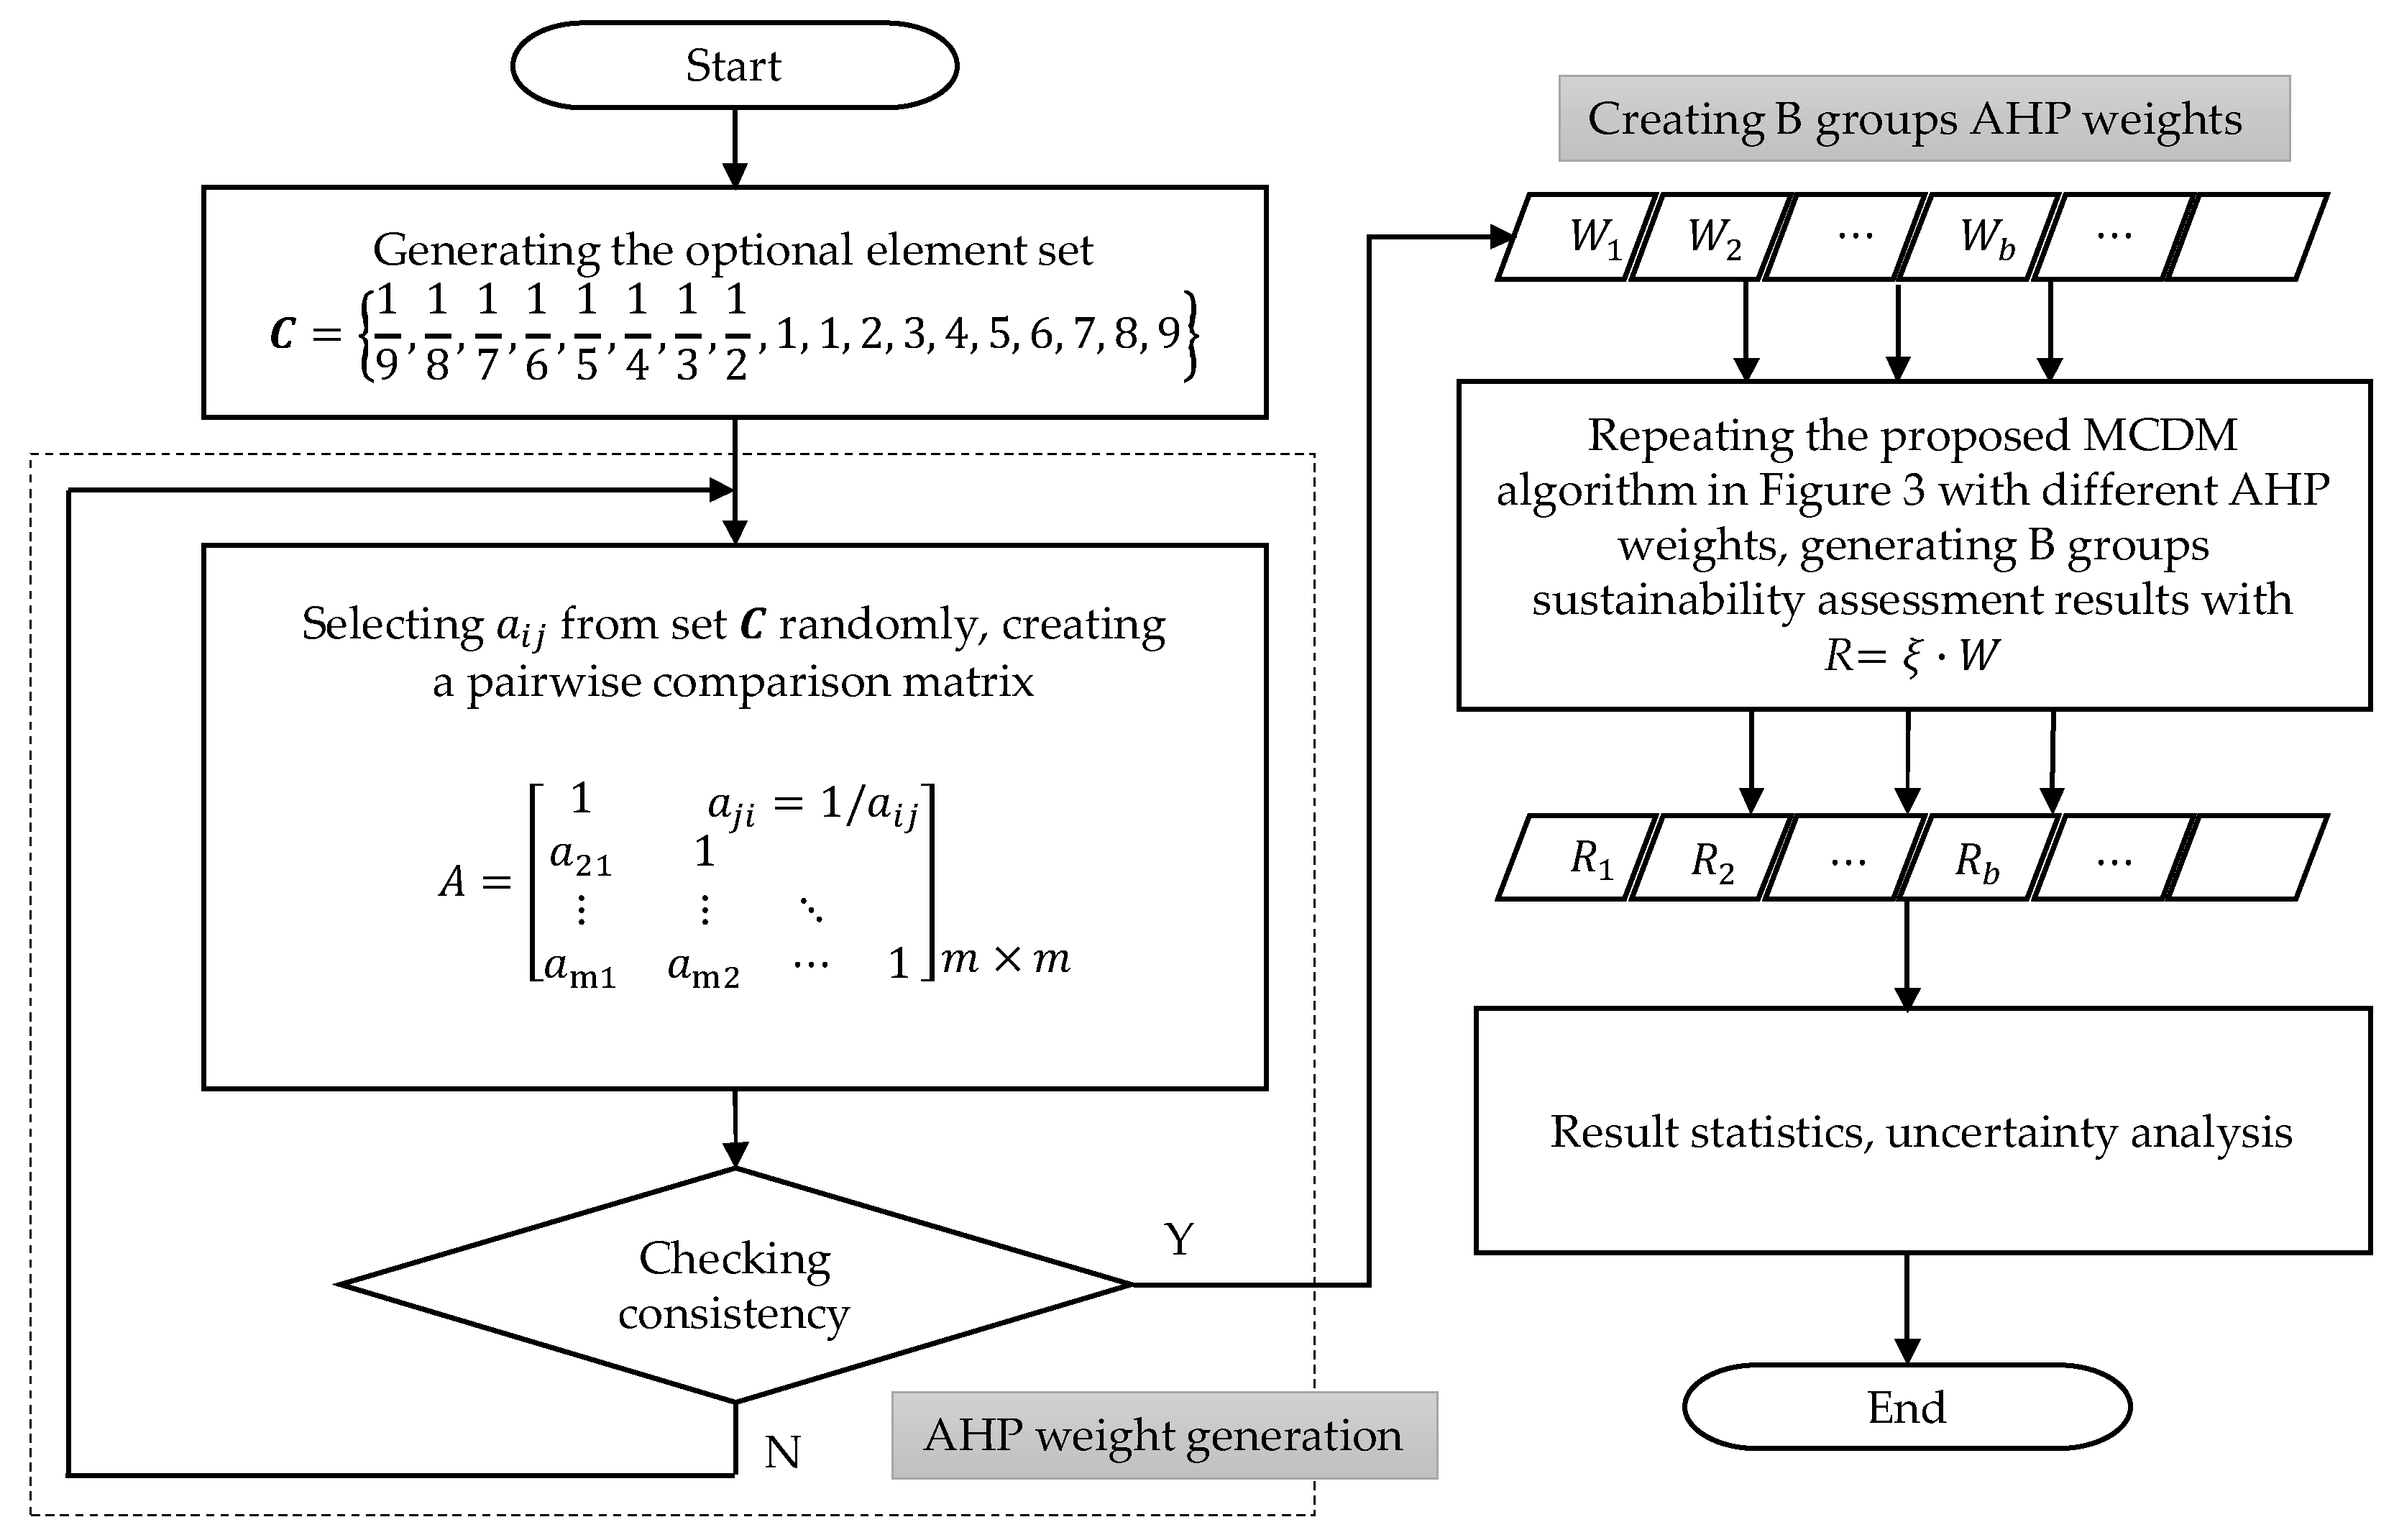
67]. However, the purpose we introduced the MC-AHP method in this paper is mainly to illustrate the sensitivity of the assessment results with the stochastic AHP weights from a statistical perspective. The algorithm is shown in Figure 4 and it is described as follows.
Step 1: Suppose there are n kinds of alternatives with m kinds of criteria; if we perform the AHP method to assess the alternatives, we need m ( m 1 ) / 2 independent elements to complete the pairwise comparison matrix, and the possible element is one of the integers between one and nine and their reciprocals, i.e., the optional element set C ought to be constructed as:
C = { 1 9 ,   1 8 ,   1 7 ,   1 6 ,   1 5 ,   1 4 ,   1 3 ,   1 2 ,   1 ,   1 ,   2 ,   3 ,   4 ,   5 ,   6 ,   7 ,   8 ,   9 }
Step 2: Creating a pairwise comparison matrix A m × m , we select every element a i j   ( 2 i m ,   1 j m 1 ) from the set C randomly with equal probabilities, and after that, we complement the reciprocals with a j i = 1 / a i j correspondingly. Then, we calculate the AHP weight with the method mentioned in Section 2.2.3.
Step 3: We check the AHP weight with the consistency rules shown in Table 2. If the consistency check failed, we repeat Step 2 to create a new weight vector.
Step 4: Repeating the process of Step 2 and Step 3, we generate B group’s AHP weight vector.
Step 5: We perform the sustainability assessment with the hybrid MCDM model that we proposed in Section 2 (see Figure 3) B times using the B group’s AHP weights generated from Step 4 correspondingly. Then, we get B group’s assessment results about the n kind alternatives, that is the results matrix has a dimension of n × B .
Step 6: We analyze the result vectors of each alternative with the statistical methods, i.e., giving out the points of 0.025 fractile and 0.975 fractile, the width of the 95% confidence intervals (CI) and the probability distributions.
Besides, in order to calculate the proposed model and implement the uncertainty analysis introduced in this section, we developed a series of programs in MATLAB (v 8.3.0.532) using a personal computer equipped with an Intel(R) Core(TM) i5-2400 CPU @ 3.10 GHz configuration and a 64-bit Windows 7 system.

4. A Case Study of the Sustainability Assessment of Power Plants

In this section, we performed a case study about the power units selected from some power plants. Firstly, we construct a hierarchical criteria system with the detailed indicators and also give some necessary data in the following subsection.
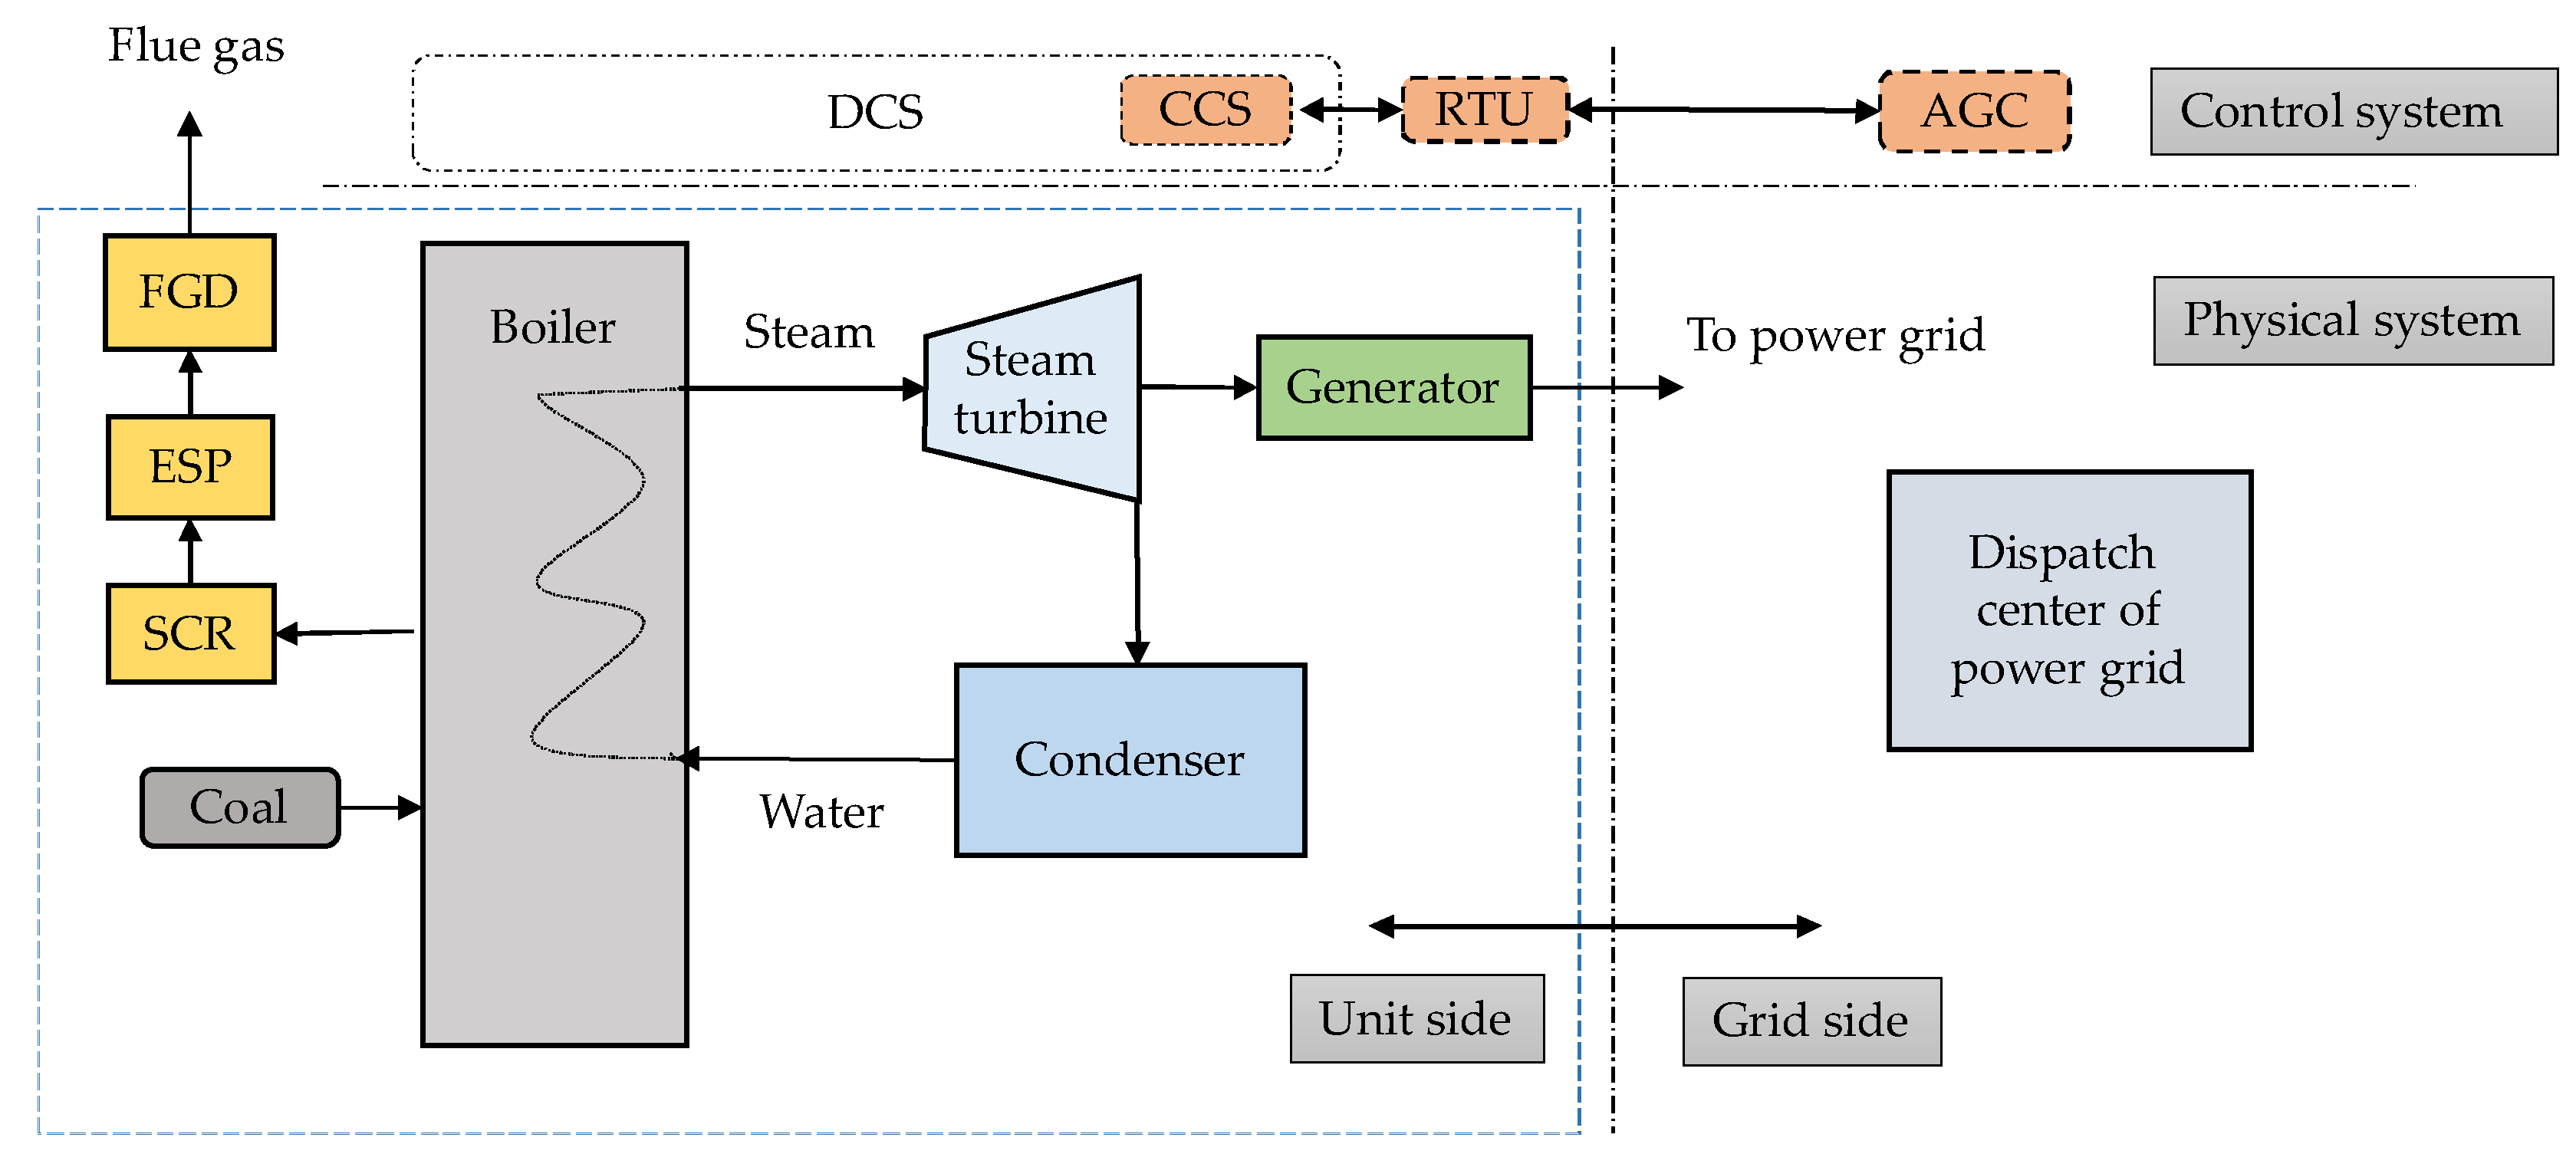
The schematic of a conventional coal-fired power unit (plant) is shown in Figure 5. The unit includes several key devices: boiler, steam turbine, generator, steam condenser and the flue gas purification equipment such as selective catalytic reduction (SCR), electrostatic precipitator (ESP) and the flue gas desulfurization (FGD). The system is briefly introduced as follows: the fuel (coal) is sent to the boiler to heat the water into steam, and the steam with a high temperature and high pressure is expanded in the turbine component. Then, the turbine drives the generator to generate the power, which is sent to the power grid, and the exhausted steam from the turbine is condensed by the condenser, which is usually cooled by water or air. Then, the water is sent to the boiler again as feedwater, and they complete a thermodynamic cycle finally. Simultaneously, the exhaust flue gas from the boiler is released into the atmosphere through the purification facilities.
The physical device system has been briefly introduced above, and for the control system, the whole coal-fired power unit is under the control of the distributed control system (DCS). The coordinate control system (CCS), one of the subsystems of the DCS, has the ability to respond to power load instructions sent out by the automatic generation control (AGC) system through the remote terminal unit (RTU) device, which is on the power plant side. However, the RTU is a functional part of the AGC system, which is one of the control systems of the power grid dispatch center.

4.1. Criteria Selection

As we mentioned in the Introduction, the coal-fired power plant is the most important power generation facility of the national power grid of China. Unlike the generalized energy system sustainable development analysis, in this paper, we just focus on the specific coal-fired power generation systems. That is, we performed the sustainability assessment just at the unit level and from the operational perspective.
For the coal-fired power units, we select the criteria that can reflect the operational sustainability considering the rules that the indicator set should be integrated, independent, available, etc. Referencing the literature [32,33,63,68], we selected five criteria categories with their own sub-criteria, that is flexibility (C1), economic (C2), environmental (C3), reliability (C4) and the technical criterion (C5). The detailed information is introduced as follows.

4.1.1. Flexibility Criterion

In recent years, for the existing coal-fired power units of China, what the electric grid has wanted is the operational flexibility to make the national energy system more sustainable, other than the power generating ability, as in the early years. Considering the technical availability, we select five sub-criteria from the AGC system, which can be obtained from the DCS system of the power unit. The indicators include: AGC availability ratio (SC11), which reflects the available state of the unit’s AGC function and is the ratio of the statistical time when the device maintains an available state to the total effective time during the statistical period. The effective time of the AGC system refers to the statistical period removing the unavailable time, which is not caused by the power plant itself, but usually by the maintenance reason or channel fault, etc. The AGC regulation rate factor (SC12) is the ratio of the regulating rate to the standard regulating rate of the electric power generation unit. The regulating rate is the average of the rising rate and the declining rate in the statistical period. The AGC regulation precision factor (SC13) is the ratio of the regulation deviation to the allowable deviation, where the regulation precision means the difference between the actual output to the AGC load instruction output. The regulation deviation is the value between the AGC load instruction with the actual stable output of the generator responding. The AGC response time factor (SC14) is the ratio of actual response time to the standard response time. The AGC response time is used to break through the regulation dead zone in the same adjustment direction based on the original generator output point. The AGC adjustable capacity (SC15) refers to the ratio of the adjustable unit capacity for the power grid to the design load rate.

4.1.2. Economic Criterion

For a power unit, the economic operation is the ability of resource savings and mainly reflects the efficiency of the facilities. The economic concept we used here is in techno-economic [63,68], which is a narrow sense of the conventional economic conception. These indicators can be gathered from the department of production management of the power plant.
The indicators include: The net coal consumption rate (SC21) is one of the most important indices representing power plant performance, which represents the amount of standard coal consumed per kWh and can reflect the operating status, maintenance quality and management level of a power plant. It can be deduced from the net efficiency of the power unit with the equation:
b = 3600 / ( H s t d η n e t )
where b is the net coal consumption rate, g/kWh; H s t d is the heat value of standard coal with the value of 29.308 kJ/g; and η n e t is the net efficiency of the unit.
The auxiliary power ratio (SC22) reflects the electric power consumption of the power unit itself in the process of power generation by the auxiliary devices such as fans and pumps. The oil consumption rate (SC23) is caused by the unit startup and sundown and the low-load combustion stability. The water consumption rate (SC24) reflects the water saving benefits and usually has a big difference in the different cooling conditions (water cooling or air cooling).

4.1.3. Environmental Criterion

Pollutant emissions are a major contributor to the environmental deterioration of China. To reflect the environment protection ability of the power unit operation, we mainly consider the gaseous pollutants in coal-fired boiler flue gas exhaust according to the current level of technology. The indicators include SO2 emission concentration (SC31), NOX emission concentration (SC32) and the dust emission concentration (SC23), which can be obtained by an online monitoring platform integrated with the DCS.
It should be noted that CO2 is not considered in this paper like [63] does. On the one hand, we argue that the emission level of CO2 mainly depends on the features of the input coal and the efficiency of the unit facility. However, the composition of the coal depends on its source and has little relationship with the sustainability level of the unit itself. Moreover, the efficiency of the unit is reflected by the C21 indicator (net coal consumption rate) indirectly. On the other hand, emission removal equipment has not been widely used in China, that is we have no effective control measures. The other pollutants like Hg and Cu [16,17] are not considered either for a similar reason. Otherwise, the original design of the power plants was based on the principle of water saving, and the optimization of the water balance system is carried out during the operation period. Thus, most of the wastewater is reused, and the remaining small amount of wastewater which is difficult to recover is comprehensively utilized in another way such as wetting dry ash and coal dust suppression. The power plants are discharged without any waste liquid [69]. Meanwhile, the coal ash is comprehensively utilized in a cyclic way. Thus, we do not consider the indicators of sewage.

4.1.4. Reliability Criterion

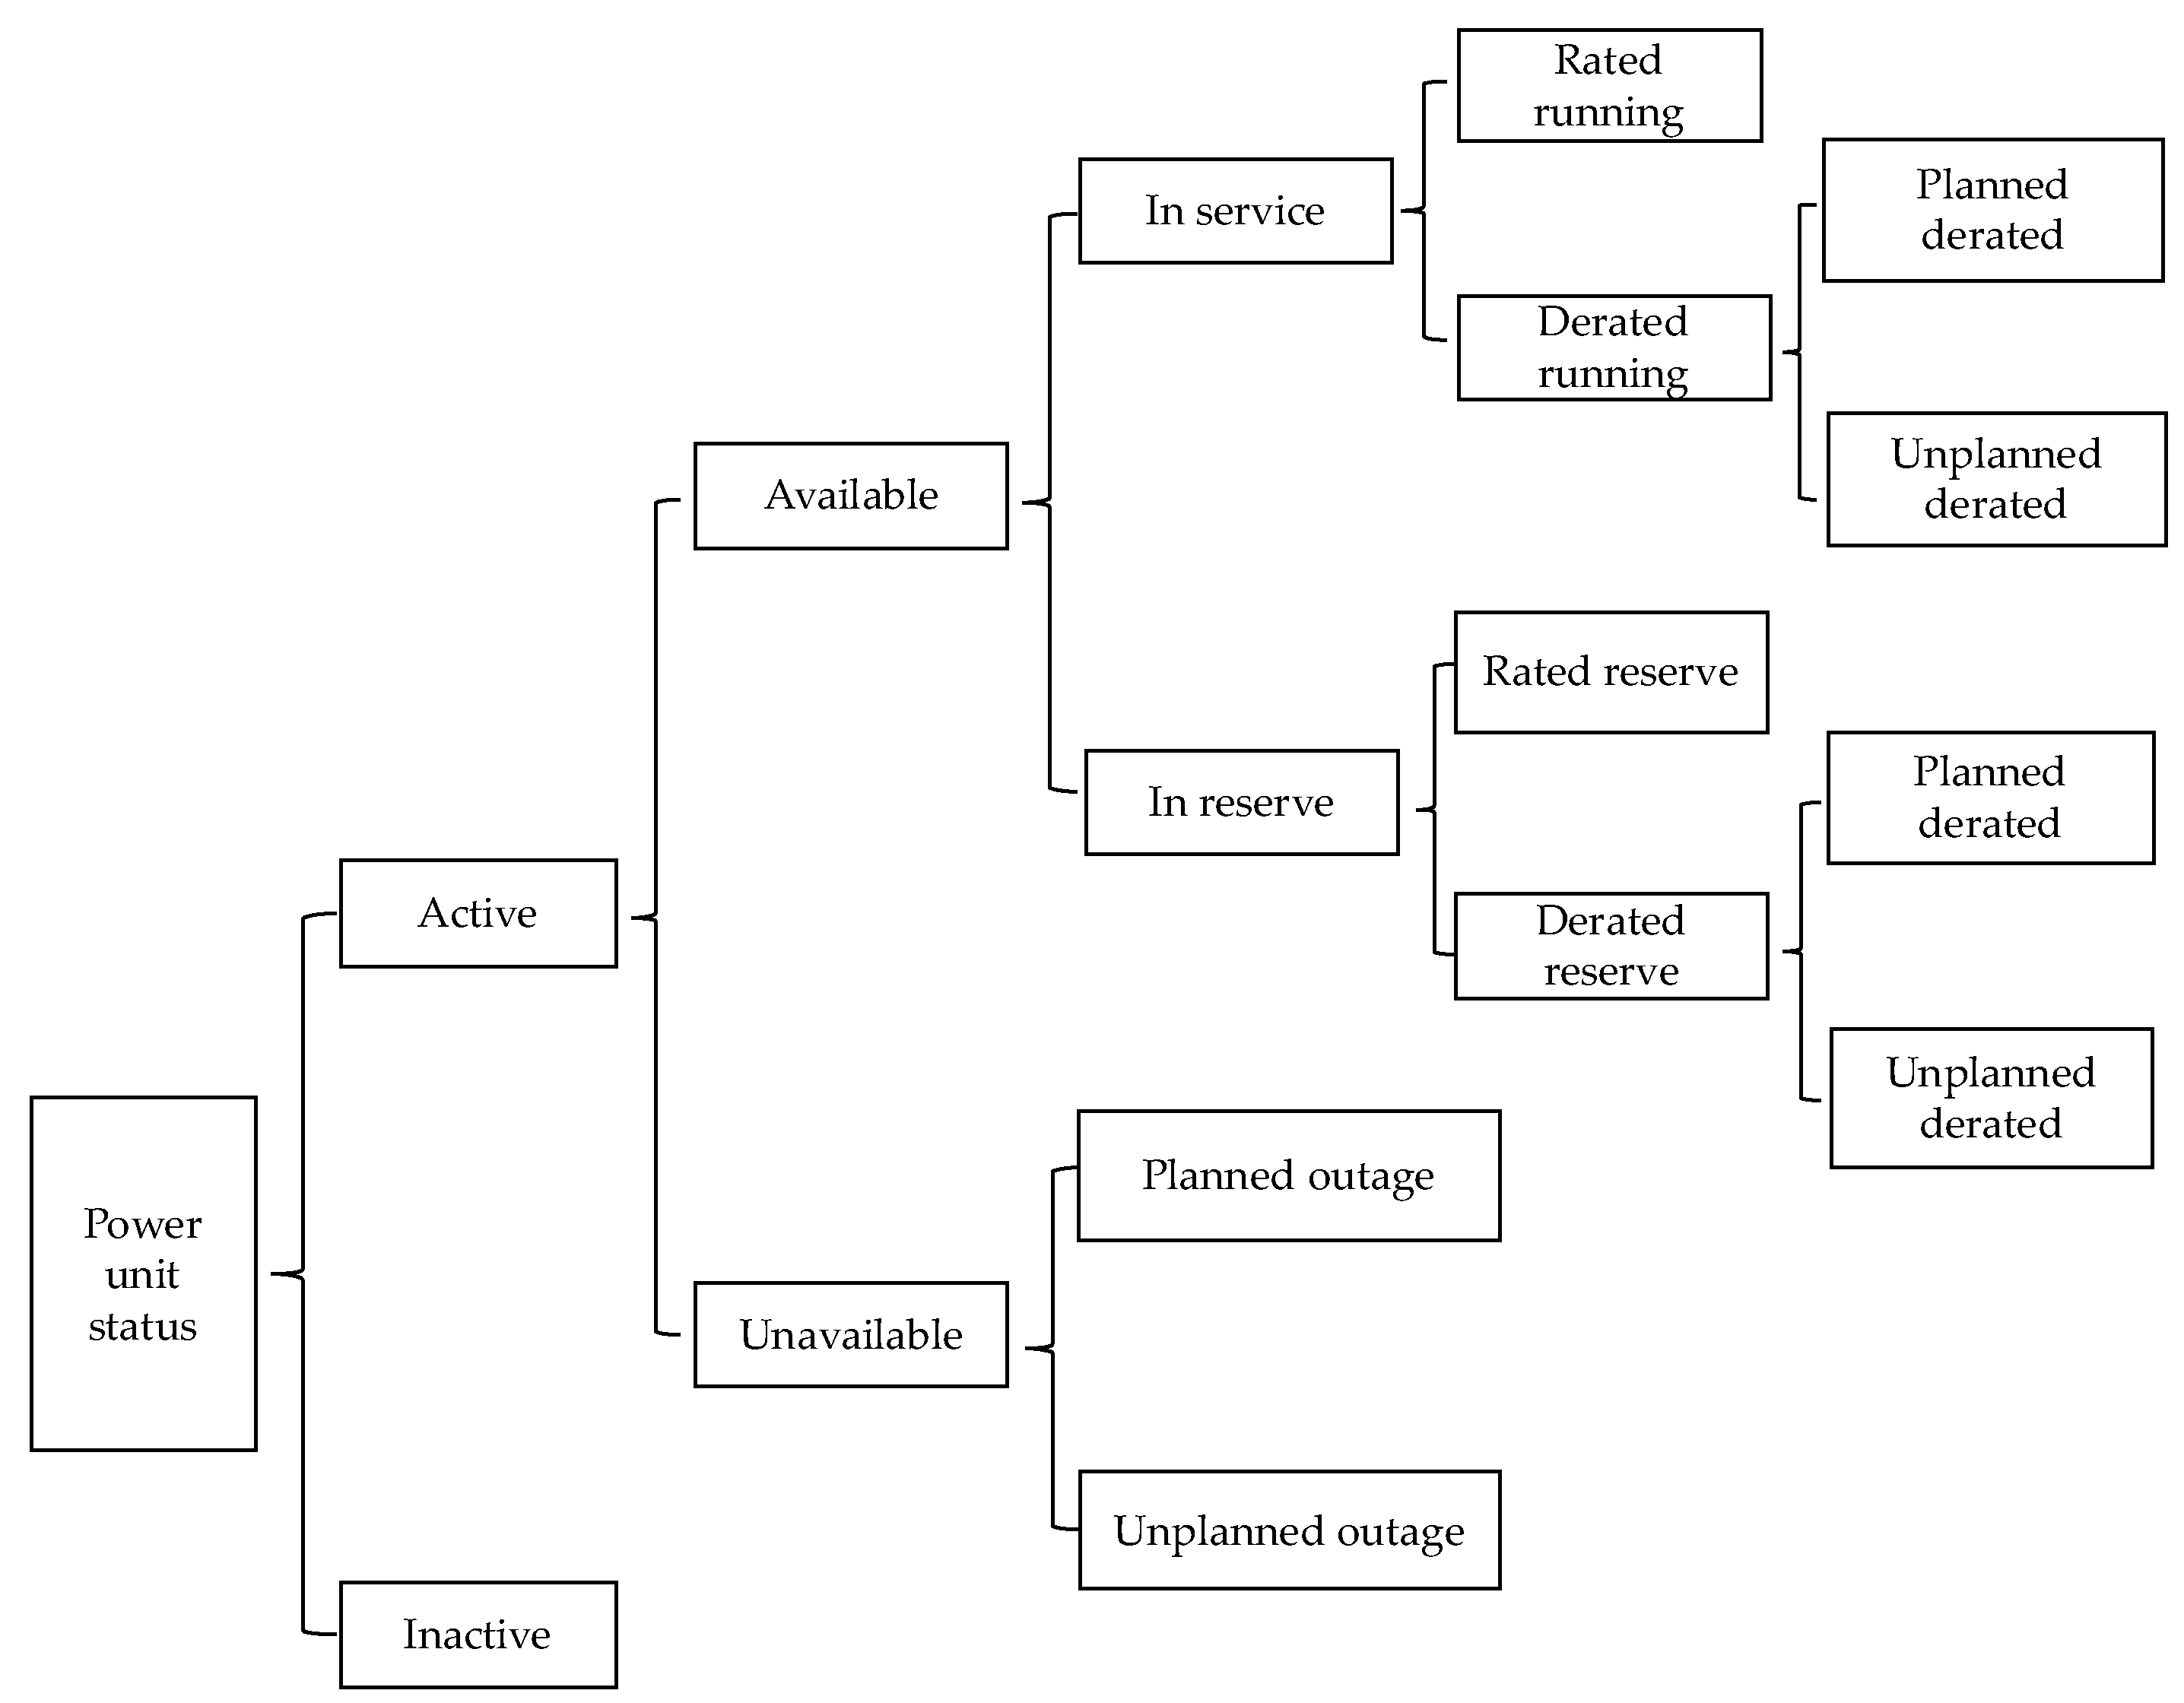
Sustainability is based on the premise of the reliability of the devices. The reliability reflects the technical level and management level of the power plant at present. We selected three comprehensive indicators to represent the reliability of the coal-fired power unit. Previously, we introduce some typical states of the unit possibly used by the reliability assessment: the status includes the active and inactive situation, and the active status contains available and unavailable states. When the unit is in an available state, it may be in service or in reserve. While the unit is in the service, in reserve or unavailable state, it can be divided into two situations, that is planned or unplanned, respectively. This information is shown in Figure 6.
The equivalent available factor (SC41) is a coefficient of the equivalent available hours to the statistical hours, where the equivalent available hours are equal to the available hours subtracting the equivalent outage hours during derated available hours. The operation exposure rate (SC42) is the ratio of the service time to the available time of a unit, and the available time is the summation of the service time and reserve time. This index reflects the reserve ratio indirectly. The equivalent forced outage rate (SC43) reflects the situation of an unplanned outage in a year. It is the ratio of the forced outage hours and the equivalent outage hours of the unplanned derated hours to the total statistical hours. These indicators can be accessed by the statistics of the production department of the power plants, and we take a year as a statistical period.

4.1.5. Technical Criterion

The power plant is a complex industrial system, which includes many subsystems as functional components, as illustrated in Figure 5. To ensure the continuous operation of the whole system, many subsystems have their own technical control index. However, in this paper, we aimed to assess the sustainability of the power generation system at the unit level. Thus, we were not concerned with the specific parameters such as the main steam pressure and temperature, whether or not they are beyond their technical allowable standards, and we only take the unit-level comprehensive indicators as the technique supervisory sub-criterion to assess the operational safety of the unit.
They include the desulphurization system input rate (SC51) and denitration system input rate (SC52) to assess the utilization of the environmental purification equipment, which refers to the ratios of the operational time of purification facilities to the total running time of coal-fired units during the statistical periods, respectively. The qualified steam and water quality ratio (SC53) refers to the ratio of qualification times to the total measurement times. The thermal protection system input rate (SC54) is the ratio of the amount of the in-service protection devices to the total amount protection devices of a unit. The relay protection system correct action rate (SC55) is the ratio of the number of protection system correct actions to the total number of actions in the statistical periods.
The five criterion categories we selected above (flexibility, economic, environmental, reliability and technical) and their sub-criteria construct the sustainability assessment system of the coal-fired power unit from different perspectives. The flexibility criteria reflect the ability to adapt to the future power grid with a high penetration rate of renewable energy generation. The economic criteria reflect the ability to save resources. The environmental criterion reflects the ability to be in harmony with the environment. The reliability and technical criteria reflect the precondition guarantee of the unit’s stable operation. Moreover, the criteria system is listed in Table 3.

4.2. Data Collection

The case study was performed with the data of eight 600-megawatt subcritical condensing power units, which are located in mid-west of the Inner Mongolia Autonomous Region of China, and the basic information is listed in Table 4. The basic configuration in the design mode is as follows.
The boilers of Unit 1 and Unit 2 use forced circulation and tangential combustion, and the other boilers use natural circulation and opposed firing. The feeding coal is bitumite with the supply mode of straight blowing, and all the boilers use plasma ignition mode. The design efficiencies of the boilers are 93.95% (Units 1–2), 93.43% (Units 3–4) and 94.36% (Units 5–8), respectively. Correspondingly, the designed heat consumption rates of steam turbine units are 7762 kJ/kWh (Units 1–2), 7773 kJ/kWh (Units 3–4) and 8153 kJ/kWh (Units 5–8), respectively. The condensers of Units 1–4 are cooled by water and the other four by air. All the units are equipped with a flue gas purification system, i.e., the flue gas desulfurization (FGD) system for SO2, the selective catalytic reduction (SCR) system for NOX and the electrostatic precipitator (ESP) for dust removal. Additionally, based on the design configuration, some units except Units 2 and 5 have completed the low-NOX combustion retrofit coupling with SCR to meet the rigorous ultra-lower emission requirements of China, and the other improvements such as the high-frequency power source retrofit of the ESP system and the upgrading of the desulfurization system were also performed.
The data in Table 4 were gathered by the authors at the end of the year 2016 as the annual average level and supplied by the electric production department of each plant, and the data were also checked by each superior of the power enterprises.

5. Results and Discussion

5.1. Calculation and Sustainability Assessment Results

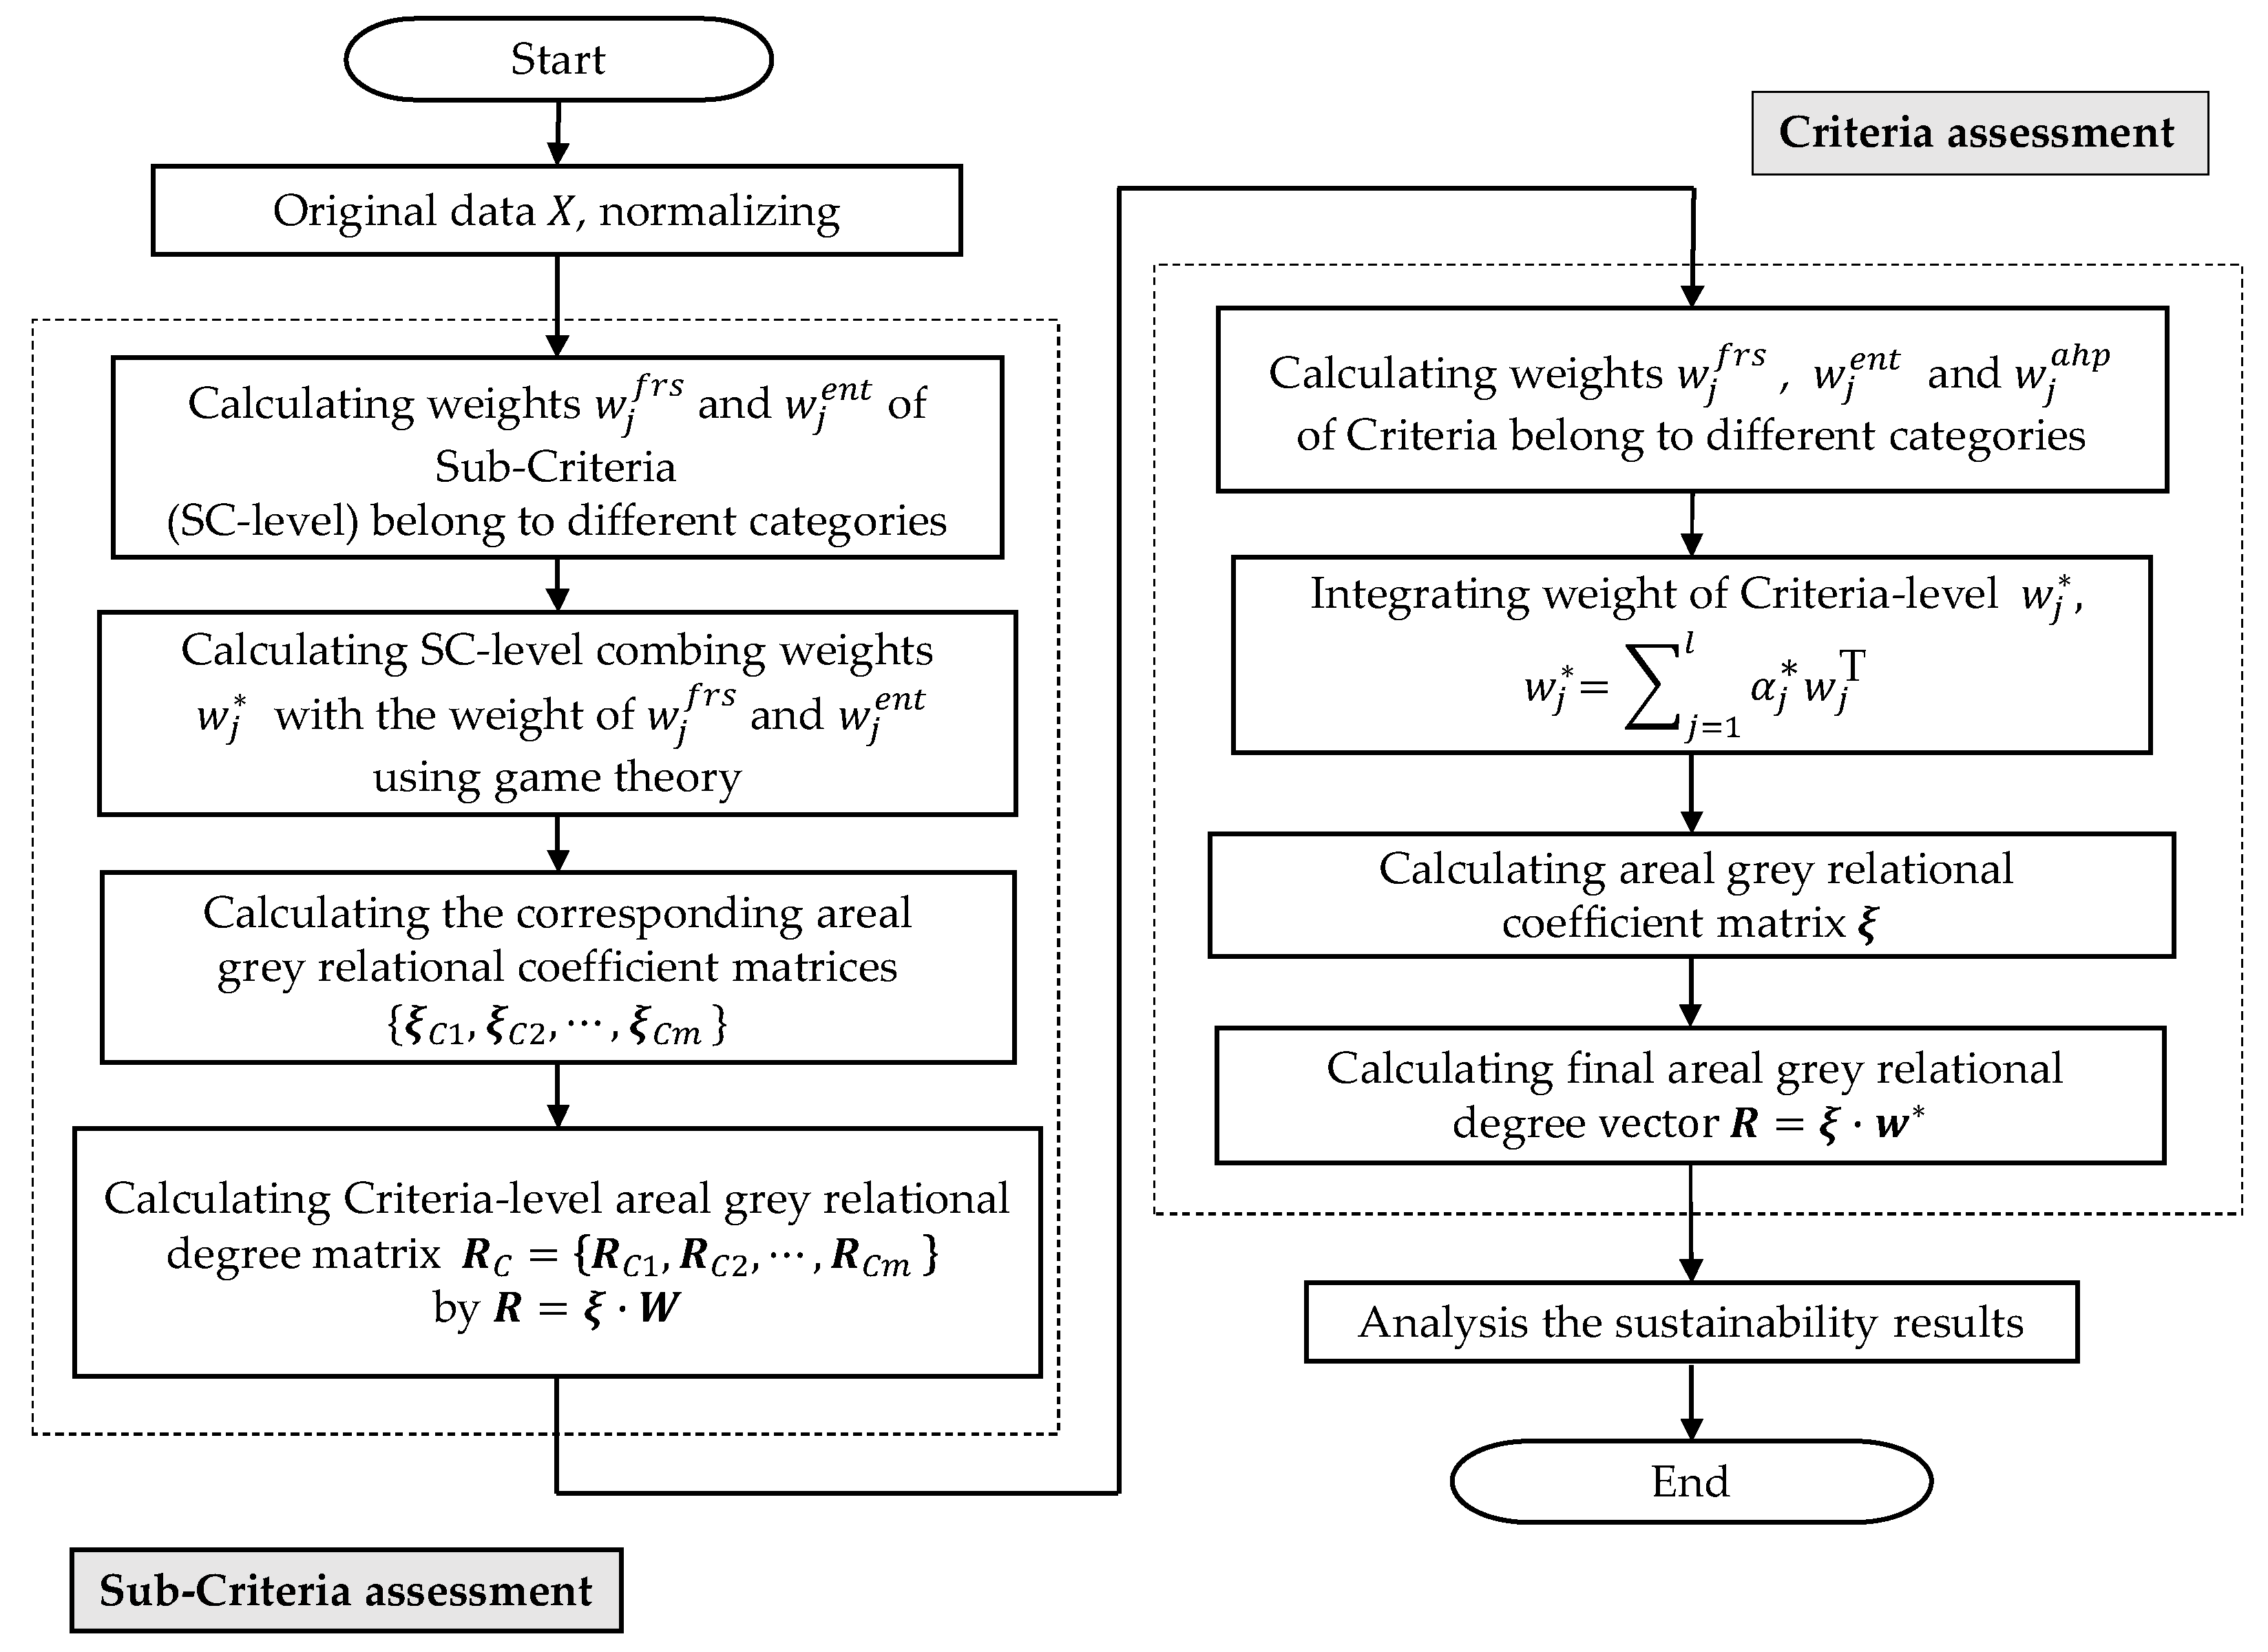
The sustainability assessment was performed according to the procedures introduced in Section 2. Firstly, we obtained the objective weights of each sub-criteria (SC-level) of the five criteria categories, i.e., flexibility (C1), economic (C2), environmental (C3), reliability (C4) and the technical (C5). In this step, the weights of FRS and the entropy method were calculated by the corresponding methods for the SC-level, and furthermore, the hybrid weights of each criterion categories were calculated by game theory. The weight results are listed in Table 5. The objective weights of the sub-criteria SC43, SC54 and SC55 scored zero mainly because the samples of the alternatives in these sub-criteria have the same data and the weighting methods were data-driven. Thus, they cannot be used to distinguish the alternatives. However, this does not mean that these sub-criteria can be neglected in the assessment processes.
With the hybrid weights shown in Table 5 and the AGRA method, we obtained five groups of sustainability assessment values of the eight power units under the five criteria, respectively. The results are listed in Table 6. The result shows that Unit 5 has the highest score with the criterion C1, and Unit 2 has the lowest. For the criterion C2, Unit 4 has the biggest score, followed by Unit 3. The two units are obviously better than the others in economic operation, and Unit 7 ranks last with the C1 criterion. For the environmental aspect, Unit 3 obtained the biggest sustainability score followed by Unit 8. Conversely, Units 2 and 5 rank at the end. The low scores of the last two are mainly because Units 2 and 5 have not completed the ultra-low emission retrofit like the other six units by the time we obtained data. Unit 7 has the highest reliability score, followed by Unit 1, with Unit 8 and Unit 2 ranking last. For the technical criterion, Units 3 and 7 have the maximum score due to all the assessed alternatives having the same data (the maximum possible value) under the two criteria, and Unit 5 has the lowest score.
The five groups’ sustainability values of the eight power units (in Table 6) performed with the sub-criteria data formed a new matrix. For this matrix, we calculated the weights using the FRS and entropy methods again, and also, in this step, we implemented the AHP procedures to get a subjective weight with the knowledge of experts (with a consistency ratio of 0.031 smaller than 0.1). The results are shown in Table 7. The AHP-based weight reflects that the flexibility criterion (C1) and the environmental (C3) criterion have obtained much more attention from experts, while the economic (C2) and reliability (C4) criteria have a similar priority score, and the technical (C5) criterion obtained the lowest attendance in the sustainability assessment. The high AHP weight score of C1 is based on the fact that it is a hot topic to improve the operational flexibility of the conventional coal-based power units in China at present, which is also considered to be one of the most promising ways to solve the current contradictions, such as the overcapacity of power generation and the high permeability ratio, which is caused by the rapid growth of renewable energy generation. On the other hand, the strict emission standard for power plants has been widely accepted and has gained continued attention, causing C2 to have the highest priority value, while C2 and C4 turn out to be relatively unimportant ones.
Different from the AHP method, the FRS and entropy methods obtained the weighting values from different perspectives correspondingly by exploiting the inherent data structure. The respective results reflect that C2 is the most important factor for sustainability assessment according to the FRS method, and C3 is the least important one; while for the entropy weight, C3 and C5 are obviously more important than the C1 and C2 criteria in the evaluation process. However, the final weight combines the three weights with a reasonable compromise by game theory, and the result shows that C3 is still the most important one as the AHP weight, while the C4 and C5 factors are becoming more important than C1and C2, so it is reasonable that C4 and C5 are the premises of the operational sustainability of power units.
Using the AGRA method with the data of Table 6 and the hybrid weight listed in Table 7, we get the final sustainability scores as follows:
R = [ 0.5716 0.3225 0.6543 0.6332 0.4292 0.4764 0.4990 0.5065 ]
Finally, we sort the scores (areal grey relational degree) of the eight coal-fired power units from small to large, and the corresponding rank result is:
U i n t   2 U i n t   5 U i n t   6 U i n t   7 U i n t   8 U i n t   1 U i n t   4 U i n t   3
The ranking result shows that Unit 3 has the highest score of sustainability from the operational perspective of the power unit, while Unit 2 ranks last. Unit 3 ranks first mainly owing to the good performance in the environmental and the technical aspects (see Table 6), and it also performed relatively well in the economic and reliability criteria. Unit 4 ranks second mainly due to the high scores in the economic and flexibility aspects. However, the performance of the rest of the criteria of Unit 4 is not outstanding among the other alternatives. The sustainability score of Unit 2 is the lowest one among the evaluated power units mainly because of the poor performance ranks in the flexibility, environmental and the reliability aspects. Unit 5 is just a little better than Unit 2 in the ranking list, which has poor performance on the technical and environmental aspects, and the other criteria are not prominent either. As mentioned in Section 4.2, Unit 2 and Unit 5 have poor environmental sustainability scores mainly due to the incomplete ultra-lower emission retrofit.
As analyzed above, the sustainability assessment using the proposed MCDM model has synthesized different sustainable features of the coal-fired power units from the operational aspects. The assessment framework is beneficial to the sustainable development of the existing power generation facilities.

5.2. The AHP Uncertainty Analysis

The MCDM methods can drive out a deterministic assessment result. However, sometimes, we need to know the result robustness information with the criteria weights that contain subjective factors. One of the optional methods is to implement sensitivity analysis on the weights. In this paper, we conducted this work in a statistical way, that is we used the probabilistic method to explore the features of the sustainability results caused by the process of the AHP weight generating.
We use the uncertainty analysis procedures mentioned in Section 3, generating 5000 group AHP weights that passed the consistency check. After that, we ran the proposed hybrid MCDM assessment method with the 5000 group AHP weights. Finally, we obtain 5000 group assessment results of the power units’ sustainability. The approximate statistical probability distribution is illustrated in
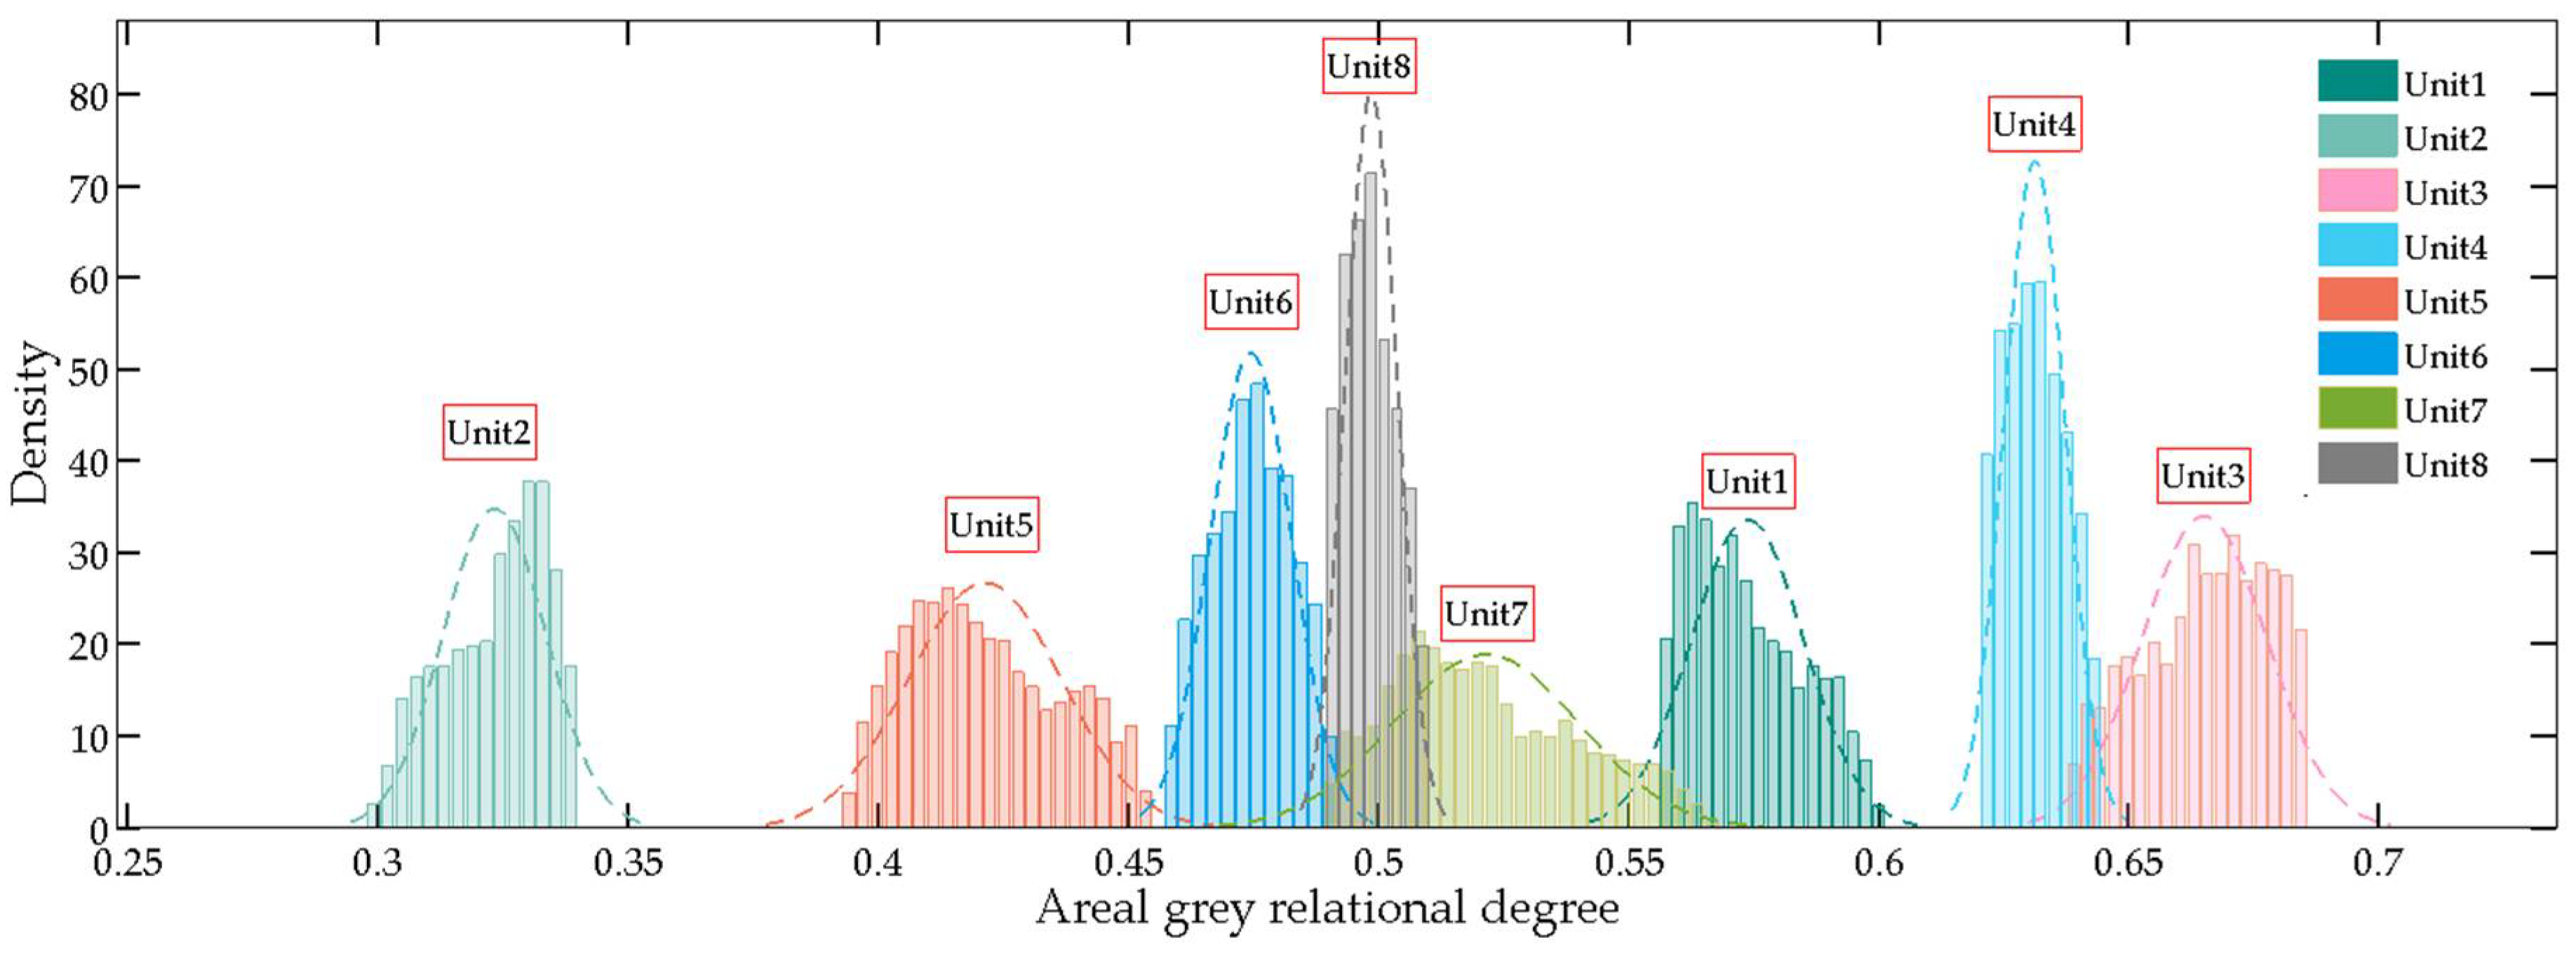
 Figure 7.
The distribution of the sustainability results of the eight power units shows that most of them are irregular in comparison with the corresponding normal distributions. Additionally, the range of the distribution intervals has the possibility of intersecting with the adjacent alternatives, such as Unit 3 with Unit 4, Unit 8 with Unit 6 and Unit 7 and Unit 7 with Unit 1. To express the uncertainty information quantitatively, we carried out some statistical information about the results series of the eight power units, which is listed in Table 8, including the mean value, standard deviation, 2.5% and 95.5% fractile and the interval range between them. Due to the possible asymmetry of these distributions, we define the width of the 95% confidential interval (CI) range (the last column in Table 8) other than the standard deviation to measure the alternatives’ uncertainties caused in the AHP procedures.
The results in Table 8 show that Unit 7 and Unit 5 have larger uncertainty values, and Unit 8 has the smallest value followed by Unit 4. That means Unit 8 and Unit 4 are more robust than the other alternatives with the possible weighting changes incurred by the AHP procedures, and the results are consistent with Figure 7.
However, the intersections of the distribution interval range such as Unit 3 and Unit 4 shown in Figure 7 do not mean the ranks of the two power units will be certainly swapped with each other. That is to say, Unit 3 may rank ahead of Unit 4 always. This is because the distribution curves shown in Figure 7 are only the representation of the alternatives in an independent way, and they are used just to illustrate the uncertainty ranges caused by the AHP method. In order to obtain more information, the statistical ranks are shown in Table 9, as [58,67] did.
As we discussed above, with 5000 times simulation, the result shows that Unit 3 always ranks first and Unit 4 second, and the others with a similar situation are Unit 2, Unit 5 and Unit 6. The numerical test also shows that the rank of Unit 7 may be changed with Unit 1 and Unit 8, with a probability of 0.22% and 14.06%, respectively. Obviously, Unit 7 is probabilistically superior to Unit 8 with a probability of 85.94% (Unit 7 and Unit 8 rank fourth and fifth probabilistically, respectively). However, the sustainability assessment result we performed in Section 5.1 shows that the sustainability score of Unit 7 is less than Unit 8. The contrast shows that the stochastic method can obtain extra information sometimes, and Unit 7 may have a bigger sustainability score than Unit 8 with different experts.

5.3. The Distribution of the AHP Weight Components

In this subsection, we discuss some other complementary information about the AHP uncertainty analysis process. As mentioned in Section 3, we simulate the process in performing the pairwise comparison matrix with equal probability under the classical scales (see 
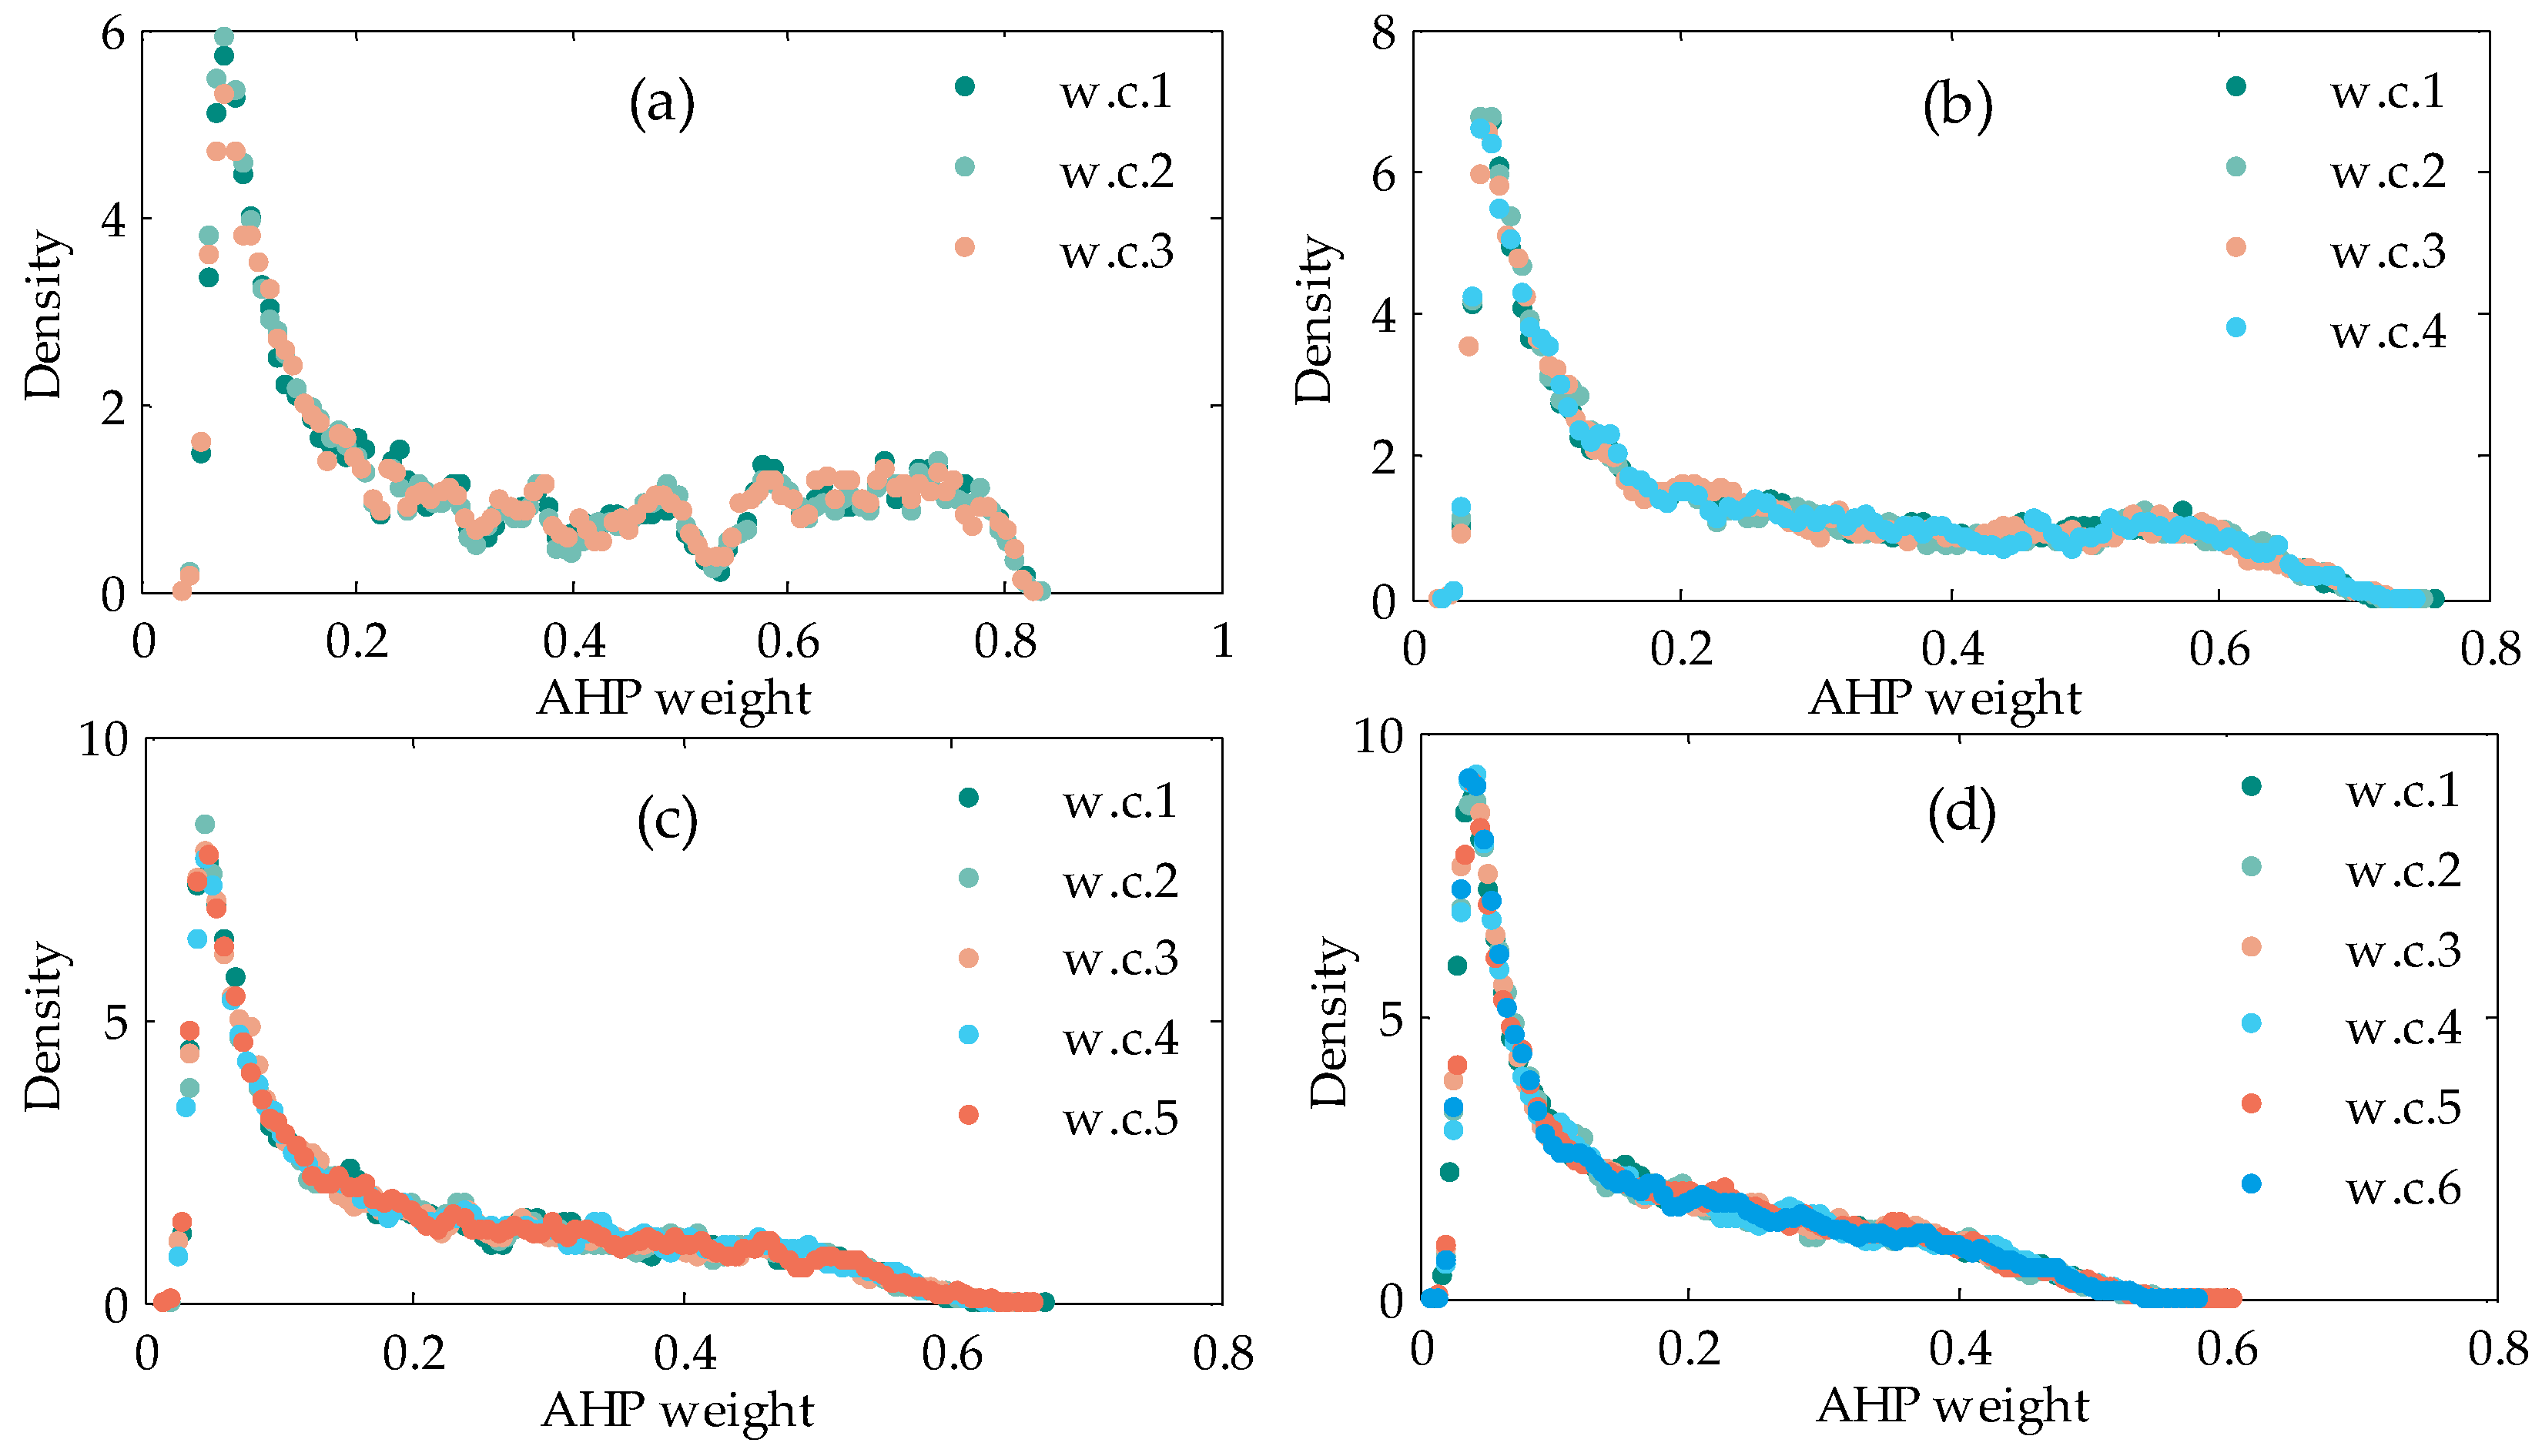
Table 1), which should be the work of the experts in the conventional AHP procedures. We display the probability distributions of the AHP weight components (w.c.) with the dimensions (criterion number) from 3–6 in Figure 8. The curves are discrete because the AHP weight components are discontinuous with the simulation method.
Figure 8 shows that every weight component has almost the same distribution and distribution curves with different dimensions, and it has a similar shape except for the main value interval of every component. The main value intervals become smaller as the dimension number increases from 3–6. The results also reflect that the asymmetrical alternative distributions in Figure 7 may not only be due to the nonlinearity of the MCDM model itself, but also may be related to the features of the input AHP weights.
On the other hand, in the process of calculating the AHP weight by creating a pairwise comparison matrix with its elements selected randomly, the time cost increases sharply to obtain the right AHP weight that can pass through the consistency check. This is because the combination of the matrix elements have 18 m ( m 1 ) / 2 possible values, where the m is the criteria number of the AHP weight. Some corresponding information is listed in Table 10 with the weight varying from 3–6. The mean denied number refers to the average failed times with a consistency check passed weight, and the total time consumption means the cumulative time we used to generate 5000 group available weights. The result shows that the time increased to 30,681 s (about 8.5 h) when the weight dimension is six. The details reflect that it is not a good idea to use the uncertainty analysis method introduced in this work on a personal computer when the MCDM problem has many criteria (such as greater than six).

5.4. Limitations

In this paper, we developed a hybrid MCDM model and introduced the AHP weight uncertainty analysis with stochastic simulation method, and after that, we implement a case study to illustrate the sustainability assessment of coal-fired power units from an operational perspective. However, it some limitations of our work should be noted.
The proposed MCDM approach using AGRA and a hybrid weight was only validated by the theoretical analysis of the case study results, and it is not verified in a practical way at present due to the current technology situation. That is, in order to figure out whether the assessment results work well, a long-term tracking study may be needed. For example, if the reward and punishment policies published by the electric plant management based on the sustainability assessment are widely accepted by most of the candidate power units, then the method is verified to be effective for the problem of coal-fired power plants.
In the process of AHP weight calculation, we invited three experts (two professors from the university and one engineer from the power plant) to complete the pairwise comparison matrix. The elements of the matrix (priorities of the five criteria) were determined by compromising their arguments, and the element adjustment work was done in the same way when the consistency check failed. However, the AHP weight result would be more reliable if more experts were involved, with the aggregation methods of group decision [42] or statistics [60]. That is, more experts coming from different subfields may balance each other’s prejudices and the incompleteness of their knowledge.
Additionally, in the process of AHP weight uncertainty analysis, we selected the elements of the comparison matrix from Equation (28) in Section 3 only with a uniform distribution by the MC simulation method. However, the distribution may vary with the specific evaluation problems due to the decision makers who always have their own preferences for some kind of criteria. Anyway, the stochastic method we used in this work is mainly to measure the possibly varying range of the assessment result caused by the uncertainty of the AHP method. However, the distribution of the sampling can be replaced by a custom one if necessary, for example the normal distribution [60]. Diverse distributions are also allowable with different elements. On the other hand, the uncertainty measurement of the attribute value is obviously another point worthy of study, which was not carried out in this paper. The MC method may be used for this question if we have the uncertainty ranges and the determinate distributions for all the attribute values of specific indicators, and we will focus on this related issue in future work.
It is a complex project to assess the sustainability of the existing coal-fired power units with the MCDM method. The non-uniqueness of the assessment result is not only due to the variation of the optional MCDM approach but also due to the difficulty in establishing an appropriate criteria system. For the assessment of the power unit’s sustainability, we only focus on the operational aspect at the device level in this paper. Additionally, the economic indicators we selected are closer to the techno-economic aspects that mainly focus on the consumption of economic resources like fuel, water and power. However, the criteria such as the overall levelized cost of electricity generation and the marginal operating cost will be more meaningful in the future for sustainability purposes because they are more comprehensive indicators with the consideration of the fixed assets’ depreciation, the operation cost, maintenance cost, financial expenses, tax factor, etc.

6. Conclusions

In this paper, a hybrid MCDM model was developed for the sustainability assessment of coal-fired power units. The model integrates AGRA with a combined criteria weight. As a case study, sustainability assessment of the eight coal-fired power units with five criteria categories (flexibility, economic, environmental, reliability and technical) was performed subsequently.
We can conclude that it is feasible to use the proposed hybrid model to evaluate the sustainability of the coal-fired power plant from an operational perspective. The AGRA method has the inherent features of considering the relationship between the adjacent indicators, while the combined weight fuses the objective and subjective weights together. This work has extended a novel hybrid MCDM model used for sustainability measurement. Moreover, the AHP weighting uncertainty analysis can provide extra information in the process of sustainability assessment. The uncertainty analysis results can reflect the sensitivity of the evaluation results to the subjective criteria weight from a statistical perspective. The 95% confidential interval range of the result distributions obtained by the stochastic AHP method can be used as an uncertainty measure index. However, the amount of calculation grows sharply with the increase of the criteria dimension.
This work provided a method of sustainability assessment for the existing coal-fired power generation facilities by focusing on the operational performances. It will benefit the coal-based power generation enterprises of China to make their own sustainability level clear. The enterprises, which are encountering the development dilemma caused by the energy transition from fossil to sustainable energy sources, can take corresponding measures to enhance their sustainability level in the future based on a reasonable assessment.

Author Contributions

D.W. and Y.Y. proposed the comprehensive evaluation method. D.W. and Z.Y. conducted the analysis of various evaluation methods. N.W. and C.L. conducted the case study and wrote the paper. D.W. developed the main program codes and contributed to the main work reported.

Funding

This research was funded by the National Basic Research Program (973 Program) (2015CB251505).

Acknowledgments

We thank Degang Chen for providing subprogram codes of the fuzzy rough set for the weighting calculation.

Conflicts of Interest

The authors declare no conflict of interest.

Nomenclature

Abbreviations
AGCautomatic generation control
AGRAareal grey relational analysis
AHPanalytic hierarchy process
CCScoordination control system
CIconsistency index in AHP, confidence interval in statistics
CRconsistency ratio in the AHP method
CRITICcriteria importance through inter-criteria correlation
DCSdistributed control system
ESPelectrostatic precipitator
FGDflue gas desulfurization
GRAgrey relational analysis
GRDgrey relational degree
LCAlife cycle assessment
MCDMmulti-criteria decision making
MCMonte Carlo
RTUremote terminal unit
SCRselective catalytic reduction
SPAset pair analysis
TOPSIStechnique for order preference by similarity to an ideal solution
Symbols
ξ the areal grey relational coefficient
ρ the distinguishing coefficient of GRA
λ m a x maximum eigenvalue of the AHP comparison matrix
η n e t net efficiency of the power unit
a , x , y , z , p element of matrix
b net coal consumption rate
a j alternative
a ¯ , z ¯ mean value
e j entropy value
f i ( j ) flag function
m a x maximum
m i n minimum
r linear correlation coefficient
s i j areal elements in AGRA method
s i g significance degree
A , X , Y , U matrix
B simulation times
F ( U × U ) fuzzy power set
H s t d the heat value of the standard coal
P , Q fuzzy equivalence relation
R _ X ( x ) , R ¯ X ( x ) lower and upper approximation operators
R , r grey relational degree, fuzzy relation
S area, knowledge representation system
W , w weight vector and element
Subscripts and Superscripts
m , n , l dimension of matrix
i , j , h , k , b index of vector or matrix
0 reference
f r s , e n t , a h p based on FRS, entropy, AHP method
T transpose symbol of the vector, similarity relation

References

  1. Farfan, J.; Breyer, C. Structural changes of global power generation capacity towards sustainability and the risk of stranded investments supported by a sustainability indicator. J. Clean. Prod. 2017, 141, 370–384. [Google Scholar] [CrossRef]
  2. Li, J.; Geng, X.; Li, J. A Comparison of Electricity Generation System Sustainability among G20 Countries. Sustainability 2017, 8, 1276. [Google Scholar] [CrossRef]
  3. Pambudi, N.A.; Itoi, R.; Jalilinasrabady, S.; Gürtürk, M. Sustainability of geothermal power plant combined with thermodynamic and silica scaling model. Geothermics 2018, 71, 108–117. [Google Scholar] [CrossRef]
  4. Sun, X.; Zhang, B.; Tang, X.; Mclellan, B.; Höök, M. Sustainable Energy Transitions in China: Renewable Options and Impacts on the Electricity System. Energies 2016, 9, 980. [Google Scholar] [CrossRef]
  5. Beires, P.; Vasconcelos, M.H.; Moreira, C.L.; Lopes, J.A.P. Stability of autonomous power systems with reversible hydro power plants: A study case for large scale renewables integration. Electr. Power Syst. Res. 2018, 158, 1–14. [Google Scholar] [CrossRef]
  6. Phillips, J. Determining the sustainability of large-scale photovoltaic solar power plants. Renew. Sustain. Energy Rev. 2013, 27, 435–444. [Google Scholar] [CrossRef]
  7. Zhao, X.; Cai, Q.; Zhang, S.; Luo, K. The substitution of wind power for coal-fired power to realize China’s CO2 emissions reduction targets in 2020 and 2030. Energy 2016, 120, 164–178. [Google Scholar] [CrossRef]
  8. Stougie, L.; Tsalidis, G.A.; Kooi, H.J.V.D.; Korevaar, G. Environmental and exergetic sustainability assessment of power generation from biomass. Renew. Energy 2017. [Google Scholar] [CrossRef]
  9. Council, C.E. Annual Development Report of China Electric Power Industry 2017, 1st ed.; China Market Press: Beijing, China, 2017. [Google Scholar]
  10. Yuan, J.; Li, P.; Wang, Y.; Liu, Q.; Shen, X.; Zhang, K.; Dong, L. Coal power overcapacity and investment bubble in China during 2015–2020. Energy Policy 2016, 97, 136–144. [Google Scholar] [CrossRef]
  11. Zeng, M.; Zhang, P.; Yu, S.; Liu, H.; Zeng, M.; Zhang, P.; Yu, S.; Liu, H.; Zeng, M.; Zhang, P. Overall review of the overcapacity situation of China’s thermal power industry: Status quo, policy analysis and suggestions. Renew. Sustain. Energy Rev. 2017, 76, 768–774. [Google Scholar]
  12. Hübel, M.; Meinke, S.; Andrén, M.T.; Wedding, C.; Nocke, J.; Gierow, C.; Hassel, E.; Funkquist, J. Modelling and simulation of a coal-fired power plant for start-up optimisation. Appl. Energy 2017. [Google Scholar] [CrossRef]
  13. Liu, M.; Zhang, X.; Ma, Y.; Yan, J. Thermo-economic analyses on a new conceptual system of waste heat recovery integrated with an S-CO2 cycle for coal-fired power plants. Energy Convers. Manag. 2018, 161, 243–253. [Google Scholar] [CrossRef]
  14. Hu, Q.; Li, X.; Lin, A.; Qi, W.; Li, X.; Yang, X.J. Total emission control policy in China. Environ. Dev. 2017. [Google Scholar] [CrossRef]
  15. Ma, Z.; Deng, J.; Li, Z.; Li, Q.; Zhao, P.; Wang, L.; Sun, Y.; Zheng, H.; Pan, L.; Zhao, S. Characteristics of NOx emission from Chinese coal-fired power plants equipped with new technologies. Atmos. Environ. 2016, 131, 164–170. [Google Scholar] [CrossRef]
  16. Li, R.; Li, J.; Cui, L.; Wu, Y.; Fu, H.; Chen, J.; Chen, M. Atmospheric emissions of Cu and Zn from coal combustion in China: Spatio-temporal distribution, human health effects, and short-term prediction. Environ. Pollut. 2017, 229, 724–734. [Google Scholar] [CrossRef] [PubMed]
  17. Li, C.; Duan, Y.; Tang, H.; Zhu, C.; Li, Y.N.; Zheng, Y.; Liu, M. Study on the Hg emission and migration characteristics in coal-fired power plant of China with an ammonia desulfurization process. Fuel 2017, 211, 621–628. [Google Scholar] [CrossRef]
  18. Ji, X.; Li, G.; Wang, Z. Impact of emission regulation policies on Chinese power firms, reusable environmental investments and sustainable operations. Energy Policy 2017, 108. [Google Scholar] [CrossRef]
  19. Cai, F. China’s Economic New Normal and Supply-Side Structural Reform, 1st ed.; Foreign Languages Press: Beijing, China, 2016. [Google Scholar]
  20. Nuer, B. Counseling Reader for the 13th Five-Year Energy Development Plan, 1st ed.; China Electric Power Press: Beijing, China, 2017. [Google Scholar]
  21. Kubik, M.L.; Coker, P.J.; Barlow, J.F. Increasing thermal plant flexibility in a high renewables power system. Appl. Energy 2015, 154, 102–111. [Google Scholar] [CrossRef]
  22. Kopiske, J.; Spieker, S.; Tsatsaronis, G. Value of power plant flexibility in power systems with high shares of variable renewables: A scenario outlook for Germany 2035. Energy 2017. [Google Scholar] [CrossRef]
  23. Kai, W.; Carmona, L.G.; Sousa, T. A review of the use of exergy to evaluate the sustainability of fossil fuels and non-fuel mineral depletion. Renew. Sustain. Energy Rev. 2017, 76, 202–211. [Google Scholar]
  24. Bilgen, S.; Sarıkaya, İ. Exergy for environment, ecology and sustainable development. Renew. Sustain. Energy Rev. 2015, 51, 1115–1131. [Google Scholar] [CrossRef]
  25. Pan, H.; Geng, Y.; Jiang, P.; Dong, H.; Sun, L.; Wu, R. An emergy based sustainability evaluation on a combined landfill and LFG power generation system. Energy 2018, 143. [Google Scholar] [CrossRef]
  26. Su, M.R.; Yang, Z.F.; Chen, B.; Ulgiati, S. Urban ecosystem health assessment based on emergy and set pair analysis—A comparative study of typical Chinese cities. Ecol. Model. 2009, 220, 2341–2348. [Google Scholar] [CrossRef]
  27. Atilgan, B.; Azapagic, A. Assessing the Environmental Sustainability of Electricity Generation in Turkey on a Life Cycle Basis. Energies 2016, 9, 31. [Google Scholar] [CrossRef]
  28. Elena Arce, M.; Saavedra, Á.; Míguez, J.L.; Granada, E. The use of grey-based methods in multi-criteria decision analysis for the evaluation of sustainable energy systems: A review. Renew. Sustain. Energy Rev. 2015, 47, 924–932. [Google Scholar] [CrossRef]
  29. Cinelli, M.; Coles, S.R.; Kirwan, K. Analysis of the potentials of multi criteria decision analysis methods to conduct sustainability assessment. Ecol. Indic. 2014, 46, 138–148. [Google Scholar] [CrossRef]
  30. Zhao, H.; Li, N. Optimal Siting of Charging Stations for Electric Vehicles Based on Fuzzy Delphi and Hybrid Multi-Criteria Decision Making Approaches from an Extended Sustainability Perspective. Energies 2016, 9, 270. [Google Scholar] [CrossRef]
  31. Diaz-Balteiro, L.; González-Pachón, J.; Romero, C. Measuring systems sustainability with multi-criteria methods: A critical review. Eur. J. Oper. Res. 2017, 258, 607–616. [Google Scholar] [CrossRef]
  32. Claudia Roldán, M.; Martínez, M.; Peña, R. Scenarios for a hierarchical assessment of the global sustainability of electric power plants in México. Renew. Sustain. Energy Rev. 2014, 33, 154–160. [Google Scholar] [CrossRef]
  33. Škobalj, P.; Kijevčanin, M.; Afgan, N.; Jovanović, M.; Turanjanin, V.; Vučićević, B. Multi-Criteria sustainability analysis of thermal power plant Kolubara-A unit 2. Energy 2017, 125. [Google Scholar] [CrossRef]
  34. Cobuloglu, H.I.; Büyüktahtakın, İ.E. A stochastic multi-criteria decision analysis for sustainable biomass crop selection. Expert Syst. Appl. 2015, 42, 6065–6074. [Google Scholar] [CrossRef]
  35. Wang, J.J.; Jing, Y.Y.; Zhang, C.F.; Zhao, J.H. Review on multi-criteria decision analysis aid in sustainable energy decision-making. Renew. Sustain. Energy Rev. 2009, 13, 2263–2278. [Google Scholar] [CrossRef]
  36. Karahalios, H. The application of the AHP-TOPSIS for evaluating ballast water treatment systems by ship operators. Transp. Res. Part D Transp. Environ. 2017, 52, 172–184. [Google Scholar] [CrossRef]
  37. Dinmohammadi, A.; Shafiee, M. Determination of the Most Suitable Technology Transfer Strategy for Wind Turbines Using an Integrated AHP-TOPSIS Decision Model. Energies 2017, 10, 642. [Google Scholar] [CrossRef]
  38. Guili, Y.; Jianhua, Z.; Tianhong, W.; Juan, D. Comprehensive energy-saving evaluation of thermal power plants based on TOPSIS gray relational projection and the weight sensitivity analysis. J. Chin. Soc. Power Eng. 2015, 35, 404–411. [Google Scholar]
  39. Saaty, T.L. How to Make a Decision: The Analytic Hierarchy Process. Eur. J. Oper. Res. 1994, 24, 19–43. [Google Scholar] [CrossRef]
  40. Zeng, F.; Cheng, X.; Guo, J.; Tao, L.; Chen, Z. Hybridising Human Judgment, AHP, Grey Theory, and Fuzzy Expert Systems for Candidate Well Selection in Fractured Reservoirs. Energies 2017, 10, 447. [Google Scholar] [CrossRef]
  41. Zhao, H.; Yao, L.; Mei, G.; Liu, T.; Ning, Y. A Fuzzy comprehensive evaluation method based on AHP and Entropy for landslide susceptibility map. Entropy 2017. [Google Scholar] [CrossRef]
  42. Ishizaka, A.; Labib, A. Review of the main developments in the analytic hierarchy process. Expert Syst. Appl. 2011, 38, 14336–14345. [Google Scholar] [CrossRef] [Green Version]
  43. Liang, J.; Shi, Z.; Li, D.; Wierman, M.J. Information entropy, rough entropy and knowledge granulation in incomplete information systems. Int. J. Gen. Syst. 2006, 35, 641–654. [Google Scholar] [CrossRef]
  44. Zhou, R.; Pan, Z.; Jin, J.; Li, C.; Ning, S. Forewarning Model of Regional Water Resources Carrying Capacity Based on Combination Weights and Entropy Principles. Entropy 2017, 19, 574. [Google Scholar] [CrossRef]
  45. Deng, J.L. Introduction grey system theory. J. Grey Syst. 1989, 1, 191–243. [Google Scholar]
  46. Chen, D.; He, Q.; Wang, X. FRSVMs: Fuzzy rough set based support vector machines. Fuzzy Sets Syst. 2010, 161, 596–607. [Google Scholar] [CrossRef]
  47. Chen, D.; Zhao, S. Local reduction of decision system with fuzzy rough sets. Fuzzy Sets Syst. 2010, 161, 1871–1883. [Google Scholar]
  48. Men, B.; Liu, H.; Tian, W.; Liu, H. Evaluation of Sustainable Use of Water Resources in Beijing Based on Rough Set and Fuzzy Theory. Water 2017, 9, 852. [Google Scholar] [CrossRef]
  49. Caixin, S.; Jian, L.; Haiping, Z.; Ji, Y.; Xiong, F. A New Method of Faulty Insulation Diagnosis in Power Transformer Based On Degree of Area Incidence Analysis. Power Syst. Technol. 2002, 26, 24–29. [Google Scholar]
  50. Mingjian, C.; Yuanzhang, S.; Jun, Y.; Yuanlin, L.; Weinan, W. Power Grid Security Comprehensive Assessment Based on Multi-Level Grey Area Relational Analysis. Power Syst. Technol. 2013, 37, 3453–3460. [Google Scholar]
  51. Jiang, S.-Q.; Liu, S.; Liu, Z.-X.; Fang, Z.-G. Grey incidence decision making model based on area. Control Decis. 2015, 30, 685–690. [Google Scholar]
  52. Minfang, Q.; Zhongguang, F.; Yuan, J.; Ya, M. Comprehensive Evaluation Method of Power Plant Unit Based on Information Entropy and Principal Component Analysis. Proc. CSEE 2013, 33, 58–64. [Google Scholar]
  53. Diakoulaki, D.; Mavrotas, G.; Papayannakis, L. Determining objective weights in multiple criteria problems: The critic method. Comput. Oper. Res. 1995, 22, 763–770. [Google Scholar] [CrossRef]
  54. Zhang, Z. Attributes reduction based on intuitionistic fuzzy rough sets. J. Intell. Fuzzy Syst. 2016, 30, 1127–1137. [Google Scholar] [CrossRef]
  55. Lai, C.; Chen, X.; Chen, X.; Wang, Z.; Wu, X.; Zhao, S. A fuzzy comprehensive evaluation model for flood risk based on the combination weight of game theory. Nat. Hazards 2015, 77, 1243–1259. [Google Scholar] [CrossRef]
  56. Sun, L.; Liu, Y.; Zhang, B.; Shang, Y.; Yuan, H. An Integrated Decision-Making Model for Transformer Condition Assessment Using Game Theory and Modified Evidence Combination Extended by D Numbers. Energies 2016, 9. [Google Scholar] [CrossRef]
  57. Carmone, F.J., Jr.; Kara, A.; Zanakis, S.H. A Monte Carlo investigation of incomplete pairwise comparison matrices in AHP. Eur. J. Oper. Res. 1997, 102, 538–553. [Google Scholar] [CrossRef]
  58. Hsu, T.; Pan, F.F.C. Application of Monte Carlo AHP in ranking dental quality attributes. Expert Syst. Appl. 2009, 36, 2310–2316. [Google Scholar] [CrossRef]
  59. Yaraghi, N.; Tabesh, P.; Guan, P.; Zhuang, J. Comparison of AHP and Monte Carlo AHP Under Different Levels of Uncertainty. IEEE Trans. Eng. Manag. 2015, 62, 122–132. [Google Scholar] [CrossRef]
  60. Mohammad, A.; Hashem, S.; Reza, M. Monte Carlo Analytic Hierarchy Process (MAHP) approach to selection of optimum mining method. Int. J. Min. Sci. Technol. 2013, 23, 573–578. [Google Scholar]
  61. Zhao, H.; Li, N. Performance Evaluation for Sustainability of Strong Smart Grid by Using Stochastic AHP and Fuzzy TOPSIS Methods. Sustainability 2016, 8, 129. [Google Scholar] [CrossRef]
  62. Scannapieco, D.; Naddeo, V.; Belgiorno, V. Sustainable power plants: A support tool for the analysis of alternatives. Land Use Policy 2014, 36, 478–484. [Google Scholar] [CrossRef]
  63. Gang, X.; Yang, Y.P.; Lu, S.Y.; Le, L.; Song, X. Comprehensive evaluation of coal-fired power plants based on grey relational analysis and analytic hierarchy process. Energy Policy 2011, 39, 2343–2351. [Google Scholar]
  64. Liu, G.; Baniyounes, A.M.; Rasul, M.G.; Amanullah, M.T.O.; Khan, M.M.K. General sustainability indicator of renewable energy system based on grey relational analysis. Int. J. Energy Res. 2013, 37, 1928–1936. [Google Scholar] [CrossRef]
  65. Pawlak, Z. Rough sets. Int. J. Comput. Inf. Sci. 1995, 38, 88–95. [Google Scholar] [CrossRef]
  66. Zhang, X.; Mei, C.; Chen, D.; Li, J. Feature selection in mixed data: A method using a novel fuzzy rough set-based information entropy. Pattern Recognit. 2016, 56, 1–15. [Google Scholar] [CrossRef]
  67. Rosenbloom, E.S. A probabilistic interpretation of the final rankings in AHP. Eur. J. Oper. Res. 1997, 96, 371–378. [Google Scholar] [CrossRef]
  68. Fu, Z.; Qi, M. Study on the evaluation method of energy-saving and emission reduction of coal-fired units based on projection pursuit method coupled with maximum entropy. Proc. CSEE 2014, 34, 4476–4482. [Google Scholar]
  69. Zhang, X.; Shi, G.; Liu, S. Study on zero discharge technology of wastewater from power plant. In Proceedings of the 2010 the 5th IEEE Conference on Industrial Electronics and Applications (ICIEA), Taichung, Taiwan, 15–17 June 2010; pp. 911–914. [Google Scholar]
Figure 1. Graphical representation of possible relations between two sequences.
Sustainability 10 01700 g001
Figure 2. The hierarchy of the criteria system for sustainability assessment.
Sustainability 10 01700 g002
Figure 3. The framework of the hybrid MCDM algorithm.
Sustainability 10 01700 g003
Figure 4. The flowchart of the AHP uncertainty analysis procedures.
Sustainability 10 01700 g004
Figure 5. Schematic of a coal-fired power plant accessed by the power grid (adapted from [33]; FGD, flue gas desulfurization; ESP, electrostatic precipitator; SCR, selective catalytic reduction; DCS, distributed control system; CCS, coordinate control system; RTU, remote terminal unit; AGC, automatic generation control).
Sustainability 10 01700 g005
Figure 6. Basic status classification of a coal-fired power unit.
Sustainability 10 01700 g006
Figure 7. Result distribution of each power unit.
Sustainability 10 01700 g007
Figure 8. Distributions of AHP weight components (w.c.) with different index dimensions: (a) three dimensions, (b) four dimensions, (c) five dimensions and (d) six dimensions.
Sustainability 10 01700 g008
Table 1. Saaty’s comparison scale of AHP.
Intensity of WeightDefinition
1Equal importance
3Moderate importance
5Strong importance
7Very strong importance
9Absolute (extreme) importance
2, 4, 6, 8Intermediate values
Table 2. Random index values.
m345678910
RI0.580.91.121.241.321.411.451.49
Table 3. Criteria hierarchy for sustainability assessment of coal-fired power units.
ObjectiveCriteriaSub-CriteriaUnitAttribute *
Sustainability assessment of coal-fired power unitsC1: flexibilitySC11: AGC availability ratio%(+)
SC12: AGC regulation rate factor-(+)
SC13: AGC regulation precision factor-(−)
SC14: AGC response time factor-(−)
SC15: AGC adjustable capacity%(+)
C2: economicSC21: net coal consumption rateg/kWh(−)
SC22: auxiliary power ratio%(−)
SC23: oil consumption rateT/a(−)
SC24: water consumption ratekg/(kWh)(−)
C3: environmentalSC31: SO2 emission concentrationmg/Nm3(−)
SC32: NOx emission concentrationmg/Nm3(−)
SC33: dust emission concentrationmg/Nm3(−)
C4: reliabilitySC41: equivalent availability factor%(+)
SC42: operating exposure rate%(+)
SC43: equivalent forced outage rate%(−)
C5: technicalSC51: desulphurization system input rate%(+)
SC52: denitration system input rate%(+)
SC53: qualified steam and water quality ratio%(+)
SC54: thermal protection system input rate%(+)
SC55: relay protection correct action rate%(+)
* (+) represents benefit attributes, the bigger the better, and (−) represents cost attributes, the smaller the better.
Table 4. Basic data of the selected power units *.
Sub-CriteriaUnit 1Unit 2Unit 3Unit 4Unit 5Unit 6Unit 7Unit 8
SC1110099.2100100100100100100
SC120.950.820.971.21.11.081.181.3
SC131.441.391.481.561.531.211.451.42
SC140.830.780.871.020.921.151.091.2
SC155050505555505051
SC21315.7301.64300312.72320.99318.28319.74328.75
SC224.724.784.454.234.755.024.584.44
SC2344.5499.4537.0121.1561.4454.01112.9424.22
SC240.890.471.980.631.552.622.311.35
SC3118.2984.118.1219.1479.6526.147.5918.95
SC3220.32116.1712.9326.3847.1627.1554.0814.76
SC332.5417.082.321.5121.723.9315.622.65
SC4110094.8610098.210010099.9196.09
SC4297.8610095.9810088.8480.1510097.29
SC4300000000
SC5199.7110010010099.699.89100100
SC5210010010010098.798.79100100
SC5399.8699.9710099.9299.9399.9310099.94
SC54100100100100100100100100
SC55100100100100100100100100
* Data information: the data were collected by the authors from some plants located in the mid-west of the Inner Mongolia Autonomous Region of China at the end of 2016; we treat the specific unit names as anonymous according to the requirements of some related enterprises.
Table 5. Weight information of sub-criteria.
WeightSC11SC12SC13SC14SC15SC21SC22SC23SC24SC31
FRS0.19030.26790.34990.07180.12010.4220.07620.14370.35810.3053
Entropy0.06320.10290.15660.13560.54170.26040.22560.23570.27820.4037
Hybrid0.11200.16630.23090.11110.37970.45350.04710.12580.37360.3386
WeightSC32SC33SC41SC42SC43SC51SC52SC53SC54SC55
FRS0.54230.15240.49990.500100.54750.26830.184200
Entropy0.22950.36680.55510.444900.30490.39510.300100
Hybrid0.43660.22480.55510.444900.51260.28650.200800
Table 6. Evaluation values (AGRA score) under five criterion groups.
CriteriaUnit 1Unit 2Unit 3Unit 4Unit 5Unit 6Unit 7Unit 8
Flexibility(C1)0.50680.42290.49230.60280.62730.53870.51260.5706
Economic (C2)0.59230.67430.74970.79260.48360.45770.42530.5562
Environmental (C3)0.89740.24930.98330.84450.30280.70840.41090.9376
Reliability (C4)0.89400.25640.83540.49610.72420.66920.95170.2966
Technical (C5)0.31670.92471.00000.87640.21700.39531.00000.8905
Table 7. Weight information on five criteria categories.
CriteriaC1C2C3C4C5
FRS0.15000.30900.05510.25080.2350
Entropy0.02060.07160.30520.25650.3461
AHP *0.31600.14950.34330.13950.0516
Hybrid **0.16030.15010.26860.21050.2105
* The consistency ratio C R = 0.031 < 0.1 ; the consistency test is passed. ** With the weight coefficient vector α = [ 0.2612 ,   0.5254 ,   0.4890 ] .
Table 8. Statistical information of AHP uncertainty analysis.
AlternativeMean ValueStandard Deviation2.5% Fractile97.5% Fractile95% Confidential Interval Range
Unit 10.57340.01120.57070.57240.0016
Unit 20.32330.01020.32470.32600.0012
Unit 30.66500.01240.66560.66740.0018
Unit 40.63060.00610.62990.63100.0010
Unit 50.42080.01510.41730.41940.0021
Unit 60.47430.00790.47390.47500.0011
Unit 70.52210.01910.51810.52040.0023
Unit 80.49810.00530.49720.49790.0007
Table 9. Statistical information on alternative ranks.
Order#1#2#3#4#5#6#7#8
Unit 1004989110000
Unit 200000005000
Unit 350000000000
Unit 405000000000
Unit 500000050000
Unit 600000500000
Unit 700114286703000
Unit 80007034297000
Total50005000500050005000500050005000
Table 10. Stochastic AHP with different weight dimensions with 5000 times *.
Weight Dimension3456
Mean denied number3.9631.82443.3915,692
Totally time consumption (s)6.8848.11690.830,681
* Computing configuration: MATLAB (v 8.3.0.532), Intel(R) Core(TM) i5-2400 CPU @ 3.10 GHz and a 64-bit Windows 7 system.

