Operator Dermal Exposure to Pesticides in Tomato and Strawberry Greenhouses from Hand-Held Sprayers


1
Department of Agricoltura, Alimentazione e Ambiente (Di3A), Section of Mechanics and Mechanisation, University of Catania, via Santa Sofia, 100-95123 Catania, Italy
2
Department of Agricultural and Environmental Science (DiSAAT), University of Bari Aldo Moro, Via Amendola, 165/A-70126 Bari, Italy
*
Author to whom correspondence should be addressed.
Sustainability 2018, 10(7), 2273; https://0-doi-org.brum.beds.ac.uk/10.3390/su10072273
Submission received: 7 June 2018
/
Revised: 28 June 2018
/
Accepted: 29 June 2018
/
Published: 2 July 2018
(This article belongs to the Special Issue Small-Scale Energy Conversion of Agro-Forestry Residues for Local Benefits and European Competitiveness)
Abstract
:Protection of greenhouse crops in southern Italy usually requires 15–20 phytosanitary treatments per year, with volume rates in the range of 1000–2000 L ha−1, depending on the plant growth stage. The most widespread sprayers are hand-held, high-pressure devices, which may expose operators to high levels of pesticides. This paper, also with the aim to lead toward a more sustainable use of greenhouses in agricultural productions, including some aspects of workers’ safety, reports the results of experimental tests aimed at measuring the amount of the mixture deposited on the worker’s body (potential dermal exposure, PDE) during pesticide applications to tomato and strawberry plants in a protected environment. Experimental tests on tomatoes were carried out taking into account two plant growth stages (flowering and senescence), two types of spray lance, two working pressures (1 and 2 MPa), and two walking directions (forwards and backwards). Those on the strawberries were carried out at the maturity of the fruit growth stage, comparing two hand-held sprayers (a standard spray gun and a short hand-held spray boom equipped with two nozzles) and working according to the common practice: forwards movement of the operator and high pressure (2 MPa). The results showed that with the tomato plants, the most important factor in reducing the deposit on the operator was the walking direction: on average, the PDE was 718 mL per 1000 L of the sprayed mixture (0.72‰) while walking forwards and 133 mL (0.13‰) while walking backwards. The reduction factor ranged from 3.0 at the flowering growth stage to 7.2 at the senescence growth stage. With respect to the strawberry plants, the PDE was significantly higher when the operator used the short hand-held spray boom (887 mL per 1000 L of the sprayed mixture, equivalent to 0.89‰), rather than the spray gun (344 mL, 0.34‰). In both cases, the most exposed body parts were the lower limbs, which accounted for 89–94% of the total PDE.
1. Introduction
Sustainability is a topic that continues to gain the attention of safety, health, and environmental (SHE) professionals. Generally limited to a board-level issue, sustainable growth strives to balance social, economic, and ecological needs. At their most basic level, sustainability and safety are really about the same thing: conserving resources [1,2]. In the case of sustainability, those resources are typically thought of as environmental. In the case of safety, the resources are human. Despite this common ground, discussions on sustainability are only beginning to give attention to safety. One of the aims of this paper is to focus on the importance of how a particular attention to the safety and health of workers involved different agricultural activities [3] and, in particular, in some greenhouse operations, could lead toward a more sustainable use of greenhouses in agricultural production.
Greenhouses, due to their peculiar structural and microclimatic conditions (confined spaces, high temperature, high relative humidity), are very specific agro-ecosystems in comparison to the open field. To ensure high productions, they require massive energetic (environment conditioning) and chemical (fertilizers and pesticides) inputs [4,5].
Pest control is complicated by the virtually year-round culture of crops and by continuous heating during cold periods. These conditions provide excellent opportunities for the survival and development of a pest or disease once it has invaded the greenhouse. In warm climates, the situation is more complex. In the Mediterranean, for example, the mild climate outside enables pests to develop throughout the year, and pest pressure is, therefore, very high [6]. As a consequence, greenhouse crops require intensive care, and therefore, workers are frequently exposed to plant protection products (PPP). In fact, besides the indubitable benefits of pesticides [7], even if partly substitutable by adopting the principles of the organic farm [8], safety aspects are often not properly considered [9,10]. Personal protective equipment (PPE) is not always used, mainly due to the uncomfortable climatic conditions inside greenhouses and the lack of information among operators relating to pesticides. In particular, the risks and the potential acute and chronic effects for human health, non-target organisms, and the environment arising from the use of pesticides are not always known.
Surveys carried out in several countries all over the world [11,12,13,14] have pointed out that the level of mechanization is quite low, the handling of plant protection products is done without taking all precautions to prevent exposure (inadequate use of PPEs), and there is a marked unawareness about their danger and toxicity.
In south-eastern Spain, PPPs are applied by manual systems involving spray guns or lances in 91.7% of the greenhouses [15]. This manual equipment, preferred for its low cost, however, has several disadvantages, such as the light deposition and uneven distribution of the PPPs on the plant canopy, heavy losses to the soil, and the serious chemical exposure risk of the workers [16,17].
Williamson et al. [18], reporting the results of a study in four African countries (Benin, Ethiopia, Ghana, and Senegal), draw a picture of regular and sometimes serious health effects arising from exposure to hazardous pesticides and risky handling and storage. Hazardous practices in the field and at home, such as the negligible use of protective clothing, pesticide storage in bedrooms, granaries, and kitchens, and the use of empty insecticide containers to store food or drink, are common. A survey in Cameroon [19] showed that lever-operated knapsack sprayers, CDA (Controlled Droplet Atomizer) rotary atomizer sprayers, hand-carried thermal foggers, and motorized knapsack mist blowers were the most widely used type of equipment. Various problems with the equipment caused leakage on operators, who generally did not wear protective clothing, so there is a need for further training and dissemination of information throughout African countries. Another survey among greenhouse workers in Turkey [20] showed that 42.3% of operators had health insurance, 86.9% used pesticides, and 59.3% did not take protective cautions during the use of pesticides. Moreover, greenhouse workers have not recorded application technique, location, amount, time, or any other required information regarding the pesticides used. Studies in China [21] showed that farmers practiced inadequate protective behaviour when using pesticides and that actions of pesticide retailers and the government were found ineffective. Finally, a survey on about 200 farms in Italy [22] showed that the application of plant protection products in greenhouses is accomplished in 71% of the cases by means of hand-held, high-pressure devices (spray lances, spray guns, and short spray booms fitted with one, two, or more nozzles). According to the Italian Central Statistics Institute (ISTAT), horticultural protected crops in southern Italy account for about 22,516 ha (57.3% of total Italian greenhouse surface) and 931 × 106 kg (53.5% of total Italian greenhouse production), mainly located in Campania (11,652 ha and 426 × 106 kg) and Sicily (7842 ha and 364 × 106 kg) [23].
The risks of exposure increase when PPPs are applied by means of hand-held sprayers, as the possibilities of direct contact with the mixture also increase. The main route of exposure is dermal contact; respiratory entry appears to be more limited, likely due to low vapor pressures of many pesticides [24,25]. Vapor pressure is a pesticide’s tendency to evaporate. In general, pesticides with low vapor pressures are less likely to turn into a vapor and get into the air, and those with high vapor pressures are more likely to get into the air. Exposure may occur during all of the three basic stages involved in PPP use: mixture preparation (mixing and loading), application (spraying), and post-treatment activities (equipment clean-up and re-entry in the field) [26,27,28,29].
Although exposure levels may vary widely between individual operators, mixing and loading are the tasks associated with the greatest intensity of exposure due to the manipulation of concentrated products [30,31]. However, because pesticide application is typically a task of longer duration than mixing and loading, total contamination incurred while applying PPPs may exceed that of mixing and loading [27]. The amount of the mixture collected by the operator’s body is related to several factors: crop features, spraying equipment, nozzle type, operator movement, pesticide formulation, and environmental conditions. Tuomainen et al. [32] reported that during Malathion application to roses, the workers’ lower limbs accounted, on average, for 48%, while the upper limbs accounted for 19% of the whole potential dermal exposure. Frenich et al. [33], spraying several greenhouse vegetable crops by means of spray guns, found that exposure of the legs and drop size should be the main variables to be included in a sampling program to assess dermal exposure to pesticides in greenhouses workers. Bjugstad and Torgrimsen [34] found that, when using a knapsack mist blower, the dermal exposure was reduced up to 20 times when the operator walked backwards away from the spray. Wicke et al. [35] found that spraying with air injection nozzles reduced exposure compared to standard cone nozzles. Berenstein et al. [36] pointed out that during the mixing and loading stage, hand exposure for liquid formulations was 22–62 times greater than that for solid ones. Experimental trials on imidacloprid application for wheat by using a knapsack electric sprayer [37] showed that the total potential dermal and inhalation exposures ranged from 14.20 to 20.78 mL h−1, corresponding to 0.2‰ to 0.3‰ of the applied volume of spray solution. In all trials, the lower part of the body (thighs, legs) was the most contaminated, accounting for approximately 76–88% of the total exposure. The inhalation exposure was less than 1% of the total exposure. Finally, a great reduction in dermal exposure can be achieved by using self-propelled sprayers rather than hand-held sprayers [38,39].
Therefore, given the great variability due to the influence of so many factors, the best procedure for assessing dermal operator exposure to PPPs is through direct measurement on the specific worker in real working conditions, using actual sprayers. The aim of the experimental tests discussed in this paper was to measure the potential dermal operator exposure during PPPs application to tomato and strawberry plants in greenhouses, under standard field conditions. Tests in tomato plants have already been presented by Cerruto et al. [40,41], where foliar deposition and ground losses were also discussed. In this paper, all data referring to dermal operator exposure are reanalyzed more in depth and in a different way; moreover, potential dermal exposure (PDE) of the workers with the tomato and strawberry plants is compared.
Tomatoes and strawberries play a significant role among horticultural crops in Italy. In the five-year period of 2012–2016, the average surface and average production of tomatoes were 101,526 ha and 6.08 × 10⁹ kg, respectively, (both in greenhouses and in the open field), whereas the corresponding values for strawberries were 5277 ha and 142.46 × 10⁶ kg respectively [23]. When cultivated in a protected environment, both greenhouses and tunnels are used [42].
Tomato plants in greenhouses are usually arranged in twin rows 25–50 m long (depending on the greenhouse size), with inter-row distance of 0.50–0.80 m, inter-twin-row distance of 1.20–1.40 m, and row spacing of 0.35–0.60 m (the final layout depends on the tomato variety). PPPs are usually applied by using hand-held, high-pressure devices (spray guns, spray lances with between one to four nozzles), in most cases connected to standard hydraulic sprayers driven by a tractor. Under field conditions, the task is normally accomplished by two workers: the first, walking in the inter-twin-row aisles inside the greenhouse, applies the mixture to the plants, while the second unwinds and rewinds the feeding hose pipe. The first worker, because of his movement, rubs his body against the vegetation, causing a relevant part of his dermal exposure. Volume rates range from 800 to 1800 L ha−1, depending on the plant growth stage.
Tunnels for strawberry cultivation have metallic structures covered with plastic film with openings in front, sides, and back; they usually have a maximum height of 2.5 m, length in the range 35–50 m, and width of about 5 m. The soil is arranged to form ridges about 0.3 m high, four for each tunnel, spaced by 0.40 m wide service aisles, suitable for the transit of workers only but not for ordinary mechanical implements. The ridges are mulched with plastic film and fitted with hoses for drip irrigation. Strawberry plants are placed on the ridges as twin rows, with approximately 7–8 plants m−2 (without considering the service aisles). PPP applications are carried out by using hand-held devices (spray lances, spray guns, short spray booms), or cannon sprayers operating from the outside of the tunnels along their openings. In all cases, very high volume rates (1500–2500 L ha−1) are applied, with working pressures of around 2 MPa.
2. Materials and Methods
2.1. Crop Features
Experimental spraying tests on tomato plants are those described by Cerruto et al. [40,41], here summarized for completeness. They were carried out in three greenhouses located in a farm in the territory of Scoglitti (Ragusa Province, Sicily, Italy, Longitude 36°55′32.3′′ N, Latitude 14°28′34.1′′ E). Plants (cultivar Ikram) had been transplanted in twin rows, with inter-row distance of 0.50–0.60 m, inter-twin-row distance of 1.25–1.45 m, and row spacing of 0.35 m, giving a density of about 28,600–31,700 plants ha−1. To take into account the effect of the vegetative development, tests were repeated in two growth stages: flowering (BBCH code = 63, third inflorescence) and senescence (BBCH code = 99, harvested product, chosen so as to have fully developed vegetation and not to damage product) (Table 1). Plants were geometrically characterized, measuring the maximum and minimum height of the vegetation and the width at different heights. The measures were carried out manually on 12 plants per each trial, belonging to the rows of six different twin rows.
Tests in strawberry plants were carried out in two tunnels located in a farm in the territory of Metaponto (Matera Province, Basilicata, Italy, Longitude 40°14′10.5′′ N, Latitude 16°41′19.3′′ E). The tunnels were 2.5 m high, 49 m long, and 5 m wide. The ridges, spaced by 40 cm wide service aisles, were 85 cm wide and 30 cm high. Strawberry plants (cultivar Candonga) had been transplanted on the ridges as twin rows with inter-row distance of 0.30 m, inter-twin-row distance of 0.95 m, and row spacing of 0.35 m, giving a density of 45,714 plants ha−1. Tests were carried out at maturity of the fruit growth stage (BBCH code = 87, main harvest: more fruits colored), when the plant height was 20–25 cm.
2.2. Spraying Devices
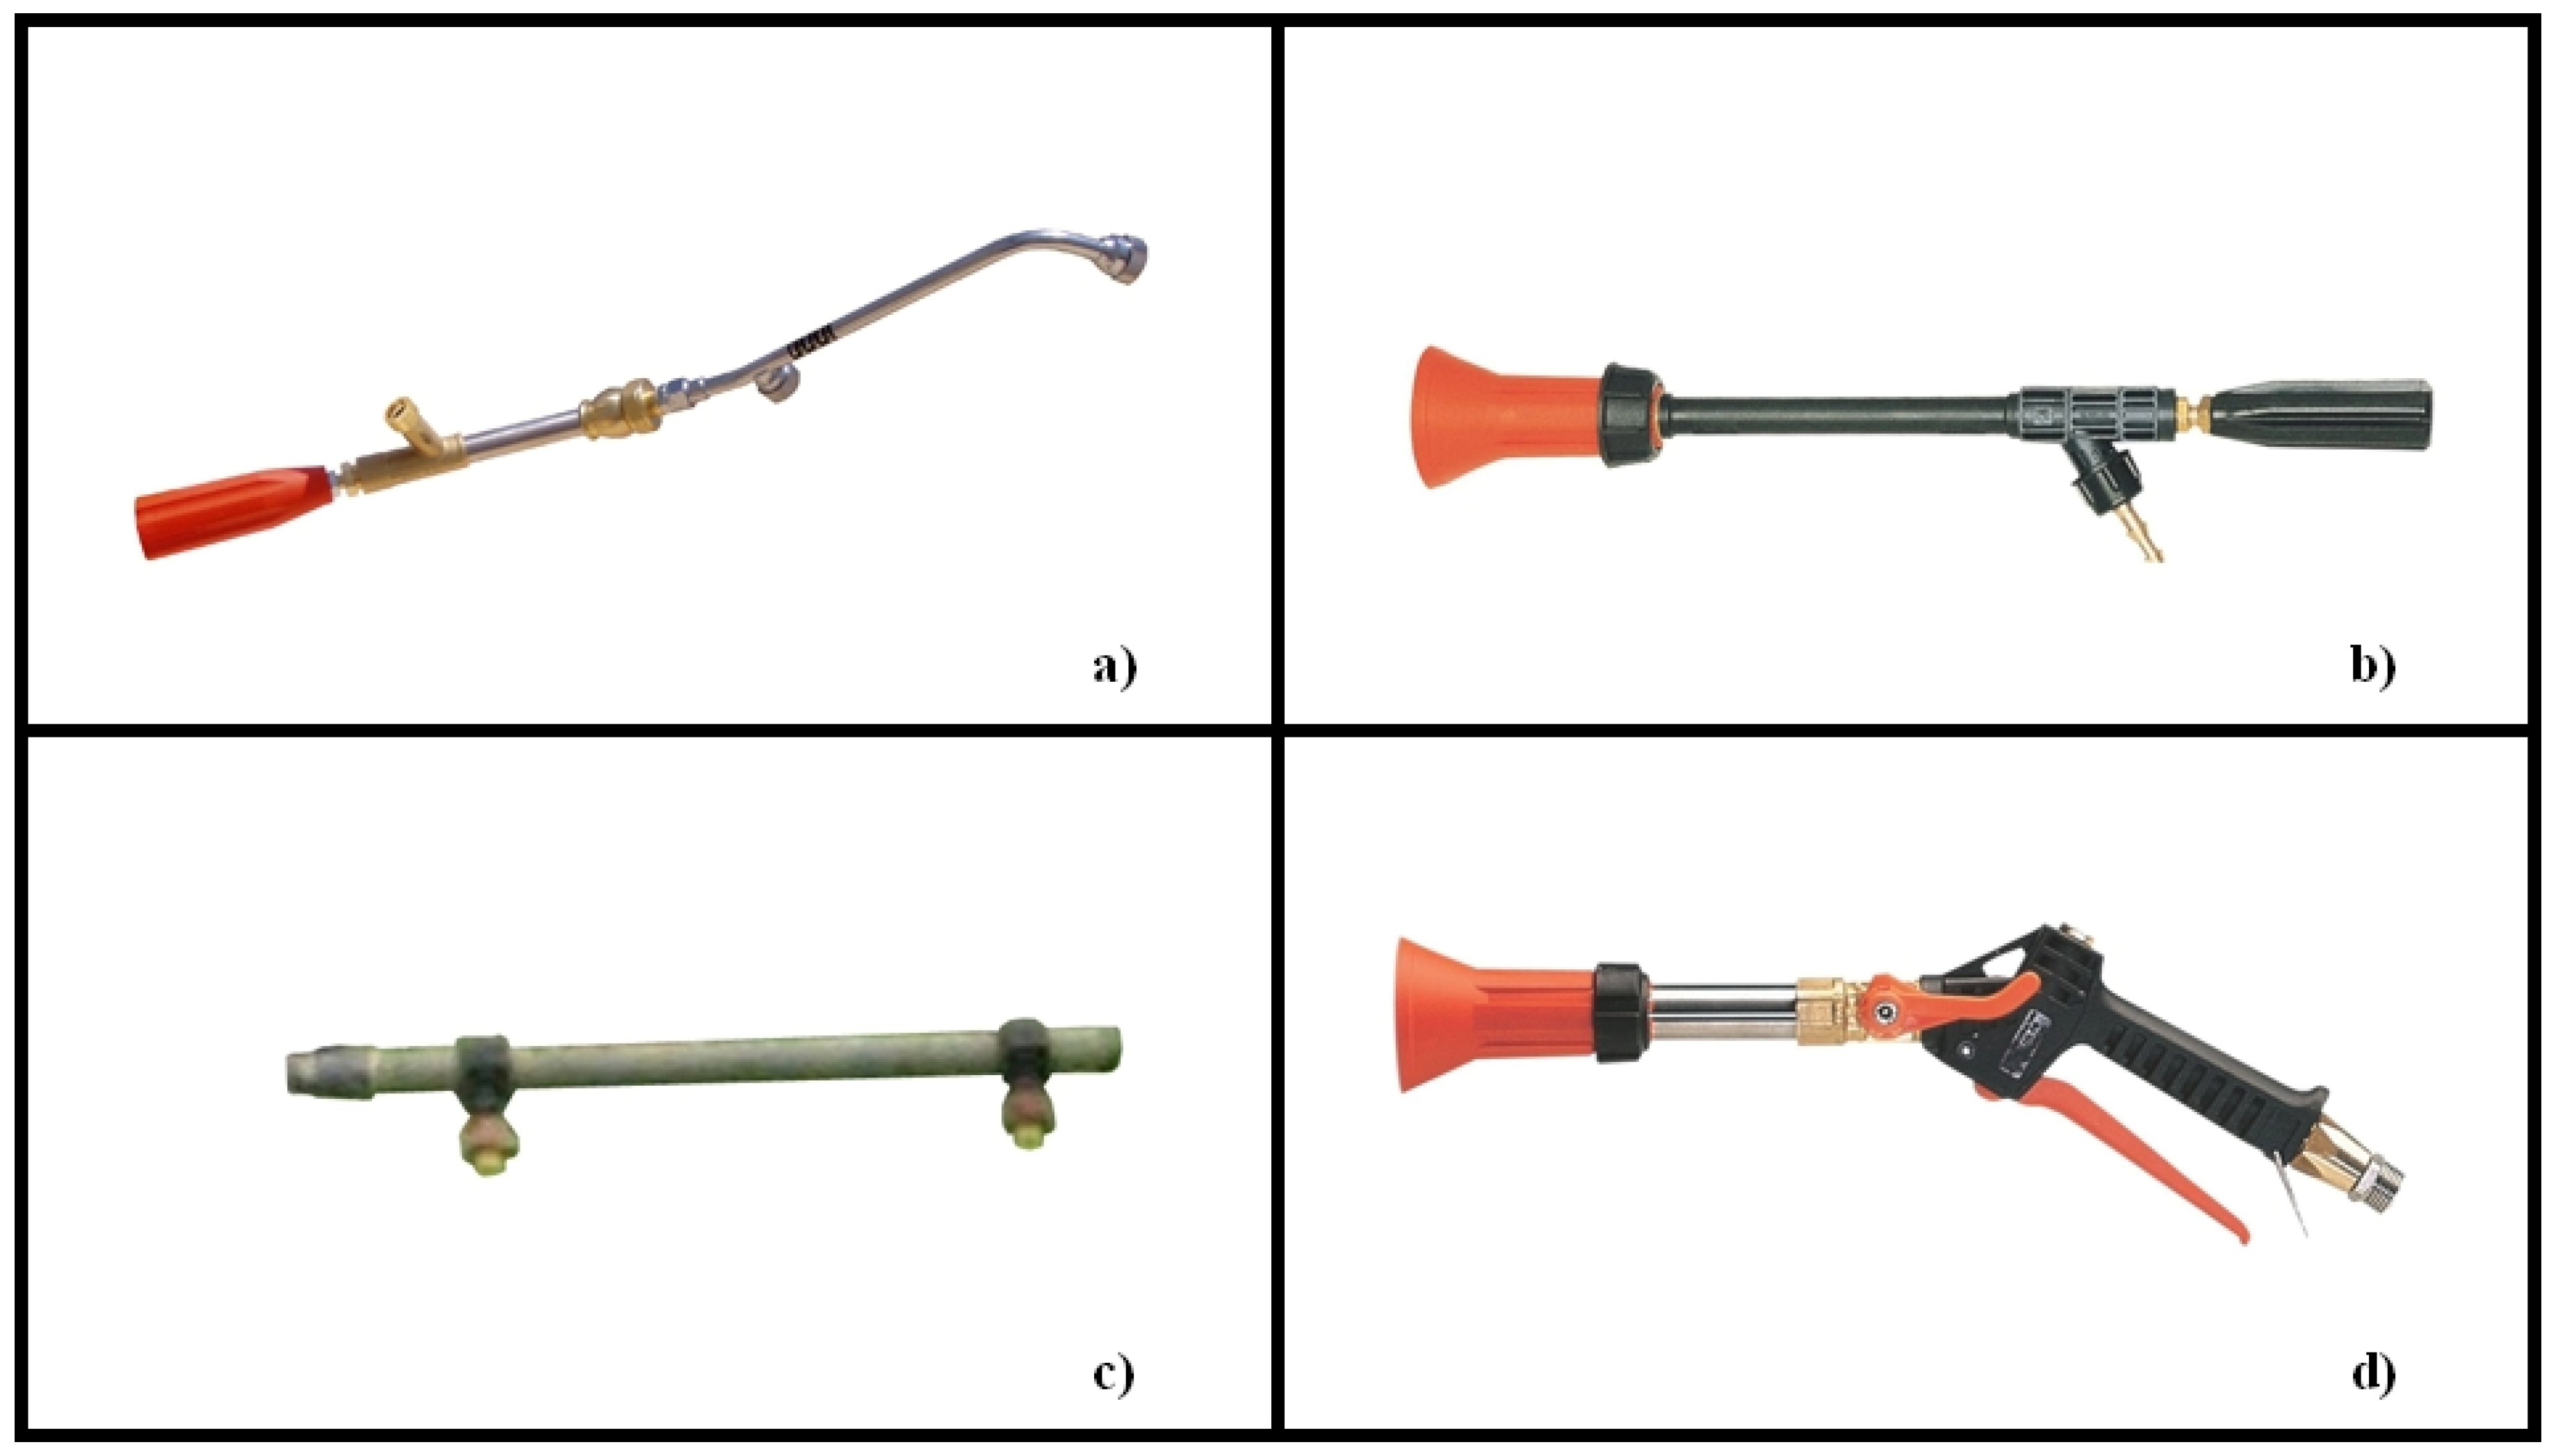
The spraying tests were carried out using the devices usually employed by the operators during PPPs application in greenhouses. The tests on the tomato plants were performed using two spray lances. The first (spray lance 1, SL1, model “12 13 22” from Yamaho Industry Co., Ltd., Ekawa, Hidakagawa-cho, Hidaka-gun, Japan, very widespread in the territory of Ragusa province) had two flat fan steel nozzles (NN-C-6S, Yamaho Industry Co., Ltd., Ekawa, Hidakagawa-cho, Hidaka-gun, Japan), was 0.5 m long (including the on–off switch handle), and the distance between the two nozzles was 0.2 m. The second (spray lance 2, SL2, “M31” model from Braglia Srl Company, Reggio Emilia, Italy) was 0.3 m long and had one hollow cone nozzle (1.5 mm AMT alumina spray tip, Braglia Srl Company, Reggio Emilia, Italy). The tank with the mixture to be distributed, diaphragm motor pump (“M35” model from Imovilli Pompe, Reggio Emilia, Italy), and hose pipe, were placed on a small trailer staying outside the greenhouse.
The tests on the strawberry plants were also performed using two spraying devices: a standard spray gun and a custom-made short hand-held spray boom. The standard spray gun (SG, model “Turbo 400” from Braglia Srl Company, Reggio Emilia, Italy) had one hollow cone nozzle (model “M15x1”, 1.5 mm spray tip, Braglia Srl Company, Reggio Emila, Italy), whereas the short hand-held spray boom (SB), 0.4 m long, was equipped with two flat fan XR8006VK (Teejet®, Spraying System Co., Wheaton, IL, USA) nozzles, 0.25 m spaced. Both devices were connected by a pipeline to a mounted hydraulic sprayer (model “VRP 600” from TIFONE, Ferrara, Italy) powered by the PTO of the tractor, placed outside the tunnel, in front of the opening.
A picture of all the spraying devices used in the experimental tests is presented in Figure 1.
For all the spraying devices, the flow rate of each nozzle was measured by gauging the amount of liquid delivered during a working time of 60 s. Measurements were repeated three times for each working condition, and mean values were assumed as reference [43].
2.3. The Experimental Activity
The spraying tests on the tomato plants were carried out taking into account operator movement (forwards and backwards), plant development (two growth stages), spraying device (two types of spray lance), and working pressure (1 and 2 MPa). Those on the strawberry plants were carried out using two hand-held sprayers (a short hand-held spray boom fitted with two nozzles and a standard spray gun) and keeping all the other parameters unchanged (operator movement = forwards, growth stage = maturity of the fruit, and working pressure = 2 MPa).
To measure the potential dermal exposure, the operator simulated a PPP application under standard field conditions by spraying a water mixture containing a food dye tracer (red Ponceau tracer (Novema Srl, Torino, Italy, richness at 88.76%) on the tomato plants and yellow tartrazine tracer (Sigma Aldrich Corporation, Saint Louis, Missouri, MO, USA, richness ≥ 85%) on the strawberry plants at a nominal concentration of 20 g L−1.
From visual assessment, it was expected that the greatest influence on PDE during the tests on tomato plants was due to the plant growth stage and the operator movement, rather than to the spray lance type or the operating pressure. Therefore, the trials on the tomato plants were organized in two steps. Firstly (trials 1 and 2), the dermal operator exposure was measured using the spray lance SL1 at the pressure of 2 MPa, comparing forwards and backwards movement and taking into account the plant growth stage (flowering and senescence). Secondly (trial 3), based upon the results of trial 1 and 2, the measurements were repeated, keeping unchanged the growth stage (senescence) and operator movement (backwards) and comparing pressures (1 and 2 MPa) and spray lances (SL1 and SL2).
The trials on the strawberry plants (trial 4) were carried out comparing the two hand-held sprayers (SB and SG) when used according to the common practice: forwards movement of the operator (indeed, the aisle size in the tunnels did not allow a safe and easy backwards movement) and high pressure (2 MPa).
A summary of all the experimental test conditions is reported in Table 2. Little discrepancies in nozzle flow rates with spray lance SL1 at 2 MPa (less than 8% with respect to the mean value of 5.06 L min−1) were due to small variations between trials in sprayer settings (position of the sprayer tank with respect to the pump, wear, and tear of the nozzles).
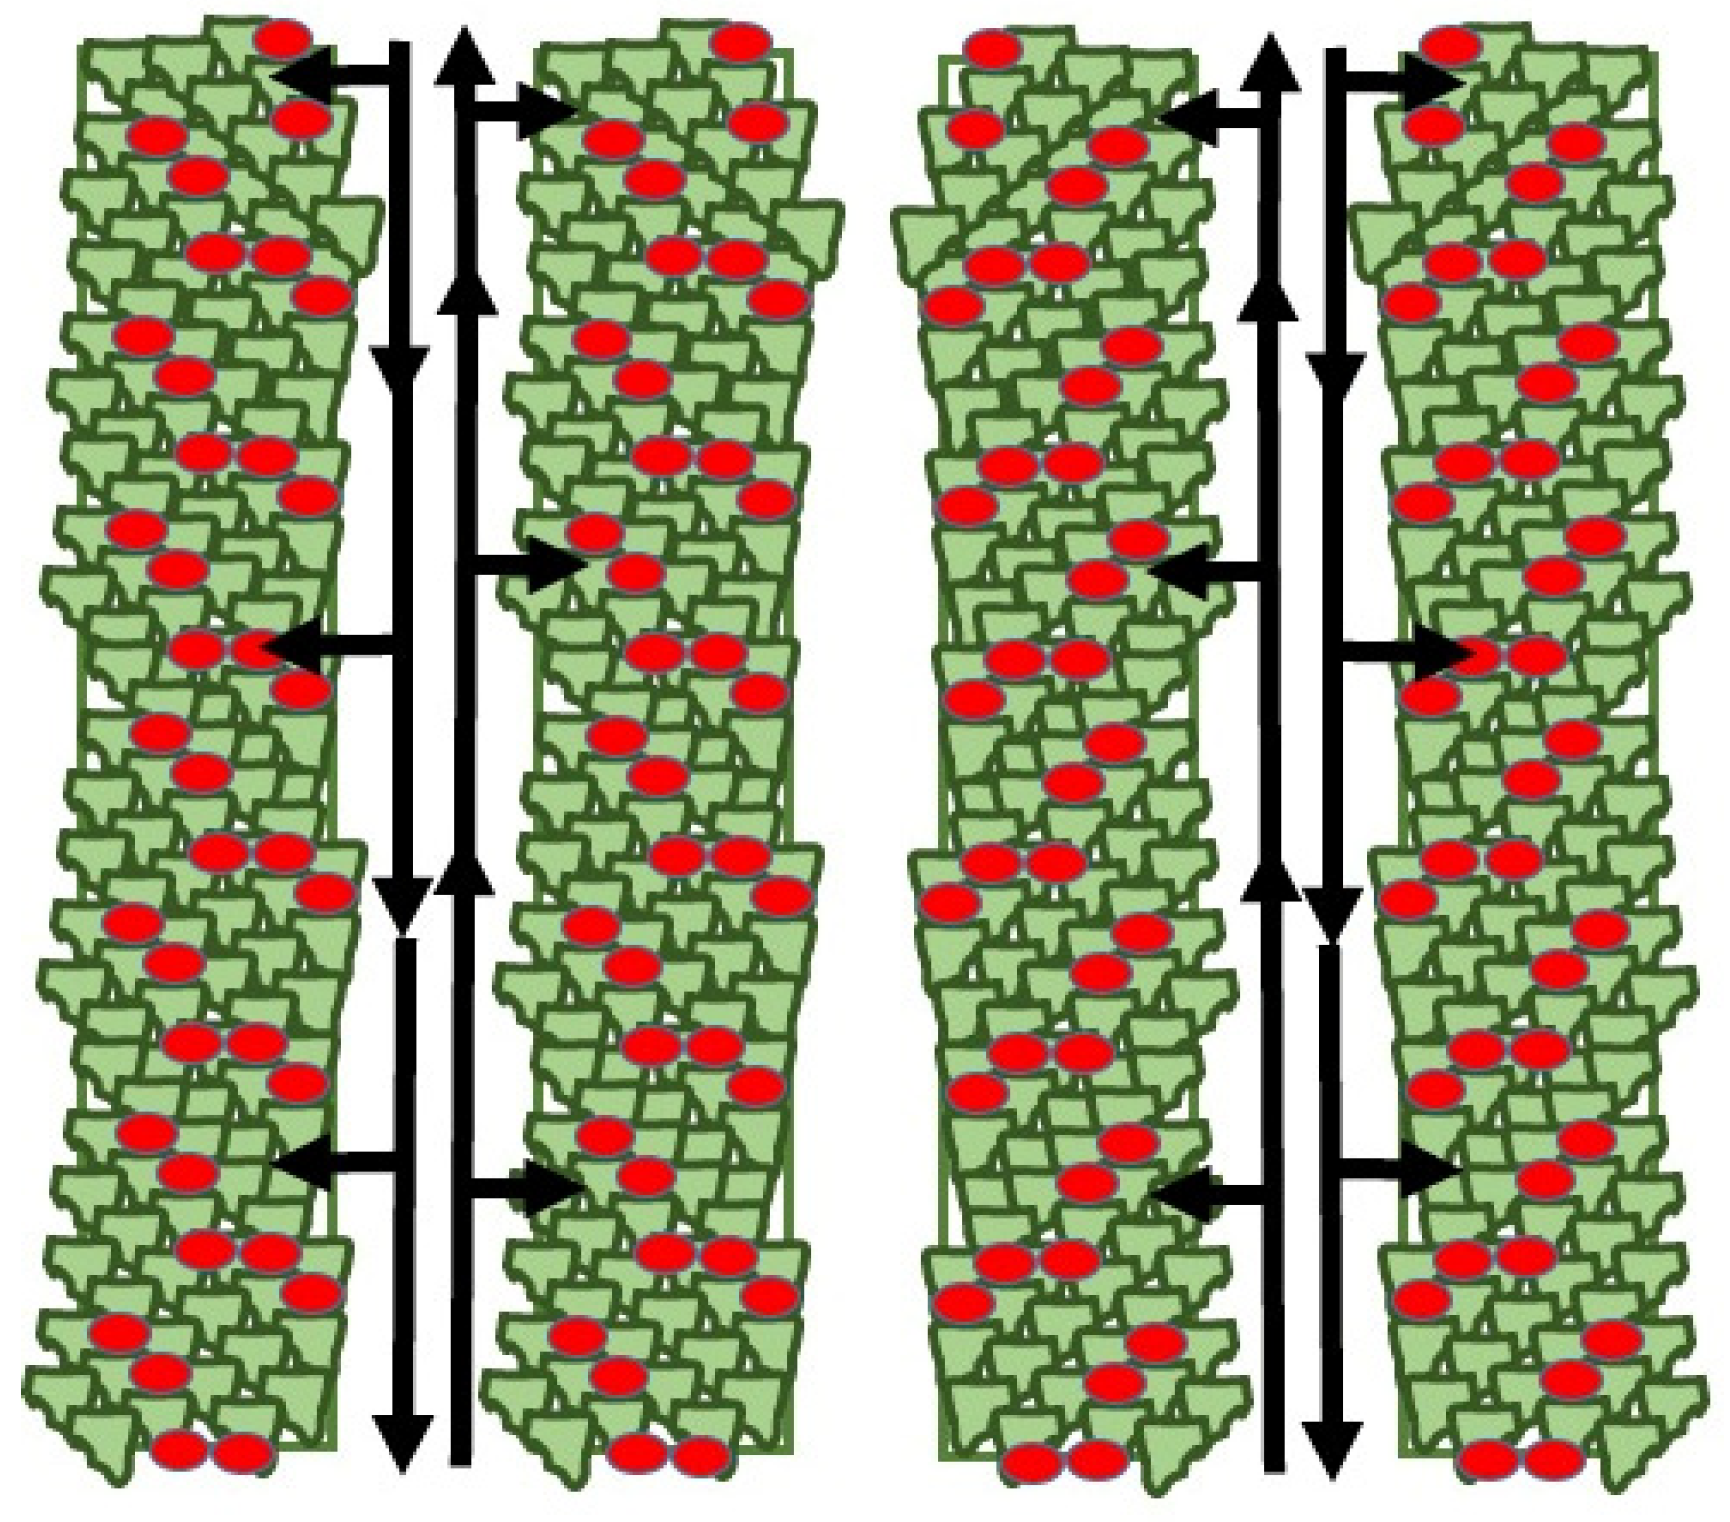
Each test condition was replicated three times on the tomatoes and four times on the strawberries. Each replicate consisted of a full path in the service aisle: the operator, moving forwards or backwards from one extreme to the other of the aisle (about 30 m in the tomato greenhouses and 49 m in the strawberry tunnels), sprayed a tomato row (or a strawberry ridge) during the forwards path and the other on the return path (Figure 2). All tests on the tomato plants were performed by the same operator, as well as those on the strawberry plants.
Spraying time was measured in the field, so walking speed and volume rate were calculated per each replicate. The temperature and relative humidity were measured during the tests, before each replicate, using a thermo-hygrometer (model “HD 8901” from Delta Ohm, Padova, Italy) during tests on the tomato plants and a thermo-hygrometric probe (model “BSU401” from LSI, Milano, Italy) connected to a multiple data acquisition system (model “BabucM BSA020” from LSI, Milano, Italy) during tests on the strawberry plants.
2.4. Deposit Measurement and Data Analysis
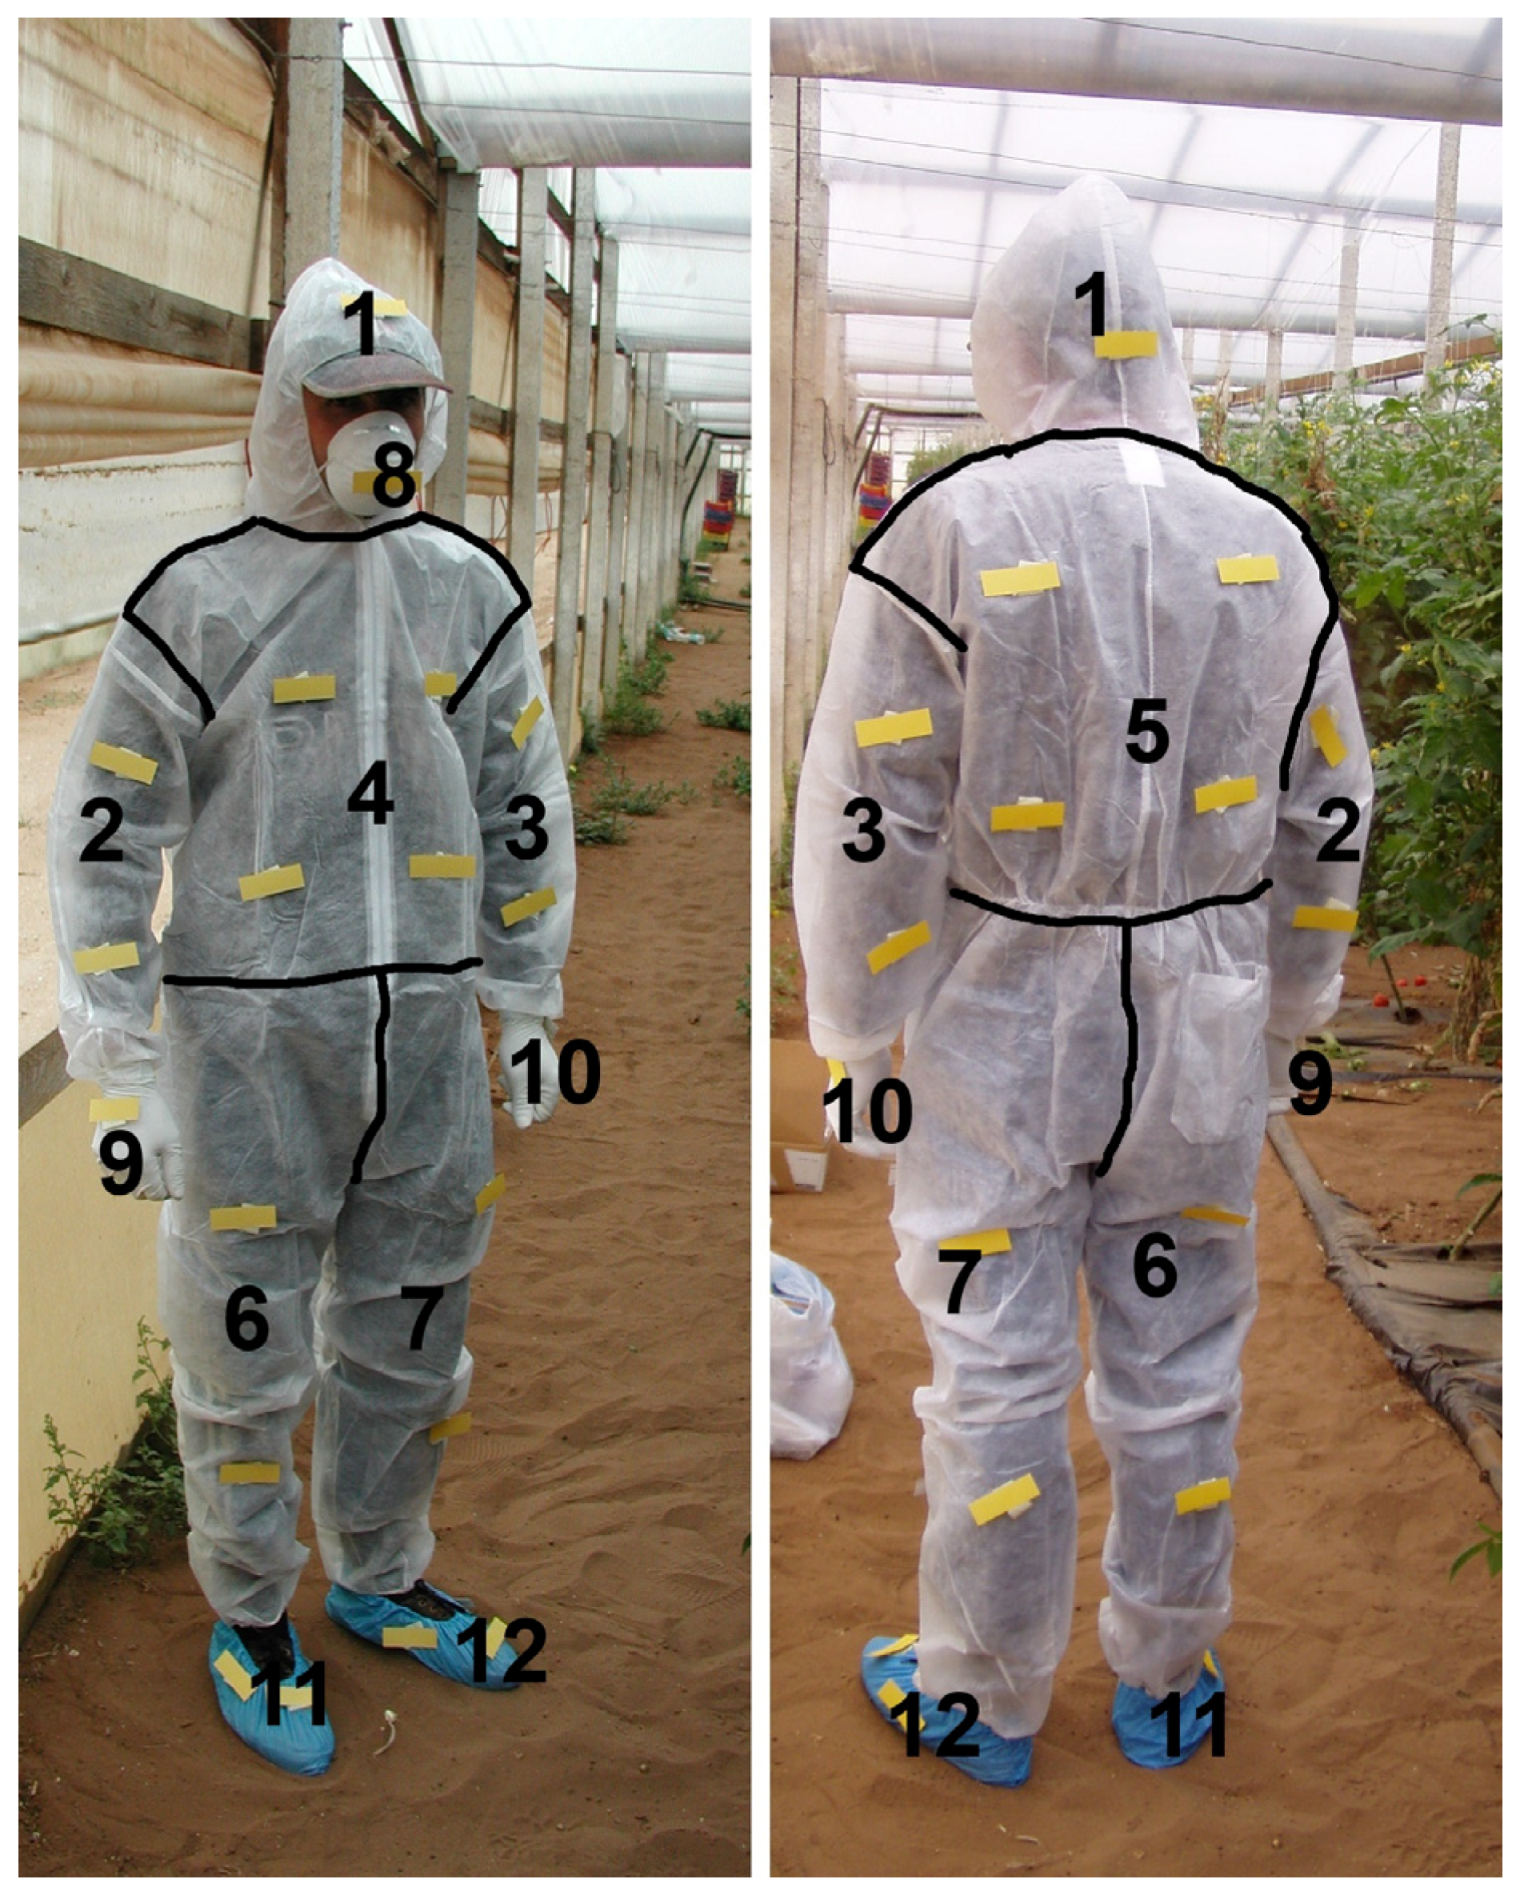
During the mixture application, the operator was wearing a polypropylene disposable coverall (GreenBay®, GR 40, XL size), complete with dust mask, shoe covers, and gloves. At the end of each replicate, the coverall, dust mask, shoe covers, and gloves were taken off by an assistant to avoid cross-contamination, and the operator took on a new clean protective suit. The coverall was then cut into seven sections as depicted in Figure 3, and each element was placed in a codified plastic bag, stored in dark conditions, and then carried into the laboratory to measure the deposit. The surface of each coverall section was estimated measuring the ratio surface/mass (278 cm2/g) of a piece of known area and then measuring the mass of each section with a precision scale (“PB3002-S” model from Mettler Toledo S.p.A., Milan, Italy). The surface of the dust mask, shoe covers, and gloves was measured by acquiring their images with a scanner and then using the ImageJ software [44]. The average values of the surface of each element, or groups of elements, are reported in Table 3.
The deposit of the mixture on each coverall element was measured by means of the spectrophotometric technique, following a well-defined procedure based on adding a known quantity of distilled water to each bag containing an element, shaking the bag manually for about 30 s, waiting for about 30 min, and then measuring the absorbance of the washing mixture [45,46,47]. More specifically, the amount of added water ranged from 50 to 400 mL (depending on the size of each element) and the absorbance of the mixture was measured on a sample of 5 mL by using a spectrophotometer (“6300” model, Jenway, Ltd., Cole-Parmer, Beacon Road, Stone, Staffordshire, ST17 OSA, UK). The wavelength used for the spectrophotometric reading was previously experimentally determined as that corresponding to the maximum absorption of 509 nm when using the red Ponceau tracer and 426 nm when using yellow tartrazine tracer.
The volume of the mixture on each coverall element was calculated according to Equation (1), as follows:
where Vs is the volume of the mixture on each coverall element (mL); ABSs is the absorbance of the washing mixture; ABSm is the absorbance of the mixture sprayed in field, sampled at the nozzles output; and VL is the amount of distilled water added to each coverall element (mL).
Assuming the absorbance is proportional to the concentration of the tracer in the mixture, Vs (Equation (1)) is independent of concentration, and therefore, no correction factors were applied to normalize the data to a reference concentration. No correction was necessary to compensate the background deposit, assessed by applying the same procedure to a new unused coverall.
To make consistent comparisons between the tests, all deposits on the coverall elements were expressed in milliliters per 1000 L of the sprayed mixture, according to Equation (2), as follows:
where ds is the deposits on each coverall element (mL per 1000 L of the sprayed mixture); Vs is the volume of the mixture on each coverall element (Equation (1)) (mL); Vf is the volume of the mixture sprayed in field during the test (L); and Vr is the reference volume (1000 L).
This deposit expression is independent of the volume rate and does not require normalization to a common reference volume rate, which is usually adopted for foliar deposit evaluation, as reported by Cerruto et al. [40,41]. The volume of the mixture sprayed in the field during each test was computed knowing the flow rate at the nozzles and measuring the spraying time.
The deposits ds were also referred to the surface S (cm2) of each coverall element to evaluate the body parts with the highest unitary deposition du (Equation (3)):
Finally, to take into account the working time, the deposits were also referred to the spraying time according to Equation (4), as follows:
where t1000 (h) is the time necessary to spray 1000 L of the mixture, calculated according to the flow rate at the nozzles.
According to the aims of the research, trials 1 and 2 were analyzed jointly to evaluate the effects of the walking direction and the plant growth stage, keeping the working pressure and the spray lance type unchanged. Trial 3 allowed for evaluating the effects of the working pressure and the spray lance type, keeping the growth stage and the operator movement unchanged. Finally, trial 4 on the strawberry plants allowed the comparison between the two spraying devices.
Firstly, the deposit on the whole body was calculated by adding the deposits on each coverall element, expressed both in milliliters (Equation (2)) and in milliliters per hour (Equation (4)). It was analyzed applying the analysis of the variance (ANOVA), considering as sources of variation the plant growth stage and the operator movement (trials 1 and 2), or the spray lance type and the working pressure (trial 3), or the spraying device (trial 4). The raw data (both mL and mL h−1) were log-transformed to meet the prerequisites for the application of the analysis: normal distribution of the residuals assessed by the Shapiro–Wilk normality test, and constant variance of the residuals assessed by the Breusch–Pagan test. Secondly, based on the deposit on each coverall element, the unitary deposition and the percentage subdivision of the total deposit between the body parts was calculated. All statistical analyses and graphical representations were carried out using the open source software R [48].
3. Results and Discussion
3.1. Crop Features
A relevant part of the operator dermal exposure is due to the body rubbing against the vegetation, particularly for tomato plants. Instead, strawberry plants affect the dermal exposure of feet and lower limbs only. In fact, the maximum vegetation height, taking into account the ridge height (30 cm), is about 50–55 cm with respect to the aisle level. Table 4 reports the main geometric sizes of the tomato plants during the three trials.
The height (H) at which to measure the plants’ width (W) was chosen in the field according to the plants’ height. In trial 1, the plants’ width ranged from 15 to 90 cm (mean = 53 cm). Given the plants’ layout (Table 1), the free aisle between the inter-twin-rows ranged from 55 to 145 cm (mean = 92 cm). In trial 2, the plants’ width ranged from 15 to 60 cm (mean = 43 cm), so the free aisle ranged from 65 to 120 cm (mean = 82 cm). Finally, in trial, the 3 plants’ width ranged from 20 to 100 cm (mean = 55 cm), giving a free aisle ranging from 40 to 120 cm (mean = 85 cm). Then, in all the trials, the operator walked in a free aisle 80–90 cm wide, inevitably rubbing his body against the vegetation.
The difference between the forwards and backwards speed (1.08 vs. 0.78 m s−1 in trial 1 and 0.62 vs. 0.53 m s−1 in trial 2, Table 2) was due to the unfamiliarity of the operator with spraying while walking backwards (that operator had always applied PPPs walking forwards, previously). The much higher difference in walking speeds between trials 1 and 2 was due to the different growth stage, which required different volume rates. Finally, the difference in the walking speeds between trials 2 and 3 (0.53 vs. 0.84 m s−1 on average) was due to the different crop layout (the wider aisle, 1.40 vs. 1.25 m, allowed for easier movement of the operator).
3.2. Tests on Tomato Plants: Effects of Walking Direction and Plant Growth Stage
Climatic conditions during trial 1 were characterized by an average temperature of 23 °C (from 19 °C to 25 °C) and an average relative humidity of 67% (from 57% to 75%). The corresponding values during trial 2 were 32 °C (from 30 °C to 35 °C) and 58% (from 50% to 63%). Table 5 reports the results of the analysis of the variance applied to the whole-body dermal deposits. From these trials, it emerged that PDE, expressed in mL per 1000 L of the sprayed mixture, was significantly affected by both the plant growth stage and the operator walking direction. No significant interaction between these two sources of variation was present. Similar results were obtained when PDE was expressed in mL h−1, with the ratio (Equation (4)) constant at the constant nozzle flow rate.
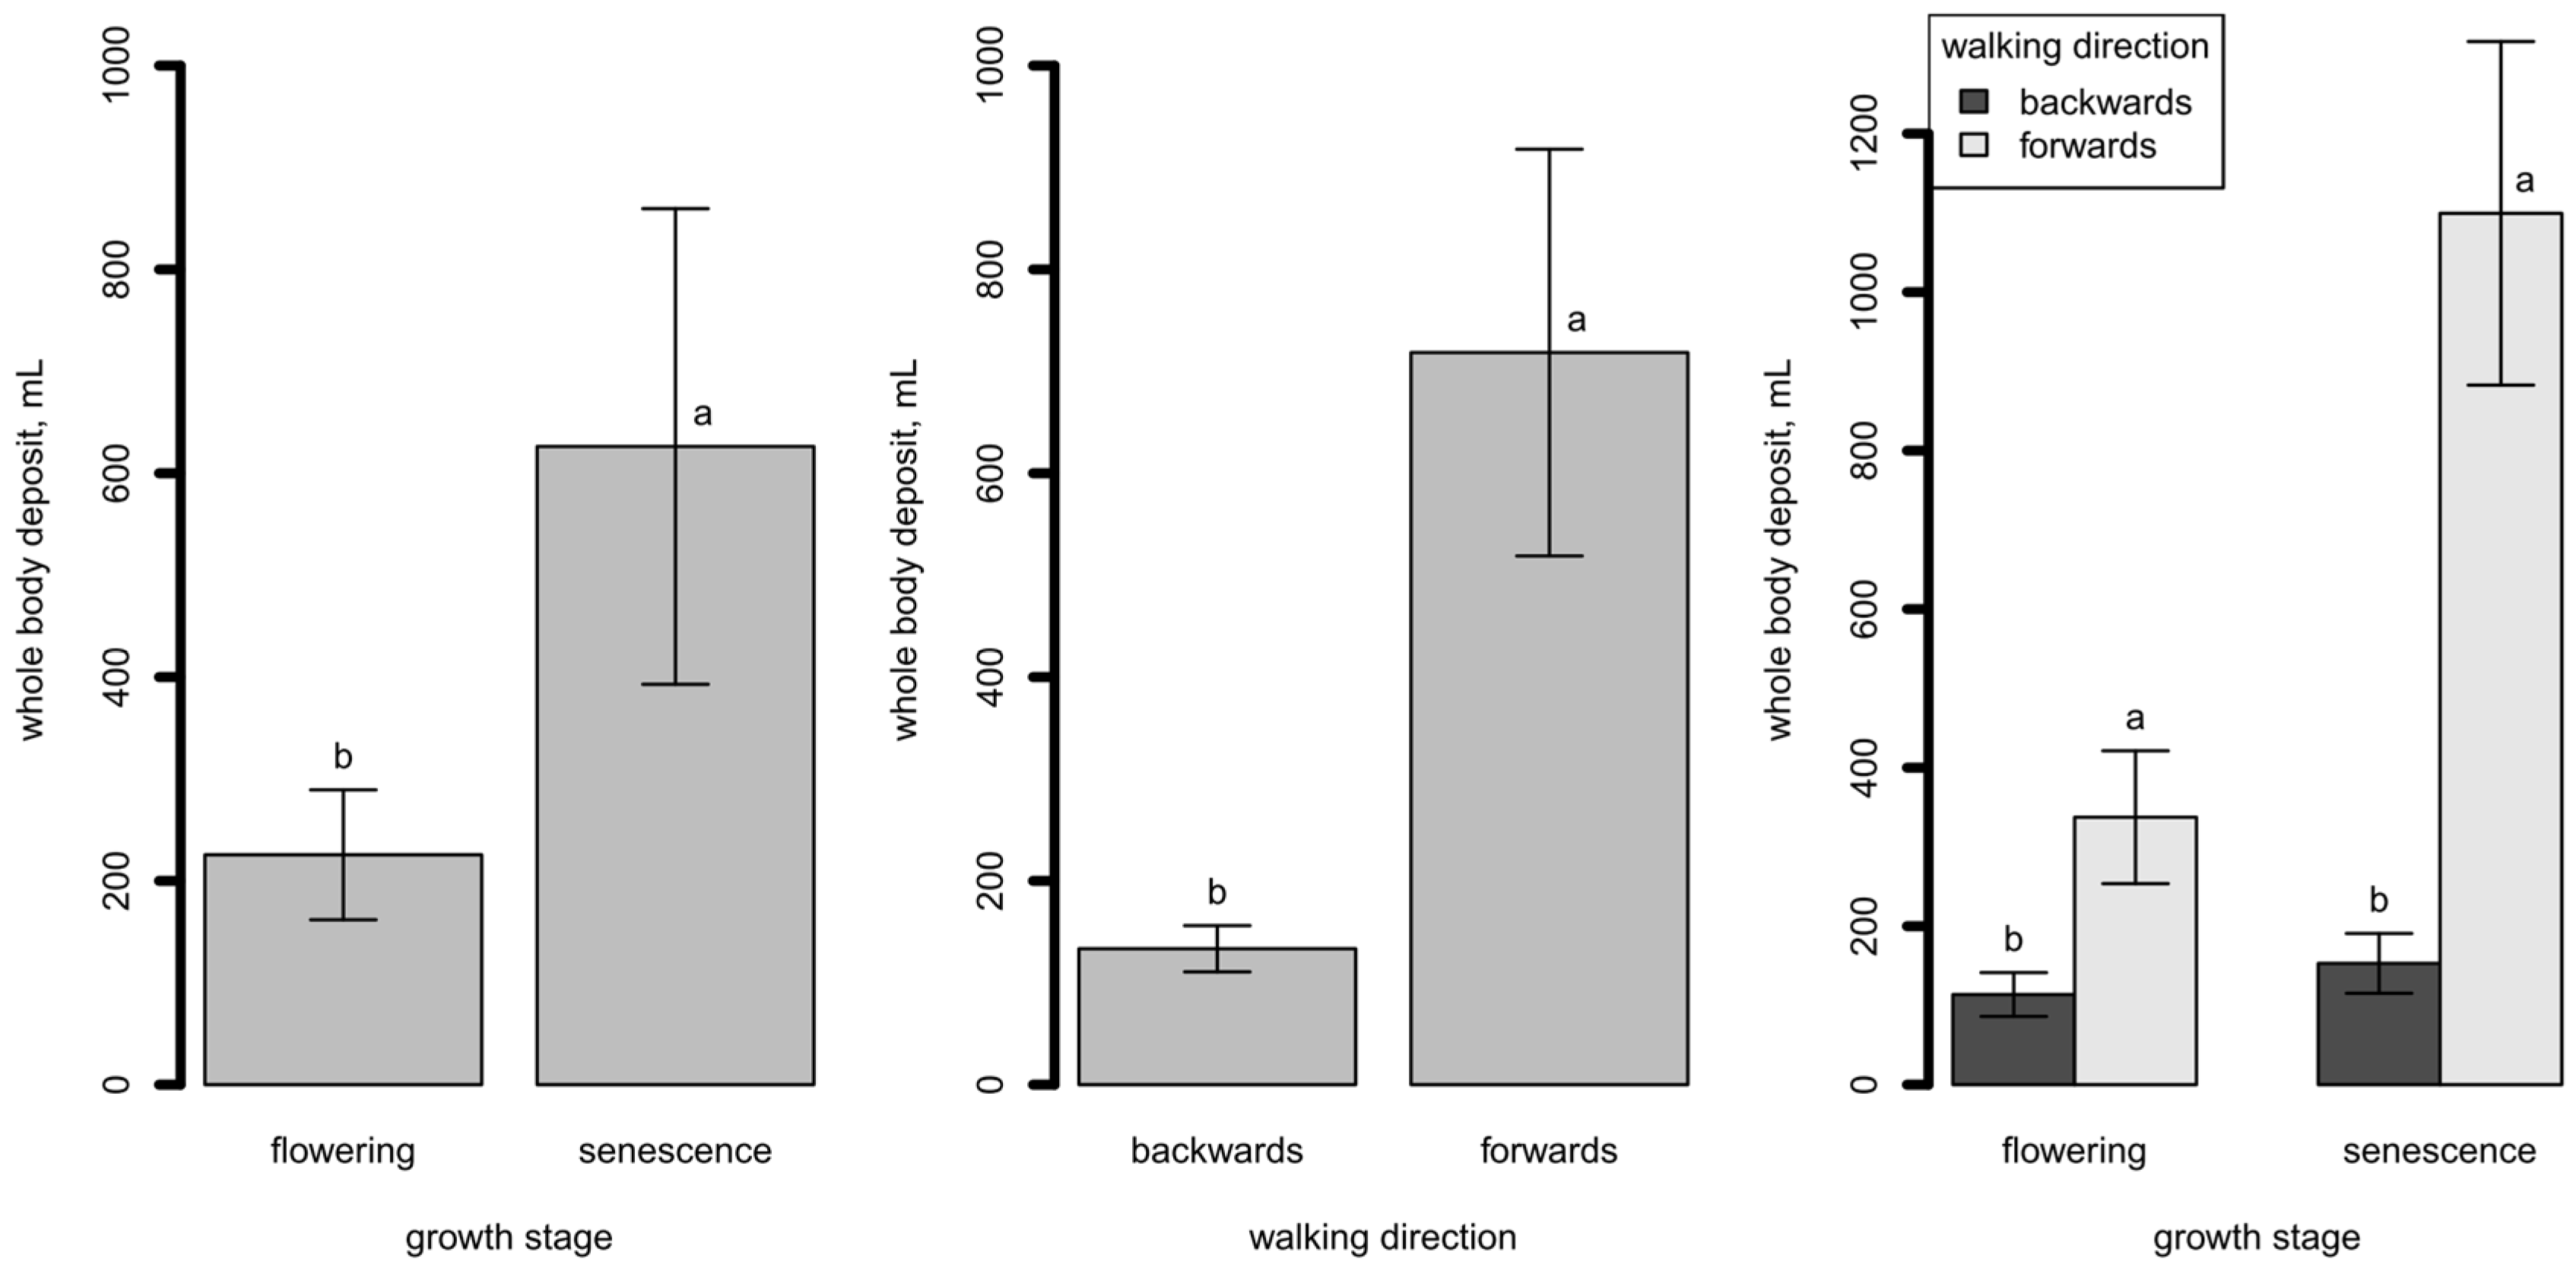
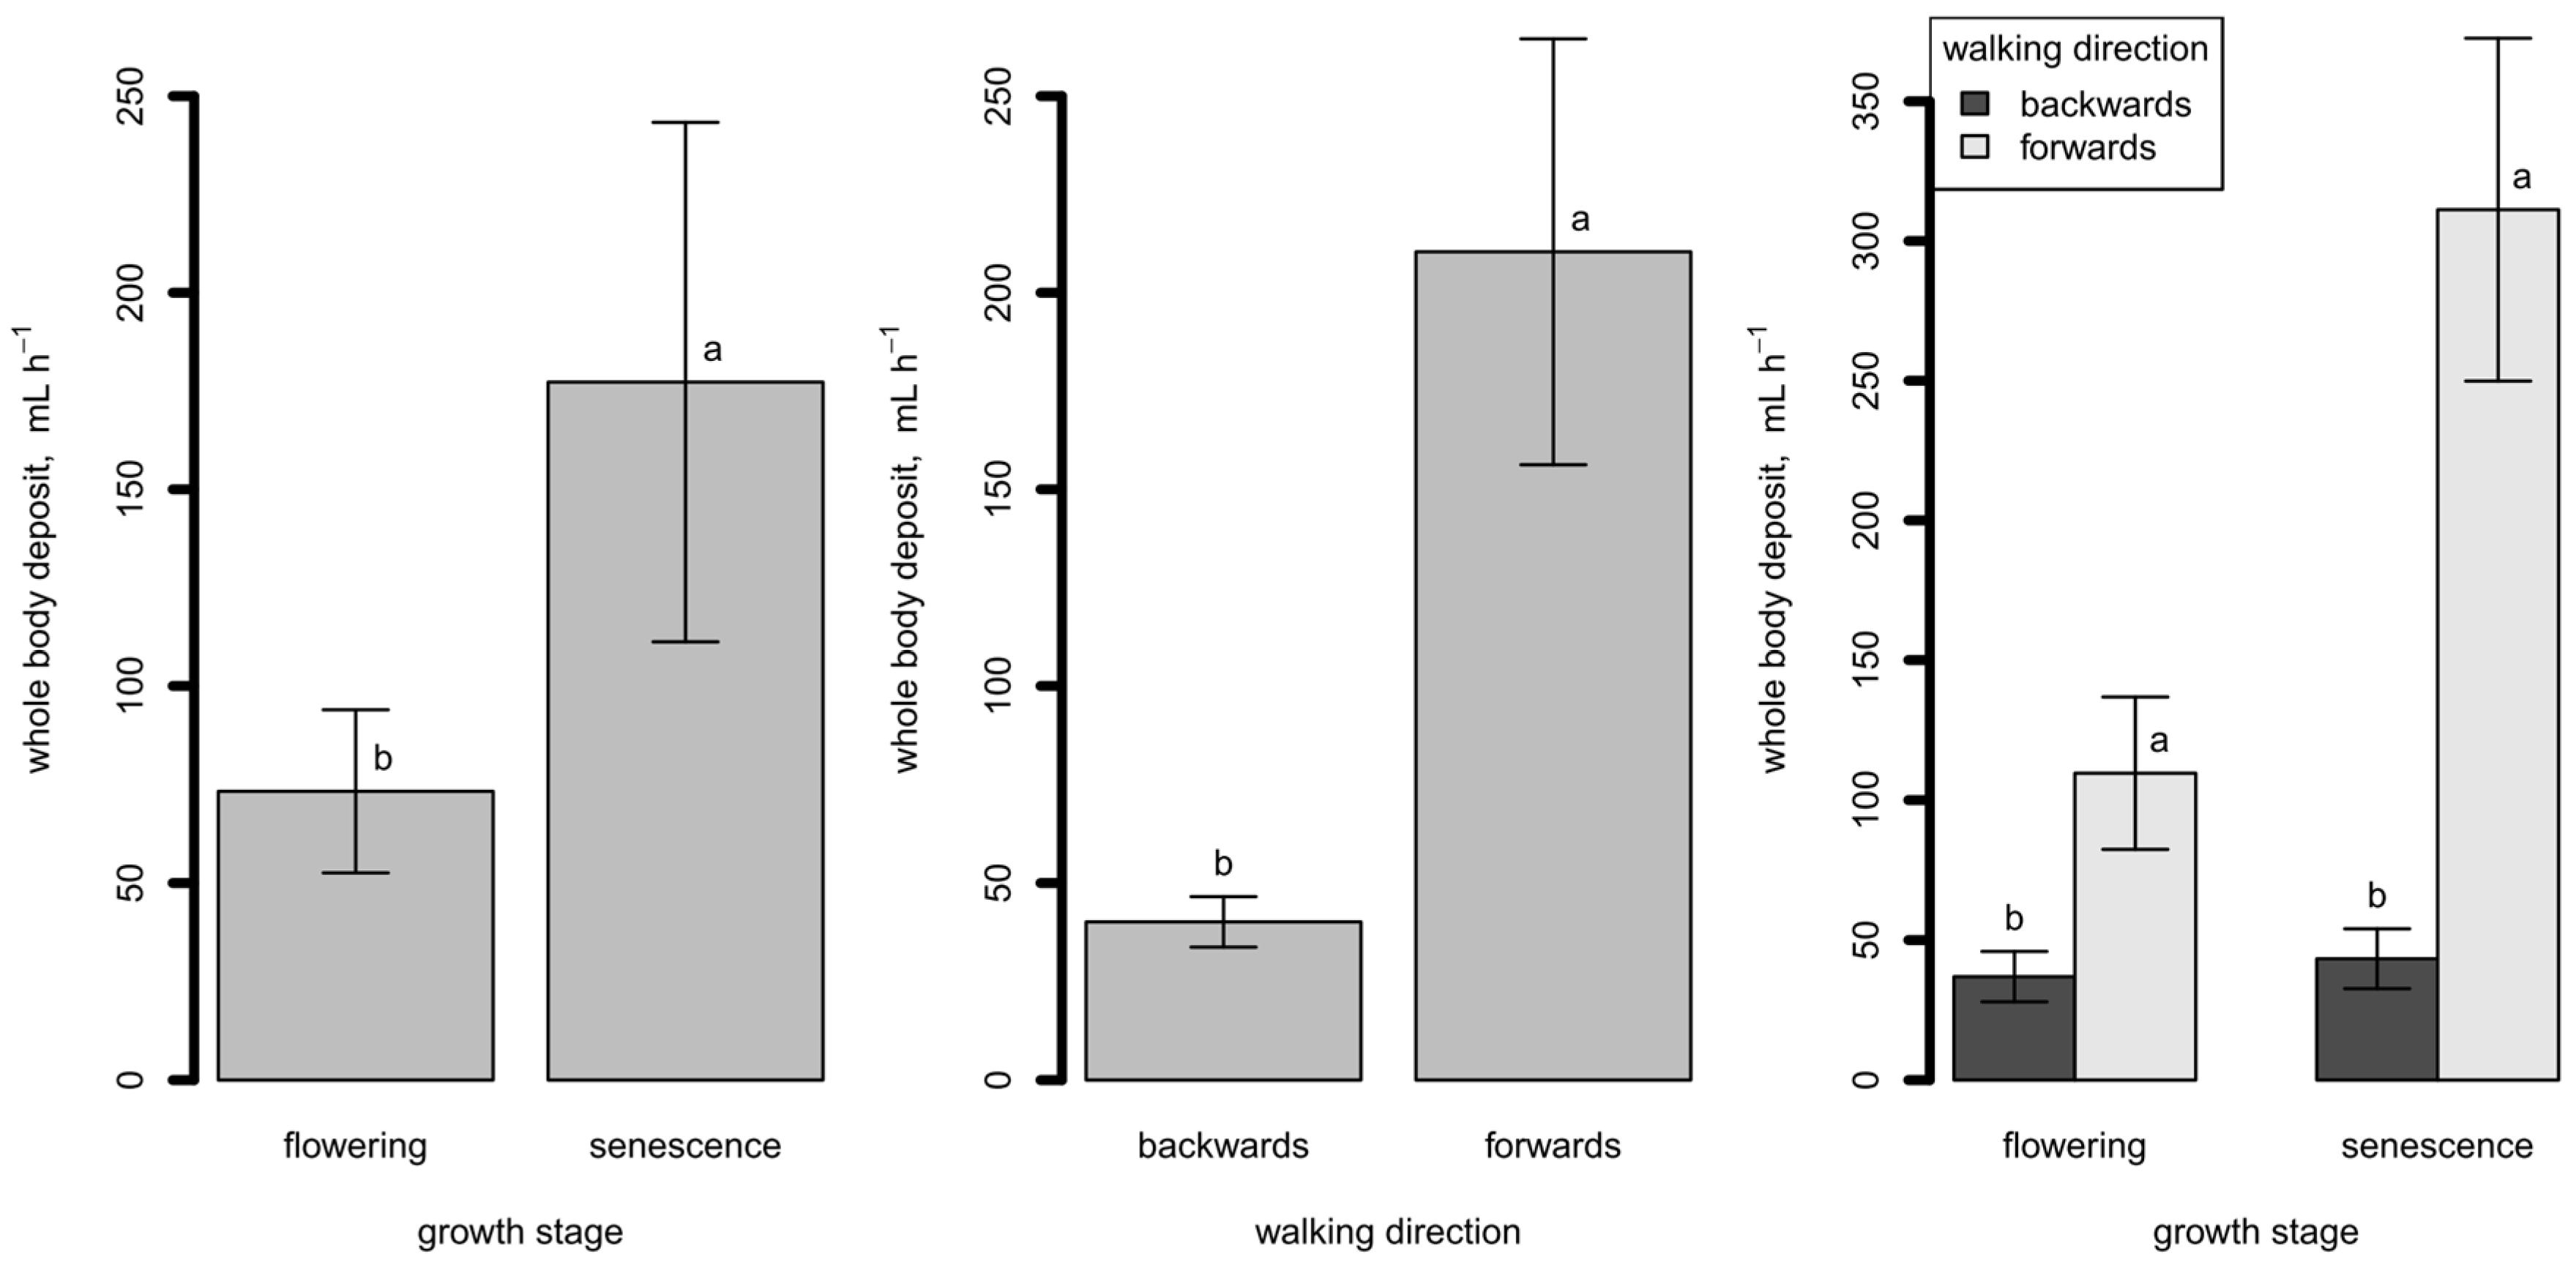
Figure 4 reports the whole-body deposit as affected by the plant growth stage and the operator movement. On average, the total PDE was 426 mL per 1000 L of the sprayed mixture (0.43‰, standard error of the mean (sem) = 130 mL). The tomato plants with fully developed vegetation caused a significantly higher dermal operator exposure: on average, the operator body collected 626 mL per 1000 L (0.63‰) of the sprayed mixture at senescence versus 226 mL (0.23‰) at flowering (ratio 2.8). This result was due both to the different movement of the spray lance necessary to spray a wider height interval of the canopy and to the greater contact between operator body and the tomato plant foliage when spraying tomato plants of greater height. The result is also in agreement with other experiments reported in the literature. Hughes et al. [49], as an example, when investigating the effect of crop type on PDE, found greater exposure during application of deltamethrin to maize (average height between 1.9 and 2.1 m) than to broccoli crops (plants height of 0.4–0.7 m).
The operator walking direction had a significant effect on the total PDE: on average, PDE was 718 mL per 1000 L of the sprayed mixture (0.72‰) walking forwards and 133 mL (0.13‰) walking backwards (ratio 5.4). The same result was obtained in both growth stages: at senescence, PDE was 1099 mL (1.10‰) walking forwards and 153 mL (0.15‰) walking backwards (ratio 7.2), whereas the corresponding values at flowering were 337 (0.34‰) and 114 mL (0.11‰), respectively, (ratio 3.0). Similar results were obtained by Nuyttens et al. [50] when testing several spray application techniques in pepper greenhouses: dermal operator exposure using a standard spray gun was reduced by a factor 7 when walking backwards. Similarly, Bjugstad and Torgrimsen [34] found that walking forwards using a knapsack sprayer on cucumber plants 2.0–2.2 m high gave a dermal exposure almost four times greater than that when working backwards. The higher exposure when walking forwards is mainly due to the greater contact of the operator’s body with the sprayed plants, but also to the fact that the operator walks through the spray cloud rather than away from it. Rincón et al. [51], testing a knapsack with a vertical spray boom, showed that if the operator stops at the turns for a few seconds, allowing the previously sprayed droplet cloud to dissipate, the level of exposure decreased significantly.
PDE expressed in milliliters per working hour is reported in Figure 5. On average, the operator’s body collected 125.3 ± 36.5 mL h−1 of the mixture (mean ± sem). This implies that at the end of the working day (8 h), the PDE is more than 1 L of the mixture, so operators should always wear appropriate personal protective equipment. PDE was 177.3 ± 60.1 mL h−1 at the senescence growth stage and 73.3 ± 20.7 mL h−1 at flowering (ratio = 2.4); 210.4 ± 54.2 mL h−1 walking forwards and 40.1 ± 6.4 mL h−1 walking backwards (ratio = 5.2).
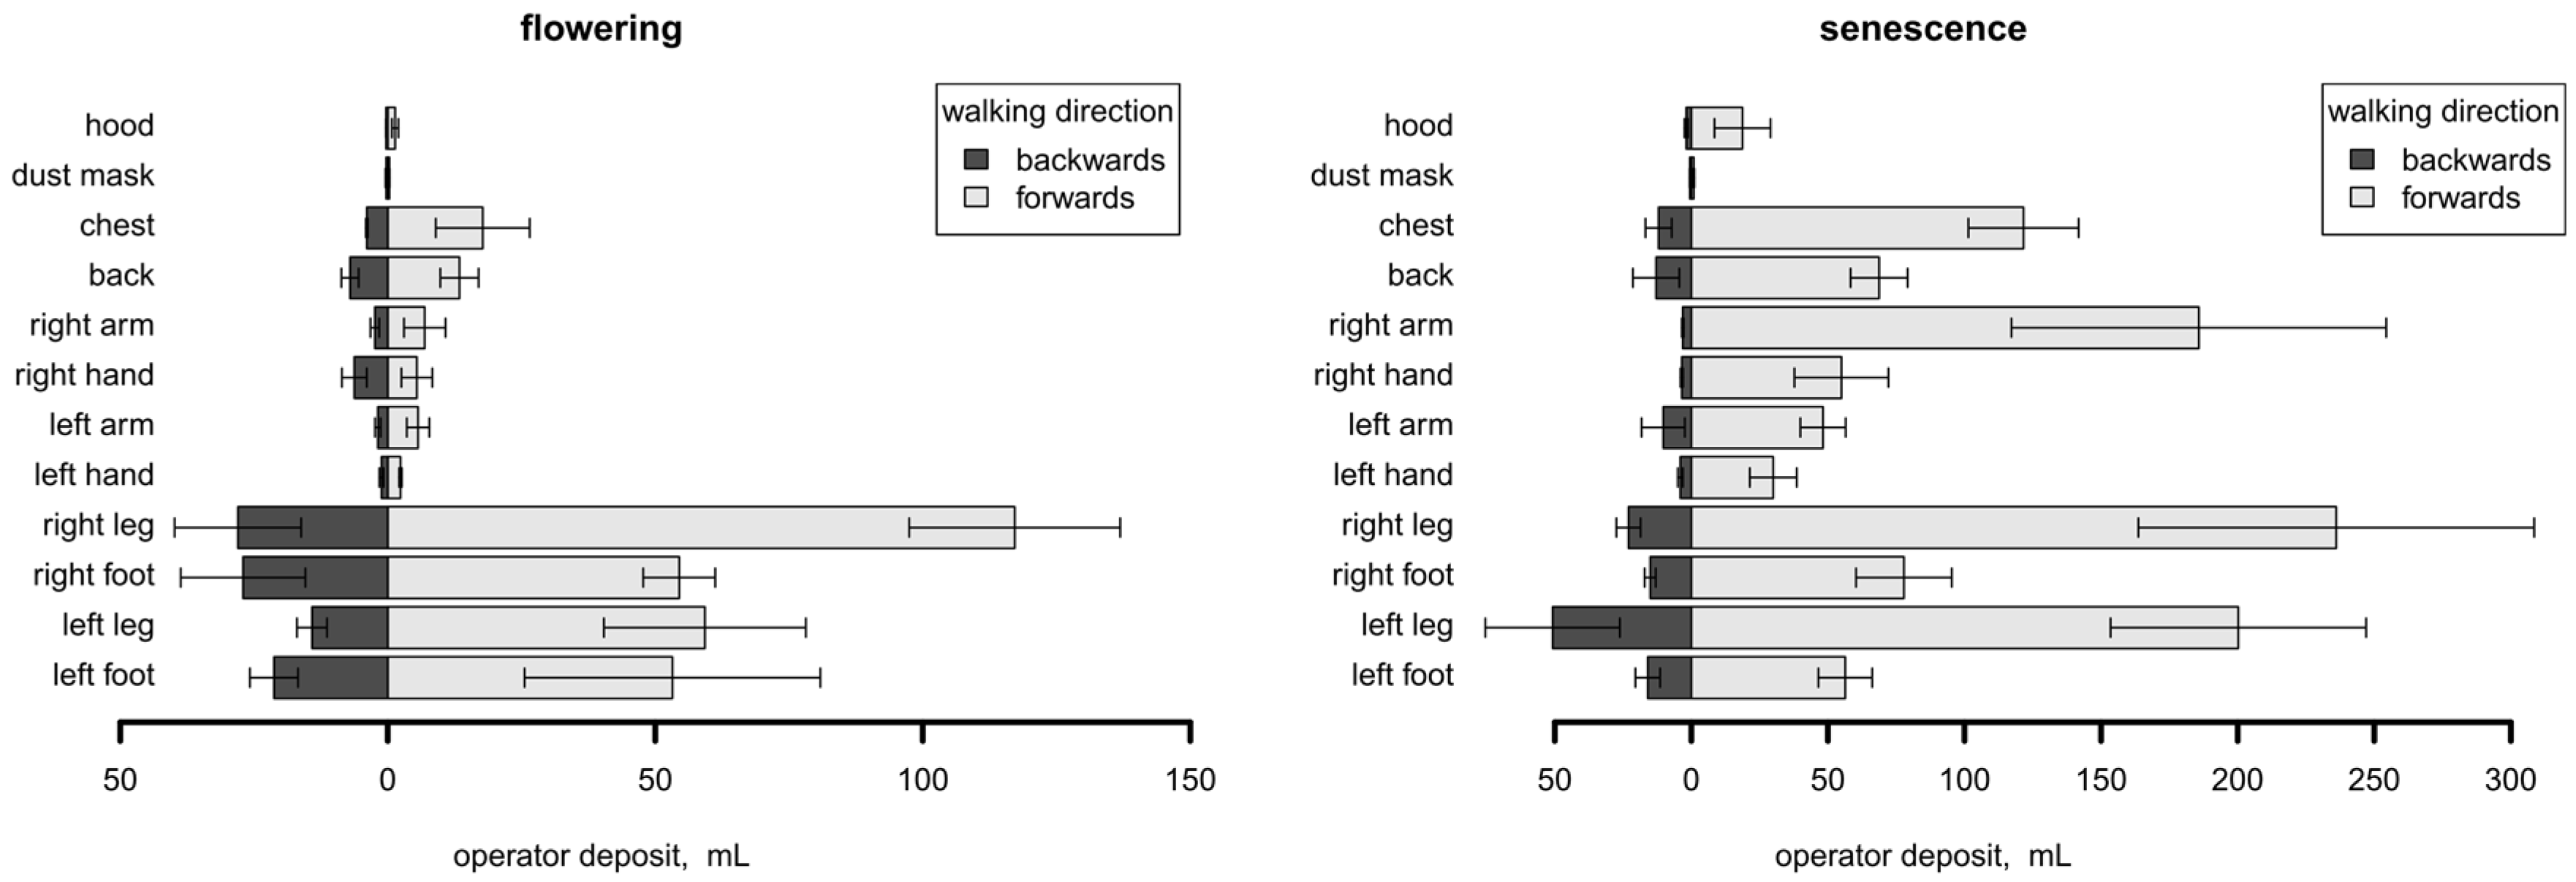
The contribution of each body part to the total PDE (mL per 1000 L of the sprayed mixture) is showed in Figure 6 according to the plant growth stage and the operator walking direction. Similar patterns were obtained when PDE was expressed in mL h−1.
At the flowering growth stage, PDE was almost all concentrated on the lower limbs (feet and legs): 84% when the operator walked forwards and 80% when he walked backwards. The upper limbs (hands and arms) accounted for 6% (forwards) and 10% (backwards), the trunk (chest and back) for 9% (forwards) and 10% (backwards), and the head (hood and dust mask) for the remaining part (less than 1%). At the senescence growth stage, while walking forwards, the lower limbs accounted for 52% of total PDE, the upper limbs for 29%, the trunk for 17%, and the head for 2%; the corresponding values while walking backwards were 68% (lower limbs), 14% (upper limbs), 16% (trunk), and 2% (head). All these data are consistent with the results of the cited research of Tuomanien et al. [32] on roses and Cao et al. [37] on wheat. Moreover, the operator’s right side (arm, hand, leg, and foot) was more exposed than the left side while he walked forwards (50% vs. 30%); the opposite happened while he walked backwards (29% vs. 53%). This result is due to the operator’s body rubbing against the sprayed vegetation, particularly for tomato plants at the senescence growth stage, when the vegetation is fully developed. When the operator walks forwards, he rubs his right side against a sprayed row during both the outward and return path and his left side against a sprayed row only during the return path; when he walks backwards, he rubs only his left side against a sprayed row only during the return path.
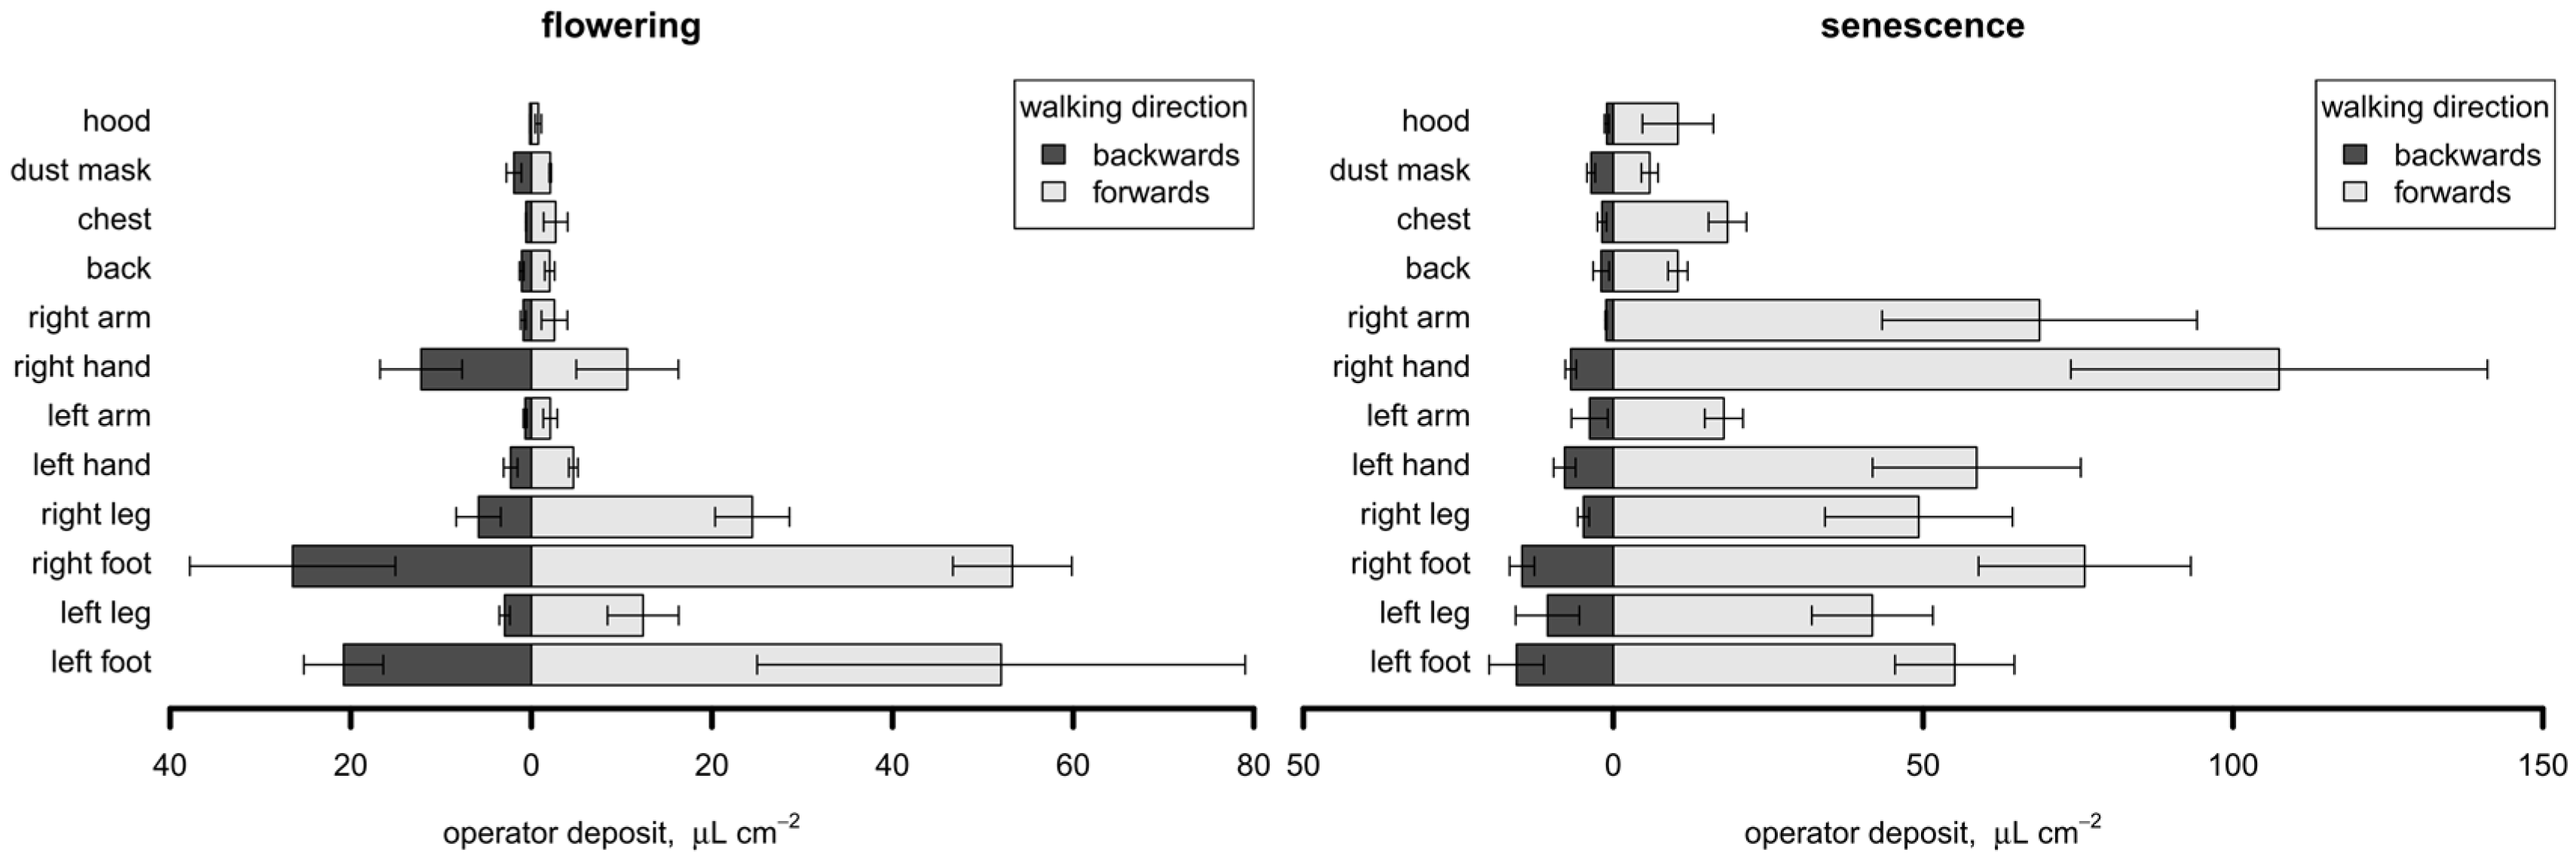
Finally, referring to the deposits-surface ratio of the coverall elements (µL cm−2), the results showed in Figure 7 were obtained.
At the flowering growth stage, the body parts with the highest unitary deposits were the feet in both walking directions. On average, the deposits on the feet, after having sprayed 1000 L of the mixture, was 52.65 ± 12.44 µL cm−2 while walking forwards and 23.61 ± 5.60 µL cm−2 while walking backwards. This because the operator was holding the spray lance, directing the spray jet from the top to the bottom of the plants, thus inevitably spraying the lower limbs as well.
At senescence, the unitary deposits showed different patterns according to the walking directions. When the operator moved backwards, the highest deposits were again measured on the feet: 15.61 ± 4.41 µL cm−2 on the left foot and 14.71 ± 2.00 µL cm−2 on the right one. Other deposits ranged from 1.05 ± 0.37 µL cm−2 on the hood to 10.60 ± 5.14 µL cm−2 on the left leg. When the operator moved forwards, the highest deposit was measured on the right hand (107.45 ± 33.61 µL cm−2), followed by right foot (76.07 ± 17.13 µL cm−2) and right arm (68.79 ± 25.41 µL cm−2). It is interesting to note that foliar deposits, normalized at 1800 L ha−1, were 1.58 µL cm−2 [40]; therefore, after having sprayed 1000 L of the mixture (or after having treated 0.56 ha of the surface), the deposit on the operator’s right hand was on average 68 times that on the leaves. This result is in accordance with Bjugstad and Torgrimsen’s work in [34]: testing several hand-held devices in greenhouses, they report that the deposit on the operator’s face and hands after 8 h spraying was in the worst case more than 2500 times greater than the foliar deposit.
3.3. Tests on Tomato Plants: Effects of Spray Lance Type and Working Pressure
Average temperature and relative humidity during trial 3 were 31 °C and 44%, respectively. PDE of the whole body ranged from 27.1 to 319.0 mL per 1000 L of the sprayed mixture (mean = 132.3 mL, sem = 27.7 mL), or from 8.2 to 107.8 mL h−1 (mean = 35.2 mL h−1, sem = 8.1 mL h−1). The analysis of variance (Table 6) showed that neither spray lance type nor working pressure affected PDE significantly. Mean values and standard error of the means are reported in Table 7.
In all the tests, PDE at 1 MPa was higher than at 2 MPa, even if not significantly. Other studies [52], aimed at evaluating the effects of spray pressure and ventilation conditions during greenhouse applications, showed that an increase in pressure produced an increase in respiratory exposure due to the reduction in the droplet size, but PDE with higher pressures was lower under multidirectional ventilation and higher under unidirectional ventilation. Similarly, another study of Berger-Preiß et al. [53] showed that the inhalation exposure was higher when the diameter of the released spray droplets was smaller.
PDE with spray lance SL2 was always higher than with SL1, even if not significantly, perhaps due to the difference in the spray lance lengths (SL1 = 0.5 m, SL2 = 0.3 m). Therefore, the best way to reduce the operator exposure when using spray lances is to perform the spray applications by walking backwards rather than forwards. In trial 2, under the same conditions (spray lance = SL1, pressure = 2 MPa, plants at the senescence growth stage, operator movement = backwards—Figure 4 and Figure 5), PDE was higher (153.1 vs. 46.1 mL or 43.3 vs. 14.0 mL h−1), perhaps due to the different plant geometry (Table 4).
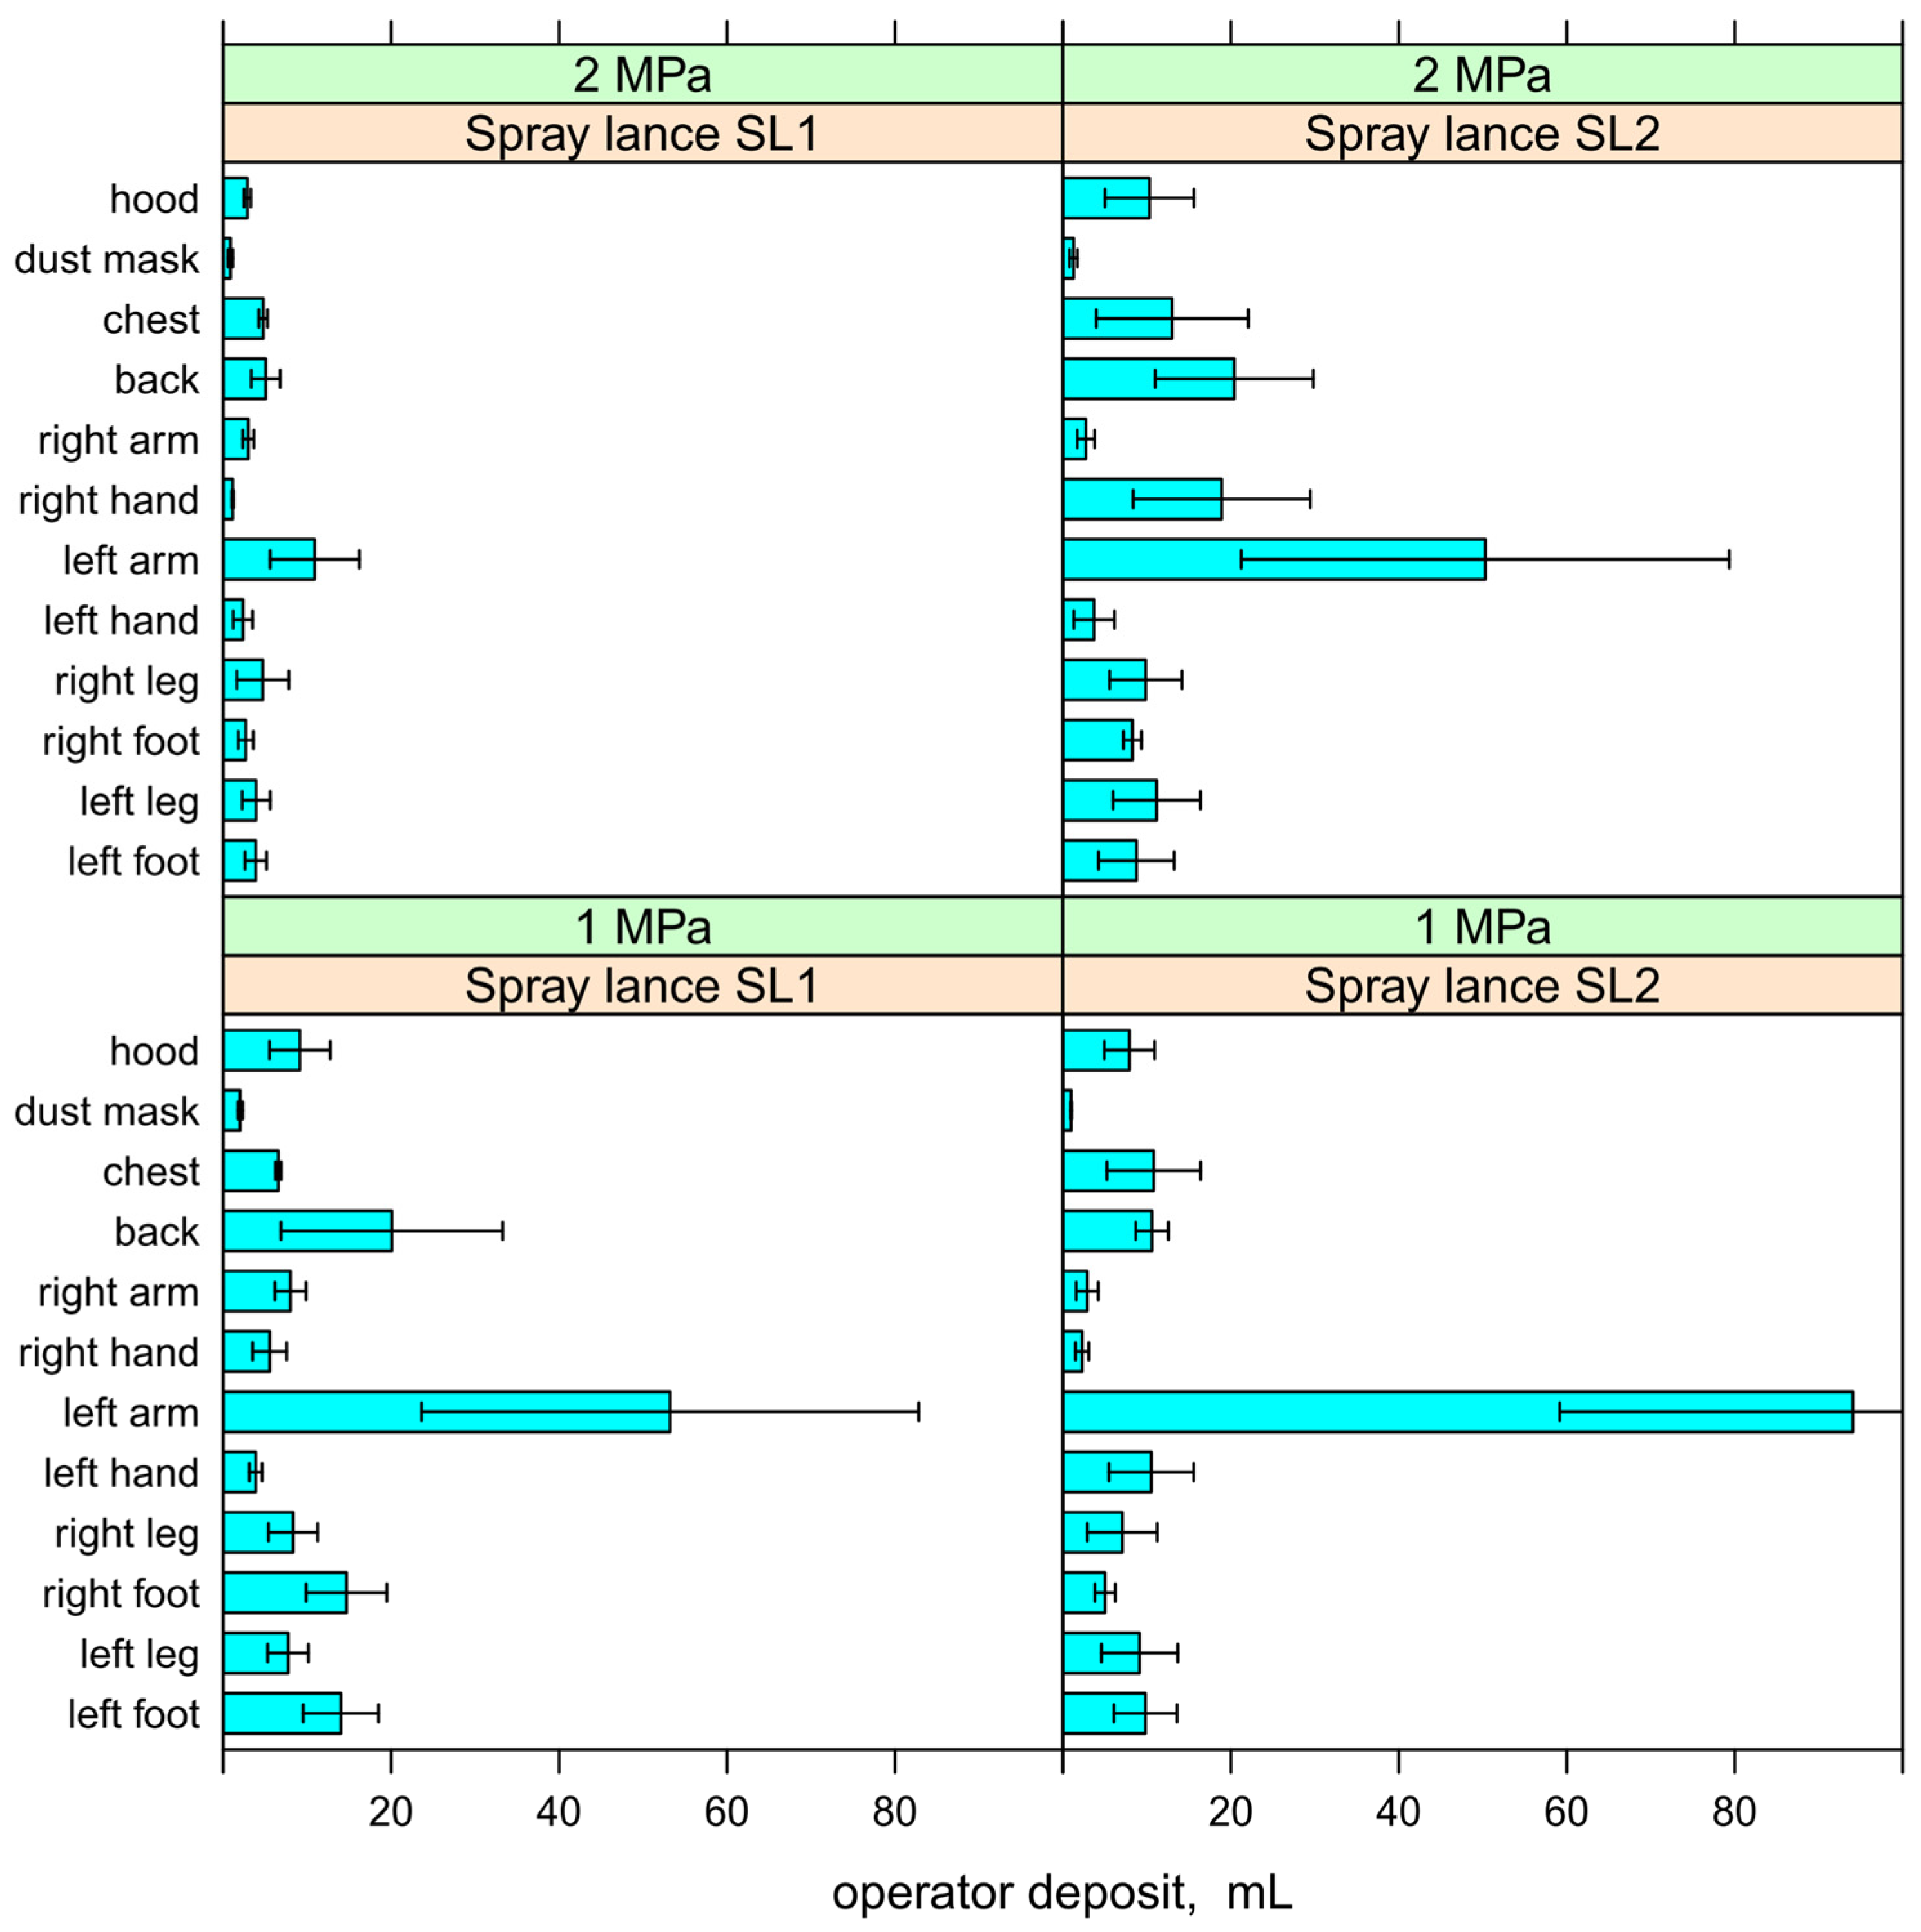
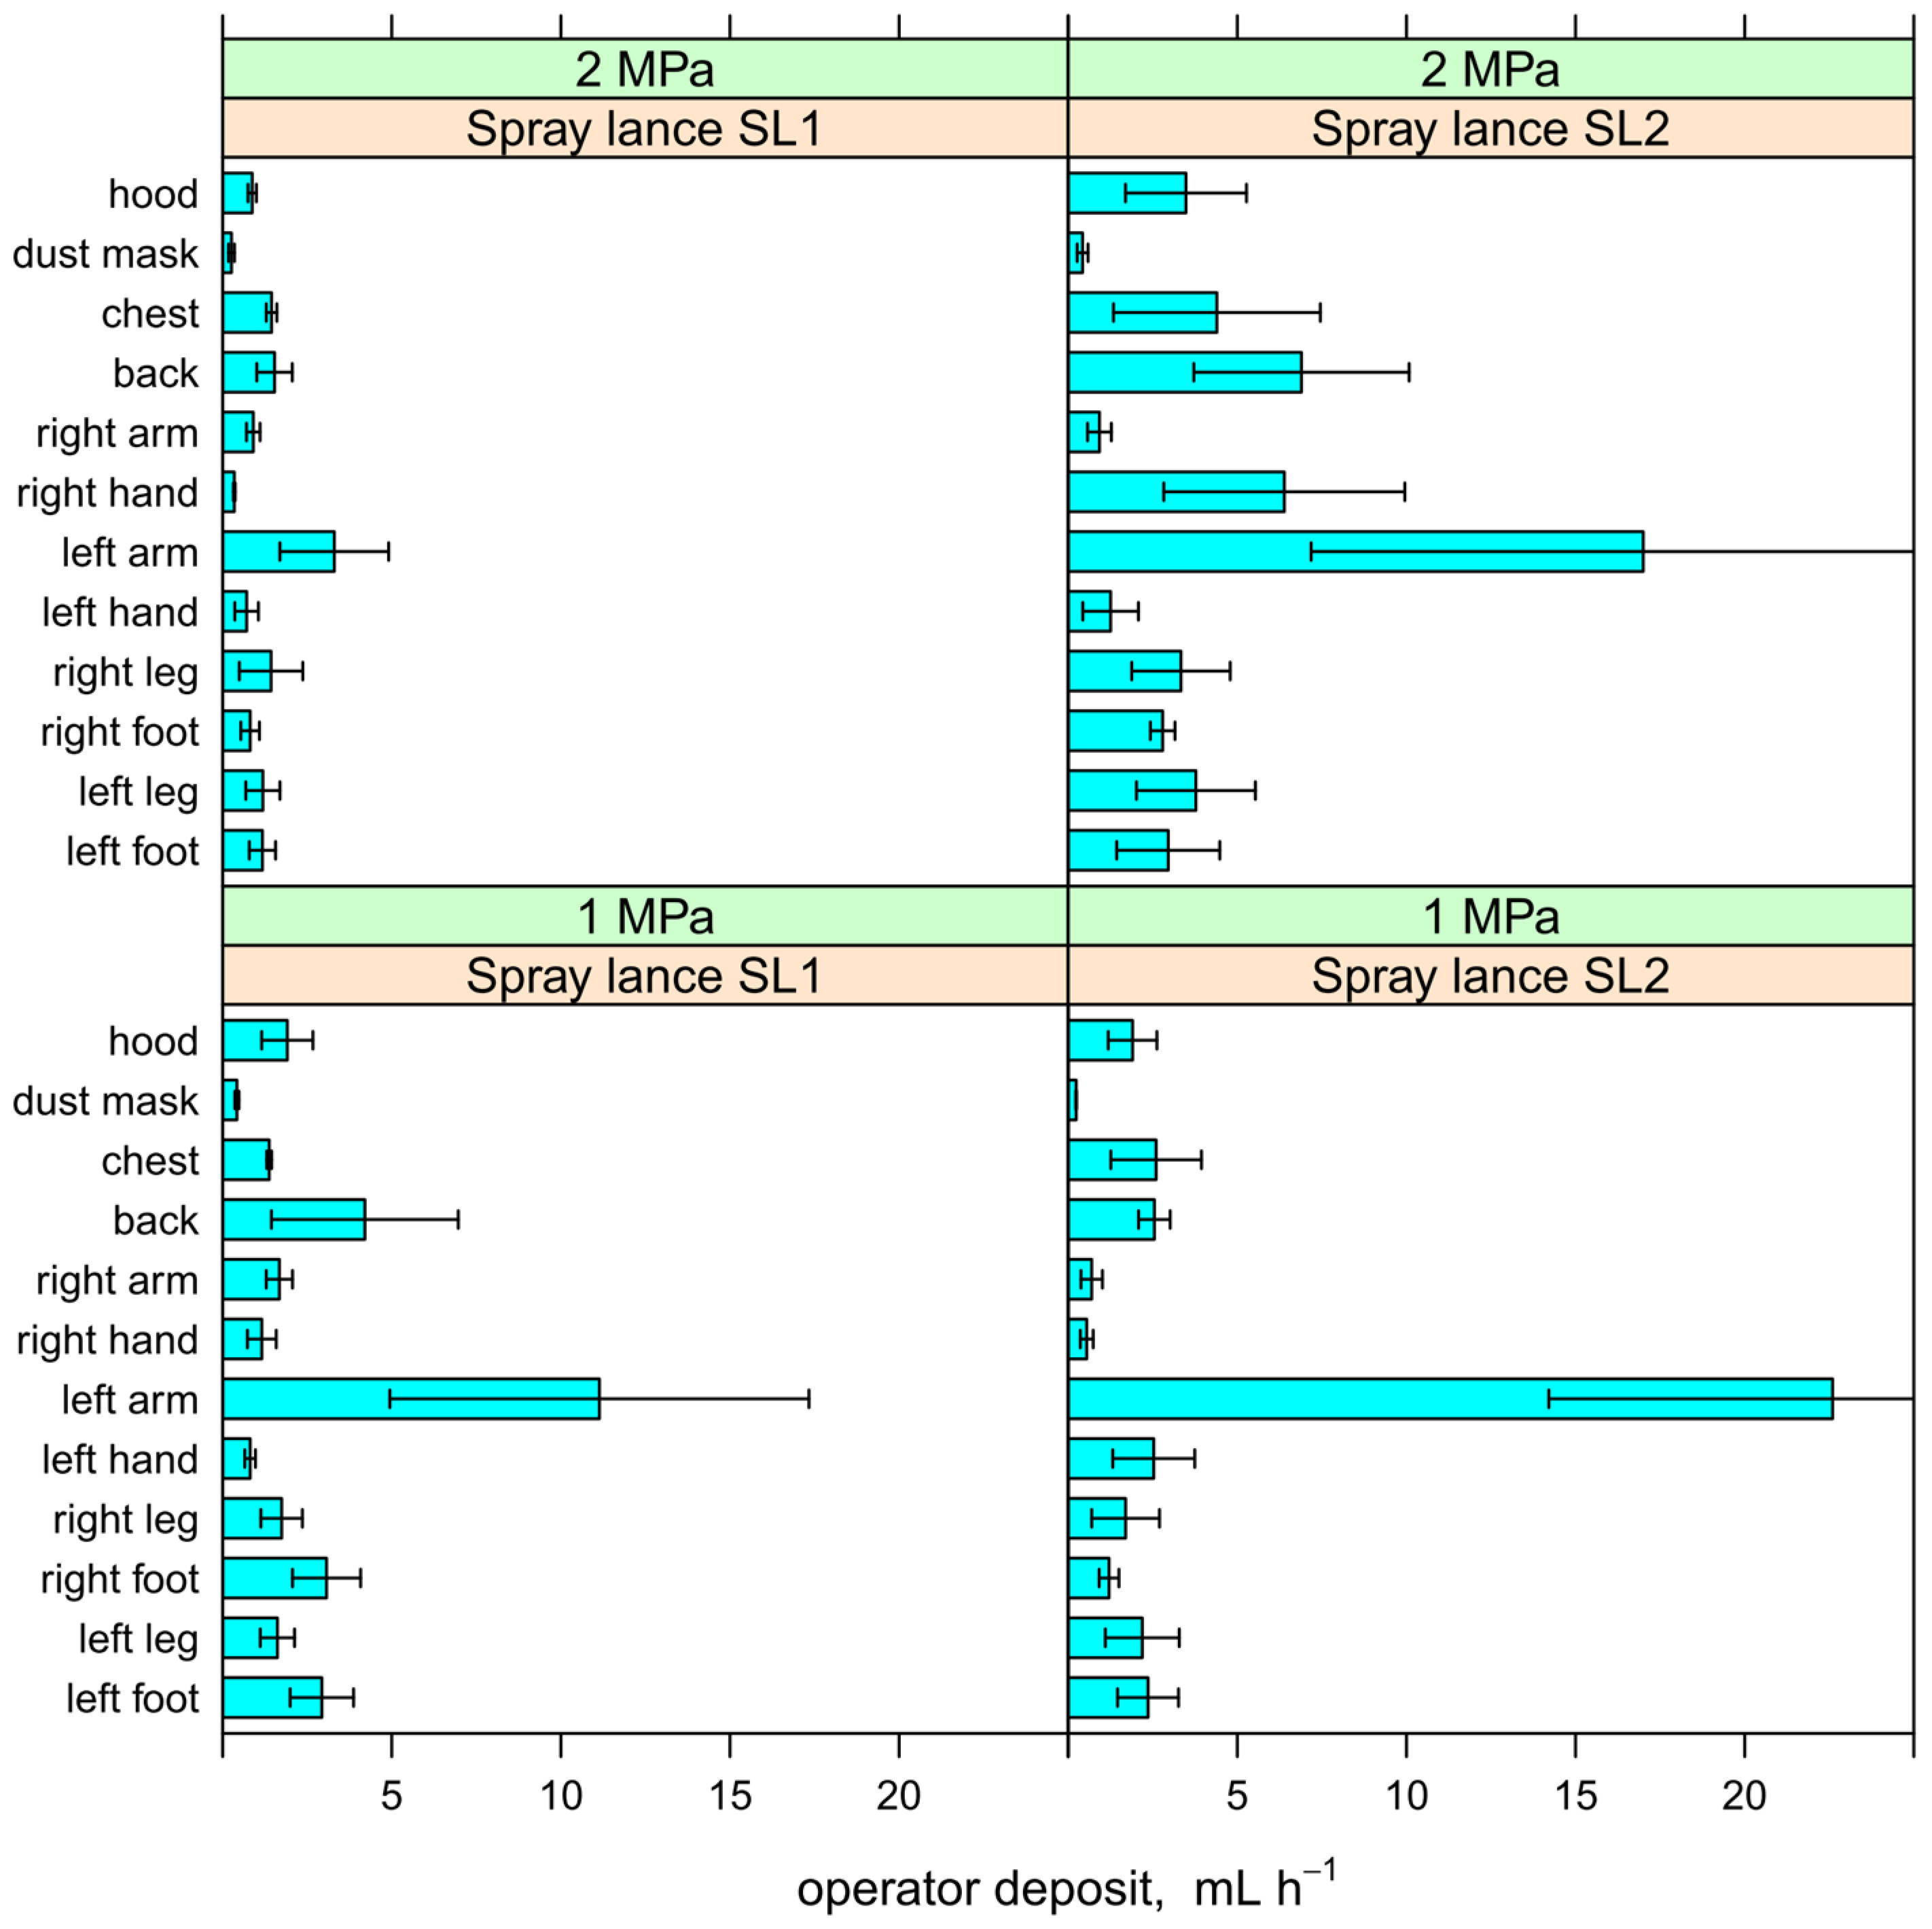
The deposit ds (mL) on each coverall element is reported in Figure 8 for each test condition. The patterns are very similar, regardless of the spray lance type or the spraying pressure. The most exposed part, consistently with walking backwards, was the left arm (on average 52.1 ± 14.6 mL), which alone accounted for 39.4% of the total PDE. The average exposure of the other body parts ranged from 1.3 ± 0.2 (dust mask) to 14.0 ± 4.0 mL (back). On average, the upper limbs accounted for 51.7% of the total PDE, the lower limbs for 24.4%, the trunk for 17.3%, and the head for 6.7%.
Deposits dt (mL h−1) are reported in Figure 9. They differ from ds by a scale factor, different for each test condition according to the nozzle flow rate. The deposits on the left arm ranged from 3.3 mL h−1 (spray lance SL1 at 2 MPa) to 22.6 mL h−1 (spray lance SL2 at 1 MPa), with a mean value of 13.5 mL h−1 (sem = 3.8 mL h−1). The average deposits on the other body parts ranged from 0.3 ± 0.0 mL h−1 (dust mask) to 3.8 ± 1.1 mL h−1 (back).
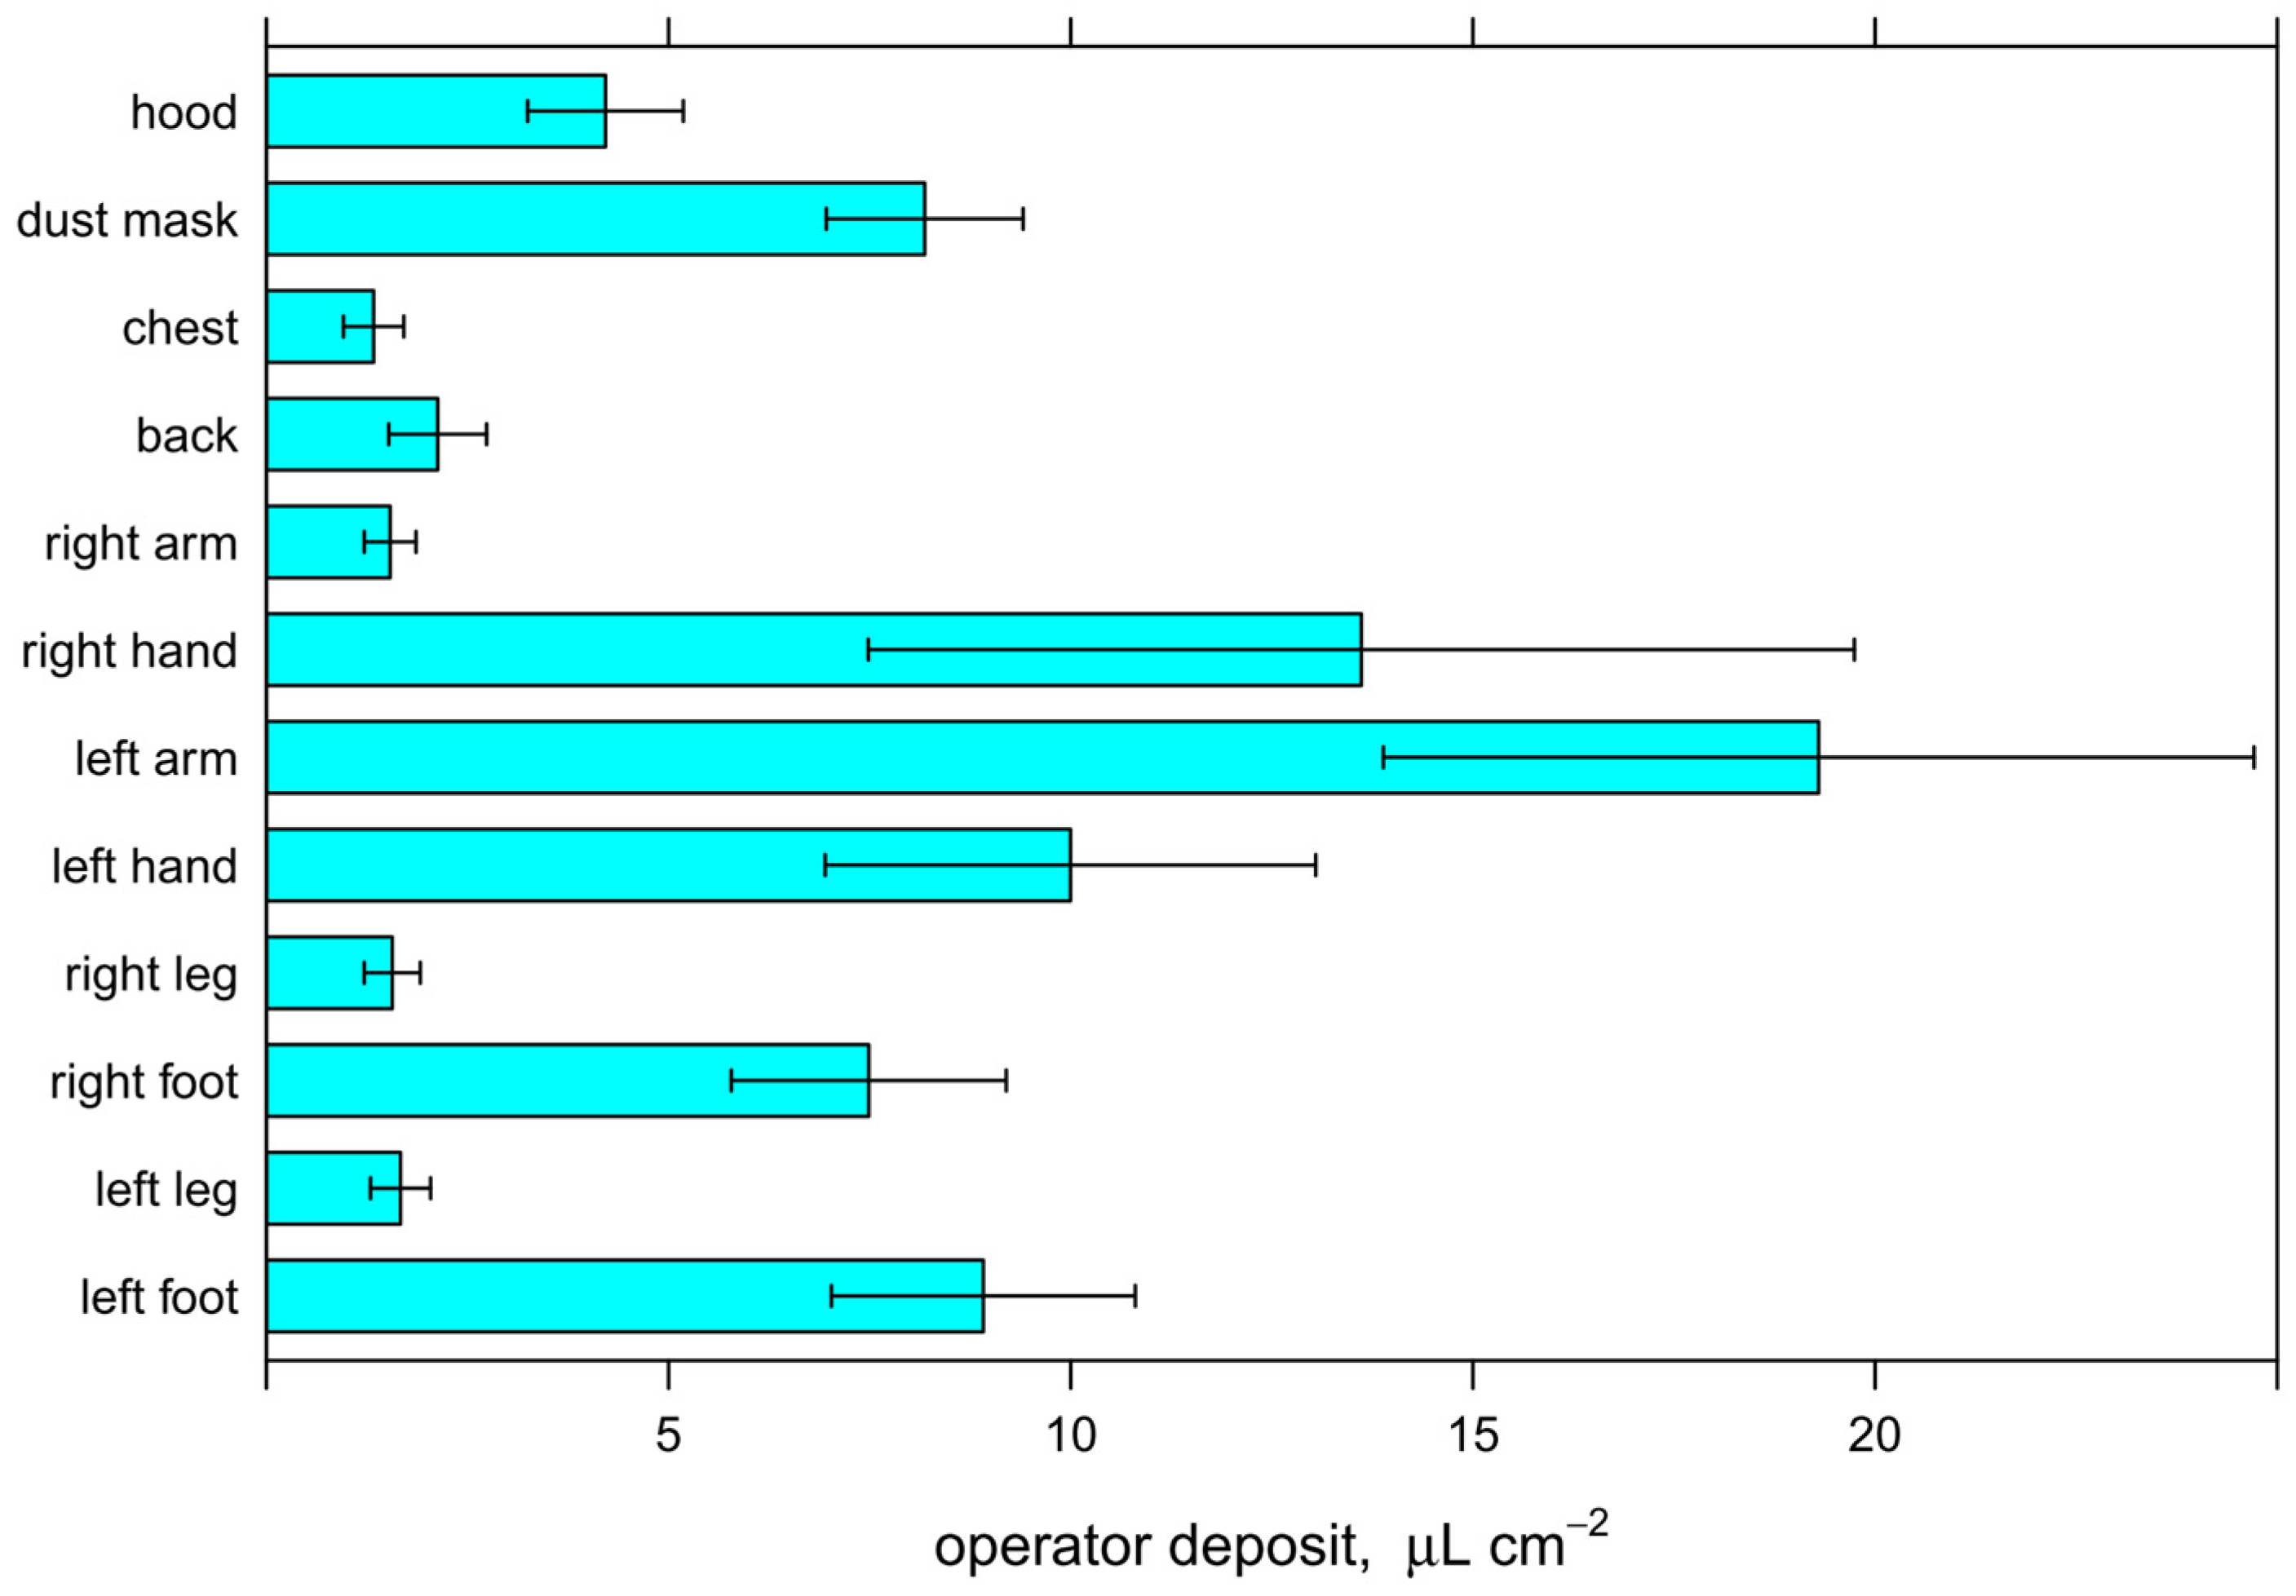
Finally, the average deposits per unit of surface ranged from 1.33 ± 0.38 µL cm−2 (chest) to 19.30 ± 5.41 µL cm−2 (left arm) (Figure 10); the mean value was 6.66 ± 0.87 µL cm−2. The values are comparable with those measured during trial 2 under the same test conditions (Figure 7). The unitary deposits on several body parts were quite high, particularly on the hands (right hand, that was holding the spray lance; left hand, used to adjust the pipeline), the feet (exposure also coming from stepping on the ground losses), the left arm (contact with the sprayed foliage), and also the dust mask.
3.4. Tests on Strawberry Plants
The average temperature and relative humidity during the trials on the strawberry plants were 18 °C and 75%, respectively. The difference between the two spraying devices was statistically significant at p = 0.05 level (Table 8).
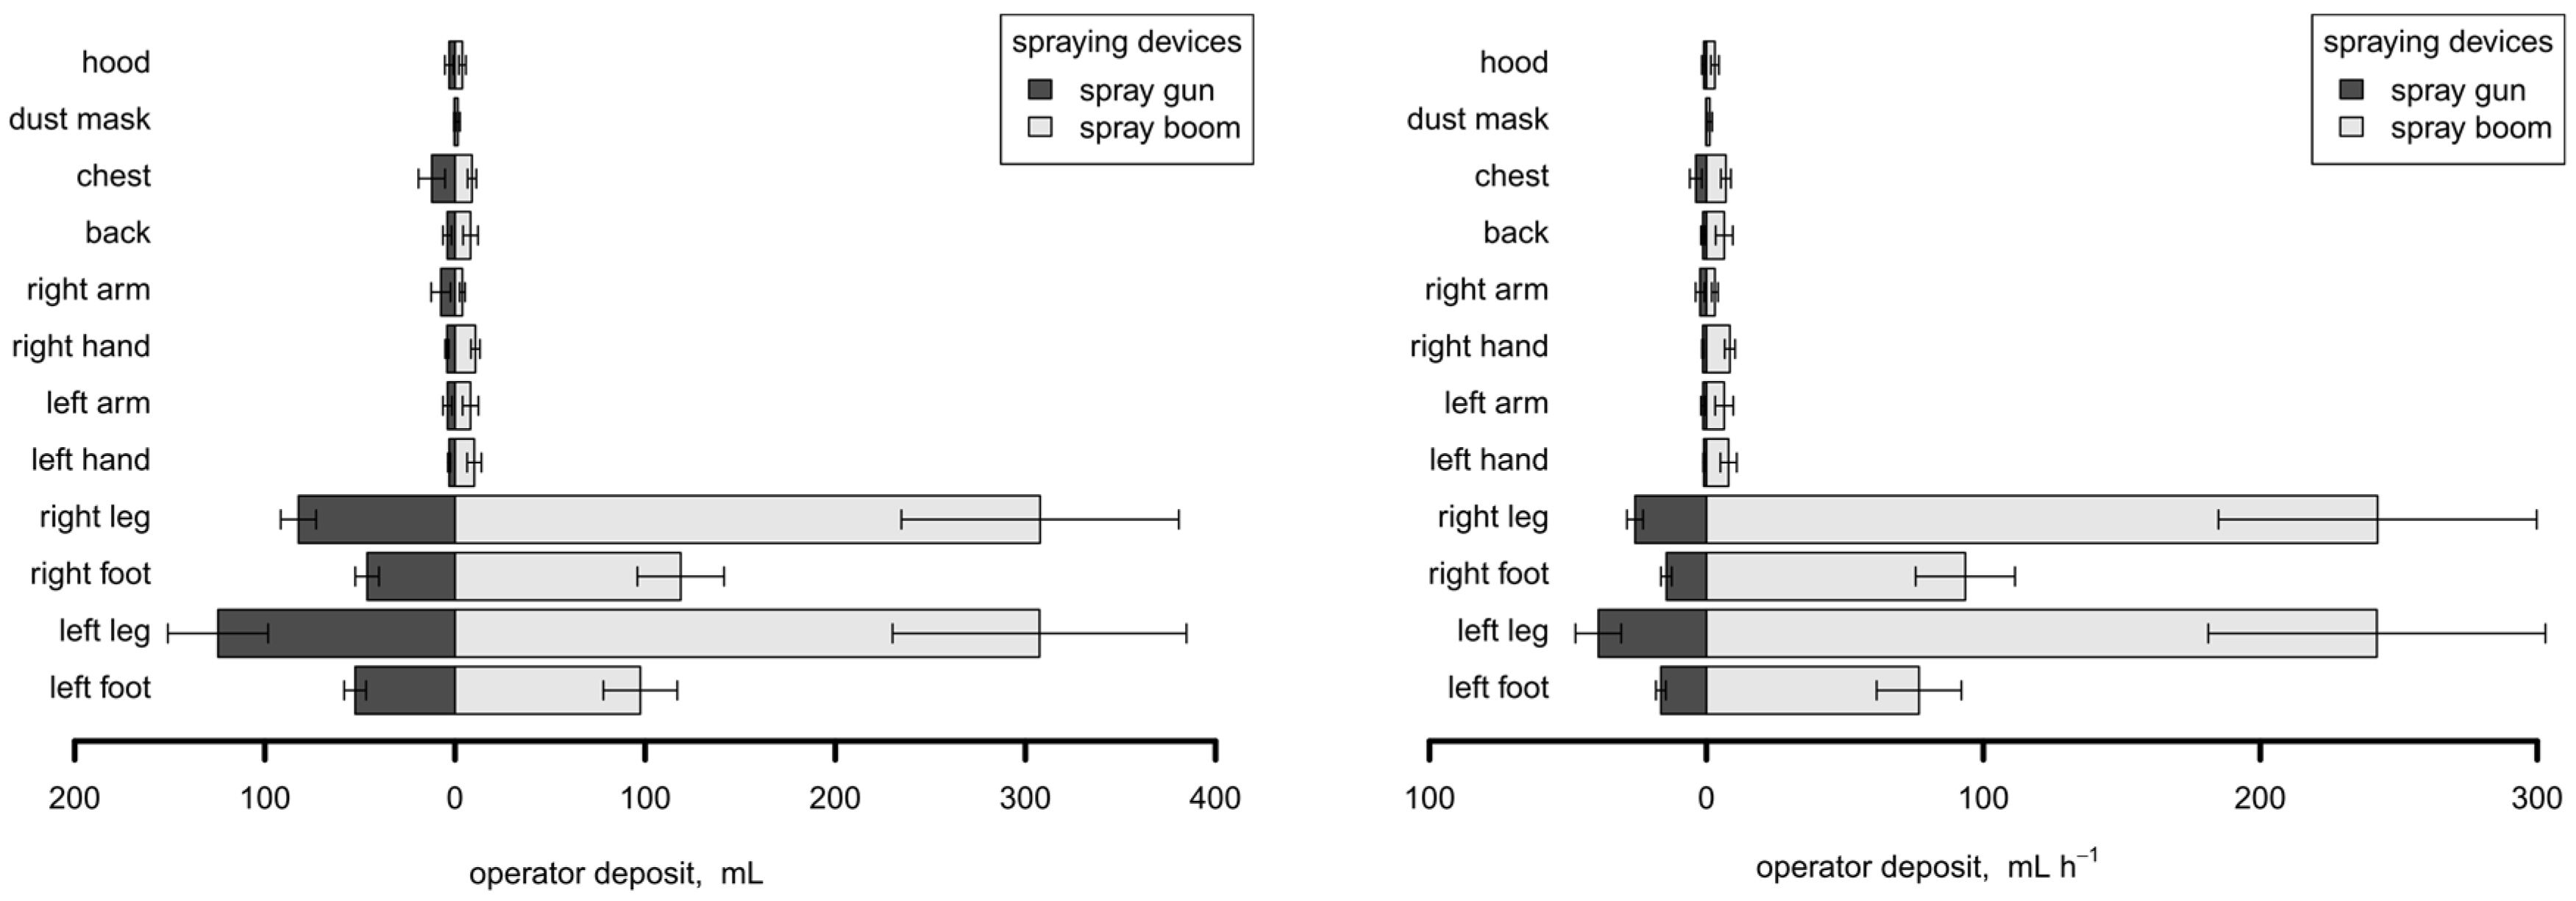
The mean deposit on the whole body, after having sprayed 1000 L of the mixture, was 615.5 ± 139.8 mL, corresponding to 403.1 ± 133.3 mL h−1. PDE was significantly higher when the operator used the short hand-held spray boom rather than the spray gun: 886.9 ± 199.0 mL (or 698.5 ± 156.7 mL h−1) versus 344.0 ± 50.4 mL (or 107.7 ± 15.8 mL h−1), ratio = 2.6 (or 6.5). When the operator used the spray boom, he inevitably directed the spray jet towards his lower limbs (more than when he used the spray gun), thus increasing his exposure.
This result can be better analyzed by observing the PDE of the body parts (Figure 11). The deposit on the lower limbs was 831.4 ± 185.9 mL per 1000 L of the sprayed mixture (93.7% of the total PDE) when the operator used the short spray boom and 305.6 ± 37.5 mL (88.8%) when he used the spray gun. The spray boom caused an increase of 172% in the lower limb deposit with respect to the spray gun. The deposit on the other body parts when using the spray boom was about 33.0 ± 9.2 mL (3.7%) on the upper limbs, 17.1 ± 6.0 mL (1.9%) on the trunk, and 5.4 ± 2.5 mL (less than 1%) on the head; the corresponding values when using the spray gun were 18.7 ± 6.4 mL (5.4%) on the upper limbs, 16.3 ± 9.0 mL (4.7%) on the trunk and 3.5 ± 2.5 mL (1.0%) on the head.
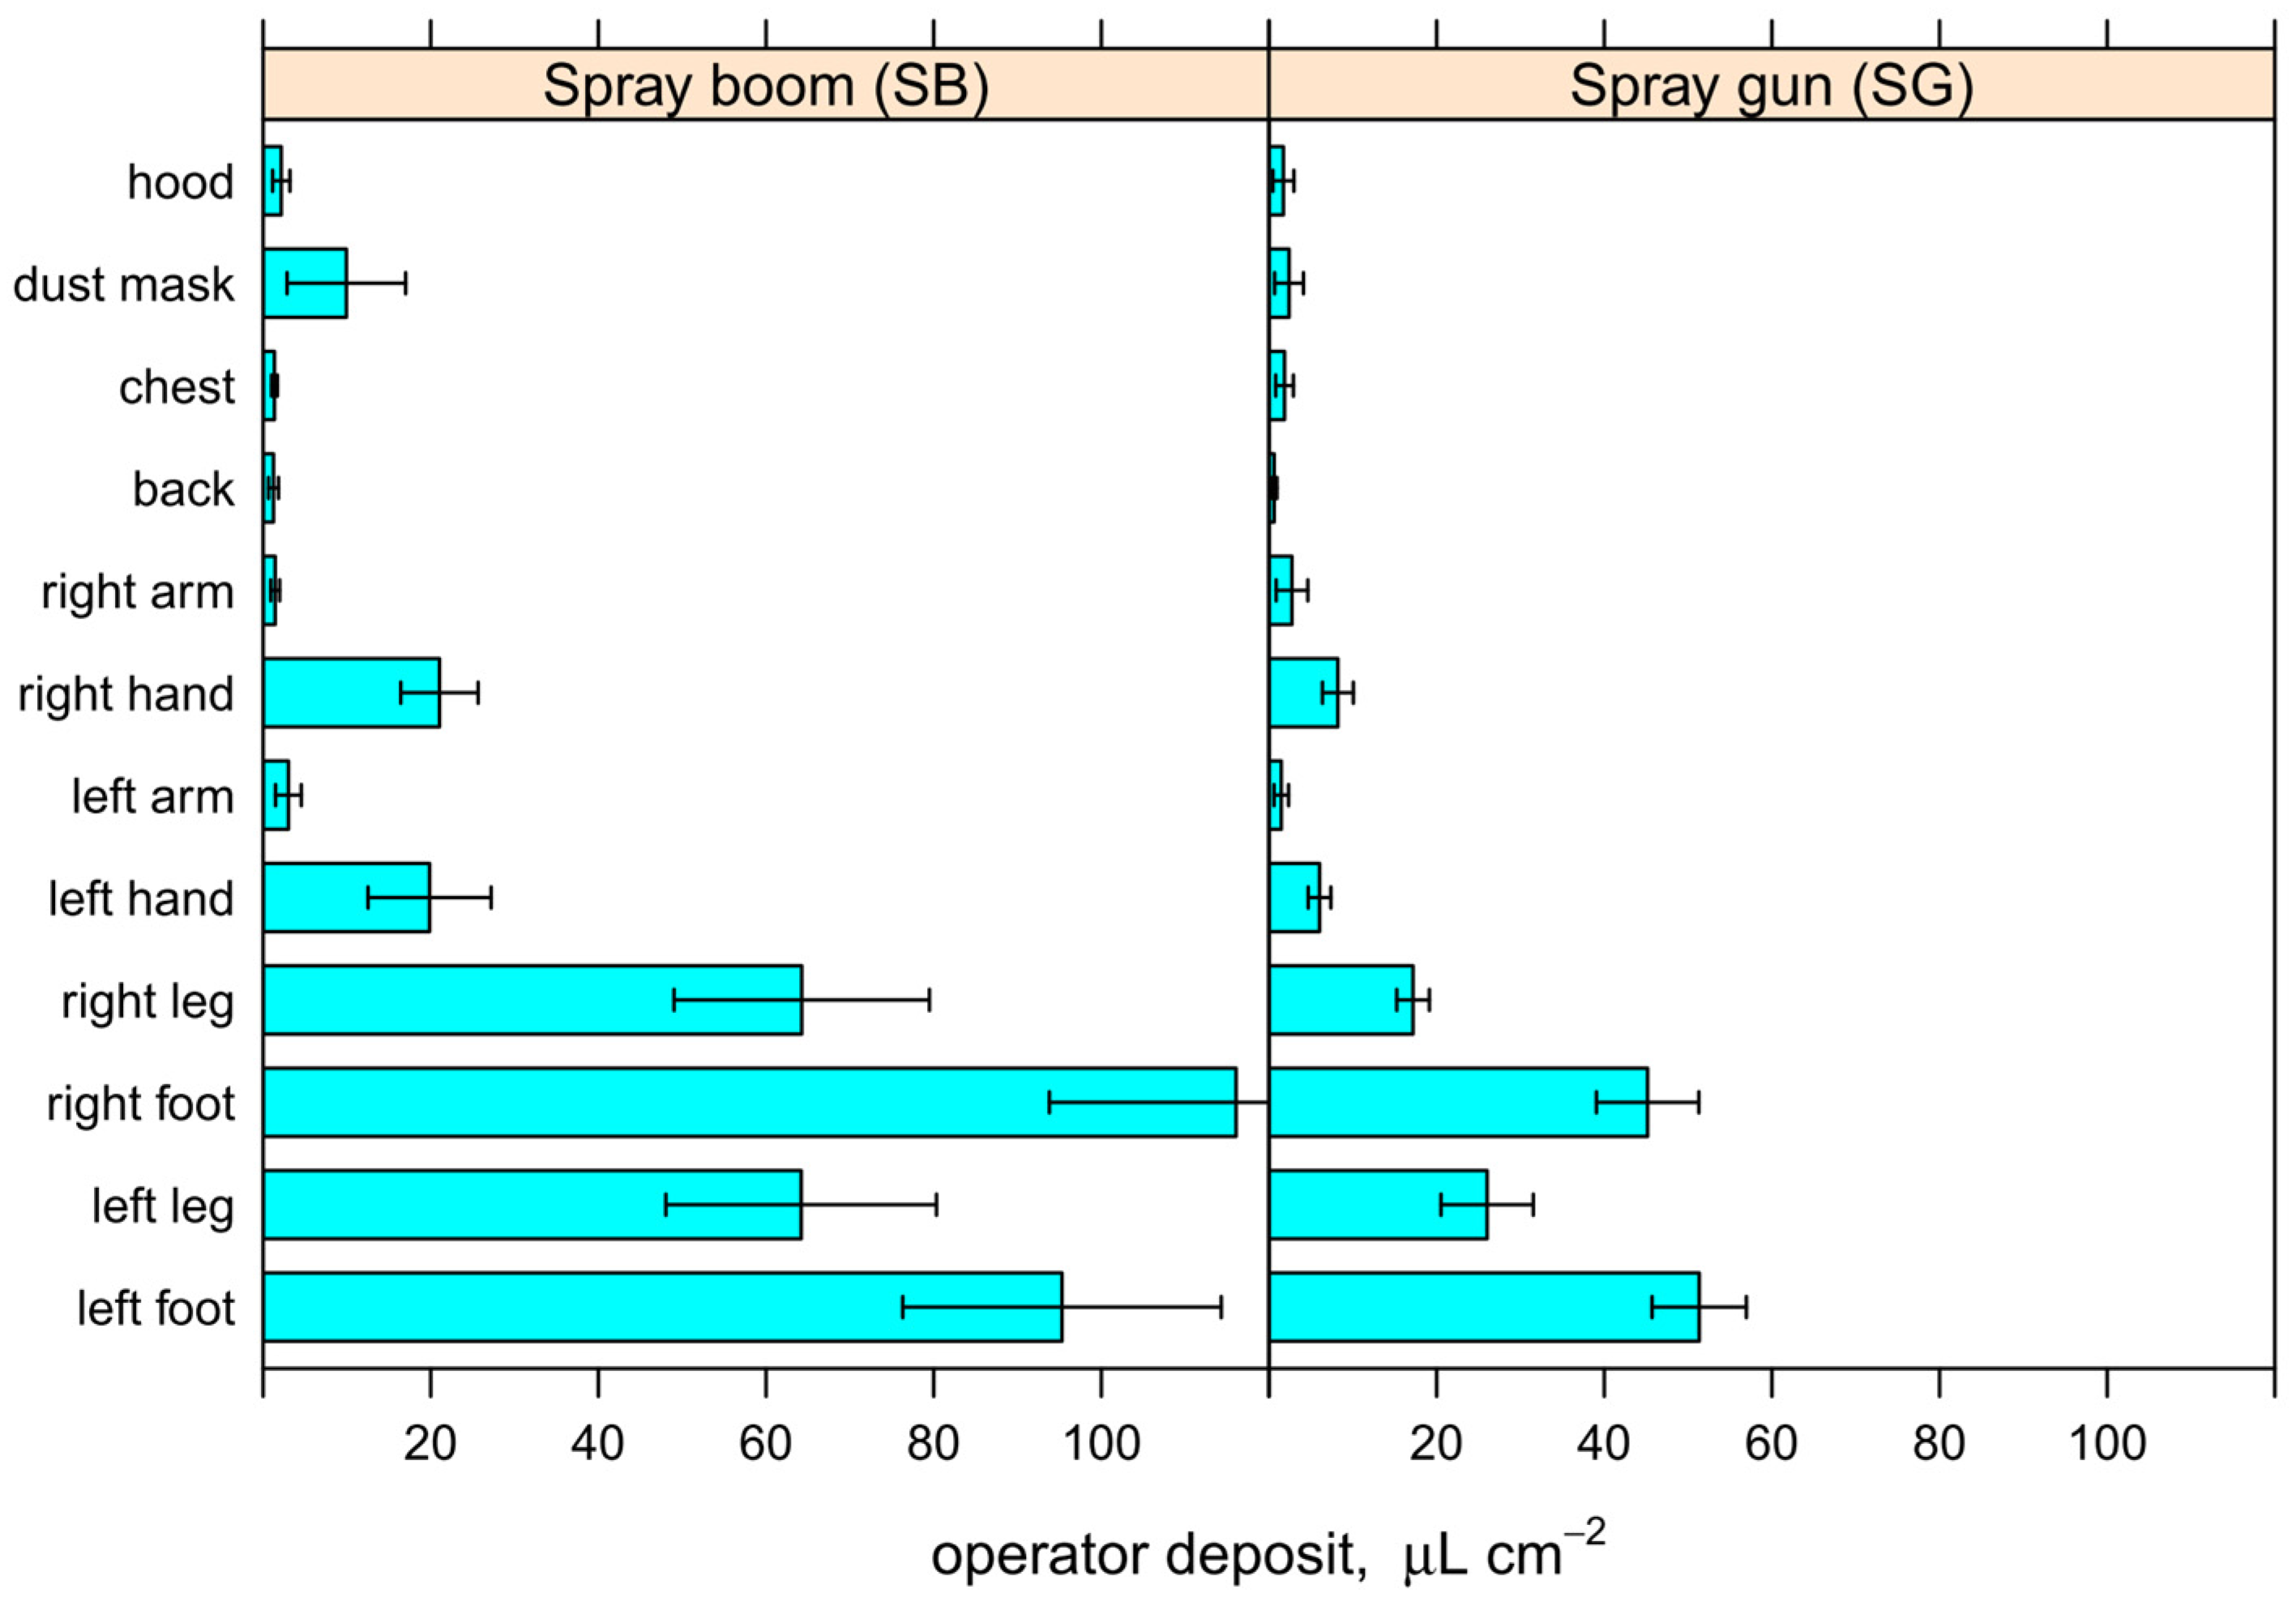
Finally, the deposit per unit of surface is reported in Figure 12. After having sprayed 1000 L of the mixture, the average values ranged from 1.24 ± 0.60 (back) to 116.10 ± 22.27 µL cm−2 (right foot) when the operator used the spray boom and from 0.62 ± 0.34 (back) to 51.33 ± 5.62 µL cm−2 (left foot) when he used the spray gun. The greatest deposits were measured on the feet with both spraying devices: on average 105.69 ± 14.11 µL cm−2 with the spray boom and 48.25 ± 4.02 µL cm−2 with the spray gun.
3.5. Comparison between Tests on Tomato and Strawberry Plants
A comparison between the deposits per unit of time (mL h−1) during the tests on the tomato and strawberry plants is reported in Table 9. From it emerges the conclusion that the body parts with the greatest deposit are related to the height of the plants. In fact, for strawberry and tomato plants at the flowering growth stage, the body parts with the highest deposits were always the lower limbs, regardless of the operator movement or the spraying device. Instead, in tomato plants at the senescence growth stage, the body parts with the highest deposits moved from the lower (trial 2) to the upper limbs (trial 3) when the height of the plants increased from 198 (trial 2) to 245 cm (trial 3) (Table 4), regardless of the operator movement, spray lance type, or working pressure.
4. Conclusions
Southern Italy is leading the national production of horticultural protected crops, even if it requires massive applications of PPPs, mainly carried out through hand-held, high-pressure devices. The present experimentation, aimed at evaluating the operator’s potential dermal exposure under standard field conditions, taking into account different hand-held, high-pressure spraying devices, crop growth stages, and operator movement, was carried out on greenhouse tomato plants located in the Sicily Region and on tunnel strawberry plants in located in the Basilicata Region. For the test conditions and the parameters analyzed in this study, the results allow the drawing of some conclusions useful for growers, operators, and personal protective equipment manufacturers.
- The body rubbing against the vegetation produces a remarkable amount of the total potential dermal exposure, especially with respect to tomato plants, whereas strawberry plants affect deposits on the feet and lower limbs only, especially due to the spray jet direction.
- For tomato plants, the operator walking direction had a significant effect on the total PDE in both the growth stages analyzed (flowering and senescence): on average, PDE was 0.72‰ of the sprayed mixture (210.4 mL h−1) walking forwards and 0.13‰ (40.1 mL h−1) walking backwards. At the end of the working day (8 h), the operator’s body collected on average more than 1680 mL of the mixture walking forwards and about 320 mL walking backwards. This implies that the best way to reduce the deposit of pesticide on the operator when using hand-held spray lances is to perform spray applications by walking backwards rather than forwards (ratio 5.2).
- When walking backwards, for fully developed tomato plants neither the spray lance type nor the working pressure affected PDE significantly. The highest deposit per unit of surface was always measured on the upper limbs, due to the body rubbing against the vegetation (left arm) and to the holding of the spray lance (right hand).
- The body parts exposed changed according to the plants height: for strawberry and tomato plants at the flowering growth stage, the highest deposit was measured on the lower limbs, whereas in the fully developed tomato plants, the highest deposit was measured on the upper limbs.
- For strawberry plants, the difference in the deposits between the two spraying devices under test was statistically significant. PDE was significantly higher when the operator used the short spray boom rather than the spray gun (0.89‰ vs. 0.34‰). Clearly, the operator oriented the spray jet towards his lower limbs when he worked with the spray boom more than when he worked with the spray gun, thus increasing the deposits on his body.
Even if the results refer to the tests carried out on tomato and strawberry plants only, they are representative of real operative conditions for many horticultural crops and clearly highlight once more the use of proper personal protection equipment (coverall, mask, gloves, and boots) as the aspect of major importance for the operators’ safety.
Author Contributions
E.C. and G.M. performed the experiments and managed the tests on the tomato plants; F.S. and S.P. performed the experiments and managed the tests on the strawberry plants.
Funding
This research was funded by MIUR-PRIN—2005 grant number 2005074058.
Acknowledgments
The authors wish to thank C. Gidiuli, V. Marzano, and D. Sfregola of DiSAAT, and G. Emma and F. Mingrino of Di3A for their helpfulness and commitment in conducting the experimental tests.
Conflicts of Interest
The authors declare no conflict of interest.
References
- Anifantis, A.S.; Colantoni, A.; Pascuzzi, S.; Santoro, F. Photovoltaic and hydrogen plant integrated with a gas heat pump for greenhouse heating: A mathematical study. Sustainability 2018, 10, 378. [Google Scholar] [CrossRef]
- Bianchi, B.; Tamborrino, A.; Santoro, F. Assessment of the energy and separation efficiency of the decanter centrifuge with regulation capability of oil water ring in the industrial process line using a continuous method. In Proceedings of the 10th Conference of the Italian Society of Agricultural Engineering Horizons in Agricultural, Forestry and Biosystems Engineering, Viterbo, Italy, 8–12 September 2013; pp. 278–282. [Google Scholar] [CrossRef]
- Pascuzzi, S.; Santoro, F. Analysis of possible noise reduction arrangements inside olive oil mills: A case study. Agriculture 2018, 7, 88. [Google Scholar] [CrossRef]
- Bakker, S.; Adams, S.; Boulard, T.; Montero, J.I. Innovative technologies for an efficient use of energy in greenhouse. Italus Hortus 2008, 15, 25–36. [Google Scholar]
- Pascuzzi, S.; Anifantis, A.S.; Blanco, I.; Scarascia Mugnozza, G. Electrolyzer performance analysis of an integrated hydrogen power system for greenhouse heating a case study. Sustainability 2016, 8, 629. [Google Scholar] [CrossRef]
- Van Lenteren, J.C. A greenhouse without pesticides: Fact or fantasy? Crop Prot. 2000, 19, 375–384. [Google Scholar] [CrossRef]
- Cooper, J.; Dobson, H. The benefits of pesticides to mankind and the environment. Crop Prot. 2007, 26, 1337–1348. [Google Scholar] [CrossRef]
- Papa, R.; Manetto, G.; Cerruto, E.; Failla, S. Mechanical distribution of beneficial arthropods in greenhouse and open field: A review. J. Agric. Eng. 2018, in press. [Google Scholar] [CrossRef]
- Pascuzzi, S.; Santoro, F. Exposure of farm workers to electromagnetic radiation from cellular network radio base stations situated on rural agricultural land. Int. J. Occup. Saf. Ergon. 2015, 21, 351–358. [Google Scholar] [CrossRef] [PubMed]
- Pascuzzi, S.; Santoro, F. Analysis of the almond harvesting and hulling mechanization process: A case study. Agriculture 2017, 7, 100. [Google Scholar] [CrossRef]
- Lichtenberg, E.; Zimmerman, R. Information and farmers’ attitudes about pesticides, water quality, and related environmental effects. Agric. Ecosyst. Environ. 1999, 73, 227–236. [Google Scholar] [CrossRef]
- Matthews, G.A. Attitudes and behaviours regarding use of crop protection products—A survey of more than 8500 smallholders in 26 countries. Crop Prot. 2008, 27, 834–846. [Google Scholar] [CrossRef]
- Snelder, D.J.; Masipiqueña, M.D.; de Snoo, G.R. Risk assessment of pesticide usage by smallholder farmers in the Cagayan Valley (Philippines). Crop Prot. 2008, 27, 747–762. [Google Scholar] [CrossRef]
- Remoundou, K.; Brennan, M.; Sacchettini, G.; Panzone, L.; Butler-Ellis, M.C.; Capri, E.; Charistou, A.; Chaideftou, E.; Gerritsen-Ebben, M.G.; Machera, K.; et al. Perceptions of pesticides exposure risks by operators, workers, residents and bystanders in Greece, Italy and the UK. Sci. Total Environ. 2015, 505, 1082–1092. [Google Scholar] [CrossRef] [PubMed]
- Sánchez-Hermosilla, J.; Páez, F.; Rincón, V.J.; Carvajal, F. Evaluation of the effect of spray pressure in hand-held sprayers in a greenhouse tomato crop. Crop Prot. 2013, 54, 121–125. [Google Scholar] [CrossRef]
- Sánchez-Hermosilla, J.; Rincón, V.J.; Páez, F.; Agüera, F.; Carvajal, F. Field evaluation of a self-propelled sprayer and effects of the application rate on spray deposition and losses to the ground in greenhouse tomato crops. Pest Manag. Sci. 2011, 67, 942–947. [Google Scholar] [CrossRef] [PubMed]
- Sánchez-Hermosilla, J.; Rincón, V.J.; Páez, F.; Fernández, M. Comparative spray deposits by manually pulled trolley sprayer and a spray gun in greenhouse tomato crops. Crop Prot. 2012, 31, 119–124. [Google Scholar] [CrossRef]
- Williamson, S.; Ball, A.; Pretty, J. Trends in pesticide use and drivers for safer pest management in four African countries. Crop Prot. 2008, 27, 1327–1334. [Google Scholar] [CrossRef]
- Matthews, G.; Wiles, T.; Baleguel, P. A survey of pesticide application in Cameroon. Crop Prot. 2003, 22, 707–714. [Google Scholar] [CrossRef]
- Ergonen, A.T.; Salacin, S.; Hakan Ozdemir, M. Pesticide use among greenhouse workers in Turkey. J. Clin. Forensic Med. 2005, 12, 205–208. [Google Scholar] [CrossRef] [PubMed]
- Fan, L.; Niu, H.; Yang, X.; Qin, W.; Bento, C.P.M.; Ritsema, C.J.; Geissen, V. Factors affecting farmers’ behaviour in pesticide use: Insights from a field study in northern China. Sci. Total Environ. 2015, 537, 360–368. [Google Scholar] [CrossRef] [PubMed]
- Cerruto, E.; Balsari, P.; Oggero, G.; Friso, D.; Guarella, A.; Raffaelli, M. Operator safety during pesticide application in greenhouses: A survey on Italian situation. ISHS Acta Horticult. 2008, 801, 1507–1514. [Google Scholar] [CrossRef]
- ISTAT (Italian Central Statistics Institute). Area (Hectares) and Production (Quintals). Available online: agri.istat.it (accessed on 29 January 2018).
- Wolf, T.M.; Gallander, K.S.; Downer, R.A.; Hall, F.R.; Fraley, R.W.; Pompeo, M.P. Contribution of aerosols generated during mixing and loading of pesticides to operator inhalation exposure. Toxicol. Lett. 1999, 105, 31–38. [Google Scholar] [CrossRef]
- MacFarlane, E.; Carey, R.; Keegel, T.; El-Zaemay, S.; Fritschi, L. Dermal exposure associated with occupational end use of pesticides and the role of protective measures. Saf. Health Work 2013, 4, 136–141. [Google Scholar] [CrossRef] [PubMed]
- Aprea, C.; Centi, L.; Lunghini, L.; Banchi, B.; Forti, M.A.; Sciarra, G. Evaluation of respiratory and cutaneous doses of chlorothalonil during re-entry in greenhouses. J. Chromatogr. 2002, 778, 131–145. [Google Scholar] [CrossRef]
- Ramos, L.M.; Querejeta, G.A.; Flores, A.P.; Hughes, E.A.; Zalts, A.; Montserrat, J.M. Potential Dermal Exposure in greenhouses for manual sprayers: Analysis of the mix/load, application and re-entry stages. Sci. Total Environ. 2010, 408, 4062–4068. [Google Scholar] [CrossRef] [PubMed]
- Lesmes-Fabian, C.; García-Santos, G.; Leuenberger, F.; Nuyttens, D.; Binder, C.R. Dermal exposure assessment of pesticide use: The case of sprayers in potato farms in the Colombian highlands. Sci. Total Environ. 2012, 430, 202–208. [Google Scholar] [CrossRef] [PubMed]
- Baldi, I.; Lebailly, P.; Bouvier, G.; Rondeau, V.; Kientz-Bouchart, V.; Canal-Raffin, M.; Garrigou, A. Levels and determinants of pesticide exposure in re-entry workers in vineyards: Results of the PESTEXPO study. Environ. Res. 2014, 132, 360–369. [Google Scholar] [CrossRef] [PubMed]
- De Vreede, J.A.F.; Brouwer, D.H.; Stevenson, H.; Van Hemmen, J.J. Exposure and risk estimation for pesticides in high volume spraying. Ann. Occup. Hyg. 1998, 42, 151–157. [Google Scholar] [CrossRef]
- Flores, A.P.; Berenstein, G.A.; Hughes, E.A.; Zalts, A.; Montserrat, J.M. Pesticide risk assessment in flower greenhouses in Argentina: The importance of manipulating concentrated products. J. Hazard. Mater. 2011, 189, 222–228. [Google Scholar] [CrossRef] [PubMed]
- Tuomainen, A.; Kangas, J.A.; Meuling, W.J.A.; Glass, R.C. Monitoring of pesticide applicators for potential dermal exposure to malathion and biomarkers in urine. Toxicol. Lett. 2002, 134, 125–132. [Google Scholar] [CrossRef]
- Garrido Frenich, A.; Aguilera, P.A.; Egea Gonzalez, F.; Castro Cano, M.L.; Martinez Galera, M.; Martinez Vidal, J.L.; Soler, M. Dermal exposure to pesticides in greenhouses workers: Discrimination and selection of variables for the design of monitoring programs. Environ. Monit. Assess. 2002, 80, 51–63. [Google Scholar] [CrossRef]
- Bjugstad, N.; Torgrimsen, T. Operator safety and plant deposits when using pesticides in greenhouses. J. Agric. Eng. Res. 1996, 65, 205–212. [Google Scholar] [CrossRef]
- Wicke, H.; Bäcker, G.; Frießleben, R. Comparison of spray operator exposure during orchard spraying with hand-held equipment fitted with standard and air injector nozzles. Crop Prot. 1999, 18, 509–516. [Google Scholar] [CrossRef]
- Berenstein, G.A.; Hughes, E.A.; March, H.; Rojic, G.; Zalts, A.; Montserrat, J.M. Pesticide potential dermal exposure during the manipulation of concentrated mixtures at small horticultural and floricultural production units in Argentina: The formulation effect. Sci. Total Environ. 2014, 472, 509–516. [Google Scholar] [CrossRef] [PubMed]
- Cao, L.; Chen, B.; Zheng, L.; Wang, D.; Liu, F.; Huang, Q. Assessment of potential dermal and inhalation exposure of workers to the insecticide imidacloprid using whole-body dosimetry in China. J. Environ. Sci. 2015, 27, 139–146. [Google Scholar] [CrossRef] [PubMed]
- Nuyttens, D.; Windey, S.; Sonck, B. Comparison of operator exposure for five different greenhouse spraying applications. In Proceedings of the XXXI CIOSTA-CIGR V Congress “Increasing Work Efficiency in Agriculture, Horticulture and Forestry”, Stuttgart, Germany, 19–21 September 2005; pp. 98–105. [Google Scholar]
- Balloni, S.; Caruso, L.; Cerruto, E.; Emma, G.; Schillaci, G. A prototype of self-propelled sprayer to reduce operator exposure in greenhouse treatment. In Proceedings of the International Conference “Innovation Technology to Empower Safety, Health and Welfare in Agriculture and Agro-food Systems”, Ragusa, Italy, 15–17 September 2008. [Google Scholar]
- Cerruto, E.; Emma, G.; Manetto, G. Spray application to tomato plants in greenhouses. Part 1: Effect of walking direction. J. Agric. Eng. 2009, 3, 41–48. [Google Scholar] [CrossRef]
- Cerruto, E.; Emma, G.; Manetto, G. Spray application to tomato plants in greenhouses. Part 2: Effect of spray lance type. J. Agric. Eng. 2009, 3, 49–56. [Google Scholar] [CrossRef]
- Baldoin, C.; Balsari, P.; Cerruto, E.; Pascuzzi, S.; Raffaelli, M. Improvement in pesticide application on greenhouse crops: Results of a survey about greenhouse structures in Italy. ISHS Acta Horticult. 2008, 801, 609–614. [Google Scholar] [CrossRef]
- ISO (International Organization of Standardization). ISO 5682-2:1997—Equipment for Crop Protection—Spraying Equipment—Part 2: Test Methods for Hydraulic Sprayers; International Organization for Standardization Publications: Geneva, Switzerland, 1997; Available online: http://www.iso.org/iso/home/store/catalogue_tc/catalogue_detail.htm?csnumber=25409 (accessed on 18 June 2018).
- Abramoff, M.D.; Magelhaes, P.J.; Ram, S.J. Image processing with Image. J. Biophotonics Int. 2004, 11, 36–42. [Google Scholar]
- Pergher, G. Recovery rate of tracer dyes used for deposit assessment. Trans. ASAE 2001, 44, 787–794. [Google Scholar] [CrossRef]
- Pascuzzi, S.; Cerruto, E. Spray deposition in “tendone” vineyards when using a pneumatic electrostatic sprayer. Crop Prot. 2015, 68, 1–11. [Google Scholar] [CrossRef]
- Pascuzzi, S.; Cerruto, E.; Manetto, G. Foliar spray deposition in a “tendone” vineyard as affected by airflow rate, volume rate and vegetative development. Crop Prot. 2016, 91, 34–38. [Google Scholar] [CrossRef]
- R Core Team. A Language and Environment for Statistical Computing; R Foundation for Statistical Computing: Vienna, Austria, 2012; ISBN 3-900051-07-0. Available online: http://www.R-project.org/ (accessed on 18 June 2018).
- Hughes, E.A.; Flores, A.P.; Ramos, L.M.; Zalts, A.; Glass, C.R.; Montserrat, J.M. Potential dermal exposure to deltamethrin and risk assessment for manual sprayers: Influence of crop type. Sci. Total Environ. 2008, 391, 34–40. [Google Scholar] [CrossRef] [PubMed]
- Nuyttens, D.; Braekman, P.; Windey, S.; Sonck, B. Potential dermal pesticide exposure affected by greenhouse spray application technique. Pest Manag. Sci. 2009, 65, 781–790. [Google Scholar] [CrossRef] [PubMed]
- Rincón, V.J.; Páez, F.C.; Sánchez-Hermosilla, J. Potential dermal exposure to operators applying pesticide on greenhouse crops using low-cost equipment. Sci. Total Environ. 2018, 630, 1181–1187. [Google Scholar] [CrossRef] [PubMed]
- Methner, M.M.; Fenske, R.A. Pesticide exposure during greenhouse applications. III. Variable exposure due to ventilation conditions and spray pressure. Appl. Occup. Environ. Hyg. 1996, 11, 174–180. [Google Scholar] [CrossRef]
- Berger-Preiß, E.; Boehnckey, A.; Könnecker, G.; Mangelsdorf, I.; Holthenrich, D.; Koch, W. Inhalational and dermal exposures during spray application of biocides. Int. J. Hyg. Environ. Health 2005, 208, 357–372. [Google Scholar] [CrossRef] [PubMed]
Figure 1.
Spraying devices used in the experimental tests. (a) Spray lance SL1; (b) Spray lance SL2; (c) Short hand-held spray boom (SB); (d) Spray gun (SG).
Figure 1.
Spraying devices used in the experimental tests. (a) Spray lance SL1; (b) Spray lance SL2; (c) Short hand-held spray boom (SB); (d) Spray gun (SG).

Figure 2.
Path of the operator in the aisles during spraying tests: forwards (left) and backwards movement (right) for a right-handed person.
Figure 2.
Path of the operator in the aisles during spraying tests: forwards (left) and backwards movement (right) for a right-handed person.

Figure 3.
Coverall elements to measure the dermal operator exposure. (1) hood, (2) right arm, (3) left arm, (4) chest, (5) back, (6) right leg, (7) left leg, (8) dust mask, (9) right hand, (10) left hand, (11) right foot, (12) left foot.
Figure 3.
Coverall elements to measure the dermal operator exposure. (1) hood, (2) right arm, (3) left arm, (4) chest, (5) back, (6) right leg, (7) left leg, (8) dust mask, (9) right hand, (10) left hand, (11) right foot, (12) left foot.

Figure 4.
Whole-body operator deposit during tests in tomato plants (mL per 1000 L of the sprayed mixture, trials 1 and 2) as affected by the plant growth stage and the operator walking direction (error bars represent the standard error of the mean; mean separation by the Tukey HSD test at p = 0.05; comparison between walking directions at each growth stage).

Figure 5.
Whole-body operator deposit during tests on the tomato plants (mL h−1, trials 1 and 2) as affected by the plant growth stage and the operator walking direction (error bars represent the standard error of the mean; mean separation by the Tukey HSD test at p = 0.05; comparison between walking directions at each growth stage).

Figure 6.
Potential dermal exposure of the body parts during the tests on the tomato plants (mL per 1000 L of the sprayed mixture, trials 1 and 2) as affected by the plant growth stage and the operator walking direction (error bars represent the standard error of the mean).
Figure 6.
Potential dermal exposure of the body parts during the tests on the tomato plants (mL per 1000 L of the sprayed mixture, trials 1 and 2) as affected by the plant growth stage and the operator walking direction (error bars represent the standard error of the mean).

Figure 7.
Deposits per unity of surface of the body parts during the tests on the tomato plants (µL cm−2 after having sprayed 1000 L of the mixture, trials 1 and 2) as affected by the plant growth stage and the operator walking direction (error bars represent the standard error of the mean).
Figure 7.
Deposits per unity of surface of the body parts during the tests on the tomato plants (µL cm−2 after having sprayed 1000 L of the mixture, trials 1 and 2) as affected by the plant growth stage and the operator walking direction (error bars represent the standard error of the mean).

Figure 8.
Potential dermal exposure of the body parts during the tests on the tomato plants (trial 3) as affected by the spray lance type and the working pressure (data in mL per 1000 L of the sprayed mixture; error bars represent the standard error of the mean).
Figure 8.
Potential dermal exposure of the body parts during the tests on the tomato plants (trial 3) as affected by the spray lance type and the working pressure (data in mL per 1000 L of the sprayed mixture; error bars represent the standard error of the mean).

Figure 9.
Potential dermal exposure of the body parts during the tests on the tomato plants (trial 3) as affected by the spray lance type and the working pressure (data in mL h−1; error bars represent the standard error of the mean).
Figure 9.
Potential dermal exposure of the body parts during the tests on the tomato plants (trial 3) as affected by the spray lance type and the working pressure (data in mL h−1; error bars represent the standard error of the mean).

Figure 10.
Average potential dermal exposure per unit of surface of the body parts during the tests on the tomato plants (trial 3) (error bars represent the standard error of the mean).
Figure 10.
Average potential dermal exposure per unit of surface of the body parts during the tests on the tomato plants (trial 3) (error bars represent the standard error of the mean).

Figure 11.
Potential dermal exposure of the body parts during the tests on the strawberry plants as affected by the spray lance type (trial 4) (mL per 1000 L of the sprayed mixture and mL h−1; error bars represent the standard error of the mean).
Figure 11.
Potential dermal exposure of the body parts during the tests on the strawberry plants as affected by the spray lance type (trial 4) (mL per 1000 L of the sprayed mixture and mL h−1; error bars represent the standard error of the mean).

Figure 12.
Deposit per unit of surface of the body parts during the tests on the strawberry plants as affected by the spray lance type (trial 4; error bars represent the standard error of the mean).
Figure 12.
Deposit per unit of surface of the body parts during the tests on the strawberry plants as affected by the spray lance type (trial 4; error bars represent the standard error of the mean).


Table 1.
Layout of the tomato and strawberry plants.
| Tomato | |||||
|---|---|---|---|---|---|
| Trials | Growth Stage (BBCH Code) | Inter-Twin-Row Distance, m | Inter-Row Distance, m | Row Spacing, m | Plant Density, Plants ha−1 |
| 1 | flowering (63) | 1.45 | 0.50 | 0.35 | 29,304 |
| 2 | senescence (99) | 1.25 | 0.55 | 0.35 | 31,746 |
| 3 | senescence (99) | 1.40 | 0.60 | 0.35 | 28,571 |
| Strawberry | |||||
| 4 | maturity (87) | 0.40 | 0.30 | 0.35 | 45,714 |
Table 2.
Summary of the experimental tests.
| Tomato | |||||||
|---|---|---|---|---|---|---|---|
| Trials | Growth Stage (BBCH Code) | Sprayer | Pressure, MPa | Flow Rate, L min−1 | Operator Movement | Walking Speed, m s−1 | Volume Rate, L ha−1 |
| 1 | flowering (63) | SL1 | 2 | 5.41 | forwards | 1.08 | 865 |
| flowering (63) | SL1 | 2 | 5.41 | backwards | 0.78 | 1185 | |
| 2 | senescence (99) | SL1 | 2 | 4.72 | forwards | 0.62 | 1423 |
| senescence (99) | SL1 | 2 | 4.72 | backwards | 0.53 | 1649 | |
| 3 | senescence (99) | SL1 | 1 | 3.49 | backwards | 0.85 | 698 |
| senescence (99) | SL1 | 2 | 5.05 | backwards | 0.84 | 1010 | |
| senescence (99) | SL2 | 1 | 4.00 | backwards | 0.82 | 801 | |
| senescence (99) | SL2 | 2 | 5.63 | backwards | 0.86 | 1127 | |
| Strawberry | |||||||
| 4 | maturity (87) | SB | 2 | 13.13 | forwards | 0.61 | 2857 |
| maturity (87) | SG | 2 | 5.22 | forwards | 0.43 | 1633 | |
Table 3.
Surface of each coverall element as depicted in Figure 3.
Table 3.
Surface of each coverall element as depicted in Figure 3.
| No. | Element | Surface, cm2 | No. | Element | Surface, cm2 |
|---|---|---|---|---|---|
| 1 | hood | 1793 | 9 | right hand | 511 |
| 8 | dust mask | 156 | 10 | left hand | 511 |
| 1 + 8 | head | 1949 | 2 + 3 + 9 + 10 | upper limbs | 6424 |
| 4 | chest | 6593 | 6 | right leg | 4789 |
| 5 | back | 6593 | 7 | left leg | 4789 |
| 4 + 5 | trunk | 13,186 | 11 | right foot | 1023 |
| 1 + 8 + 4 + 5 | head and trunk | 15,135 | 12 | left foot | 1023 |
| 2 | right arm | 2701 | 6 + 7 + 11 + 12 | lower limbs | 11,624 |
| 3 | left arm | 2701 | total | 33,183 |
Table 4.
Main geometric sizes of the tomato plants (sizes in cm, measured on 12 plants per each trial).
Table 4.
Main geometric sizes of the tomato plants (sizes in cm, measured on 12 plants per each trial).
| Feature | Trial 1 | Trial 2 | Trial 3 | ||||||
|---|---|---|---|---|---|---|---|---|---|
| Mean | Std Dev | CV a, % | Mean | Std Dev | CV, % | Mean | Std Dev | CV, % | |
| Min. height | 19 | 5 | 26 | 48 | 13 | 27 | 83 | 21 | 26 |
| Max. height | 123 | 10 | 8 | 198 | 5 | 3 | 245 | 19 | 8 |
| W(H1) b | W(40) = 70 | 15 | 21 | W(60) = 46 | 12 | 27 | W(80) = 49 | 12 | 24 |
| W(H2) b | W(80) = 61 | 12 | 20 | W(100) = 48 | 7 | 15 | W(125) = 50 | 19 | 38 |
| W(H3) b | W(120) = 28 | 11 | 37 | W(140) = 45 | 9 | 19 | W(170) = 61 | 18 | 29 |
| W(H4) b | W(180) = 36 | 12 | 34 | W(205) = 58 | 18 | 32 | |||
a: CV = coefficient of variation; b: W(H) = width (W) of the vegetation at height (H).
Table 5.
Results of the analysis of the variance applied to the whole-body deposits (mL per 1000 L of the sprayed mixture, trials 1 and 2).
Table 5.
Results of the analysis of the variance applied to the whole-body deposits (mL per 1000 L of the sprayed mixture, trials 1 and 2).
| Source of Variation | DoF a | F-Value | p-Level b |
|---|---|---|---|
| growth stage | 1 | 9.895 | 0.0137 * |
| walking direction | 1 | 41.440 | 0.0002 *** |
| growth stage × walking direction | 1 | 3.374 | 0.1035 ns |
| error | 8 |
a: DoF: degree of freedom; b: ns: not significant; *: significant for p = 0.05; ***: significant for p = 0.001.
Table 6.
Results of the analysis of the variance applied to the whole-body deposits (trial 3).
| Source of Variation | DoF a | mL | mL h−1 | ||||
|---|---|---|---|---|---|---|---|
| F-Value | p-Level b | F-Value | p-Level b | ||||
| pressure | 1 | 3.547 | 0.0964 ns | 0.850 | 0.3836 ns | ||
| spray lance | 1 | 2.550 | 0.1490 ns | 3.726 | 0.0897 ns | ||
| pressure × spray lance | 1 | 1.633 | 0.2371 ns | 1.535 | 0.2505 ns | ||
| error | 8 | ||||||
a: DoF: degree of freedom. b: ns: not significant.
Table 7.
Whole-body deposits as affected by the spray lance type and the working pressure (mean value ± standard error of the mean, trial 3).
Table 7.
Whole-body deposits as affected by the spray lance type and the working pressure (mean value ± standard error of the mean, trial 3).
| Spray Lance | mL per 1000 L of the Sprayed Mixture | mL h−1 | ||||
|---|---|---|---|---|---|---|
| Pressure, MPa | Mean | Pressure, MPa | Mean | |||
| 1 | 2 | 1 | 2 | |||
| SL1 | 153.2 ± 53.9 | 46.1 ± 13.3 | 99.6 ± 34.5 | 32.1 ± 11.3 | 14.0 ± 4.0 | 23.0 ± 6.7 |
| SL2 | 171.1 ± 47.5 | 158.7 ± 80.8 | 164.9 ± 42.0 | 41.1 ± 11.4 | 53.6 ± 27.3 | 47.4 ± 13.5 |
| mean | 162.2 ± 32.4 | 102.4 ± 44.4 | 132.3 ± 27.7 | 36.6 ± 7.5 | 33.8 ± 15.2 | 35.2 ± 8.1 |
Table 8.
Results of the analysis of the variance applied to the whole-body deposits (trial 4).
| Source of Variation | DoF a | mL | mL h−1 | ||
|---|---|---|---|---|---|
| F-Value | p-Level b | F-Value | p-Level b | ||
| spray lance (SL) | 1 | 9.828 | 0.0202 * | 40.580 | 0.0007 *** |
| error | 6 | ||||
a: DoF: degree of freedom. b: *: significant for p = 0.05; ***: significant for p = 0.001.
Table 9.
Deposit per unit of time (mL h−1) during the tests on the tomato and strawberry plants.
| Trials | Spray Lance | Pressure, MPa | Growth Stage | Operator Movement | Trunk and Head | Upper Limbs | Lower Limbs |
|---|---|---|---|---|---|---|---|
| 1 | SL1 | 2 | flowering | backwards | 3.76 | 3.79 | 29.39 |
| SL1 | 2 | flowering | forwards | 10.68 | 6.62 | 92.30 | |
| 2 | SL1 | 2 | senescence | backwards | 7.73 | 5.93 | 29.67 |
| SL1 | 2 | senescence | forwards | 59.43 | 90.28 | 161.48 | |
| 3 | SL1 | 1 | senescence | backwards | 7.91 | 14.78 | 9.37 |
| SL2 | 1 | senescence | backwards | 7.28 | 26.37 | 7.45 | |
| SL1 | 2 | senescence | backwards | 4.11 | 5.26 | 4.61 | |
| SL2 | 2 | senescence | backwards | 15.20 | 25.57 | 12.86 | |
| 4 | SB | 2 | maturity | forwards | 17.76 | 25.97 | 654.73 |
| SG | 2 | maturity | forwards | 6.18 | 5.84 | 96.68 |
© 2018 by the authors. Licensee MDPI, Basel, Switzerland. This article is an open access article distributed under the terms and conditions of the Creative Commons Attribution (CC BY) license (http://creativecommons.org/licenses/by/4.0/).
Share and Cite
MDPI and ACS Style
Cerruto, E.; Manetto, G.; Santoro, F.; Pascuzzi, S. Operator Dermal Exposure to Pesticides in Tomato and Strawberry Greenhouses from Hand-Held Sprayers. Sustainability 2018, 10, 2273. https://0-doi-org.brum.beds.ac.uk/10.3390/su10072273
AMA Style
Cerruto E, Manetto G, Santoro F, Pascuzzi S. Operator Dermal Exposure to Pesticides in Tomato and Strawberry Greenhouses from Hand-Held Sprayers. Sustainability. 2018; 10(7):2273. https://0-doi-org.brum.beds.ac.uk/10.3390/su10072273
Chicago/Turabian StyleCerruto, Emanuele, Giuseppe Manetto, Francesco Santoro, and Simone Pascuzzi. 2018. "Operator Dermal Exposure to Pesticides in Tomato and Strawberry Greenhouses from Hand-Held Sprayers" Sustainability 10, no. 7: 2273. https://0-doi-org.brum.beds.ac.uk/10.3390/su10072273
Note that from the first issue of 2016, this journal uses article numbers instead of page numbers. See further details here.