China-Angola Investment Model

1
Faculty of Economic Cybernetics, Statistics and Informatics, The Bucharest University of Economic Studies, 010374 Bucharest, Romania
2
The National Scientific Research Institute for Labour and Social Protection, 010643 Bucharest, Romania
3
The Faculty for Business Administration in Foreign Languages, The Bucharest University of Economic Studies, 010374 Bucharest, Romania
*
Author to whom correspondence should be addressed.
Sustainability 2018, 10(8), 2936; https://0-doi-org.brum.beds.ac.uk/10.3390/su10082936
Submission received: 7 July 2018
/
Revised: 8 August 2018
/
Accepted: 14 August 2018
/
Published: 18 August 2018
(This article belongs to the Special Issue Innovation and Sustainability in a Turbulent Economic Environment–Selected Papers from the 12th International Conference on Business Excellence)
Abstract
:In the aftermath of Angola’s civil war, strong economic relations developed between the country and the People’s Republic of China. Our study addresses China’s investment risks in Angola, considering an infrastructure-for-petroleum partnership between these two countries. The main working hypothesis is that the recovery of Chinese investments made in Angola is has translated into thousands of barrels of petroleum being imported daily from Angola. We analyzed the main economic, social, and political indicators that describe the situation in Angola that could impact the recovery of Chinese loans in the form of oil exports. Data processing implied involved regression-based imputation, MinMax data normalization, the use of the Analytical Hierarchy Process (AHP), and econometric analysis, next to the construction of a composite risk indicator. The results of the econometric analysis highlighted that an increase in the composite risk indicator of 1% leads to a decrease in the quantity of petroleum exported by almost 6377 barrels per day. Because, at least in the short run, the economic diversification in Angola is weak, and the most important asset is its oil, the partnership with China will continue to exist. This cooperation model represents a source of economic growth and infrastructure development for Angola and a source of energy that fuels China—one of the most powerful economies in the world.
1. Introduction
Currently, Africa is perceived by the world’s powers as a huge distribution market with good development potential. Also, the rich resources of the African continent have increased the interest of the world’s major economies in this region.
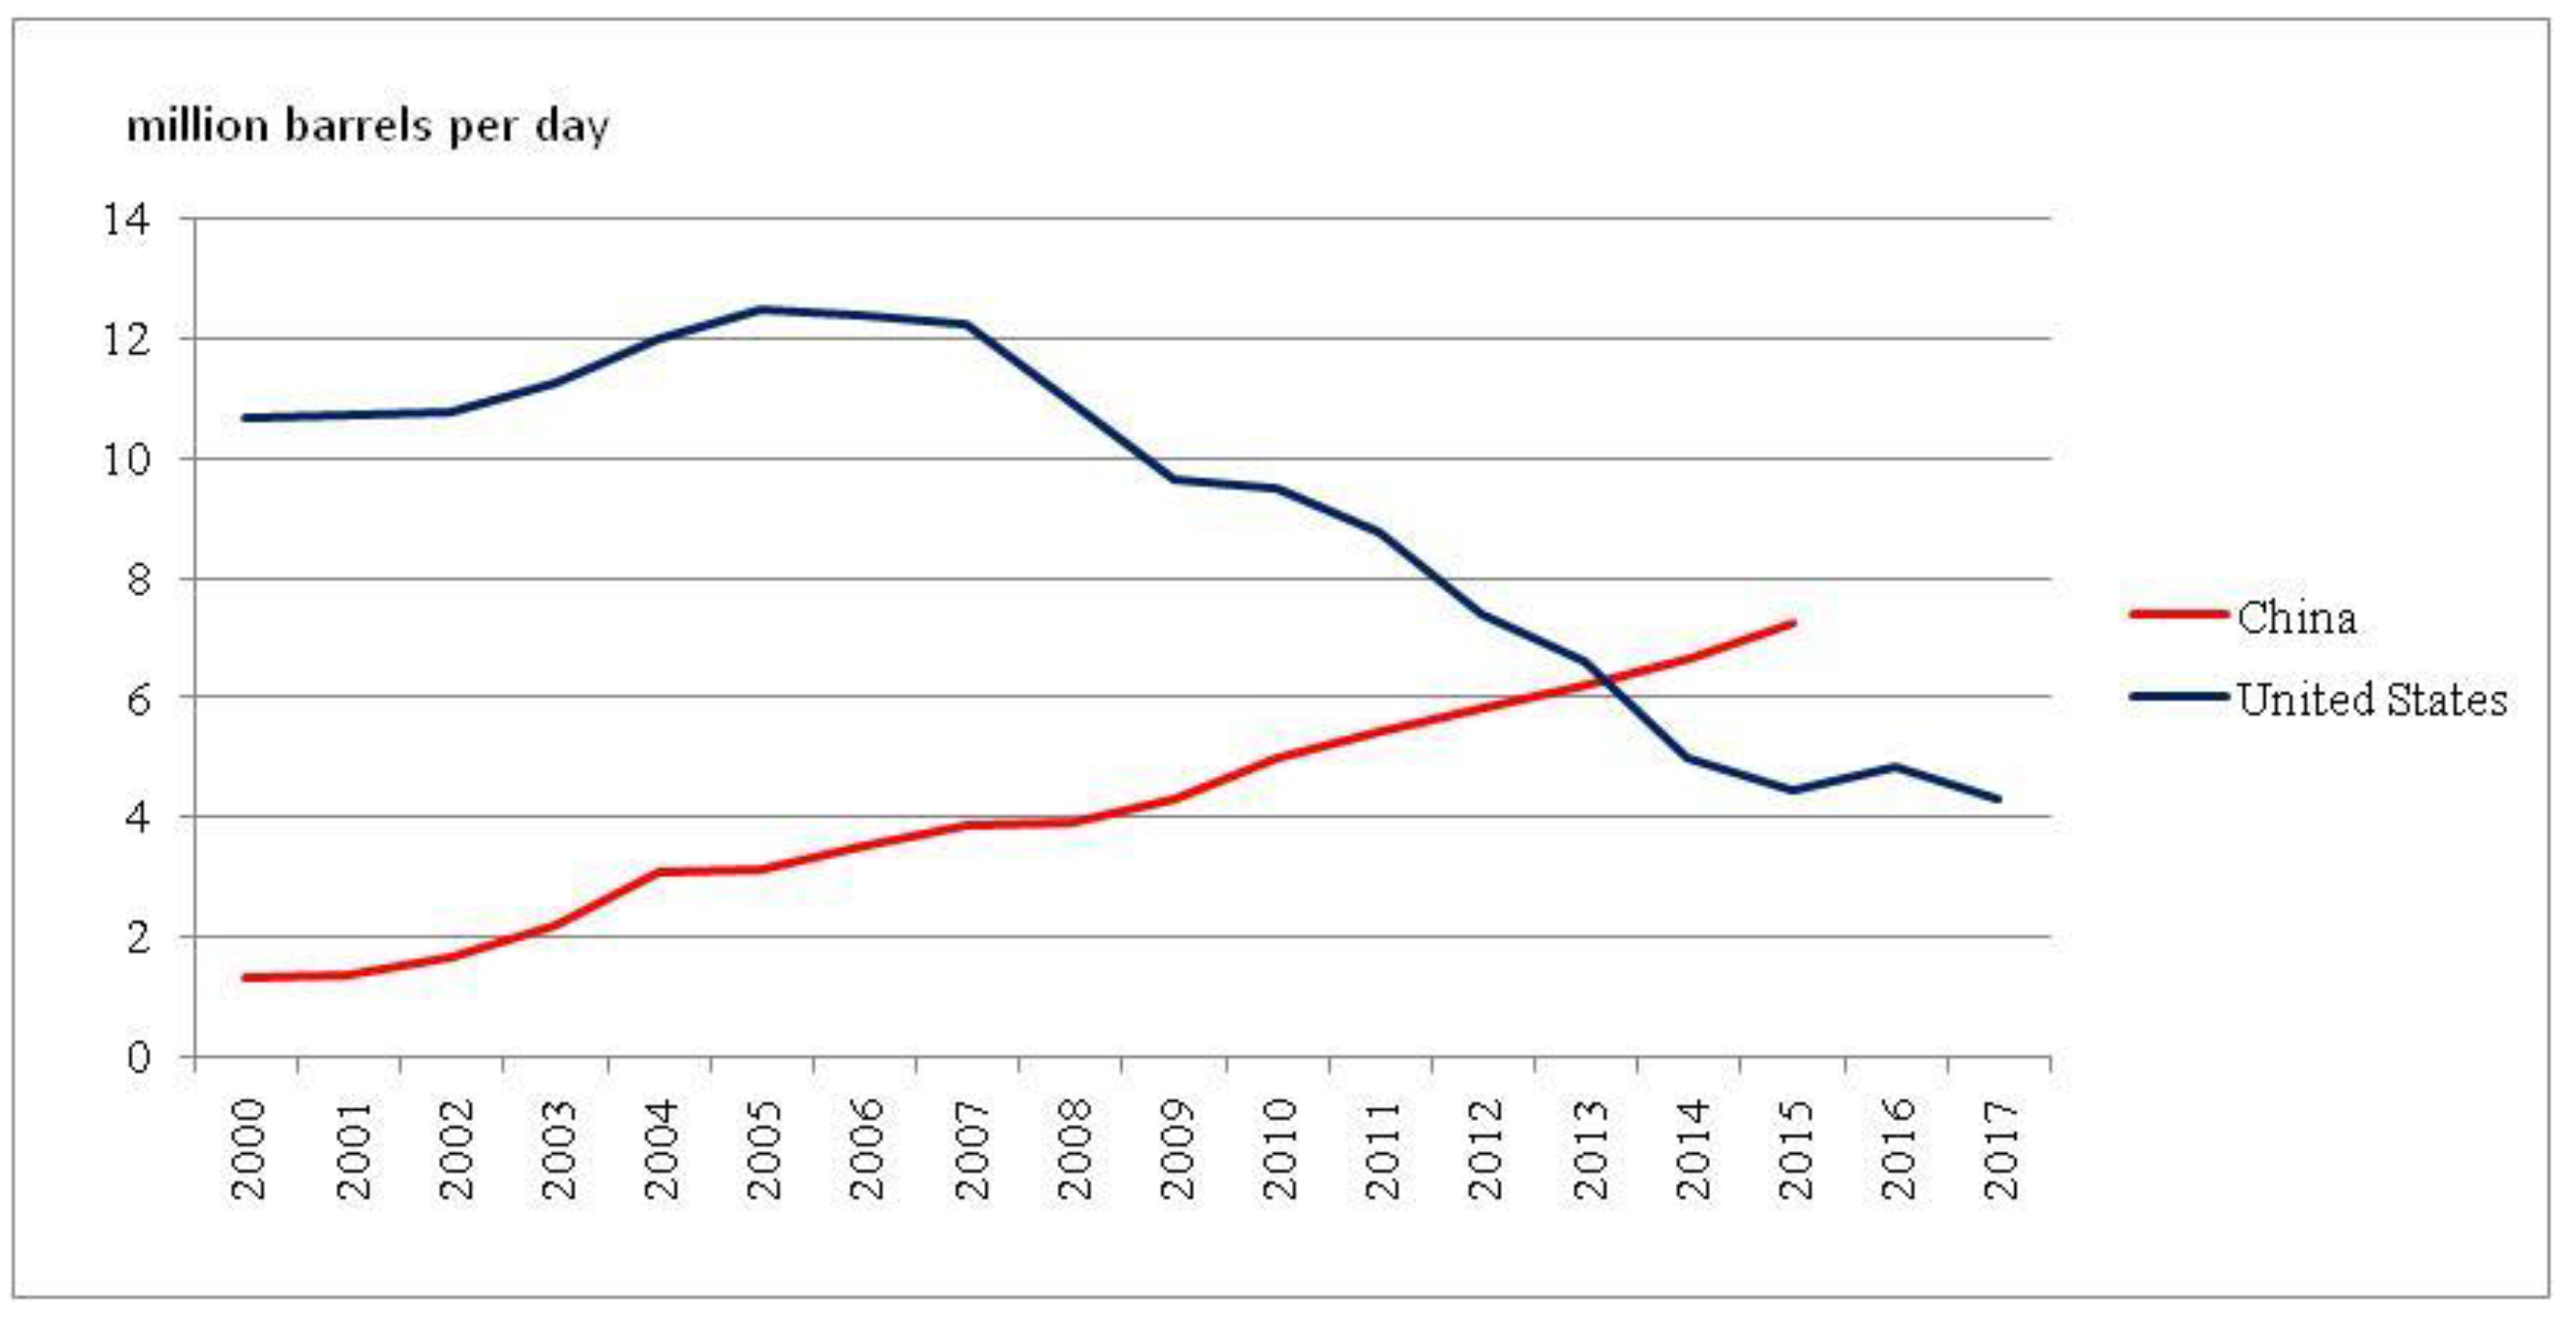
China has become the most important economic partner of the African states after the massive investment it has made in many countries on the continent. China’s main economic partners in Africa are Angola, South Africa, Nigeria, and Egypt [1]. Through bilateral and multilateral relations with these countries, China seeks to make vital raw materials available to sustain its own economy. At present, economic growth in China is facing development constraints to their energy supply [2]. Among the energy resources, the supply of petroleum is a major concern. China became the world’s largest importer of petroleum in September 2013, surpassing the United States, as depicted in Figure 1. China also surpassed the United States in annual gross crude oil imports in 2017, importing 8.4 million barrels per day (b/d) compared with 7.9 million b/d for the United States [2].
At present, China is the world’s largest importer of petroleum; therefore, the substantial petroleum demand has driven China to engage in trade relations with many countries and to import huge quantities from various sources. China has implemented an oil import diversification strategy that can meet the short-term demands of the domestic market, but this does not reduce the risk of oil importing, making it difficult for China to guarantee its long-term oil import demand [4].
Within this paper, we focus on the relations between China and Angola with the objective of analyzing the evolution of China’s investment risk in Angola. Angola is the first petroleum exporter to China after Saudi Arabia, with more than half of the petroleum exported by Angola in 2016 being imported by China, accounting for 12% of China’s total petroleum imports. In this way, in recent years, the Chinese investments made in the industry and infrastructure of Angola, destroyed in the aftermath of the 27-year civil war, are being recovered.
Investment risk analysis takes into account those factors that could have an impact on the recovery of the investment. These factors represent economic, social, and political indicators of Angola, the evolution of which correlates with the export of petroleum to China.
The strategic partnership between China and Angola relies heavily on oil cooperation. Both countries are interested in maintaining and developing this partnership by developing trade and investment relationships with multiple benefits in key areas such as industry, infrastructure development, urban construction, energy and mineral resources exploitation [5].
Although Angola is currently one of Africa’s richest countries, this does not apply to the population as well. Thus, despite its natural resources, Angola’s GDP per capita remains one of the lowest, and subsistence farming is one of the most important economic activities with approximately 85% of the population involved. Given that the economy of Angola is closely linked to petroleum exports and implicitly to its price, a decrease in petroleum prices could have a strong impact on government expenditure. In this context, the importance of the strategic relations with China becomes even more obvious, as China provides financial resources for the development of construction and infrastructure projects.
The Chinese-Angolan Partnership has been debated in many articles and publications, most of the time doubting its morality (for example, [6,7,8,9]). This strategic link has been seen by some analysts as a marriage of convenience [10]. China’s interest is centered on petroleum and other mineral resources, and Angola’s plan is to rebuild the country which was destroyed by civil war. The question that arises in this context is to what extent Chinese investments really aid in the development of Angola [11]. Some economists are optimistic and state that the development of a state is based on a profitable primary sector, and that exports are currently a way to pay for projects to improve infrastructure and investments in human capital to sustain this growth in the future. Habiyaremnye [12] argues that resources-for-infrastructure swap deals enabled African countries to increase their diversification capacity.
Christina Wolf also argues that many China-related effects work in favor of manufacturing development [13] and advocates for the positive role that China played in Angola’s domestic-market formation and general economic development. The process was, according to her, supported by the economic engagement with China, on one hand due to the Chinese contracted projects which increased demand for building materials. Her study addresses the increasing volumes of foreign and domestic investment in food and beverages production but also in the export-oriented sectors like light manufacturing, even if these remain in the shadow of the much larger mining sector [14].
Other experts, however, believe that this trade linkage, on the contrary, prevents the industrialization process, does not include other branches of the economy and does not create jobs for the Angolans. Tkachenko [15], for instance, stresses the huge increase in the workforce from China in Africa, especially in Algeria and Angola. He observes that they reached record-breaking numbers for the past 15 years and intensive growth is also expected for the future. Schmitz [16] also speaks about an estimate of 250,000 Chinese migrants in Angola.
Much of the money borrowed by China was intended for health, education, transport, social communication, and public works. For example, in 2004, nearly 32% of the Exim Bank’s loans in Angola supported education and health projects, and in 2007 more than half of the allocated funds went to such investments. Chinese enterprises renovated, expanded, and constructed hospitals, and financed the purchase of ambulances. Also, they renovated and built dozens of schools. China–Angola cooperation in social development extended even to higher education through scholarships offered by the Chinese government [17].
However, studies have shown that Chinese investment did not lead to significant social development, and among the main criticisms is the lack of adaptability to local needs [18]. An interesting example is the so-called “ghost towns” built by the Chinese from scratch. These are not just residential districts but whole cities where hospitals, schools and other such institutions have been built and where access to drinking water is ensured. An example of this is the city of Kilamba, located near Luanda, built in a record time of only 3 years. Although the initial prices were subsequently reduced following a decision by President Dos Santos, an extremely small percentage of the local population can afford to purchase an apartment in Kilamba for $70,000–$190,000, with most of the population living below the poverty line of $1.25 per day. Cain [19] names the private sector, both international and local, as the major beneficiary of these state construction subsidies. The private sector involved in such projects, however, has been reluctant to provide its own financing. It avoided investing in real estate due to weak land tenure and the lack of legislative reforms to create a functional real estate market.
These government measures have increased the dissatisfaction of the population that cannot benefit from the outcomes of the Chinese investments and who see the efforts made to pay for these investments through huge petroleum exports.
Zafar [7] argues that “China poses a challenge to good governance and macroeconomic management in Africa because of the potential Dutch disease implications of commodity booms”. Not only are other sectors late to develop, but a strong kwanza also makes them less competitive on the international markets.
The relationship between the level of taxation and people’s involvement in governmental decision-making processes (the level of democratic control and accountability) is not very strong in oil-dependent states like Angola. Governments often use petroleum revenues instead of tax revenues to ensure a minimal level of social welfare therefore reducing popular unrest in order to avoid citizens’ influence in policy making [20]. Critiques of China’s petroleum diplomacy also center on its alleged disregard for transparency and human rights. Bader and Daxecker [21] performed a study in 2015 which shows that petroleum producing states dependent on exports to the USA exhibit lower human rights performance than those exporting to China. They argue that, contrary to conventional wisdom, petroleum export dependence on the USA affects human rights more negatively than dependence on China. This difference is given by the timing of market entry, since human rights played a less important role in the past than they do today. Hackenesch [22] performed an empirical analysis regarding the accused undermining of the US and the EU’s possibilities to set material incentives for reforms in Angola due to Chinese support policies with “no political strings attached”, which notably suggests that the level of challenge to regime survival that the government of Angola faces, rather than the relation with China, influences the government’s willingness to engage with the EU and US.
From a legal perspective, Siu notes that financing agreements are neither backed by a treaty between states, nor by a commercial contract between a host state and a purely private investor. They rely on “a hybrid sovereign-commercial legal regime from the doctrines and mechanisms of public international law, international commercial law and public law”. The author concludes that while this kind of arrangement may deliver meaningful benefits to the African state involved, “the underdevelopment of legal approaches and of self-regulatory organizations will likely vitiate the long-term sustainability of such arrangements for either country” [23].
2. Materials and Methods
2.1. Data Used in the Analysis
Investment decisions are part of the category of complex economic actions and depend on regional considerations [24]. Any investment project also involves a quantitative analysis of the risk that the investor is exposed to and financial risks related issues [25]. Therefore, the assessment of China’s investment risk in Angola implies a quantitative analysis of the main economic, social and political indicators that describe the situation in Angola. Starting from the three dimensions—economic, social, and political—this study proposes the construction of a composite risk indicator that includes the most important indicators related to these three aspects. Thus, depending on the availability and relevance of data, the following indicators (Table 1) were selected for the period 2000–2012:
In order to determine the extent to which the investment risk affects the amount of petroleum exported to China, we use a single factor regression model, with the dependent variable being the indicator of the quantity of exported petroleum, measured in thousands of barrels per day.
2.2. Imputation of Missing Data: The Regression-Based Imputation Method
After selecting the variables, the next step was the imputation of the missing data, because there are intermediate years for which few data are missing. For example, for the Human Development Index in Angola there is no information available for the period 2001-2004, although the values for both 2000 and the period 2005–2012 are public. In this case, objective imputation was used to estimate missing data.
Objective imputation implies generating a regression equation based on the data set containing complete records of the variable to be subjected to the imputation process [30]. The equation may take the form
where
y= β0 + β1x1 + β2x2 + … + βkxk,
- y represents the variable to be imputed for the given values of variables xi, i = 1,2, ..., k, and
- xi represents the explanatory variables correlated with the explained variable y.
A similar situation was also encountered in the case of political indicators, the efficiency of government, the participation of the population in the political decisions, the political stability and the lack of violence/terrorism, where data are missing only for 2001. A linear dependence was considered either with the Gross Domestic Product, or with the inflation and the perceived corruption index.
2.3. Data Normalization: Min-Max Method
Normalization is the scaling of all data to a default range. This transformation must be done before the aggregation of the indicators, as association between variables measured on different scales is likely to affect the consistency and accuracy of the results. In practice, a number of normalization methods are used. One of the most used methods is the min-max method. This involves scaling the data within a preset interval, for example the range (0.1; or 0%,100%). The method usually applies when the minimum and maximum values of a variable are known because the first step is to assign the value 0 to the minimum or maximum value. The other intermediate values are converted by the formula
where
- v′ represents the normalized value of indicator A
- v represents the initial value of indicator A
- minA represents the minimum value of indicator A in the original dataset
- maxA represents the maximum value of indicator A in the original dataset
Similarly, all the indicators selected for analysis were normalized after their impact on investment had been studied. Since it is very difficult to assess Chinese investments in infrastructure projects, the export of petroleum (1000 barrels per day) to China was used, as this represents the main purpose of Chinese investments in Angola. In order to see the link between each economic, social, or political indicator and the investment, it was therefore necessary to study the correlation between them and the export of petroleum (1000 barrels per day) to China.
2.4. Weighing and Aggregation: The Analytical Hierarchy Process
The analytical hierarchy process (AHP) was the method used for weighting and ranking the analyzed criteria. This method conceived by Thomas L. Saaty [31] has proven to be one of the most applied methods of multicriterial analysis and is mentioned in most manuals and guides on decisional processes [32].
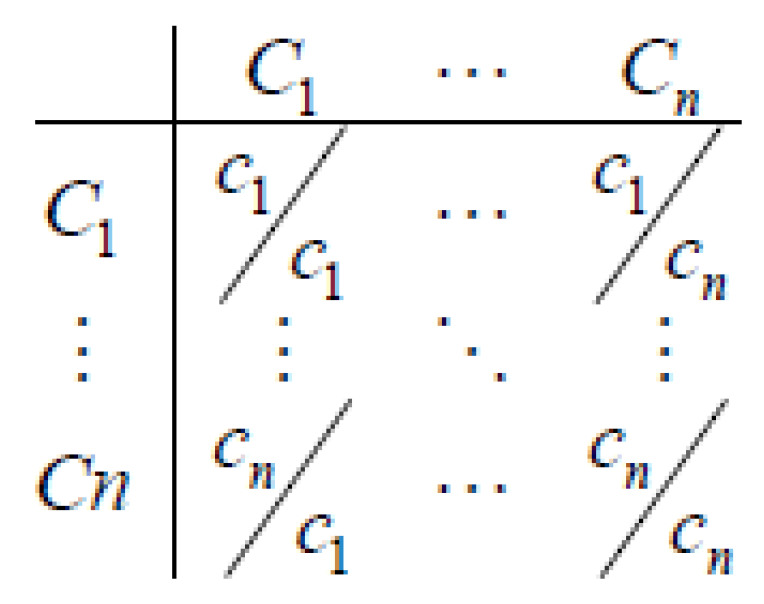
This method is essentially an interactive one, the input data being answers to questions such as “How important is the C1 criterion compared to Cn ?”. Thus, ‘pair comparisons’ are achieved, with scores or weights being obtained. The method comes largely from the theories of human behavior, including those related to thinking, logic, intuition, experience, and learning theories.
The first step of AHP is to build a comparison matrix for the criteria (Figure 2).
The purpose of this approach is to determine the contribution of these criteria to the overall objective. If the criteria are broken down into a number of sub-criteria, the pair comparisons can be repeated for each level of the hierarchy [33]. To make these comparisons, Saaty has also developed a scale of measurement of ‘importance intensity’ in which the criteria are evaluated against each other, as presented in Table 2.
Intermediate values can be used to define nuances between the five basic formulations. Of course, if Cn is considered to be of very strong importance as compared to C1, then the mutual is also valid, so C1 is associated with 1/7 relative to Cn. On the main diagonal, the completed values will be 1 because a criterion is equally important in relation to itself.
After completing the matrix, the next step was to calculate the geometric means. These are calculated for each line, summed up and rescaled so that the results were weights that together added up to 100%.
This Analytical Hierarchy process was applied to each set of indicators as used by other authors [34]. Thus, each economic, social, or political indicator was assigned a weight to reflect its importance within the group to which it belongs.
The basis for the “pair comparisons” and the determination of the level of importance were studies performed by experts from “The Economist” [35], BBC [36], CSIS (Center for Strategic and International Studies) [37], and other publications on geopolitical issues. Moreover, the hierarchy of indicators could also be made according to the intensity of the links between them and the export of petroleum to China, as this was the benchmark in the investment risk analysis.
After determining the weights for each of the 14 selected indicators, the next step is to aggregate them at a group level. Thus, out of the 14 indicators, there were 3 aggregated indicators corresponding to the economic, social and political dimensions respectively, as presented in Table 3, Table 4 and Table 5.
For the aggregated indicators, weights were also determined applying the analytical hierarchy process in order to obtain a single indicator that encompasses all of the information of an economic, social, and political nature, as depicted in Table 6.
2.5. Econometric Analysis
The single factor regression model describes how an endogenous quantitative variable (the dependent variable Y, in our study the crude oil exported to China, expressed in thousands of barrels per day) is influenced by an exogenous quantitative factor (variable X, in this study the ‘Global Risk Indicator’) and by residual factors (ε). The general, synthetic form of the single factor regression model is
where f is the linear function describing the dependence
y = f(x) + ε,
In addition to explaining the model in mathematical form, regression model analysis involves estimating regression parameters, testing the significance of the model using the t-test, testing its validity, and checking the classical assumptions of a regression model [38].
3. Results
3.1. Chinese Investment Model in Angola
Although diplomatic relations between China and Angola date back to 1983, with the establishment of peace in 2002, a strategic relationship has been created, and so important investments have been made by Chinese companies in order to restore Angola, which was destroyed in the aftermath of the 27-year war. The fundamental assumption in our proposed China-Angola model is a win-win situation, with China interested in Angola’s oil resources and Angola in the important amount of money China invested and continues to invest mostly in its infrastructure projects. This theory reflects macroeconomic complementarities between Angola and China: China has one of the world’s largest and most competitive construction industries and few natural resources, while Angola has an infrastructure deficit and a wealth of resources [39].
China is extremely interested in importing oil from Angola because the Angolan crude oil is suited to the needs of Chinese refineries which are configured to process internally extracted medium-sour crude oil [40]. On the other hand, Angola considers China as an advantageous alternative to conventional financing sources because it provides loans without political conditionality and at a much lower interest rate than any international financial institution [41].
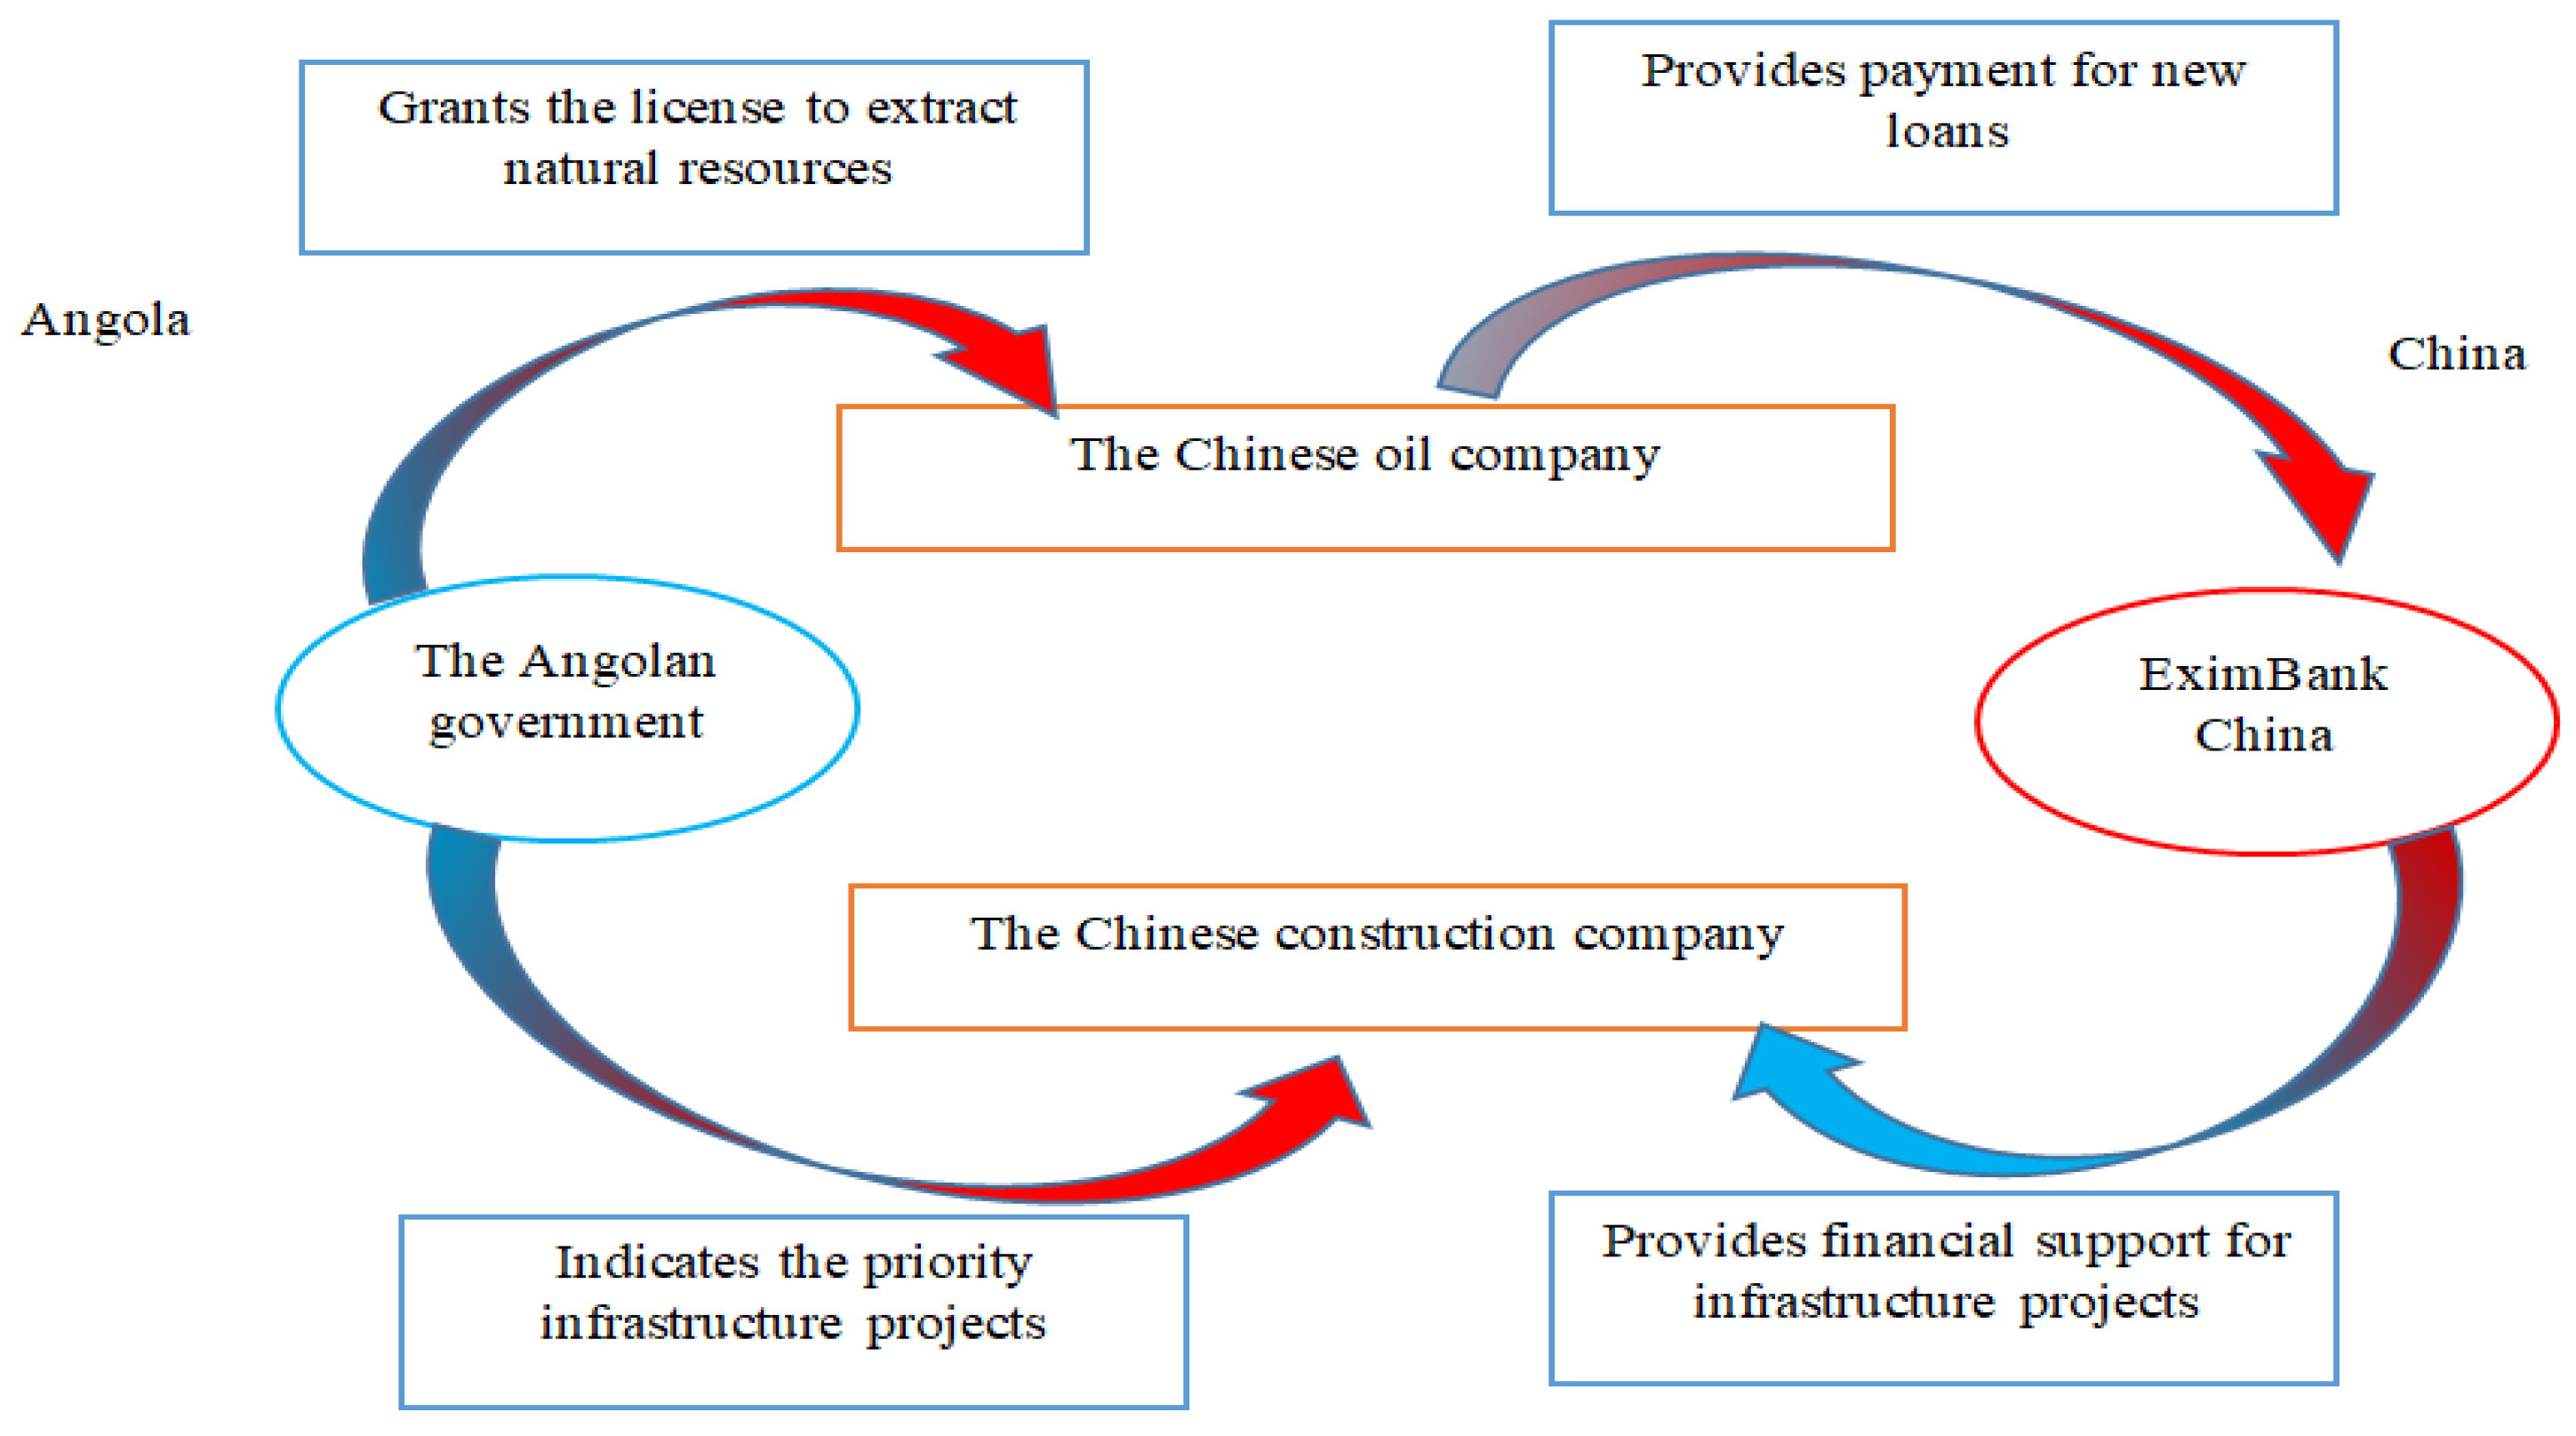
The Angolan government uses Chinese credit facilities backed by petroleum-based guarantees to finance investments [19]. However, these investments do not represent amounts of money delivered directly to the Angolan government, but rather the provision of the necessary funds for Chinese public enterprises to develop infrastructure and industrial projects in exchange for petroleum and minerals [17]. According to figures published by the Finance Ministry of Angola [42] at the end of 2011, the amount invested by China through the Exim Bank, the Development Bank, and the Commercial Bank was estimated to be $14.5 billion. Chinese investments are recovered from extracted and imported petroleum. The diagram below (Figure 3) describes the investment model applied in Angola and its flow.
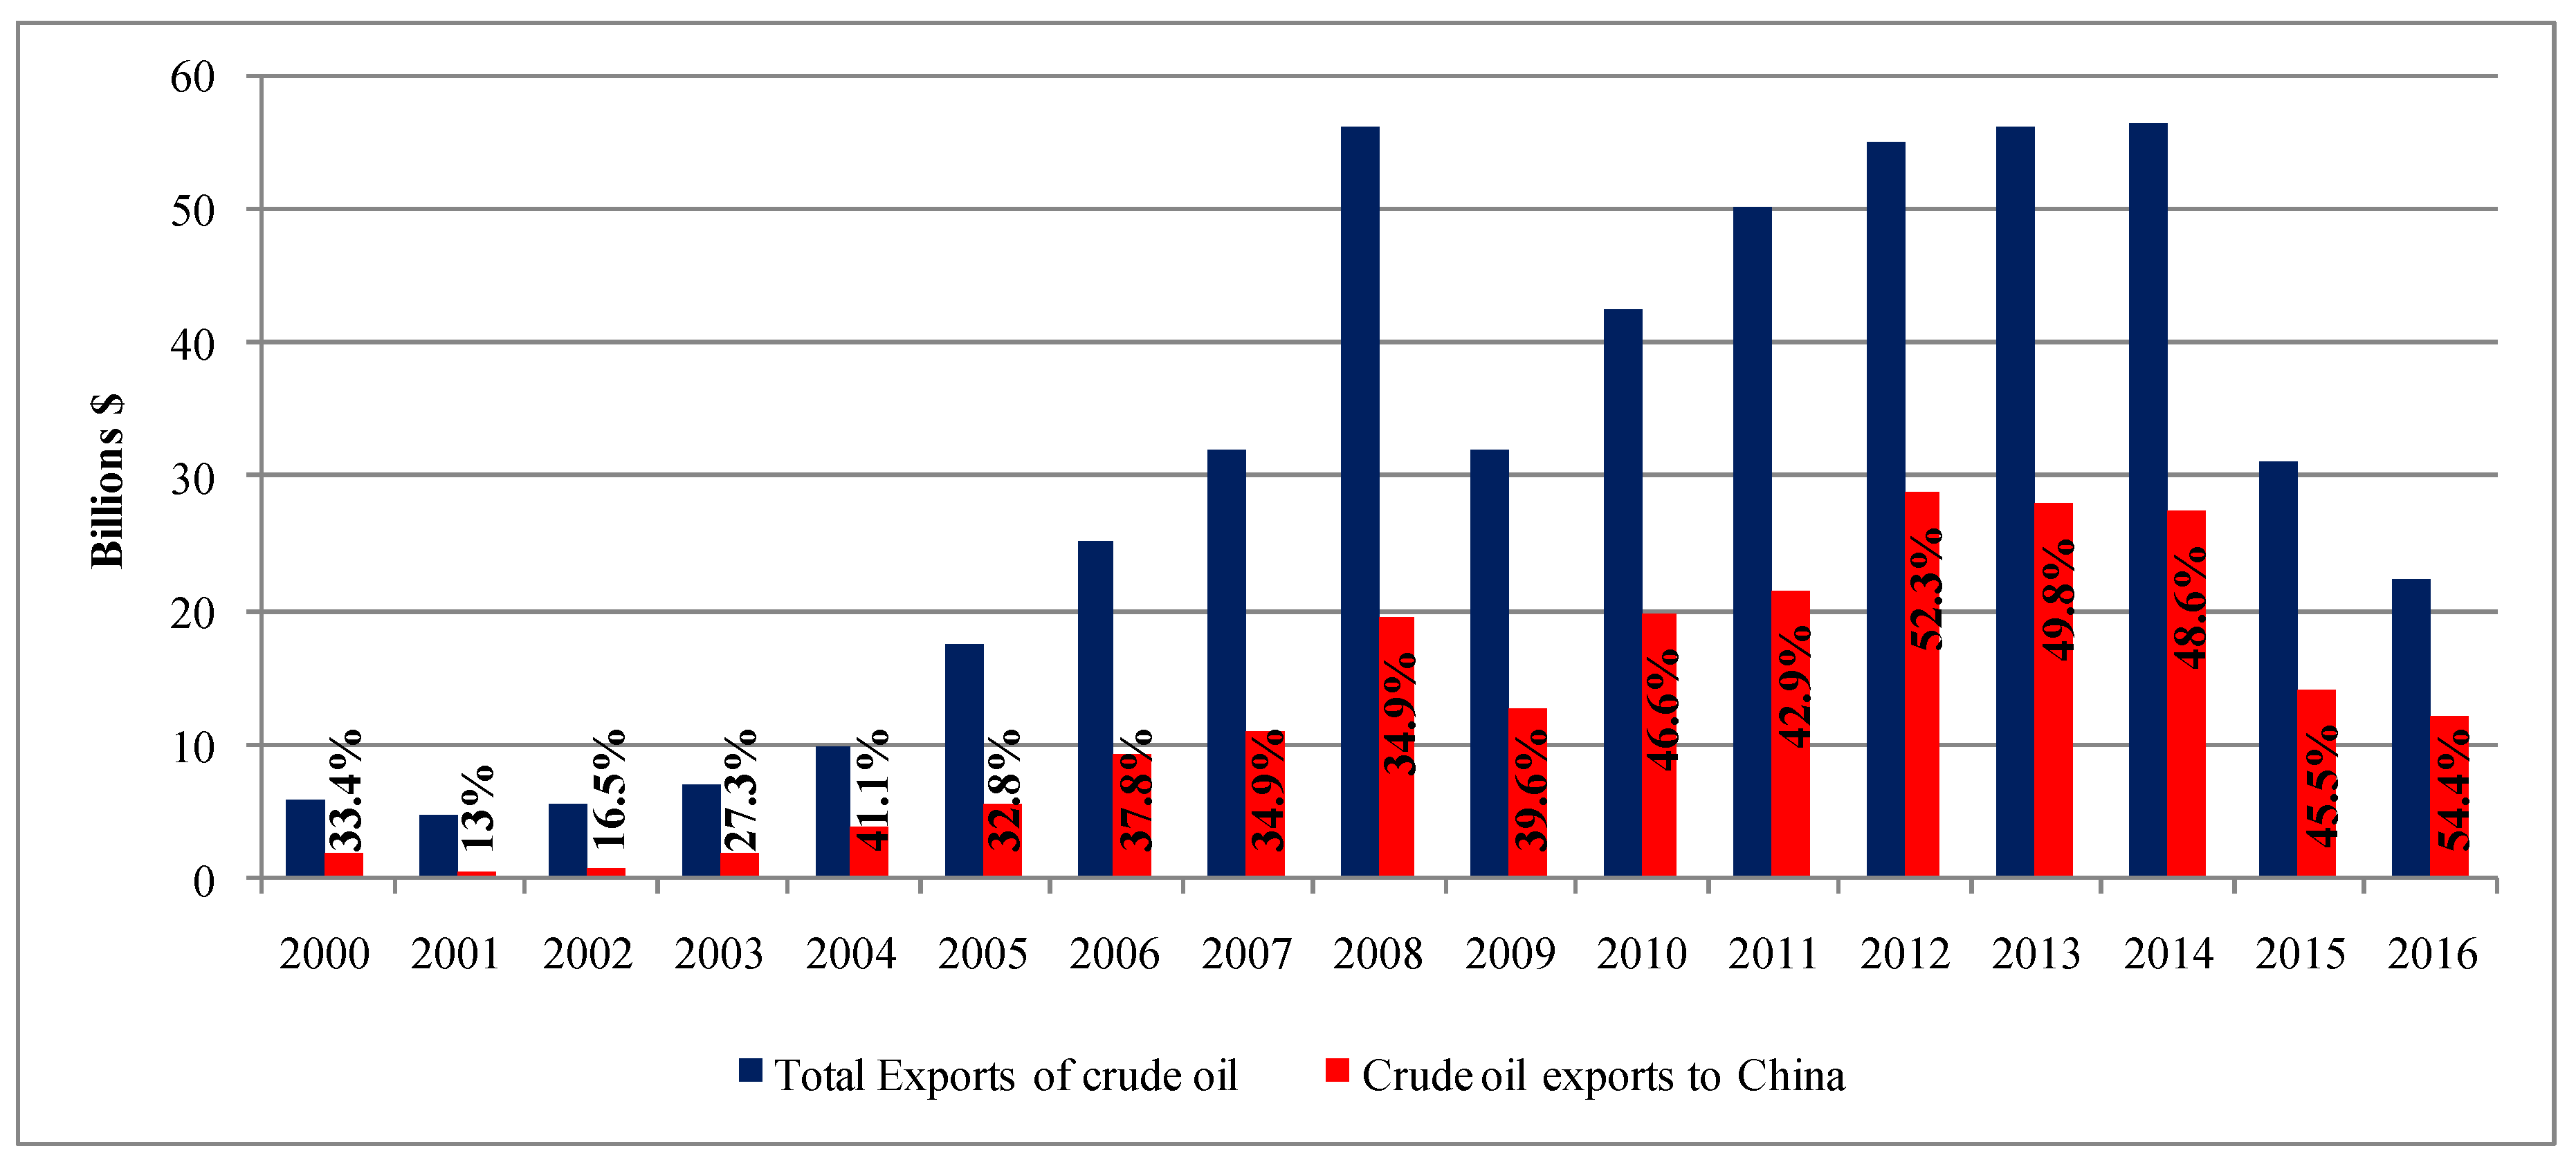
Since this funding model is atypical and complex, it is difficult to determine the amounts invested over time and their recovery. China’s investment risk in Angola could be assessed to the extent that petroleum exports from Angola to China are affected. Figure 4 shows the evolution of petroleum exports from Angola to China between 2000 and 2016. Since 2010, almost half of Angola’s exported petroleum has been imported by China which accounts for 12–17% of China’s total petroleum imports.
3.2. Impact of Social, Economic, and Political Risk Indicators on Petroleum Exported
Using the assumption that Chinese investments are recovered from extracted and imported petroleum, the investment risk factors are the same as factors that would reduce the amount of petroleum exported to China. These factors depend on the destination of the investments, and thus on the situation in Angola. To describe the overall situation of Angola, data were gathered for the 14 indicators (economic, social, and political), as described in the previous chapter. We have considered these three thematic areas because most of the country profiles are being built taking into account the economic, social, and political contexts [27]. The strength of their relationships with petroleum exports, as well as the direction of these relationships, can be determined by analyzing Pearson’s correlation coefficients. Correlations between the Angolan indicators and the petroleum export to China index are shown in Table 7.
Thus, among the economic indicators, only Angola’s GDP and the exchange rate have a strong positive correlation with the crude oil exports to China. Given that the economy of Angola is based on petroleum, the relationship between GDP and the crude oil exports is well known. With regard to the exchange rate, because repayments of Chinese loans are related to the price of oil at the time of their negotiation, Angola has to export more oil to China when its value depreciates.
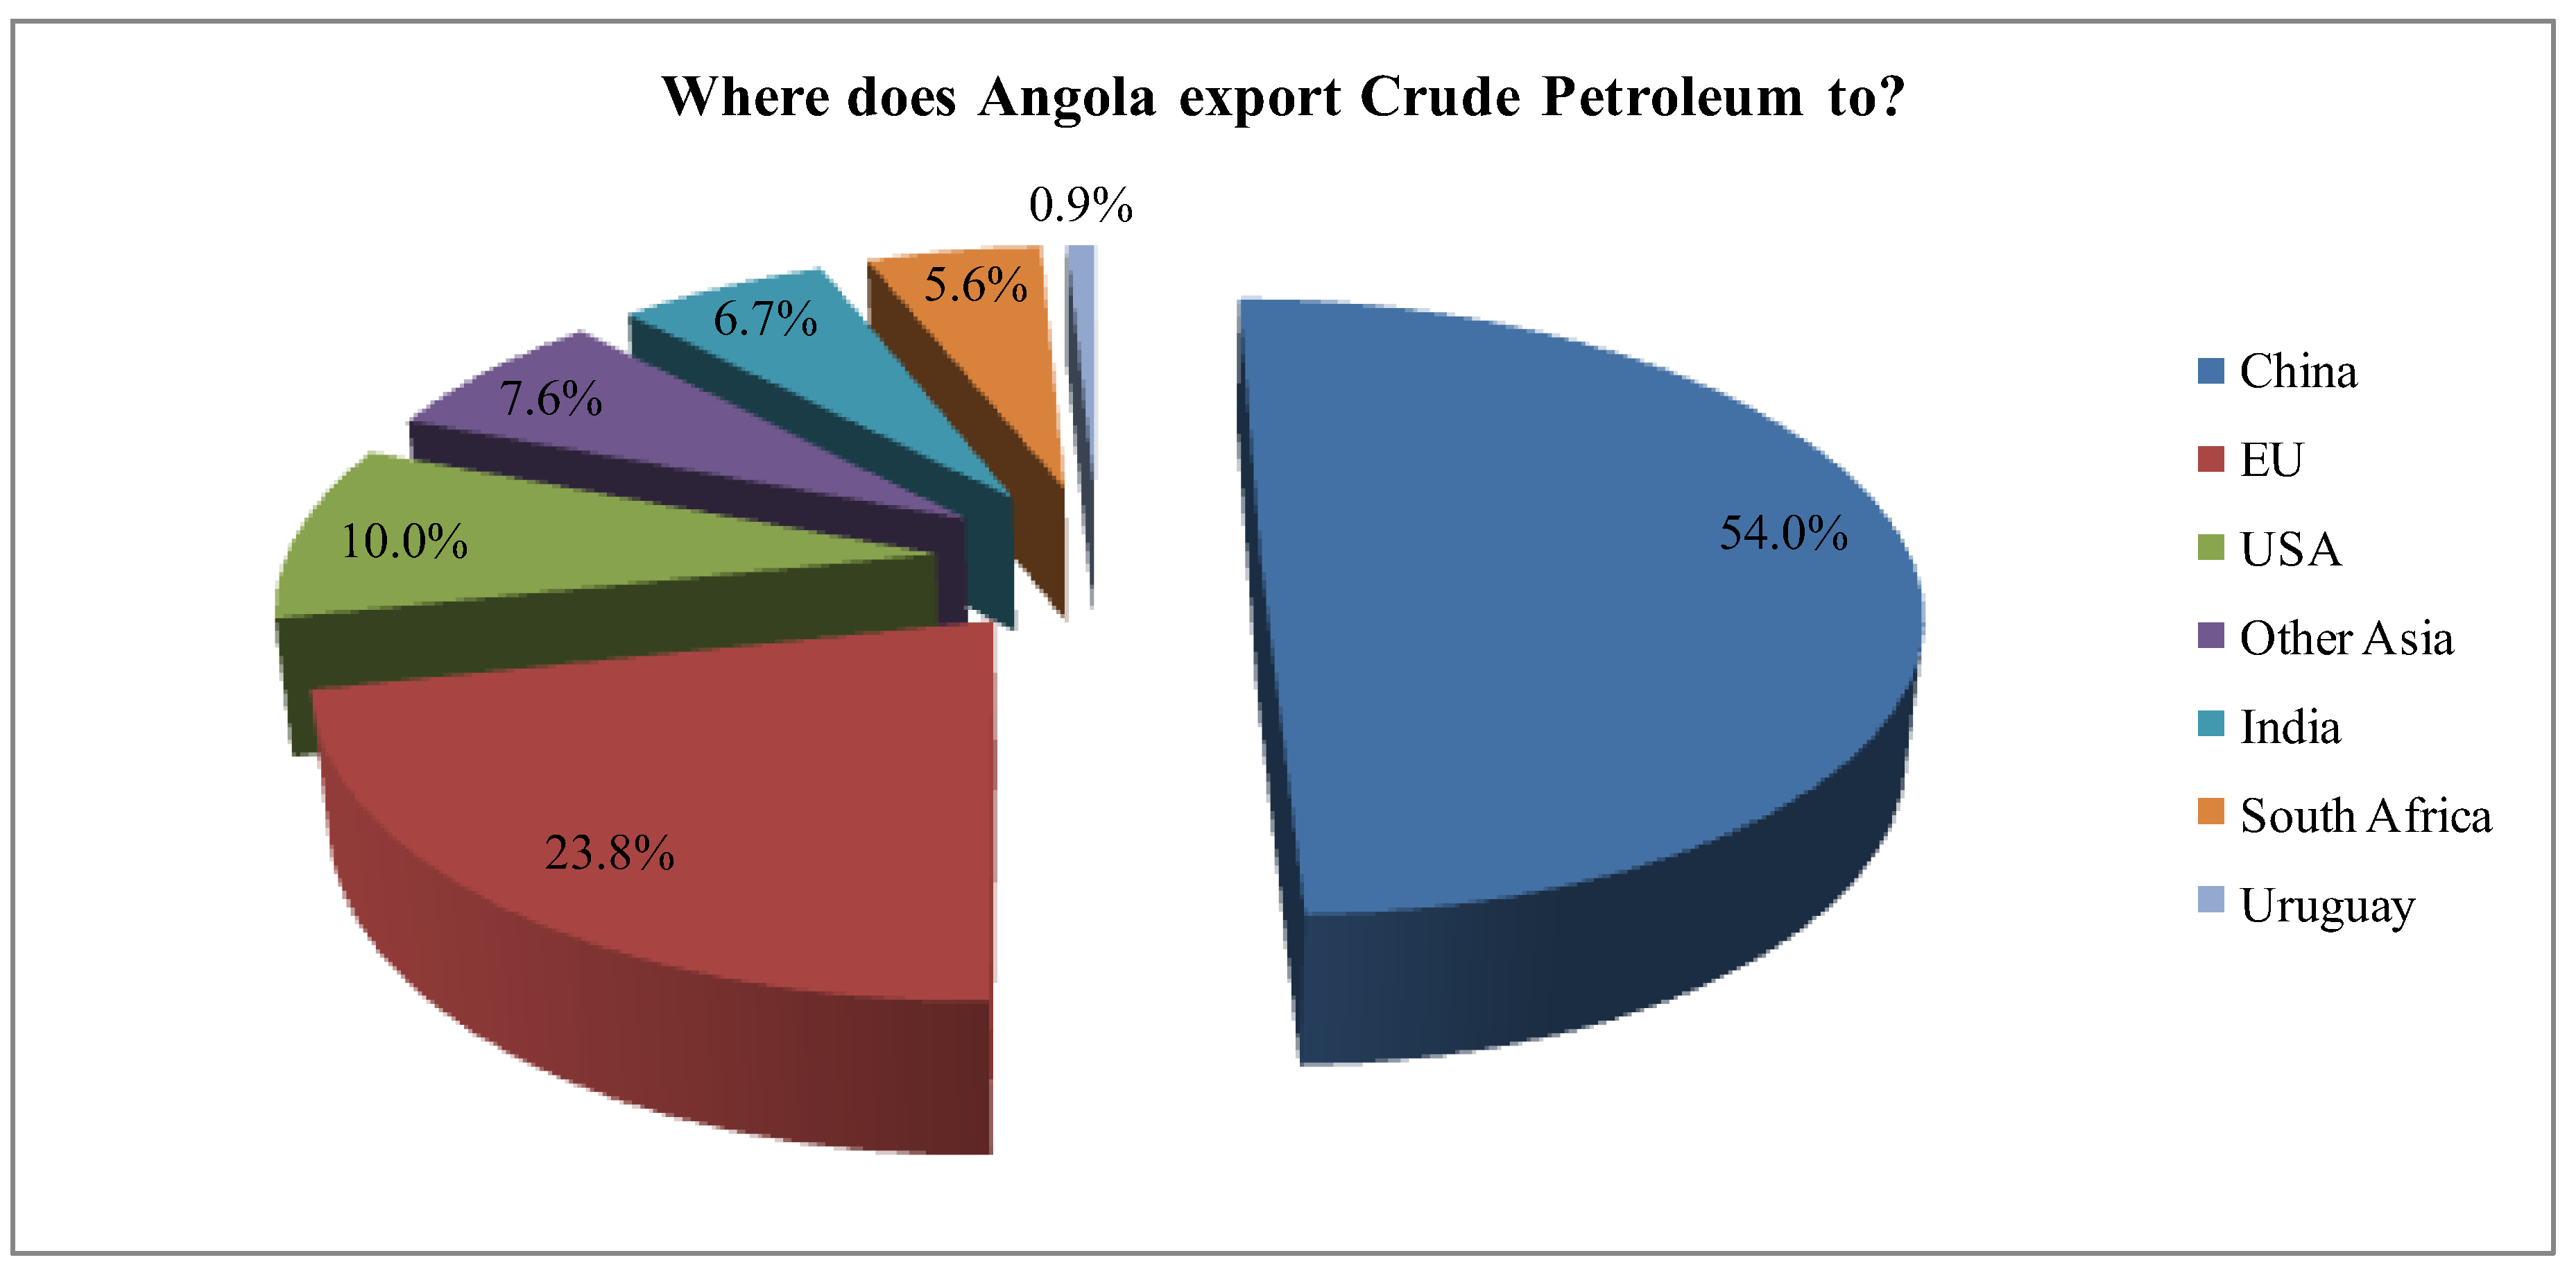
Both imports and exports (as% of GDP) are negatively correlated with crude oil export to China. A large percentage of imports in the GDP is an alarm signal indicating a decrease in production and increasing dependence on the country from which it is imported. The share of export in the GDP could be a risk factor as China is not the only trading partner of Angola. The structure of petroleum exports in 2016 is presented in Figure 5 which shows the percentage exported to each destination.
An increase in the share of the employed population in the total population would be a sign that Angola’s developing economy is expanding thus creating jobs. As any development process involves resource consumption, this consumption could affect the amount of petroleum intended for China by using this amount for its own benefit in order to sustain economic growth. Thus, increasing the share of the employed population may be considered a risk factor. In this case, it is also worth mentioning that Chinese construction companies build infrastructure projects with their own employees. China does not create jobs for Angolans, with evoked reasons being the language barrier, unskilled labor, and the long time it takes to train foreign employees.
Another macroeconomic factor that could influence the China-Angola relationship is inflation. A widespread increase in prices may affect exports, as inflation has a direct impact on production costs, which can be labor-related costs, material expenditures, etc. Thus, inflation may negatively affect petroleum exports to China, resulting in an increased investment risk.
Access to drinking water is one of the social factors that are highly positively correlated with the export of crude oil to China. At present, only half of Angola’s population has access to drinking water, which is one of the country’s major health-related problems and without an improvement in the well-being of the population there can be no sustainable development, so this factor was taken into account in the investment risk analysis. Also the Human Development Index is positively correlated with the export of petroleum to China. In Angola, HDI has steadily increased in recent years, but it is still at a low level. In assessing the evolution of a country, people are extremely important—their health status influences productivity and their skills are essential to the development of a country, so HDI is an indicator that cannot be neglected in the investment risk analysis.
The fertility rate in Angola is very high, with six live births per woman being reported in 2012, which is negatively correlated with the petroleum exports. As a rule, the registration of a high rate of fertility in a country is associated with a low level of the Human Development Index and indicates a low development level of that state. Angola is a country with a very young population. Almost half of the country’s population, 47.58% in 2012, is younger than 14 years old. Calculations show that the share of the population aged 0 to 14 years is not correlated with the export of petroleum.
Although China does not intervene in the domestic politics of any African state with which it has commercial relations, there is a fear of these former colonies being, once again, under the domination of a superpower [44]. In Angola, a possible threat could come from the population as well [45]. Considering the four centuries under Portuguese rule (1575–1975), a period followed by a civil war, state independence is still a sensitive issue. The influence of a super power like China has awakened a sense of mistrust and uncertainty among the population, but the memory of the war discourages them from expressing their discontent. The political stability of Angola is an extremely important factor that can influence trade relations with China. China has already had a similar experience with Sudan, one of its major partners until 2012, where the partnership ended due to internal conflicts for the resources between Sudan and South Sudan [3].
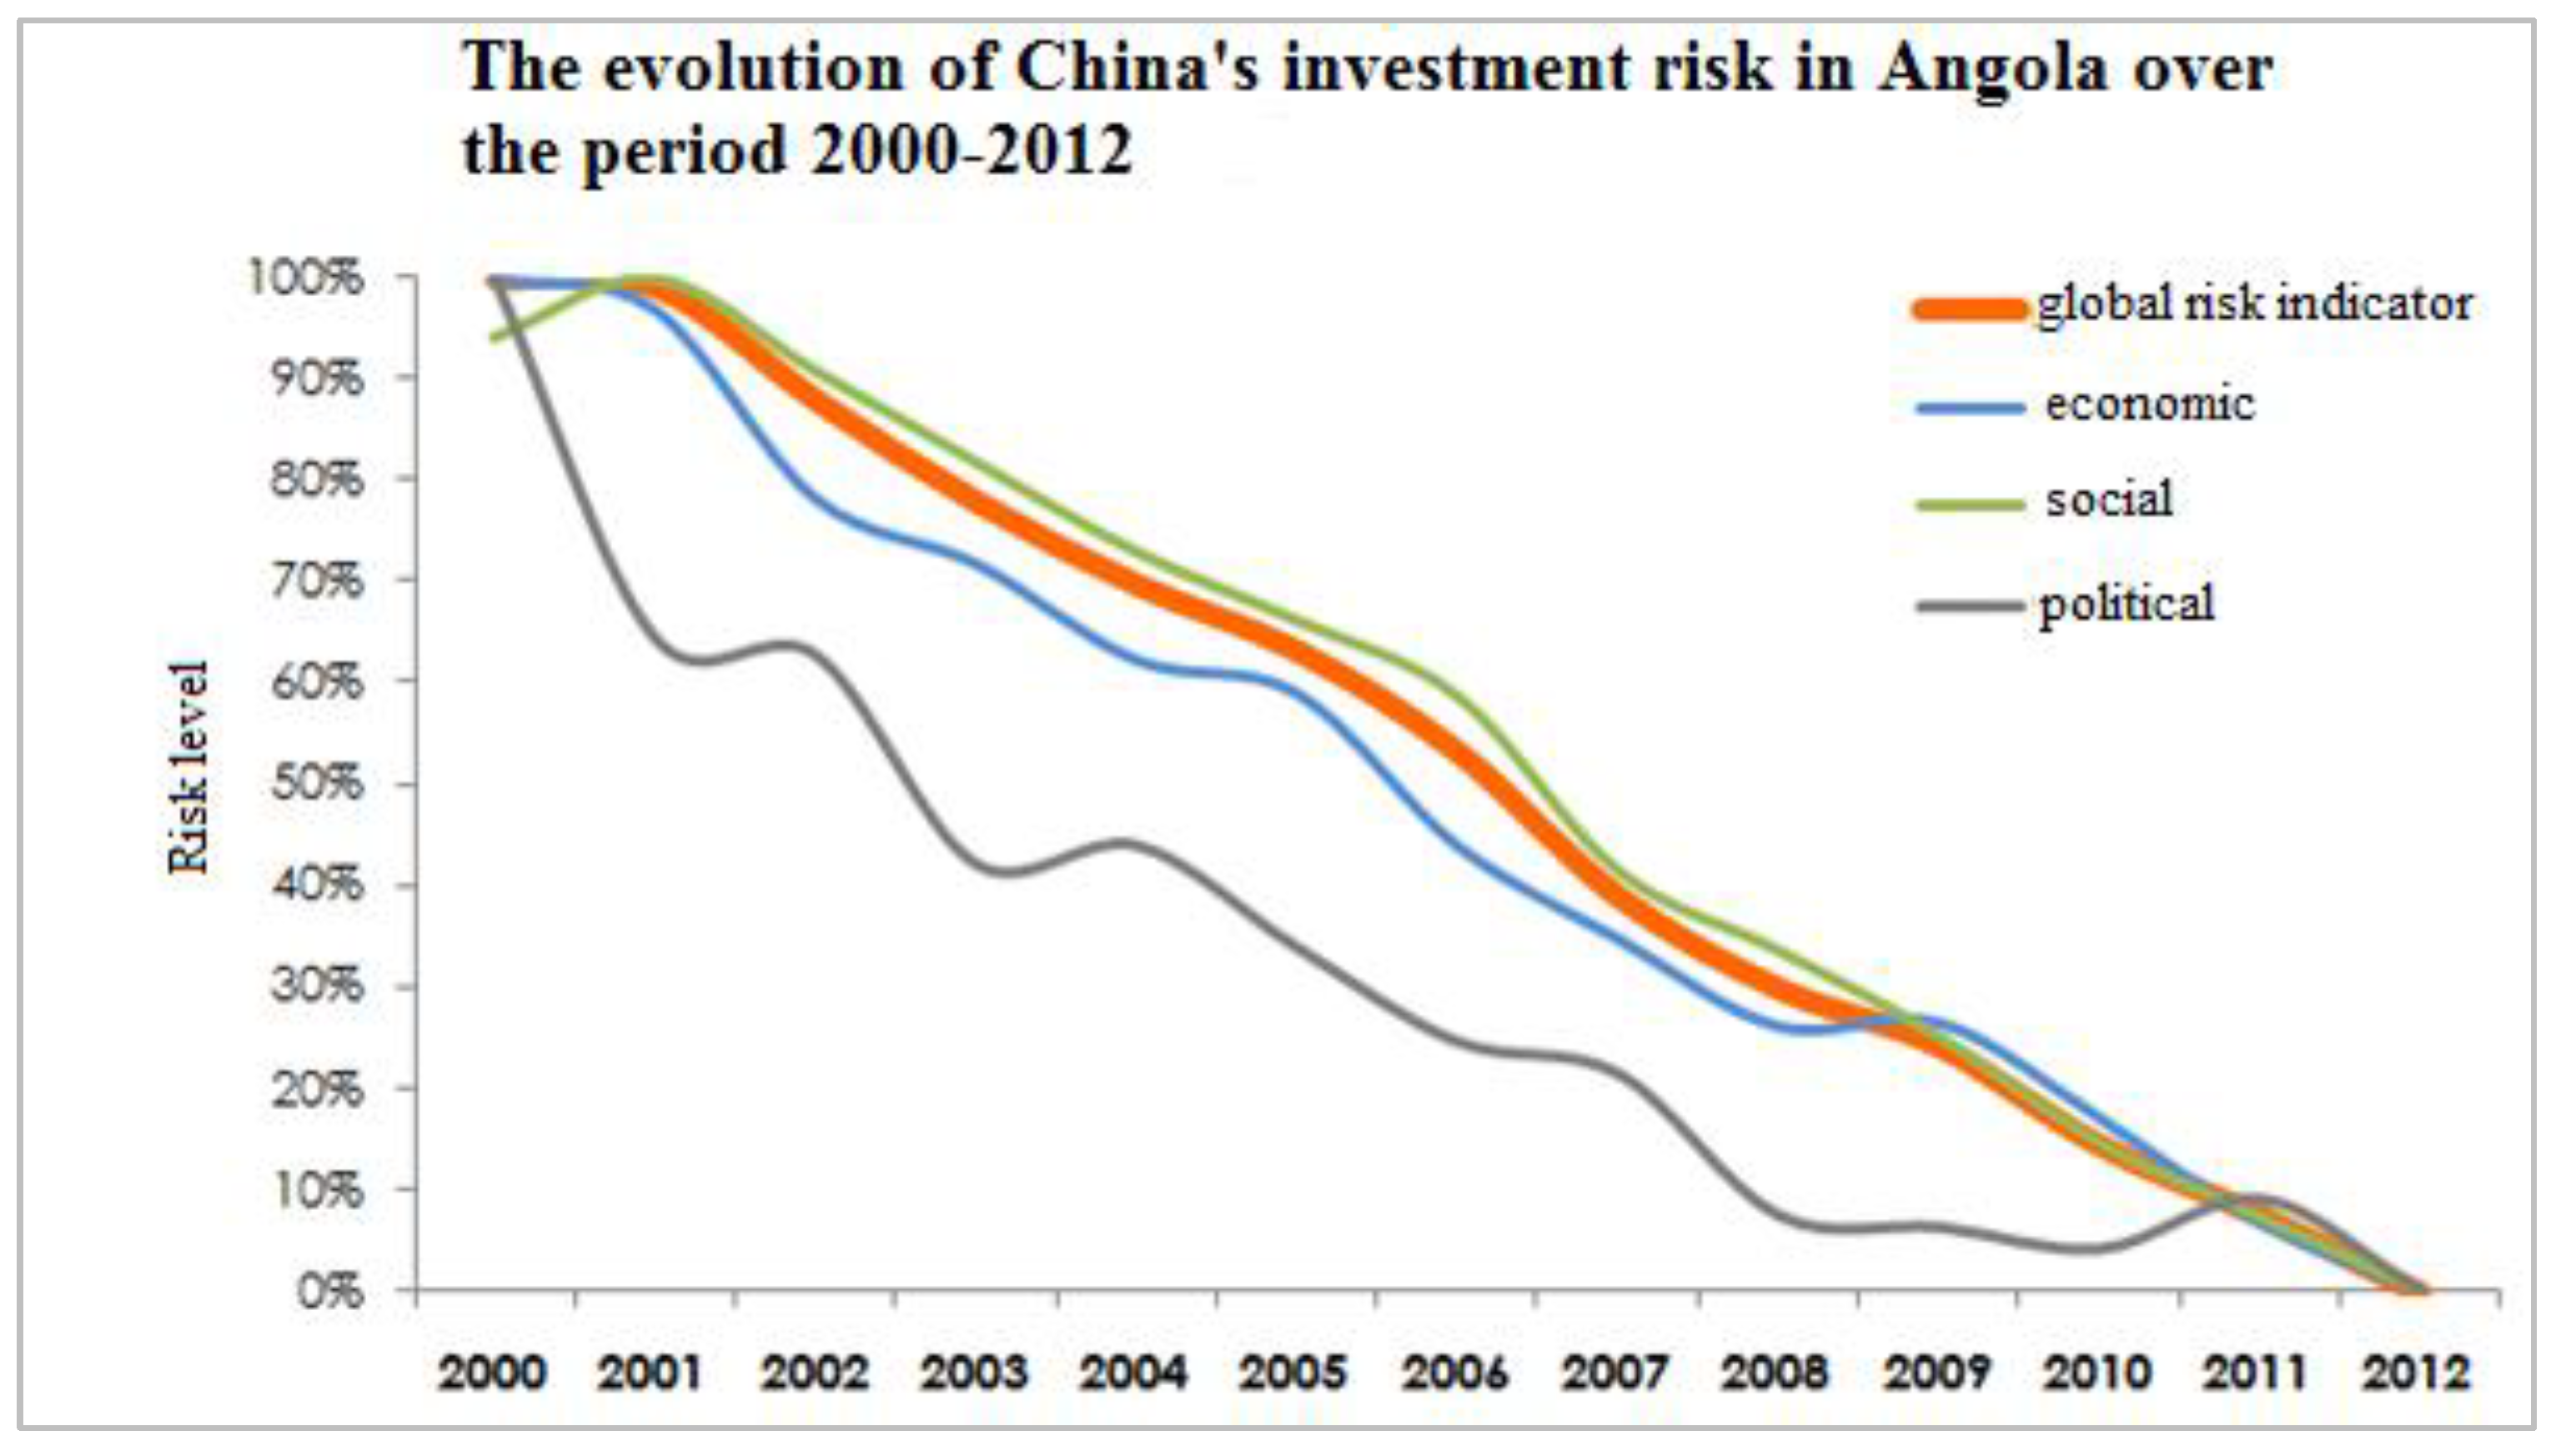
Thus, the specific political aspects of Angola are directly related to the export of petroleum to China, with any political tension in the population being a risk factor. From Figure 6, it is visible that since the end of the war, the risk has had a downward trend so far, a sign that political tensions have diminished and the country is trying to rebuild by attracting investments.
3.3. Interpreting the Global Risk Indicator and Its Impact on Recovery of Investments Made in Angola
According to the investment model depicted in Figure 3, China recovers its investments made in Angola’s industry and infrastructure through the petroleum it imports from this country. After having highlighted the direction and the relationship between the amount of exported petroleum and each economic, social, and political factor that could constitute an investment risk factor, it is important to also analyze to what extent the increase in the Global Risk Indicator (GRI) influences the amount of petroleum exported.
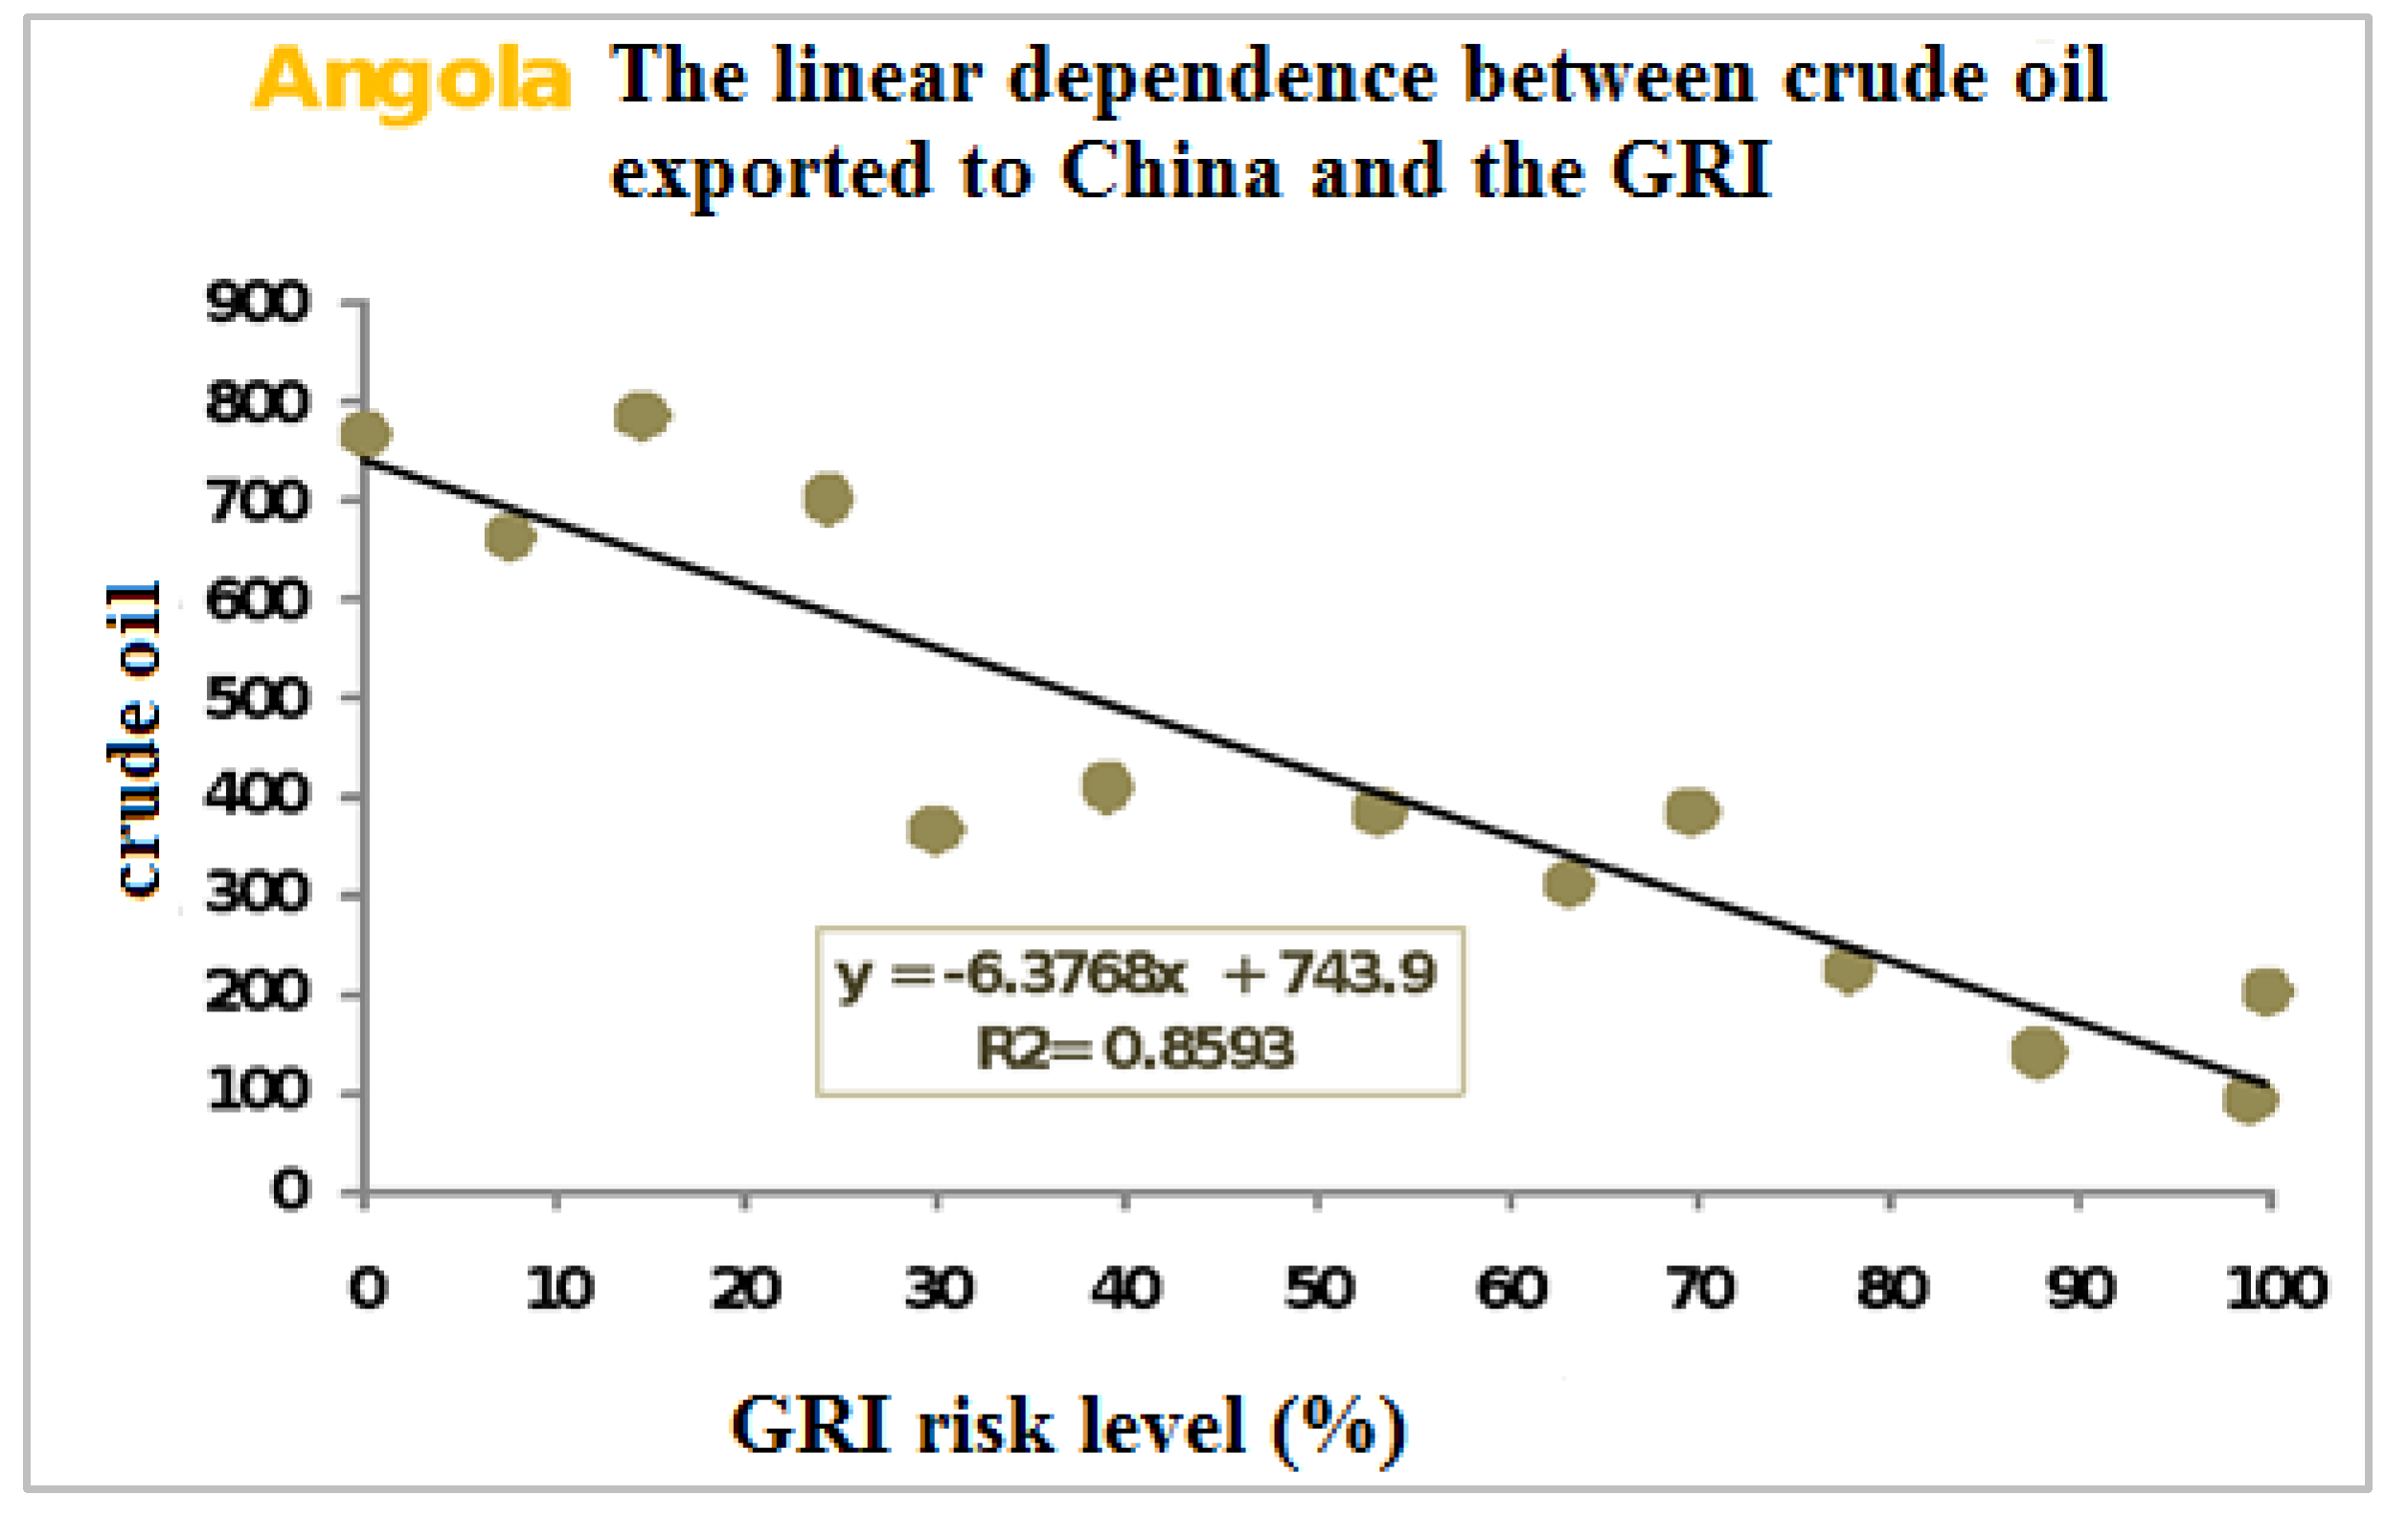
As a result of processing on the data, a reverse linear relationship between the amount of crude oil exported to China and the level of investment risk was identified. The linear dependence is presented in Figure 7, and the explicit mathematical model has the following form
Petroleum exported = −6.3768 × GRI + 743.9
This model is guaranteed with a 95% probability and is statistically valid. Therefore, a 1% increase in risk results in a drop in the amount of petroleum exported by almost 6377 barrels per day. Otherwise, the risk variation explains 86% of the petroleum exported to China.
Furthermore, the hypotheses of the linear single factor regression model were then tested to confirm the model. To test the significance of the model, we turned to the t-test, assuming that the parameter tested is statistically insignificant [38]. In the present case, the value of the t-test indicated the rejection of the null hypothesis and the acceptance of the alternative, according to which all the model parameters are statistically significant.
To check the validity of the regression model, we performed the Fisher test. The value obtained also indicates the rejection of the null hypothesis and acceptance of the alternative, according to which the model is valid.
Tests were then required to verify the hypotheses of homoscedasticity, normality and autocorrelation. The homoscedasticity hypothesis (Var(εi) = σ2) refers to the variance of the model and involves the constant dispersion of the errors. If errors do not have this property, then they are supposed to be heteroscedastic, a situation that needs to be highlighted and corrected. The White test is a statistical test that starts by explaining the errors observed with one or more exogenous variables. The results of this test indicated that the errors are homoscedastic (Appendix A, Table A1).
Regarding the autocorrelation hypothesis, the Durbin–Watson test was used, which has as a null hypothesis the fact that the errors are not autocorrelated. The result obtained led to the acceptance of this hypothesis (DW statistics was 1.824). Also, for the normality test, we used the Jarque–Bera test, which is based on the property of the normal distributions to be characterized only by the first two moments (mean and standard deviation), with all other moments being expressed according to these. Thus, any normal distribution is symmetrical (skewness = 0 and kurtosis = 3). The result of the test indicated that the model errors have a normal distribution (Appendix A, Table A1).
It can be concluded that the single factor regression model complies with all the assumptions of a statistically valid model. The link between the investment risk and the quantity of petroleum exported from Angola to China can be described by a linear equation. Thus, an increase in investment risk of 1% leads to a decrease in the amount of petroleum exported by 6377 barrels per day.
4. Discussion
China is among the major economic partners of the African states and grants massive investments, infrastructure projects, and loans to them. The interest in the African continent is nourished, on the one hand, by its new potential markets and on the other hand, by its wealth of natural resources. China’s substantial need for natural and energy resources is explained by its spectacular economic growth. It is also the world’s largest consumer of energy, and as its consumption cannot be covered by its own production, China has to import raw materials from many sources. China became the worldwide largest petroleum importer in September 2013, surpassing the United States that had been the petroleum import world leader since the 1970s.
The strategic partnership between China and Angola is based, in particular, on oil cooperation, simplified as a bilateral barter relationship “infrastructure for petroleum”, as China provided significant financial resources, guaranteed by future oil exports, for infrastructure projects meant to create the conditions for economic growth and sustainable development. The analysis of China’s investment model in Angola is based on the assumption that China recovers its investments by importing petroleum and that the risk factors for the investments are the same as the factors that would reduce the amount of petroleum exported by Angola to China. These factors depend on the situation in Angola.
In the analysis of the correlations between the economic, social, and political indicators of Angola and the export of petroleum to China, the social risk factor was shown to be the most risky at 64%, followed by the economic (26%) and the political (10%) factors. Although the Human Development Index has steadily increased since 2000, its value is low compared to other countries on the African continent. Also, the increased fertility rate of 6 live births to a woman is often associated with weak state development. However, the social factor that most discourages investment is access to drinking water. In Angola, almost half of the population has no access to clean drinking water, and this has a major impact on health.
Regarding the economic component, Angola’s GDP is by far the most important factor in the analysis of investment risk. GDP growth diminishes the risk of not recovering investments. Indeed, GDP growth in Angola is based on petroleum production and exports.
Based on the 2000–2012 data, the political factor has a less important influence on the investment risk analysis. Although Angola is one of the most corrupt states in the world (among the top 25 countries), this aspect does not seem to discourage investment. This is explained by the fact that China’s partnership with Angola does not imply intervention in the domestic policy. Diplomatic relations between the two countries are very tight, with private Chinese investments being increasingly diversified in sectors such as agriculture, industry, human resources and health, all of which strengthen the sustainable partnership between the two countries. On the other hand, a risk factor is given by the political tensions still felt among the population. They disagree with the China–Angola partnership because they associate this relationship with those of the colonial period. However, as the population benefits from Chinese investment and the economy will be on a rising trend, with obvious positive effects for the well-being of the population, these concerns will fade away.
All these economic, social, and political Angolan issues whose dynamics could impact the evolution of oil export to China are summarized by the newly built GRI (Global Risk Indicator) indicator. Its evolution in the period 2000–2012 follows a linear downward trend. This indicates a reduction in investment risk. Consequently, China’s investments in Angola are safer, and the relationship between the two states is getting stronger.
Starting from the assumption that the recovery of investments made in Angola is translated into thousands of barrels of petroleum imported daily from Angola, the second part of the analysis highlighted the risk impact of the amount of petroleum imported by China. The links between these variables were described by a single-factor regression model, a model that was proven to be valid (hypotheses of homoscedasticity, autocorrelation, and error normality were verified). The variation of global risk indicator explains 86% of the variation in the amount of petroleum exported to China. An increase in risk of 1% would lead to a decrease in the quantity of petroleum exported by almost 6377 barrels per day. Our study has, of course, some limitations—due to the small number of observations, the causal relationship obtained in our model should be viewed with caution.
Therefore, the evolution of the China–Angola partnership is difficult to predict, being influenced by many aspects. It may depend on other factors that were not included in the model, such as exogenous factors of political or decisional nature. One example might be Angola’s desire to diminish its dependence on China by trying to find other sources of funding from other states. On the other hand, China could try to streamline its resource consumption or reconsider its investment in many countries around the world. It can be said, however, that this partnership will continue as long as China continues to invest in Angola, all the more so as petroleum is the only currency currently available to Angola.
Author Contributions
Conceptualization, all authors; Methodology, L.S.B.; Software, M.D.V.; Validation, L.S.; Formal Analysis, M.D.V.; Investigation, all authors; Resources, L.S. and R.C.; Data Curation, L.S.B. and M.D.V.; Writing—Original Draft Preparation, L.S. and R.C.; Writing—Review and Editing, all authors; Visualization, L.S. and R.C.; Supervision, L.S.B. and M.D.V.; Project Administration, L.S.B..
Funding
This research received no external funding.
Conflicts of Interest
The authors declare no conflict of interest.
Appendix A

Table A1.
Results of the White and Jarque–Bera tests.
| Test Name | Test Value | Probability |
|---|---|---|
| White heteroscedasticity test | 1.70 | 0.42 |
| Jarque–Bera test | 0.17 | 0.91 |
References
- Van de Looy, J. Africa and China: A Strategic Partnership? ASC Work. Pap. 2006, 67, 1–28. [Google Scholar]
- Deng, C.; Jiang, Z.; Sun, C. Estimating the Efficiency and Impacts of Petroleum Product Pricing Reforms in China. Sustainability 2018, 10, 1080. [Google Scholar] [CrossRef]
- EIA. China International Analysis U.S. Energy Information Administration (EIA). 2015. Available online: https://www.eia.gov/beta/international/analysis.php?iso=CHN (accessed on 16 August 2018).
- Xu, J.; Zhang, J.-S.; Yao, Q.; Zhang, W. Is It Feasible for China to Optimize Oil Import Source Diversification? Sustainability 2014, 6, 8329–8341. [Google Scholar] [CrossRef] [Green Version]
- Mo, C. Energy ties and the China–Angola strategic partnership. Newsletter 2012, 62, 29. Available online: https://iias.asia/sites/default/files/IIAS_NL62_29.pdf (accessed on 26 July 2018).
- Taylor, I. Mainland China–Angola relations: Moving from debacle to détente. Issues Stud. 1997, 33, 64–81. [Google Scholar]
- Zafar, A. The growing relationship between China and Sub-Saharan Africa: Macroeconomic, trade, investment, and aid links. World Bank Res. Obs. 2007, 22, 103–130. [Google Scholar] [CrossRef]
- Aguilar, R.; Goldstein, A. The Chinisation of Africa: The Case of Angola. World Econ. 2009, 32, 1543–1562. [Google Scholar] [CrossRef]
- Alves, A.C. The Petroleum Factor in Sino–Angolan Relations at the Start of the 21st Century, Occasional paper. China Afr. Proj. 2010, 2, 55. [Google Scholar]
- Corkin, L. China and Angola. Strategic partnership or marriage of convenience. Angola Br. 2011, 1, 1. [Google Scholar]
- Power, M. Angola 2025: The Future of the “World’s Richest Poor Country” as Seen through a Chinese Rear-View Mirror. Antipode 2012, 44, 993–1014. [Google Scholar] [CrossRef]
- Habiyaremye, A. Is Sino-African trade exacerbating resource dependence in Africa? Struct. Change Econ. Dyn. 2016, 37, 1–12. [Google Scholar] [CrossRef]
- Wolf, C. China and Latecomer Industrialization Processes in Sub-Saharan Africa. A Case of Combined and Uneven Development. World Rev. Political Econ. 2016, 7, 249–284. [Google Scholar] [CrossRef]
- Wolf, C. Industrialization in Times of China: Domestic-Market Formation in Angola. Afr. Aff. 2017, 116, 435–461. [Google Scholar] [CrossRef]
- Tkachenko, K.A. Chinese Infrastructure Projects in Africa. Aziya I Afr. Segodnya. 2018, 2, 41–44. [Google Scholar]
- Schmitz, C.M.-T. Performing "China in Africa" for the West: Chinese migrant discourses in Angola. Asian Pac. Migr. J. 2018, 27, 9–27. [Google Scholar] [CrossRef]
- Kiala, C. China–Angola aid relations: strategic cooperation for development? S. Afr. J. Int. Aff. 2010, 17, 313–331. [Google Scholar] [CrossRef] [Green Version]
- Murgui, M.V. FDI and Development. Desk-Study on the Impact of Chinese Foreign Direct Investment (FDI) Has in Angola’s Socio-Economic Development. 2004. Available online: https://ddd.uab.cat/pub/tfg/2014/119109/TFG_mvargasmurgui.pdf (accessed on 07 August 2018).
- Cain, A. Alternatives to African commodity-backed urbanization: The case of China in Angola. Oxf. Rev. Econ. Policy. 2017, 33, 478–495. [Google Scholar] [CrossRef]
- Shaxson, N. Oil, corruption and the resource curse. Int. Aff. 2007, 83, 1123–1140. [Google Scholar] [CrossRef]
- Bader, J.; Daxecker, U.A. Chinese resource curse? The human rights effects of petroleum export dependence on China versus the United States. J. Peace Res. 2015, 52, 774–790. [Google Scholar] [CrossRef]
- Hackenesch, C. Not as bad as it seems: EU and US democracy promotion faces China in Africa. Democratization 2015, 22, 419–437. [Google Scholar] [CrossRef]
- Siu, S. The Sovereign-Commercial Hybrid: Chinese Minerals for Infrastructure Financing in the Democratic Republic of the Congo. Columbia J. Transnatl. Law. 2010, 48, 599–653. [Google Scholar]
- Miron, D.; Dima, M.A.; Vasilache, S. Models Of The Intra-Regional Trade Influence On Economic Sustainable Development In Romania. Amfiteatru Econ. J. 2010, 12, 27–35. [Google Scholar]
- Dima, M.A.; Vasilache, S. Credit Risk modeling for Companies Default Prediction using Neural Networks. J. Econ. Forecast. 2016, XIX, 127–143. [Google Scholar]
- The Organization of Petroleum Exporting Countries (OPEC). Available online: http://www.opec.org/opec_web/en/about_us/24.htm (accessed on 18 February 2018).
- The World Bank Group. Available online: https://www.worldbank.org/en/country/angola/overview (accessed on 26 July 2018).
- The United Nations Development Programme (UNDP). Available online: http://www.undp.org/content/undp/en/home.html (accessed on 18 February 2018).
- Transparency International. Available online: https://www.transparency.org/country/AGO (accessed on 18 February 2018).
- McDonough, I.K.; Millimet, D.L. Missing Data, Imputation, and Endogeneity. J. Econ. 2017, 199, 141–155. [Google Scholar] [CrossRef]
- Saaty, T.L. The Analytic Hierarchy Process: Planning, Priority Setting, Resource Allocation; McGraw-Hill Press: New York, NY, USA, 1980. [Google Scholar]
- Agoston, S.; Dima, A.M. Modeling Intellectual Capital Using Analytic Hierarchy Process (AHP). In Proceedings of the 4th European Conference on Intellectual Capital: Arcada University of Applied Sciences, Helsinki, Finland, 23–24 April 2012. [Google Scholar]
- Hadad, S. Analytic hierarchy process analysis for choosing a corporate social entrepreneurship strategy. Manag. Mark. 2015, 10, 185–207. [Google Scholar]
- Pop, I.; Chicu, N.; Răduțu, A. Non-performing loans decision making in the Romanian banking system. Manag. Mark. 2018, 13, 761–776. [Google Scholar] [Green Version]
- The Economist. Available online: https://www.economist.com/ (accessed on 18 February 2018).
- British Broadcasting Company (BBC). Available online: https://www.bbc.com/news (accessed on 18 February 2018).
- Center for Strategic and International Studies (CSIS). Available online: https://www.csis.org/ (accessed on 18 February 2018).
- Wooldridge, J.M. Introductory Econometrics–A Modern Approach, 2nd ed.; South-Western: Nashville, TN, USA, 2002. [Google Scholar]
- Zongwe, D. On the Road to Post Conflict Reconstruction by Contract: The Angola Model. Available online: https://ssrn.com/abstract=1730442 or http://0-dx-doi-org.brum.beds.ac.uk/10.2139/ssrn.1730442 (accessed on 23 December 2010).
- Meidan, M. China’s Loans for Oil: Asset or Liability? Available online: https://www.oxfordenergy.org/wpcms/wp-content/uploads/2016/12/Chinas-loans-for-oil-WPM-70.pdf (accessed on 18 February 2018).
- Aberg, J. Chinese Financial Assistance in Angola: Promise, Curse or an Uncertain Venture? Department of Political Science, Lund University, 2010. Available online: https://lup.lub.lu.se/luur/download?func=downloadFile&recordOId=1666736&fileOId=1666737 (accessed on 07 August 2018).
- Finance Ministry of Angola. Available online: http://www.minfin.gov.ao/PortalMinfin/#!/ (accessed on 18 February 2018).
- The Observatory of Economic Complexity. Available online: https://atlas.media.mit.edu/en/ (accessed on 27 July 2018).
- Szunomár, Á. China’s relations with the developing world: A new type of colonialism or a fruitful cooperation. In China’s Changing Competitiveness: Shaking up or Waking up the European Union? McCaleb, A., Ed.; Warsaw School of Economics Press: Warsaw, Poland, 2013; pp. 85–110. [Google Scholar]
- Vines, A.; Weimer, M. Angola—Assessing Risks to Stability; Center for Strategic and International Studies: Washington, GL, USA, 2011. [Google Scholar]
Figure 1.
Net imports of petroleum and other liquid fuels for China and the United States. Data source. EIA [3], authors’ own calculation and representation.
Figure 1.
Net imports of petroleum and other liquid fuels for China and the United States. Data source. EIA [3], authors’ own calculation and representation.

Figure 2.
AHP—criterion comparison matrix. Source: Authors’ representation based on Saaty’s methodology [31].
Figure 2.
AHP—criterion comparison matrix. Source: Authors’ representation based on Saaty’s methodology [31].

Figure 3.
Chinese investment model in Angola. Source: Authors’ representation.

Figure 4.
Angola—the evolution of petroleum exports between 2000 and 2016. Data source: Observatory of Economic Complexity [43], authors’ own calculation and representation.
Figure 4.
Angola—the evolution of petroleum exports between 2000 and 2016. Data source: Observatory of Economic Complexity [43], authors’ own calculation and representation.

Figure 5.
Angola—structure of crude oil exports depending on the destination (2016). Data source: Observatory of Economic Complexity [43], author’s own calculation and representation.
Figure 5.
Angola—structure of crude oil exports depending on the destination (2016). Data source: Observatory of Economic Complexity [43], author’s own calculation and representation.

Figure 6.
Evolution of China’s investment risk in Angola in the period 2000–2012. Source: Authors’ own calculation and representation.
Figure 6.
Evolution of China’s investment risk in Angola in the period 2000–2012. Source: Authors’ own calculation and representation.

Figure 7.
Linear dependence of petroleum exported to China and the Global Risk Indicator (GRI). Source: Authors’ calculation and representation.
Figure 7.
Linear dependence of petroleum exported to China and the Global Risk Indicator (GRI). Source: Authors’ calculation and representation.

Table 1.
Indicators’ description and data source
| Indicator | Description | Source |
|---|---|---|
| Petroleum exports to China | Billions of dollars | US Energy Information Administration (EIA) [3] The Organization of Petroleum Exporting Countries (OPEC) [26] |
| Net imports of petroleum | Millions of barrels per day | US Energy Information Administration (EIA) [3] |
| Economic component | ||
| Gross domestic product | Millions of dollars; values are obtained by converting the local currency to US dollars using the official exchange rates for each year. | World Bank [27] |
| Inflation | World Bank [27] | |
| Share of imports in the gross domestic product | The cost of imports includes, in addition to the value of the products traded, the transportation costs associated with the purchase of goods, production stocks and services provided by third parties. | World Bank [27] |
| Share of exports in gross domestic product | The value of exports also includes the costs associated with the export of products and services in addition to their actual value. | World Bank [27] |
| Exchange rate | Reflects the purchase price of a dollar in the local currency of the country; the indicator is calculated annually as an average of the official exchange rates recorded monthly. | World Bank [27] |
| Share of population occupied in total population | World Bank [27] | |
| Social component | ||
| Human Development Index | Composite index that holds information on life expectancy, literacy, education, and living standards; to complete the missing values for this indicator, the life expectancy indicator—a synthetic indicator regarding the health status of the population measured as the number of years that newborns will live if they live the rest of their lives according to the mortality by age levels of that country—is also taken into account. | United Nations Development Program [28] |
| Fertility rate | World Bank [27] | |
| Population share between 0 and 14 years in the total population | World Bank [27] | |
| Share of people who have access to drinking water in total population | Measure for the risk of illness of the population as well as for the degree of poverty. | World Bank [27] |
| Political component | ||
| Corruption perception index | Aspects of corruption are assessed by experts in each country; a score close to 0 indicates a high level of corruption and a score close to 1 the reduction in corruption levels in the public sector. | Transparency International [29] |
| Governance efficiency | Reflects the perception of the quality of public services, the lack of political pressure and the degree of confidence in government measures and policies; this indicator takes values in the range [−2.5,2.5], where −2.5 indicates an inefficient government to the detriment of the population, and 2.5 efficient governance. | World Bank [27] |
| Voice and accountability | Reflects the extent to which the vote of the population is taken into account as well as aspects of freedom of expression and the freedom of the media; this indicator takes values in the range [−2.5,2.5], where −2.5 suggests an extremist political regime where the vote of the population is not taken into account, and 2.5 a political regime in which the state leadership is elected by democratic vote. | World Bank [27] |
| Political stability and lack of violence/terrorism | Reflects the extent to which the rule of a state can be destabilized or replaced by unconstitutional means, coup d’états, acts of violence or terrorist attacks; this indicator takes values in the range [−2.5,2.5], where −2.5 suggests a high degree of instability and 2.5 political stability. | World Bank [27] |
Source: authors’ representation.
Table 2.
AHP— fundamental scale of the AHP importance intensity value.
| Qualitative Variables | Quantitative Variables |
|---|---|
| Equal importance | 1 |
| Moderate importance | 3 |
| Strong importance | 5 |
| Very strong importance | 7 |
| Extreme importance | 9 |
Source: Authors’ representation based on Saaty’s methodology [31].
Table 3.
Weight associated with each economic indicator.
| Economic Indicators | GDP (Mil $) | Exchange Rate | Imports (% of GDP) | Exports (% of GDP) | Employed Population (% pop) | Inflation | Geometric Mean | Weights |
|---|---|---|---|---|---|---|---|---|
| GDP (mil $) | 1 | 5 | 5 | 6 | 6 | 7 | 4.3 | 49% |
| Exchange rate | 0.2 | 1 | 2 | 3 | 3 | 5 | 1.62 | 19% |
| Imports (% of GDP) | 0.2 | 0.5 | 1 | 3 | 3 | 5 | 1.28 | 15% |
| Exports (% of GDP) | 0.17 | 0.33 | 0.33 | 1 | 2 | 3 | 0.69 | 8% |
| Employed population (% pop) | 0.17 | 0.33 | 0.33 | 0.5 | 1 | 3 | 0.55 | 6% |
| Inflation | 0.14 | 0.2 | 0.2 | 0.33 | 0.33 | 1 | 0.29 | 3% |
| Total | 8.74 | 100% |
Source: Authors’ own calculations.
Table 4.
Weight associated with each social indicator.
| Social Indicators | Access to Drinking Water (% pop) | Fertility Rate | HDI | Population Aged 0–14 Years (% pop) | Geometric Mean | Weights |
|---|---|---|---|---|---|---|
| Access to drinking water (% pop) | 1 | 1 | 1 | 9 | 1.73 | 32% |
| Fertility rate | 1 | 1 | 1 | 9 | 1.73 | 32% |
| HDI | 1 | 1 | 1 | 9 | 1.73 | 32% |
| Population aged 0–14 years (% pop) | 0.11 | 0.11 | 0.11 | 1 | 0.19 | 4% |
| Total | 5.39 | 100% |
Source: Authors’ own calculations.
Table 5.
Weight associated with each political indicator.
| Political Indicators | Political Stability and Absence of Violence | Voice and Accountability | Government Effectiveness | CPI | Geometric Mean | Weights |
|---|---|---|---|---|---|---|
| Political Stability and Absence of Violence | 1 | 3 | 5 | 6 | 3.08 | 56% |
| Voice and Accountability | 0.33 | 1 | 3 | 5 | 1.5 | 27% |
| Government Effectiveness | 0.2 | 0.33 | 1 | 2 | 0.6 | 11% |
| CPI | 0.17 | 0.2 | 0.5 | 1 | 0.36 | 6% |
| Total | 5.54 | 100% |
Source: Authors’ own calculations.
Table 6.
Weight associated with each aggregated indicator (social, economic, and political)
| Aggregated Indicators | Social | Economic | Political | Geometric Mean | Weights |
|---|---|---|---|---|---|
| Social | 1 | 3 | 5 | 2.47 | 64% |
| Economic | 0.33 | 1 | 3 | 1 | 26% |
| Political | 0.2 | 0.33 | 1 | 0.41 | 10% |
| Total | 3.87 | 100% |
Source: Authors’ own calculations.
Table 7.
Correlations between Angola’s indicators and the amount of petroleum exported to China.
| INDICATORS | Crude Oil Export to China |
|---|---|
| Economic Indicators | |
| GDP (mil $) | 0.882 ** |
| Exchange rate | 0.732 ** |
| Imports (% of GDP) | −0.699 ** |
| Exports (% of GDP) | −0.673 * |
| The employed population (% pop) | −0.630 * |
| Inflation | −0.604 * |
| Social indicators | |
| Access to drinking water (% pop) | 0.935 ** |
| Fertility rate | −0.934 ** |
| HDI | 0.915 ** |
| Population aged 0–14 years (% pop) | 0.189 |
| Political indicators | |
| Political stability and absence of violence | 0.817 ** |
| Voice and accountability | 0.716 ** |
| Government effectiveness | 0.571 * |
| CPI | 0.546 |
* Correlation is significant at the 0.05 level; ** Correlation is significant at the 0.01 level. Source: Authors’ calculations.
© 2018 by the authors. Licensee MDPI, Basel, Switzerland. This article is an open access article distributed under the terms and conditions of the Creative Commons Attribution (CC BY) license (http://creativecommons.org/licenses/by/4.0/).
Share and Cite
MDPI and ACS Style
Begu, L.S.; Vasilescu, M.D.; Stanila, L.; Clodnitchi, R. China-Angola Investment Model. Sustainability 2018, 10, 2936. https://0-doi-org.brum.beds.ac.uk/10.3390/su10082936
AMA Style
Begu LS, Vasilescu MD, Stanila L, Clodnitchi R. China-Angola Investment Model. Sustainability. 2018; 10(8):2936. https://0-doi-org.brum.beds.ac.uk/10.3390/su10082936
Chicago/Turabian StyleBegu, Liviu Stelian, Maria Denisa Vasilescu, Larisa Stanila, and Roxana Clodnitchi. 2018. "China-Angola Investment Model" Sustainability 10, no. 8: 2936. https://0-doi-org.brum.beds.ac.uk/10.3390/su10082936
Note that from the first issue of 2016, this journal uses article numbers instead of page numbers. See further details here.