Potential of 3D Visualization for Collaborative Rural Landscape Planning with Remote Participants


1
Graduate School of Global Environmental Studies, Kyoto University, Kyoto 606-8501, Japan
2
Graduate School of Agriculture, Kyoto University, Kyoto 606-8502, Japan
*
Author to whom correspondence should be addressed.
Sustainability 2018, 10(9), 3059; https://0-doi-org.brum.beds.ac.uk/10.3390/su10093059
Submission received: 30 June 2018
/
Revised: 3 August 2018
/
Accepted: 21 August 2018
/
Published: 28 August 2018
(This article belongs to the Special Issue Sustainable Land Uses and Rural Governance)
Abstract
:Rural populations are aging and declining, which has reduced the capacity for rural landscape conservation. Thus, collaborative governance with non-local stakeholders is essential to foster innovative ideas by combining knowledge bases. In the current digital era, remote actors can play a part in rural governance across boundaries through information technology. This study focused on the potential of 3D visualization for rural landscape planning and examined the effects and challenges of using 3D models for collaboration with non-local stakeholders. We conducted a survey with remote participants about a rural village landscape, using 3D models created from drone-shot aerial photos, and then discussed the findings with local stakeholders in a workshop in the village. We found that, by using 3D models, various opinions could be obtained from non-local stakeholders who had never seen the actual landscape. They used the 3D model to view the landscape from various perspectives and it enabled participants to accurately grasp local situations and problems. However, some of the opinions gathered in the survey were unrealistic for actual landscape planning. We conclude that 3D models are a useful tool to incorporate external opinions into rural landscape planning across temporal and spatial boundaries, to maintain healthy rural landscapes.
1. Introduction
A long history of human activity being in harmony with nature has created rural landscapes. In rural areas, a combination of manmade structures (e.g., houses, roads, buildings) and semi-natural areas (e.g., farmlands, miscellaneous forests, irrigation canals, and reservoirs) form socio-ecological production landscapes (SEPLs) [1]. SEPLs are multifunctional areas that provide ecosystem services that nurture human life and conserve abundant biodiversity. In recent years, human attraction to the rural landscape has been reconfirmed by interest from not only rural inhabitants but also urban dwellers [2]. As interest in rural areas has increased, it is essential to preserve and reform rural landscapes, which are an essential regional resource.
While the importance of a participatory approach for rural landscape planning has been reported [3], it has become challenging for rural inhabitants to conserve rural landscapes because of local community capacities deteriorating. This is caused by depopulation, emigration of youth, aging, and conflicts within the diversified population due to different lifestyles and mindsets. Thus, it is increasingly important for new governance structures to incorporate diverse actors, from both inside and outside the region, into local planning [4,5]. Incorporating the knowledge of a variety of actors into discussions and increasing diversity should improve rural governance, contributing to the goal of reaching rural sustainability [5]. Potential actors include the public sector, private sector, non-profit organizations, neighboring villages, emigrants from the village, tourists, educational institutions, etc. Non-local actors can provide opinions and ideas from alternative, potentially more objective viewpoints. The demand for quality tourism in rural areas is increasing, meaning that potential visitors (i.e., people who are unfamiliar with the village) are also important actors, since tourism has had great potential for revitalizing the rural economy [6]. Besides, in our current interconnected society, we cannot ignore the many unspecified people on the Internet as potential actors in our planning.
Temporal and spatial distance has been a significant barrier to continuous collaboration and discussions as part of a new form of rural governance with a variety of external actors. In the past, it was difficult to have people in distant places participate in the discussions taking place at a local site. However, the penetration of the Internet and social media since the latter half of the 1990s has enabled communication across time and distance boundaries. Furthermore, social media allows people to easily exchange information and knowledge in a variety of formats beyond text, such as still and moving images, website links, and questionnaires. Another media format accessible on the Internet since the mid-2010s is the three-dimensional model (3D model). 3D models have long been used for landscape planning [7]. Currently, they are difficult to share because of large file size and low Internet connection speeds, but it is expected that as Internet speeds increase it will become possible to share larger and more accurate 3D models. These models will then be available for various regional planning uses.
Given the need to incorporate external perspectives into rural governance and the potential to use 3D models in landscape planning, this study aims to examine the potential usefulness and challenges of 3D models as a method to collaborate with remote stakeholders in the process of landscape planning. This study particularly focused on the many unspecified people on the Internet as non-local stakeholders. While they do not engage in any activities taking place at a local site, they could contribute objective and diverse opinions that are not available within a local community, once sufficient information is provided. We used a case study village, Shimo-Okubo in Japan, for our study. The findings have implications for improving collaborative governance in rural areas.
1.1. Literature Review
1.1.1. Collaborative Governance in Rural Areas
Historically, there have been three popular rural development theories: exogenous (top-down), endogenous (bottom-up), and neo-endogenous, in which both local and extra-local factors are considered [8]. Neo-endogenous development is characterized by cooperation between various social actors. In addition to these three theories, social innovation theory is also considered a core part of rural studies. Social innovation theory, like the neo-endogenous approach, emphasizes external collaboration and networking, but, unlike the neo-endogenous approach, does not always put initiative only on the local [5,9].
Rural communities have contributed significantly to conserving SEPLs [10], and as they deteriorate it is difficult for local individuals to continue to sustainably manage SEPLs. Therefore, co-management systems, or collaboration incorporating various external actors, is considered essential [4,11]. Various empirical studies have investigated how (adaptive) co-management systems develop and the effects and challenges of co-management or multi-actor collaboration [11,12,13]. Studies have also been conducted on governing watersheds and environmental management [14,15,16].
Many of the studies on co-management or collaborative governance were carried out at the regional or watershed level. Studies focusing on collaboration among remote actors are scarce; within the studies that have been conducted, digital communication tools are expected to facilitate the collaboration [5]. However, in a study of intercommunity networking between rural communities in Japan, there were many in-person or telephone-based networks, but email and social networks were seldom used among remote communities [17]. One example of remote use of social media for rural development is a workshop that was conducted in Japan, which enabled professionals to participate remotely in a discussion in rural areas via Facebook. However, it was reported that the remote participants had some difficulties understanding the actual situation of the workshop location only by exchanging texts and still images [18].
1.1.2. Who Are the Remote Participants?
The neo-endogenous approach and social innovation have emphasized both local and extra-local actors [5,8,9]; nonetheless, there is no clear definition of who the extra-local actors are and why they participate. Relevant case studies have shown diverse external actors in the context of rural development including urban consumers [19,20], cooperatives [19], educational and research institutes [21], other communities with communal challenges [17], etc.
As information and communication technology (ICT) has spread worldwide since the mid-1990s, online communities have emerged, becoming an essential platform for communication [22] and cooperative work [23]. On the current online communities, people communicate with both known and anonymous people, exchanging knowledge and information. The members of online communities share their knowledge and information for motives like professional reputation [24], self-efficacy [25], trust [25], and reciprocal relationships [25], even though reciprocity from others is not expected [24]. As these studies indicate, many unspecified—and sometimes anonymous—people online can contribute knowledge and information leading to innovative ideas in local planning from a distance. They also become potential tourists. However, studies on the roles of those actors in the neo-endogenous rural development and rural social innovation have been scarce.
1.1.3. Application of 3D Visualization Technology in Planning
Many studies have been conducted of landscape perceptions [26]; in a number of these studies, still images were used to present landscapes [27]. However, still images are subjective since the researcher chooses the images, viewpoints, photographing ranges, and quality, and this may problematically affect the viewer’s perception of the landscape [28]. The fixed angle, focus, and size of still and moving images also means they are unrealistic. However, remarkable advances in visual technology in recent years have moved visual representation beyond the limits of still images, to synthesized panoramic photographs or digital photomontages [29,30]. Since the 1980s, 3D visualization has also been used to represent landscapes, although it was rather experimental and required specialist knowledge that made it inaccessible to non-professionals [31,32]. Studies have shown that 2D and 3D representations trigger people to evaluate landscapes differently [33,34]. Since the 2000s, 3D visualization has gained popularity in studies on landscape evaluation or landscape planning, and several types of 3D visualization have been used for these purposes, including GIS-based [35,36], physical model [37], clay model with illumination [38], and synthesis of digital surface model and pictures [39]. Some studies tested the qualities and reality of 3D visualization methods in general [40,41,42], while others applied the methods in context for landscape evaluation or assessing their effects on landscape planning.
In the landscape planning context, studies have evaluated the effectiveness of 3D visualization in communicating a landscape plan to stakeholders as part of a participatory landscape planning process [33,36,43]. A survey of private landscape planning consultancies, landscape architects, and public planning and environmental authorities in Germany showed that 3D visualization had a positive image, but a few of these actors had already adopted it [44]. In the context of rural development, 3D models were employed as a visualization tool for workshops, confirming their usefulness [45]. Despite the increased public popularity of unmanned aerial vehicles, 3D models created from drone-shot aerial photos have rarely been adopted in rural landscape studies.
1.2. Scope and Research Hypotheses
Although research has confirmed the effectiveness of using 3D technology to visualize landscapes, most studies thus far have focused its use for communicating with local residents. However, rural areas are facing the challenges of aging and shrinking populations, and this means that potential stakeholders are not always local, as suggested by neo-endogenous development and social innovation theories [5]. Fast Internet connections, cheaper drones, and 3D conversion software have made it realistic to share 3D models remotely via the Internet, facilitating the involvement of non-local stakeholders in planning. This approach should be interactive, rather than a one-way, potentially top-down, communication of landscape information. However, there is a lack of research on interactive, non-hierarchical communication between stakeholders regarding landscape. Furthermore, soliciting a variety of opinions on landscape is essential to improve collaboration among geographically dispersed stakeholders, but again there is a knowledge gap in terms of obtaining diverse opinions via a 3D model.
This study uses 3D models as a tool to obtain diverse opinions on a local landscape from non-local stakeholders, meaning many unspecified people who have never seen and do not know the study village. Furthermore, we examine the usefulness of these opinions and the reality of using them in local landscape planning. Establishing a new way of incorporating the opinions of non-local stakeholders into plans for preserving and improving rural landscapes could contribute to tools for new rural governance. Based on the literature examined above, we set the following hypotheses:
Hypothesis 1.
3D models result in opinions from non-local stakeholders viewing a landscape at varied orientations, some of which are not possible for local people to see in person.
Hypothesis 2.
3D models result in diverse opinions on diverse elements being obtained from non-local stakeholders.
Hypothesis 3.
Opinions from non-local stakeholders on 3D models are useful and realistic for local landscape planning.
Hypothesis 1 and 2 examine the technical potential of 3D models shared online for collecting diverse opinions from remote people. Hypothesis 3, furthermore, extrapolates from the technical potential to examine how useful and realistic the obtained opinions are for local landscape planning by having the opinions evaluated by local participants. We investigated these hypotheses by creating 3D models of a case study village in Japan and obtaining external opinions on the landscapes through an online questionnaire. In the following sections of this paper, we explain our materials and methods (Section 2) and results (Section 3). These results are then discussed in Section 4, and finally we draw conclusions in Section 5.
2. Materials and Methods
2.1. Study Area
We selected a rural village, Shimo-Okubo, located in the middle of Kyoto Prefecture, Japan, as the study area. The population of Japan has fallen continuously since 2008 [48], and rural areas particularly have faced more severe conditions of aging and depopulation. To address the lack of human resources and facilitate innovative ideas to cope with this difficulty, national and local governments have introduced policy programs to encourage multi-actor cooperation in rural development. The rural landscape, which is referred to as “satoyama” in Japan, induces nostalgia or a relaxed feeling in many Japanese people, as the history and culture of Japan was established through 2000 years of rice cultivation. A growing number of youth are interested in living in rural areas [49].
The study village is surrounded by mountains, and a majority of the land is farmland. As of 2010, the population was 175, composed of 63 households. This is a 13% decline in population from 2005. The proportion of older adults (over 65) reached 33.1% as of 2010, and this proportion is expected to rise. Therefore, Shimo-Okubo can be characterized as a typical disadvantaged rural village in Japan, suffering from a declining and aging population. From January to March 2010, a series of workshops were held in this village as part of a rural revitalization program supported by the Kyoto prefectural government and with advice from a professor of Kyoto Gakuen University. The workshops included villagers, government officials, and others, and were held to create and implement a new landscape plan. Twenty to 40 people participated in each of the workshops. During the workshops, the participants created a plan for the local landscape and subsequently proceeded to implement the plan through planting flowers and trees, cleaning up the villages, designating landmarks, and building signboards at appropriate places in the village. Throughout this experience, the village was particularly concerned with landscape planning for regional promotion and revitalization. In 2010, the village formed a new regional group named “Niji-no-muradukuri-no-kai” or “Rainbow village creation group” (henceforth referred to as “muradukuri-kai”), which is involved in regional revitalization activities.
2.2. 3D Visualization Method
In this study, we used a drone and 3D conversion software to visualize and present a rural landscape.
- Drone: Phantom 3 Standard (DJI Co., Ltd., Shenzhen, China, 2015)
- Drone flight planning application: Pix4Dcapture (Pix4D S.A., Lausanne, Switzerland, 2015)
- 3D conversion software: Photoscan Professional (Agisoft LLC, St. Petersburg, Russia, 2010)
We created 3D models by processing numerous still aerial images taken by a drone. Below are five anticipated advantages of using a drone and 3D models in landscape planning.
- Portability: 3D models are easily shared and viewed on the Internet
- Realism: 3D models are more realistic than presentations from other formats
- Flexibility: 3D models created with a drone have fewer limits on shooting location
- Interactivity: 3D models enable viewers to change the orientation of the model at their discretion
- Operability and economic efficiency: 3D models are created more easily, and at a lower cost, than with previous methods
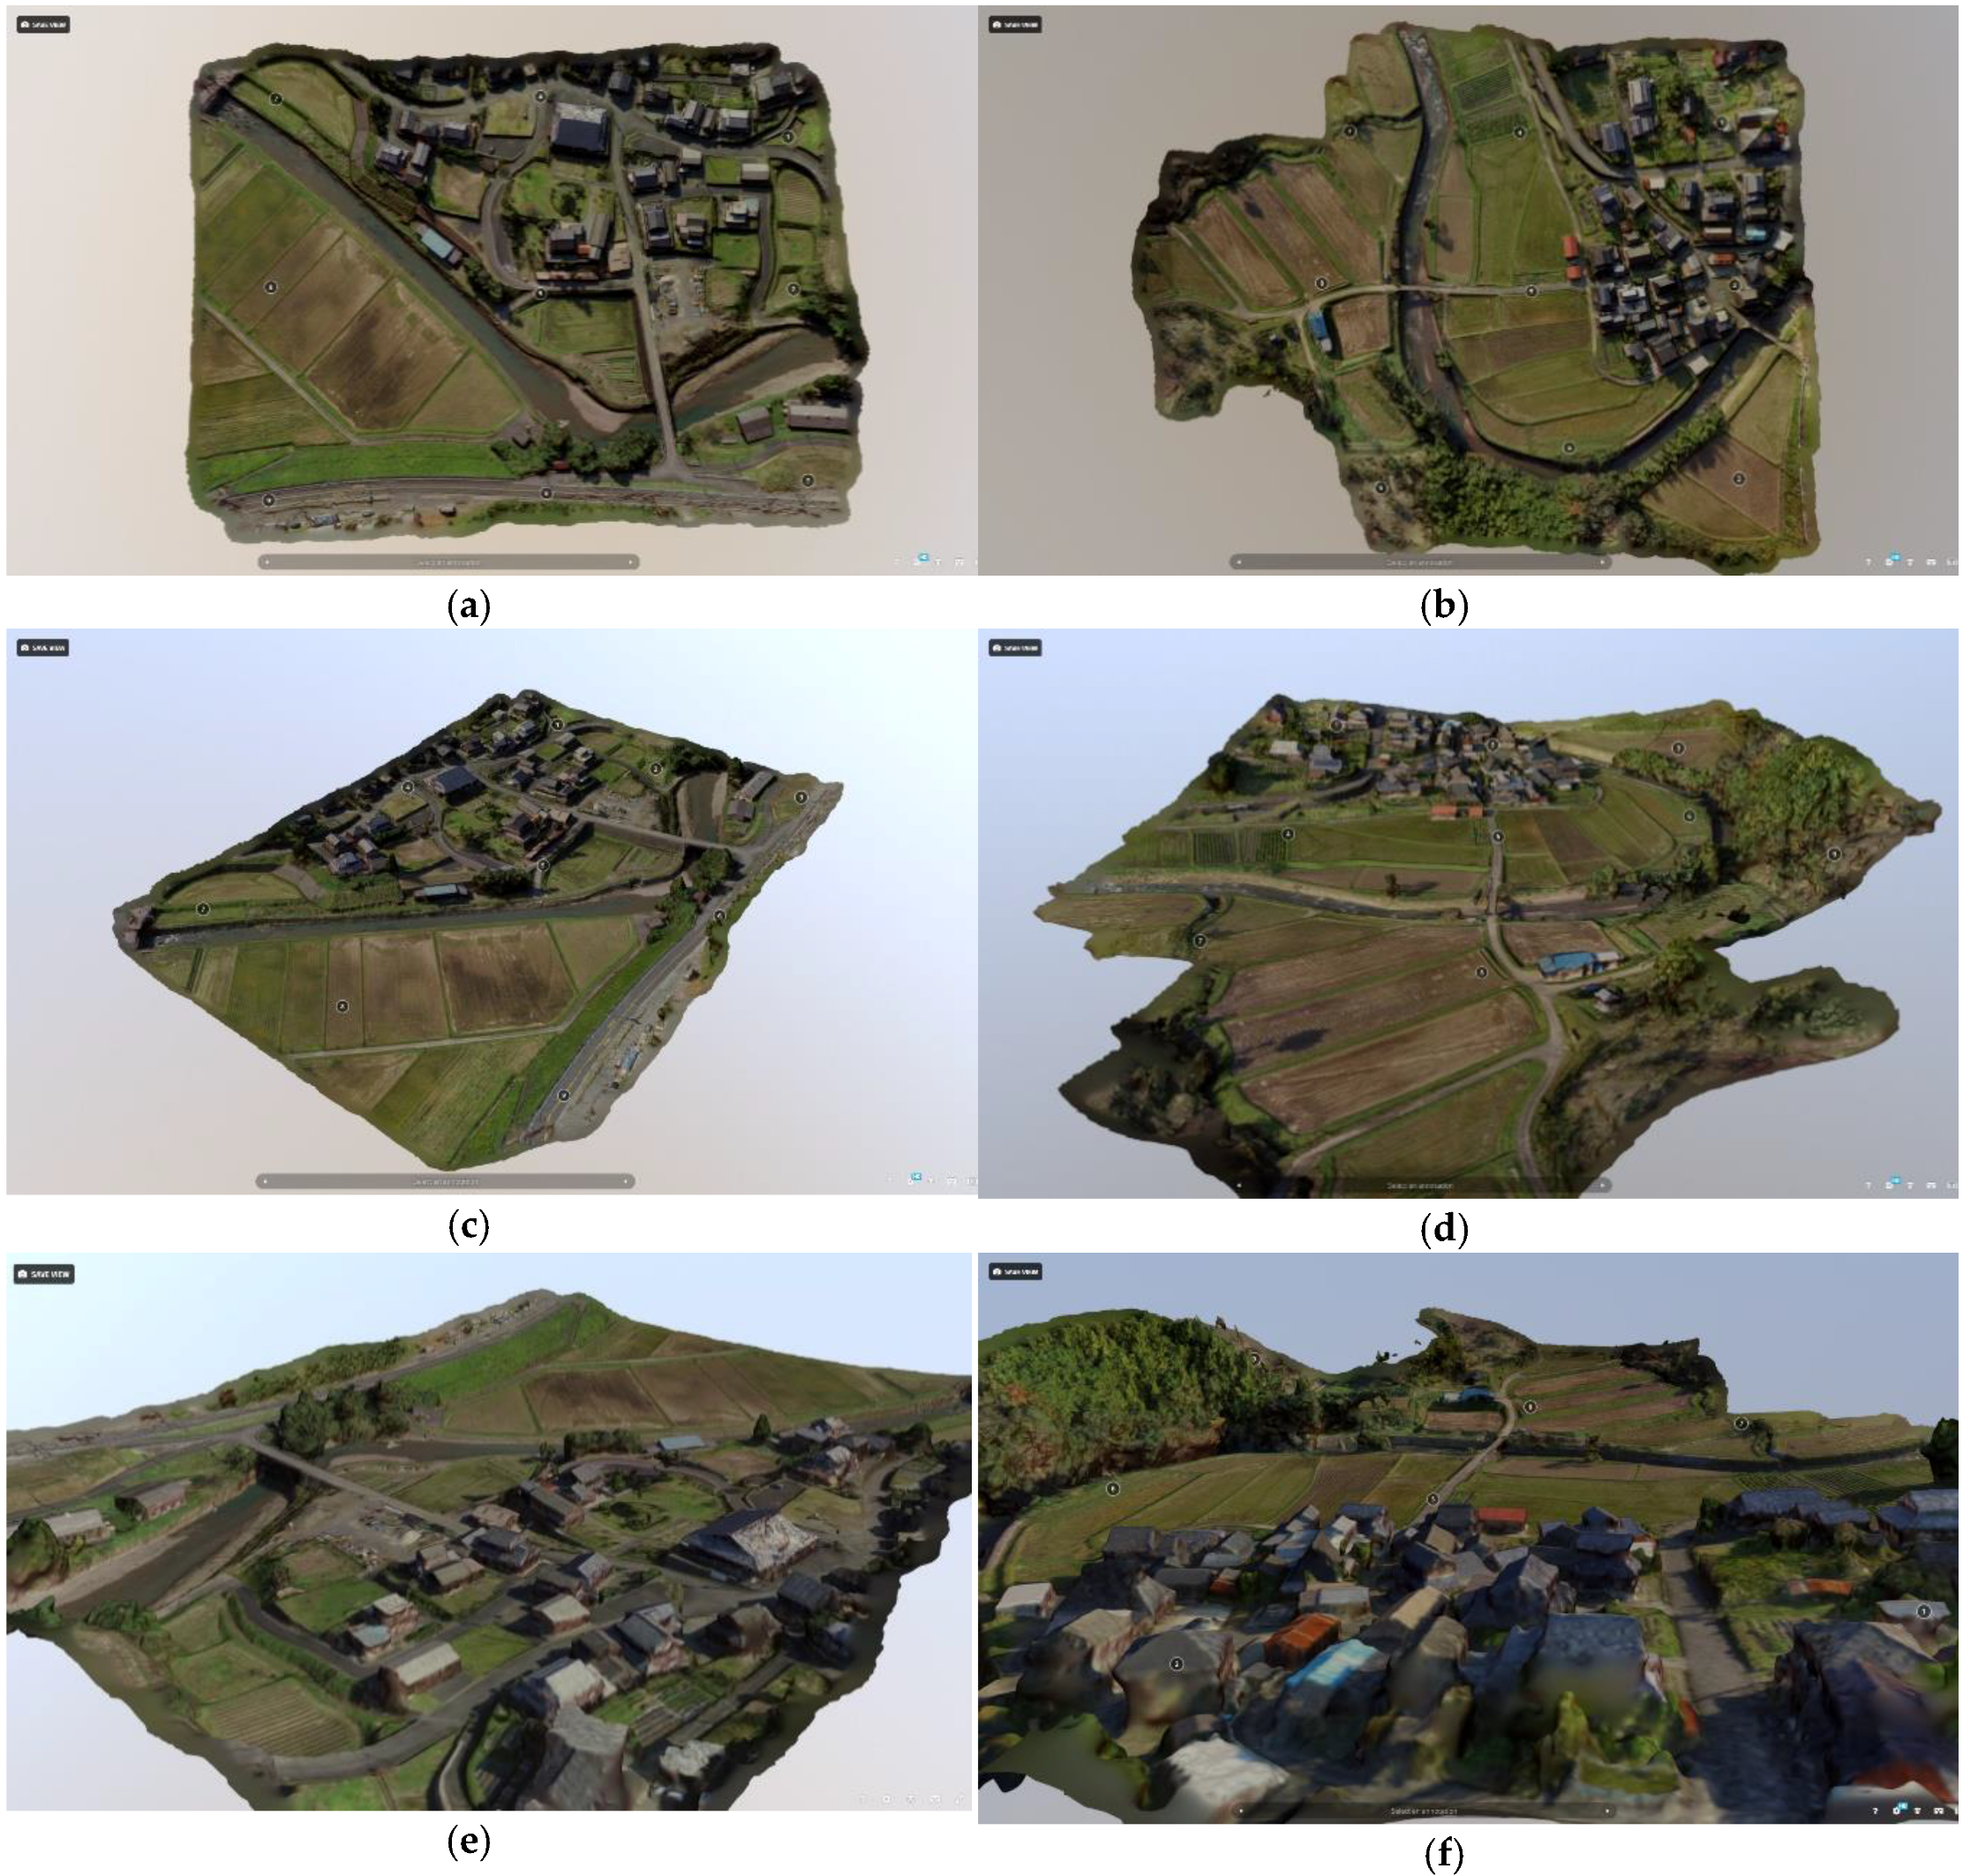
After obtaining permission to fly a drone in the study village, we interviewed a leader of the muradukuri-kai regarding the village landscape and to obtain more details about the landscape planning process. Based on this interview, we selected two target landscapes for this study. The first is in the north of the village and has an area of 239 × 162 m; the other is the south of the village with an area of 199 × 170 m. The selected landscapes are referred to throughout this paper as “Landscape I” and “Landscape II”, respectively. We took 379 aerial images of the landscape and 390 images from a height of 50 m on 26 October 2017, when the weather was fine with no clouds in the sky. The images were captured between 12.00–3.00 p.m., when the effect of shadows was minimized. Some landscape images captured from these 3D models are shown in Figure 1. Both landscapes include settlements, farmland, terraced paddy fields, a river, forests, and roads. They also include landmarks such as flower gardens (Landscape I); an old, traditional temple; and a symbol tree of the village (Landscape II). The images obtained from the drone were processed with Photoscan 3D conversion software to create the 3D models. The 3D conversion process using Photoscan mainly included three steps after importing aerial images: (1) aligning photos, (2) building a dense point cloud, and (3) computing geometry. In the quality settings for aligning photos and building a dense point cloud, we needed to choose one from five levels: lowest, low, medium, high, and highest. After trying each level, we decided to use the low level for Step 1 and Step 2 to reduce the data size needed to share the models on a 3D model sharing site (see Section 2.3.1. for the detail), since we observed that it was not possible to manipulate 3D models created at higher qualities smoothly, and even low-quality conversion was relevant for this survey. Table 1 shows the parameters of the created 3D landscape models.
2.3. Online Questionnaire Survey
2.3.1. Survey Format
To obtain non-local stakeholders’ opinions on the two selected landscapes through 3D models, we commissioned an online questionnaire survey with the aim of obtaining objective, novel opinions from non-local stakeholders who have never seen either landscape. We targeted people, aged 18–69, who lived outside Kyoto Prefecture. Online questionnaire surveys have been widely used since the 1990s. Some advantages of online survey include accessibility to groups or individuals who are difficult to reach through other channels, time saving, and cost efficiency [50]. On the other hand, researchers need to consider potential disadvantages, such as less sampling validity, drop-out, non-response, and invalid answers [50,51]. To get reliable data, we used one of the leading research companies in Japan—Cross Marketing Inc.—which has abundant experience with online surveys for academic research. To minimize the expected biases in gender or age, we employed a quota sampling method to choose samples with equal distributions of gender and age groups. While an issue with sampling has been reported, the questionnaire was not designed for statistical analysis, but to obtain a variety of opinions from non-local stakeholders that can be discussed with local inhabitants. In the questionnaire, respondents were given access, via the popular 3D model sharing site Sketchfab, to the 3D models we created. This meant respondents could access and answer the questions while looking at the 3D models. We used the paid premium service of Sketchfab, which allowed users to upload up to 500 MB per model, since the free basic service allowed only 50 MB per model. The respondents first accessed a page with questions about their primary attributes, enabling us to select respondents who met our inclusion criteria. The respondents who passed the screening proceeded to the main questionnaire page. The main questions are summarized in Table 2. At the time of the survey, we could not find any examples of online questionnaires using 3D models and information about the perspective these models were viewed from to obtain opinions from respondents. Our method can therefore be considered an original method of landscape evaluation. Since our participants were unlikely to be familiar with the technique, we provided detailed instructions, including examples, on how to respond to the questions.
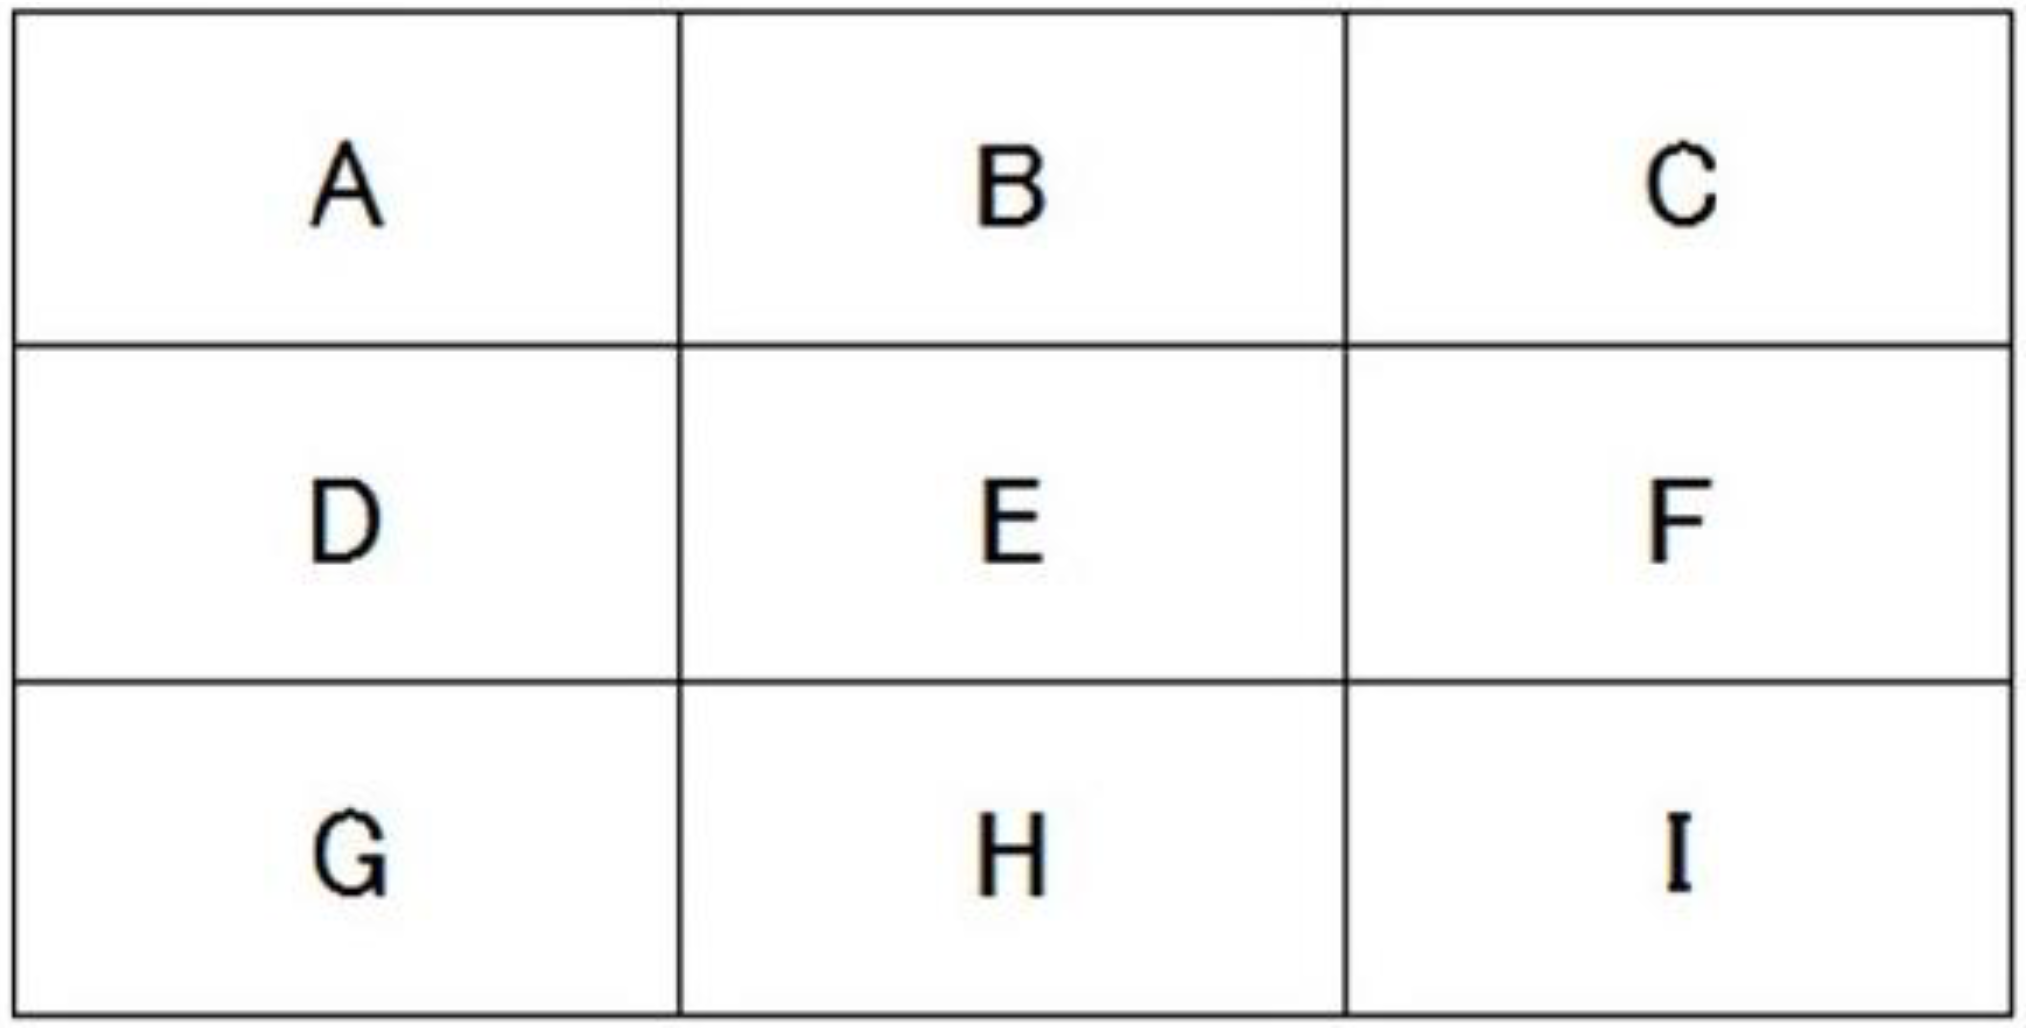
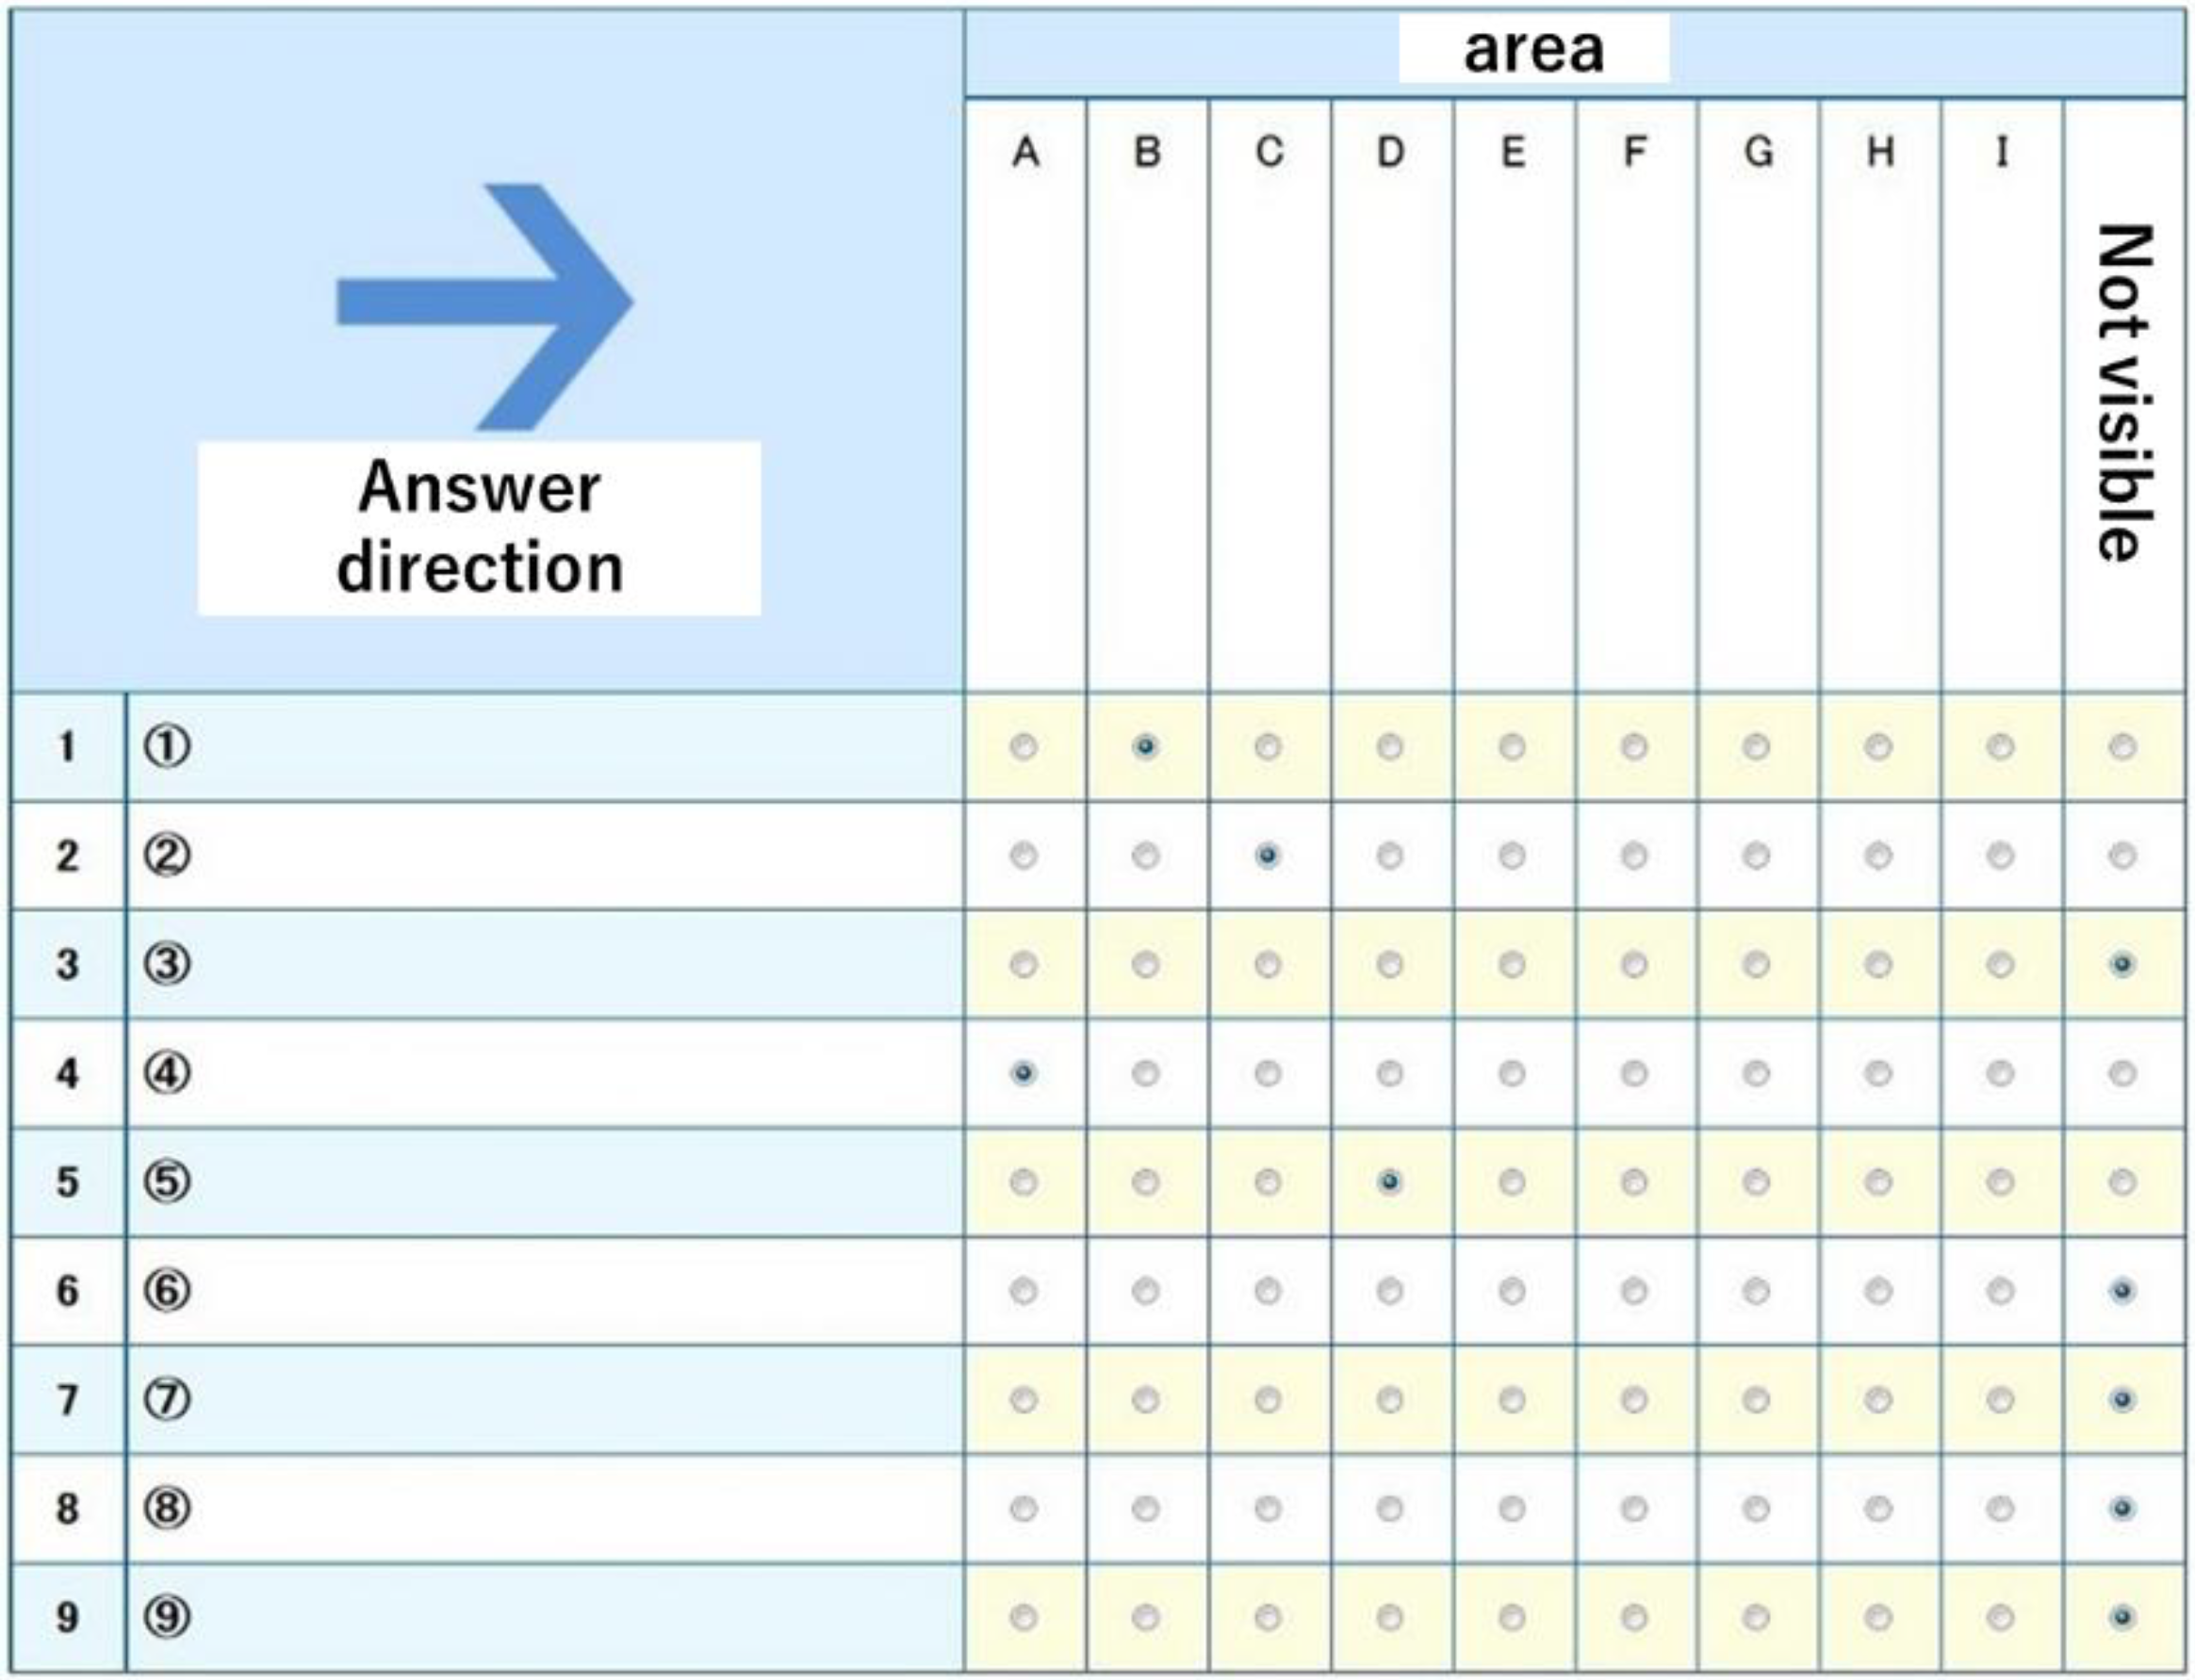
There were two types of questions: orientation and opinion. Each opinion question, which centered on the respondents’ opinion of the landscape, was necessarily preceded by an orientation question, to understand how respondents were viewing the model when answering. Respondents could freely change the orientation from which they viewed each model. Landmarks were marked on each model using nine numeric tags (see Figure 2). When participants changed the orientation of the model, the landmarks moved into different areas of a grid which overlaid the model (see Figure 3). Respondents reported the position of each tag within the grid through “orientation” questions (see Figure 4 and Table 2: Q1_1, Q1_3, Q2_1, Q2_3). This enabled us to understand the perspective they were viewing when responding to each opinion question. The “opinion” questions, in which participants evaluated the landscape, asked respondents to give both positive and negative opinions on the two landscapes and reasons for their opinions in a free, descriptive form with over 30 Japanese characters (see Table 2: Q1_2, Q1_4, Q2_2, Q2_4).
2.3.2. Data Analysis
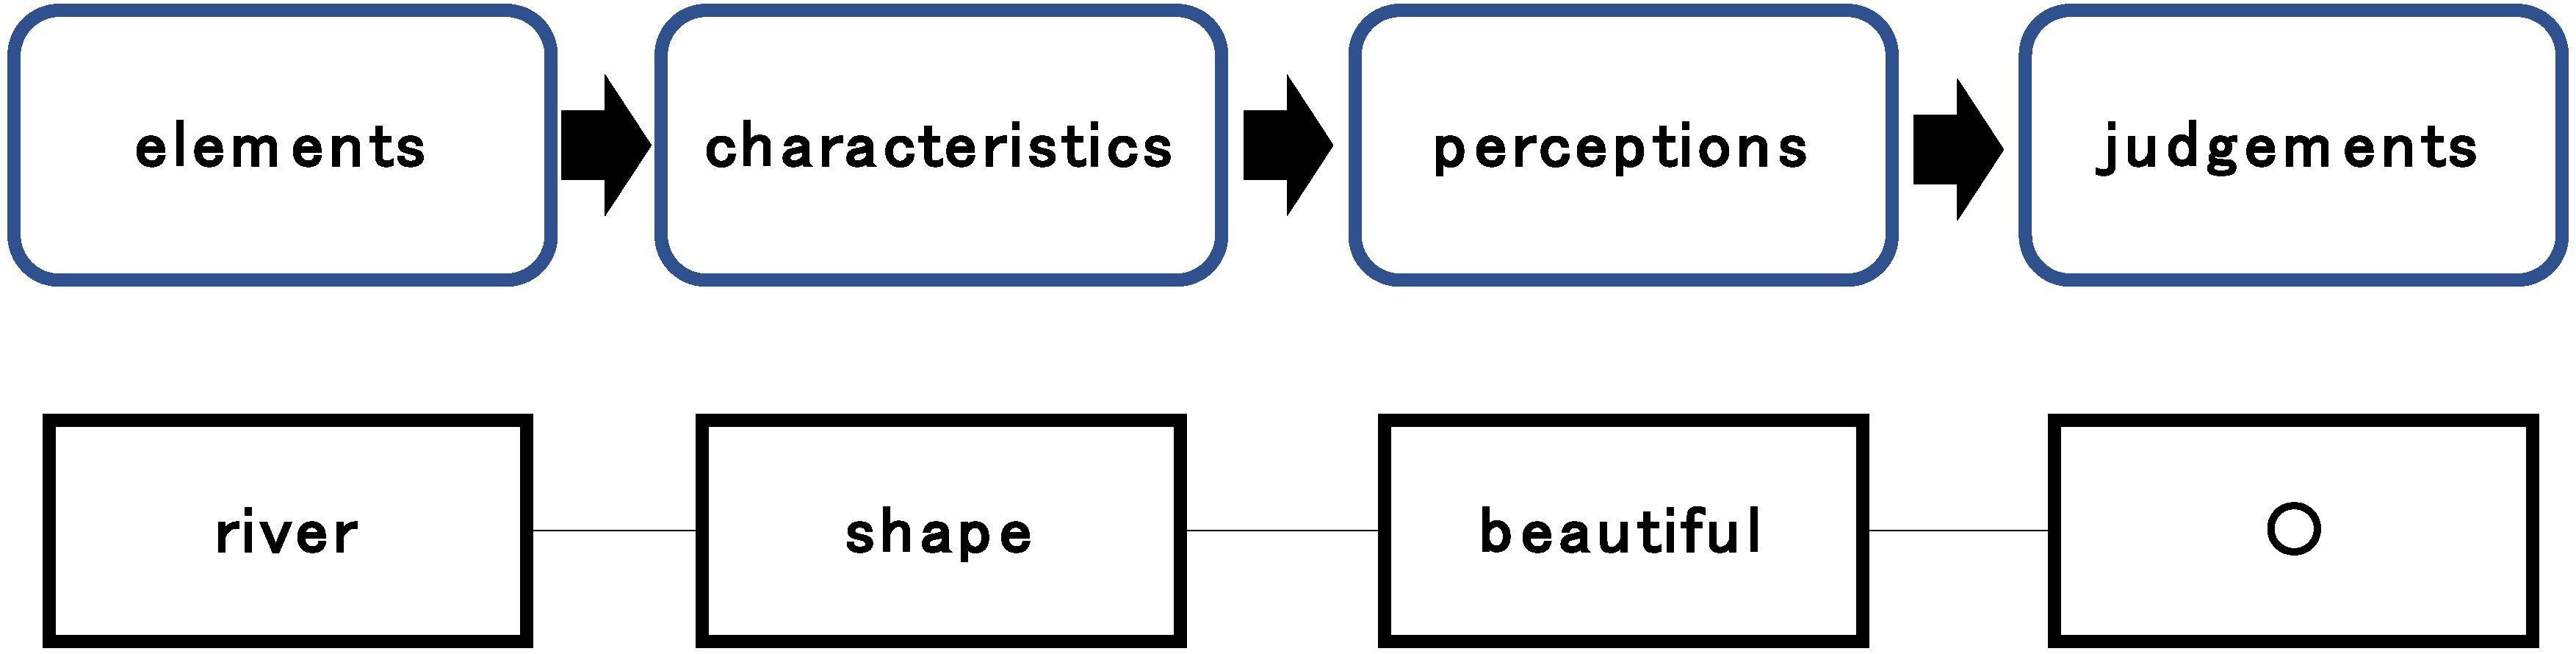
We used Microsoft Excel for data aggregation. To analyze the responses to the opinion questions, we employed the caption evaluation method [52,53]. In this method, text is analyzed for the appearance of three components: element, characteristics of the element, and perception of the characteristics of the element. Each opinion given regarding these three components is then categorized by topic. The categories, such as “surface” and “nature” for elements, developed based on the responses we got. As shown in Figure 5, the four components: element, characteristics, perception, and judgment are connected in order to form one unit of landscape evaluation. Some of the responses had “errors”: sentences with no element; sentences regarding the whole landscape, which were not based on a given orientation; or sentences with multiple elements. For those answers, we created and followed the rules below:
- If there were no elements in a sentence, we considered the landscape which was specified by the orientation questions to be an element. For a sentence without characteristics and perceptions, we left the corresponding fields blank.
- If the sentence did not make sense or did not show clear opinions, we considered it as an unknown element. We left the characteristics and perceptions fields blank.
- If one sentence had multiple elements, we considered all the elements and adopted all the characteristics and perceptions in the sentence. If one sentence had multiple elements, characteristics, and perceptions, we carefully considered appropriate combinations.
- If multiple sentences had opposite perceptions, we categorized the sentences into one category.
2.4. Workshop with Villagers
We carefully checked the results from the online questionnaire and selected typical opinions from our findings. From 7:30 to 11:00 p.m. on 21 December 2017, we held a workshop to have local key stakeholders who had actively participated in past landscape planning in the village evaluate non-local stakeholders’ opinions. We used the workshop to examine how useful and realistic the non-local stakeholders’ opinions are for local landscape planning and to clarify the challenges of using 3D models for landscape planning that includes remote stakeholders.
3. Results
We collected 115 usable responses from the online questionnaire (respondents passed the screening questions and appropriately answered the main questions). Among them, 63 respondents were male and 52 female. The mean age of respondents was 41.6 years. Table 3 shows the age and gender distributions of the respondents. As a result of quota sampling, we can see that our samples had nearly equal proportions gender and age groups, with rather fewer samples of younger respondents.
3.1. Diversity of Orientations Viewed through 3D Models
The questionnaire resulted in a variety of opinions formed at diverse orientations. Table 4 shows the aggregated number of numeric tags placed in each of the grid squares for Landscape I, for both positive and negative opinions. Table 5 shows the same information for Landscape II.
In Table 4 and Table 5, we can see that each landscape tag was placed in a variety of grid squares for both landscapes. We can also see that some tag-grid combinations had many responses, including both positive and negative opinions. This indicates that for any given view of a landscape (each orientation of the model), the respondents had a variety of opinions. Some of the views were from specific locations such as a hilltop, road, or farmland, while others were from above.
3.2. Caption Evaluation Results
Through the caption evaluation method, this study found 15 elements, 11 characteristics, and 13 perceptions in total, for both landscapes. The following sections discuss in further detail the positive and negative opinions that were revealed regarding the elements, characteristics, and perceptions of Landscapes I and II.
3.2.1. Elements, Characteristics, and Perceptions of Landscape I
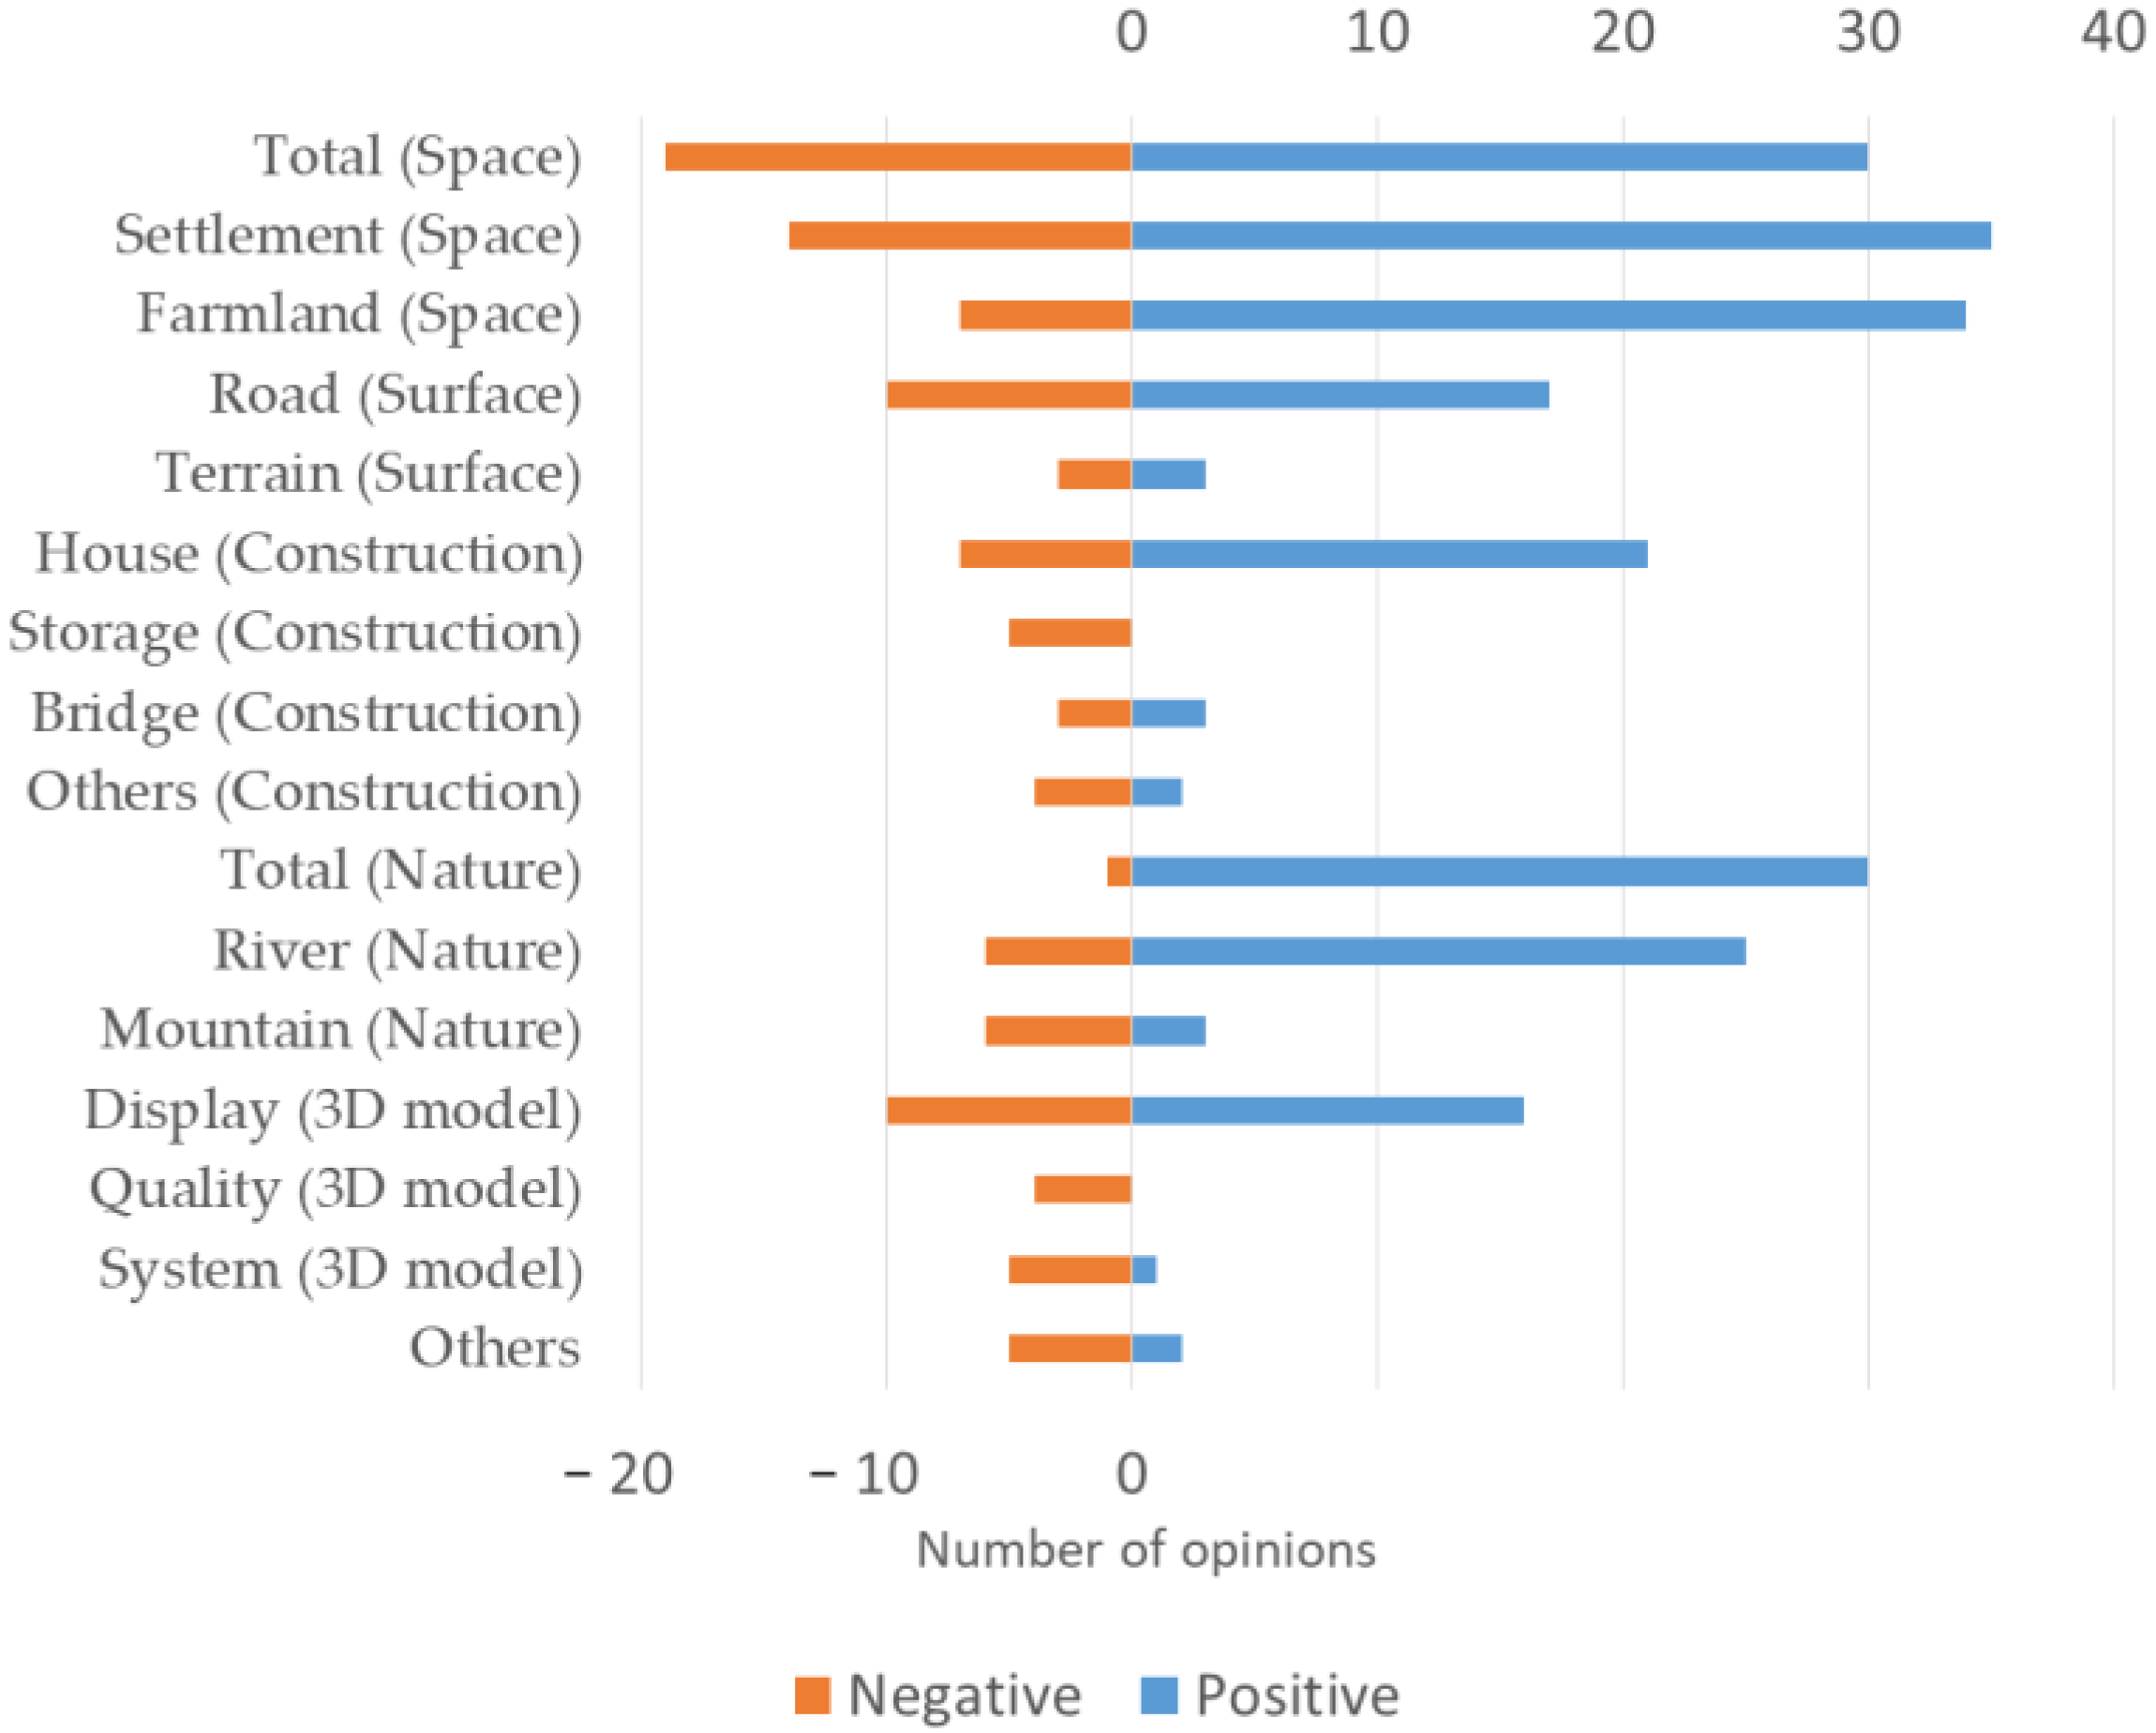
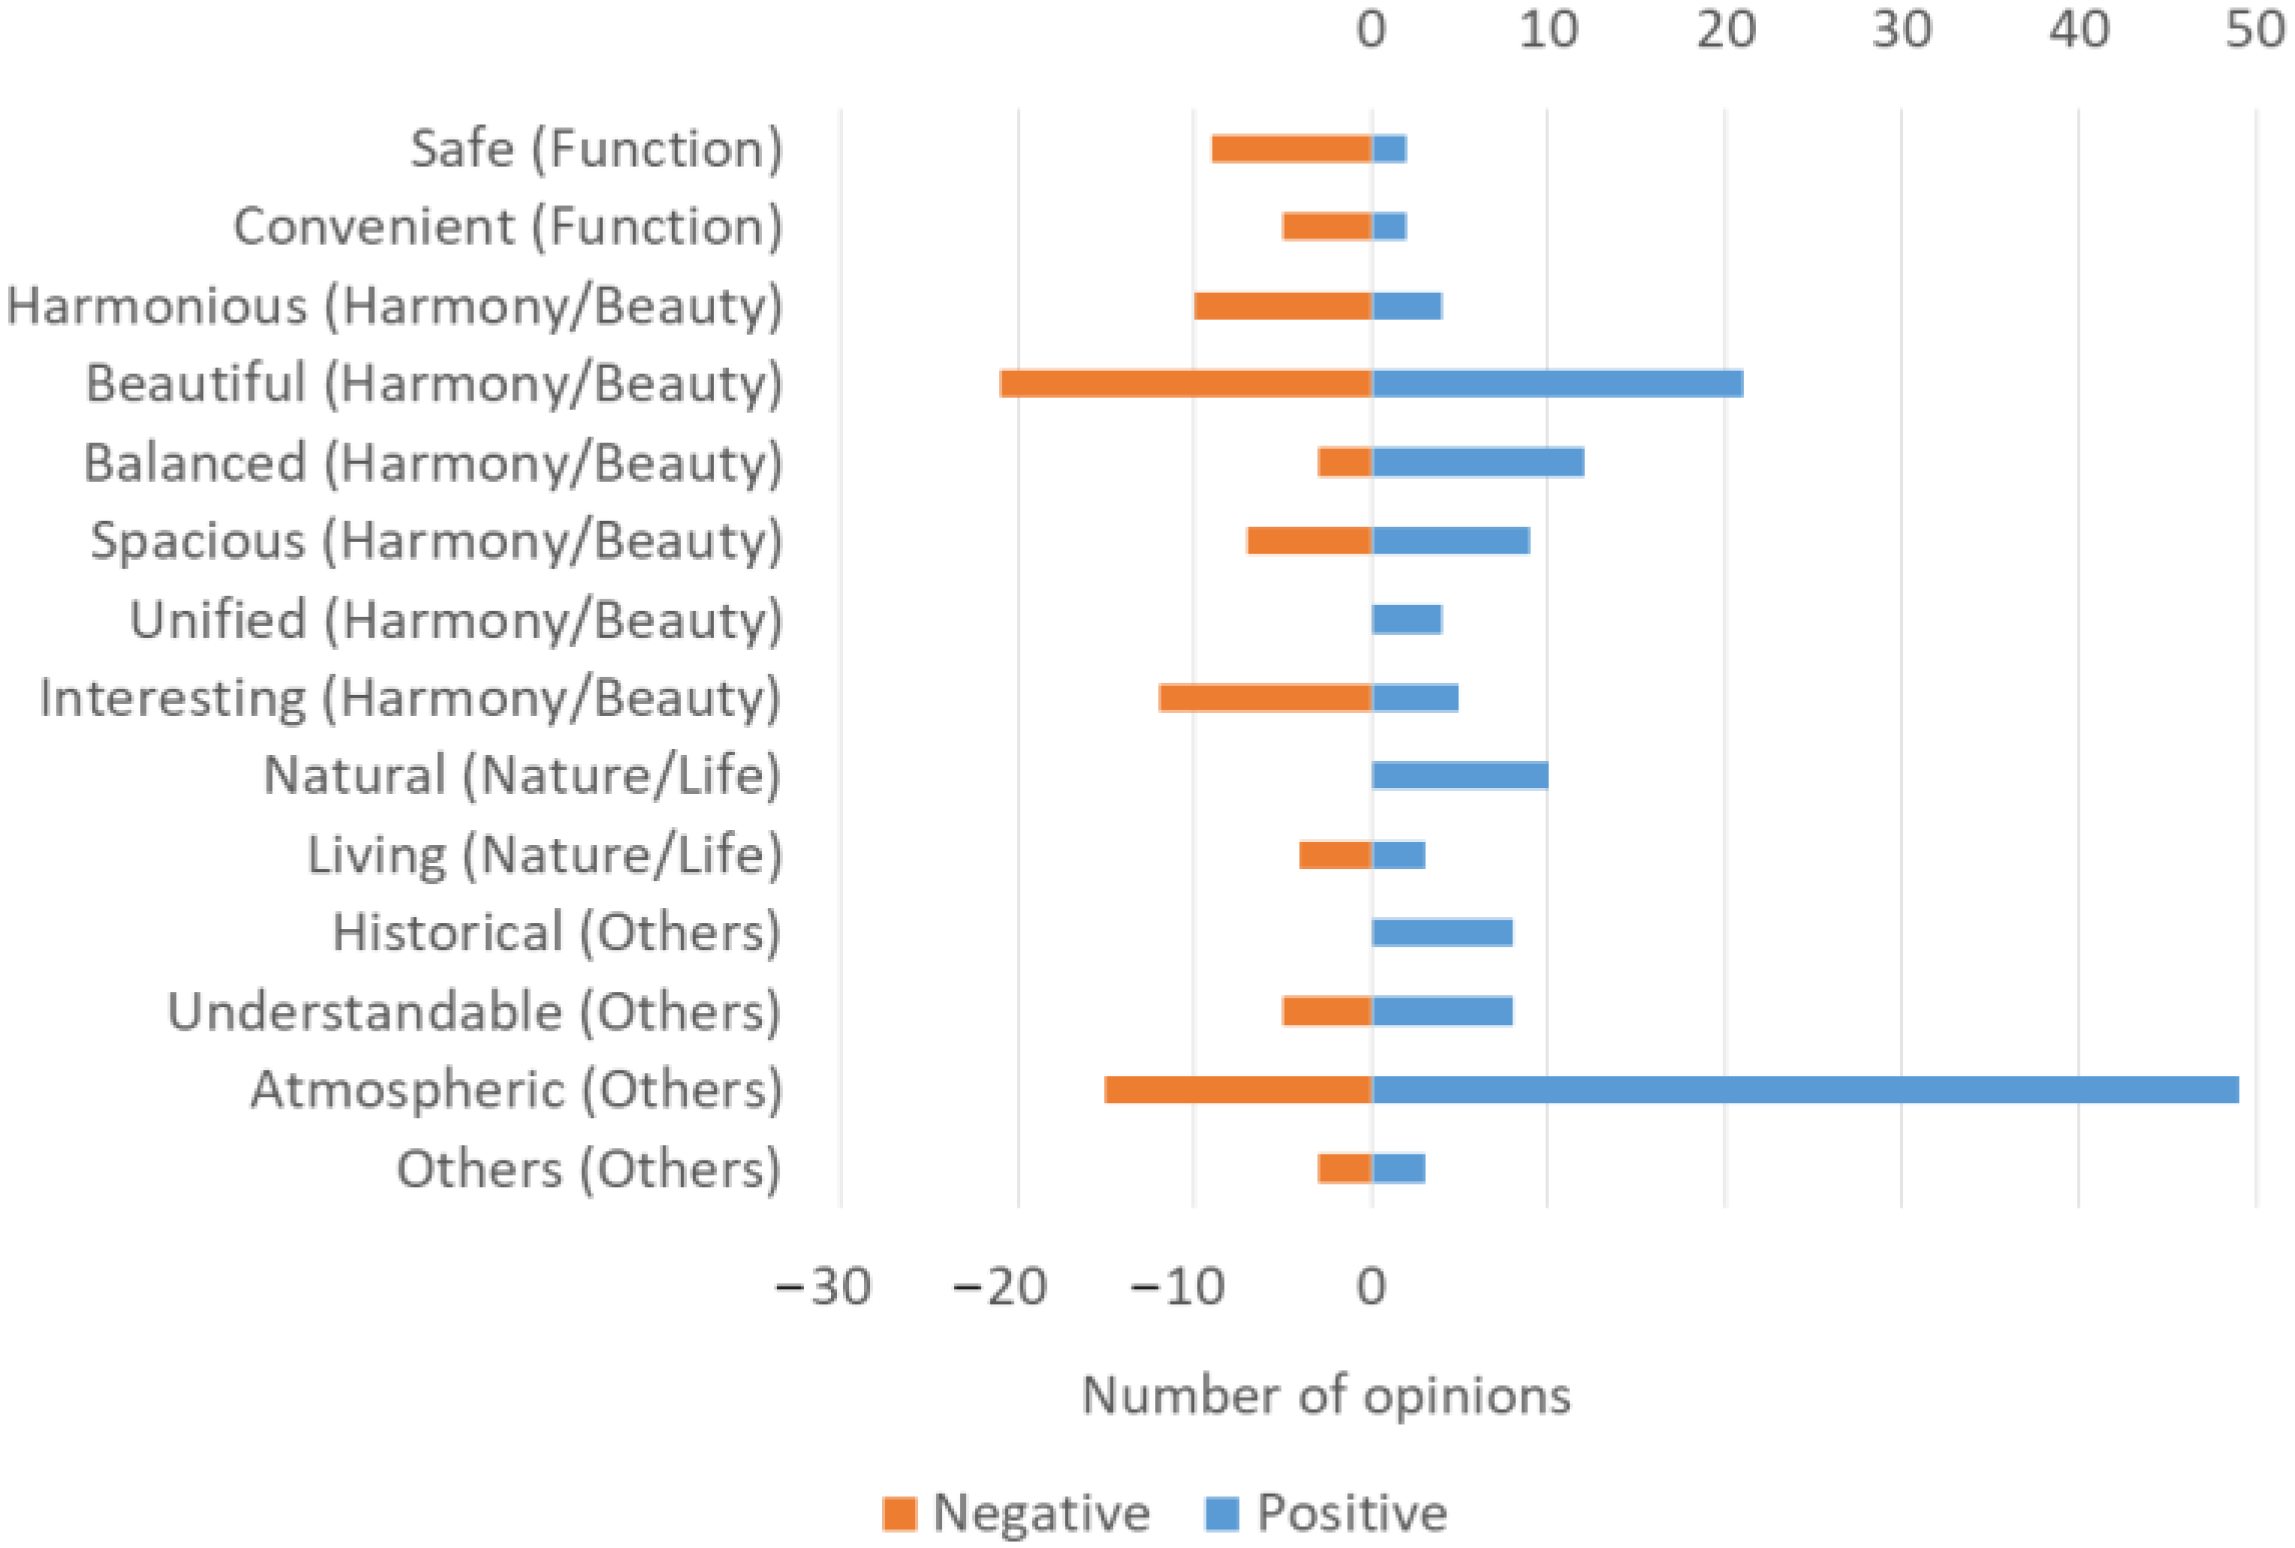
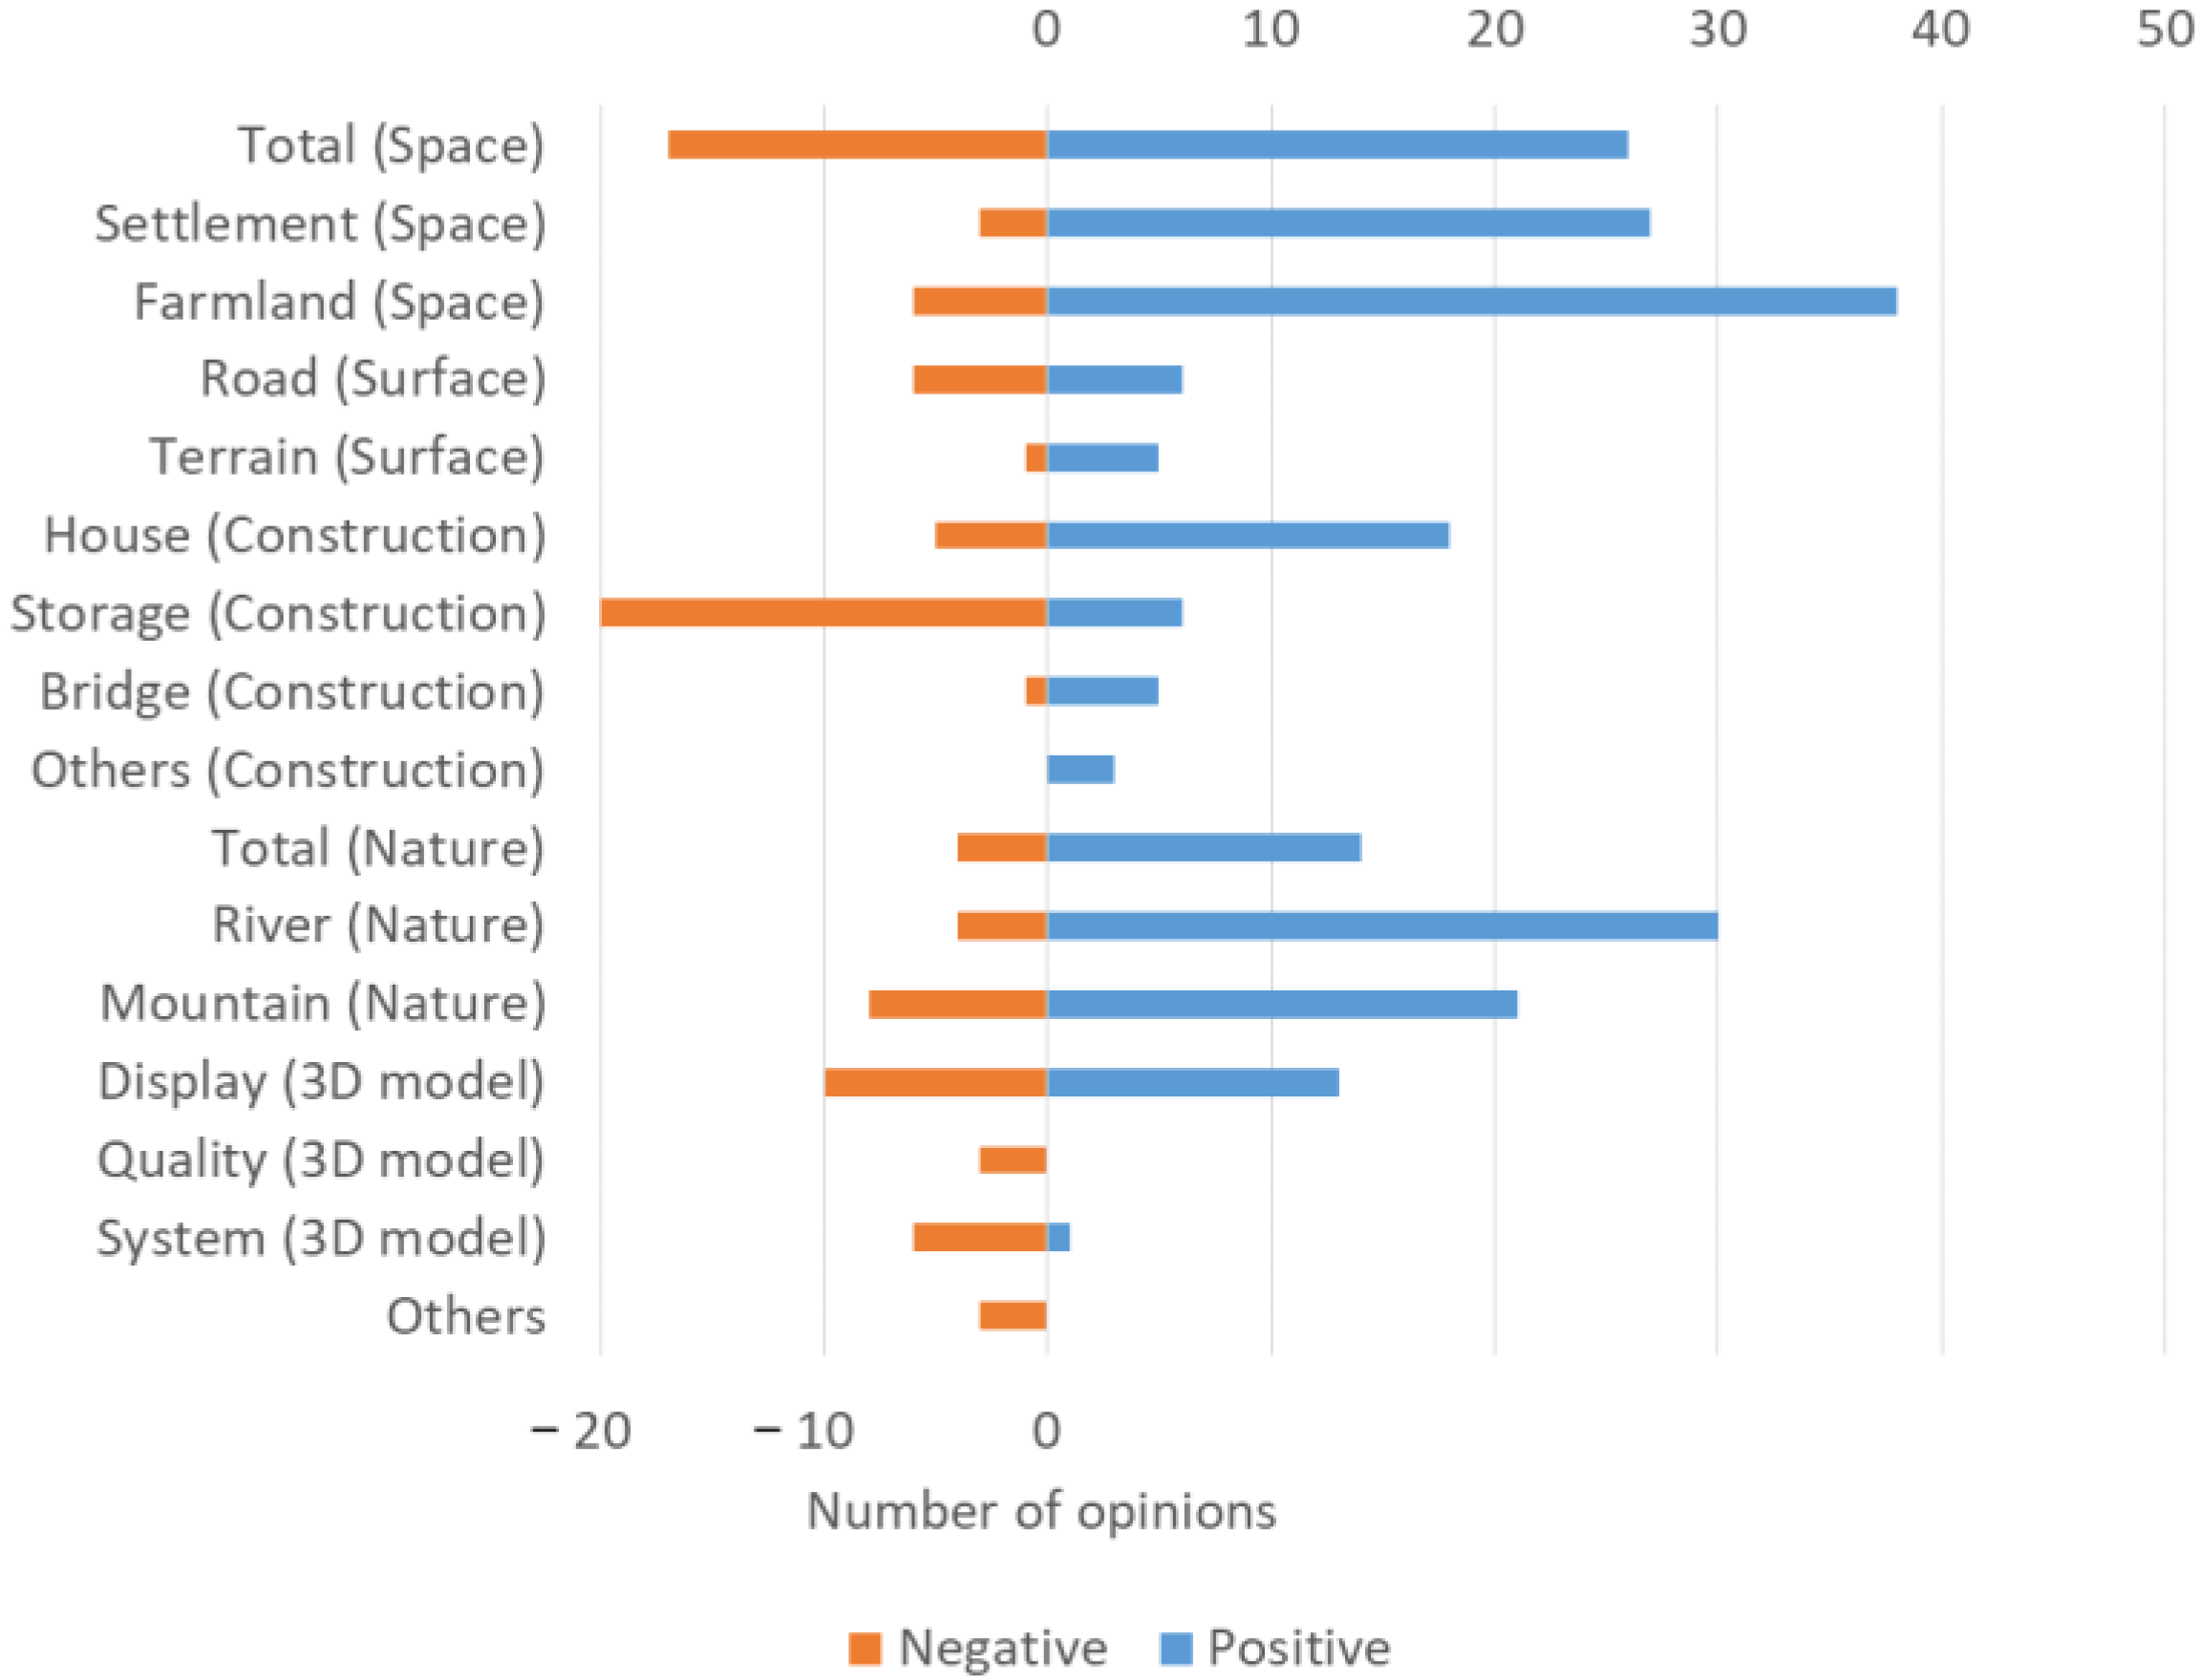
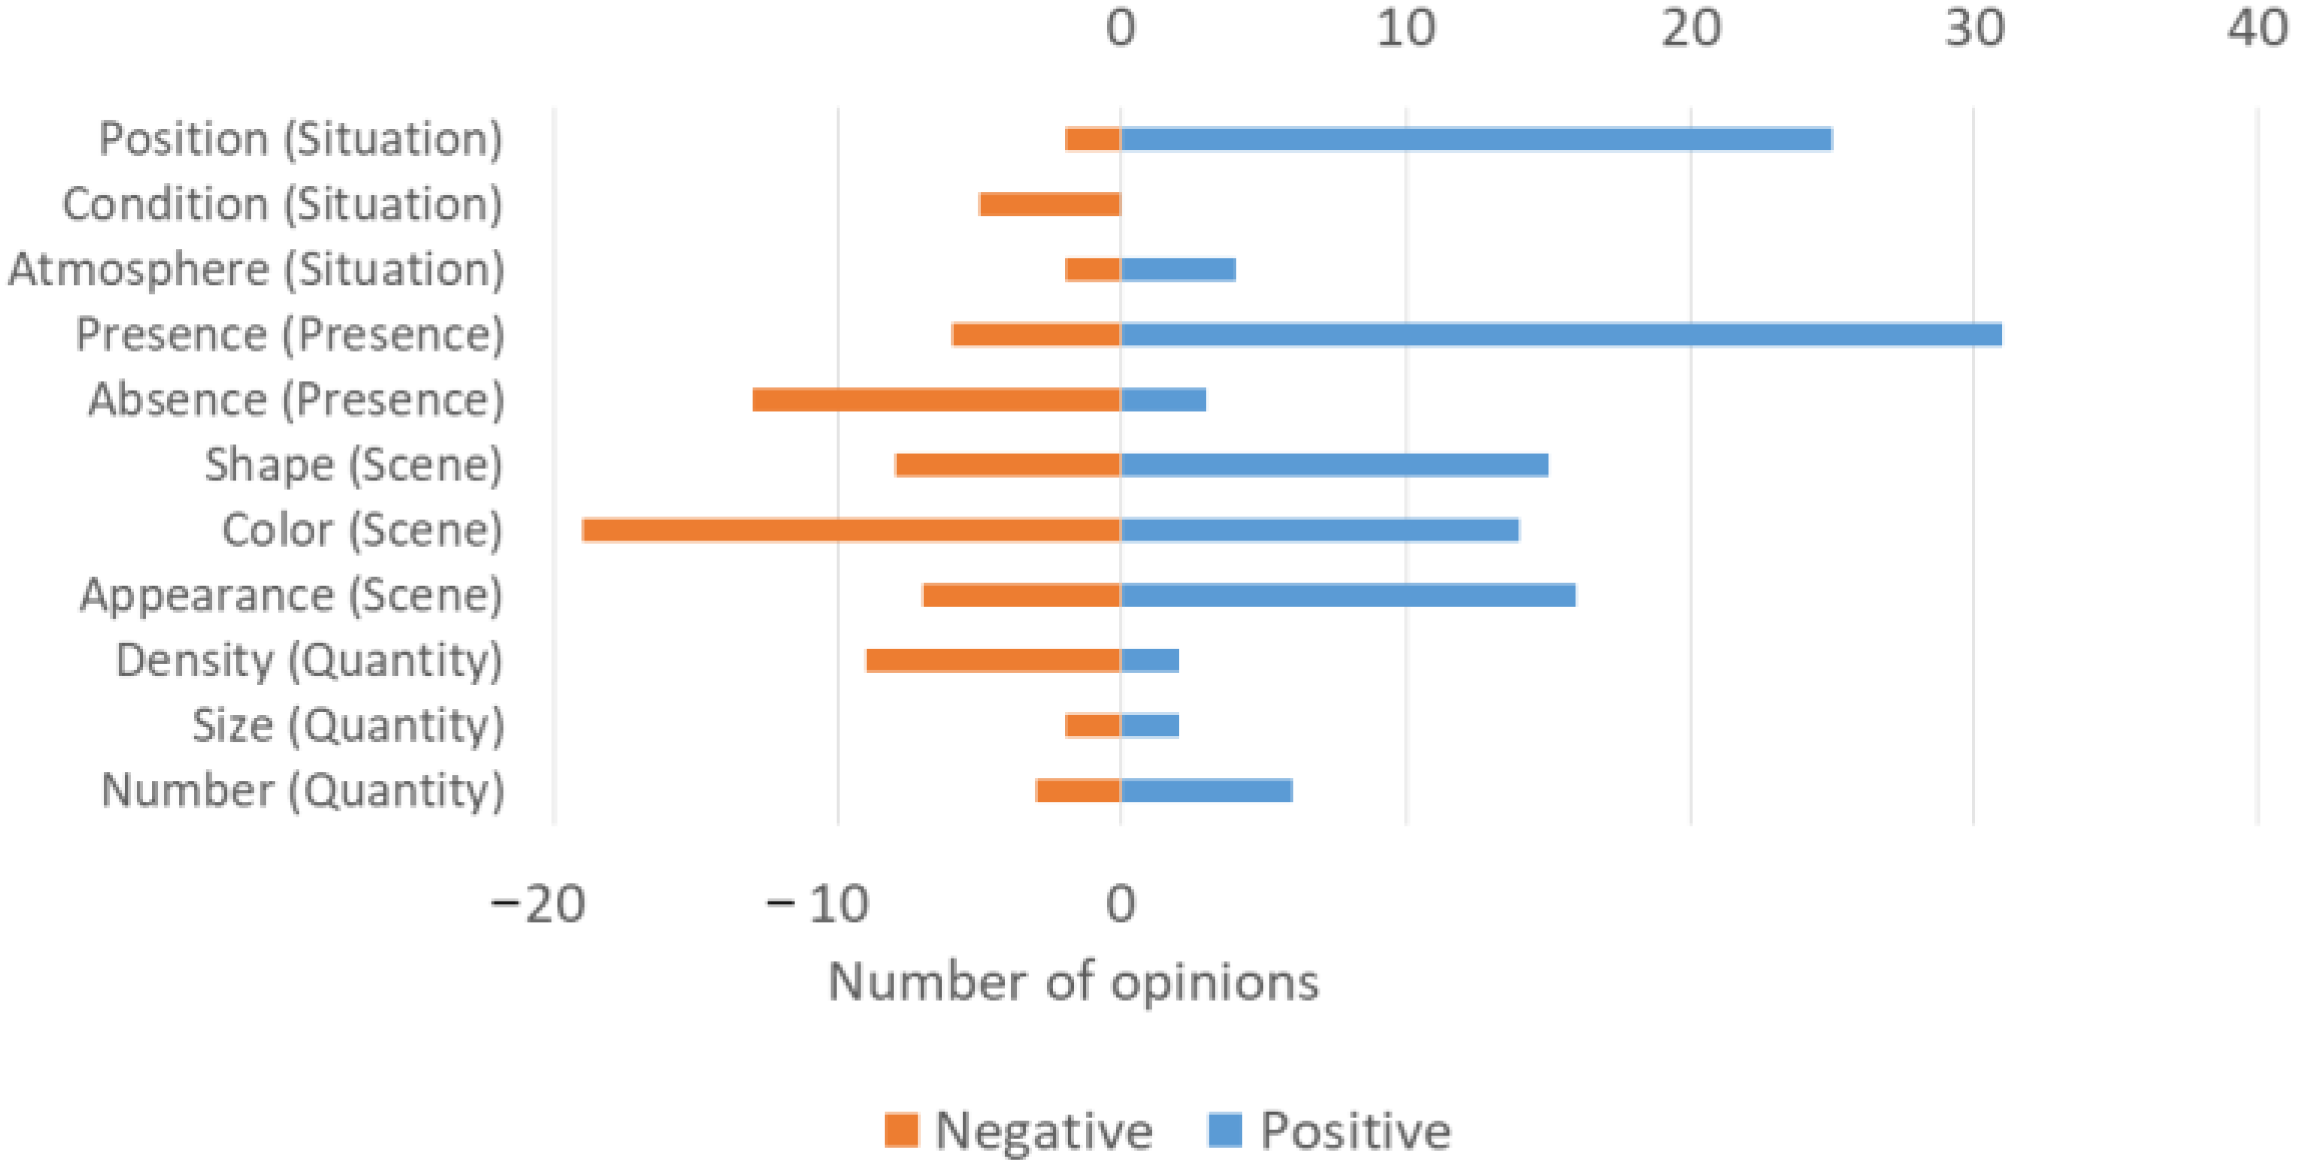
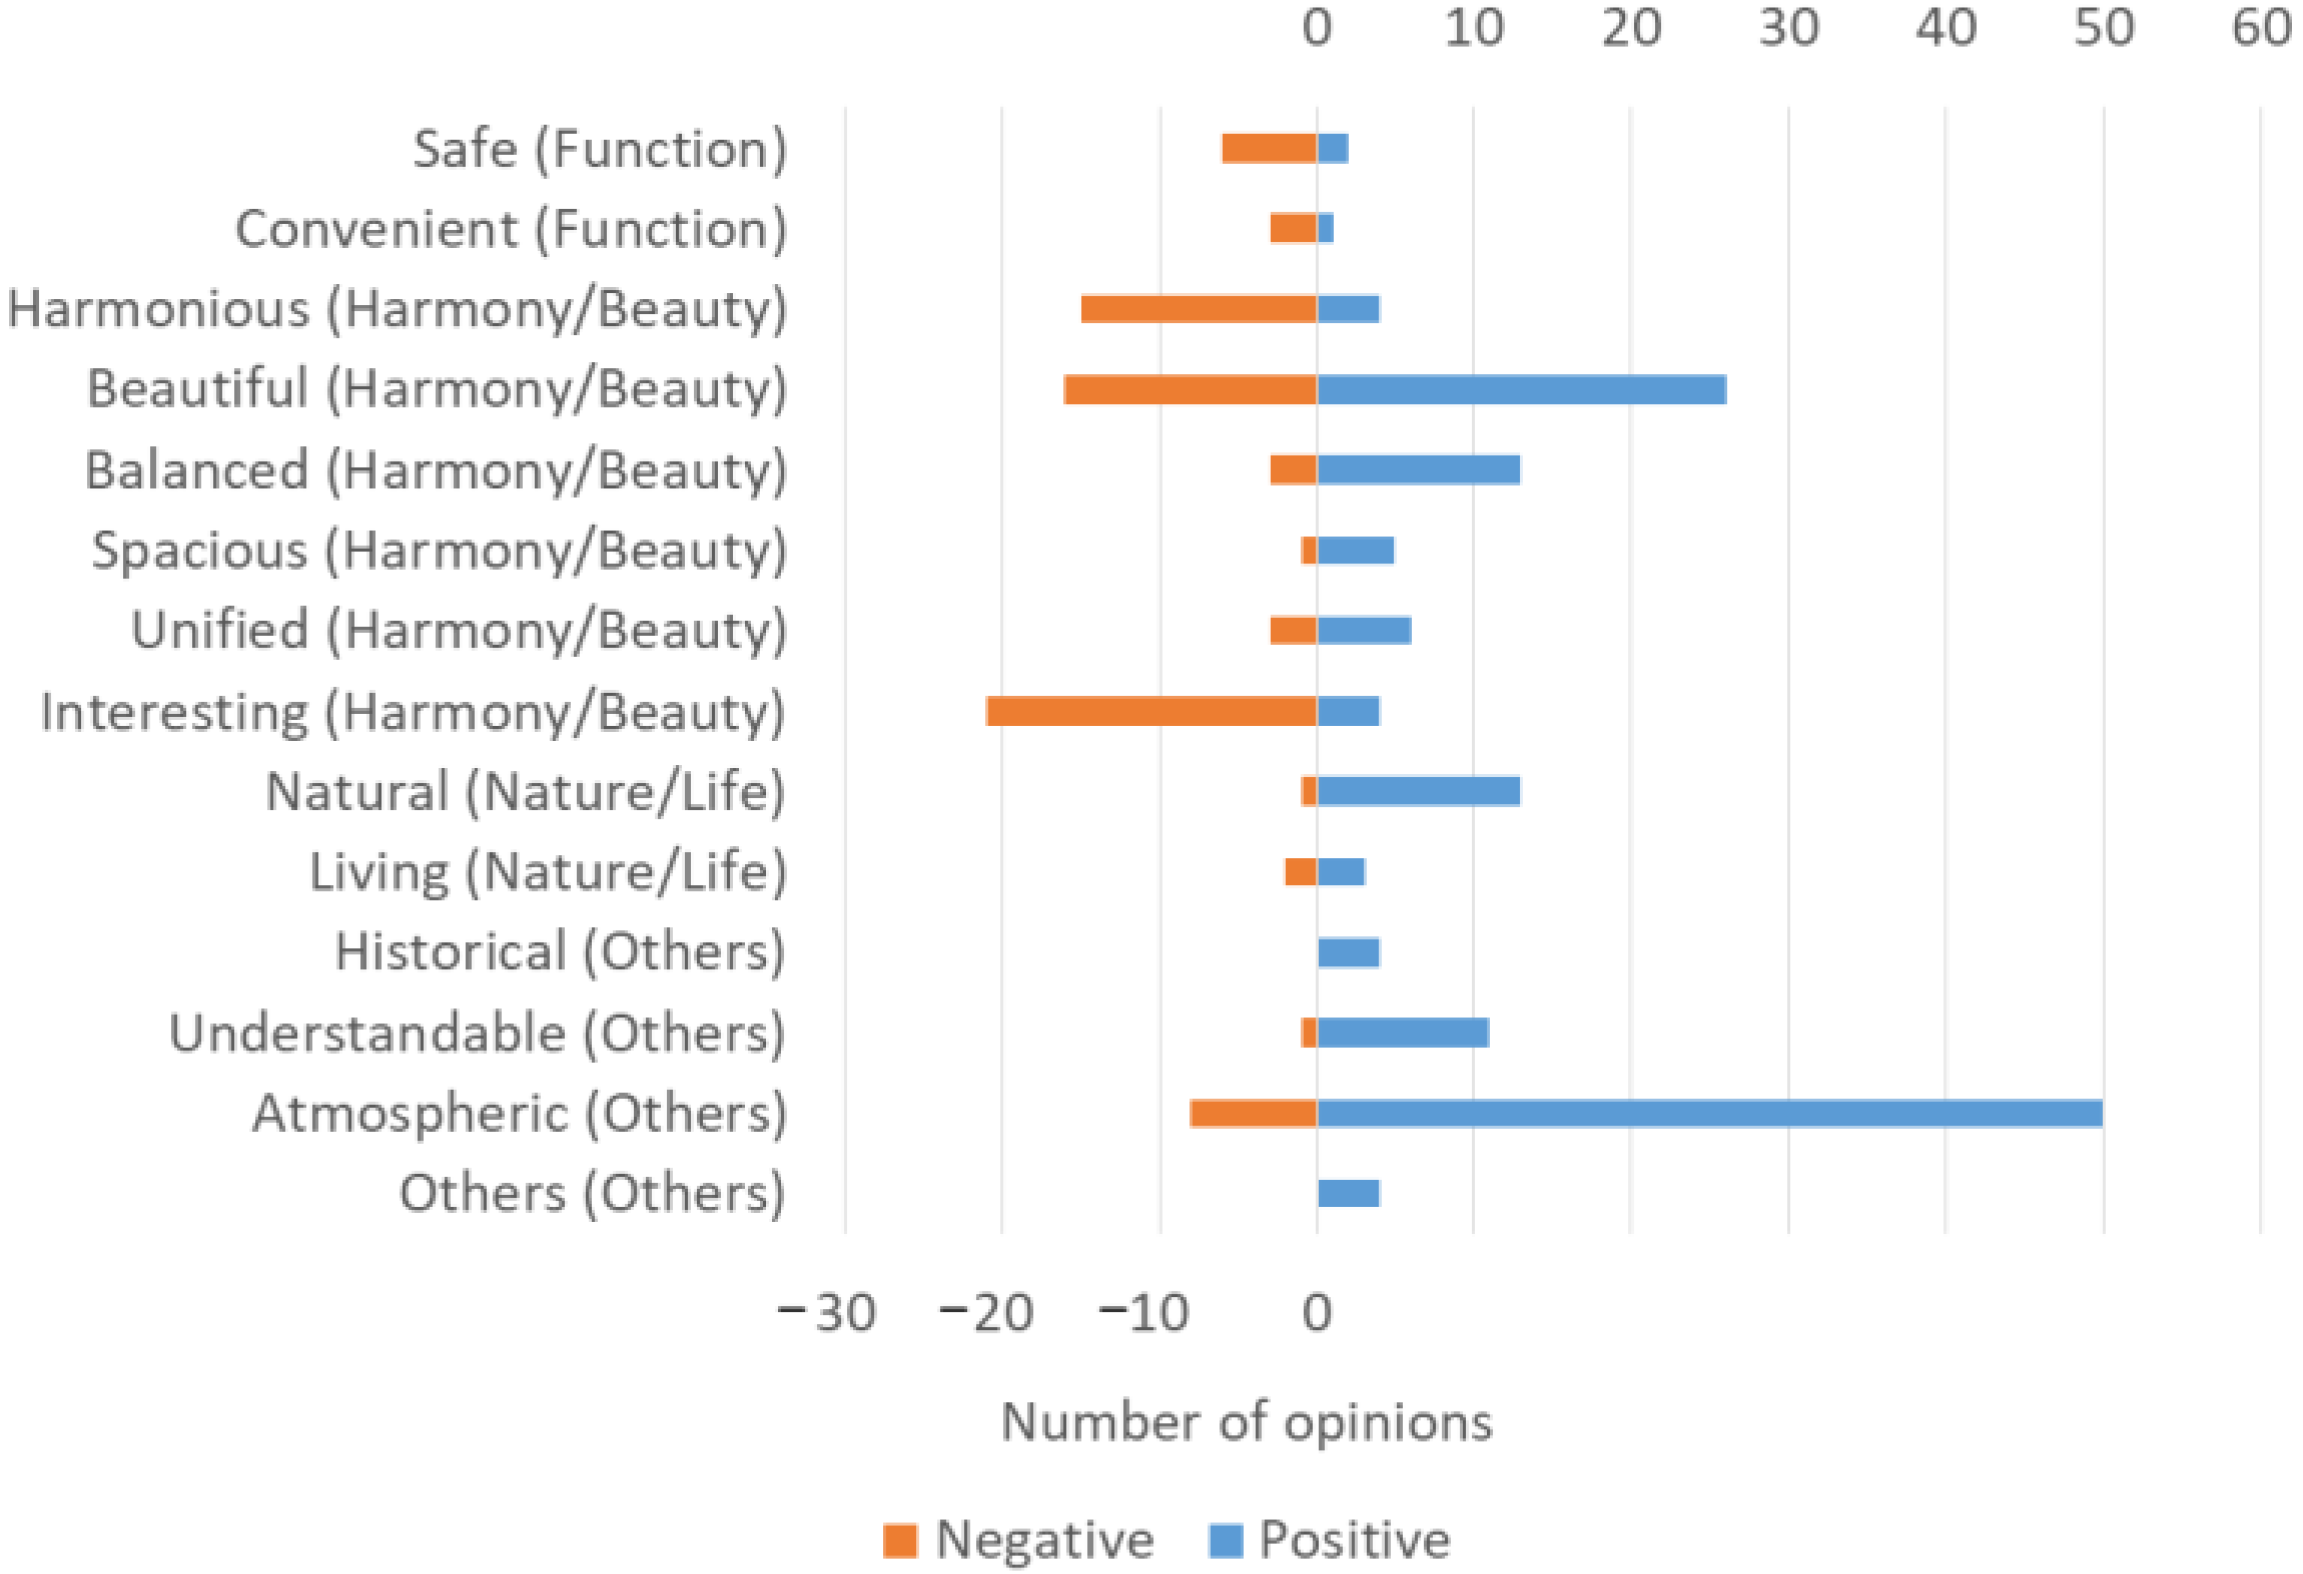
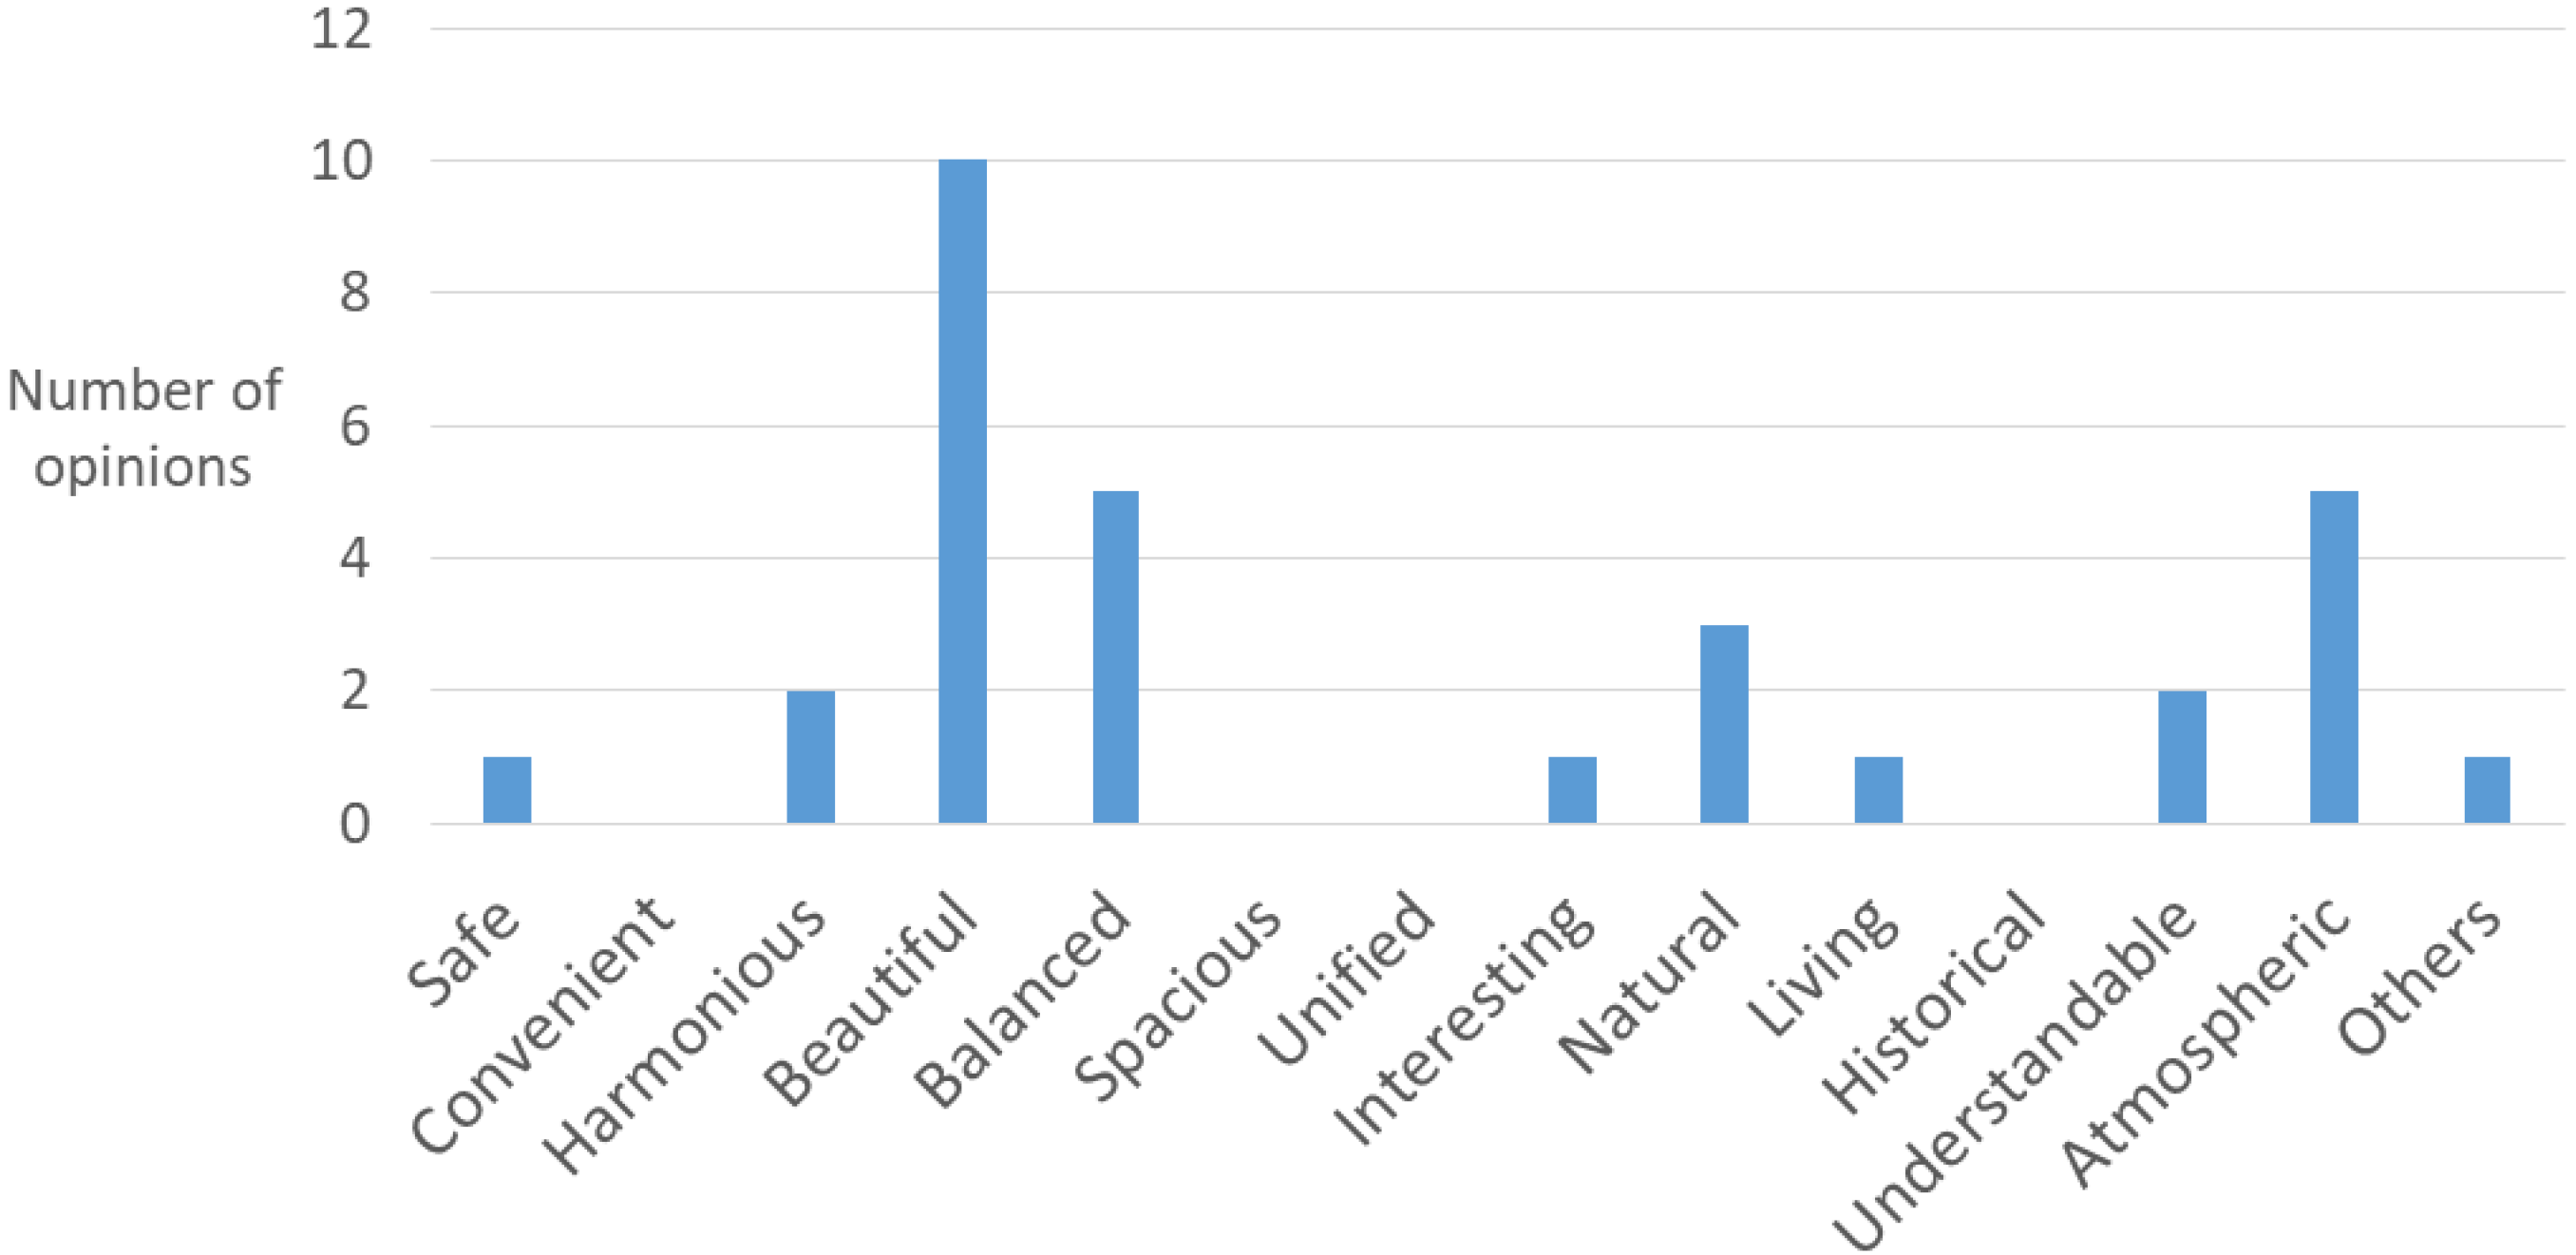
Positive evaluations of several elements of Landscape I far outweighed negative responses (see Figure 6). The positive evaluations were mostly of components categorized as “space”, “surface”, and “nature”, although elements categorized as “road” also received many negative evaluations. All “storage” elements had only negative evaluations. There were also negative evaluations of elements in the “quality” and “system” categories; these were not evaluations of the landscape. Overall, both positive and negative evaluations were made for a variety of elements. In terms of characteristics, “position”, “presence”, and “appearance” had many positive evaluations. “Position” also had many negative evaluations, as did “absence”, “shape”, and “color” (see Figure 7). In the perception category, many positive and negative evaluations were made regarding “beautiful” and “atmospheric” (see Figure 8). “Interesting” was evaluated negatively more than positively.
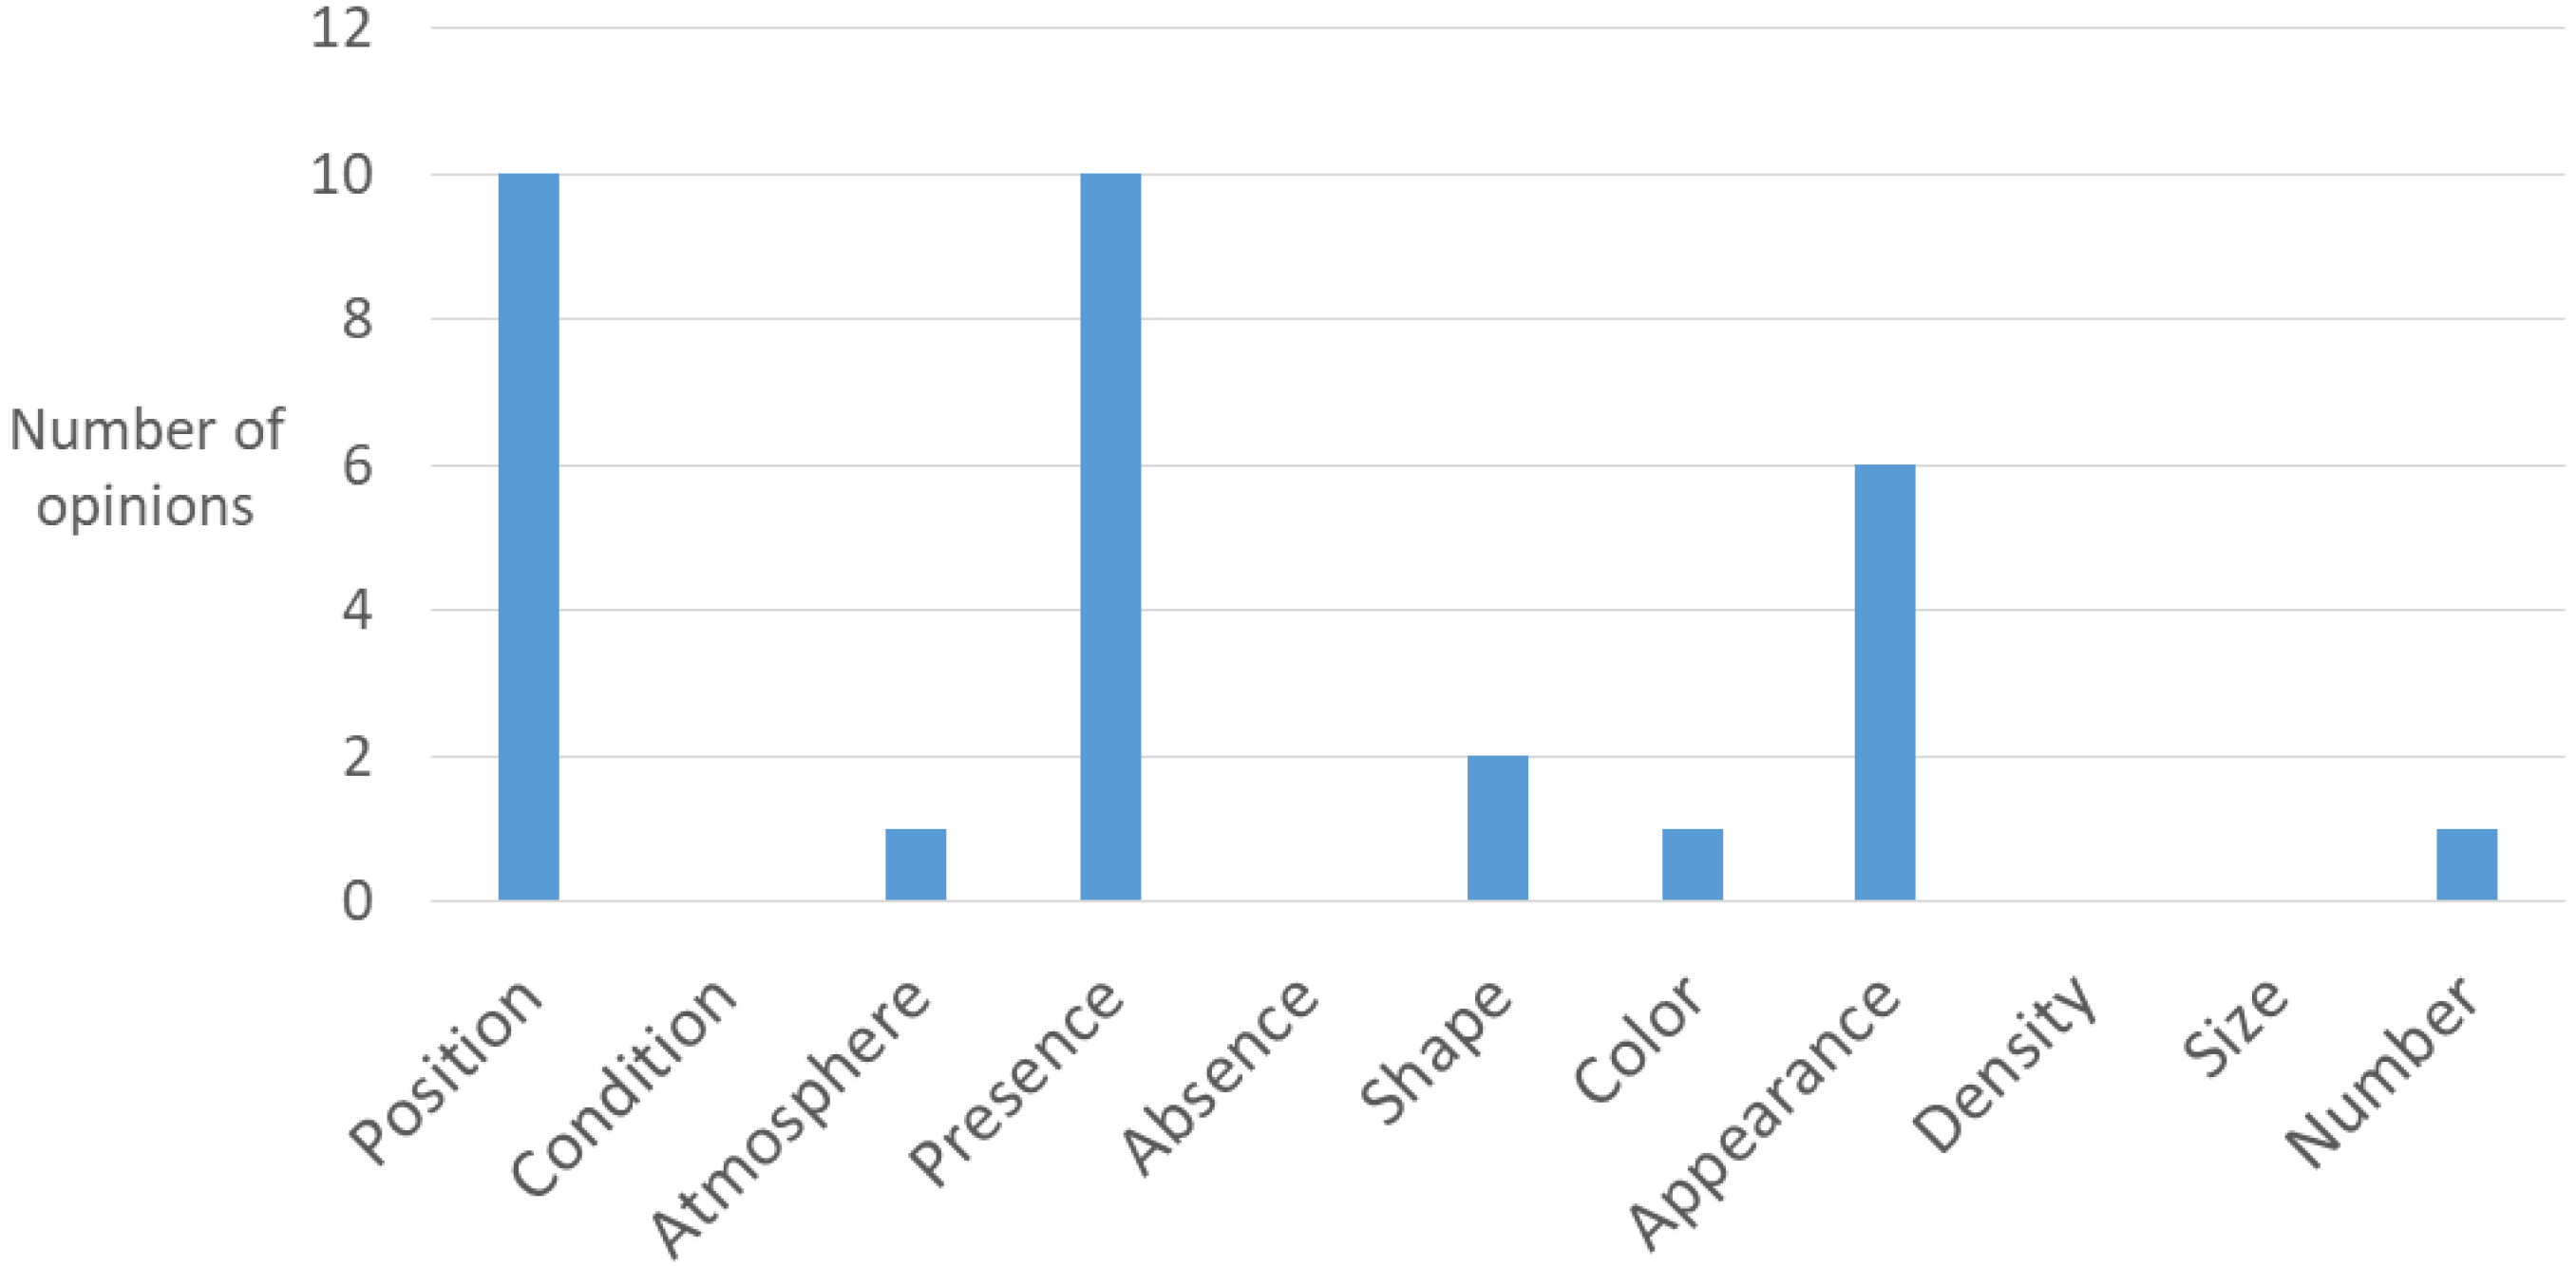
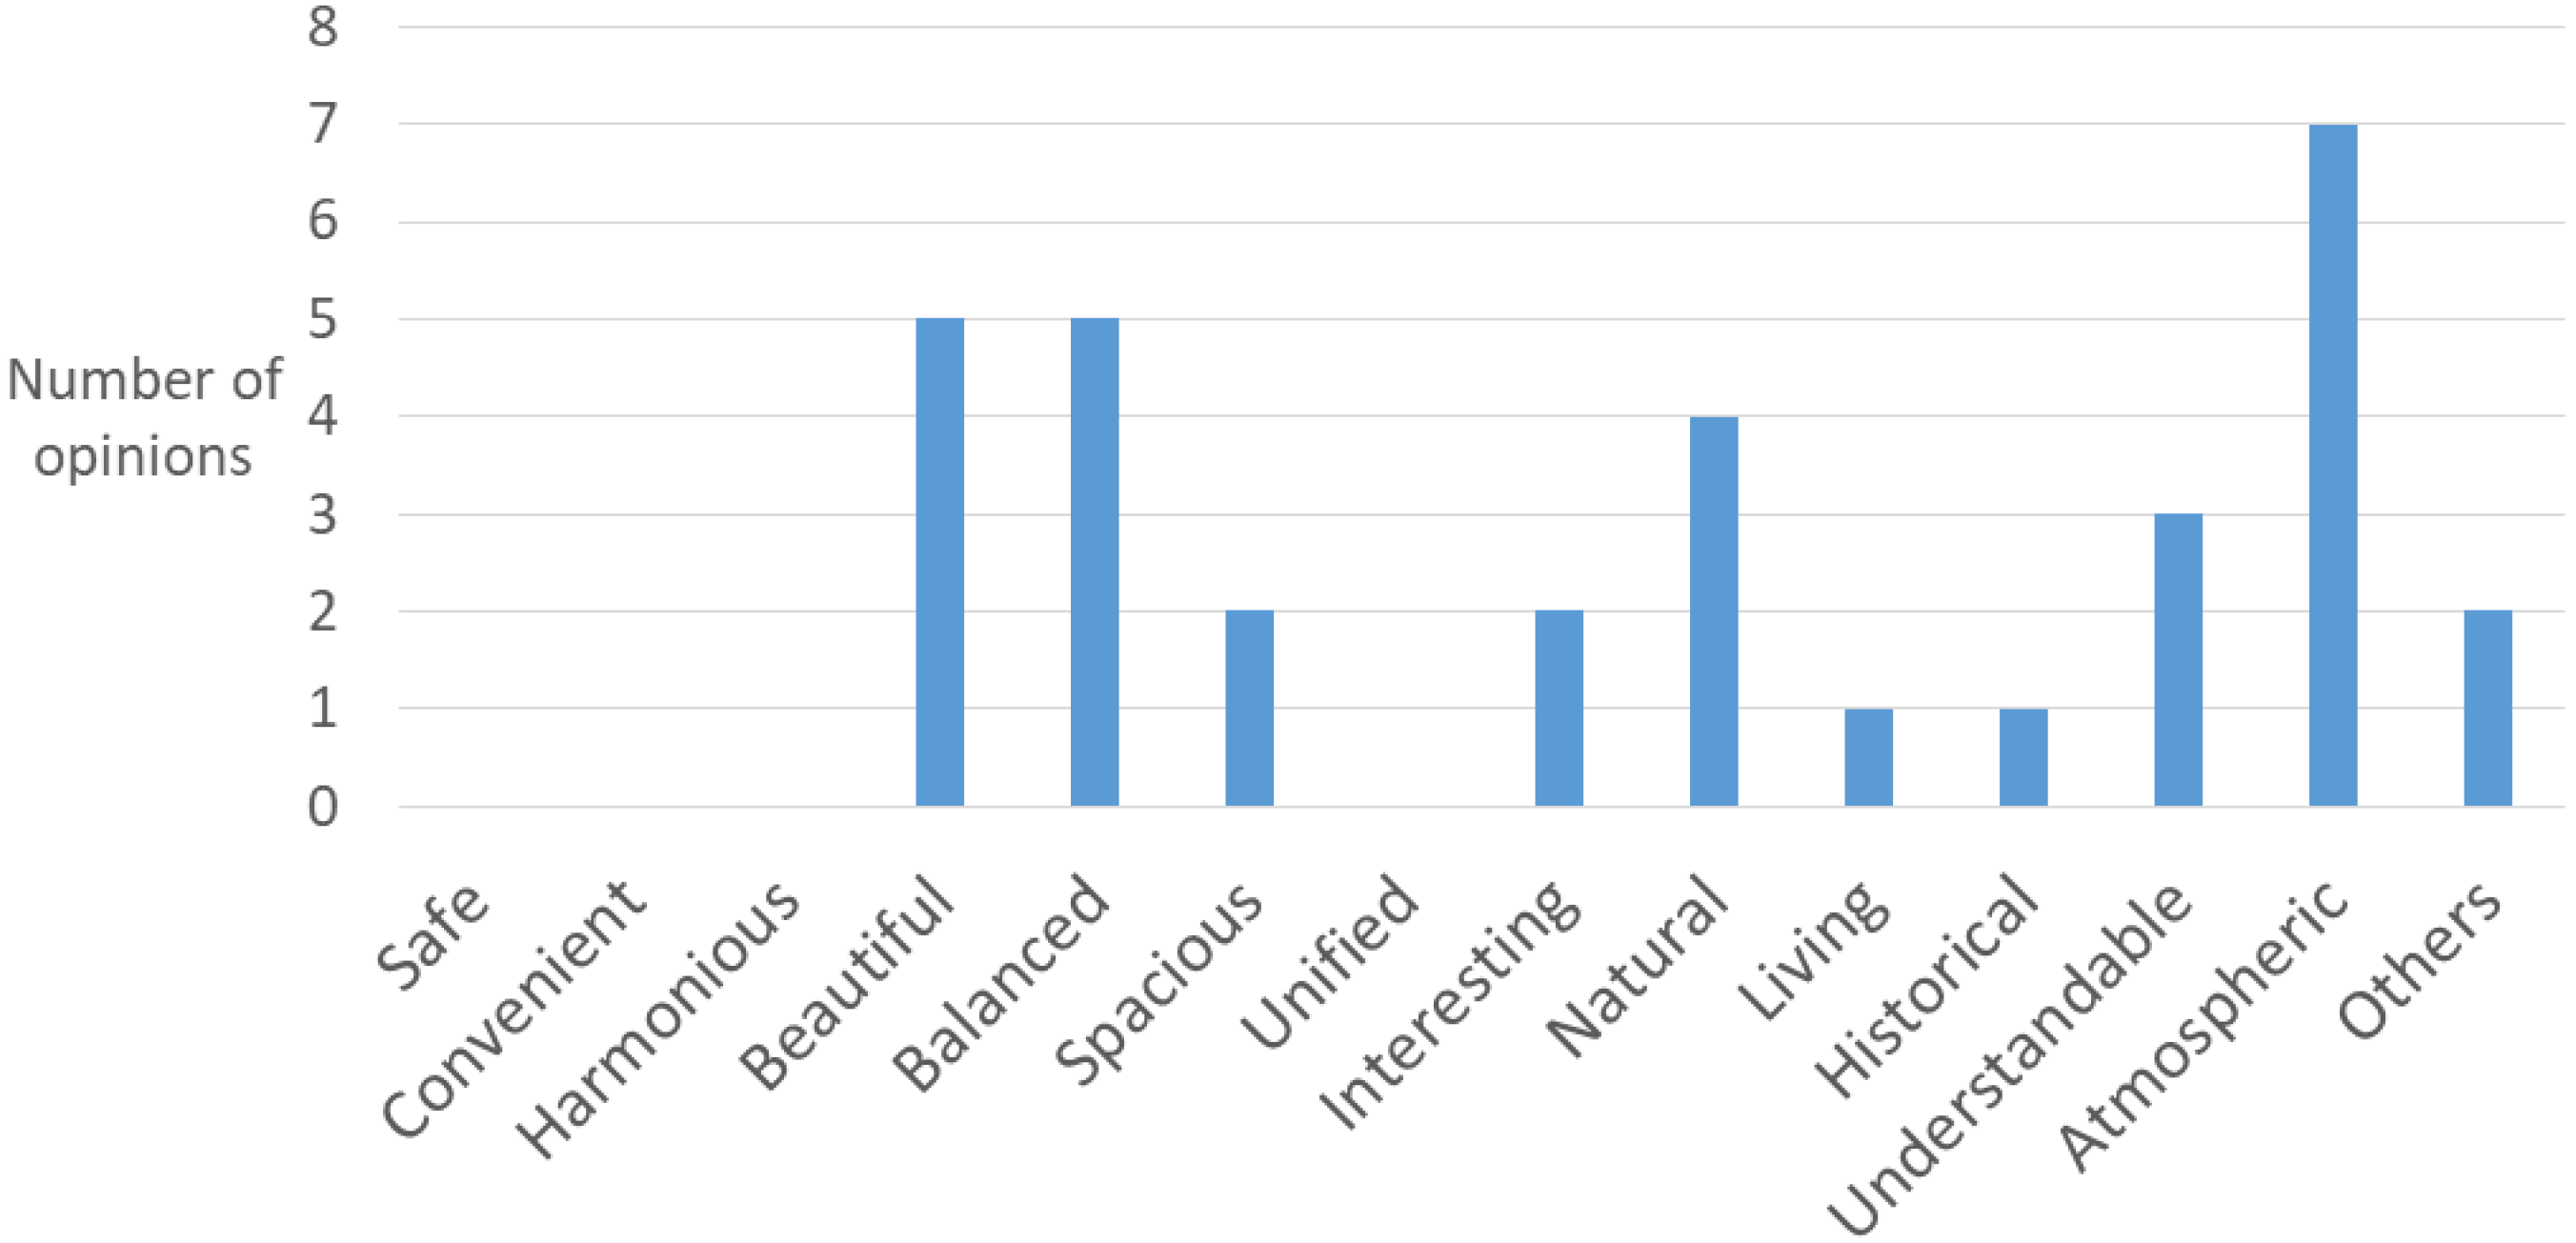
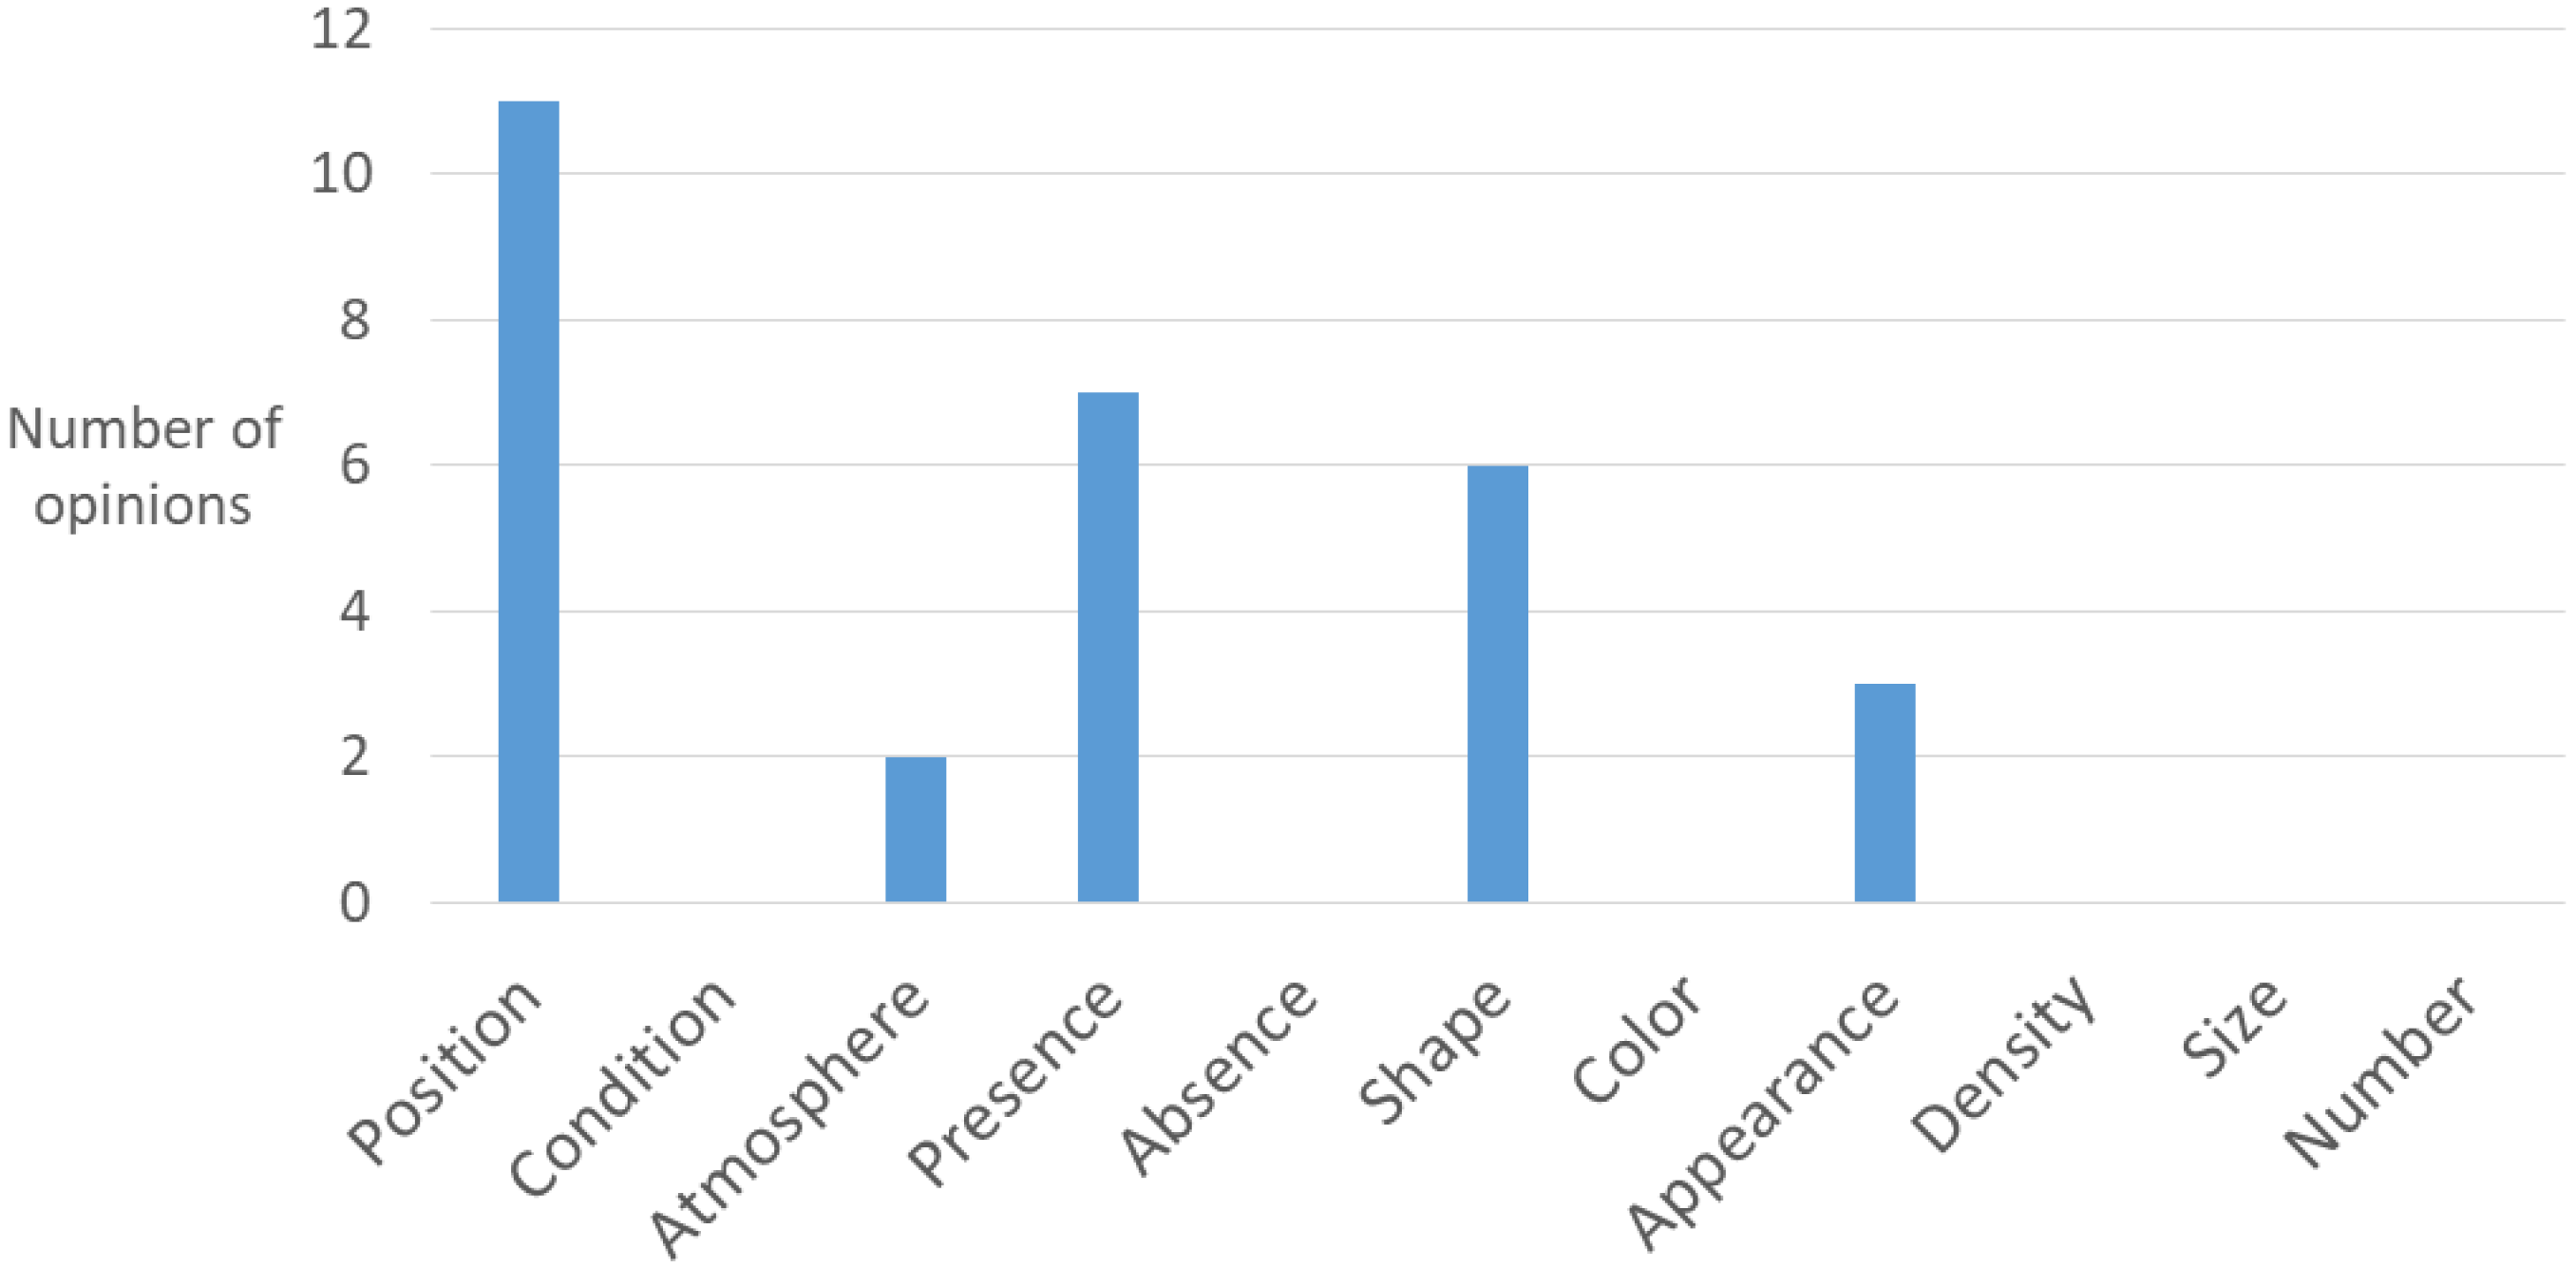
As a further step, we examined the diversity of evaluations made about characteristics and perceptions for the same element. For example, Figure 9 and Figure 10 show how respondents evaluated characteristics and perceptions for the element “farmland” in Landscape I. Its characteristics were mostly evaluated in terms of “position”, “presence”, and “appearance”, while its perception was mostly evaluated in relation to being “beautiful”, “balanced”, “natural”, and “atmospheric.”
3.2.2. Elements, Characteristics, and Perceptions of Landscape II
For Landscape II, there were many positive evaluations of elements categorized as “space” and “nature” (see Figure 11), although these elements also had several negative evaluations. In the “construction” category, “house” received many positive evaluations, while “storage” mostly had negative evaluations. As shown in Figure 12, the characteristics “position” and “presence” received many positive evaluations, as did characteristics within the “scene” category. Those in the “scene” category also received several negative evaluations. In terms of perceptions, “beautiful” and “atmospheric” received many positive evaluations (see Figure 13); this was similar to Landscape I. However, some negative evaluations were made of the characteristics “harmonious”, “beautiful”, and “interesting.”
As we did for Landscape I, we analyzed the diversity of evaluations given for characteristics and perceptions of the same element in Landscape II. For example, Figure 14 and Figure 15 show evaluations for characteristics and perceptions for the same element (“river”) in Landscape II. Variation in responses was observed for the same element. For characteristics, the most evaluations were made of the characteristics of “position”, “presence”, and “shape.” For perceptions, evaluations were concentrated on “beautiful”, “balanced”, and “atmospheric.”
3.3. Using External Opinions for Local Landscape Planning
The results of the workshop, in which key village stakeholders discussed the non-local stakeholders’ opinions, are summarized in this section. We qualitatively analyzed typical evaluations by the locals for the non-local stakeholders’ opinions, examining the usefulness and realism of using non-local stakeholders’ opinions in local landscape planning. Information about the workshop participants is shown in Table 6. Most of them were members of muradukuri-kai and most had strong motivations for landscape conservation.
3.3.1. Responses to Non-Local Stakeholders’ Opinions on Landscape I
First, we analyzed the responses of the local stakeholders to the non-local stakeholders’ opinions on Landscape I. The opinions solicited via the survey were grouped into five categories, which are shown in the first column of Table 7. For each category, the non-local stakeholders’ opinions are summarized and divided into positive and negative. At the workshop, the summary process was explained to the local stakeholders, who were then individually shown the typical opinions.
Below, we summarized how the local participants responded to these typical opinions.
- (1)
- Responses to the positive opinions on settlementIt seems relaxing to live in harmony with nature“As someone who lives in the area, the scenery is typical, and I do not feel good or bad about life in harmony with nature. Non-local stakeholders might have more positive feelings about rural settlements than the local inhabitants. The view on the 3D model may seem more beautiful than it really is.”I feel nostalgic about the scenery of the unified rural settlement“Urban people may long for the sense of openness in spacious rural areas, unlike urban areas.”The position, size, or color of the settlement is visually appealing“It is not uncommon for rivers to sweep around the village, even in other rural areas, but urban people might not see this scenery so much.”“About the commonality of houses, we do not have any intention for it and are not conscious of it. However, we learned from those opinions that it is good as a landscape for non-local stakeholders.”
- (2)
- Responses to the negative opinions on settlementThe houses are densely built, making the landscape seem unorganized“From the viewpoint of local inhabitants, I do not feel that the houses are densely built. It is common for one household to have several houses in rural areas, so non-local stakeholders may feel that it is messy.”The color of the houses seems dark and depressing“For those who are used to life in cities that are full of flashy buildings and things, it is understandable that rural landscapes are somewhat monotonous.”The houses are not positioned in coordination with each other“It must be an opinion based on the urban environment where houses are aligned. The arrangement of the houses is a private matter, so they cannot be reformed for the reason of deteriorating landscape.”
- (3)
- Responses to the positive opinions on farmlandThe scenery of farmlands seems relaxing and healing“In the season when the cherry blossoms are in bloom around farmlands, I feel healed. Publicizing the scenery as a landscape to non-local stakeholders was discussed at the previous workshop. However, it is not easy to modify the farmlands for the scenery, since the farmlands are recognized as a workplace.”The combination of settlement and farmlands seems beautiful“For efficient machine use, wide square fields are required. It is not possible to publicize the rice terraces just because the landscape is good. We need to think about the balance of attraction and income. “
- (4)
- Responses to the negative opinions on farmlandThere is too much farmland without plants, which is not attractive“It must be because the 3D model was created from photos taken after harvest. If there were crops in the fields, the opinions must have been different. However, we considered it important to create an attractive landscape throughout the year.”The difference between the level of the road and farmland seems dangerous“There are guardrails on both sides of the road, and the bridge also has a balustrade, but due to the resolution of the 3D model, this is not clear on the 3D model.”
- (5)
- Responses to the positive opinions on the riverThe shape, place, and color of the river create a good atmosphere“We can agree with the opinion that the babbling of the river sounds good. In fact, algae has grown in the river, and it is not as beautiful as it is seen in the 3D model.”I feel that the position of the settlement in relation to the river is safe“When flooding occurs, water never reaches the houses since the houses are located at higher elevations. However, the farmland along the river was flooded several times during typhoons.”
- (6)
- Responses to the negative opinions on the riverThe buildings located close to the river seem susceptible to flooding“The water level reached the floor of a material storage building. We believe that the non-local stakeholders have correctly grasped the local issue through the 3D model. It is not easy to remove the building due to land ownership.”The riverside landscape is very open and empty“Afforestation of cherry blossom trees was indeed discussed at past workshops, but it was not allowed by a regulation of Kyoto Prefecture.”
- (7)
- Responses to the negative opinions on material storage siteMaterial storage site is inconsistent with the overall landscape”We cannot make any judgements about the place since the land is a private asset. In the past workshops, private spaces were never discussed, since we feel landowners can use the land as they want.”“I do not think that the material storage site has a negative impact on the landscape.”
- (8)
- Responses to the positive opinions on other aspectsFrom the national road, there is an excellent view of the rural landscape“The view from the road was recognized as a point to be proud of in the past workshop. It could be more attractive if the 3D model can show more distant mountains, which are not seen in the current model.”
- (9)
- Responses to the negative opinions on other aspectsThere are no resting places or cafes, and the village is on a slope“We recognize the necessity of resting places, and there was a plan to set up benches for a rest in the past workshop, but this has not been realized. We are also afraid that it would not be profitable to create a cafe etc. for people coming from outside.”
In the responses of the local participants, we can see that in many cases they did not recognize the value and attraction of their landscape before the survey and did understand the typical opinions from those who lived outside, especially in urban areas. In contrast, some opinions received support from local participants while some others were unrealistic to them. They also considered some of the new opinions useful for their actual landscape planning, and confirmed that the 3D model could deliver detailed characteristics of the landscape such as areas at risk of natural hazards, comfortable sound levels of the river, or an elevation gap between a road and farmland. However, the 3D model could never convey information regarding private assets about which the local participants were sensitive. They also mentioned technical advantages and disadvantages of the current 3D model.
3.3.2. Responses to Non-Local Stakeholders’ Opinions on Landscape II
We then repeated the process of summarizing the responses of key local stakeholders to the non-local stakeholders’ opinions on Landscape II. Table 8 gives a summary of non-local stakeholders’ opinions on various landscape categories, divided into positive and negative opinions.
- (1)
- Responses to the positive opinions on settlementThe settlement is well-positioned in relation to the river and farmland“Since the past, the houses have been densely built, and the physical relation between the houses and river has never changed. We have never carried out farmland improvement.”The few houses and surrounding nature are well balanced“We can see the whole view of farmlands and houses from above on the 3D model, and this might make non-local stakeholders perceive the landscape to be balanced. However, we (in person) cannot see the whole view due to the difference in height.”
- (2)
- Responses to the negative opinions on settlementThe settlement is dense and makes the landscape unorganized“This opinion is not realistic for us because we cannot change the long-term location of houses.”
- (3)
- Responses to the positive opinions on farmlandThe terraced paddy fields are beautiful and nostalgic“As with the response to Landscape I, we have never considered farmlands as attractive landscape.”Farmland between the river and settlement creates a buffer zone for flooding“We can agree with this opinion. When flooding occurs, water reaches the farmland but not the houses at higher elevation.”
- (4)
- Responses to the positive opinions on river and bridgeThe landscape of the river and bridge is beautiful, healing, and attractive“The river has been in a natural form, and we hardly discuss the river in landscape planning.”
- (5)
- Responses to the negative opinions on river and bridgeThe bridge seems vulnerable to flooding“This opinion is realistic for the village. The bridge is old and has deteriorated. We have considered replacing the railings, which are low and dangerous.”The riverbank seems vulnerable, and river slope protection is needed“Concrete river walls cover the river slope, which cannot be seen on the 3D model.”The river seems susceptible to blockages by landslides, triggering flooding in the case of heavy rain“A long time ago, a landslide took place and blocked the river. It caused an overflow of river water, soaking the farmland. The mountainside is still vulnerable, and it is still possible for landslides to occur.”
- (6)
- Responses to the negative opinions on storage buildings with colored roofsThe colored roofs are not consistent with the surrounding landscape“The buildings with colored roofs are privately owned storage buildings for farming machines and equipment. We do not feel that these buildings are not in harmony with the landscape. However, I was surprised to see that the color of the roofs is more vivid than I expected on the 3D model.”A blue roof house is blocking the view of the traditional temple“We agree that one storage building hides the ancestral shrine. We feel that we should consider non-local stakeholders’ opinions when planning rural development.”
The responses of the local participants to the opinions on Landscape II were similar to those on Landscape I. Some opinions were from perspectives that the local people could never see surprising them.
4. Discussion
Through this study, we examined three hypotheses. In this section, we discuss the results we obtained in relation to these hypotheses.
4.1. Orientations from Which Participants Viewed Remote Landscapes Using 3D Models
By analyzing how respondents oriented the 3D model to view each landscape and give opinions, we found that the respondents who had never seen the landscapes in person gave opinions from a variety of orientations. Some opinions were formed from specific viewing points such as a hilltop or road, while others were from above. This indicates that 3D models are useful to obtain opinions from orientations that local villagers have never perceived as important (such as from a hilltop) or from which they physically cannot see (such as above). However, as drones have become popular, aerial still or moving images have been used for regional promotion, appealing to a desire for unusual and beautiful landscapes on the Internet. We therefore need to pay attention even to those landscapes that cannot be seen from the ground. From the same orientations, both positive and negative opinions were recorded. Currently, still or moving images have higher resolution and a more convenient file size than 3D models; however, these images are more subjective as the photographer influenced the angle, range, and quality. To overcome this barrier, many still or moving images from various perspectives would be needed. Although still or moving images may be more visually impressive, 3D models are more appropriate for obtaining opinions from non-local stakeholders as they are less subjective.
4.2. Diversity of Non-Local Stakeholders’ Opinions on Various Landscape Elements
This study confirmed that non-local stakeholders to a landscape have diverse opinions, or perceptions, on the elements of that landscape. Since people with different attributes have different opinions [46], one way of gathering diverse opinions for landscape planning could be sharing 3D models with many unspecified people on the Internet. In our study, participants described settlement, farmlands, and nature in a relatively large number of different ways, especially regarding their position, presence, or appearance, for both of the case study landscapes. Balances or contrast in color were also mentioned. We also received many opinions regarding the appearance of the landscape from different orientations. This is useful for deciding how to position observation decks or benches, or for making the landscape more attractive. Despite the ability to change the model’s orientation, certain elements were the focus of negative opinions, indicating that the village should prioritize these elements in landscape planning. In addition, we found that respondents perceived the landscapes as “beautiful” and “atmospheric”. Such results could be used by the village for attracting visitors and other informational purposes. However, if there were both agreement and disagreement among respondents regarding the characteristics and perceptions of the same element, local inhabitants might be unsure how to proceed with landscape planning. While this study had a limited number of samples. With a greater number, it should become clear which opinions are dominant.
We received some negative evaluations of the image quality and the system. The image quality of the 3D model used in this study was still inferior to still and moving images, especially when zoomed in, which frustrated some participants. Past studies also pointed out the insufficient quality of 3D visualization for actual landscape planning [36,40]. Moreover, it can be difficult to operate 3D models with a slow Internet connection or low computer processing speed. Since this type of questionnaire (asking for opinions on 3D models online) is very rare, some participants might not have understood the point of the questionnaire. The methodology for online questionnaires that incorporate 3D models must be improved; the system will also naturally become easier to use as Internet connection speeds and computer processing abilities continue to improve.
4.3. Employing Non-Local Stakeholders’ Opinions Based on 3D Models for Local Landscape Planning
The central question of this study is whether 3D models can be used to gather useful and realistic opinions for local landscape planning. Our results showed the potential of 3D models as a tool with which to gather diverse opinions from non-local stakeholders; we conclude that these models are valuable for collaborative planning.
The results showed that there were both advantages and disadvantages in using 3D models in collaborative landscape planning. Previous studies showed that 3D models were useful in communicating information about landscape conditions or temporary plans to stakeholders [33,36,43]. This study confirmed those findings, observing that our 3D models enabled non-local stakeholders to perceive detailed landscape issues such as a vulnerable bridge, the position of a house blocking a good view of a landmark, areas at risk of natural hazards, or an elevation gap between a road and farmland. On the contrary, participants did not see algae in the river or the presence of guardrails along a road. We also found that many of the non-local stakeholders’ opinions on the landscapes focused on issues with which local inhabitants were not ordinarily concerned, or which they had not even noticed, because locals are so familiar with the landscapes. This finding implies that non-local stakeholders’ opinions, solicited only after viewing 3D models, have the potential to alert locals to features in the local landscape that were previously unnoticed. Negative external opinions may provide good opportunities for local inhabitants to improve the landscape via objective feedback. However, we also found that some opinions were not important or realistic for local inhabitants to deal with. The findings correspond with those of past studies regarding differences in opinions between local and non-local people [46,47]. In other cases, non-local stakeholders’ opinions were consistent with those of local inhabitants. The external opinions can then positively reinforce local perspectives and could lead to conservation, improvement, or utilization of the landscape in a way that is also attractive to non-local stakeholders. These findings expand on those of a previous study—“the interaction between different stakeholders allowed to construct alternative visions of agricultural development and new possible scenarios” [3]—by focusing on unspecified non-local stakeholders.
Private assets or farmlands raised another issue. While outside observers had various opinions about their positive and negative qualities, local inhabitants were sensitive to the requirements of private assets and recognized that it is not easy to alter them as part of landscape planning. Locals also recognized farmland as a workplace. To improve the landscape as a whole, more thorough participation of inhabitants and consensus building is required. From a practical standpoint, the 3D models could be improved to better convey information regarding private assets.
5. Conclusions
This study examined the potential of 3D models to obtain opinions from remote non-local stakeholders to be used in collaborative landscape planning in rural areas. We analyzed the technical potential of 3D models to obtain diverse opinions from remote participants and how the remote participants evaluated the landscape. We found that their opinions were useful for local landscape planning, with limitations. While this study mainly focused on many unspecified people online as potential stakeholders, 3D models can be used for other remote stakeholders who are connected to the local community but cannot participate in the regional planning at a local site due to a geographic barrier.
Although we found many advantages of using 3D models for collaboration with remote participants, we also recognize the following limitations, which should be addressed in future research. First, it is necessary to determine the area of landscape suitable for this method. Some longer-distance views were not visible through our 3D models, and it would be inappropriate to use 3D models if we intended to evaluate long-distance landscapes. Second, the methodology for online surveys that incorporate 3D models must be polished. This study developed a novel method of soliciting opinions on 3D models online, but it could be further improved by enabling the participants to save the different model orientations as images, thus showing how they viewed the model. Third, this study intentionally collected samples with nearly equal age and gender distributions using online questionnaire survey, while others may consider social media as a tool to collect opinions from non-local stakeholders. In such studies, biases in the results should be carefully considered, since younger people tend to use social media compared to older inhabitants of rural communities [56]. On the other hand, this implies that online collaboration can provide rural communities with a rare opportunity to obtain the opinions of younger people outside those communities. Fourth, further technological advancements regarding 3D modeling, drones, and Internet speed are required. Currently, 3D model creation takes a long time even with relatively low quality and resolution, and it is difficult to upload and manipulate high-quality 3D models on the Internet due to the large amount of data required. These technological limitations should be improved shortly. Fifth, this study used a drone for 3D modeling; comparison between other 3D visualization methods, which were adopted in the past literature, is needed.
Given the trend in rural development theory to include remote stakeholders in local planning, this study has addressed the practicalities of how to obtain opinions from people who cannot see a landscape in person. We found that 3D models provide a way to solicit opinions from non-local stakeholders, who may never have seen the landscape, and that these opinions can be useful to local landscape planners. This is an important step towards promoting collaborative landscape planning and ensuring that SEPLs remain well cared for, despite the trends of rural aging and depopulation.
Author Contributions
K.O. and K.N. formulated the research design, conducted field survey, collected data and wrote the paper; K.N. analyzed the data; S.H. supervised in the process of the study.
Funding
This research was funded by MEXT Grants-in-Aid for Scientific Research grant number 16H04995.
Acknowledgments
We would like to thank to the villagers of the study area who participated in the workshop.
Conflicts of Interest
The authors declare no conflict of interest. The funders had no role in the design of the study; in the collection, analyses, or interpretation of data; in the writing of the manuscript, or in the decision to publish the results.
References
- IPSI Secretariat. The International Partnership for the Satoyama Initiative (IPSI): Information Booklet and 2016 Annual Report; United Nations University Institute for the Advanced Study of Sustainability: Tokyo, Japan, 2017. [Google Scholar]
- The Ministry of Agriculture, Forestry and Fisheries of Japan (MAFF). Annual Report on Food, Agriculture and Rural Areas in Japan FY2015. Available online: http://www.maff.go.jp/j/wpaper/w_maff/h26/h26_h/trend/part1/chap0/c0_1_02.html (accessed on 21 June 2018). (In Japanese)
- Gullino, P.; Devecchi, M.; Larcher, F. How can different stakeholders contribute to rural landscape planning policy? The case study of Pralormo municipality (Italy). J. Rural Stud. 2018, 57, 99–109. [Google Scholar] [CrossRef] [Green Version]
- Takeuchi, K. Rebuilding the relationship between people and nature: The Satoyama Initiative. Ecol. Res. 2010, 25, 891–897. [Google Scholar] [CrossRef]
- Bock, B. Rural Marginalisation and the Role of Social Innovation; A Turn Towards Nexogenous Development and Rural Reconnection. Sociol. Rural. 2016, 56, 552–573. [Google Scholar] [CrossRef]
- Lane, B. Rural tourism: An overview. In The SAGE Handbook of Tourism Studies 2009; SAGE Publications: Thousand Oaks, CA, USA, 2009. [Google Scholar]
- Lovett, A.; Appleton, K.; Warren-Kretzschmar, B.; Haaren, C. Using 3D visualization methods in landscape planning: An evaluation of options and practical issues. Landsc. Urban Plan 2015, 142, 85–94. [Google Scholar] [CrossRef]
- Bosworth, G.; Annibal, I.; Carroll, T.; Price, L.; Sellick, J.; Shepherd, J. Empowering Local Action through Neo-Endogenous Development; The Case of LEADER in England. Sociol. Rural. 2016, 56, 427–449. [Google Scholar] [CrossRef]
- Neumeier, S. Why do Social Innovations in Rural Development Matter and Should They be Considered More Seriously in Rural Development Research?—Proposal for a Stronger Focus on Social Innovations in Rural Development Research. Sociol. Rural. 2012, 52, 48–69. [Google Scholar] [CrossRef]
- Morimoto, Y. What is Satoyama? Points for discussion on its future direction. Landsc. Ecol. Eng. 2011, 7, 163–171. [Google Scholar] [CrossRef]
- Olsson, P.; Folke, C.; Berkes, F. Adaptive Comanagement for Building Resilience in Social? Ecol. Syst. Environ. Manag. 2004, 34, 75–90. [Google Scholar]
- Olsson, P.; Folke, C.; Hahn, T. Social-ecological transformation for ecosystem management: The development of adaptive co-management of a wetland landscape in southern Sweden. Ecol. Soc. 2004, 9, 1–26. [Google Scholar] [CrossRef]
- Armitage, D.; Plummer, R.; Berkes, F.; Arthur, R.; Charles, A.; Davidson-Hunt, I.; Diduck, A.; Doubleday, N.; Johnson, D.; Marschke, M.; et al. Adaptive co-management for social–ecological complexity. Front. Ecol. Environ. 2009, 7, 95–102. [Google Scholar] [CrossRef]
- De Loë, R.; Murray, D.; Simpson, H. Farmer perspectives on collaborative approaches to governance for water. J. Rural Stud. 2015, 42, 191–205. [Google Scholar] [CrossRef]
- Peng, L.-P.; Wang, C.-J.; Onitsuka, K. Collaborative Conservation of a Socio-Ecological Production Landscape through ICT Tools. Environments 2017, 4, 63. [Google Scholar] [CrossRef]
- Koontz, T.; Newig, J. From Planning to Implementation: Top-Down and Bottom-Up Approaches for Collaborative Watershed Management. Policy Stud. J. 2014, 42, 416–442. [Google Scholar] [CrossRef] [Green Version]
- Onitsuka, K.; Hoshino, S. Inter-community networks of rural leaders and key people: Case study on a rural revitalization program in Kyoto Prefecture, Japan. J. Rural Stud. 2018, 61, 123–136. [Google Scholar] [CrossRef]
- Onitsuka, K.; Hagihara, K.; Hoshino, S.; Shimizu, N.; Hashimoto, S. The effects and problems of workshop utilizing Facebook—A case study of Ikaga region, Kyotango City. J. Rural Plan 2014, 32, 507–516. (In Japanese) [Google Scholar] [CrossRef]
- Bock, B. Social innovation and sustainability; how to disentangle the buzzword and its application in the field of agriculture and rural development. Stud. Agric. Econ. 2012, 114, 57–63. [Google Scholar] [CrossRef]
- Rover, O.; de Gennaro, B.; Roselli, L. Social Innovation and Sustainable Rural Development: The Case of a Brazilian Agroecology Network. Sustainability 2016, 9, 3. [Google Scholar] [CrossRef]
- Virkkala, S. Innovation and Networking in Peripheral Areas—A Case Study of Emergence and Change in Rural Manufacturing. Eur. Plan Stud. 2007, 15, 511–529. [Google Scholar] [CrossRef]
- Preece, J.; Maloney-Krichmar, D. Online Communities: Design, Theory, and Practice. J. Comput.-Mediat. Commun. 2005, 10, JCMC10410. [Google Scholar] [CrossRef]
- Wellman, B.; Salaff, J.; Dimitrova, D.; Garton, L.; Gulia, M.; Haythornthwaite, C. Computer Networks as Social Networks: Collaborative Work, Telework, and Virtual Community. Annu. Rev. Sociol. 1996, 22, 213–238. [Google Scholar] [CrossRef]
- Wasko, M.; Faraj, S. Why should I share? Examining social capital and knowledge contribution in electronic networks of practice. MIS Q. 2005, 29, 35–57. [Google Scholar] [CrossRef]
- Chiu, C.-M.; Hsu, M.-H.; Wang, E. Understanding knowledge sharing in virtual communities: An integration of social capital and social cognitive theories. Decis. Support Syst. 2006, 42, 1872–1888. [Google Scholar] [CrossRef]
- Zube, E.; Sell, J.; Taylor, J. Landscape perception: Research, application and theory. Landsc. Plan 1982, 9, 1–33. [Google Scholar] [CrossRef]
- Aoki, Y. Review article: Trends in the study of the psychological evaluation of landscape. Landsc. Res. 2007, 24, 85–94. [Google Scholar] [CrossRef]
- Hull, B.; Revell, G. Issues in sampling landscapes for visual quality assessments. Landsc. Urban Plan 1989, 17, 323–330. [Google Scholar] [CrossRef]
- Matsuo, Y. Fundamentals and Applications of Rural Landscape Simulation Technique (3)—Image Processed Montage: Mosaic Image and Landscape Estimation. J. Agric. Eng. Soc. 2000, 68, 1063–1066. (In Japanese) [Google Scholar]
- Warren-Kretzschmar, B.; Tiedtke, S. What role does visualization play in communication with citizens?—A field study from the interactive landscape plan. In Trends in Real-Time Landscape Visualization and Participation; Buhmann, E., Ed.; Wichmann Verlag: Berlin, Germany, 2005. [Google Scholar]
- Schmid, W. The emerging role of visual resource assessment and visualisation in landscape planning in Switzerland. Landsc. Urban Plan 2001, 54, 213–221. [Google Scholar] [CrossRef]
- Lange, E. 99 volumes later: We can visualise. Now what? Landsc. Urban Plan 2011, 100, 403–406. [Google Scholar] [CrossRef] [Green Version]
- Getzner, M.; Färber, B.; Yamu, C. 2D Versus 3D: The relevance of the mode of presentation for the economic valuation of an Alpine landscape. Sustainability 2016, 8, 591. [Google Scholar] [CrossRef]
- Van Lammeren, R.; Houtkamp, J.; Colijn, S.; Hilferink, M.; Bouwman, A. Affective appraisal of 3D land use visualization. Comput. Environ. Urban Syst. 2010, 34, 465–475. [Google Scholar] [CrossRef]
- Wissen, U.; Schroth, O.; Lange, E.; Schmid, W. Approaches to integrating indicators into 3D landscape visualisations and their benefits for participative planning situations. J. Environ. Manag. 2008, 89, 184–196. [Google Scholar] [CrossRef] [PubMed]
- Hayek, U. Which is the Appropriate 3D Visualization Type for Participatory Landscape Planning Workshops? A Portfolio of Their Effectiveness. Environ. Plan. B Plan. Des. 2009, 38, 921–939. [Google Scholar] [CrossRef]
- Bourgoin, J.; Castella, J.-C.; Pullar, D.; Lestrelin, G.; Bouahom, B. Toward a land zoning negotiation support platform: “Tips and tricks” for participatory land use planning in Laos. Landsc. Urban Plan 2012, 104, 270–278. [Google Scholar] [CrossRef]
- Piper, B.; Ratti, C.; Ishii, H. Illuminating clay: A 3-D tangible interface for landscape analysis. In Proceedings of the SIGCHI Conference on Human Factors in Computing Systems, New York, NY, USA, 20–25 April 2002. [Google Scholar]
- Kume, T. Fundamentals and Applications of Rural Landscape Simulation Technique (7)—Land Reclamation Planning and its Landscape Design using Digital Terrain Model. J. Agric. Eng. Soc. 2001, 69, 189–194. (In Japanese) [Google Scholar]
- Appleton, K.; Lovett, A. GIS-based visualisation of rural landscapes: Defining “sufficient” realism for environmental decision-making. Landsc. Urban Plan 2003, 65, 117–131. [Google Scholar] [CrossRef]
- Ball, J.; Capanni, N.; Watt, S. Virtual reality for mutual understanding in landscape planning. Int. J. Soc. Sci. 2008, 2, 78–88. [Google Scholar]
- Lange, E. The limits of realism: Perceptions of virtual landscapes. Landsc. Urban Plan 2001, 54, 163–182. [Google Scholar] [CrossRef]
- Tress, B.; Tress, G. Scenario visualisation for participatory landscape planning—A study from Denmark. Landsc. Urban Plan 2003, 64, 161–178. [Google Scholar] [CrossRef]
- Paar, P. Landscape visualizations: Applications and requirements of 3D visualization software for environmental planning. Comput. Environ. Urban Syst. 2006, 30, 815–839. [Google Scholar] [CrossRef]
- Berkel, D.; Carvalho-Ribeiro, S.; Verburg, P.; Lovett, A. Identifying assets and constraints for rural development with qualitative scenarios: A case study of Castro Laboreiro, Portugal. Landsc. Urban Plan 2011, 102, 127–141. [Google Scholar] [CrossRef]
- Oku, H.; Fukamachi, K. The differences in scenic perception of forest visitors through their attributes and recreational activity. Landsc. Urban Plan 2006, 75, 34–42. [Google Scholar] [CrossRef]
- Hull, R.B., IV; Reveli, G.R. Cross-cultural comparison of landscape scenic beauty evaluations: A case study in Bali. J. Environ. Psychol. 1989, 9, 177–191. [Google Scholar] [CrossRef]
- Ministry of Internal Affairs and Communication, Japan (MIC). Japan Statistical Yearbook. Available online: http//www.stat.go.jp/data/nenkan/65nenkan/index.htm (accessed on 23 June 2018).
- BBC. Japan’s Youth Turn to Rural Areas Seeking a Slower Life. Available online: https://www.bbc.com/news/business-15850243 (accessed on 24 June 2018).
- Wright, K. Researching Internet-Based Populations: Advantages and Disadvantages of Online Survey Research, Online Questionnaire Authoring Software Packages, and Web Survey Services. J. Comput.-Mediat. Commun. 2005, 10, JCMC1034. [Google Scholar] [CrossRef]
- Reips, U.-D.; Buchanan, T.; Krantz, J.; McGraw, K. Methodological challenges in the use of the Internet for scientific research: Ten solutions and recommendations. Studia Psychol. 2015, 15, 139–148. [Google Scholar] [CrossRef]
- Koga, T.; Taka, A.; Munakata, J.; Kojima, T.; Hirate, K.; Yasuoka, M. Participatory research of townscape, using caption evaluation method. J. Archit. Plan. 1999, 517, 79–84. (In Japanese) [Google Scholar] [CrossRef]
- Naoi, T.; Yamada, T.; Iijima, S.; Kumazawa, T. Applying the caption evaluation method to studies of visitors’ evaluation of historical districts. Tourism Manag. 2011, 32, 1061–1074. [Google Scholar] [CrossRef]
- Kawakita, J. The Original KJ Method; Kawakita Research Institute: Tokyo, Japan, 1991. [Google Scholar]
- Ohiwa, H.; Takeda, N.; Kawai, K.; Shiomi, A. KJ editor: A card-handling tool for creative work support. Knowl.-Based Syst. 1997, 10, 43–50. [Google Scholar] [CrossRef]
- Perrin, A. Social Media Usage. Pew Research Center 2015. Available online: https://www.secretintelligenceservice.org/wp-content/uploads/2016/02/PI_2015-10-08_Social-Networking-Usage-2005-2015_FINAL.pdf (accessed on 2 August 2018).
Figure 1.
Two landscapes shown in 3D images. Left-hand column shows Landscape I; right-hand column shows Landscape II. From top to bottom, landscapes are shown from above (a,b); at an oblique angle (c,d); and at a different oblique angle (e,f).
Figure 1.
Two landscapes shown in 3D images. Left-hand column shows Landscape I; right-hand column shows Landscape II. From top to bottom, landscapes are shown from above (a,b); at an oblique angle (c,d); and at a different oblique angle (e,f).

Figure 2.
Landmarks indicated on 3D landscape models with numeric tags.

Figure 3.
Lettered grid that overlaid the 3D models.

Figure 4.
Form that respondents used to indicate the orientation from which they viewed the 3D model.
Figure 4.
Form that respondents used to indicate the orientation from which they viewed the 3D model.

Figure 5.
Categorization using the caption evaluation method. The top line shows the categories and the bottom line shows an example.
Figure 5.
Categorization using the caption evaluation method. The top line shows the categories and the bottom line shows an example.

Figure 6.
Result of categorization of opinions regarding “elements” of Landscape I.

Figure 7.
Result of categorization of opinions regarding “characteristics” of Landscape I.

Figure 8.
Result of categorization of opinions regarding “perceptions” of Landscape I.

Figure 9.
Responses about “characteristics” of farmland in Landscape I (n = 31).

Figure 10.
Responses about “perceptions” of farmland in Landscape I (n = 33).

Figure 11.
Result of categorization of opinions regarding “factors” of Landscape II.

Figure 12.
Result of categorization of opinions regarding “characteristics” of Landscape II.

Figure 13.
Result of categorization of opinions regarding “perceptions” of Landscape II.

Figure 14.
Responses about “characteristics” of the river in Landscape II (n = 29).

Figure 15.
Responses about “perceptions” of the river in Landscape II (n = 31).


Table 1.
Parameters of the 3D landscape models.
| Landscape I | Landscape II | |
|---|---|---|
| Cameras | 379 | 390 |
| Points (point cloud) | 75,350 | 82,316 |
| Points (dense point cloud) | 4,048,481 | 4,963,697 |
| Faces | 8,838,819 | 11,084,214 |
| Vertices | 4,420,504 | 5,543,638 |
| File size (MB) | 376.251 | 472,231 |
Table 2.
Main questions in the survey questionnaire (translated by authors).
| ID | Question | Answer Type |
|---|---|---|
| Q1_1 | Determine the orientation from which you had the most positive opinions on LI after seeing the model from all the orientations. | Single answer for each tag |
| Q1_2 | Why did you have positive opinions from the determined viewpoint on LI? Write how you felt about the characteristics of each element. | Free description (over 30 Japanese characters) |
| Q1_3 | Determine the orientation from which you had the most negative opinions on LI after seeing the model from all the orientations. | Single answer for each tag |
| Q1_4 | Why did you have negative opinions from the determined viewpoint on LI? Write how you felt about the characteristics of each element. | Free description (over 30 Japanese characters) |
| Q2_1 | Determine the orientation from which you had the most positive opinions on LII after seeing the model from all the orientations. | Single answer for each tag |
| Q2_2 | Why did you have positive opinions from the determined viewpoint on LII? Write how you felt about the characteristics of each element. | Free description (over 30 Japanese characters) |
| Q2_3 | Determine the orientation from which you had the most negative opinions on LII after seeing the model from all the orientations. | Single answer for each tag |
| Q2_4 | Why did you have negative opinions from the determined viewpoint on LII? Write how you felt about the characteristics of each element. | Free description (over 30 Japanese characters) |
Table 3.
Age and gender distributions of the respondents.
| Age | 18–19 | 20–29 | 30–39 | 40–49 | 50–59 | 60–69 | Total |
|---|---|---|---|---|---|---|---|
| Male | 3 (2.6%) | 14 (12.2%) | 14 (12.2%) | 14 (12.2%) | 11 (9.6%) | 7 (6.1%) | 63 (54.8%) |
| Female | 6 (5.2%) | 6 (5.2%) | 11 (9.6%) | 9 (7.8%) | 10 (8.7%) | 10 (8.7%) | 52 (45.2%) |
| Total | 9 (7.8%) | 20 (17.4%) | 25 (21.7%) | 23 (20.0%) | 21 (18.3%) | 17 (14.8%) | 115 (100.0%) |
Table 4.
Responses to Landscape I, evaluated by 3D model. Each cell represents an orientation from which respondents evaluated the landscape. The numbers in each cell indicate the number of positive (left) and negative (right) evaluations from that orientation. Positive opinions: n = 80; negative opinions: n = 67.
| 1 | 2 | 3 | 4 | 5 | 6 | 7 | 8 | 9 | |
|---|---|---|---|---|---|---|---|---|---|
| A | 15/9 | 2/1 | 7/8 | 15/6 | 1/0 | 3/6 | 10/6 | 4/3 | 7/6 |
| B | 14/8 | 16/12 | 5/2 | 13/5 | 0/5 | 5/5 | 5/1 | 8/6 | 4/2 |
| C | 11/7 | 16/6 | 10/10 | 5/6 | 3/1 | 5/2 | 5/5 | 1/2 | 8/9 |
| D | 2/1 | 5/7 | 1/0 | 13/4 | 16/10 | 4/4 | 0/0 | 10/3 | 1/0 |
| E | 1/1 | 0/0 | 1/1 | 2/1 | 38/21 | 1/1 | 1/0 | 1/0 | 0/0 |
| F | 0/0 | 12/7 | 1/0 | 2/1 | 4/0 | 9/7 | 1/1 | 4/5 | 0/0 |
| G | 5/4 | 1/1 | 0/1 | 3/0 | 2/3 | 0/1 | 11/4 | 1/2 | 9/3 |
| H | 0/1 | 0/1 | 1/0 | 3/5 | 4/1 | 9/3 | 0/0 | 10/3 | 0/1 |
| I | 1/1 | 2/1 | 8/6 | 0/0 | 0/0 | 5/1 | 5/3 | 3/1 | 9/3 |
| NA * | 31/35 | 26/31 | 46/39 | 24/39 | 12/26 | 39/37 | 42/47 | 38/42 | 42/43 |
* Indicates the number of responses in which each landscape tag (1–9) did not appear in any of the nine grid squares (A–I).
Table 5.
Responses to Landscape II, evaluated by 3D model. Each cell represents an orientation from which respondents evaluated the landscape. The numbers in each cell indicate the number of positive (left) and negative (right) evaluations from that orientation. Positive opinions: n = 75; negative opinions: n = 61.
| 1 | 2 | 3 | 4 | 5 | 6 | 7 | 8 | 9 | |
|---|---|---|---|---|---|---|---|---|---|
| A | 20/8 | 3/3 | 3/8 | 1/1 | 0/2 | 3/0 | 4/1 | 0/1 | 6/3 |
| B | 5/4 | 18/9 | 5/3 | 6/3 | 3/3 | 4/8 | 2/3 | 5/3 | 4/2 |
| C | 5/1 | 4/6 | 18/5 | 2/1 | 1/0 | 2/3 | 4/1 | 3/5 | 5/8 |
| D | 0/0 | 3/5 | 1/0 | 19/6 | 6/2 | 8/4 | 2/0 | 18/8 | 3/2 |
| E | 1/0 | 2/2 | 0/1 | 0/2 | 31/14 | 3/3 | 11/6 | 3/2 | 2/1 |
| F | 0/1 | 4/1 | 2/0 | 15/8 | 1/1 | 13/4 | 5/1 | 5/5 | 2/1 |
| G | 1/3 | 1/0 | 1/1 | 0/1 | 1/3 | 1/0 | 9/3 | 2/0 | 3/0 |
| H | 1/1 | 1/2 | 1/0 | 2/3 | 8/6 | 4/0 | 1/2 | 11/5 | 1/0 |
| I | 2/0 | 1/0 | 3/1 | 3/0 | 11/4 | 3/0 | 1/3 | 1/4 | 10/4 |
| NA * | 40/43 | 38/33 | 41/42 | 27/36 | 13/26 | 34/39 | 36/41 | 27/28 | 39/40 |
* Indicates the number of responses in which each landscape tag (1–9) did not appear in any of the nine grid squares (A–I).
Table 6.
Description of key local stakeholders who participated in the workshop.
| No. | Gender | Age | Motivation for Landscape Conservation |
|---|---|---|---|
| 1 | Male | 70s | (no answer) |
| 2 | Male | 60s | Very weak |
| 3 | Male | 70s | Very strong |
| 4 | Male | 60s | Rather strong |
| 5 | Male | 60s | Rather strong |
| 6 | Male | 60s | Rather strong |
| 7 | Male | 60s | Neutral |
For privacy, this study does not show detailed information such as the roles of the stakeholders in the village.
Table 7.
Typical non-local stakeholder opinions on Landscape I, solicited through a survey using a 3D model.
Table 7.
Typical non-local stakeholder opinions on Landscape I, solicited through a survey using a 3D model.
| Category | Evaluation | Representative Opinion |
|---|---|---|
| Settlement | Positive | It seems relaxing to live in harmony with nature |
| I feel nostalgic about the scenery of the unified rural settlement | ||
| The position, size, or color of the settlement is visually appealing | ||
| Negative | The houses are densely built, making the landscape seem unorganized | |
| The color of the houses seems dark and depressing | ||
| The houses are not positioned in coordination with each other | ||
| Farmland | Positive | The scenery of farmlands seems relaxing and healing |
| The combination of settlement and farmlands seems beautiful | ||
| Negative | There is too much farmland without plants, which is not attractive | |
| The difference between the level of the road and farmland seems dangerous | ||
| River | Positive | The shape, place, and color of the river create a good atmosphere |
| I feel that the position of the settlement in relation to the river is safe | ||
| Negative | The buildings located close to the river seem susceptible to flooding | |
| The riverside landscape is very open and empty | ||
| Storage | Negative | Material storage site is inconsistent with the overall landscape |
| Other aspects | Positive | From the national road, there is an excellent view of the rural landscape |
| Negative | There are no resting places or cafes, and the village is on a slope |
Table 8.
Typical non-local stakeholder opinions on Landscape II, solicited through a survey using a 3D model.
Table 8.
Typical non-local stakeholder opinions on Landscape II, solicited through a survey using a 3D model.
| Category | Evaluation | Representative Opinion |
|---|---|---|
| Settlement | Positive | The settlement is well-positioned in relation to the river and farmland |
| The few houses and surrounding nature are well balanced | ||
| Negative | The settlement is dense and makes the landscape unorganized | |
| Farmland | Positive | The terraced paddy fields are beautiful and nostalgic |
| Farmland between the river and settlement creates a buffer zone for flooding | ||
| River | Positive | The landscape of the river and bridge is beautiful, healing, and attractive |
| Negative | The bridge seems vulnerable to flooding | |
| The riverbank seems vulnerable, and river slope protection is needed | ||
| The river seems susceptible to blockages by landslides, triggering flooding in the case of heavy rain | ||
| House | Negative | The colored roofs are not consistent with the surrounding landscape |
| A blue roofed house is blocking the view of the traditional temple |
© 2018 by the authors. Licensee MDPI, Basel, Switzerland. This article is an open access article distributed under the terms and conditions of the Creative Commons Attribution (CC BY) license (http://creativecommons.org/licenses/by/4.0/).
Share and Cite
MDPI and ACS Style
Onitsuka, K.; Ninomiya, K.; Hoshino, S. Potential of 3D Visualization for Collaborative Rural Landscape Planning with Remote Participants. Sustainability 2018, 10, 3059. https://0-doi-org.brum.beds.ac.uk/10.3390/su10093059
AMA Style
Onitsuka K, Ninomiya K, Hoshino S. Potential of 3D Visualization for Collaborative Rural Landscape Planning with Remote Participants. Sustainability. 2018; 10(9):3059. https://0-doi-org.brum.beds.ac.uk/10.3390/su10093059
Chicago/Turabian StyleOnitsuka, Kenichiro, Kento Ninomiya, and Satoshi Hoshino. 2018. "Potential of 3D Visualization for Collaborative Rural Landscape Planning with Remote Participants" Sustainability 10, no. 9: 3059. https://0-doi-org.brum.beds.ac.uk/10.3390/su10093059
Note that from the first issue of 2016, this journal uses article numbers instead of page numbers. See further details here.