Development of SWAT-Paddy for Simulating Lowland Paddy Fields


1
The Graduate School of Agriculture, Tokyo University of Agriculture and Technology, 3-5-8 Saiwaicho, Fuchu, Tokyo 183-8509, Japan
2
Institute for Rural Engineering, NARO, 2-1-6 Kannondai, Tsukuba, Ibaraki 305-8609, Japan
3
Institute of Agriculture, Tokyo University of Agriculture and Technology, 3-5-8 Saiwaicho, Fuchu, Tokyo 183-8509, Japan
4
Blackland Research and Extension Center, Texas A&M AgriLife Research, 720 East Blackland Road, Temple, TX 76502, USA
5
Grassland Soil and Water Research Laboratory, USDA-ARS, 808 East Blackland Road, Temple, TX 76502, USA
*
Author to whom correspondence should be addressed.
Sustainability 2018, 10(9), 3246; https://0-doi-org.brum.beds.ac.uk/10.3390/su10093246
Submission received: 21 August 2018
/
Revised: 6 September 2018
/
Accepted: 6 September 2018
/
Published: 11 September 2018
(This article belongs to the Special Issue Selected Papers on Sustainable Water Resources Management from the 2017 and 2018 International SWAT (Soil and Water Assessment Tool) Conference)
Abstract
:The recent increase in global consumption of rice has led to increased demand for sustainable water management in paddy cultivation. In this study, we propose an enhanced paddy simulation module to be introduced to Soil and Water Assessment Tool (SWAT) to evaluate the sustainability of paddy cultivation. The enhancements added to SWAT include: (1) modification of water balance calculation for impounded fields, (2) addition of an irrigation management option for paddy fields that are characterized by flood irrigation with target water depth, and (3) addition of a puddling operation that influences the water quality and infiltration rate of the top soil layer. In a case study, the enhanced model, entitled SWAT-Paddy, was applied to an agricultural watershed in Japan. The results showed that the SWAT-Paddy successfully represented paddy cultivation, water management, and discharge processes. Simulated daily discharge rates with SWAT-Paddy (R2 = 0.8) were superior to the SWAT result (R2 = 0.002). SWAT-Paddy allows the simulation of paddy management processes realistically, and thus can enhance model accuracy in paddy-dominant agricultural watersheds.
1. Introduction
Rice is the staple food of more than half of the world’s population and supplies more dietary energy than many other grain crops [1]. Increasing demand for rice requires the land productivity of paddy fields to increase [2]. To increase land productivity, several methods are generally used: increasing the number of rice cultivations per year, improving crop yield potential with genetic modification, or applying more agrochemicals, fertilizers, and irrigation [3]. Paddy fields are cultivated under inundation of irrigated water, as these consume and discharge a large volume of water. Therefore, paddy cultivation often affects local water resource sustainability by consuming a large amount of water and discharging pollutants into downstream water bodies [4,5]. To mitigate the impact on water quality in watersheds containing paddy fields, a management plan for land use, irrigation, and drainage should be employed. To assess the sustainability of natural resources such as land and surface or ground water, several hydrological models have been used, including MIKE Système Hydrologique Européen (MIKE SHE) [6], Hydrological Simulation Program-FORTRAN (HSPF) [7], and others [8,9]. The Soil and Water Assessment Tool (SWAT) is one of the hydrological models used to assess the sustainability of land and water resources, considering agricultural production at the watershed scale [10,11]. SWAT has been globally applied to address water quantity and the associated challenges [12,13,14]. Because several kinds of software tools are available to prepare input data [15], check errors in a simulation [16], and calibrate the parameters [17] of a SWAT model simulation, the users of SWAT can easily apply a model. Therefore, the SWAT model has significant potential to help administrators make sustainable management plans for watersheds with paddy fields.
However, SWAT is not designed to model the wetting conditions with water inundation commonly practiced in paddy fields [18,19]. To mimic water impoundment in SWAT simulation, the pothole module, which is available in SWAT, was used [20]. Sakaguchi et al. [21] pointed out the unsuitability of the pothole module for simulating paddy water balances. To date, a handful of studies have been published regarding paddy modeling with the SWAT model. Xie and Cui [22] modified the existing pothole algorithm to simulate hydrological processes in paddy fields. Boulange et al. [23] developed PCPF-1@SWAT by combining a field-scale model for estimating pesticide concentration in paddy water and surface soil (Pesticide Concentration in Paddy Field-1; PCPF-1 [24]) with the modified pothole model to evaluate the impact of pesticides in paddy fields. In the water balance computation, lateral seepage through the embankment was considered in this model. Sakaguchi et al. [21] developed a paddy model based on the modified pothole. In this model, a new parameter representing the potential percolation rate of paddy fields was proposed. This parameter was defined as a hydraulic property that represents lateral seepage and vertical percolation from paddy impoundment in one term. Therefore, an advantage of Sakaguchi’s model compared to PCPF-1@SWAT, which requires users to define two parameters to represent water loss from impoundment through paddy soil, is the lower number of fitting parameters for paddy simulation. Sofiyuddin et al. [25] analyzed the performance and structure of Sakaguchi’s model by comparing it to the original SWAT model and concluded that the proposed model structure improved the model performance.
Although these models showed acceptable simulation results in their research, their structures are still based on the concept of the pothole module. Agricultural management practices in paddy fields are unique and distinctive, and have sophisticated effects on hydrology and crop growth. Furthermore, puddling management, which is important for impounding water above the ground surface by reducing the hydraulic conductivity of soil, makes water muddy by mixing surface soil and impounded water; therefore, discharge water from paddy fields shortly after puddling often contains more sediment and pollutants than usual [4]. On the other hand, polluted irrigation water is purified in paddy fields because of plant uptake, biodegradation, denitrification, and cyclic water use in paddy field districts [26,27]. These environmental impacts of paddy cultivation are strongly related to agricultural management in paddy fields, including puddling, irrigation and drainage. Therefore, agricultural management in paddy fields should be taken into account when environmental conservation practice is planned in watersheds that contain them [28]. Furthermore, paddy fields should be modeled based on their own unique hydrological processes and agricultural managements.
The goal of this study was to enhance paddy simulation by improving accuracy in watershed modeling using the SWAT model. As an objective of this research, to simulate paddy fields water management, SWAT2012 rev.629 was modified (1) to equip it with a new water balance model including water impoundments in paddy fields, (2) to add an irrigation management option for paddy fields that are characterized by flood irrigation, with target ponding depths managed on a daily basis, and (3) to account for the fact that puddling influences discharge water quality and infiltration rate during growing periods. The modified model was named SWAT-Paddy. To examine the model’s performance, SWAT-Paddy was applied to an actual watershed containing paddy fields in Japan. The workflow scheme of the research is shown in Figure 1.
2. Materials and Methods
2.1. Overview of SWAT Model Simulation
SWAT is a semi-distributed and process-oriented eco-hydrological model that computes water, nutrients, and pesticide discharge from a watershed at a daily time step [10]. Water and mass balance, plant growth, and management practices are simulated in each hydrological response unit (HRU), which is generated by overlying maps of land use, soil, and slope. Then, outputs from HRUs are aggregated at subbasin level and routed downstream through a channel network. This enables the model to represent hydrological characteristics of watershed efficiently, with reasonable approximation. For the simulation, SWAT requires input data of weather, maps, and schedule of management practices. Detailed description of the model is available in the SWAT2012 theoretical documentation [29].
2.2 Development of SWAT-Paddy
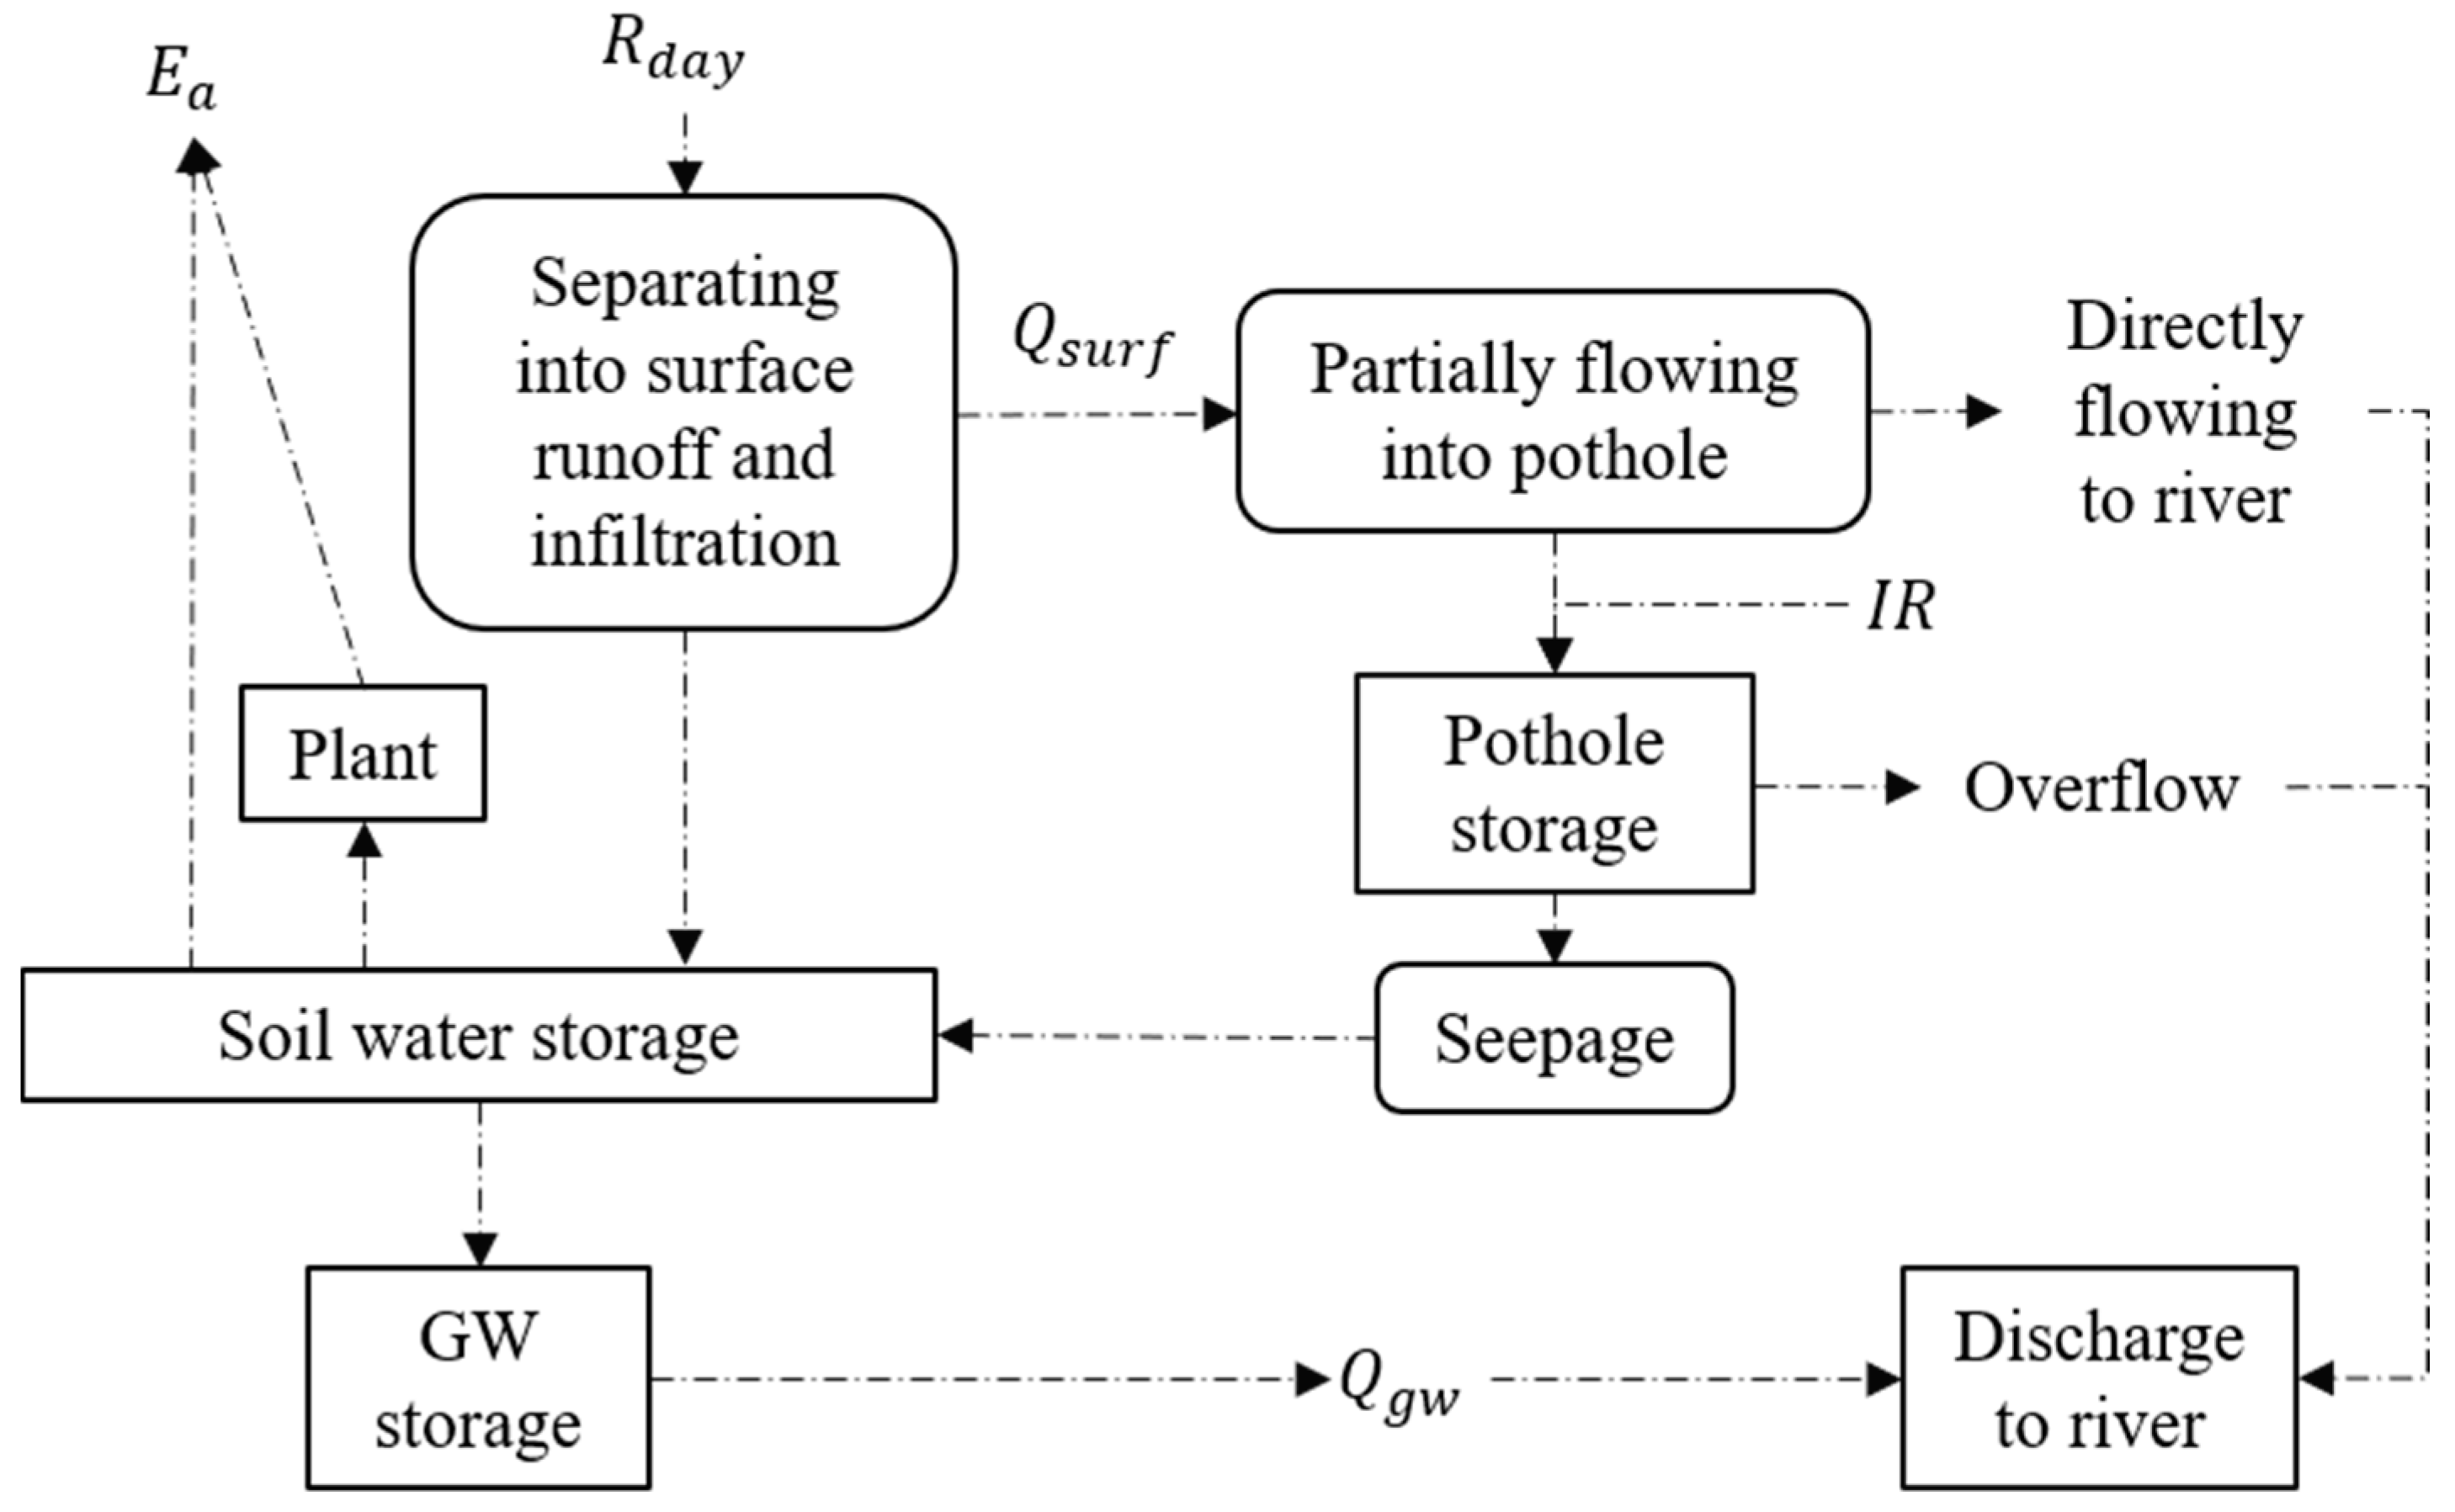
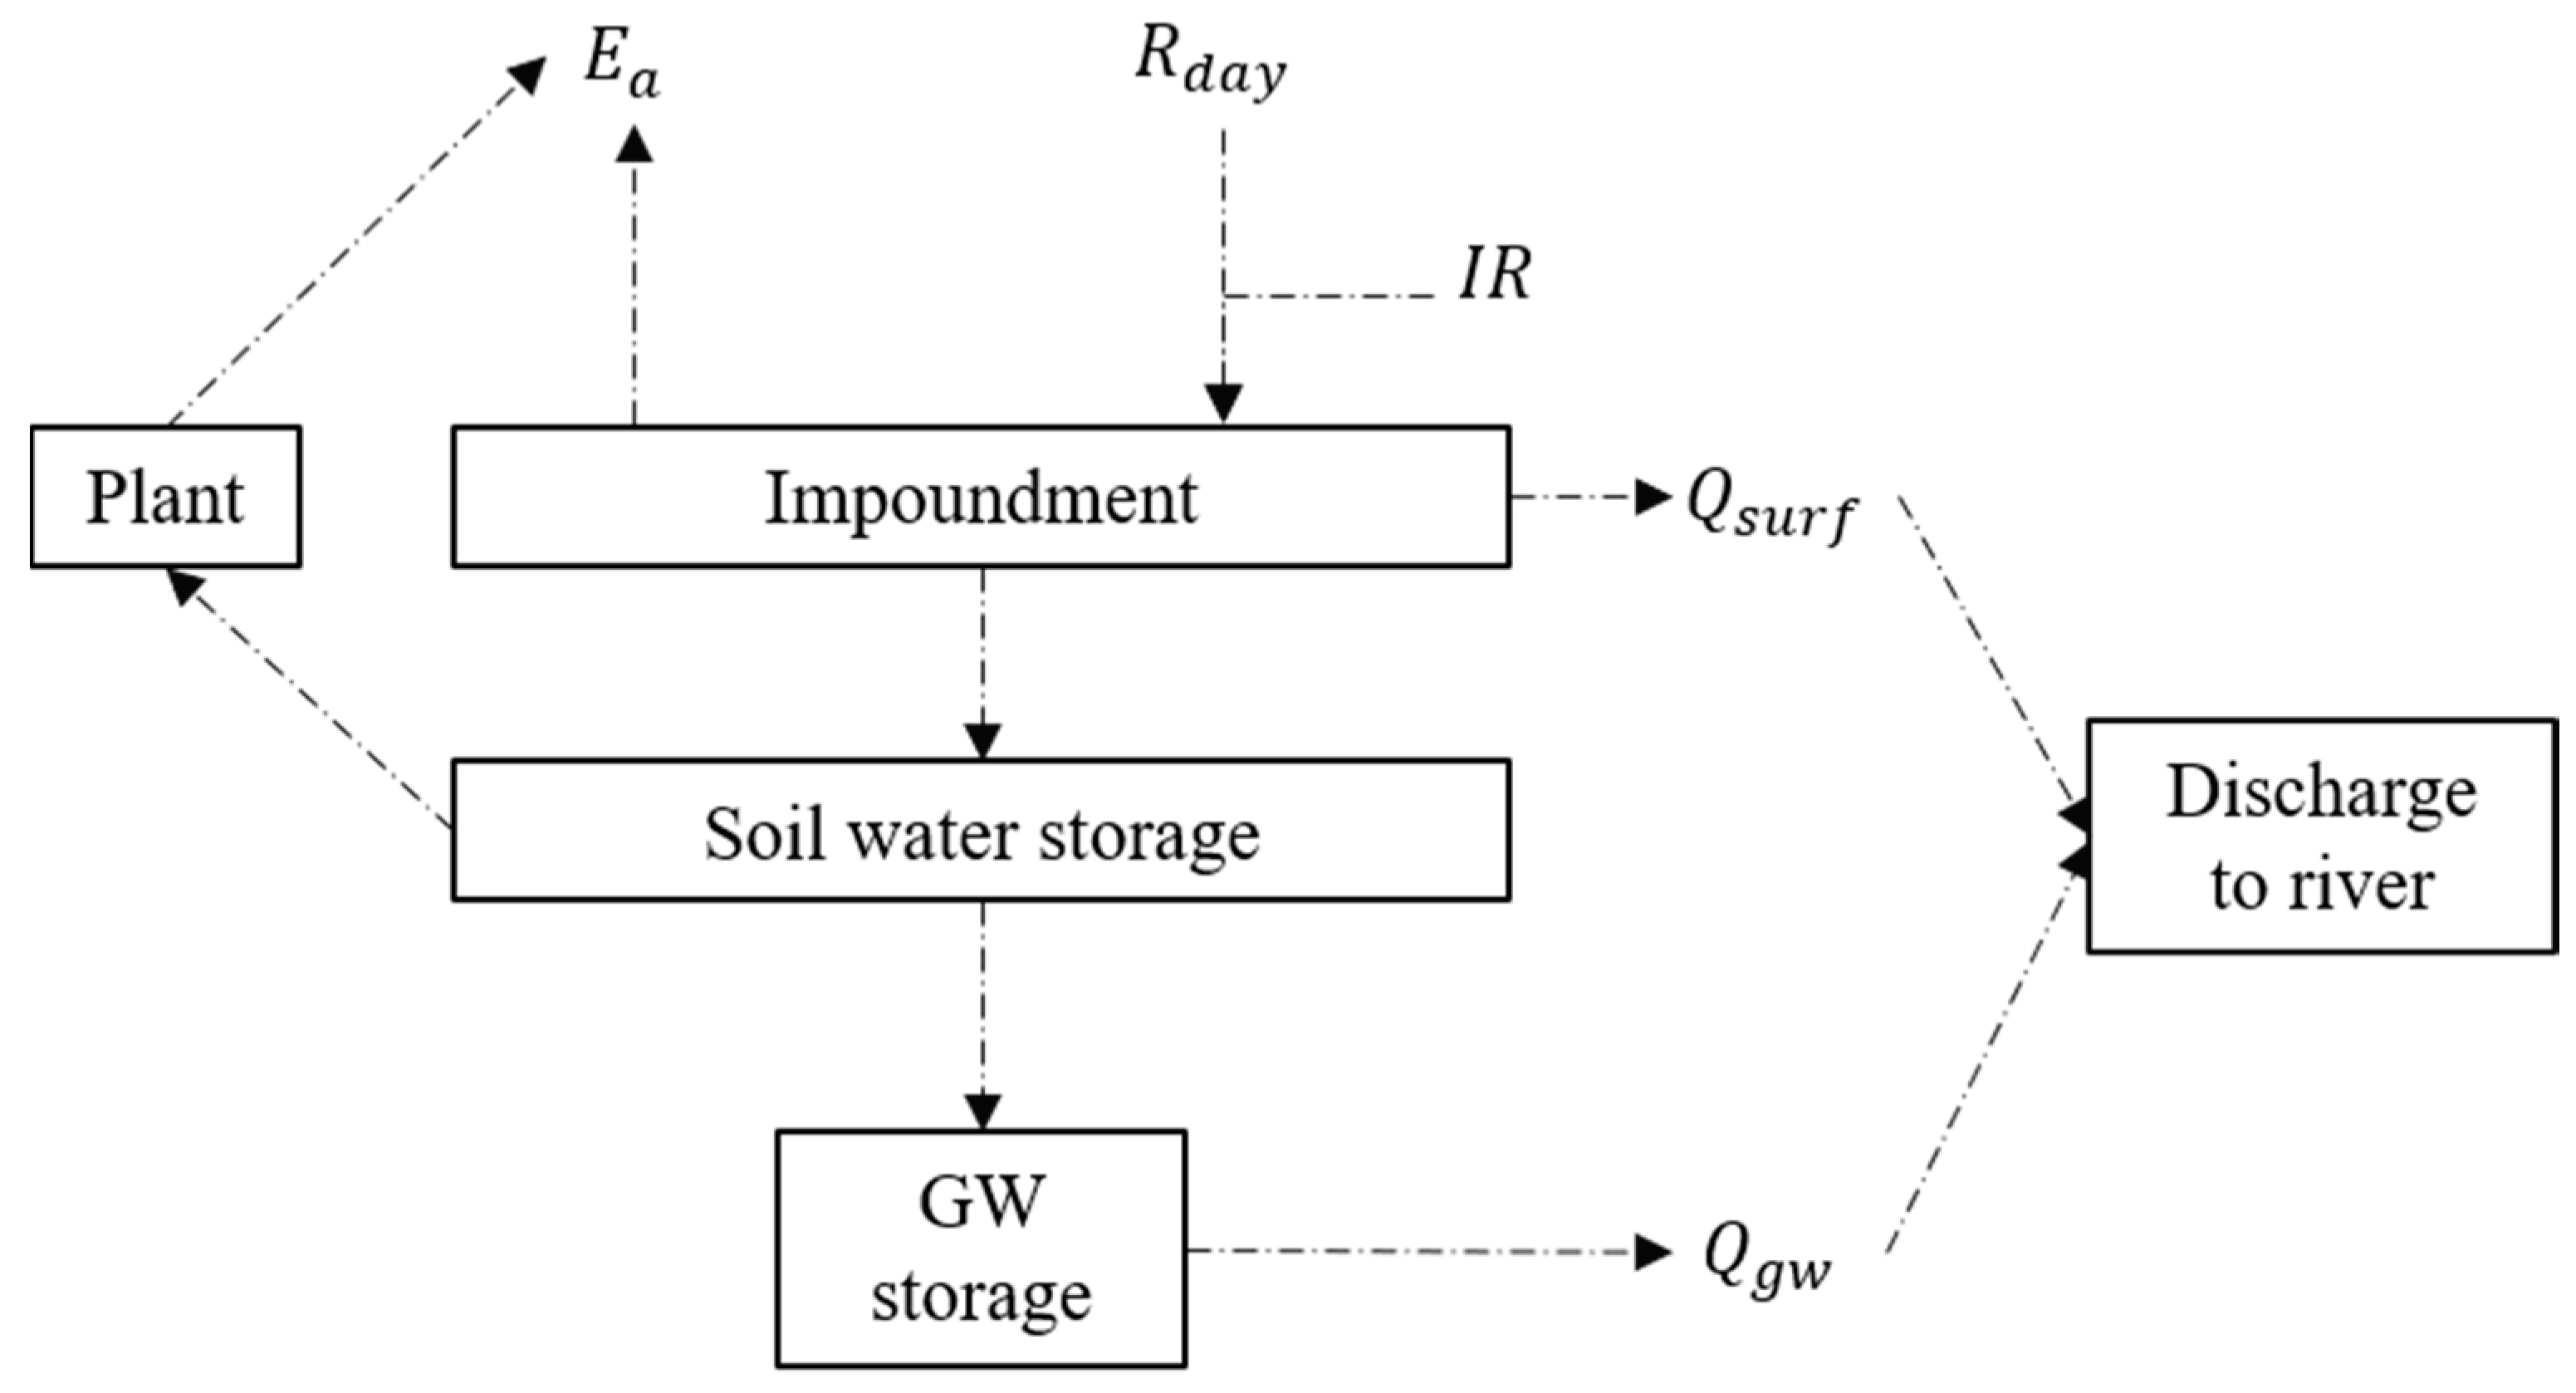
In previous studies, the pothole module was often used to model impoundment in paddy fields [21,22,23]. However, the computational algorithm of the pothole model does not target hydrological processes in paddy fields (Figure 2), and a paddy field and a pothole have conceptually different hydrological characteristics, especially with regard to soil water conditions and agricultural management. Soil in the pothole region is completely drained with tile drainage when a field is used for crop production [30]. However, soil is kept wet under paddy impoundment, and this leads to a lot of benefits for production [31]. With regard to the farmer’s management, depth of impoundment in a paddy field is controlled every day, in consideration of the growth of paddy crop and climatic conditions. The pothole is not appropriate for modeling water depth management because it calculates water balance in volume [20]. In this study, we propose a scheme to simulate paddy fields based on their physical hydrological processes, which can be the basis of further modification and application of SWAT in paddy field districts. A terrestrial process was modified, as shown in Figure 3, for this purpose. Additionally, agricultural management practices in paddy fields are different from the other farmlands assumed in SWAT. Thus, new paddy management options are added to the scheduled management scheme in SWAT.
2.2.1. Development of the Paddy Impoundment Module
Hydrological processes in paddy fields are different from processes in other land uses, because water from rainfall and irrigation is stored above the ground as an impoundment during growth seasons [31]. To represent paddy impoundment in SWAT, a new module for impoundment was developed [21]. Water balance was calculated using:
where ∆DEPimpnd is daily change of impounded depth (mm H2O), IR is daily irrigated water depth (mm H2O), Rday is daily precipitation (mm H2O), Qsurf is daily surface discharge (i.e., overflow from outlet weir) from paddy fields (mm H2O), EVimpnd is daily evaporation from water surface (mm H2O), and PERCday is daily water percolation to soil surface layer (mm H2O).
∆DEPimpnd = IR + Rday − Qsurf − EVimpnd − PERCday,
Qsurf,EVimpnd, and PERCday were determined using a newly developed subroutine for paddy field simulation, which was named the paddy subroutine. One of the major improvements is that water balance of impoundment is calculated in depth, whereas the pothole module calculates water balance in volume, which is not appropriate for paddy fields. Evaporation from the water surface was calculated using Equations (2) and (3).
where η is the evaporation coefficient, E0 is potential evapotranspiration for a given day (mm H2O), LAI is leaf area index of a crop grown in impoundment, and LAIev is the leaf area index when evaporation from the water surface does not occur.
If LAI < LAIev, EVimpnd = ηE0 (1 − LAI/LAIev),
If LAI ≥ LAIev, EVimpnd = 0,
For the parameters of η and LAIev, the values of 0.6 and 4.0 were adopted, respectively, based on previous reports [21]. Computation techniques for Qsurf and IR are described in the following sections.
In SWAT-Paddy, the method for computing percolation of water from impoundment to soil that was used in the original or modified pothole [20,22] was not adopted, because the soil water content and saturated hydraulic conductivity of surface soil layers are only elements in determining the percolation rate, and these lead to underestimation of percolation in paddy fields [19]. In actual paddy fields, there is constant water loss by seepage through the bund of the paddy field and vertical percolation, even though surface soils are saturated and hydraulic conductivity is very low because of puddling. Thus, the potential percolation rate (PERC0) from impoundment to soil layers is defined as a constant value after puddling, as modeled in previous research [21].
2.2.2. Modification of the Operation Scheme of Irrigation and Drainage for Paddy Field Districts
Controlling impounded water depth is quite important for rice production [32]. In SWAT-Paddy, the water depth control method used in the previous study [22] was adopted. Three critical water depths, namely, maximum flooding depth for surface discharge computation (DEPmax; mm H2O), irrigation trigger depth (DEPtrigger; mm H2O), and irrigation target depth (DEPtarget; mm H2O), were introduced in this method. A new command was added to the schedule management subroutine that changes the values of the critical water depths on each day. Surface discharge was calculated using Equations (4) and (5) in the paddy subroutine.
where DEPimpnd is depth of impoundment on a given day (mm H2O), and DEPmax is maximum depth of impoundment (mm H2O).
If DEPimpnd > DEPmax, Qsurf = DEPimpnd − DEPmax,
If DEPimpnd ≤ DEPmax, Qsurf = 0,
The demanded irrigation depth on a given day (IRdemand, mm H2O) was calculated using Equations (6) and (7).
If DEPimpnd < DEPtrigger, IRdemand = DEPtarget − DEPimpnd,
If DEPimpnd ≥ DEPtrigger, IRdemand = 0,
During rice cultivation, the value of IRdemand increases, and one water resource is sometimes insufficient to satisfy the water demand. Therefore, multiple water resources, including river, aquifer, and irrigation pond, are designed to be used in paddy irrigation systems when the amount of available water from a given resource is estimated to be insufficient [33,34]. In a paddy field district with a well-developed irrigation system, including water withdrawal facilities and irrigation canals, the ratio of irrigated water amount from each resource can be assumed to be the same as the area of the paddy fields, and the ratio does not fluctuate. Therefore, we introduced a parameter for the main resource ratio (rmain), assuming a doubled water resource requirement for one district, as shown in Equations (8) and (9).
where IRdemand,main is irrigation demand for main water resource (mm H2O), and IRdemand,sub is irrigation water demand for sub water resource (mm H2O).
IRdemand,main = rmain × IRdemand,
IRdemand,sub = (1 − rmain) × IRdemand,
Equations (6)–(9) were added to a subroutine of auto-application of irrigation.
2.2.3. Puddling as Scheduled Management
Puddling is carried out to keep water above the land surface; farmers maintain a low hydraulic conductivity of paddy soil [35,36]. In puddling, farmers break soil aggregations by rotary tillage and fill cracks in the plow sole, made by tractor compaction, with small soil particles, and this leads to low conductivity in the plow sole. Therefore, the hydraulic conductivity of surface soil in a paddy field is low in rice growing season. In addition, this means that the surface soil is saturated with water, leading to reduced conditions in paddy soil. A reduced soil environment promotes denitrification, which is related to nitrogen loss in paddy soil. Therefore, the operation commands “puddling” and “break puddle” were added to the scheduled management subroutine in SWAT-Paddy. Equation (10), originally from the previous work in APEX modification for paddy fields [37], is computed when puddling is carried out.
where Ksat,wet is saturated hydraulic conductivity after puddling (mm/h), coeffpudd is a puddling coefficient less than 1, and Ksat,dry is an original value of hydraulic conductivity (mm/h).
Ksat,wet = coeffpudd × Ksat,dry,
Users can set the depth of the plow sole, and this equation is applied to the layer including the plow sole and the overlying layers. After completion of paddy cultivation, users can carry out break puddle to return the hydraulic conductivity to its original value (Ksat,dry). In addition to changing the physical properties of soil, puddling often causes water pollution when farmers drain water, which contains high concentrations of sediments and nutrients resuspended by mixing surface soil and impounded water, just after the management is carried out. To represent this, resuspension after puddling was also modeled in this puddling scheme based on the tillage algorithm existing in SWAT. The basic idea of this is conceptually the same as the modification in APEX [37].
2.3. Study Area for Evaluation
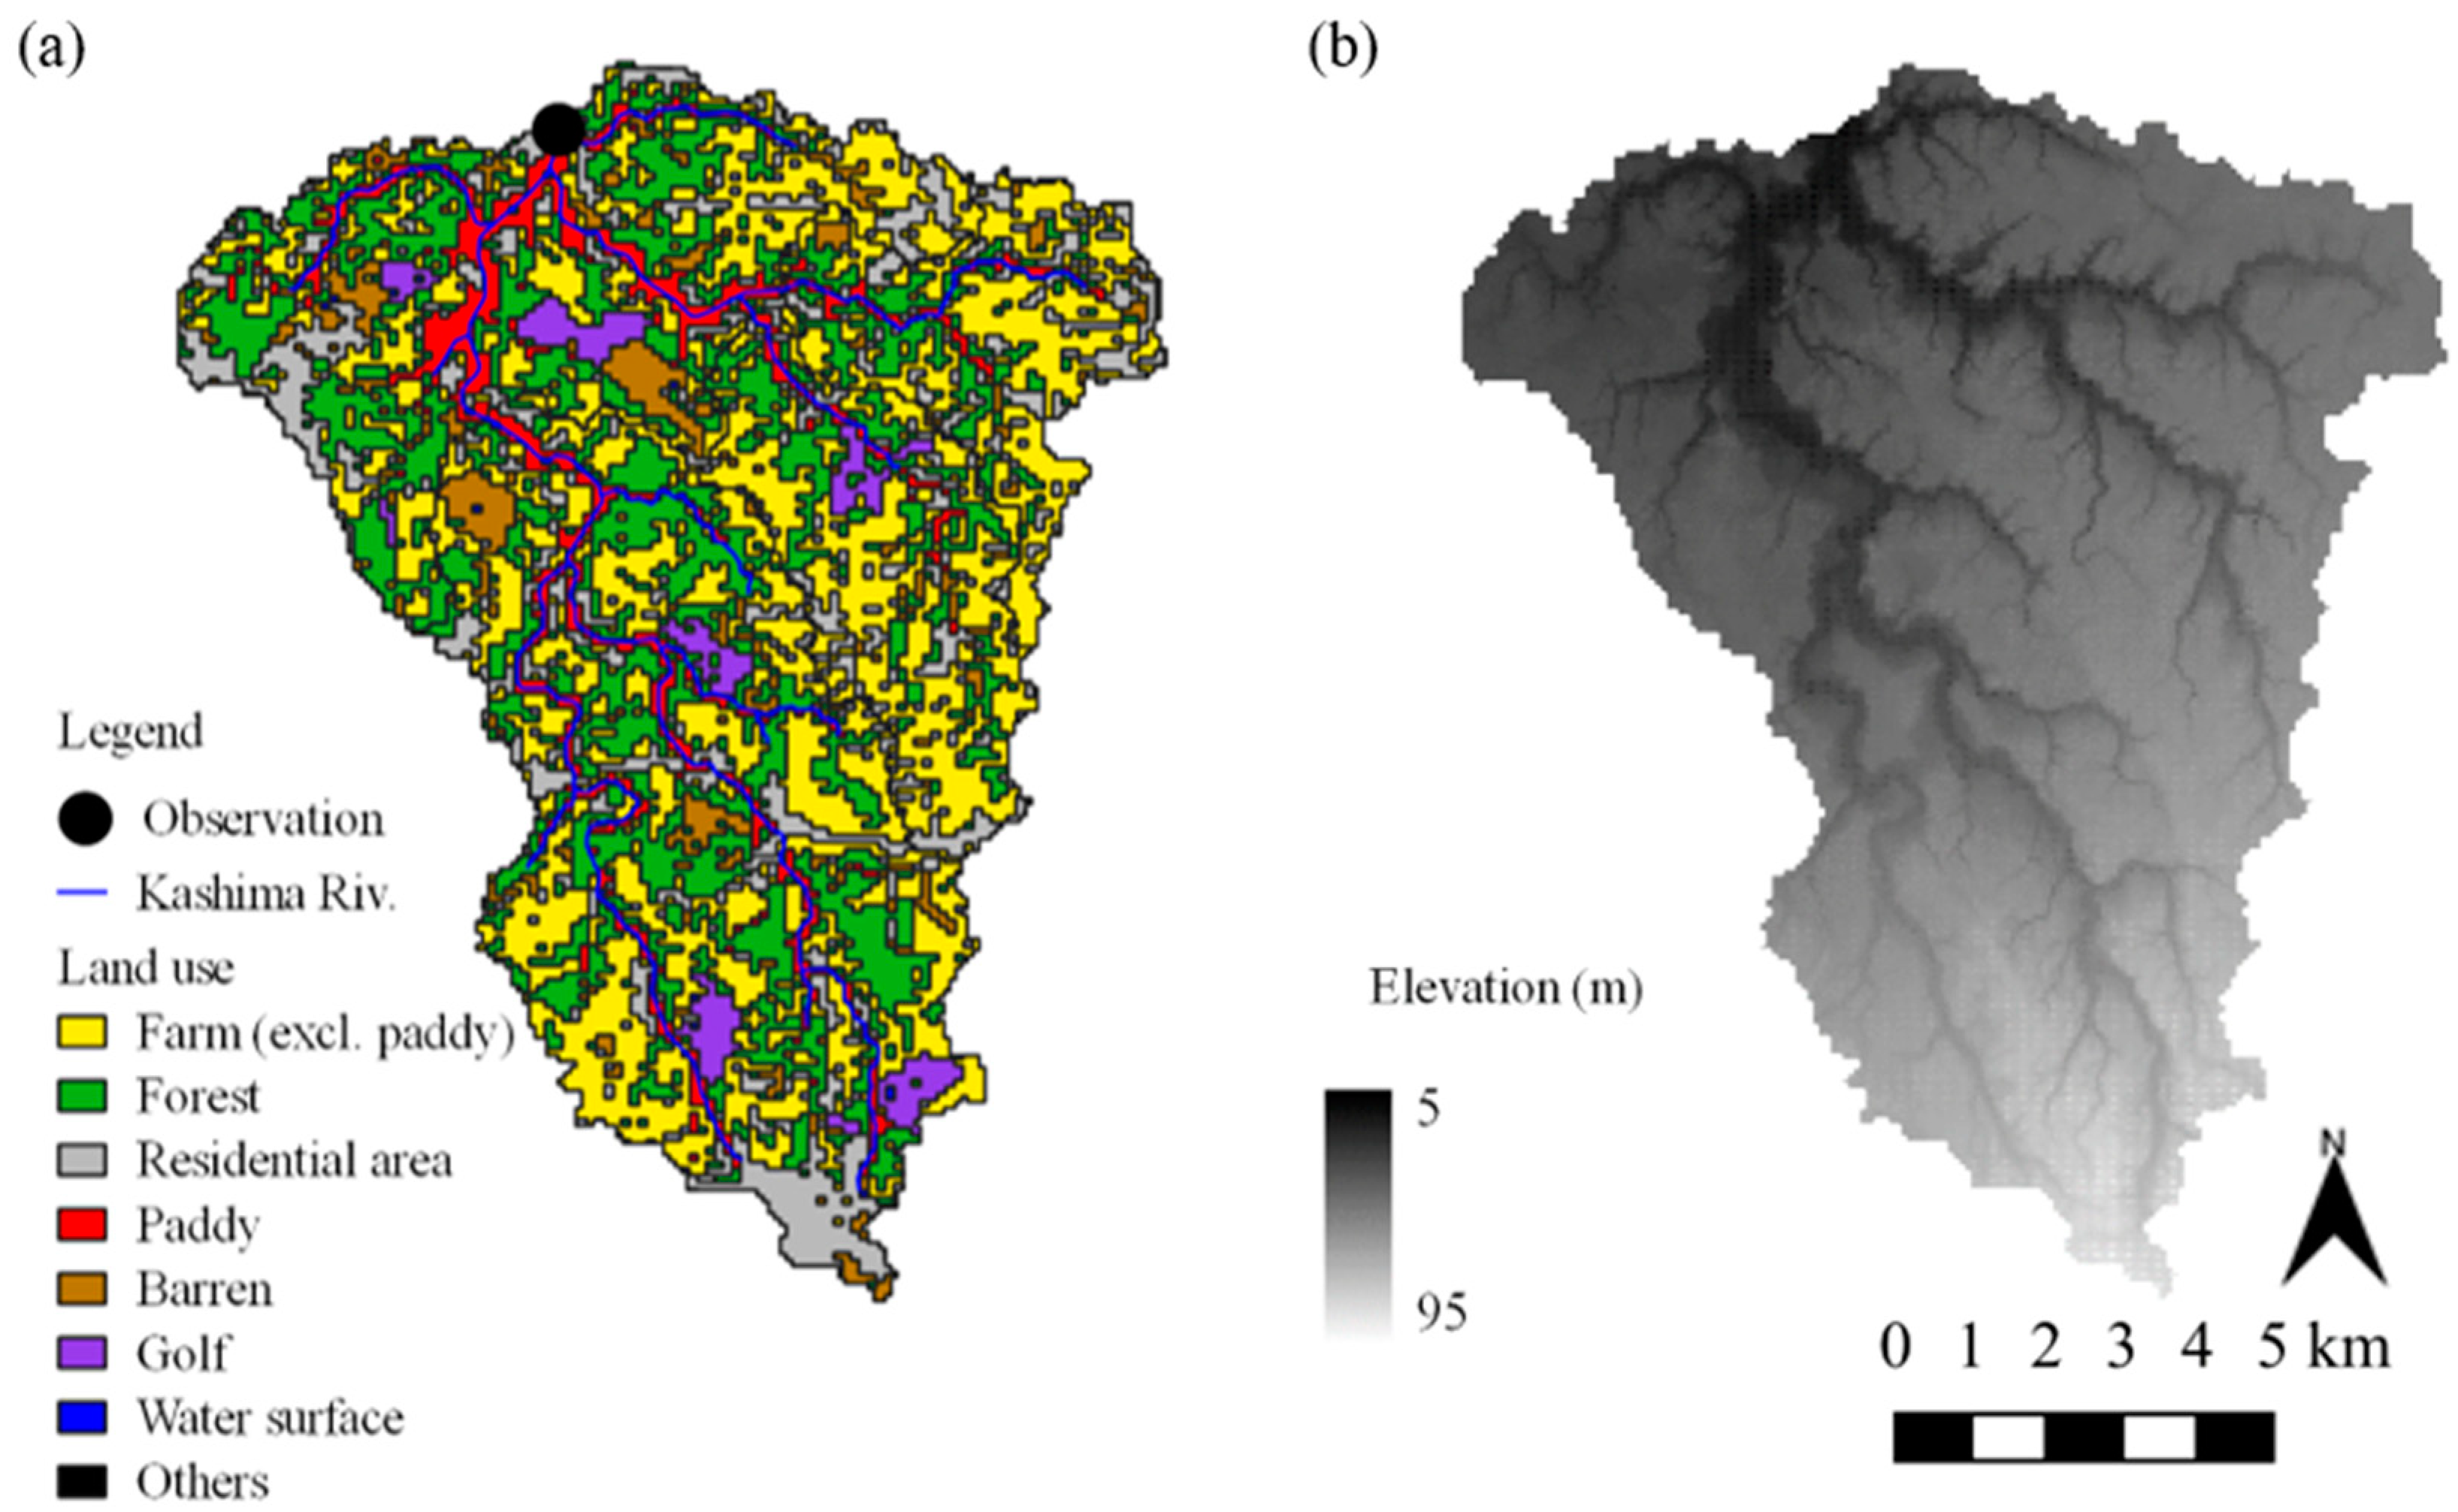
SWAT-Paddy was evaluated in a case study in the Upper Kashima River watershed in the Imbanuma Lake basin, Chiba Prefecture, which is located in the central region of Japan. The area of the study watershed is 117 km2. The watershed is covered mainly by andosol soil, which is made from volcanic ash and is highly permeable [38]. The daily average river discharge observed at the outlet of the study watershed was 2 to 3 m3·s−1 on days without a rainfall event, and 5 to more than 20 m3·s−1 on days with a rainfall event. In this area, small valleys and hills form a complex landscape, called “yatsu”; however, there is no significant difference in their elevation. Therefore, surface runoff is insignificant in this area, and river flow is dominated by groundwater discharge. In this watershed, lowland areas are used for paddy fields, which occupy 9% of the watershed. Water is pumped up from the river and deep aquifer to irrigated paddy fields through small open canals and is drained through channels to the Kashima River. Irrigation pumps and the gates between drainage channels and the river, which is usually closed during the irrigation period, are mainly controlled by farmers. Farmlands, excluding paddy fields, constitute the largest land use in this watershed; it is located on a hilly area (Figure 4 and Table 1). The areal portion of paddy fields is not so high, but it has a significant impact on the watershed hydrology because paddy fields are located along the river. In addition, 2000–3000 mm of water is withdrawn from the river and deep aquifer using pump facilities for the irrigated paddy fields [39]. This value is much higher than average annual precipitation (approximately 1400 mm), and the main source of irrigation, which accounts for 80% of total irrigation water use, is the Kashima River itself. Therefore, paddy irrigation has an impact on the water environment through both irrigation and drainage practices. Thus, considering paddy fields in a hydrological simulation is important for the management of this watershed. We set a hydrologic investigation point in the middle of Kashima River and observed the river flow rate in the period 2012–2014, although we stopped monitoring between January and March because paddy fields are not cultivated in that period. In addition, data were not recorded during October–December 2013 because of damage to sensors caused by a large typhoon that happened on 13 October 2013. Surface discharge was monitored at one of paddy fields in the watershed in the period of 26 April–4 August 2016. Actual evapotranspiration (ET) was estimated using the FAO56 method [40], which has been well validated in similar environments [41]. Using this observation data, the water balance of the target paddy fields was estimated.
2.4. The Application and Calibration of SWAT
Model input files were generated using ArcSWAT 2012 with the following data:
With this data, 227 HRUs were defined in 11 subbasins, classified by 8 land uses, 5 soil classes and 2 slope classes with a threshold rate of 5% in the subbasin area for each. The simulation period was 2012–2014 and a warm-up simulation was conducted for five years (2008–2011) prior to the main simulation. Management schedule in paddy fields was determined based on the local standard of fertilization [47], local guidelines for paddy management [48], and field monitoring conducted in 2016 at a paddy field located near the outlet of the watershed. In addition, both river and deep aquifer sources are used for irrigation in this region. However, SWAT allows for only one irrigation source per HRU. With regard to water balance, water withdrawal from deep aquifers is an additional water resource at a river watershed scale, because deep groundwater flows directly to the sea and does not affect river flow in this watershed. On the other hand, river water use within this watershed is cyclic due to the use of small pumps located along the river. Therefore, groundwater was chosen as the irrigation source in the calibration of SWAT. To widen the model capability globally, SWAT allows users to choose several methods to compute each hydrological process. In this study, we chose the plant-evapotranspiration-related estimation method for the soil moisture-retention parameter used in the surface runoff computation [49], and the Priestley-Taylor method [50] to compute the potential ET in order to present the hydrological characteristics of the watershed. To evaluate the performance of the model, the hydrological parameters (Table 2) were firstly calibrated at watershed scale by SWAT-CUP with the original SWAT, and then, SWAT-Paddy was applied with the parameters obtained in the calibration.
2.5. The Setting and Evaluation of SWAT-Paddy
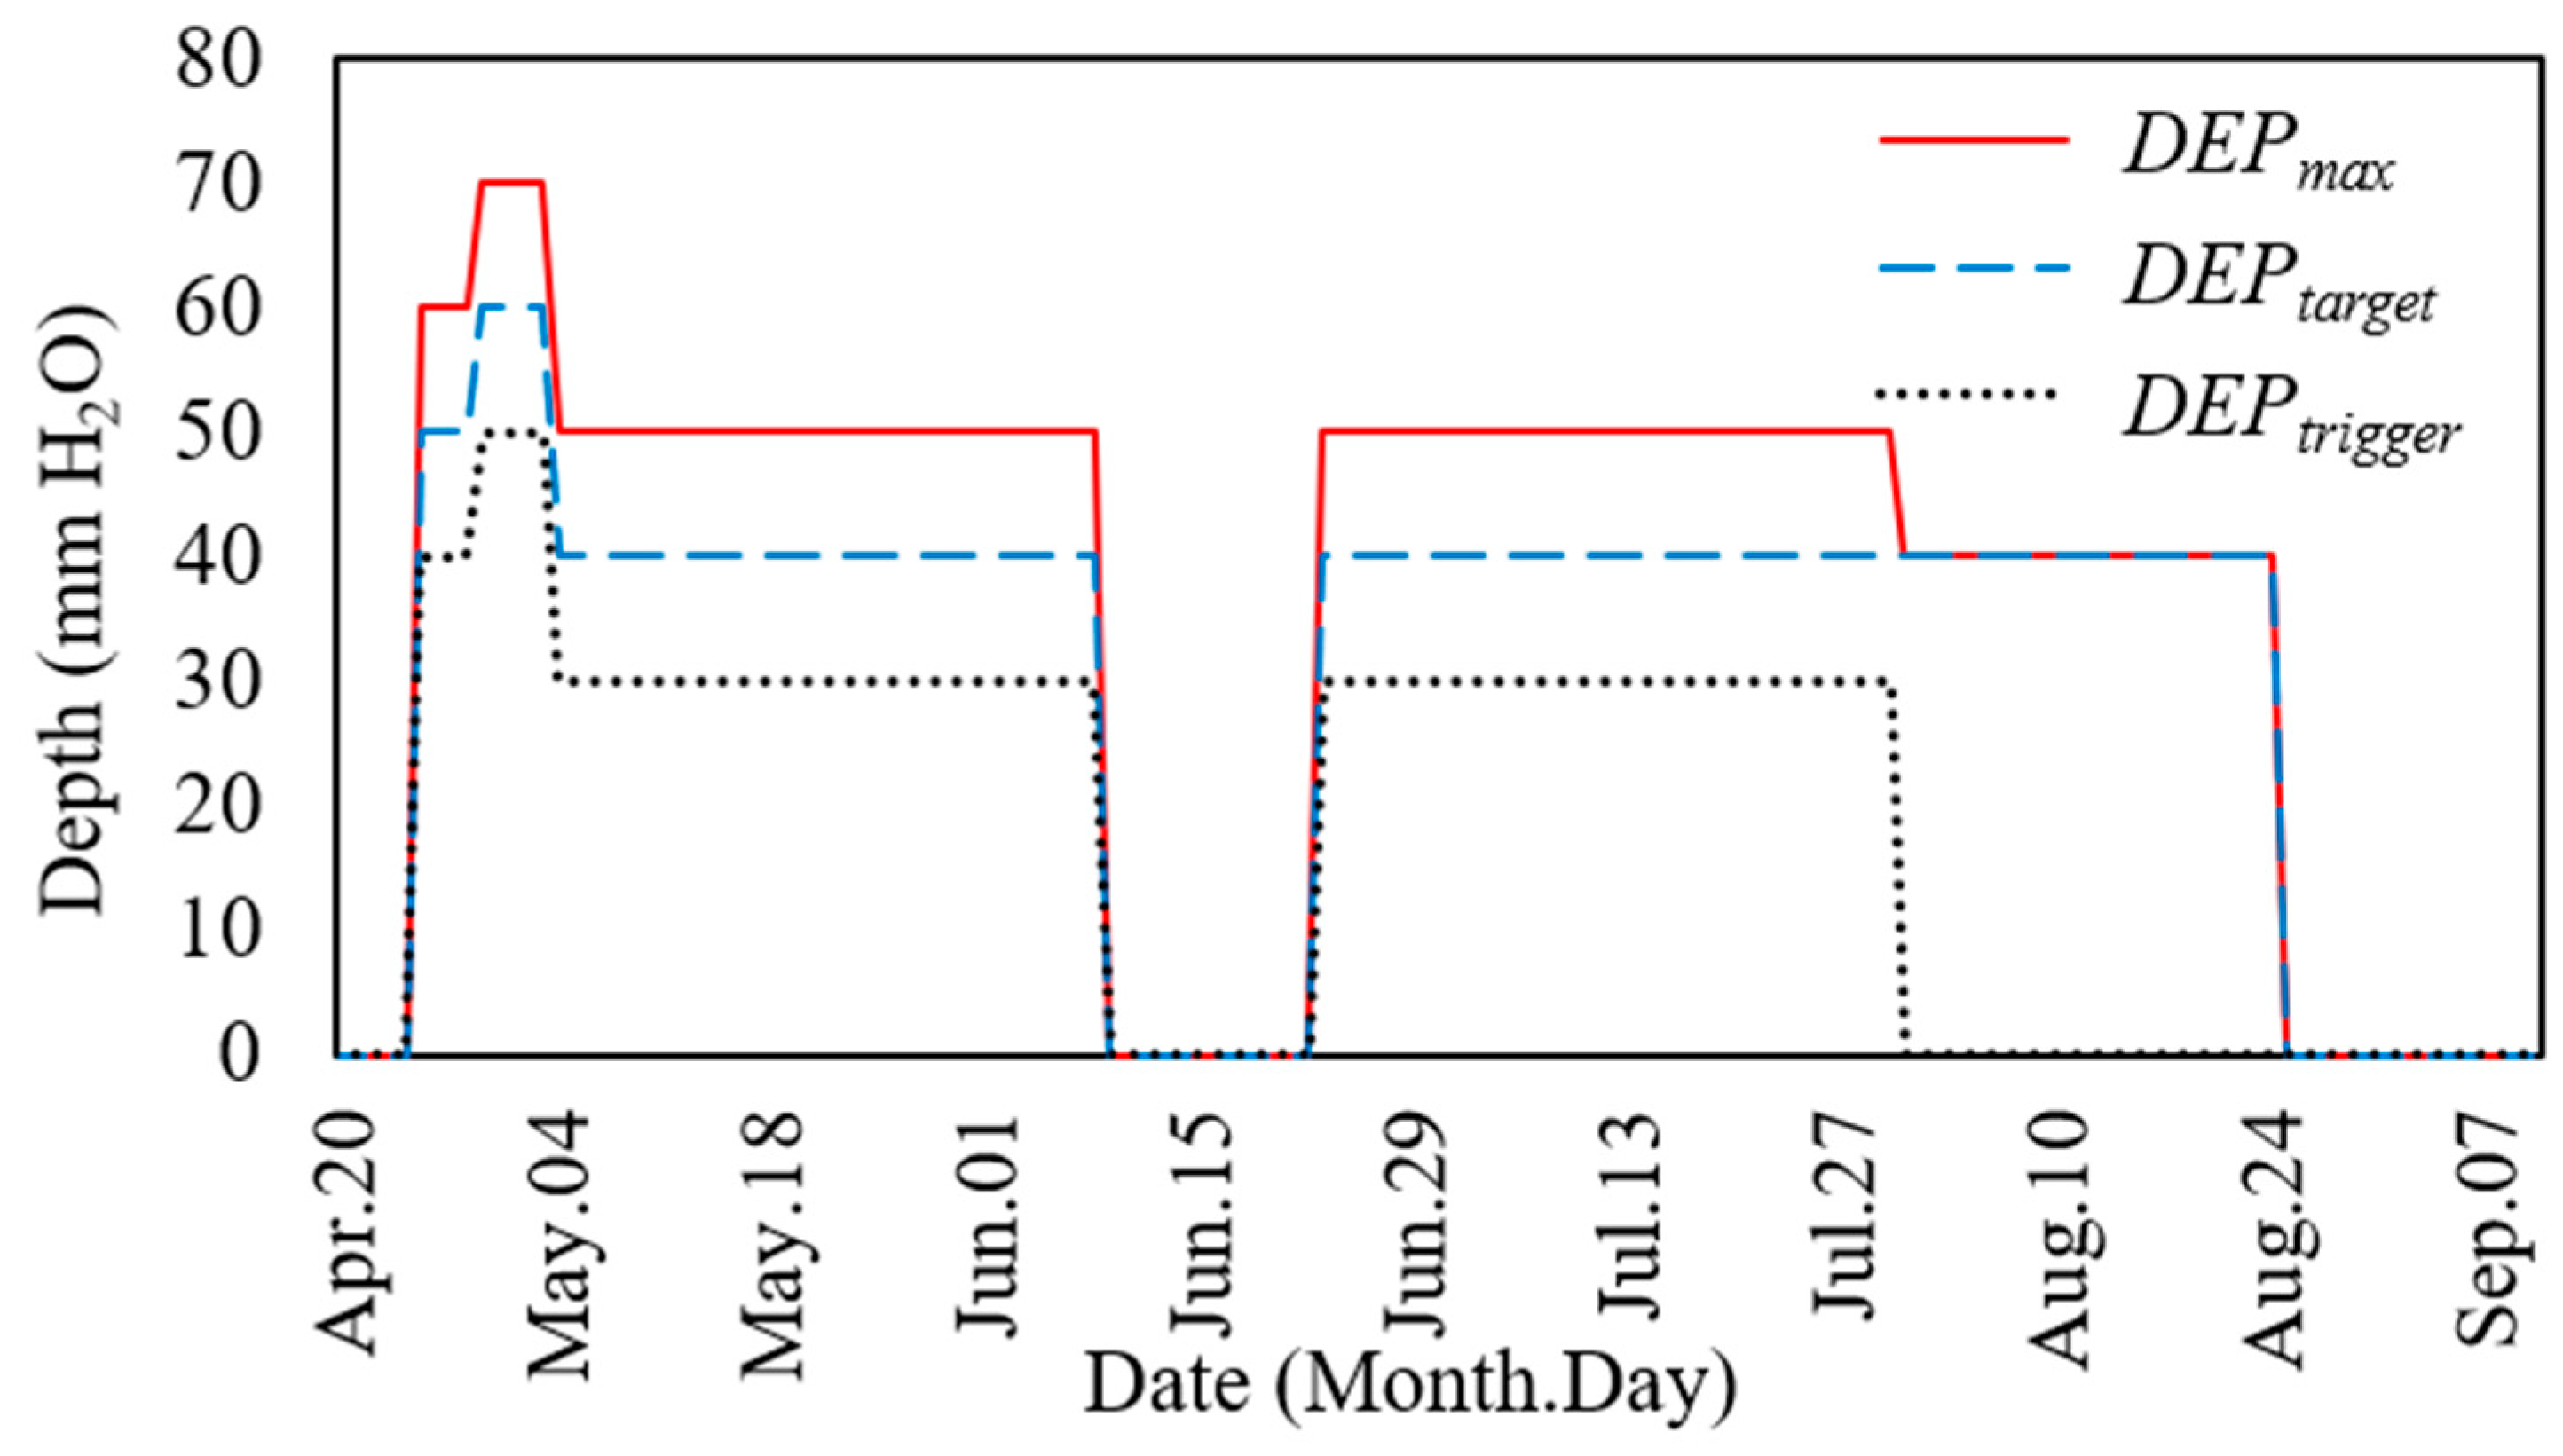
In the SWAT-Paddy application, water depth and agricultural management were defined as shown in Figure 5 and Table 3, respectively. The schedules were determined based on agriculture guidelines of the Chiba Prefecture local government [48]. The value of PERC0 was set to 10 (mm H2O), as recommended and observed in the same region [51,52]. To examine the performance of the puddling model introduced in SWAT-Paddy, five values were inputted for the parameter coeffpudd: 1, 0.1, 0.01, 0.001, and 0.0001. For the evaluation, we chose an HRU, which is defined as a paddy field with gleysol soil that is used for paddy cultivation in this region and a gentle slope towards the lowest subbasin. The simulated values of surface runoff using SWAT and SWAT-Paddy were compared with each other. Subsequently, performances of the two models were compared based on simulation results for river flow during the period that were the same as the calibration results of SWAT and water balance in the paddy HRU in the period of 26 April–4 August in 2016.
3. Results
3.1. Calibration of SWAT
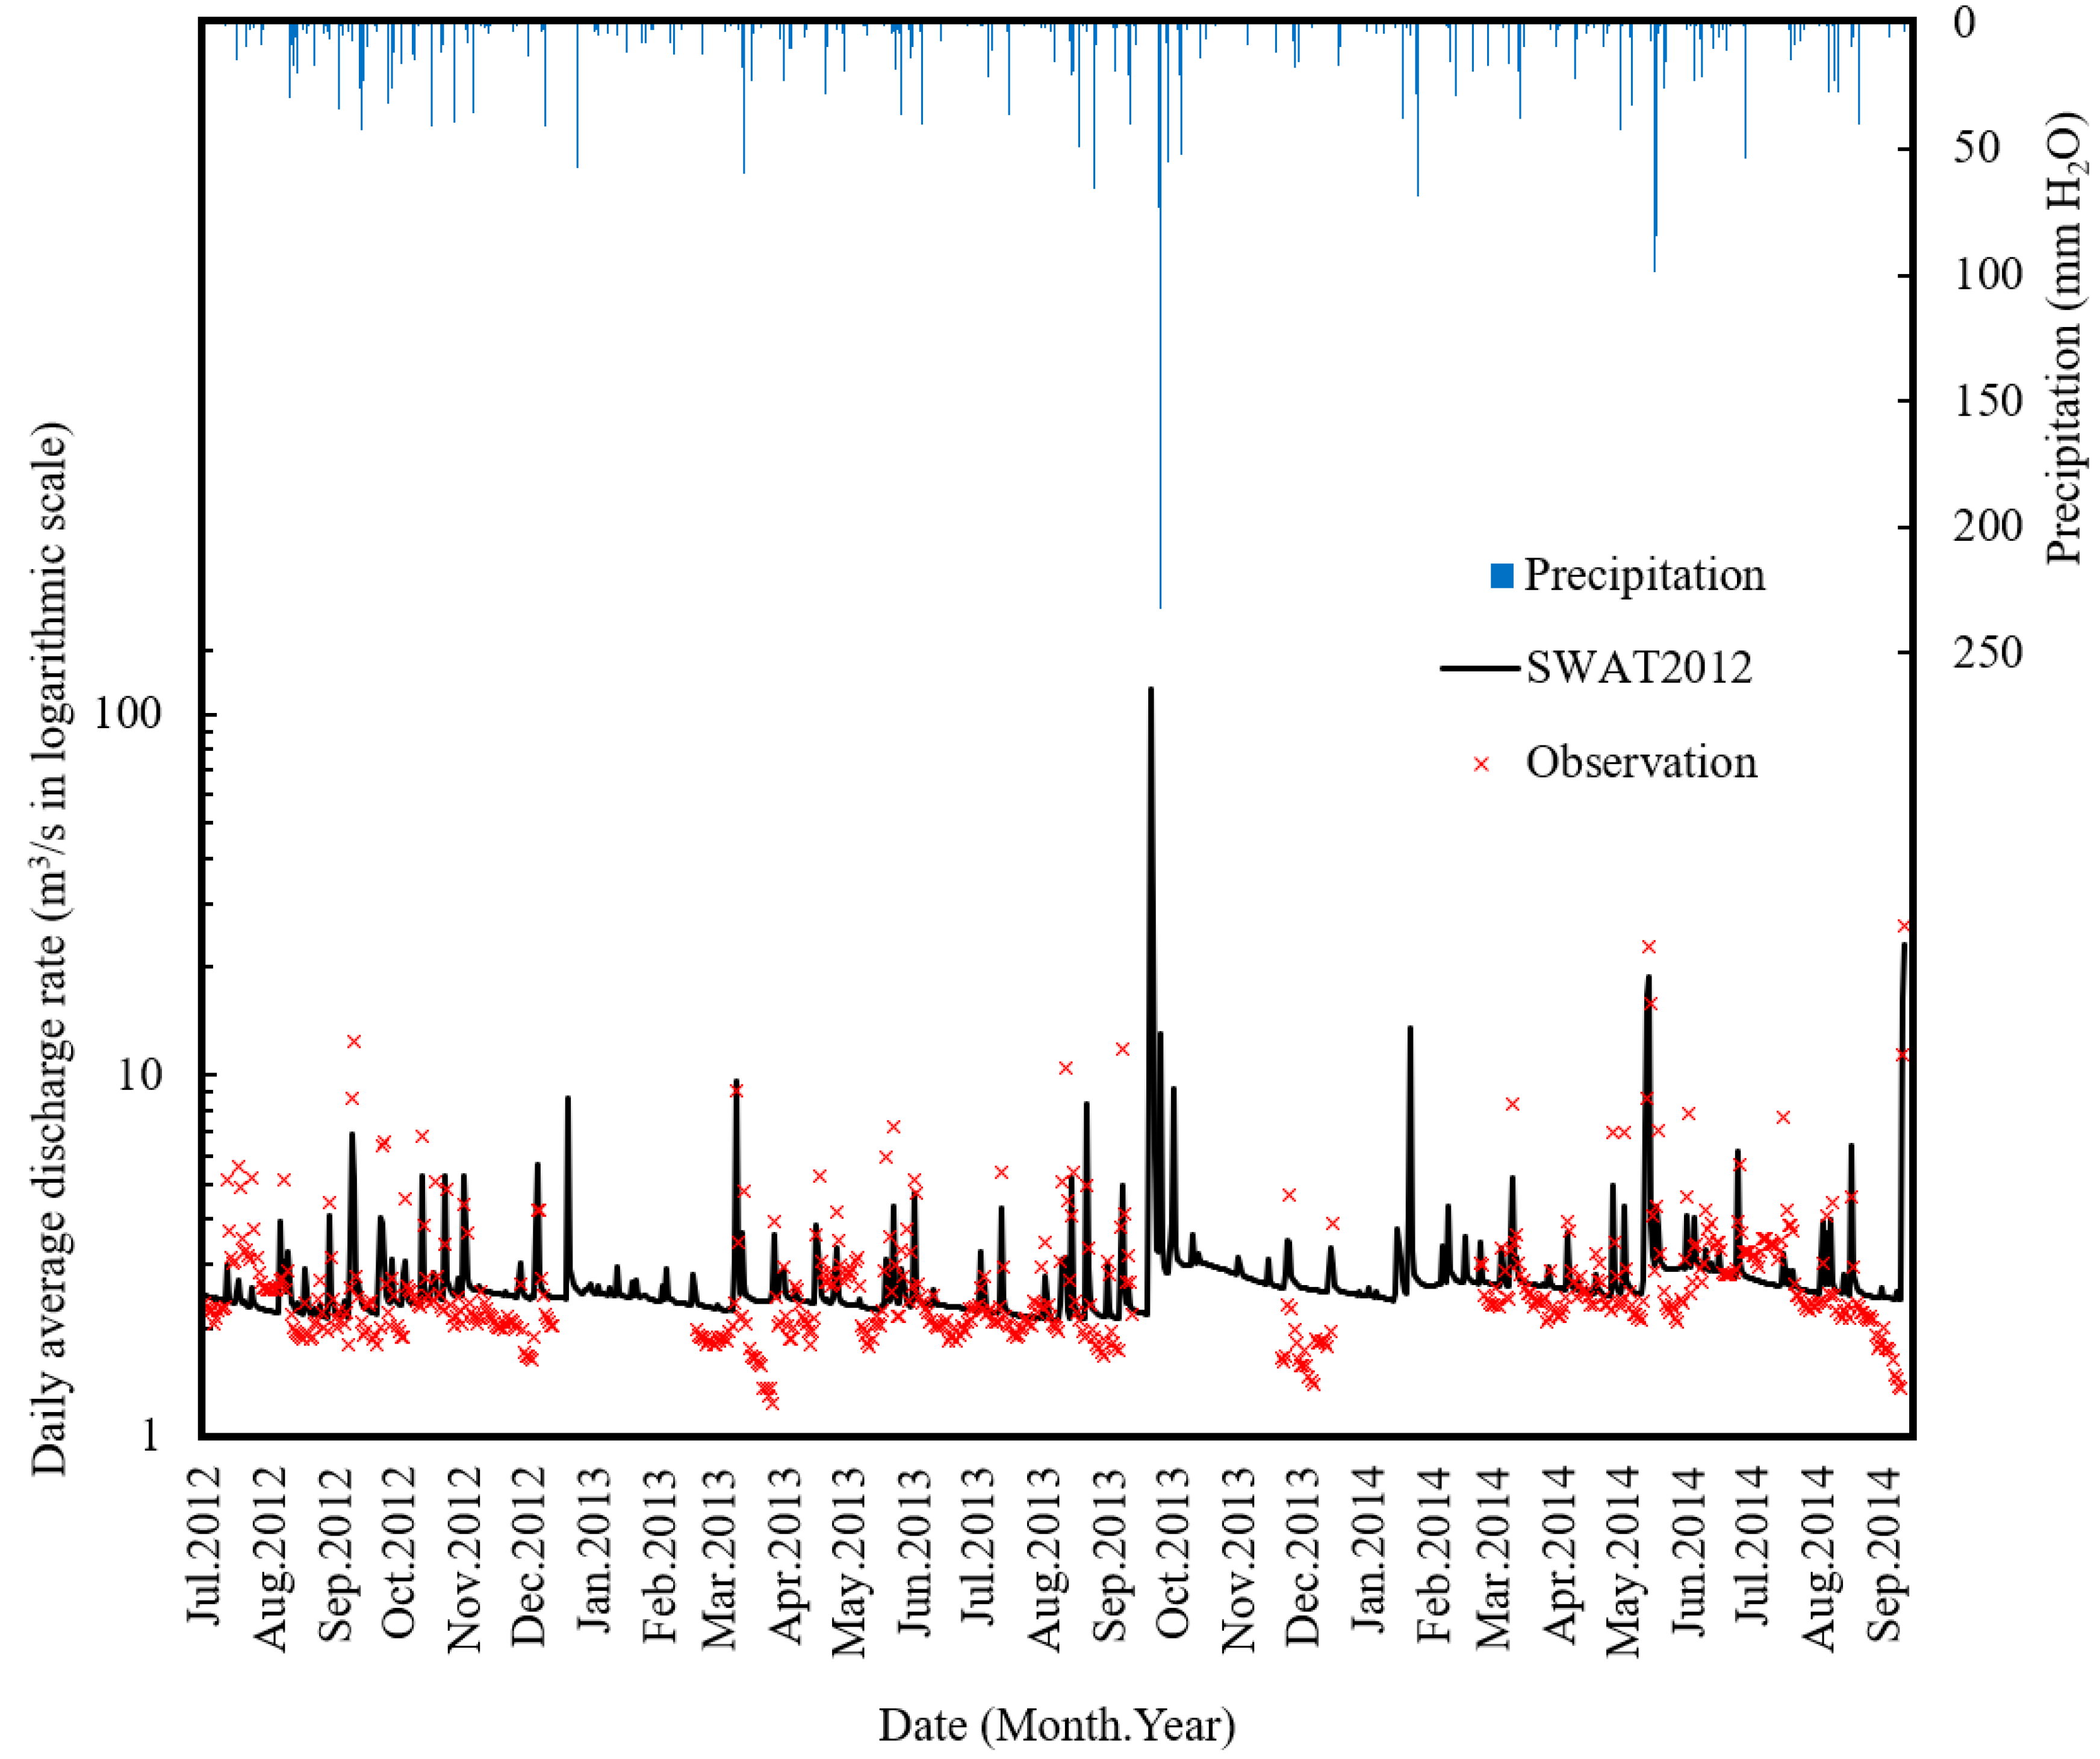
The parameters required to compute the hydrologic cycle in this watershed were calibrated with daily river flow data, which was observed in the period between 2012 and 2014, using the SUFI-2 [53] method in SWAT-CUP. After seven iterations (one iteration equals 1500 simulations), we obtained the best parameter set (Table 4). In the SUFI-2 method, parameter sensitivity is determined by computing multiple regression systems [54]. In this process, we got the ranking of parameter sensitivities in the final iteration (Table 4). The p-value of each parameter obtained from the t-test shows that the sensitivity of ALPHA_BF is considerably significant. This means that the groundwater process in this watershed has a large impact on river flow compared to other processes. In addition, the value of ALPHA_BF is calibrated to a low value to represent the highly stable base flow of the Kashima River. Based on the results of the calibration, the watershed was characterized as being very flat, with groundwater discharge taking a very long time to reach river flow. Using the best parameter set gained in the calibration process, the Nash Sutcliffe model efficiency (NSE), Ratio of RMSE to the standard deviation of the observations (RSR), and percent bias (PBIAS) of the daily river flow simulation (Figure 6) were measured to be 0.63, 0.61, and 1.57, respectively, which indicates that the hydrological simulation is “satisfactory” [55]. Therefore, this parameter set was chosen to be used for the testing of SWAT-Paddy.
3.2. Test of Soil Moisture Simulation with Puddling Operation
To represent saturated soil conditions in paddy fields, puddling management was added to SWAT-Paddy. To check the model performance and to identify the value of coeffpudd, different values were inputted into the model. Ref. [56] shows that the effect of puddling in terms of coeffpudd is in the range between 5 × 10⁻¹⁰ and 1 × 10⁻⁴ for paddy fields in Japan. Among the values of original hydraulic conductivity, the highest value was 85.41 mm/h for the second layer (10–294 mm), and the lowest value was 6.46 mm/h in layers deeper than 466 mm. Figure 7 shows the soil water content simulated with each coefficient value. Soil water content in irrigation periods was observed to increase with a decrease in coefficient, and no significant difference was observed between the simulation results with coeffpudd = 0.001 and coeffpudd = 0.0001. Therefore, the value of 0.0001 was considered extraordinarily low for the model, and the value of 0.001 was used in the case study. Figure 8 shows the fluctuation of degree of saturation in each layer of soil in the paddy HRU with coeffpudd = 0.001. In this study, the plow sole was set in the second layer. Thus, the first and second layers became saturated after puddling. This graph suggests that the puddling was operated successfully in SWAT-Paddy.
3.3. Evaluation of Water Balance Simulated by SWAT-Paddy
3.3.1. Rainfall-Runoff Simulation
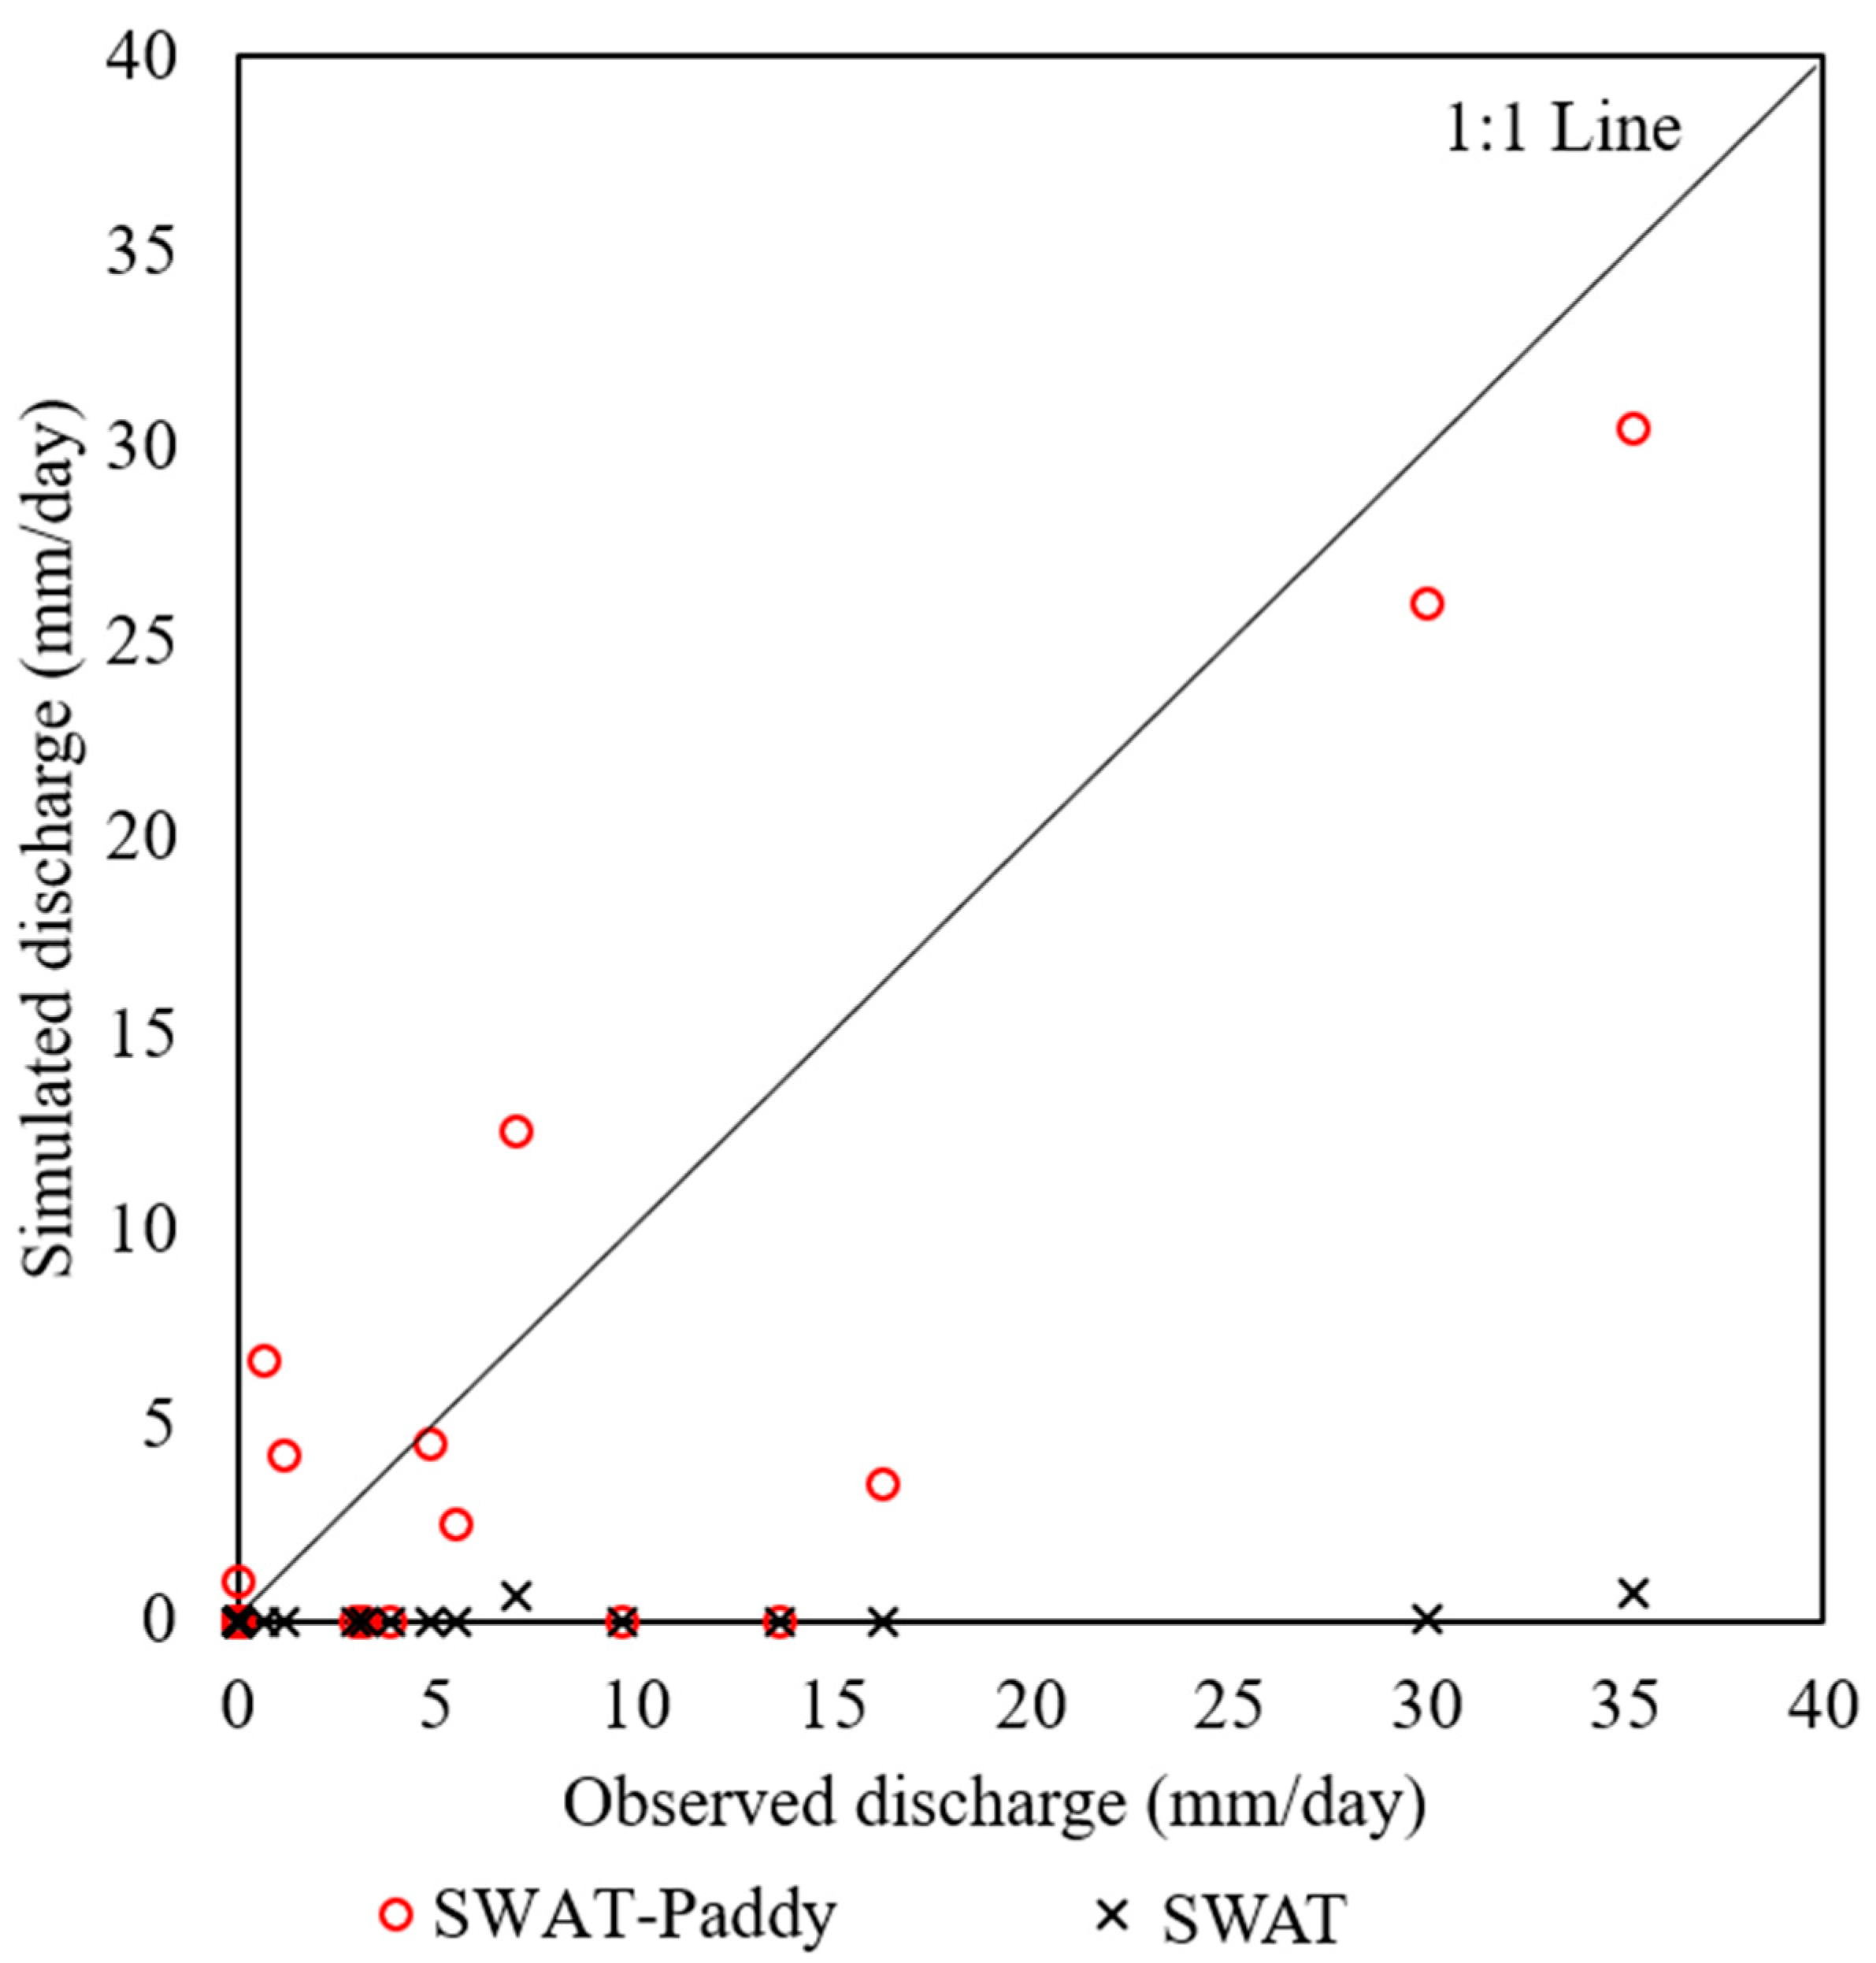
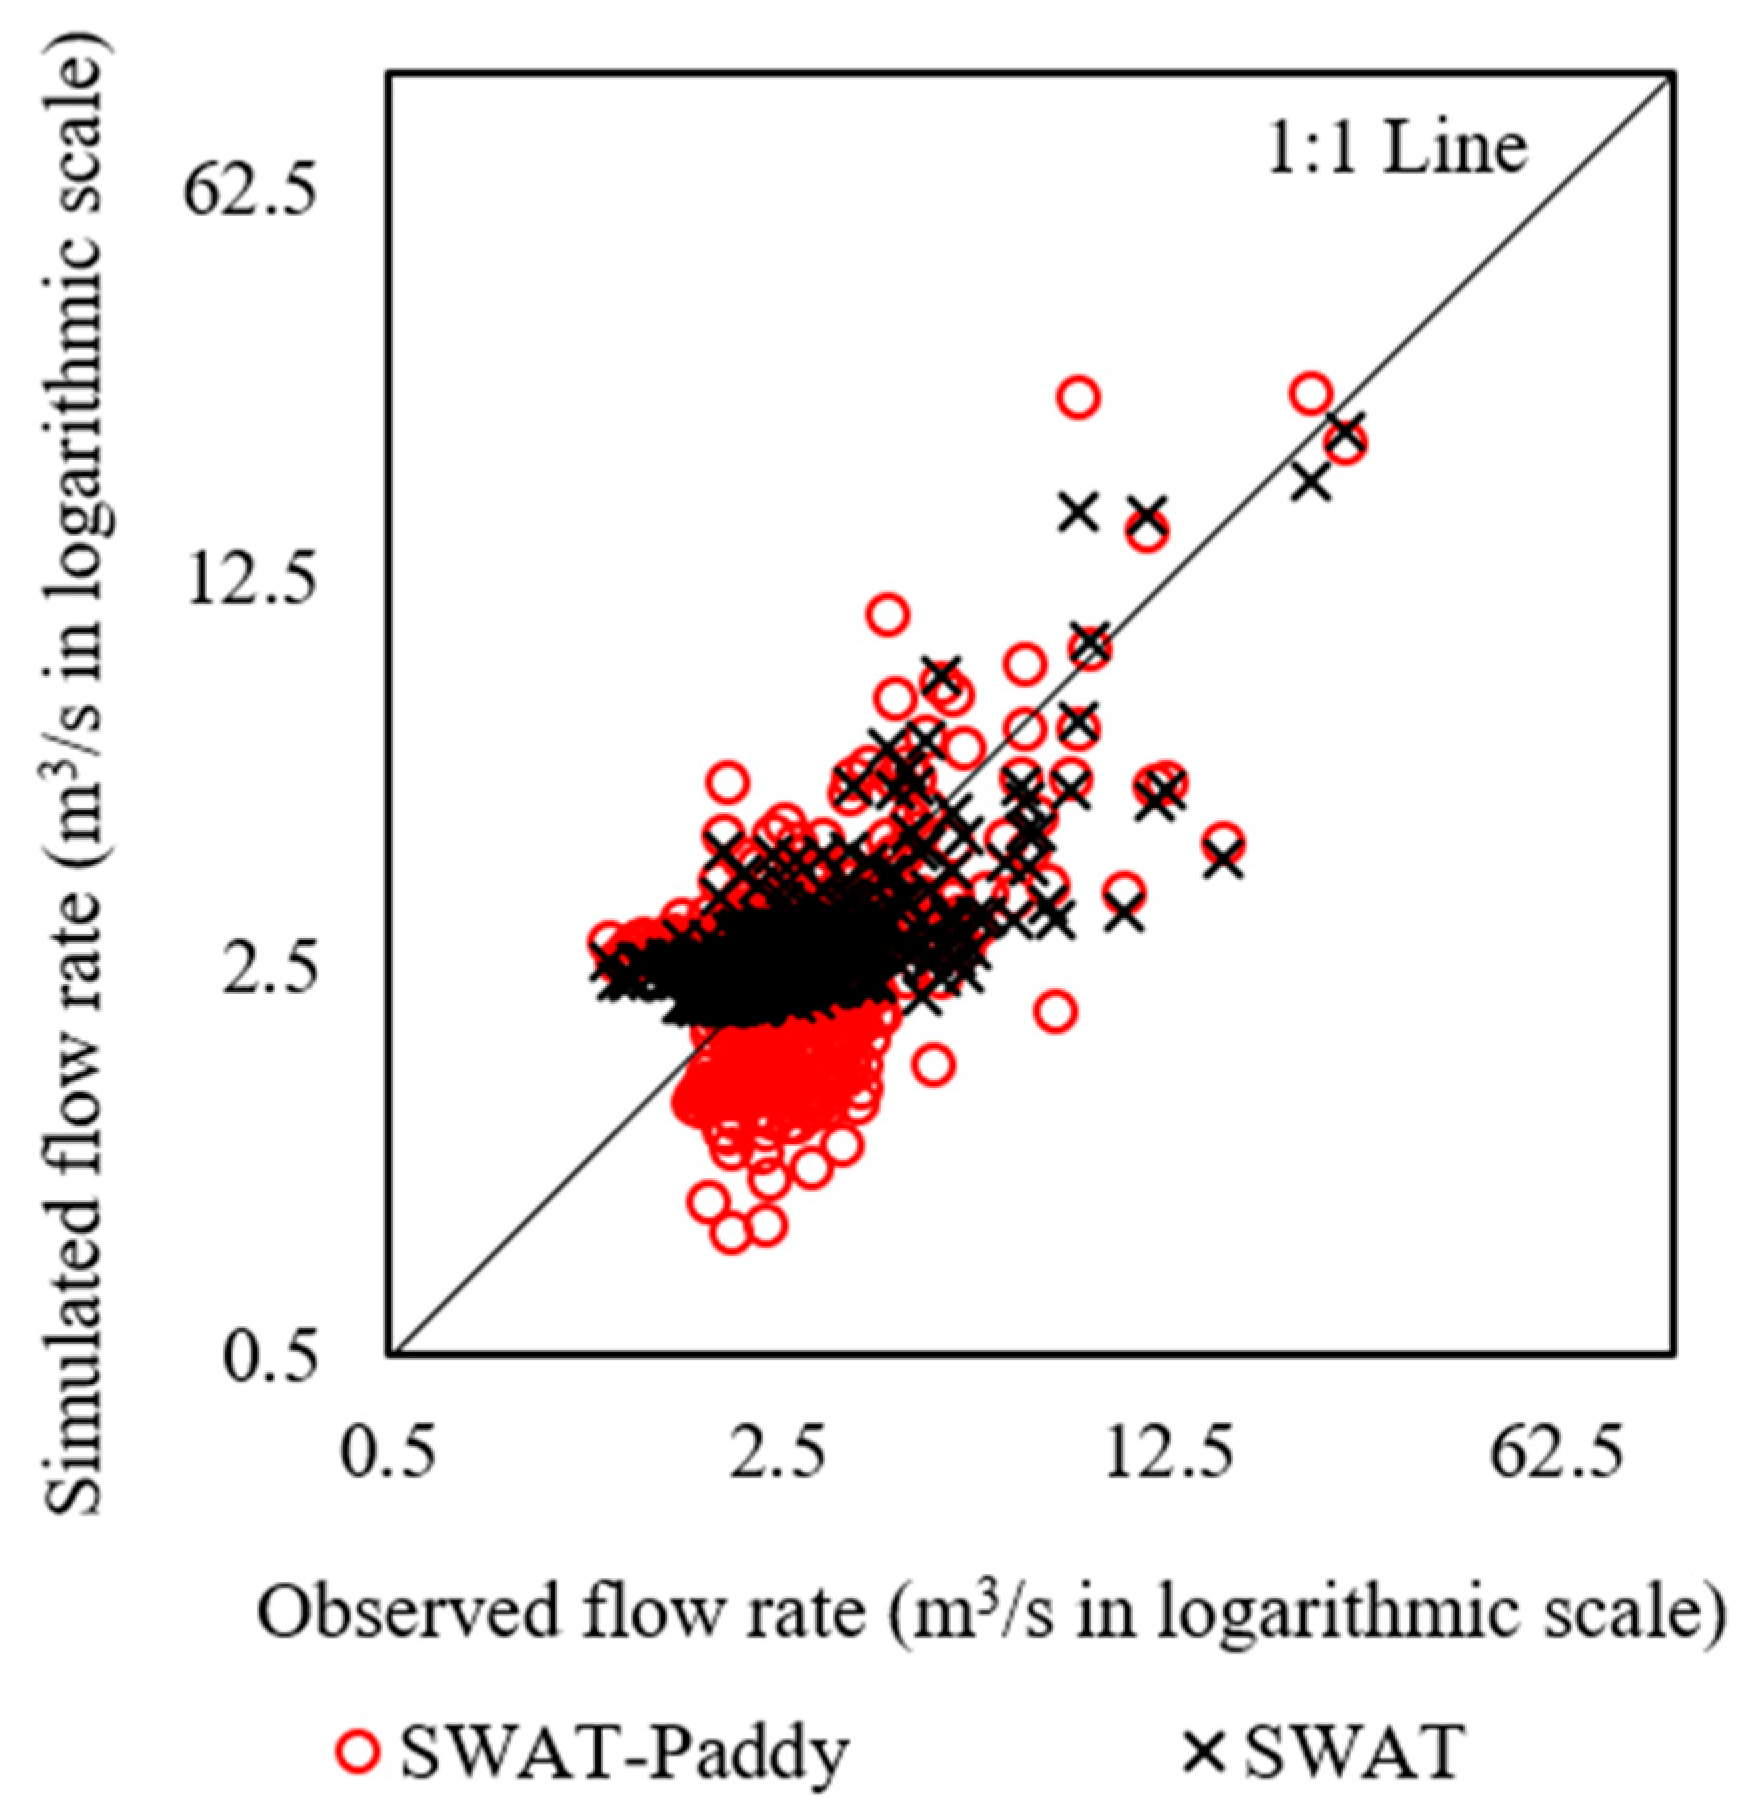
SWAT-Paddy showed a better simulation of surface discharge during rainfall events than SWAT did (Figure 9). Compared to the observed surface discharge, the R2 value for the SWAT-Paddy simulation was 0.8, while that of SWAT was 0.002, indicating a poor performance. As depicted in Figure 9, the curve number method used for simulating surface runoff from the lowland paddy field districts predicted a very low surface discharge. This is because the parameters related to surface discharge were calibrated to represent the hydrological characteristics of a watershed in which groundwater discharge was dominant, with very low surface runoff rate. On the other hand, SWAT-Paddy, by introducing the paddy impoundment module, estimated rainfall-surface discharge much better than the SWAT model with the curve number method. Thus, the alternative simulation scheme in the SWAT-Paddy modeled the discharge process better than the curve number method when simulating the water balance of paddy fields.
3.3.2. Evaluation of Simulation for Impoundment Water
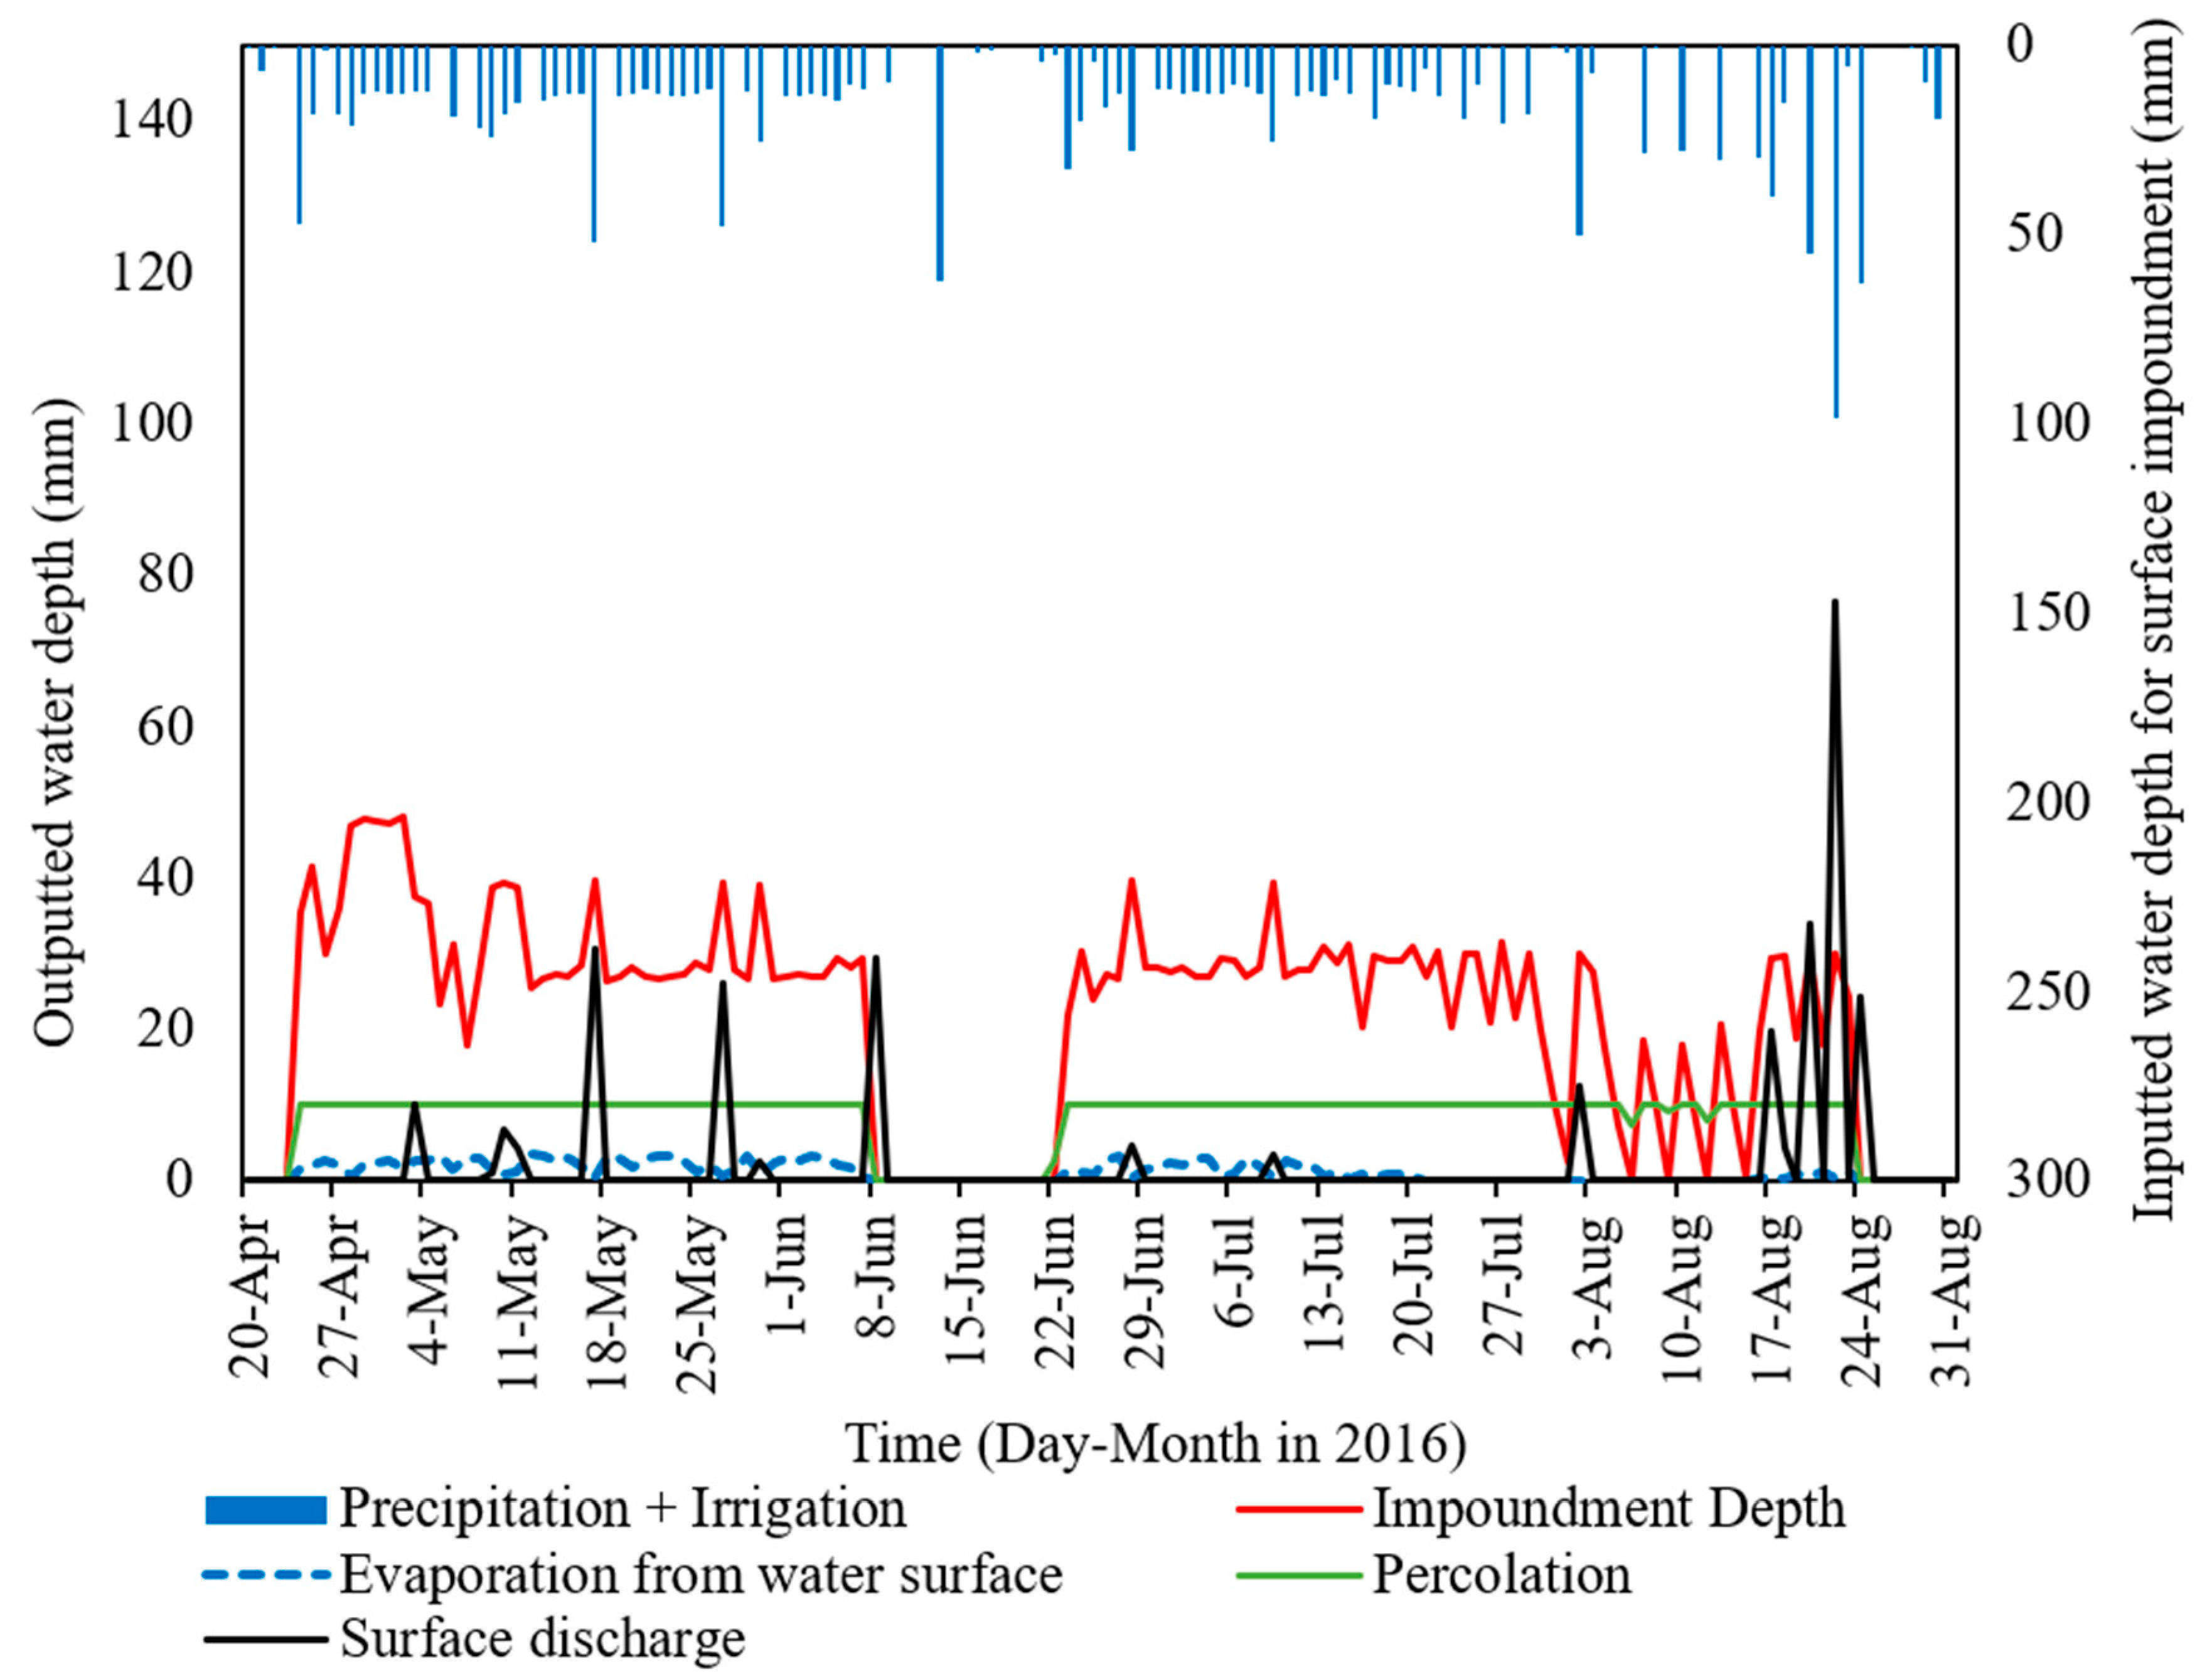
The water balance of the surface impoundment layer above the soil surface of paddy fields simulated with SWAT-Paddy is shown in Figure 10. The paddy field was kept impounded for the majority of the growing season of 2016. Surface discharge occurred during or after storm events. Daily evaporation from ponding water was reduced to negligible amounts after a canopy was fully established in mid-July. These trends are reasonable for paddy fields in Japan. The observed and simulated water balance in the Upper Kashima River Basin is summarized in Table 5. Simulated ponding water depth and water yield with both SWAT-Paddy and SWAT were much lower than the observed amounts, because the observed data contains excessive irrigation, which flowed directly to the drainage ditch on the same day as irrigation. In addition, errors in irrigation and ET were due to input uncertainty regarding the definition of the management schedule and crop parameterization. However, when comparing the ratio of discharged water quantity (Out) to the sum of precipitation and irrigation (In) (hereafter referred to as drainage ratio = Out/In), the values of observation (=0.54) and SWAT-Paddy (=0.47) showed more similarity with each other than with SWAT (=0.27). Thus, SWAT-Paddy succeeded in modeling the paddy field discharge process better than the original method.
3.4. Evaluation of River Flow Simulation of SWAT-Paddy Compared with SWAT
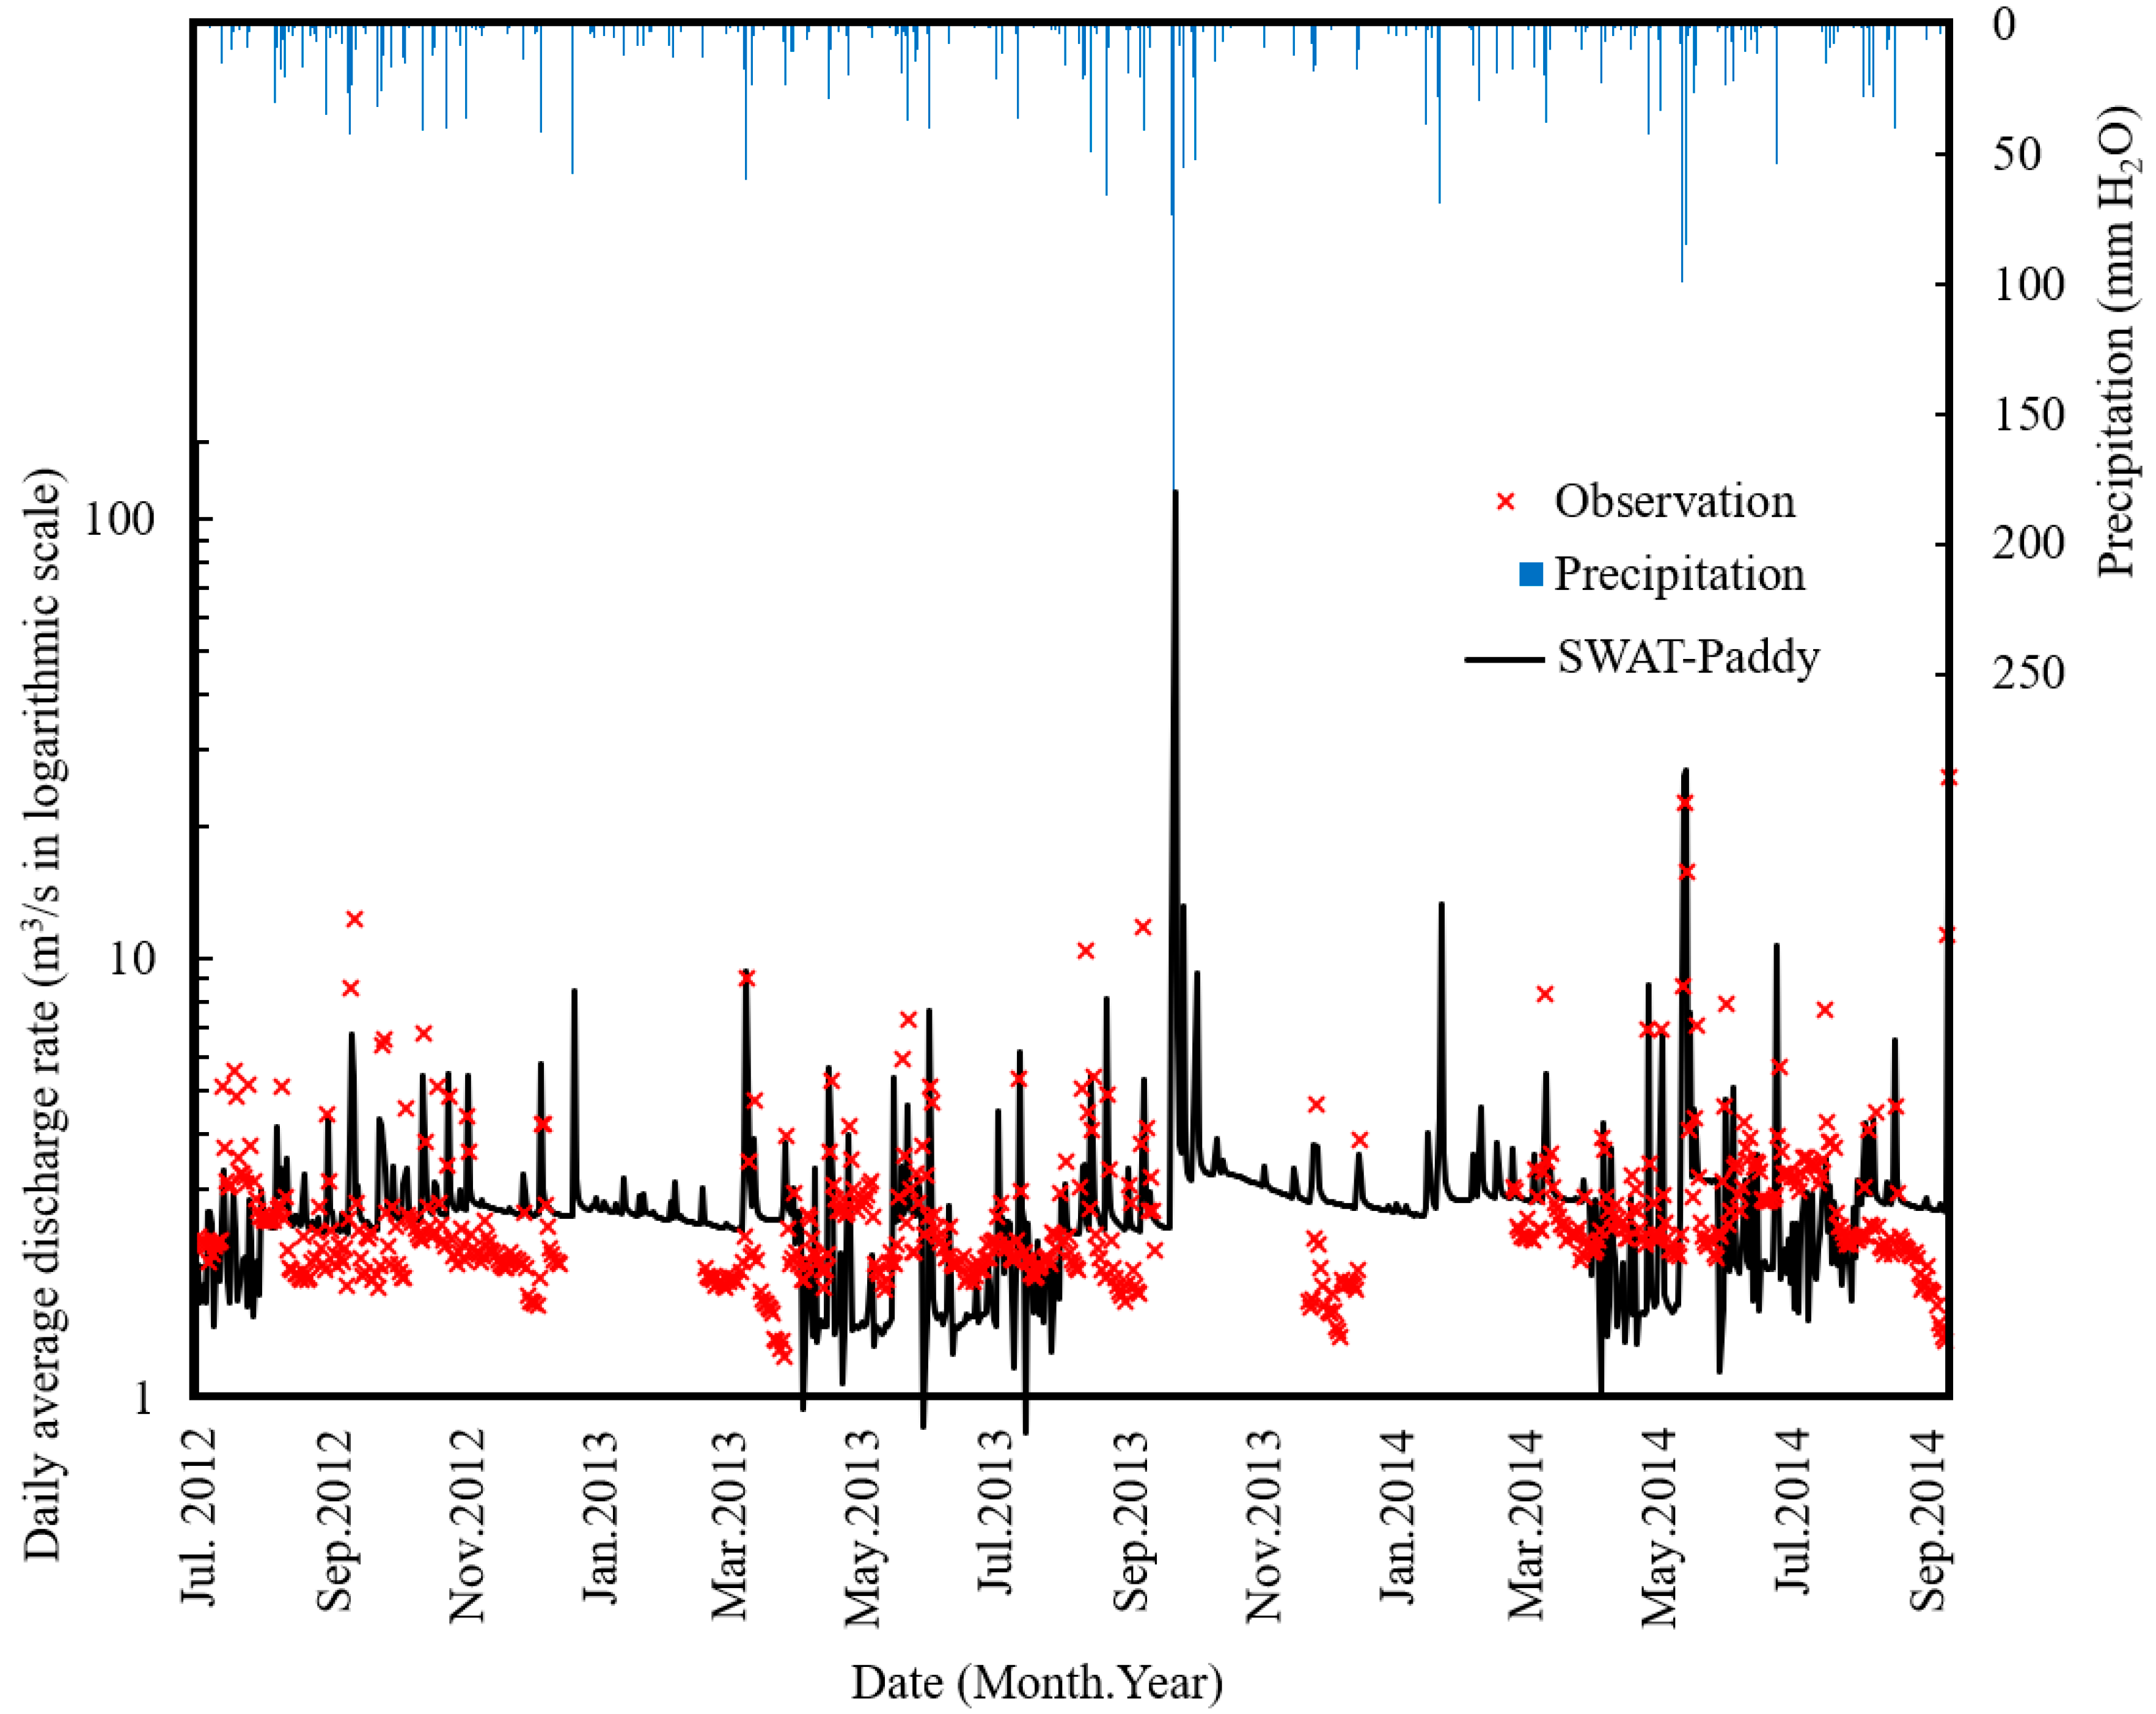
The hydrograph simulated with SWAT-Paddy, compared with the observed river flow, is shown in Figure 11. The accuracy of river flow simulation by SWAT-Paddy (NSE = 0.40 and R2 = 0.51) was lower than that of the original model (NSE = 0.63 and R2 = 0.63). The comparison of Figure 6 and Figure 11 shows that the base flow greatly decreased once the irrigation period had started, which did not occur in the observation. The comparison of the correlations of SWAT and SWAT-Paddy against the observation also reveals the poor model accuracy of SWAT-Paddy for baseflow simulation (Figure 12). The PBIAS calculated for the irrigation period (May to August) and the non-irrigation period (Table 6) showed a trend in which SWAT-Paddy underestimated the river flow in the irrigation period, and overestimated it in the non-irrigation period, more than the SWAT estimates, and the magnitude of bias was almost doubled in SWAT-Paddy. These results suggest that SWAT-Paddy has the problem of poor base flow estimation in this watershed, which is characterized as a lowland paddy field watershed.
4. Discussion
4.1. Water Balance Model for Paddy Impoundment
By introducing the paddy module, SWAT was enabled to represent water balance in paddy fields. As Figure 10 shows, the water balance of impounded water above the ground was estimated reasonably in SWAT-Paddy by calculating water storage over ground, surface discharge, evaporation from water surface, constant percolation from water impoundment to soil layers, and irrigation water supply to impoundment in depth, which had been calculated in volume in the previous pothole-based models. In particular, SWAT-Paddy succeeded in modeling surface discharge from paddy fields with much higher accuracy (R2 = 0.8) than the original SWAT (R2 = 0.002). The original model calibrated with the observed river flow tended to estimate a very low surface discharge, representing the groundwater-dominant hydrology in the lowland watershed. However, even in the lowland watershed, surface discharge is observed in paddy fields due to farmers’ water management. This process was modeled to improve the accuracy of SWAT-Paddy.
4.2. Management Operation for Paddy Cultivation
In SWAT-Paddy, two important enhancements were made in SWAT for simulating rice cultivation in paddy fields: (1) the irrigation scheme was modified to model the water management of paddy cultivation, and (2) puddling was added to the options of agricultural management. The modified irrigation function enables the model to simulate irrigated water use more accurately than the original SWAT. The puddling operation reduces the hydraulic conductivity of paddy soil and allows the model to simulate water ponding in paddy HRUs, which in turn enables the modeling of nutrient dynamics in saturated soils and fertilizer mass balance in the ponding water, as well as in soils. This is very important when SWAT-Paddy is used to evaluate water pollution in the watershed, including irrigated paddy field districts, because nitrate in irrigated water decreases through denitrification in reduced conditions [27]. However, there still exist challenges regarding the simulation of paddy-associated processes in SWAT, to be addressed in future studies. Firstly, the effect of simplifying irrigation scheduling on simulated irrigation water depth and water balance calculation was unclear in the current case study due to the lack of detailed management data. Secondly, irrigation schedules for individual paddy fields are not the same within the watershed, in which there may exist hundreds of paddy HRUs. Thus, an approximation method that diversifies the irrigation schedule among paddy HRUs needs to be developed.
4.3. Further Improvement of SWAT-Paddy
Though SWAT-Paddy showed good performance for a field-scale water balance simulation, the simulation accuracy of river flow was lower in SWAT-Paddy, especially with regard to base flow simulation. This is related to the large amount of water uptake for irrigation. Irrigated water is partially consumed in the paddy fields and flows back to the river through well-organized drainage channel networks in modernized paddy fields, which is called irrigation return flow. However, in our simulation of a lowland watershed, irrigation return flow was mostly estimated on the basis of groundwater discharge, which is hydrologically characterized as “very slow”, to represent the stable flow rate in this watershed. However, paddy drainage systems increase water discharge through lateral flow process and seepage through the ridge of the paddy fields, and quickly transfer discharged water to the river [35]. Thus, base flow underestimation during the irrigation period and overestimation in the non-irrigation period were caused by low estimation of irrigation return flow. Therefore, modeling the drainage systems in paddy field districts is important to improve the base flow estimation accuracy and enhance the model applicability of SWAT-Paddy.
4.4. Contribution of SWAT-Paddy to Sustainable Water Use in Paddy Cultivation
Irrigation is one of the most important factors for paddy cultivation, as water scarcity affects the production of rice greatly. Farmers irrigate with more water than is actually required when growing paddy, because it takes much labor to manage water depth strictly by starting or stopping water intake or changing the height of the outlet weir many times. This leads to excess water use and sometimes causes water scarcity in paddy field regions. In addition, irrigation requires energy input in lowland area where large-scale paddy fields are located. Therefore, to increase rice productivity at the regional scale while saving water and energy consumption, irrigation management should be planned, considering various aspects of crop production and water balances, such as productivity, lower input, and sustainability of water resources and environment. SWAT-Paddy will help decision-makers develop policies on agricultural irrigation, based on the hydrological conditions of their region and to clearly explain the effect of management practices to farmers.
5. Conclusions
In this study, discharge processes and management practices in paddy HRUs were newly developed in SWAT-Paddy. As demonstrated in a case study, SWAT-Paddy successfully simulated paddy water balance and watershed hydrology compared to SWAT. The R2 value for surface discharge increased substantially with SWAT-Paddy. Thus, the proposed model succeeded in representing the hydrological characteristics of an irrigated and impounded paddy field. However, the improved accuracy in simulating paddy water balance did not result in significant improvement in river flow simulation at the watershed-scale SWAT-Paddy. We speculate that, in part, the small areal portion (8%) of paddy fields in the watershed may have acted to diffuse the paddy-level improvement in hydrologic simulation at the watershed scale. In particular, base flow was underestimated in the irrigation period and overestimated in the non-irrigation period by SWAT-Paddy. This is because the model was not configured to simulate quick return flow process through the drainage system. Further improvement in the ability to configure drainage ditches in paddy fields SWAT-Paddy may improve model performance.
Author Contributions
Design of research, T.K. and R.T., design and development of the model, J.J., J.G.A. and R.T., application of model and analysis of simulation result in the case study, R.T., manuscript drafting, R.T., manuscript revision, T.K., J.J., J.G.A., and R.T.
Funding
This research was partly supported by the academic fund of the Japan Society of Irrigation, Drainage, and Rural Engineering.
Acknowledgments
Japan Public-Private Partnership Student Study Abroad Program “TOBITATE! Young Ambassador Program” supported making a communication between the researchers of Tokyo University of Agriculture and Technology and Blackland Research and Extension Center, Texas.
Conflicts of Interest
The authors declare no conflict of interest.
Abbreviations
| SWAT | Soil and Water Assessment Tool |
| SWAT-CUP | SWAT Calibration and Uncertainty Procedures |
| SUFI-2 | Sequential Uncertainty FItting Ver. 2 |
| HRU | Hydrological Response Unit |
| APEX | Agricultural Policy/Environmental eXtender |
| ET | Evapotranspiration |
| R2 | Coefficient of determination |
| NSE | Nash Sutcliffe model Efficiency |
| RSR | RMSE (Root Mean Square Error)-observations standard deviation ratio |
| PBIAS | Percent bias |
References
- FAO Food and Nutrition Division Rice and Human Nutrition. Available online: http://www.fao.org/rice2004/en/f-sheet/factsheet3.pdf (accessed on 8 September 2016).
- Global Rice Science Partnership (GRiSP). Rice Almanac, 4th ed.; Maclean, J., Hardy, B., Hettel, G., Eds.; International Rice Research Institute (IRRI): Los Baños, PA, USA, 2013. [Google Scholar]
- Brown, L.R. Raising Land Productivity. In Plan B: Rescuing a Planet Under Stress and a Civilization in Trouble; W. W. Norton & Company: New York, NY, USA, 2003; pp. 131–150. [Google Scholar]
- Maruyama, T.; Hashimoto, I.; Murashima, K.; Takimoto, H. Evaluation of N and P mass balance in paddy rice culture along Kahokugata Lake, Japan, to assess potential lake pollution. Paddy Water Environ. 2008, 6, 355–362. [Google Scholar] [CrossRef]
- Phong, T.K.; Yoshino, K.; Hiramatsu, K.; Harada, M.; Inoue, T. Pesticide discharge and water management in a paddy catchment in Japan. Paddy Water Environ. 2010, 8, 361–369. [Google Scholar] [CrossRef]
- Hughes, J.D.; Liu, J. MIKE SHE: Software for Integrated Surface Water/Ground Water Modeling. Groundwater 2008, 46, 797–802. [Google Scholar] [CrossRef]
- Bicknell, B.R.; Imhoff, J.C.; Kittle, J.L.; Donigian, A.S.; Johanson, R.C. Hydrological Simulation Program-FORTRAN, User’s Manual for Release 11; U.S. Environmental Protection Agency: Washington, DC, USA, 1997.
- Kato, T. Development of a water quality tank model classified by land use for nitrogen load reduction scenarios. Paddy Water Environ. 2005, 3, 21–27. [Google Scholar] [CrossRef]
- Van Chinh, L.; Iseri, H.; Hiramatsu, K.; Harada, M.; Mori, M. Simulation of rainfall runoff and pollutant load for Chikugo River basin in Japan using a GIS-based distributed parameter model. Paddy Water Environ. 2013, 11, 97–112. [Google Scholar] [CrossRef]
- Arnold, J.G.; Srinivasan, R.; Muttiah, R.S.; Williams, J.R. Large area hydrologic modeling and assessment - Part 1: Model development. J. Am. Water Resour. Assoc. 1998, 34, 73–89. [Google Scholar] [CrossRef]
- Srinivasan, R.; Ramanarayanan, T.S.; Arnold, J.G.; Bednarz, S.T. Large area hydrologic modeling and assessment—Part II: Model application. J. Am. Water Resour. Assoc. 1998, 34, 91–101. [Google Scholar] [CrossRef]
- Gassman, P.W.; Reyes, M.R.; Green, C.H.; Arnold, J.G. The soil and water assessment tool: Historical development, applications, and future research directions. Trans. ASABE 2007, 50, 1211–1250. [Google Scholar] [CrossRef]
- Douglas-Mankin, K.R.; Srinivasan, R.; Arnold, J.G. Soil and water assessment tool (swat) model: Current developments and applications. Trans. ASABE 2010, 53, 1423–1431. [Google Scholar] [CrossRef]
- Tuppad, P.; Douglas-Mankin, K.R.; Lee, T.; Srinivasan, R.; Arnold, J.G. Soil and water assessment tool (swat) hydrologic/water quality model: Extended capability and wider adoption. Trans. ASABE 2011, 54, 1677–1684. [Google Scholar] [CrossRef]
- ArcSWAT and QSWAT. Available online: http://swat.tamu.edu/software/ (accessed on 9 September 2018).
- SWAT-Check. Available online: http://swat.tamu.edu/software/swat-check/ (accessed on 9 September 2018).
- SWAT-CUP. Available online: http://swat.tamu.edu/software/swat-cup/ (accessed on 9 September 2018).
- Kato, T.; Somura, H.; Kuroda, H.; Nakasone, H. Simulation of nutrients from an agricultural watershed in Japan using the SWAT model. Int. Agric. Eng. J. 2011, 20, 40–49. [Google Scholar]
- Sakaguchi, A.; Eguchi, S.; Kasuya, M. Examination of the water balance of irrigated paddy fields in SWAT 2009 using the curve number procedure and the pothole module. Soil Sci. Plant Nutr. 2014, 60, 551–564. [Google Scholar] [CrossRef] [Green Version]
- Du, B.; Arnold, J.G.; Saleh, A.; Jaynes, D.B. Development and application of SWAT to landscapes with tiles and potholes. Trans. ASAE 2005, 48, 1121–1133. [Google Scholar] [CrossRef]
- Sakaguchi, A.; Eguchi, S.; Kato, T.; Kasuya, M.; Ono, K.; Miyata, A.; Tase, N. Development and evaluation of a paddy module for improving hydrological simulation in SWAT. Agric. Water Manag. 2014, 137, 116–122. [Google Scholar] [CrossRef]
- Xie, X.H.; Cui, Y.L. Development and test of SWAT for modeling hydrological processes in irrigation districts with paddy rice. J. Hydrol. 2011, 396, 61–71. [Google Scholar] [CrossRef]
- Boulange, J.; Watanabe, H.; Inao, K.; Iwafune, T.; Zhang, M.H.; Luo, Y.Z.; Arnold, J. Development and validation of a basin scale model PCPF-1@ SWAT for simulating fate and transport of rice pesticides. J. Hydrol. 2014, 517, 146–156. [Google Scholar] [CrossRef]
- Watanabe, H.; Takagi, K. A simulation model for predicting pesticide concentrations in paddy water and surface soil. I. Model development. Environ. Technol. 2000, 21, 1379–1391. [Google Scholar] [CrossRef]
- Sofiyuddin, H.A.; Kato, T.; Tsuchiya, R. Uncertainties of SWAT Model in Irrigated Paddy Field Watershed. J. Irig. 2016, 11, 11–22. [Google Scholar] [CrossRef]
- Tabuchi, T.; Takamura, Y. Nitrogen and Phosphorus Outflow from Catchment Area; University of Tokyo Press: Tokyo, Japan, 1985. (In Japanese) [Google Scholar]
- Takeda, I.; Fukushima, A.; Tanaka, R. Non-point pollutant reduction in a paddy-field watershed using a circular irrigation system. Water Res. 1997, 31, 2685–2692. [Google Scholar] [CrossRef]
- Matsuno, Y.; Nakamura, K.; Masumoto, T.; Matsui, H.; Kato, T.; Sato, Y. Prospects for multifunctionality of paddy rice cultivation in Japan and other countries in monsoon Asia. Paddy Water Environ. 2006, 4, 189–197. [Google Scholar] [CrossRef]
- Neitsch, S.L.; Arnold, J.G.; Kiniry, J.R.; Williams, J.R. Soil and Water Assessment Tool Theoretical Documentation; Texas Water Resources Institute: College Station, TX, USA, 2011. [Google Scholar]
- Dahl, T.E. Wetlands Losses in the United States 1780’s to 1980s; Report to the Congress, No. PB-91-169284/XAB; National Wetlands Inventory: St. Petersburg, FL, USA, 1990.
- Watanabe, T. Irrigation Water Requirement. In Advanced Paddy Field Engineering; Editorial Committee of Advanced Paddy Field Engineering, the Japanese Society of Irrigation, Drainage and Reclamation Engineering (JSIDRE), Ed.; Shinzan-sha Sci. & Tech.: Tokyo, Japan, 1999; pp. 31–50. [Google Scholar]
- Anbumozhi, V.; Yamaji, E.; Tabuchi, T. Rice crop growth and yield as influenced by changes in ponding water depth, water regime and fertigation level. Agric. Water Manag. 1998, 37, 241–253. [Google Scholar] [CrossRef]
- Kato, T.; Kuroda, H.; Yoshida, K. GIS analysis of conjunctive water resource use in Nganjuk district, east Java, Indonesia. Paddy Water Environ. 2013, 11, 193–205. [Google Scholar] [CrossRef]
- Elhassan, A.M.; Goto, A.; Mizutani, M. Effect of Conjunctive Use of Water for Paddy Field Irrigation on Groundwater Budget in an Alluvial Fan. Agric. Eng. Int. CIGR J. 2003, 5, 1–12. [Google Scholar]
- Adachi, K.; Sasaki, C. Percolation and seepage. In Advanced Paddy Field Engineering; Editorial Committee of Advanced Paddy Field Engineering, the Japanese Society of Irrigation, Drainage and Reclamation Engineering (JSIDRE), Ed.; Shinzan-sha Sci. & Tech.: Tokyo, Japan, 1999; pp. 71–88. [Google Scholar]
- Mousavi, S.F.; Yousefi-Moghadam, S.; Mostafazadeh-Fard, B.; Hemmat, A.; Yazdani, M.R. Effect of puddling intensity on physical properties of a silty clay soil under laboratory and field conditions. Paddy Water Environ. 2009, 7, 45–54. [Google Scholar] [CrossRef]
- Choi, S.; Jeong, J.; Kim, M. Simulating the Effects of Agricultural Management on Water Quality Dynamics in Rice Paddies for Sustainable Rice Production—Model Development and Validation. Water 2017, 9, 869. [Google Scholar] [CrossRef]
- Wada, K. The distinctive properties of Andosols. In Advances in Soil Science; Springer: New York, NY, USA, 1985; pp. 173–229. ISBN 978-1-4612-9558-7. [Google Scholar]
- Nakamura, Y.; Manpuku, K.; Koga, Y. Conservation of water environment on circular irrigation system in the Inbanuma Basin. J. Agric. Eng. Soc. Jpn. 1998, 66, 1241–1248. (In Japanese) [Google Scholar] [CrossRef]
- Allen, R.G.; Pereira, L.S.; Raes, D.; Smith, M. Crop Evapotranspiration—Guidelines for Computing Crop Water Requirements; FAO: Rome, Italy, 1998; Volume 56. [Google Scholar]
- Vu, S.H.; Watanabe, H.; Takagi, K. Application of FAO-56 for evaluating evapotranspiration in simulation of pollutant runoff from paddy rice field in Japan. Agric. Water Manag. 2005, 76, 195–210. [Google Scholar] [CrossRef]
- Geographical Survay Institute Basic Geographic Data of Japan. Available online: http://nlftp.mlit.go.jp/ksj/index.html (accessed on 26 January 2016). (In Japanese)
- Ministry of Land, Infrastructure and Transport. National Land Numerical Information download service. Available online: http://nlftp.mlit.go.jp/ksj/ (accessed on 1 December 2016). (In Japanese)
- The Database of Soil Information Based on Basical Investigation for Soil Fertility Conservation—Soil Map Data; [CD-ROM]; Japan Soil Association: Tokyo, Japan, 2009. (In Japanese)
- Eguchi, S.; Aoki, K.; Kohyama, K. Development of agricultural soil-profile physical properties database, Japan: SolphyJ. In Proceedings of the ASA-CSSA-SSSA International Annual Meetings, San Antonio, TX, USA, 16–19 October 2011; pp. 117–122. [Google Scholar]
- Japan Meteorological Agency Data Download Service of Past Meteorological Information. Available online: http://www.data.jma.go.jp/gmd/risk/obsdl/index.php (accessed on 12 January 2015). (In Japanese)
- Chiba Prefecture Standard of Fertilizing for Main Crops. Available online: http://www.pref.chiba.lg.jp/annou/sehikijun.html (accessed on 12 January 2015). (In Japanese).
- Chiba Prefectural Committee on Agriculture, Forestry & Fishery. Standard Guideline for Rice Cultivation; Chiba Prefecture: Chiba, Japan, 2014. (In Japanese)
- Kannan, N.; Santhi, C.; Williams, J.R.; Arnold, J.G. Development of a continuous soil moisture accounting procedure for curve number methodology and its behaviour with different evapotranspiration methods. Hydrol. Process. 2008, 22, 2114–2121. [Google Scholar] [CrossRef]
- Priestley, C.H.B.; Taylor, R.J. On the assessment of surface heat flux and evaporation using large-scale parameters. Mon. Weather Rev. 1972, 100, 81–92. [Google Scholar] [CrossRef]
- Hitomi, T.; Yoshinaga, I.; Miura, A.; Hamada, K.; Shiratani, E.; Takaki, K. Research for Effluent of DOM and Hydrophobic Acids from a Paddy Field. Trans. Jpn. Soc. Irrig. Drain. Rural Eng. 2007, 250, 419–427. (In Japanese) [Google Scholar] [CrossRef]
- Kitagawa, I. Planning paddy fields consolidation. In Handbook of Irrigation, Drainage and Rural Engineering, 7th ed.; The Japanese Society of Irrigation, Drainage, and Rural Engineering: Tokyo, Japan, 2010; pp. 77–90. (In Japanese) [Google Scholar]
- Abbaspour, K.C.; Yang, J.; Maximov, I.; Siber, R.; Bogner, K.; Mieleitner, J.; Zobrist, J.; Srinivasan, R. Modelling hydrology and water quality in the pre-ailpine/alpine Thur watershed using SWAT. J. Hydrol. 2007, 333, 413–430. [Google Scholar] [CrossRef]
- Abbaspour, K.C. SWAT-CUP: SWAT. Calibration and Uncertainty Programs—A User Manual; Eawag: Dübendorf, Switzerland, 2015. [Google Scholar]
- Moriasi, D.N.; Arnold, J.G.; Van Liew, M.W.; Bingner, R.L.; Harmel, R.D.; Veith, T.L. Model evaluation guidelines for systematic quantification of accuracy in watershed simulations. Trans. ASABE 2007, 50, 885–900. [Google Scholar] [CrossRef]
- Adachi, K. Experimental Studies of the Effects of Puddling on Percolation Control: Studies on the water movement of rotational paddy fields. Trans. Agric. Eng. Soc. Jpn. 1988, 135, 1–8. (In Japanese) [Google Scholar] [CrossRef]
Figure 1.
Workflow scheme of the research.

Figure 2.
Schematic chart of the pothole procedure in SWAT (Rday denotes precipitation; Ea denotes the evapotranspiration; Qsurf denotes the surface discharge; Qgw denotes the groundwater discharge; IR denotes the irrigated water; GW denotes groundwater).
Figure 2.
Schematic chart of the pothole procedure in SWAT (Rday denotes precipitation; Ea denotes the evapotranspiration; Qsurf denotes the surface discharge; Qgw denotes the groundwater discharge; IR denotes the irrigated water; GW denotes groundwater).

Figure 3.
Schematic chart of the paddy model developed in SWAT-Paddy (each variable denotes the same as in Figure 2).
Figure 3.
Schematic chart of the paddy model developed in SWAT-Paddy (each variable denotes the same as in Figure 2).

Figure 4.
Maps of (a) land use distribution in the watershed and (b) topography of the watershed.

Figure 5.
Water depth management schedule used in the simulation.

Figure 6.
Daily hydrograph simulated with SWAT model compared with the observed river flow.

Figure 7.
Daily soil water content (SWC) in a paddy field HRU, simulated with different coeffpudd values in 2012.
Figure 7.
Daily soil water content (SWC) in a paddy field HRU, simulated with different coeffpudd values in 2012.

Figure 8.
Daily fluctuation in degree of saturation of soil layers in a paddy HRU, in 2012, simulated with SWAT-Paddy.
Figure 8.
Daily fluctuation in degree of saturation of soil layers in a paddy HRU, in 2012, simulated with SWAT-Paddy.

Figure 9.
The values of surface discharge on rainfall events simulated by SWAT-Paddy and SWAT plotted against those of the observation.
Figure 9.
The values of surface discharge on rainfall events simulated by SWAT-Paddy and SWAT plotted against those of the observation.

Figure 10.
Daily water balance of surface impoundment layer above soil surface in paddy fields in 2016 simulated with SWAT-Paddy.
Figure 10.
Daily water balance of surface impoundment layer above soil surface in paddy fields in 2016 simulated with SWAT-Paddy.

Figure 11.
Daily hydrograph simulated with SWAT-Paddy.

Figure 12.
The values of daily average discharge rate estimated by SWAT-Paddy and SWAT plotted against those of the observation.
Figure 12.
The values of daily average discharge rate estimated by SWAT-Paddy and SWAT plotted against those of the observation.


Table 1.
Land uses in the study area.
| Land Use | Area (%) |
|---|---|
| Farm (excl. paddy) * | 38.08 |
| Forest | 28.61 |
| Residential area | 15.24 |
| Paddy | 8.98 |
| Barren | 5.79 |
| Golf | 3.05 |
| Water surface | 0.16 |
| Others | 0.09 |
* Major crops for “farm” are peanut, carrot, and sweet potato in this watershed.
Table 2.
List of the calibrated parameters and their description [29].
Table 2.
List of the calibrated parameters and their description [29].
| Parameters | Description |
|---|---|
| CN2 | Initial SCS runoff curve number for moisture condition II |
| CNCOEF | Plant ET curve number coefficient |
| SURLAG | Surface runoff lag coefficient |
| SOL_AWC | Available water capacity of the soil layer |
| ESCO | Soil evaporation compensation factor |
| EPCO | Plant uptake compensation factor |
| ALPHA_BF | Base flow alpha factor |
| GW_DELAY | Groundwater delay time |
| RCHRG_DP | Deep aquifer percolation fraction |
| ALPHA_BF_D | Alpha factor for groundwater recession curve of the deep aquifer |
Table 3.
Inputted schedule of paddy management and assigned operation type in SWAT.
| Date | Management | Operation Type in SWAT |
|---|---|---|
| 25 April | Start impoundment | Auto irrigation initialization/outlet weir control (new) |
| 28 April | Puddling | Puddling (new) |
| 1 May | Transplanting | Plant (initially, LAI = 0.1 and biomass = 20 kg/ha [30]) |
| 9 June | Mid-summer Drainage | Auto irrigation initialization/outlet weir control (new) (Setting three critical values = 0) |
| 23 June | Finish mid-summer drainage | Auto irrigation initialization/outlet weir control (new) |
| 31 July | Intermittent Irrigation | Auto irrigation initialization/outlet weir control (new) |
| 25 August | Draining | Auto irrigation initialization/outlet weir control (new) (Setting three critical values = 0) |
| 10 September | Harvest | Harvest and kill operation/Break puddle (new) |
Table 4.
The list of calibrated parameters and sensitivity.
| Parameters | Type | Original | Range min. | Range max. | Best | Rank | p-Value |
|---|---|---|---|---|---|---|---|
| CN2 | R | 36~86 | 1.04 | 1.07 | 38.12~91.05 | 2 | 0.17 |
| CNCOEF | V | 0.5 | 0.52 | 0.55 | 0.52 | 3 | 0.19 |
| SURLAG | V | 4 | 14.77 | 16.75 | 16.67 | 5 | 0.23 |
| SOL_AWC | R | 0.09~0.25 | 1.35 | 1.43 | 0.13~0.35 | 7 | 0.55 |
| ESCO | V | 0.95 | 0.98 | 1.00 | 1.00 | 6 | 0.29 |
| EPCO | V | 1.00 | 0.71 | 0.76 | 0.73 | 8 | 0.74 |
| ALPHA_BF | V | 0.005 | 0.00 | 0.02 | 0.08 × 10⁻² | 1 | 0.00 |
| GW_DELAY | V | 5 | 36.83 | 39.39 | 38.22 | 10 | 0.91 |
| RCHRG_DP | V | 0.02 | 0.10 | 0.12 | 0.11 | 9 | 0.88 |
| ALPHA_BF_D | V | 0.9 | 0.12 | 0.19 | 0.15 | 4 | 0.22 |
The column “Type” shows whether the value was replaced (V) or multiplied (R) by the original value. The values tabulated in the column “Range min. (max.)” were replaced or multiplied by the values tabulated in “Original”. The column “Best” shows the best parameter set used in the model evaluation described in the following part. The column “Rank” shows rank of parameter sensitivity.
Table 5.
Water balance of paddy fields in irrigation period (26 April to 4 October) observed and simulated by SWAT-Paddy and SWAT.
Table 5.
Water balance of paddy fields in irrigation period (26 April to 4 October) observed and simulated by SWAT-Paddy and SWAT.
| Observation | SWAT-Paddy | SWAT 2012 | |
|---|---|---|---|
| Precipitation (a; mm) | 3.7 | 3.7 | 3.7 |
| Irrigation (b; mm) | 17.7 | 8.1 | 4.5 |
| ET (mm) | 4.6 | 2.9 | 2.3 |
| Water yield (discharged water amount in drainage channel in observation) (c; mm) | 11.6 | 5.5 | 2.2 |
| Outlet/Inlet ratio (drainage ratio) [c/(a + b)] | 0.54 | 0.47 | 0.27 |
Table 6.
The comparison of NSE, RSR, and PBIAS during the irrigation period (May to August) and non-irrigation period of the simulations by SWAT and SWAT-Paddy.
Table 6.
The comparison of NSE, RSR, and PBIAS during the irrigation period (May to August) and non-irrigation period of the simulations by SWAT and SWAT-Paddy.
| Irrigation Period/Non-irrigation Period | Model | NSE | RSR | PBIAS |
|---|---|---|---|---|
| Irrigation period | SWAT | 0.54 | 0.68 | 8.82 |
| SWAT-Paddy | 0.023 | 0.99 | 16.3 | |
| Non-irrigation period | SWAT | 0.70 | 0.55 | −5.7 |
| SWAT-Paddy | 0.67 | 0.58 | −13.6 |
© 2018 by the authors. Licensee MDPI, Basel, Switzerland. This article is an open access article distributed under the terms and conditions of the Creative Commons Attribution (CC BY) license (http://creativecommons.org/licenses/by/4.0/).
Share and Cite
MDPI and ACS Style
Tsuchiya, R.; Kato, T.; Jeong, J.; Arnold, J.G. Development of SWAT-Paddy for Simulating Lowland Paddy Fields. Sustainability 2018, 10, 3246. https://0-doi-org.brum.beds.ac.uk/10.3390/su10093246
AMA Style
Tsuchiya R, Kato T, Jeong J, Arnold JG. Development of SWAT-Paddy for Simulating Lowland Paddy Fields. Sustainability. 2018; 10(9):3246. https://0-doi-org.brum.beds.ac.uk/10.3390/su10093246
Chicago/Turabian StyleTsuchiya, Ryota, Tasuku Kato, Jaehak Jeong, and Jeffrey G. Arnold. 2018. "Development of SWAT-Paddy for Simulating Lowland Paddy Fields" Sustainability 10, no. 9: 3246. https://0-doi-org.brum.beds.ac.uk/10.3390/su10093246
Note that from the first issue of 2016, this journal uses article numbers instead of page numbers. See further details here.