Patch-Based Assessments of Shifting Cultivation Detected by Landsat Time Series Images in Myanmar


1
Graduate School of Bioresource and Bioenvironmental Sciences, Kyushu University, 744 Motooka, Fukuoka 819-0395, Japan
2
Research Fellow of Japan Society for the Promotion of Science, Kojimachi, Chiyoda-ku, Tokyo 102-0083, Japan
3
Institute of Decision Science for a Sustainable Society, Kyushu University, 744 Motooka, Fukuoka 819-0395, Japan
4
Faculty of Agriculture, Kyushu University, 744 Motooka, Fukuoka 819-0395, Japan
*
Author to whom correspondence should be addressed.
Sustainability 2018, 10(9), 3350; https://0-doi-org.brum.beds.ac.uk/10.3390/su10093350
Submission received: 10 July 2018
/
Revised: 12 September 2018
/
Accepted: 17 September 2018
/
Published: 19 September 2018
(This article belongs to the Section Environmental Sustainability and Applications)
Abstract
:Shifting cultivation is a widely practiced agriculture system in the tropics. Regardless of the dominant land use, the dynamics of shifting cultivation over large areas are of limited knowledge. We conducted patch-based assessments and characterization of shifting cultivation extracted from already developed dataset, which detected shifting cultivation by a trajectory-based analysis using annual Landsat TM/ETM+/OLI time series images from 2000 to 2014 in Myanmar. An accuracy assessment was conducted in terms of the size and number of cleared areas compared with reference polygons of shifting cultivation, which were manually delineated by visual interpretation using Landsat and high-resolution satellite images from Google Earth™ in the selected areas. The producer’s and user’s accuracies in detecting the number of shifting cultivation patches were 78.1% and 88.4%, respectively. In whole study area, the probability of disturbances caused by shifting cultivation was significantly affected by distance to the nearest village, indicating the importance of accessibility from residences. The number of shifting cultivation patches showed a decreasing trend in this region and it will lead to less cleared forests such as located far from residences. These dynamics of shifting cultivation have possibility to affect the mosaic patterns of landscape and function maintained in the landscape in this region.
1. Introduction
Shifting cultivation (also known as slash-and-burn agriculture or swidden agriculture) is a subsistence agricultural practice characterized by a field rotation with the slashing and burning of forests for a short term cropping period followed by a long term fallow period [1]. Shifting cultivation has been practiced for centuries mainly in tropical regions [2]. Although there are various causes of tropical forest disturbances, shifting cultivation has been one of major proximate drivers of deforestation and forest degradation in Southeast Asia, Africa, and Latin America [3,4,5]. The frequent burning of vegetation at each cycle of shifting cultivation under shorter fallow lengths has significant negative impacts on regional ecosystems such as carbon sequestration [2]. While the negative aspects of shifting cultivation are often raised, shifting cultivation also plays a positive role in biodiversity compared with permanent agriculture [6]. Because permanent agriculture converts forest to other land use, it directly contributes to forest loss. Although the extent of land affected by shifting cultivation has declined in the last few decades [6,7], the practice still affects a global area of approximately 280 million hectares [8]. Because there is a substantial area of shifting cultivation, applying suitable management to maximize the positive aspects of shifting cultivation is of great importance.
A key factor in this management is the characteristic landscape pattern of shifting cultivation. This is a mosaic of agriculture fields, and fallows of different ages, which is created from repeated small-scale forest clearing (hereafter called patches). The mosaic landscape plays an important role in maintaining the biodiversity of shifting cultivation [9,10]. Moreover, the characteristics of the patch itself—such as size and topographic condition—are also important because these characteristics affect vegetation recovery [11]. Thus, information on the temporal and spatial patterns of patches and their characteristics is required for the better management of shifting cultivation. Satellite remote sensing is well suited to attaining spatially and temporally explicit information especially for tropical forests where ground records are generally inadequate [12].
Past studies have used various kinds of satellite images to detect areas affected by shifting cultivation (e.g., [13,14]). However, because of fast vegetation recovery after burning, detecting shifting cultivation using single-date remote sensing data or multi-date data, where the observation intervals are usually between 5 to 10 years, is difficult [15]. Time series satellite data, for example, annual observations, is required to further investigate the detailed and accurate dynamics of shifting cultivation. The use of Landsat images is a viable option for time series analysis because the long term records of the United States Geological Survey (USGS) Landsat archives (i.e., more than 40 years) are freely available [16]. Because of the large area coverage and the suitable spatial resolution of Landsat images, several studies have used near annual, or more frequent, Landsat time series images for detecting shifting cultivation (e.g., [17,18,19,20]).
Landsat time series images have enabled researchers to conduct change detection using various approaches [21]. A trajectory-based analysis, which analyzes the temporal trajectories of spectral indices (e.g., Normalized Difference Vegetation Index or Enhanced Vegetation Index) to detect forest changes, has been accomplished by constructing near annual Landsat time series images. Since this trajectory-based analysis provides insights on the conditions of pre- and post- disturbance through the trajectories of spectral indices, detecting disturbances caused by shifting cultivation in this approach has great potential for understanding temporal and spatial dynamics. In this regard, Schneibel et al. [22] investigated cultivation patterns from 1989 to 2013 using annual Landsat TM/ETM+/OLI time series images based on a trajectory segmentation in Angola. Dutrieux et al. [23] enhanced all available Landsat TM/ETM+/OLI images to reconstruct land use history defined as the number of cultivation using an object-based approach in Brazil. Jakovac et al. [24] used the products of land use history maps generated by [23] to analyze fallow period changes and relationships between land use patterns and human accessibility. While previous studies have demonstrated that the trajectory-based analysis using Landsat time series has successfully detected shifting cultivation, from our knowledge no study has investigated the temporal and spatial patterns of the patches comprising the mosaic landscapes.
In this study, we investigated the characteristics of shifting cultivation in patch-based change detection using annual Landsat time series images in a mountainous region of Myanmar. Shifting cultivation has been practiced for centuries in this region as an economically and ecologically important land use. Based on visual interpretation, we firstly conducted a patch-based accuracy assessment to shifting cultivation patches, which were detected using Landsat time series images. Then, the patch-based characteristics of shifting cultivation including the size of cleared area and spatial and temporal change were investigated by analyzing the temporal trajectories of Landsat time series images.
2. Materials and Methods
2.1. Study Area
The study area is in the Bago Mountains, in the central part of Myanmar. The study area is a mountainous landscape covering approximately 158,000 ha across two townships (i.e., Thoungoo and Yedashe Township) (Figure 1). We only used areas near villages in this region for analysis. Detailed procedures are explained in later sections (i.e., 2.4). Mean annual precipitation is approximately 2000 mm. Mean annual temperature in this region is approximately 27 °C with the highest mean temperature in April (31 °C) and the lowest mean temperature in January (24 °C). Elevation ranges from 10 to 400 m above sea level. The forests in this region are dominated by deciduous species such as Teak (Tectona grandis).
Shifting cultivation in this region has been practiced by the Karen people who have been allowed to conduct cultivation for self-sufficiency [25]. The practices of shifting cultivation in this region consist of slashing and burning from the end of the dry season (February) to the hot season (April), seeding at the beginning of the rainy season (May), and harvesting during the dry season (December) with the mean size of cleared areas ranging from 1.72 ha to 2.70 ha [26,27]. The fallow period after harvesting is approximately from 9 to 12 years on average [28]. Aboveground biomass after the start of the fallow period rapidly increases through bamboo species, followed by tree species which reach similar levels of aboveground biomass as bamboo after 10 years [25]. The total aboveground biomass reaches almost the same level as old forests after 20 to 35 years [29,30].
2.2. Maps of Disturbance and Disturbance Agents
To assess the patch-based characteristics of shifting cultivation, we used a dataset developed by Shimizu et al. [31], which detected the timing and locations of disturbances and then classified disturbance agents in the Bago Mountains. Here we provide a brief summary of the data processing below. Please note that we did not conduct the processing in this study. All processing in this section had already been completed in [31] and we merely used the processed dataset for our analysis.
This dataset is composed of a total of 126 Landsat Thematic Mapper (TM), Enhanced Thematic Mapper plus (ETM+), and Operational Land Imager (OLI) images in five path/row of Worldwide Reference System 2 to cover the whole study area. All images were acquired in the dry season (from November to January) from 2000 to 2014. After downloading Landsat images from the USGS Landsat archives, all images were atmospherically corrected by LEDAPS [32] and normalized by IR-MAD [33], and then subjected to topographic correction. Missing pixels caused by clouds, cloud shadows, and the failure of the Scan Line Corrector were filled with auxiliary images acquired in the same year using a weighted linear regression algorithm [34].
After the Landsat time series images were preprocessed for change detection, a LandTrendr temporal segmentation algorithm [35] was applied to detect forest changes using trajectory-based analysis. The accuracy of pixel-based change detection was evaluated with 379 pixel-based reference samples. Detected disturbance pixels were grouped as disturbance patches based on spatial adjacency and then attributed to disturbance agents (e.g., shifting cultivation, logging, and plantation expansion) using a random forest attribution model. The producer’s accuracy for disturbance in pixel-based change detection was 91.9%, which means 8.1% of actual disturbances were not detected in change detection (Table 1). The overall accuracy for the patch-based attribution of disturbance agents was 84.7%, and the producer’s and user’s accuracies for shifting cultivation were 87.5% and 100%, respectively (Table 1). Further details of the processing of Landsat times series can be seen in [31].
2.3. Accuracy Assessments
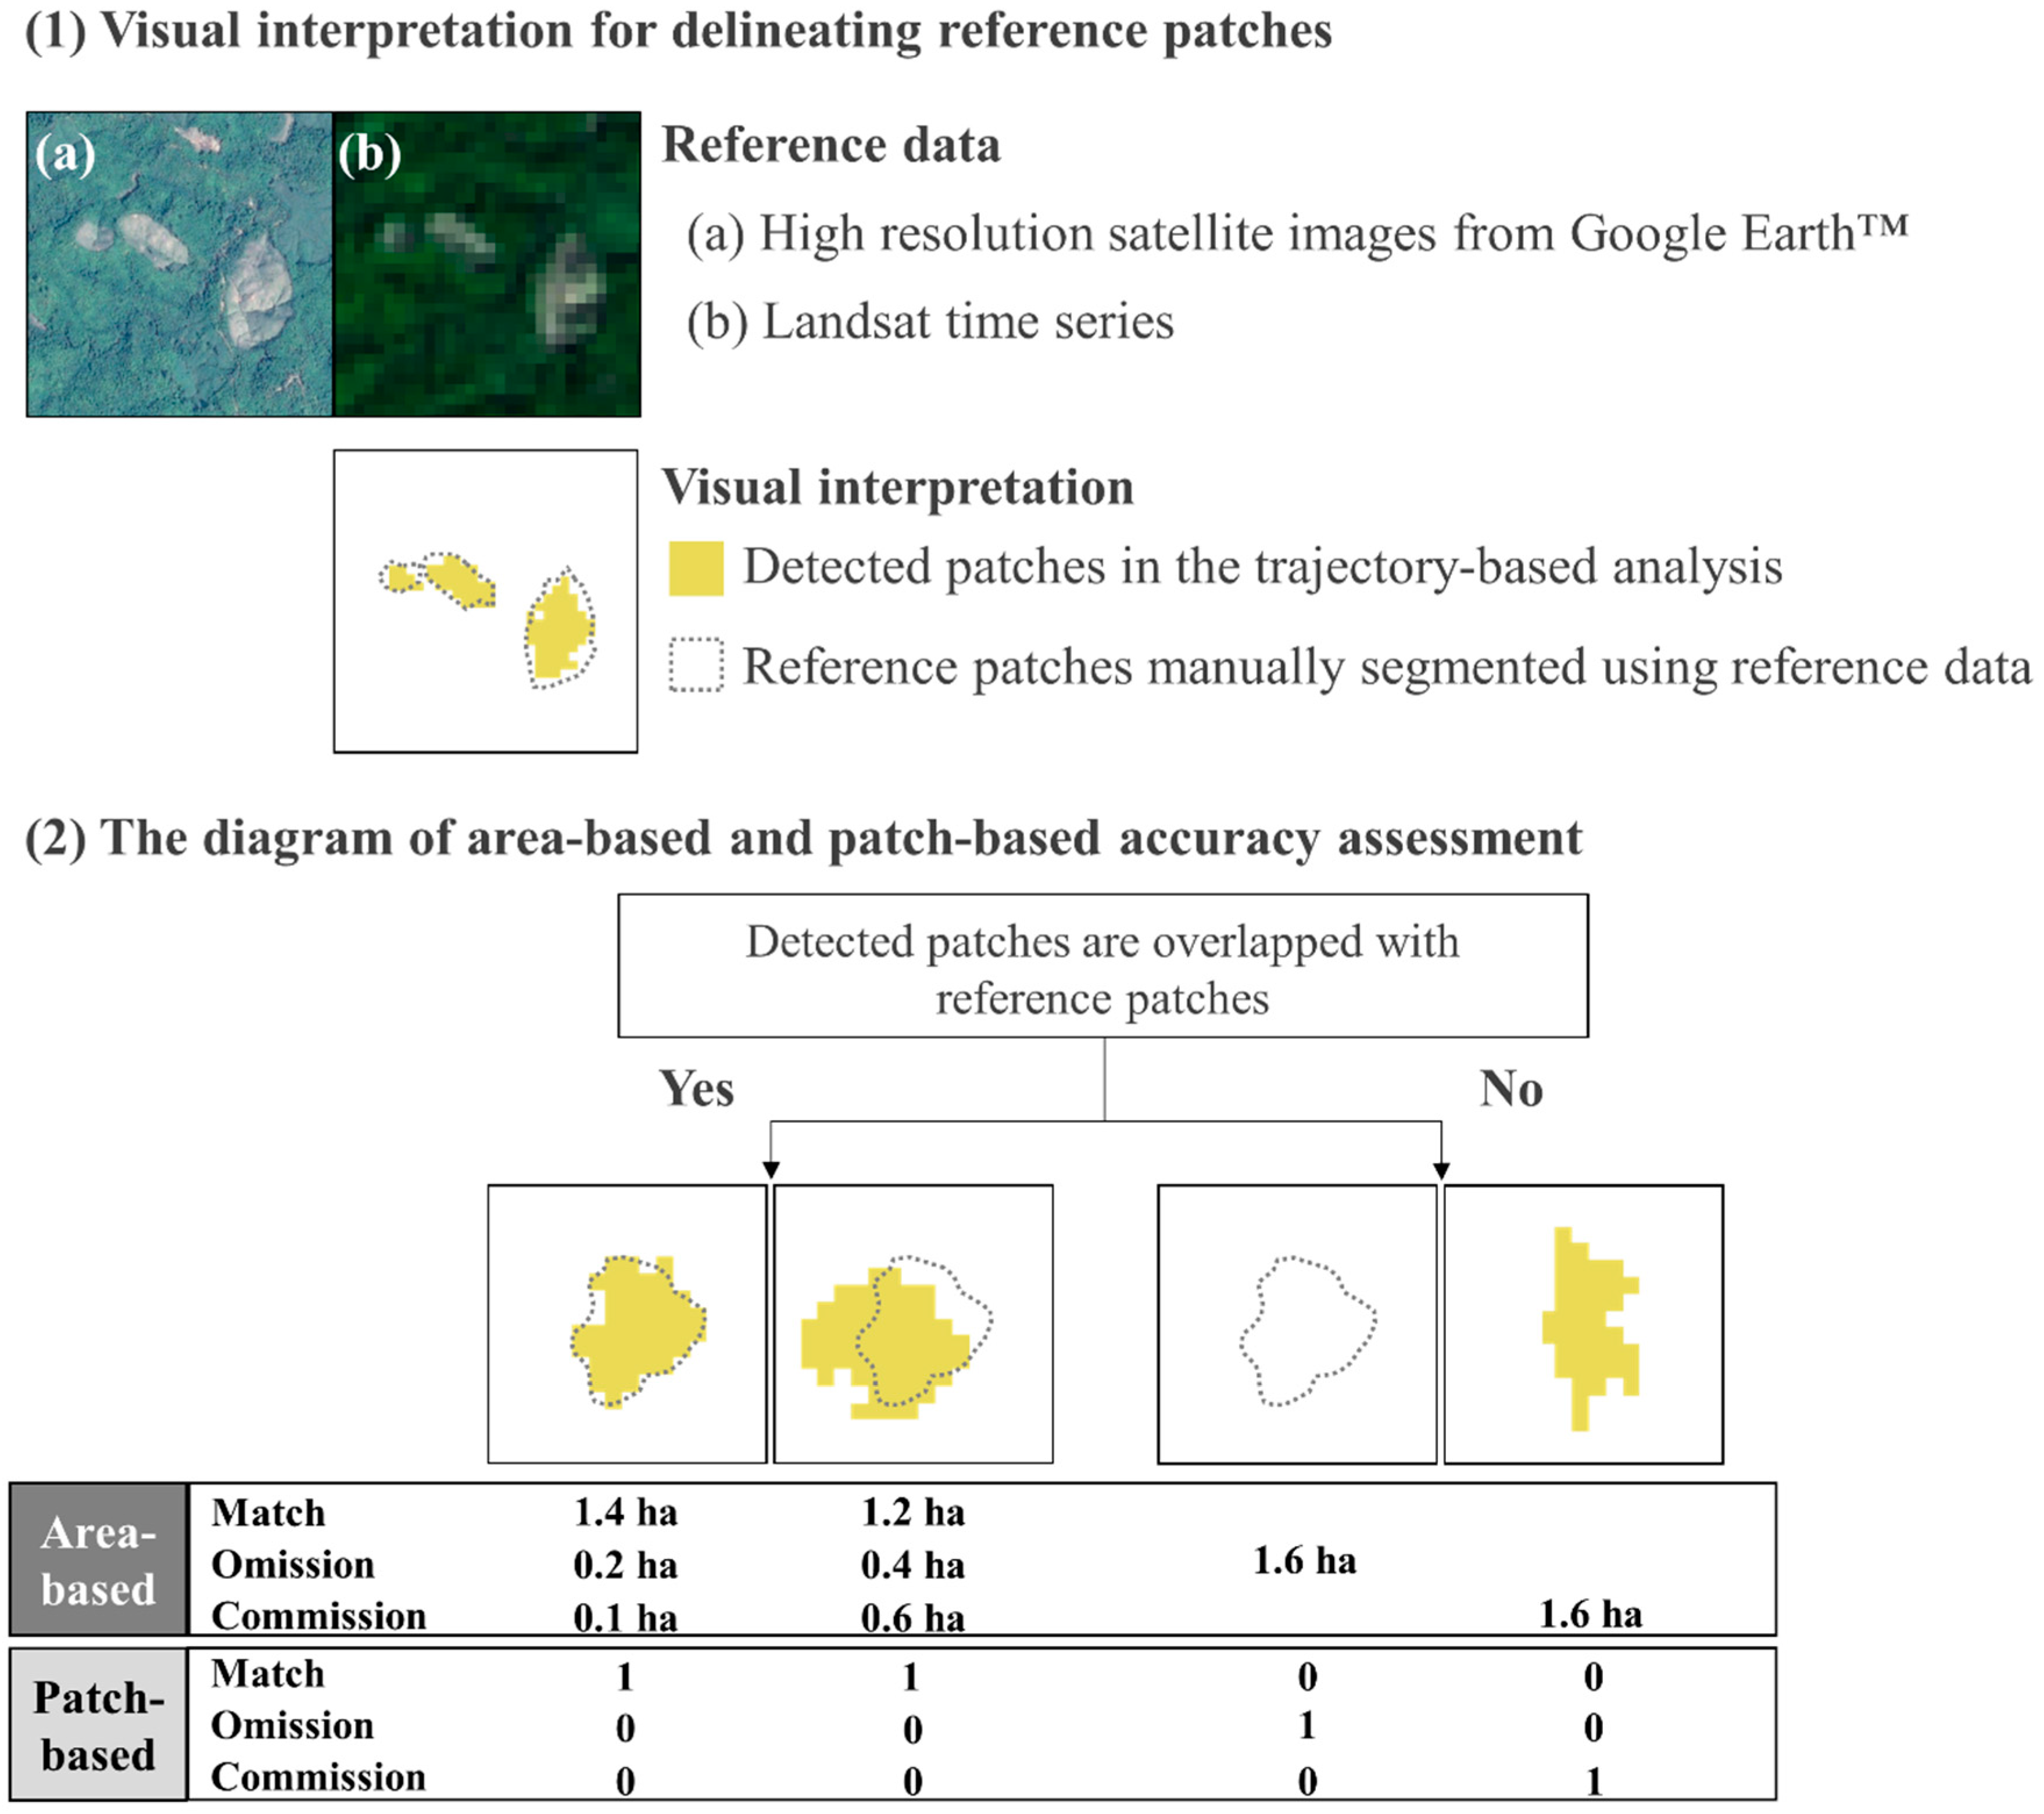
To implement the patch-based accuracy assessment, we selected a 25 km2 area, where shifting cultivation has been actively conducted, within the whole study area covering 158,000 ha. We assumed that this 25 km2 area can cover a sufficient number of shifting cultivation patches for the validation of whole study area. Although an accuracy assessment of the dataset was conducted in Shimizu et al. [31], it aimed to evaluate the class allocation of disturbance agents rather than the spatial extent of patches detected and attributed through the trajectory-based analysis. Thus, an accuracy assessment for spatial matching against actual shapes should be conducted. Because reference field data indicating exact location and timing of shifting cultivation is lacking in the study area, we employed a thematic accuracy assessment for shifting cultivation based on spatial overlap with reference patches, which were delineated by visual interpretation. All the disturbances caused by shifting cultivation in the selected area from 2000 to 2014 were visually interpreted and manually delineated as polygons using the Landsat images and high-resolution satellite images from DigitalGlobe and CNES/Airbus in Google Earth™. We assumed that little bias arose in visual interpretation because the signs of shifting cultivation were visually clear in the reference images. This procedure resulted in 568 patches (hereafter called reference patches).
Shifting cultivation detected with trajectory-based analysis using Landsat time series images by Shimizu et al. [31] was compared with the reference patches in the selected area. Firstly, simple area-based accuracies were calculated using area (ha) that was overlapped and not overlapped between detected and reference patches. Then, patch-based thematic accuracies were calculated based on 1 or 0 category, that was spatially matched (1) or not matched (0) between reference and detected patches, similar to Linke et al. [36]. Here, we defined detected patches that overlapped with reference patches by at least one pixel as ‘matched (1)’. This was because we could assess the number of detected patches, which overlapped with reference patches by more than one pixel. By doing this, we calculated the patch-based producer’s and user’s accuracies. We showed some patterns of the area-based and patch-based accuracy assessments in Figure 2. For example, when a reference patch (area: 1.6 ha) overlaps with a detected patch (area: 1.5 ha) by 1.4 ha as shown in the left end pattern in Figure 2, then we calculate 1.4 ha matched, 0.2 ha omission, and 0.1 ha commission in the area-based accuracy assessment, while we count this case as 1 matched, 0 omission, and 0 commission in the patch-based accuracy assessment.
2.4. Patch-Based Characteristics
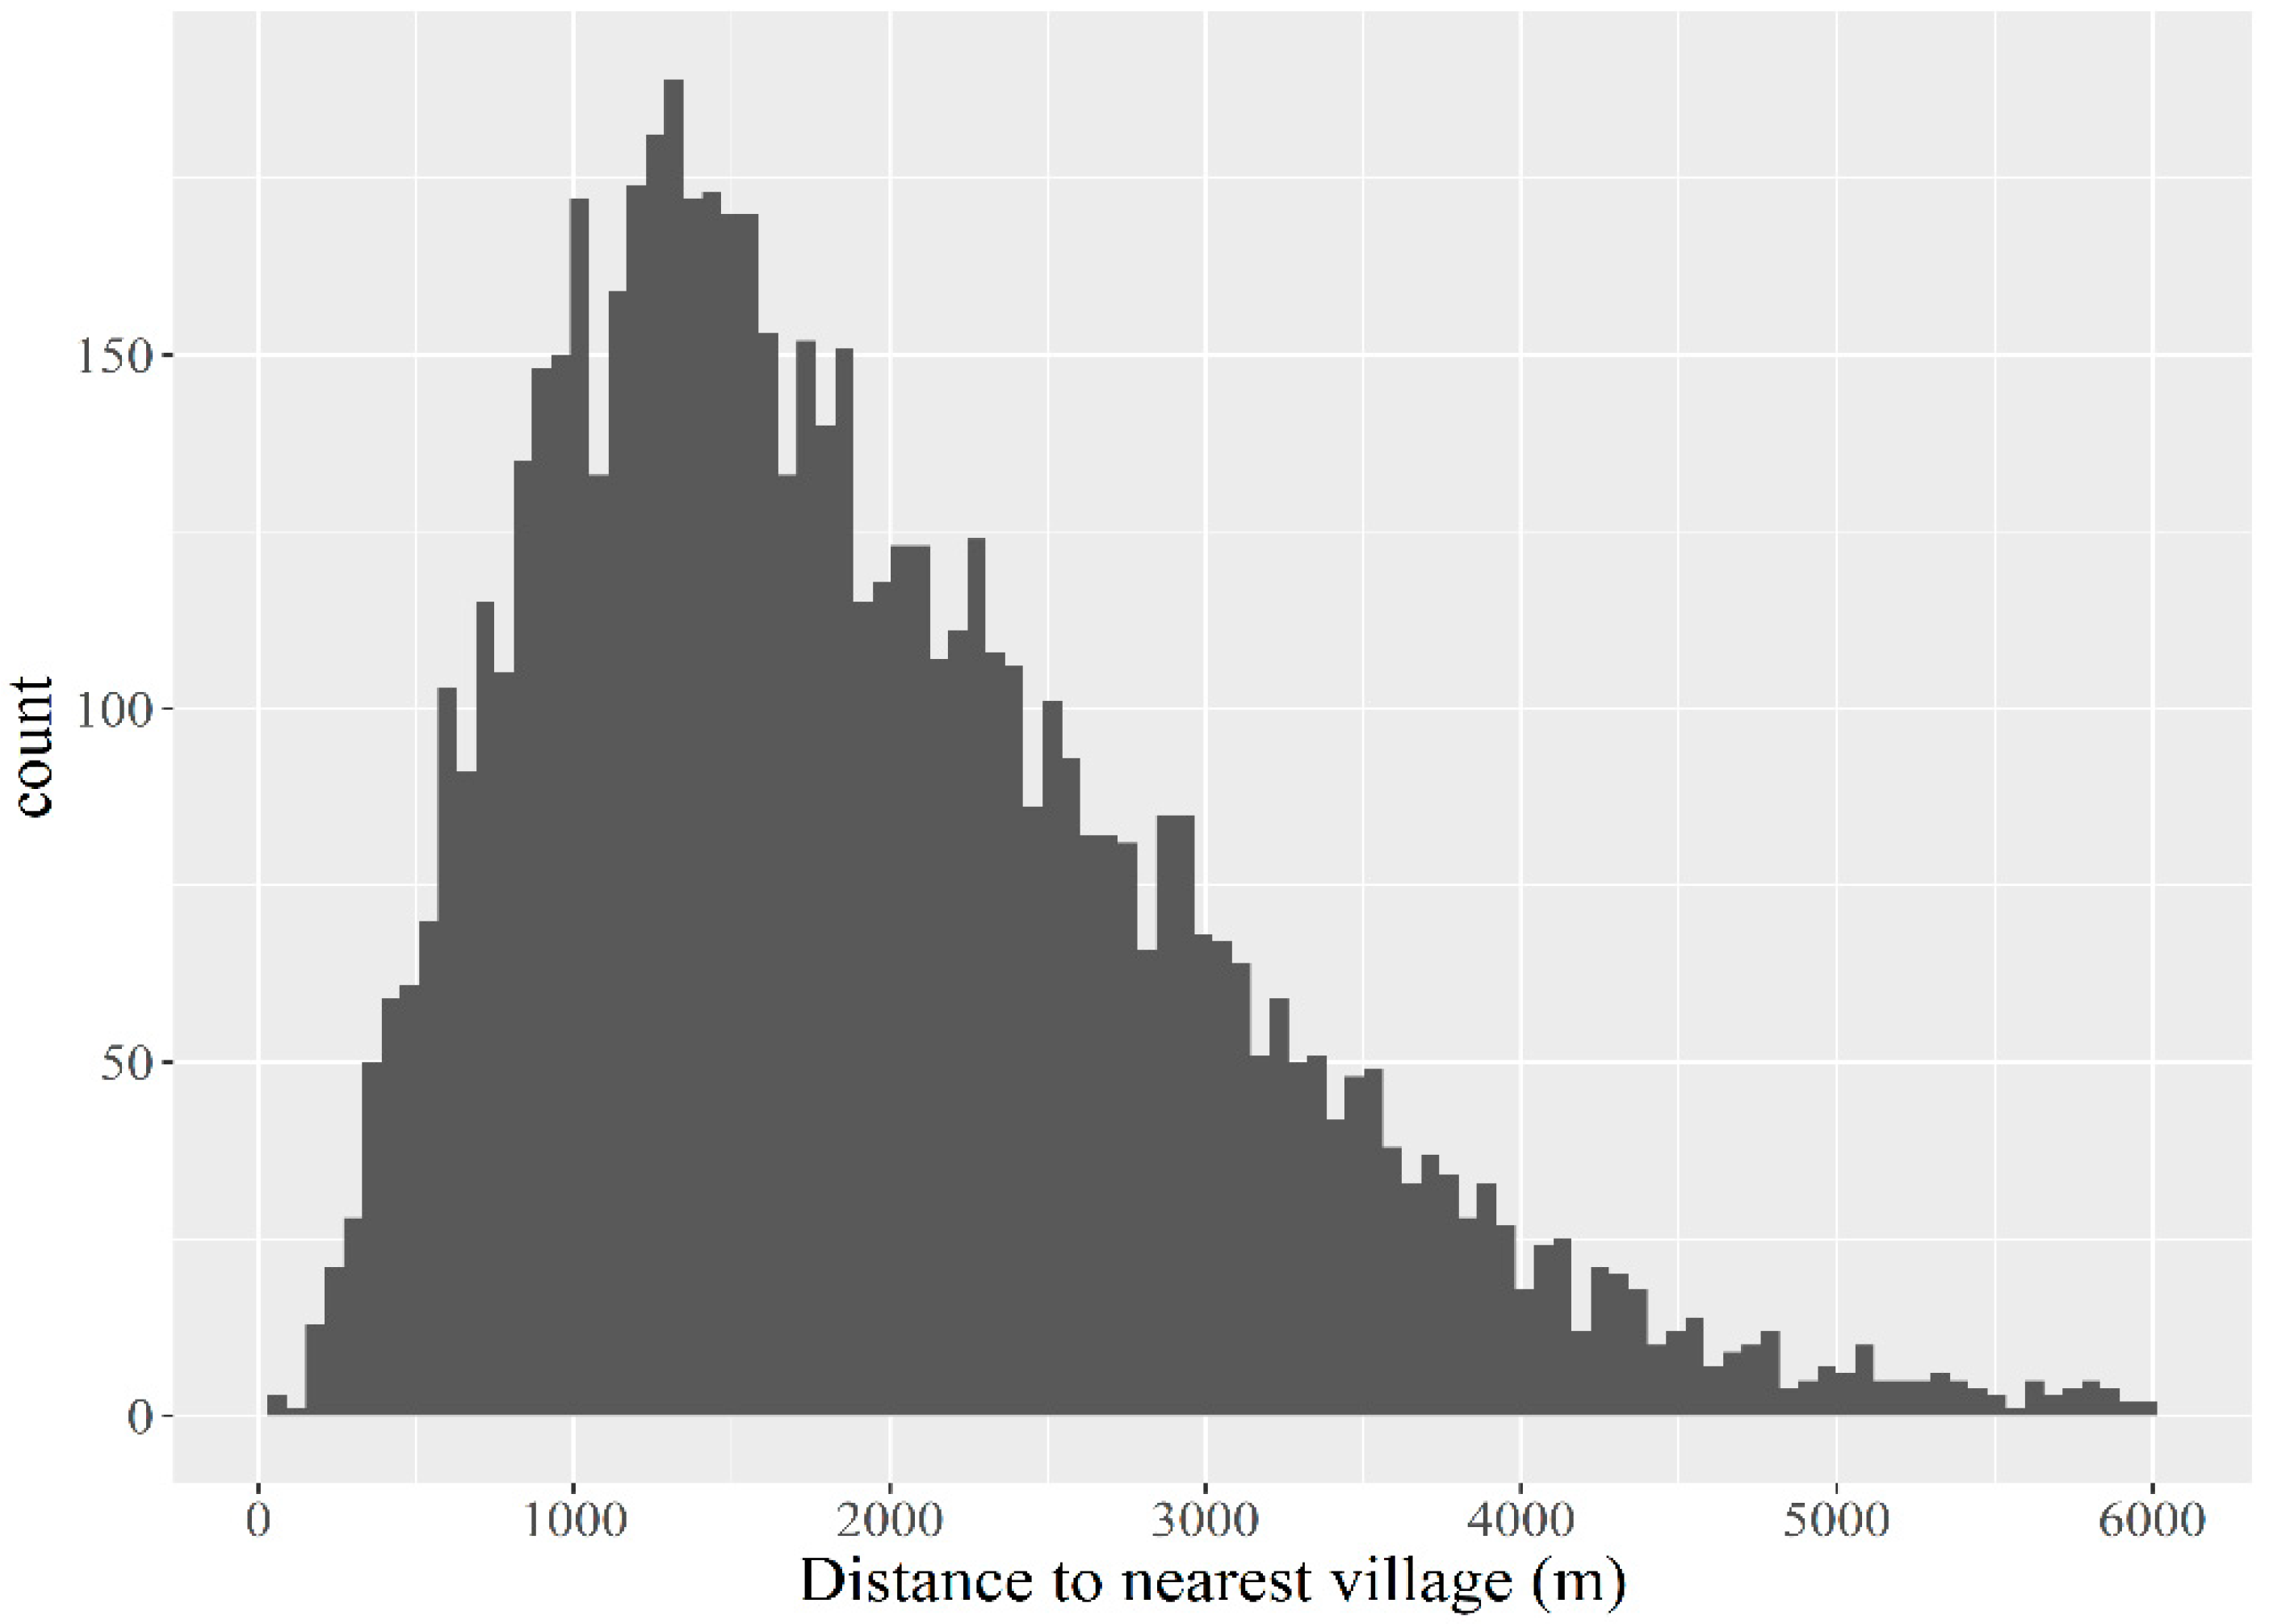
In this study, shifting cultivation patches located within 6 km from villages were targeted, because most shifting cultivation is practiced within 6 km from a village in this region [26]. We downloaded village points in the Bago region from Myanmar Information Management Unit (http://www.themimu.info/). Village points located in Thoungoo and Yedashe Township were selected and visually inspected for their location and existence using high resolution satellite images from DigitalGlobe and CNES/Airbus in Bing Map and Google Earth™. In total, 2 village points were removed because of dam construction, and 17 points were added after visual inspection. Then, villages located in the region where shifting cultivation had been conducted were selected and shifting cultivation patches within 6 km of the village points were used for analysis. The threshold (i.e., 6 km) was validated by the actual location and distribution of shifting cultivation in this study (Figure 3). Finally, 52 village points were retained and 6453 patches surrounding the villages were used for our analysis.
The factors affecting spatial and temporal patterns of shifting cultivation were investigated using a logistic regression model with variables derived from the trajectory-based analysis and topographic data. The response variable was shifting cultivation (1) or no shifting cultivation (0) in each year. Explanatory variables were elevation (scaled to 100 m intervals), slope (degree), distance to the nearest village (km), distance to the nearest shifting cultivation in the same year (km), distance to the nearest shifting cultivation in the preceding year (km), and tasseled cap wetness (TCW) value in the preceding year. Because TCW was used as a spectral index in the trajectory-based analysis, we included TCW to represent the condition of vegetation. We randomly selected 6453 points avoiding shifting cultivation patches in the same year to include in the logistic regression model. The explanatory variables were selected by performing a stepwise model selection.
The results of trajectory-based change detection in the first and last periods of the time series images are generally unreliable because there are no Landsat images before or after the Landsat images bounded by the time series [37]. Thus, we only used the detected patches from 2003 to 2012 in this analysis.
3. Results
3.1. Accuracy Assessments
In the selected 25 km2 area, a total of 531 shifting cultivation patches were detected, which accounted for 8.2% of the total detected shifting cultivation patches in the study area. The result of area-based accuracy assessment is shown in Table 2. The producer’s and user’s accuracies for shifting cultivation across all years were 45.1% and 74.4%, respectively (Table 2).
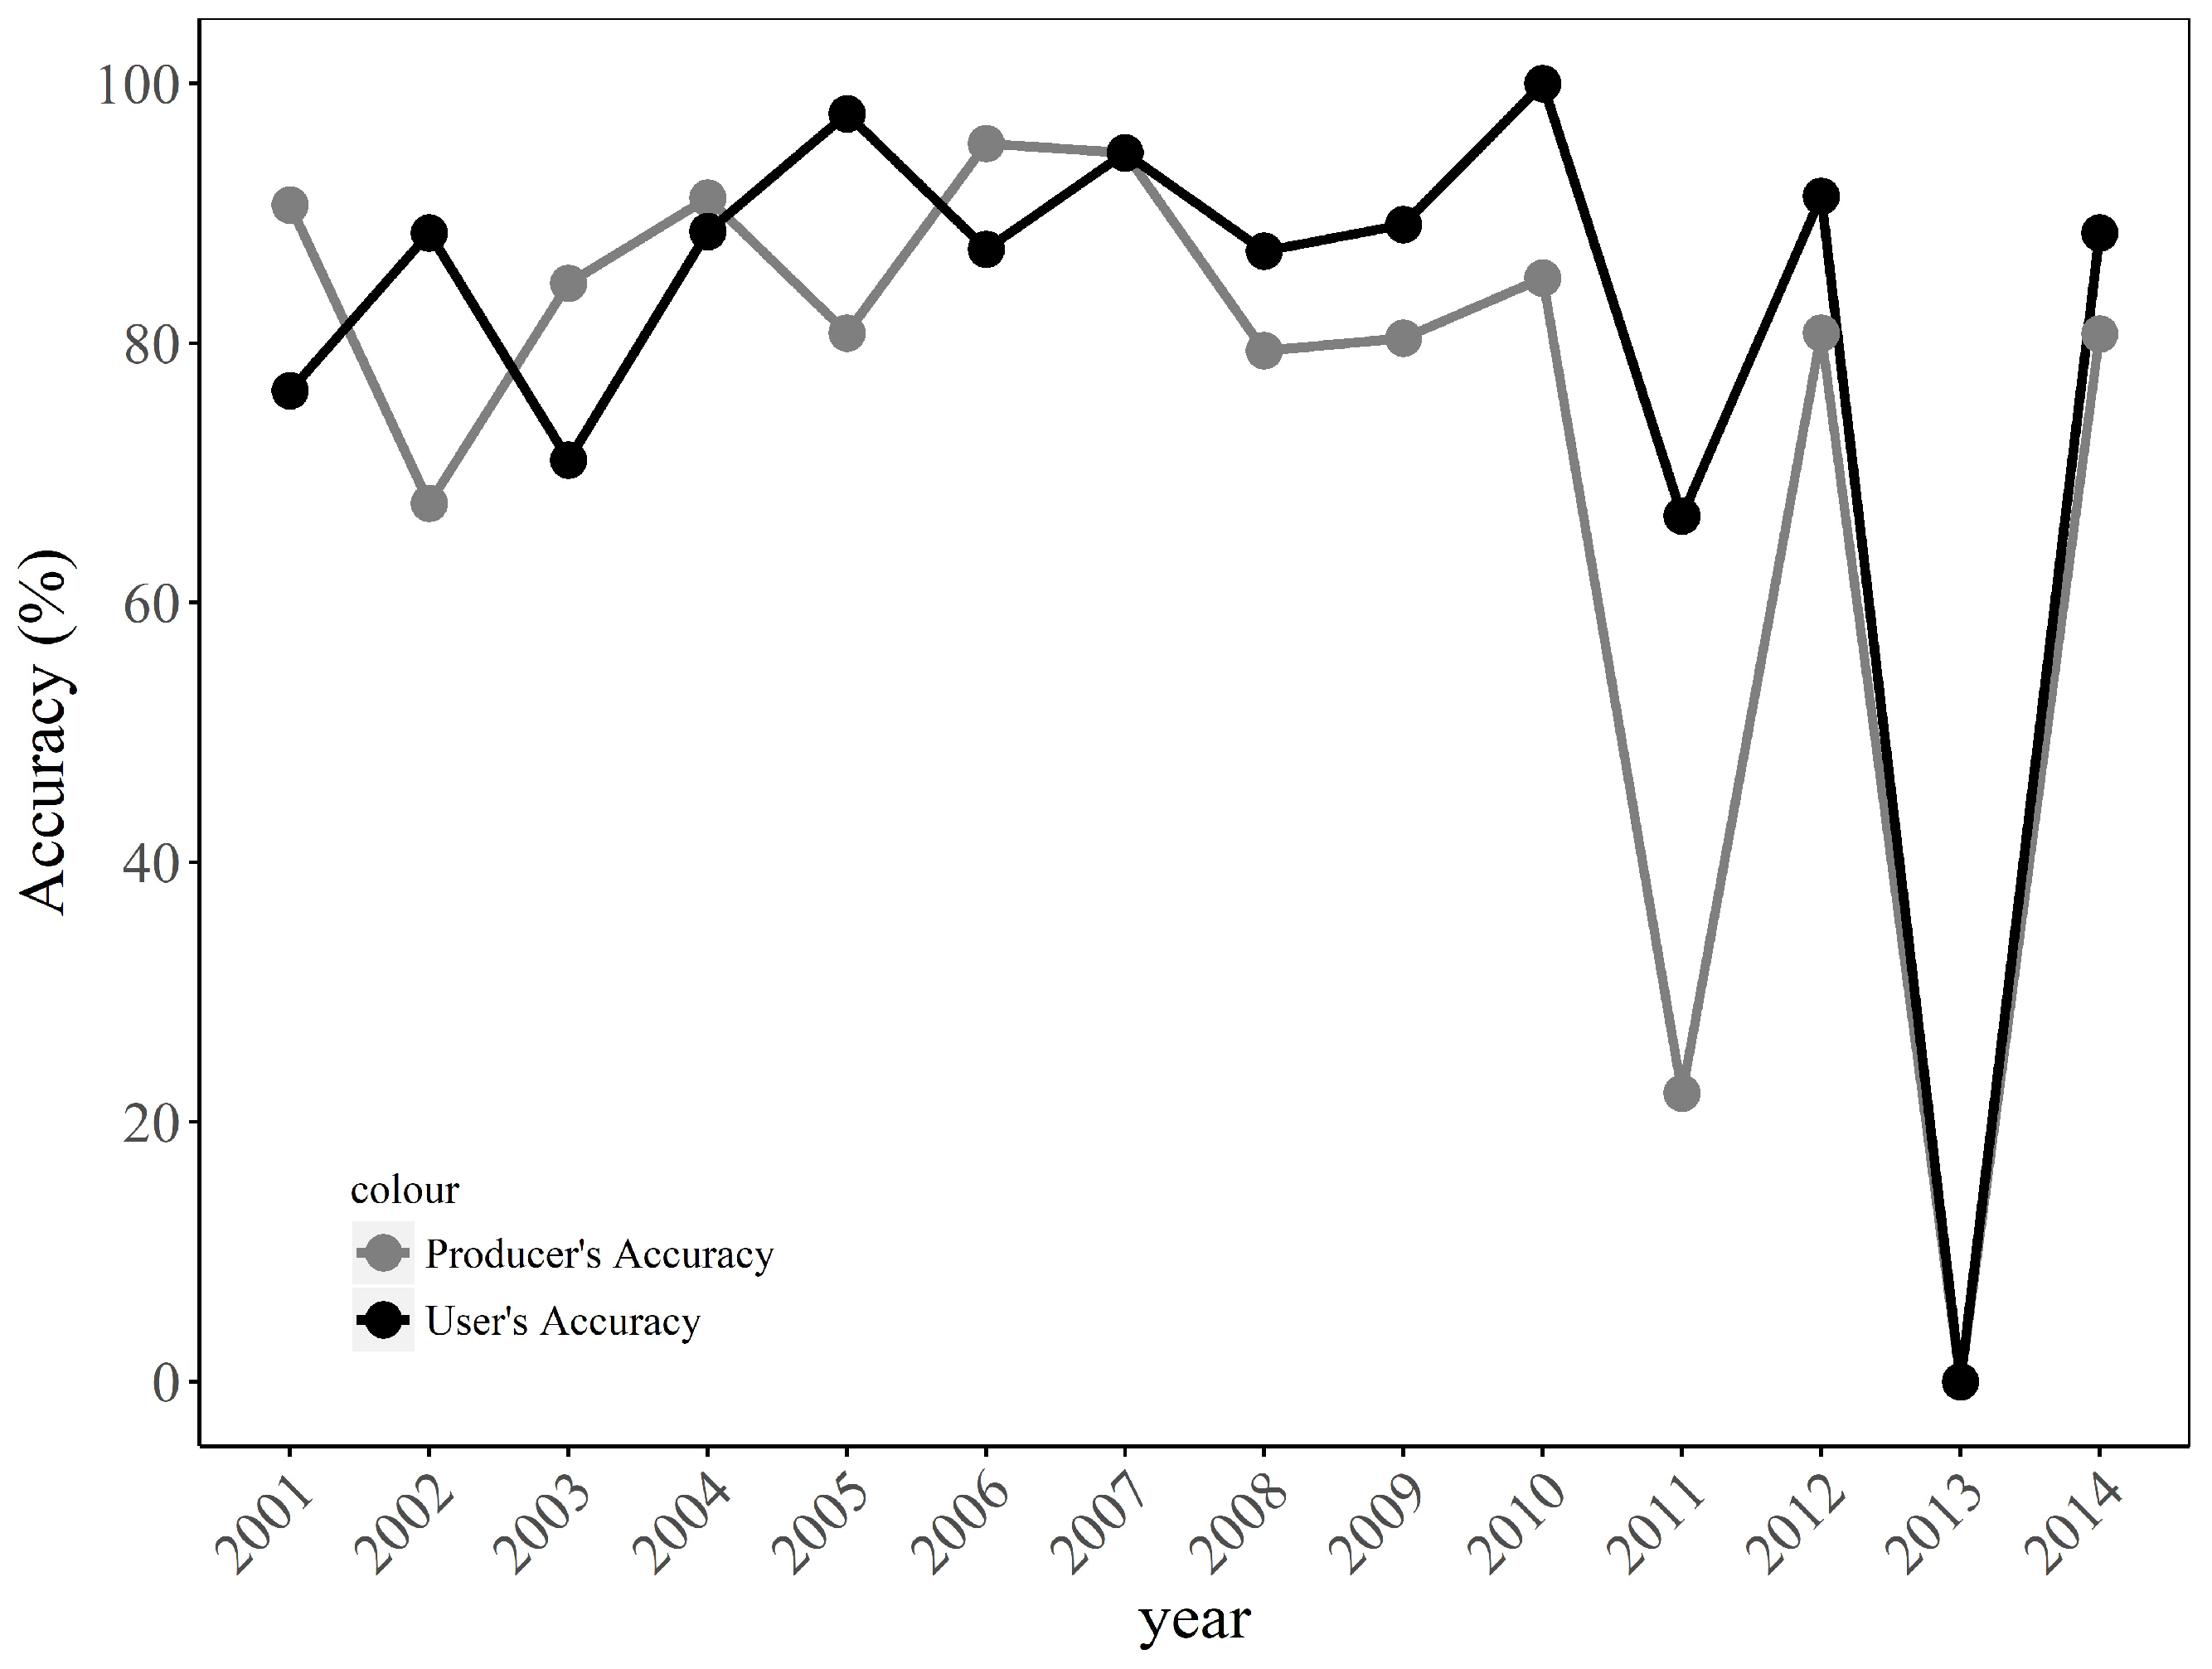
The producer’s and user’s accuracies for shifting cultivation in the patch-based accuracy assessment were 78.1% and 88.4%, respectively. The mean size of all detected patches and reference patches were 1.34 ha and 2.07 ha, respectively. The temporal change of producer’s and user’s accuracies are shown in Figure 4. The producer’s accuracies in some years were quite low compared with those of other years (e.g., 2011 and 2013).
3.2. Patch-Based Characteristics
In the logistic regression model, all explanatory variables except slope were selected in the stepwise model selection and determined as significant for explaining the probability of disturbance caused by shifting cultivation in each year (Table 3). The probability of shifting cultivation increased with increasing elevation and with decreasing distance to the nearest village, distance to the nearest shifting cultivation in the same year, distance to the nearest shifting cultivation in the preceding year, and the TCW value in the preceding year. The model revealed that a 1 km increase in distance to the nearest shifting cultivation in the same year decreased the probability of shifting cultivation by about 80% while a 1 km increase in distance to the nearest shifting cultivation in the preceding year decreased the probability only by about 39%.
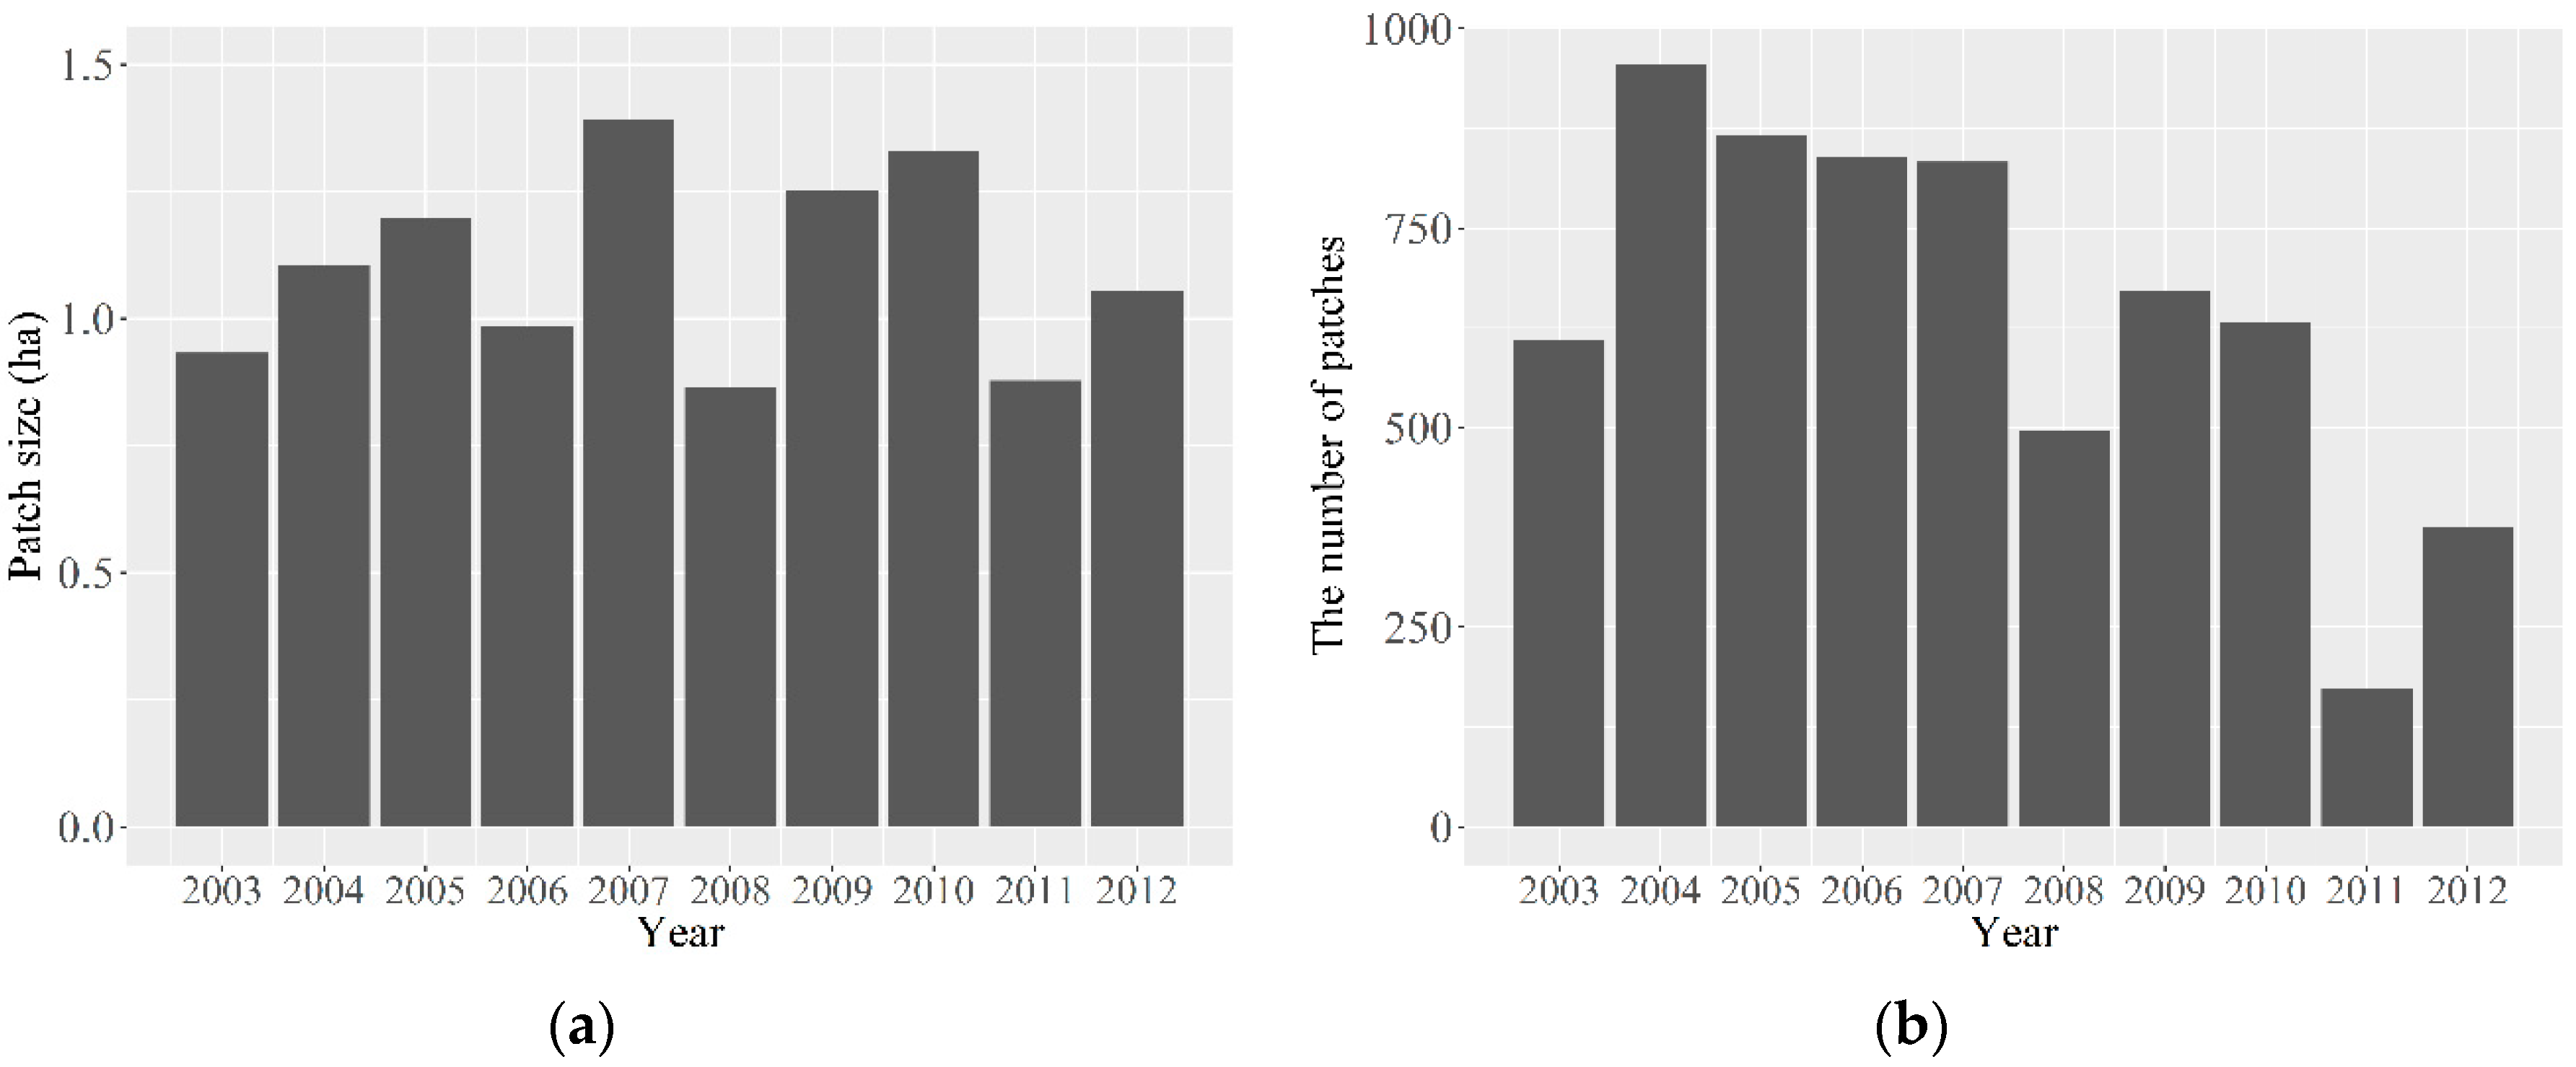
The patch size and the number of detected shifting cultivation patches in the study area are shown in Figure 5. The mean patch size was 1.13 ha, ranging from 0.87 ha to 1.39 ha in each year. There was no clear temporal trend for the mean patch size but the number of detected patches decreased (Figure 5).
4. Discussion
The accuracy of detecting shifting cultivation in terms of spatial overlap was revealed in the area-based and patch-based accuracy assessment. The patch-based accuracy assessment showed satisfactory accuracies (i.e., producer’s accuracy = 78.1% and user’s accuracy = 88.4%). This indicated that most disturbance patches caused by shifting cultivation were, at least partially, detected by the trajectory-based analysis. In the area-based assessment, however, producer’s and user’s accuracies were 45.1% and 74.4%, respectively (Table 2). These relatively low accuracies revealed that the proportion of spatial overlap with the reference patches was low even though some parts of shifting cultivation were successfully detected. The low spatial overlap was assumed to be caused by the detection of too small an area rather than too large an area. Since the mean size of detected patches (1.34 ha) were smaller than those of the reference patches (2.07 ha), we assumed that the detected patches were smaller than the actual size of the cleared area. In total, about 60.6% of actual shifting cultivation (1175.6 ha in Table 2) was detected as shifting cultivation (712.3 ha). Thus, in the whole study area, estimated area of shifting cultivation would only account for about 60.6% of actual area. One possible solution to ensure the successful detection of cleared area is to adjust the parameters in the trajectory-based analysis. Because the change detection by trajectory-based analysis used in this study was largely affected by the fitted temporal segmentation and the parameters for the fitting were adjusted to extract not only shifting cultivation but also other disturbances, adjusting the parameters might be a good way to detect the majority of areas of disturbance caused by shifting cultivation. Although spatial overlap was relatively low, most disturbance patches were detected by the trajectory-based analysis and thus we assume that the timing and location of detected shifting cultivation can be used for further analysis, such as logistic regression models.
The producer’s accuracy for shifting cultivation in the area-based accuracy assessment (i.e., 45.1%) was relatively low considering the result of the pixel-based accuracy assessment and the patch-based change attribution conducted by [31] (i.e., 91.9% and 87.5% in producer’s accuracy in Table 1). Because the pixel-based accuracy assessment conducted by [31] included all types of disturbances, the accuracy of detecting shifting cultivation, which occupies only 10.5% of the total areas of disturbance in the study area, might not be reflected in Table 1 (note that their user’s accuracy—i.e., 35.8% and 100%—cannot be compared with the result of this study because false detection was eliminated in the attribution process). To precisely show the accuracy of each disturbance agent, future studies should identify existing disturbance types and include sufficient samples in the accuracy assessment because different disturbance types can show different levels of accuracies in the trajectory-based analysis.
The producer’s and user’s accuracies of detected patches in each year showed different levels of accuracy in the patch-based accuracy assessment (Figure 4). Several studies have pointed out that trajectory-based change detection for the first and last period is generally unreliable because there are no images before or after the Landsat images bounded by the time series [37]. The accuracies in the last two years of the period in this study coincided with past studies. The reason for a sudden decrease for producer’s accuracy in 2011 was not known; however, based on visual assessment, the signs of shifting cultivation were not clear in 2011 and this might lead to a large omission error.
The factors affecting the probability of shifting cultivation were shown in the logistic regression model. Not surprisingly, the practice of shifting cultivation was more frequently conducted near the villages, especially for distance from 1000 to 2000 m, due to the ease of accessibility from residences. There were few disturbances caused by shifting cultivation in the area very close to the villages (e.g., ~500 m from the villages), because these areas are occupied by residences and protected forests. The areas near the villages are also located at relatively low elevations, and this might be a reason for the higher probability of shifting cultivation at higher elevations. The distance to the nearest shifting cultivation in the same year and preceding year also significantly affected the probability of shifting cultivation. This indicates that shifting cultivation was conducted in a concentrated rather than in a random manner. Considering the difference of odds ratio (i.e., 0.200 and 0.613 for distance to the nearest shifting cultivation in the same year and preceding year, respectively), the distance to the nearest shifting cultivation in the same year was more influential for the probability of shifting cultivation. Lower TCW values in the preceding year increased the probability of shifting cultivation, indicating that lower vegetation cover was more prone to be disturbed by shifting cultivation. This is supported by the practice of shifting cultivation, which is conducted at intervals of 9 to 12 years [28] and thus leads to low aboveground biomass accumulation. Due to the existence of protected forests which have relatively high aboveground biomass, as indicated in the previous study [26], shifting cultivation was likely to occur in areas of low vegetation.
The spatial and temporal patterns of shifting cultivation are usually not random but consequences of site selection by villagers. Villagers tend to open the forests in easily accessible locations [27]. In addition, they do not select mountain ridges for shifting cultivation since a water condition in those places are not suitable for cultivation [26,28]. This selectivity would result in the increased probability of shifting cultivation in the locations near villages and shifting cultivation in the logistic regression model. Because there are limited sites with good accessibility for shifting cultivation, these spatial patterns might also cause shorter fallow periods in these locations. Actually, shorter fallow periods near village locations was observed by interview survey in this region [29]. The impacts of shorter fallow periods on biodiversity and site condition need to be further investigated in terms of sustainable land use in this region.
The size and number of patches in the study area showed the temporal and spatial dynamics of shifting cultivation in the study area. The mean patch size in the study area was 1.13 ha with no significant temporal trend (Figure 5b). Takeda et al. [26] measured the size of cleared area using handy GPS in the field and reported that the mean size ranged from 1.72 ha to 2.70 ha year by year in this region. In comparison with the result by [26], the patch size of detected shifting cultivation in this study was underestimated. This is reasonable since the area-based and patch-based accuracy assessments also indicated sufficient accuracy for the detected number of patches but insufficient overlap with the reference patches. In terms of the number of detected patches, there was a clear decreasing trend (Figure 5a). Based on the temporal change in the size and number of patches detected in this study region, areas affected by shifting cultivation were assumed to be decreasing, which is similar to the country-scale situation in Myanmar in the last few decades [38]. This finding suggests that the decline of the area affected by shifting cultivation in Myanmar is due to a decrease in the number of cleared areas rather than a decrease in the size of cleared areas. The number of shifting cultivation fields is largely affected by the number of households in villages [38]. Recent out-migration to urban area in this region [39] is a possible reason for decreasing number of households and shifting cultivation. In this context, some parts of forests, such as in the location far from villages, will be less cleared by shifting cultivation and have longer recovery period, and this affects the sustainability of the mosaic patterns of landscape in this region.
5. Conclusions
In this study, we investigated the characteristics of patch-based disturbances caused by shifting cultivation detected in the trajectory-based analysis using annual Landsat time series images in Myanmar. The area-based and patch-based accuracy assessments in the selected area showed satisfactory accuracy in terms of the number of detected patches in this area; however, an underestimation of the area detected by the trajectory-based analysis was observed. For the temporal accuracy, the producer’s and user’s accuracies varied year by year, presenting low accuracies in the last periods of time series images. Using the location and timing of shifting cultivation over the whole study area as a response variable, several factors affecting the probability of shifting cultivation were specified in the logistic regression model, which included distance to the nearest villages, distance to the nearest shifting cultivation conducted in the same year and the preceding year, and the TCW value in the preceding year. The temporal dynamics of shifting cultivation over the whole study area showed a declining trend in the number of detected patches although patch size was relatively consistent. The decreasing number of shifting cultivation will cause less disturbance caused by shifting cultivation and longer fallow period in some parts of forests, such as in the location far from villages. These dynamics have the potential to affect the patterns of mosaic landscape caused by shifting cultivation and maintained biodiversity in the mosaic landscape in this region. We showed the utility of patch-based information derived from annual Landsat time series images to assess the dynamics of shifting cultivation. As the pattern of disturbance caused by shifting cultivation varies year by year, using Landsat time series images to detect patch-based shifting cultivation and understand temporal and spatial dynamics is a viable option. This analysis can aid better understanding of shifting cultivation in this region and possibly in other regions where large area ground survey is difficult to be conducted.
Author Contributions
Conceptualization of the research, T.O. and N.M.; Data processing and analysis, K.S. and T.O.; Drafting of the manuscript, K.S.; Revising and reviewing of the manuscript, K.S., T.O., N.M., and S.Y.
Funding
This study was supported by Japan Society for the Promotion of Science KAKENHI Grant Number JP18J12647.
Acknowledgments
The work of K.S. was supported by Research Fellowships of Japan Society for the Promotion of Science for Young Scientists. We thank Leonie Seabrook, from Edanz Group (www.edanzediting.com/ac) for editing a draft of this manuscript.
Conflicts of Interest
The authors declare no conflict of interest. The funding sponsors had no role in the design of the study; in the collection, analyses, or interpretation of data; in the writing of the manuscript, or in the decision to publish the results.
References
- Mertz, O.; Padoch, C.; Fox, J.; Cramb, R.A.; Leisz, S.J.; Lam, N.T.; Vien, T.D. Swidden Change in Southeast Asia: Understanding Causes and Consequences. Hum. Ecol. 2009, 37, 259–264. [Google Scholar] [CrossRef]
- Li, P.; Feng, Z.; Jiang, L.; Liao, C.; Zhang, J. A review of swidden agriculture in Southeast Asia. Remote Sens. 2014, 6, 1654–1683. [Google Scholar] [CrossRef]
- Houghton, R.A. Carbon emissions and the drivers of deforestation and forest degradation in the tropics. Curr. Opin. Environ. Sustain. 2012, 4, 597–603. [Google Scholar] [CrossRef]
- Hosonuma, N.; Herold, M.; De Sy, V.; De Fries, R.S.; Brockhaus, M.; Verchot, L.; Angelsen, A.; Romijn, E. An assessment of deforestation and forest degradation drivers in developing countries. Environ. Res. Lett. 2012, 7, 044009. [Google Scholar] [CrossRef] [Green Version]
- Miettinen, J.; Stibig, H.-J.; Achard, F. Remote sensing of forest degradation in Southeast Asia—Aiming for a regional view through 5–30 m satellite data. Glob. Ecol. Conserv. 2014, 2, 24–36. [Google Scholar] [CrossRef] [Green Version]
- Van Vliet, N.; Mertz, O.; Heinimann, A.; Langanke, T.; Pascual, U.; Schmook, B.; Adams, C.; Schmidt-Vogt, D.; Messerli, P.; Leisz, S.; et al. Trends, drivers and impacts of changes in swidden cultivation in tropical forest-agriculture frontiers: A global assessment. Glob. Environ. Chang. 2012, 22, 418–429. [Google Scholar] [CrossRef]
- Fox, J.; Fujita, Y.; Ngidang, D.; Peluso, N.; Potter, L.; Sakuntaladewi, N.; Sturgeon, J.; Thomas, D. Policies, Political-Economy, and Swidden in Southeast Asia. Hum. Ecol. 2009, 37, 305–322. [Google Scholar] [CrossRef] [PubMed] [Green Version]
- Heinimann, A.; Mertz, O.; Frolking, S.; Christensen, A.E.; Hurni, K.; Sedano, F.; Chini, L.P.; Sahajpal, R.; Hansen, M.; Hurtt, G. A global view of shifting cultivation: Recent, current, and future extent. PLoS ONE 2017, 12, e0184479. [Google Scholar] [CrossRef] [PubMed]
- Padoch, C.; Pinedo-Vasquez, M. Saving Slash-and-Burn to Save Biodiversity. Biotropica 2010, 42, 550–552. [Google Scholar] [CrossRef]
- Finegan, B.; Nasi, R. The biodiversity and conservation potential of shifting cultivation landscapes. In Agroforestry and Biodiversity Conservation in Tropical Landsacapes; Schroth, G., Da Fonseca, G.A., Harvey, C.A., Gascon, C., Vasconcelos, H.L., Izac, A.M.N., Eds.; Island Press: Washington, DC, USA, 2004; pp. 153–197. [Google Scholar]
- Mukul, S.A.; Herbohn, J.; Firn, J. Tropical secondary forests regenerating after shifting cultivation in the Philippines uplands are important carbon sinks. Sci. Rep. 2016, 6, 22483. [Google Scholar] [CrossRef] [PubMed] [Green Version]
- De Sy, V.; Herold, M.; Achard, F.; Asner, G.P.; Held, A.; Kellndorfer, J.; Verbesselt, J. Synergies of multiple remote sensing data sources for REDD+ monitoring. Curr. Opin. Environ. Sustain. 2012, 4, 696–706. [Google Scholar] [CrossRef]
- Molinario, G.; Hansen, M.C.; Potapov, P.V. Forest cover dynamics of shifting cultivation in the Democratic Republic of Congo: A remote sensing-based assessment for 2000–2010. Environ. Res. Lett. 2015, 10, 094009. [Google Scholar] [CrossRef]
- Molinario, G.; Hansen, M.C.; Potapov, P.V.; Tyukavina, A.; Stehman, S.; Barker, B.; Humber, M. Quantification of land cover and land use within the rural complex of the Democratic Republic of Congo. Environ. Res. Lett. 2017, 12, 104001. [Google Scholar] [CrossRef] [Green Version]
- Frolking, S.; Palace, M.W.; Clark, D.B.; Chambers, J.Q.; Shugart, H.H.; Hurtt, G.C. Forest disturbance and recovery: A general review in the context of spaceborne remote sensing of impacts on aboveground biomass and canopy structure. J. Geophys. Res. Biogeosci. 2009, 114, G00E02. [Google Scholar] [CrossRef]
- Woodcock, C.E.; Allen, R.; Anderson, M.; Belward, A.S.; Bindschadler, R.; Cohen, W.B.; Gao, F.; Goward, S.N.; Helder, D.; Helmer, E.; et al. Free access to landsat imagery. Science 2008, 320, 1011. [Google Scholar] [CrossRef] [PubMed]
- Fujiki, S.; Okada, K.; Nishio, S.; Kitayama, K. Estimation of the stand ages of tropical secondary forests after shifting cultivation based on the combination of WorldView-2 and time-series Landsat images. ISPRS J. Photogramm. Remote Sens. 2016, 119, 280–293. [Google Scholar] [CrossRef]
- Inoue, Y.; Kiyono, Y.; Asai, H.; Ochiai, Y.; Qi, J.; Olioso, A.; Shiraiwa, T.; Horie, T.; Saito, K.; Dounagsavanh, L. Assessing land-use and carbon stock in slash-and-burn ecosystems in tropical mountain of Laos based on time-series satellite images. Int. J. Appl. Earth Obs. Geoinf. 2010, 12, 287–297. [Google Scholar] [CrossRef]
- Liao, C.; Feng, Z.; Li, P.; Zhang, J. Monitoring the spatio-temporal dynamics of swidden agriculture and fallow vegetation recovery using Landsat imagery in northern Laos. J. Geogr. Sci. 2015, 25, 1218–1234. [Google Scholar] [CrossRef] [Green Version]
- Li, P.; Feng, Z. Extent and Area of Swidden in Montane Mainland Southeast Asia: Estimation by Multi-Step Thresholds with Landsat-8 OLI Data. Remote Sens. 2016, 8, 44. [Google Scholar] [CrossRef]
- Zhu, Z. Change detection using landsat time series: A review of frequencies, preprocessing, algorithms, and applications. ISPRS J. Photogramm. Remote Sens. 2017, 130, 370–384. [Google Scholar] [CrossRef]
- Schneibel, A.; Frantz, D.; Röder, A.; Stellmes, M.; Fischer, K.; Hill, J. Using Annual Landsat Time Series for the Detection of Dry Forest Degradation Processes in South-Central Angola. Remote Sens. 2017, 9, 905. [Google Scholar] [CrossRef]
- Dutrieux, L.P.; Jakovac, C.C.; Latifah, S.H.; Kooistra, L. Reconstructing land use history from Landsat time-series. Int. J. Appl. Earth Obs. Geoinf. 2016, 47, 112–124. [Google Scholar] [CrossRef]
- Jakovac, C.C.; Dutrieux, L.P.; Siti, L.; Peña-Claros, M.; Bongers, F. Spatial and temporal dynamics of shifting cultivation in the middle-Amazonas river: Expansion and intensification. PLoS ONE 2017, 12, e0181092. [Google Scholar] [CrossRef] [PubMed]
- Fukushima, M.; Kanzaki, M.; Hla Maung, T.; Yazar, M. Recovery process of fallow vegetation in the Traditional Karen Swidden Cultivation System in the Bago Mountain Range, Myanmar. Southeast Asian Stud. 2007, 45, 317–333. [Google Scholar]
- Takeda, S.; Suzuki, R.; Thein, H.M. Mapping Shifting Cultivation Fields in a Karen Area of the Bago Mountains, Myanmar. Southeast Asian Stud. 2007, 45, 334–342. [Google Scholar] [CrossRef]
- Kosaka, Y.; Takeda, S. Underground biomass accumulation of two economically important non-timber forest products is influenced by ecological settings and swiddeners’ management in the Bago Mountains, Myanmar. For. Ecol. Manag. 2017, 404, 330–337. [Google Scholar] [CrossRef]
- Suzuki, R.; Takeda, S.; Thein, H.M. Analysis of Land Use History and Fallow Vegetation Recovery: A Case Study of Shifting Cultivation by the Karen in the Bago Mountains, Myanmar. Southeast Asian Stud. 2007, 45, 343–358. [Google Scholar]
- Chan, N.; Takeda, S.; Suzuki, R.; Yamamoto, S. Establishment of allometric models and estimation of biomass recovery of swidden cultivation fallows in mixed deciduous forests of the Bago Mountains, Myanmar. For. Ecol. Manag. 2013, 304, 427–436. [Google Scholar] [CrossRef]
- Chan, N.; Takeda, S.; Suzuki, R.; Yamamoto, S. Assessment of biomass recovery and soil carbon storage of fallow forests after swidden cultivation in the Bago Mountains, Myanmar. New For. 2016, 47, 565–585. [Google Scholar] [CrossRef]
- Shimizu, K.; Ahmed, O.S.; Ponce-Hernandez, R.; Ota, T.; Win, Z.C.; Mizoue, N.; Yoshida, S. Attribution of Disturbance Agents to Forest Change Using a Landsat Time Series in Tropical Seasonal Forests in the Bago Mountains, Myanmar. Forests 2017, 8, 218. [Google Scholar] [CrossRef]
- Masek, J.G.; Vermote, E.F.; Saleous, N.E.; Wolfe, R.; Hall, F.G.; Huemmrich, K.F.; Gao, F.; Kutler, J.; Lim, T.K. A Landsat Surface Reflectance Dataset for North America, 1990–2000. IEEE Geosci. Remote Sens. Lett. 2006, 3, 68–72. [Google Scholar] [CrossRef]
- Canty, M.J.; Nielsen, A.A. Automatic radiometric normalization of multitemporal satellite imagery with the iteratively re-weighted MAD transformation. Remote Sens. Environ. 2008, 112, 1025–1036. [Google Scholar] [CrossRef] [Green Version]
- Zeng, C.; Shen, H.; Zhang, L. Recovering missing pixels for Landsat ETM+ SLC-off imagery using multi-temporal regression analysis and a regularization method. Remote Sens. Environ. 2013, 131, 182–194. [Google Scholar] [CrossRef]
- Kennedy, R.E.; Yang, Z.; Cohen, W.B. Detecting trends in forest disturbance and recovery using yearly Landsat time series: 1. LandTrendr—Temporal segmentation algorithms. Remote Sens. Environ. 2010, 114, 2897–2910. [Google Scholar] [CrossRef]
- Linke, J.; Fortin, M.-J.; Courtenay, S.; Cormier, R. High-resolution global maps of 21st-century annual forest loss: Independent accuracy assessment and application in a temperate forest region of Atlantic Canada. Remote Sens. Environ. 2017, 188, 164–176. [Google Scholar] [CrossRef]
- Cohen, W.; Healey, S.; Yang, Z.; Stehman, S.; Brewer, C.; Brooks, E.; Gorelick, N.; Huang, C.; Hughes, M.; Kennedy, R.; et al. How Similar Are Forest Disturbance Maps Derived from Different Landsat Time Series Algorithms? Forests 2017, 8, 98. [Google Scholar] [CrossRef]
- Chan, N.; Takeda, S. The Transition Away From Swidden Agriculture and Trends in Biomass Accumulation in Fallow Forests: Case Studies in the Southern Chin Hills of Myanmar. Mt. Res. Dev. 2016, 36, 320–331. [Google Scholar] [CrossRef] [Green Version]
- Ministry of Labour Immigration and Population. Overview of the Results of the 2014 Population and Housing Census, Myanmar; Ministry of Labour Immigration and Population: Nay Pyi Taw, Myanmar, 2017.
Figure 1.
The location of the study area in Myanmar. The two townships colored grey indicate where shifting cultivation has been actively practiced. Villages except in the urban area are shown on a natural color Landsat 8 OLI image acquired in 2014. Administrative boundaries and village locations were sourced from Myanmar Information Management Unit (http://www.themimu.info/). The World Borders Dataset provided by Thematic Mapping (http://thematicmapping.org/) was used as the country border.

Figure 2.
The procedure for area-based and patch-based accuracy assessment. Visual interpretation was conducted using reference data. Detected patches were assessed based on the spatial overlap with the reference patches. The high-resolution satellite image in this figure was from Image © 2018 DigitalGlobe.

Figure 3.
The histogram of distance to the nearest village from shifting cultivation in the study area. The mean and median of the distance to the nearest village were 1943 m and 1741 m, respectively (n = 6453).
Figure 3.
The histogram of distance to the nearest village from shifting cultivation in the study area. The mean and median of the distance to the nearest village were 1943 m and 1741 m, respectively (n = 6453).

Figure 4.
The producer’s and user’s accuracies for detected patches in each year.

Figure 5.
(a) The mean patch size of detected patches in each year, and (b) the number of detected patches in each year in the study area.
Figure 5.
(a) The mean patch size of detected patches in each year, and (b) the number of detected patches in each year in the study area.


Table 1.
Producer’s and user’s accuracies of pixel-based change detection and patch-based change attribution in [31].
Table 1.
Producer’s and user’s accuracies of pixel-based change detection and patch-based change attribution in [31].
| “Disturbance“ in Pixel-Based Change Detection | “Shifting Cultivation“ in Patch-Based Change Attribution | |
|---|---|---|
| Producer‘s accuracy (%) | 91.9 | 87.5 |
| User‘s accuracy (%) | 35.8 | 100.0 |
Table 2.
Confusion matrix of the area-based accuracy assessment in the selected 25 km2 area from 2000 to 2014.
Table 2.
Confusion matrix of the area-based accuracy assessment in the selected 25 km2 area from 2000 to 2014.
| Reference Patches | |||||
|---|---|---|---|---|---|
| Shifting Cultivation (ha) | No Shifting Cultivation (ha) | Sum (ha) | User’s Accuracy (%) | ||
| Detected patches | Shifting cultivation (ha) | 529.9 | 182.3 | 712.3 | 74.4 |
| No shifting cultivation (ha) | 645.7 | 33782.2 | 34427.9 | 98.1 | |
| Sum (ha) | 1175.6 | 33964.6 | |||
| Producer’s accuracy (%) | 45.1 | 99.5 | |||
Table 3.
Result of logistic regression for the probability of disturbance caused by shifting cultivation.
Table 3.
Result of logistic regression for the probability of disturbance caused by shifting cultivation.
| Coefficients | Estimate | Standard Error | z Value | p Value | Odds Ratio |
|---|---|---|---|---|---|
| Intercept | 1.5831 | 0.1768 | 8.954 | <0.0001 | 4.870 |
| Elevation (100 m) | 0.1342 | 0.0627 | 2.139 | 0.0324 | 1.144 |
| Distance to nearest village (km) | −0.3059 | 0.0200 | −15.334 | <0.0001 | 0.736 |
| Distance to nearest shifting cultivation in the same year (km) | −1.6090 | 0.0469 | −34.302 | <0.0001 | 0.200 |
| Distance to nearest shifting cultivation in the preceding year (km) | −0.4895 | 0.0361 | −13.548 | <0.0001 | 0.613 |
| Tasseled cap wetness value in the preceding year | −5.8257 | 1.0074 | −5.783 | <0.0001 | 0.003 |
© 2018 by the authors. Licensee MDPI, Basel, Switzerland. This article is an open access article distributed under the terms and conditions of the Creative Commons Attribution (CC BY) license (http://creativecommons.org/licenses/by/4.0/).
Share and Cite
MDPI and ACS Style
Shimizu, K.; Ota, T.; Mizoue, N.; Yoshida, S. Patch-Based Assessments of Shifting Cultivation Detected by Landsat Time Series Images in Myanmar. Sustainability 2018, 10, 3350. https://0-doi-org.brum.beds.ac.uk/10.3390/su10093350
AMA Style
Shimizu K, Ota T, Mizoue N, Yoshida S. Patch-Based Assessments of Shifting Cultivation Detected by Landsat Time Series Images in Myanmar. Sustainability. 2018; 10(9):3350. https://0-doi-org.brum.beds.ac.uk/10.3390/su10093350
Chicago/Turabian StyleShimizu, Katsuto, Tetsuji Ota, Nobuya Mizoue, and Shigejiro Yoshida. 2018. "Patch-Based Assessments of Shifting Cultivation Detected by Landsat Time Series Images in Myanmar" Sustainability 10, no. 9: 3350. https://0-doi-org.brum.beds.ac.uk/10.3390/su10093350
Note that from the first issue of 2016, this journal uses article numbers instead of page numbers. See further details here.