Review

A Review of Waste Management Decision Support Tools and Their Ability to Assess Circular Biowaste Management Systems

by
Eldbjørg Blikra Vea
1,
Veronica Martinez-Sanchez
2 and
Marianne Thomsen
1,*
1
Department of Environmental Science, Aarhus University, 40000 Roskilde, Denmark
2
Fundació ENT, Carrer Josep Llanza, 08800 Vilanova i la Geltrú, Spain
*
Author to whom correspondence should be addressed.
Sustainability 2018, 10(10), 3720; https://0-doi-org.brum.beds.ac.uk/10.3390/su10103720
Submission received: 31 August 2018 / Revised: 30 September 2018 / Accepted: 11 October 2018 / Published: 16 October 2018
(This article belongs to the Special Issue The New Paradigm of Waste Management: Waste as Resources)

Abstract

:
The circular economy concept offers a number of solutions to increasing amounts of biowaste and resource scarcity by valorising biowaste. However, it is necessary to consistently address the environmental benefits and impacts of circular biowaste management systems (CBWMS). Various decision support tools (DST) for environmental assessment of waste management systems (WMS) exist. This study provides a review of life cycle assessment based WMS-DSTs. Twenty-five WMS-DSTs were identified and analysed through a shortlisting procedure. Eight tools were shortlisted for the assessment of their applicability to deliver sustainability assessment of CBWMS. It was found that six tools model key properties that are necessary for assessing the environmental sustainability of CBWMSs, including waste-specific modelling of gaseous emissions, biogas generation or bioproduct composition. However, only two tools consider both waste-specific heavy metals content in bioproducts and the associated implications when applied on soil. Most of the shortlisted tools are flexible to simulate new technologies involved in CBWMS. Nevertheless, only two tools allow importing directly new background data, which is important when modelling substitution of new bioproducts developed in emerging biowaste refineries.

1. Introduction

Circular economy has gained attention as a key solution for mitigating the increasing generation of solid waste and resource scarcity. As opposed to the linear economy, the concept describes how to develop closed-loop technical and biological cycles by either recycling materials indefinitely with no degradation of their properties (the technical cycle) or returning materials to the natural ecosystem with no harm to the environment (the biological cycle) [1]. Although circular economy practices (such as material recycling) are widely embraced as a sustainability strategy, it is important to consistently assess their net environmental benefits and possible drawbacks [2] and develop methods and indicators that are suitable for assessing circular economy concepts [3]. The term “circular economy” is frequently applied to suggest increased sustainability. However, it tends to focus on an increased quantity of reused and recycled resources and overlook the quality of resource flows re-entering to the product cycle [4]. This can pose a risk of augmenting unwanted recirculation of micro-pollutants [5,6,7,8], if disregarding the material quality, particularly in the transition period from linear to circular systems.
In 2015, 241 million tonnes of municipal solid waste were generated in the EU [9]. Of this waste, 40–60% was organic waste [10], representing a great challenge in terms of its management. However, at the same time, organic waste also constitutes a valuable resource as a component in the circular bioeconomy [11,12]. Biowaste-based biorefineries, producing high value products such as enzymes, bioplastic and biofertilizer from the organic fraction of municipal solid waste, is an emerging technology field whose environmental performance should be addressed to ensure a beneficial implementation [12]. This study refers to such circular economy systems related to management of municipal biowaste as circular biowaste management systems (CBWMS).
Several decision support tools (DSTs) based on life cycle assessment (LCA) are currently available to assess the sustainability of waste management systems (WMS). These WMS-DSTs are specifically developed to analyse the performance of integrated WMSs from collection, treatment and final disposal. Winkler and Bilitewski [13] and Jain et al. [14] showed large discrepancies in the results obtained when modelling specific scenarios across different WMS-DSTs. Gentil et al. [15] analysed the technical assumptions that caused the difference in the results obtained with various WMS-DST; e.g., time horizon for landfill emissions and calculation of long-term carbon balance when applying biowaste derived compost on soil [15].
However, there is still a need to identify, analyse and challenge the technical assumptions included in the tools to strengthen waste LCA modelling [15]. Moreover, a recent in-depth review of WMS-DSTs does not exist and how they are applicable for assessing CBWMS is not yet studied. For example, what types of biological treatment technologies are included in existing DSTs and if they are adaptable to represent emerging advanced treatment set-ups in biorefineries transforming biowaste into biobased products. The applicability to assess CBWMS would also imply that the tools are able to assess the fate of impurities present in the biowaste and model the nutrient capture when applying biobased products such as compost on soil.
The overall aim of this study was to review and analyse existing LCA-based WMS-DSTs and their applicability in sustainability assessment of CBWMSs, focusing on municipal biowaste. To reach this aim, this study fulfilled the following objectives: (1) identify, compare, evaluate and shortlist existing WMS-DSTs based on their general characteristics; (2) analyse the applicability of the shortlisted tools to assess CBWMS, based on default datasets and flexibility; and (3) discuss how to increase the applicability of existing WMS-DSTs to assess CBWMS. This review is performed to provide a state-of-the-art overview of existing WMS-DST to support the development of a decision support tool for CBWMS within the project DECISIVE [16].

2. Methodology

2.1. Waste Management Decision Support Tools

A LCA WMS-DST often has two main modules: life cycle inventories (LCI) and impact assessment modules (Figure 1). The LCI module includes all information needed to model foreground and background process data. Foreground processes account for direct consumptions, emissions or outputs in the collection and treatment phases, while background processes account for the production of material and energy items consumed in waste collection and treatment. The LCI module can encompass two sub-modules: waste collection chain processes and waste treatment processes. Both include type of collection system or treatment process, foreground data inventories, technical assumptions and calculations algorithms and they are connected with background processes. Calculation algorithms typically connect the modules, linking the data inventory module to the impact assessment module by computing, e.g., mass flow balances of the system of study. Technical assumptions are for example type of substituted energy sources and the assumptions applied in the calculations, e.g., the time horizon for carbon storage. The impact assessment module translates inventory data to indicators (e.g., climate change and human toxicity) commonly applying life cycle impact assessment (LCIA) methods.
In the waste collection chain processes, type of collection system, transportation and distances are typically included. In addition, data on amounts and composition of the collected waste considering macro-impurities (non-biowaste fractions such as paper, plastic and metals that can be mechanically removed) and micro-impurities (chemical contamination that cannot be mechanically removed) is normally included in a separate waste characterization process. For a full definition of macro- and micro-impurities refer to [17]. The waste treatment processes module covers technologies related to both main treatment (e.g., composting) and final treatment of refuse derived from the main treatment (e.g., incineration and landfill)
The focus of this paper is on waste characteristics and waste treatment processes as it is assumed that these are most affected by the change towards circular economy (Figure 1). Waste collection is addressed indirectly by considering how the tools quantify the content of macro- and micro- impurities in the collected waste. The impact assessment part is only addressed to the level that at least one environmental impact indicator must be included for the tools to be considered in this review (see Step 1 in Section 2.2).

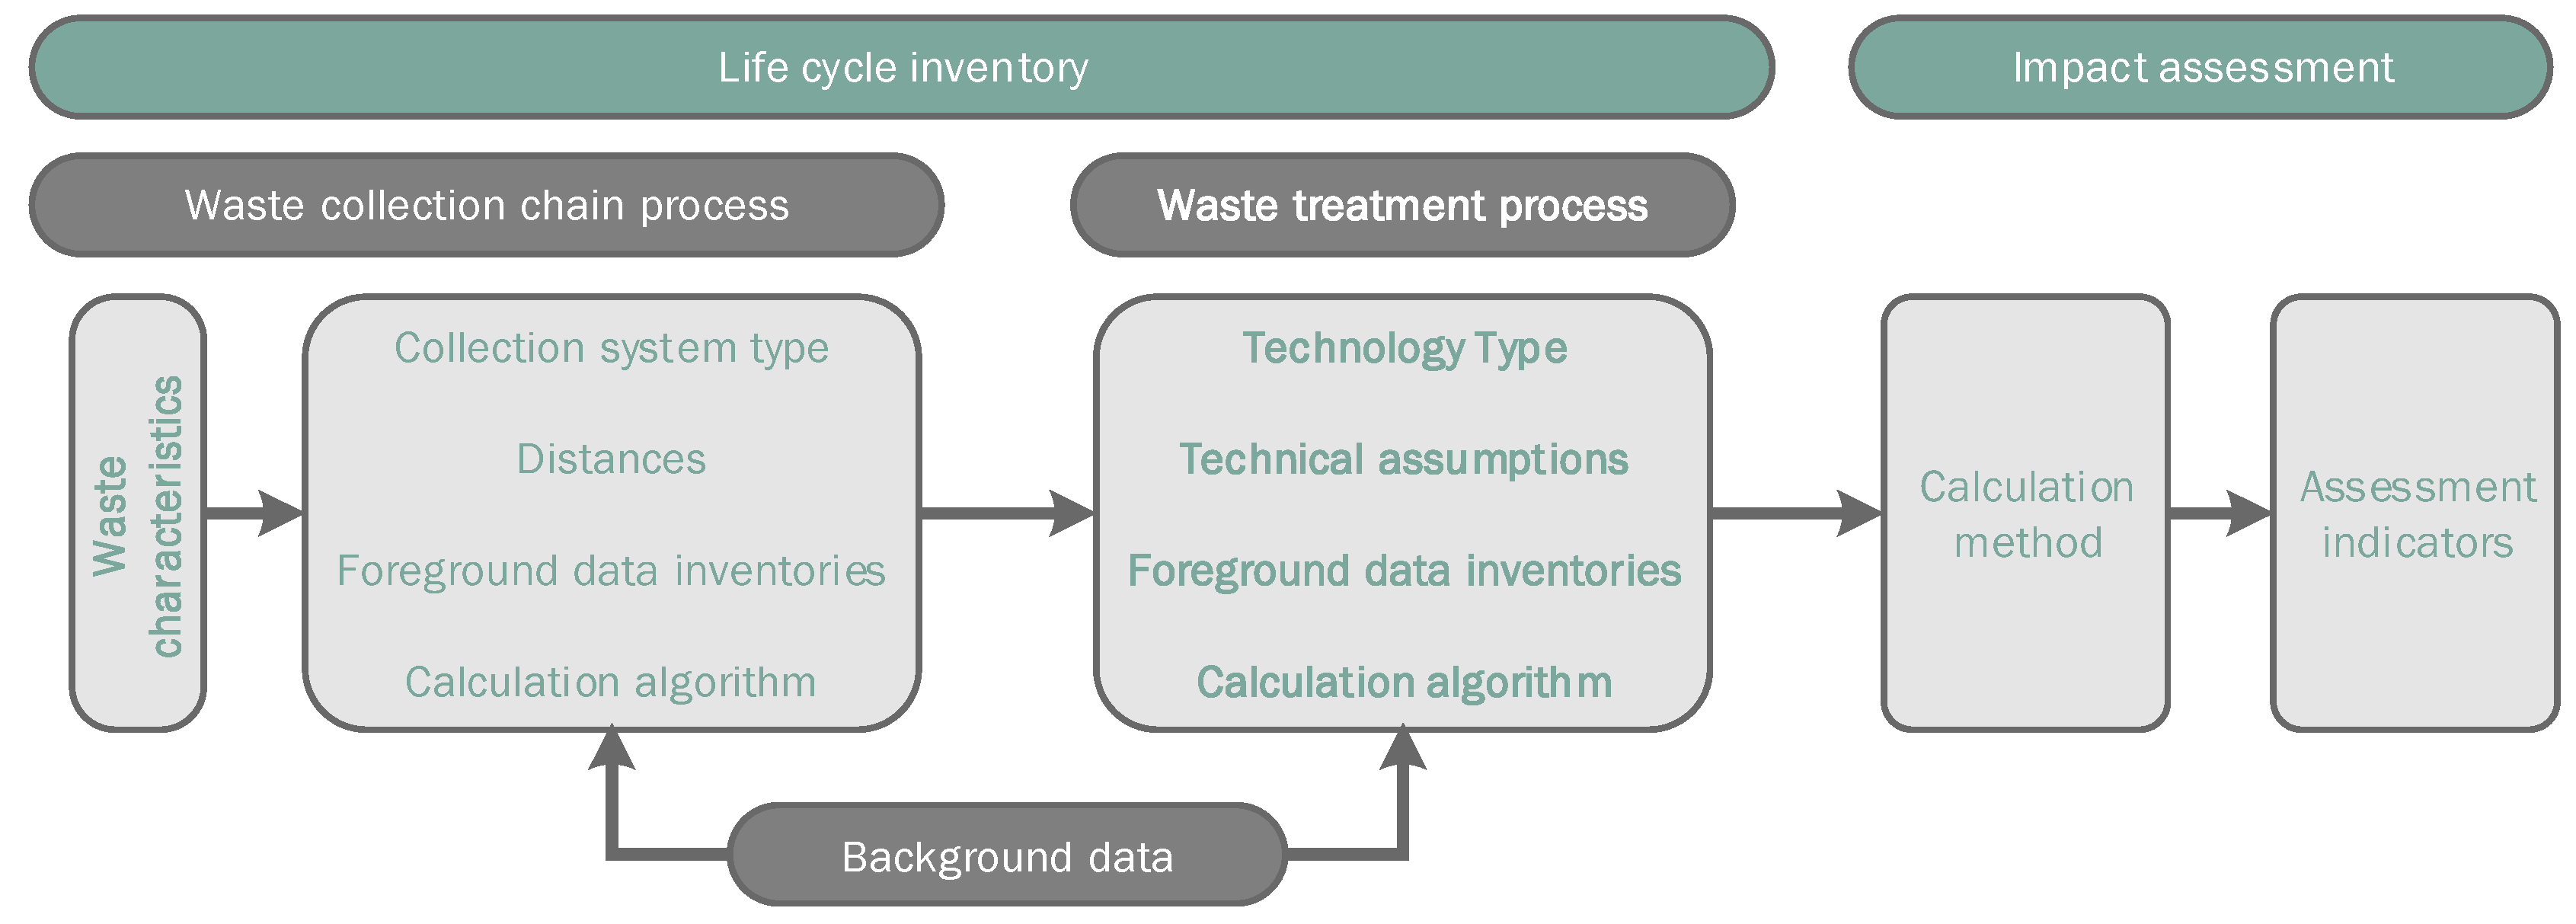
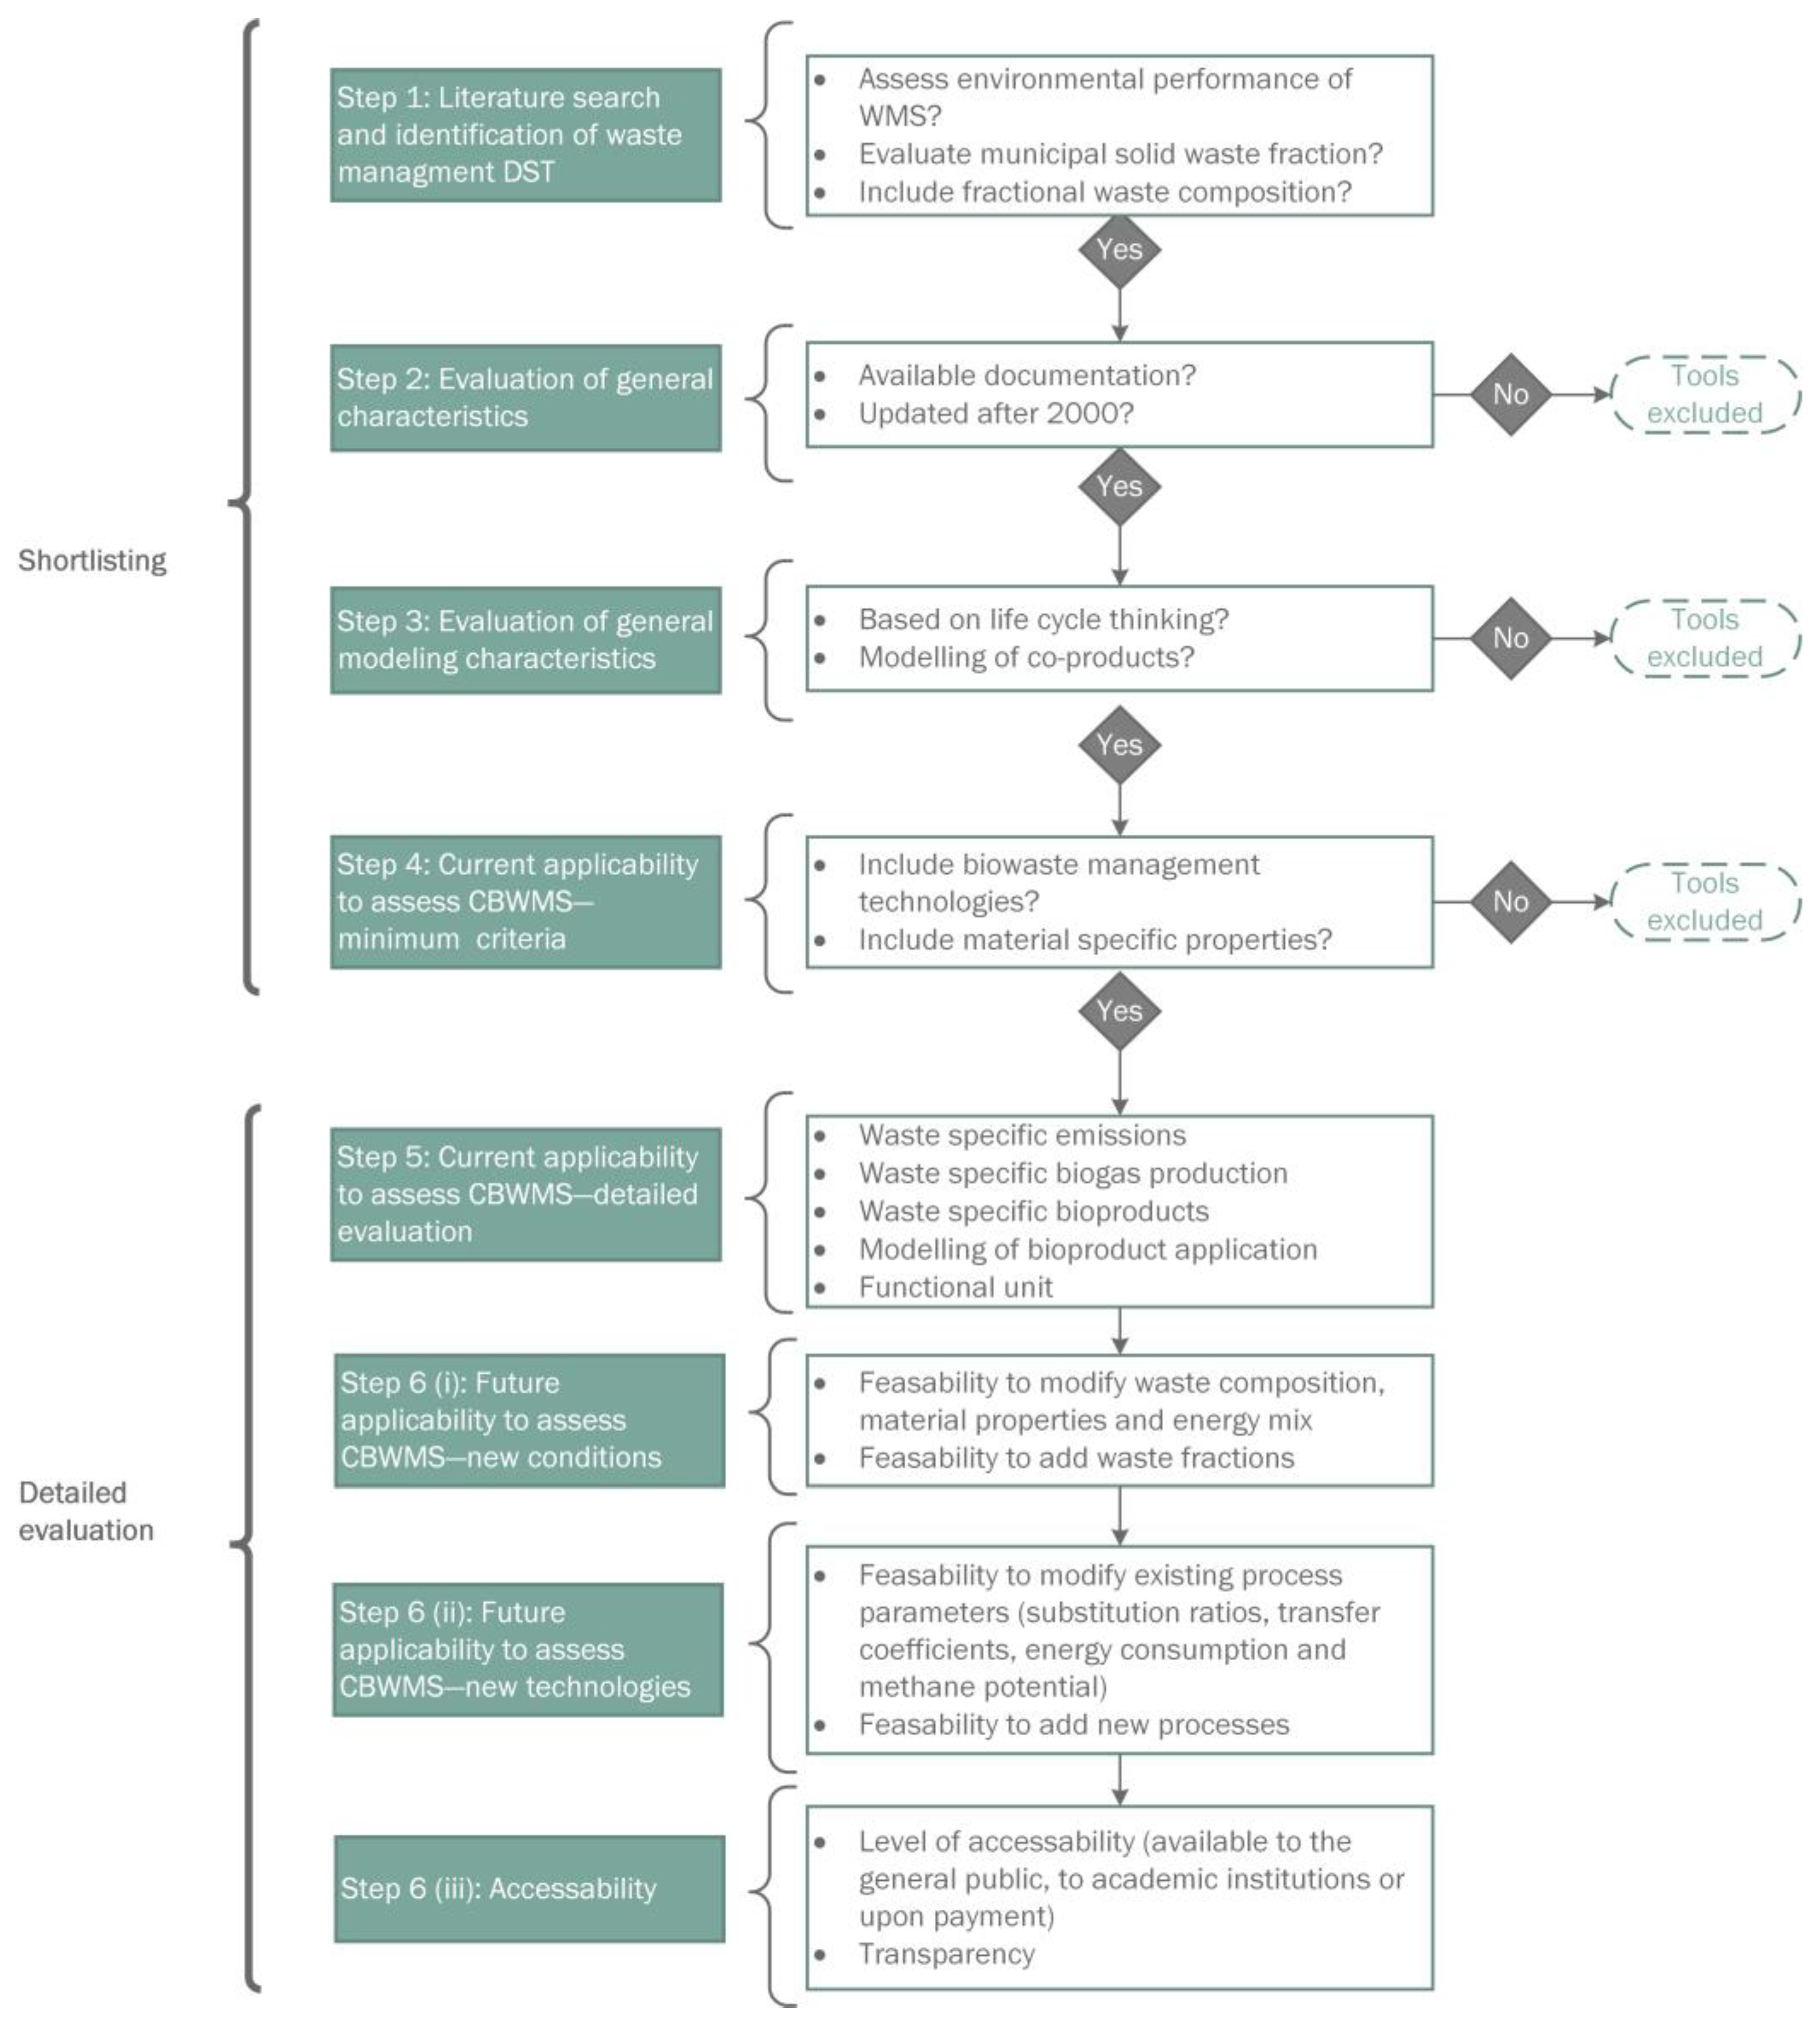
2.2. Review Methodology

The WMS-DST review methodology comprised six steps as visualized in Figure 2. Steps 1–4 refer to the shortlisting procedure (Table 1) and Steps 5 and 6 consist of a detailed evaluation of the shortlisted tools (Table 2). The evaluation and shortlisting of the tools was mainly based on tool documentation and publications of the tool version available during the elaboration of the present paper. Hence, future planned updates of the tools are excluded in the main body of the paper due to the lack of documentation to validate them. Future planned updates can be found in Table A1. For the evaluation in Steps 5 and 6, some information was retrieved directly from tool developers or inside the interface of the tool itself. The feasibility to access information to conduct this review was considered when assessing the transparency in Step 6.
In Step 1, tools were identified through the search engine Scopus and LIFE and Cordis project databases according to the first three criteria in Table 1 and Figure 2. Combinations of the keywords “decision support tool”, “waste”, “municipal solid waste”, “biowaste”, LCA” and “biomass” were applied. This review is limited to tools designed to assess the environmental sustainability of WMS. The identified tools should model as a minimum one impact assessment indicator quantifying environmental performance of municipal solid waste treatment technologies and be able to model reference flows with different waste compositions (per cent of, e.g., plastic, glass and biowaste). Tools designed for agricultural waste streams were excluded, since the focus of this paper is on municipal solid waste.
Table 1 lists the shortlisting parameters and criteria applied in each step of the methodology shown in Figure 2. In Step 2, tools were shortlisted based on the availability of documentation and the last updates. WMS-DSTs with no documentation available in English were excluded as well as the tools not updated after 2000. In Step 3, tools were shortlisted according to general life cycle modelling characteristics (i.e., assessment type and co-products modelling). The tools not based on life cycle approach, i.e., considering the whole chain of the WMS were excluded. Co-products generated must be considered, e.g., by substituting energy and primary resources.
In Step 4, tools were shortlisted based on: (1) type of biowaste treatment technologies included as default in the tools; and (2) material-specific properties. These two aspects are considered minimum criteria for existing WMS-DSTs to be supportive for assessing CBWMS. As a minimum, one biowaste treatment technology should be available in the default technology portfolio of the tool (i.e., current dataset available in the tool). Treatment technologies not particularly dedicated to biowaste such as landfilling, incineration and pyrolysis, were not mapped, as they are not considered as a part of CBWMS. Consequently, the treatment of refuse is not covered in this paper. Material-specific properties of the waste include chemical properties such as methane generation potential and elemental composition (e.g., %VS, %VFA %P, %N, and %Cd). This needs to be included to enable modelling of waste-specific features such as direct gaseous emission of, e.g., CO2 and CH4, occurring during composting.
A detailed analysis of the applicability to model CBWMSs was conducted in Step 5 (Table 2 and Figure 2). This involved an analysis of calculation algorithms and technology assumptions applied when modelling biowaste treatment, waste-specific features and bioproduct application. Waste-specific features relate to how waste composition and characteristics influence the performance of different waste treatment technologies, e.g., if the composition of output bioproduct depends on the composition of the input waste. Modelling of application of waste derived bioproducts (e.g., compost) on soil was evaluated according to whether the tools account for resource consumption, substitution, emissions occurring after application and how and if carbon sequestration is modelled. Lastly, in Step 5, it was assessed how the functional unit of the system is defined. In LCA, the functional unit describes the quantified performance of a product or a system [18].
The feasibility to simulate new conditions was analysed looking at how the tools allow modifying default parameters related to site-specific conditions (including waste composition, material properties and energy mix) and the possibility to import additional material fractions (Step 6 (i)). Such parameters must be adjustable to reflect various waste collection designs, associated variations in the feedstock quality, etc. In Step 6 (ii), the possibility for the user to increase the treatment technology portfolio to assess novel options, such as the biorefinery concepts, was considered by analysing whether the tools allow creating new processes and changing default parameters related to existing treatment processes. This includes substitution ratios, transfer coefficients, energy consumption and methane potential. In addition, the feasibility to directly import background processes from different databases (e.g., Ecoinvent, Eurostat, national energy statistics and waste statistics) was analysed.
Finally, the accessibility of the shortlisted tools (Step 6 (iii)) was analysed considering if the tool is currently available and the mode of access (e.g., as freeware). Transparency was evaluated as low, medium or high based on the available documentation including the tool specification (i.e., algorithm behind the tool). The level of transparency was classified as: “High” if all information needed to do a full evaluation was available in documents. The transparency was evaluated as “Medium” if information was partially retrieved in accessible documentation and partially by direct contact with developers. If complete tool specification is available, the transparency was classified as “Medium/high”. For tools with insufficient information to conduct the full evaluation, the transparency was classified as “Low”.

3. Results

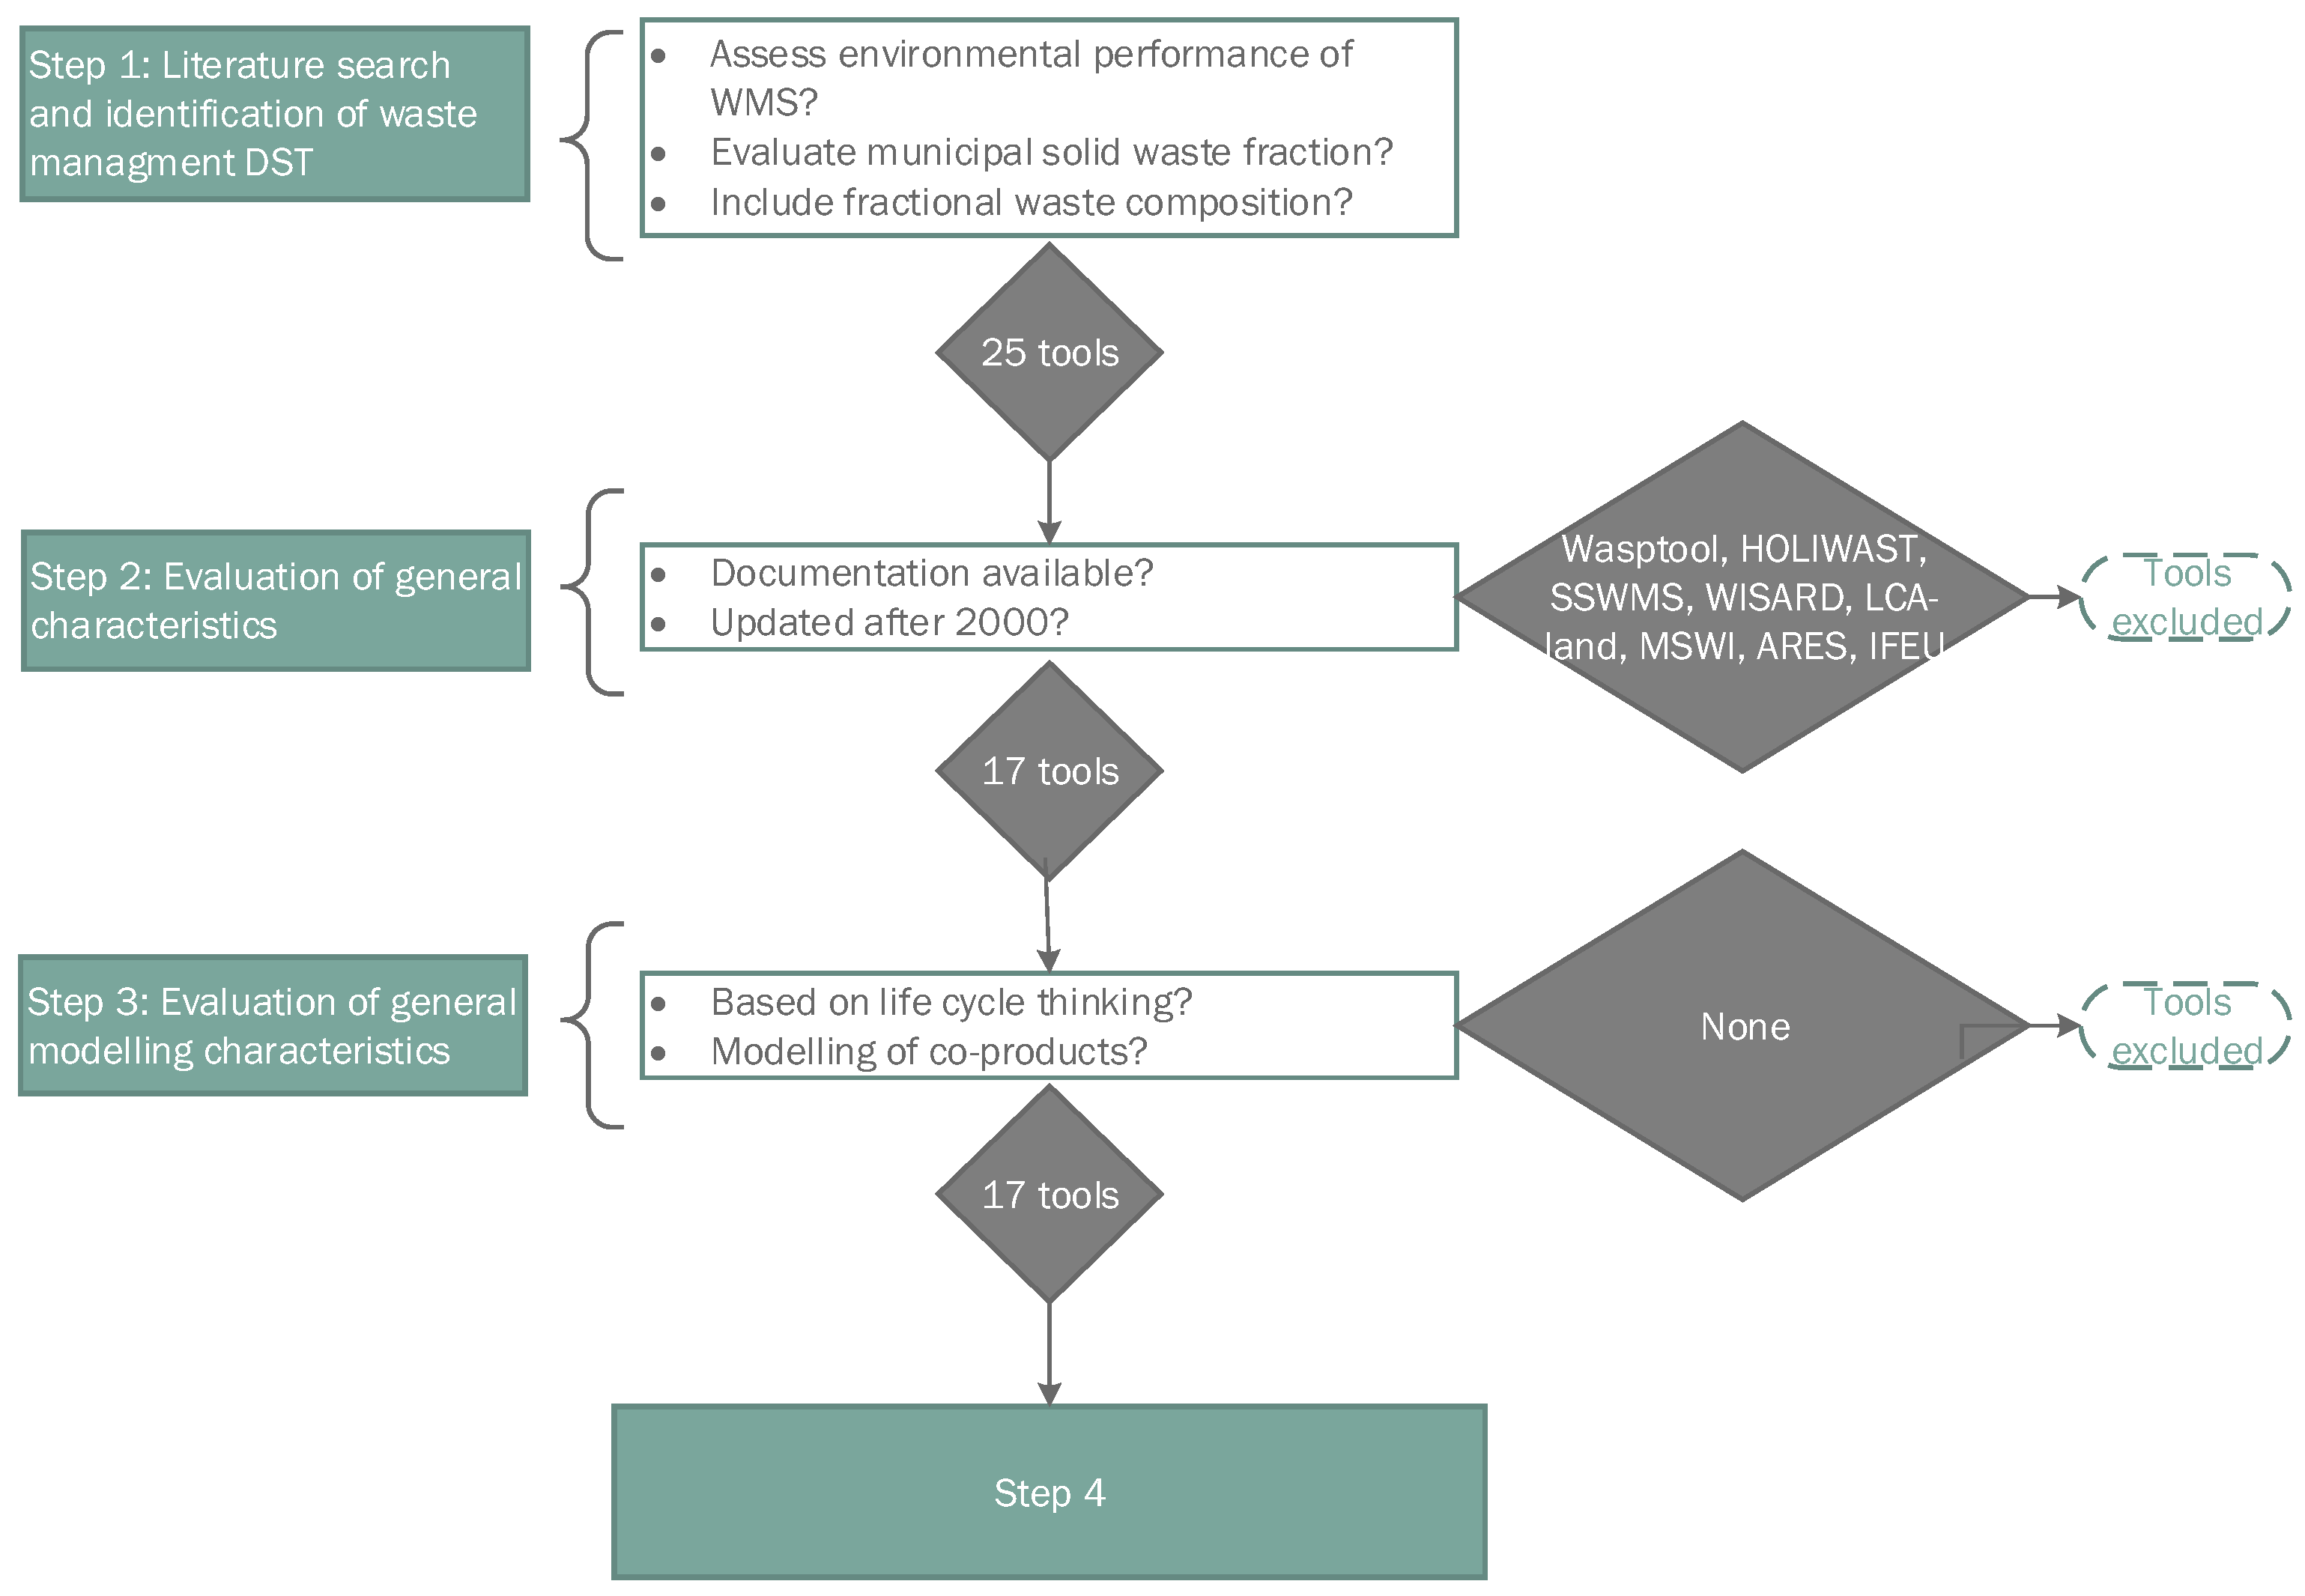
3.1. General Tool Characteristics and Modelling Assumptions (Steps 1–3)

Twenty-five WMS-DST assessing the environmental performance of treatment of municipal solid waste were identified and considered within the scope of this review (Step 1) (Figure 3).
Several DST tools were not included in the review because they focus on non-biowaste municipal solid waste fractions as AgroLCAmanager [20] that exclusively considers agricultural waste. General LCA tools such as Simapro, OpenLCA and Gabi were also excluded as they do not enable modelling of reference flows with different fractional composition (per cent of, e.g., plastic, glass and biowaste), unless the user creates “add-on” models [21]. These more generic LCA tools do not include biowaste characterization data and are often based on average reference flows with average emission data for a particular waste treatment technology, neglecting any effects from the waste composition [22]. Table A2 summarizes the identified tools describing (if available): (1) the reference for documentation; (2) the aim and concept; (3) tool type; (4) environmental impact indicators; (5) number of waste fractions; (6) year of last update; and (7) whether the documentation is available.
All identified tools evaluate the environmental performance of WMS as presented in the “aim and concept” column of Table A2. However, environmental indicators considered could not be identified for six tools. For the remaining nineteen tools, the environmental indicators covered range from carbon footprint only (CO2ZW waste management tool) and several environmental indicators applying standardized life cycle impact assessment (LCIA) methods such as CML (LCA-IWM, SIMUR and WRATE) to the option to choose between several LCIA methods and indicators (EASETECH). Table A2 reports the environmental indicators used in each tool. Eight tools also consider costs. Some tools have very detailed waste composition such as EASETECH (80 waste fractions and additional 43 energy fractions (i.e., energy crops such as wheat and straw)), WRATE (15 waste fractions and up to 52 sub-waste fractions), SWOLF (41 fractions) and MSW-DST (26 fractions). However, five of the reviewed tools include less than 10 fractions (IWM (EPIC/CSR), CO2ZW, IWM-PL, IWM2-UK and WASTED).
In Step 2, eight tools were excluded mainly due to poor or inaccessible documentation (HOLIWASTE, SSWMSS, WISARD, MSWI, ARES and IFEU) or not being updated after 2000 (LCA-LAND) (Figure 3). In the following, seventeen tools were analysed based on their general modelling characteristics (Step 3). The seventeen tools model co-products by substituting energy or primary resources (Table A3). All tools are based on life cycle thinking including an interconnected waste management system with activities from waste generation or collection to waste treatment processes and final disposal. There are differences in the starting point of the WMS chain. Indeed, some tools include waste generation while others start at the point of collection. For example, WARM considers generation by including source reduction factors and LCA-IWM starts with temporary storage prior collection. No tools were excluded in Step 3, hence seventeen tools were further analysed according to their current applicability to model CBWMS (Step 4) (Figure 3).

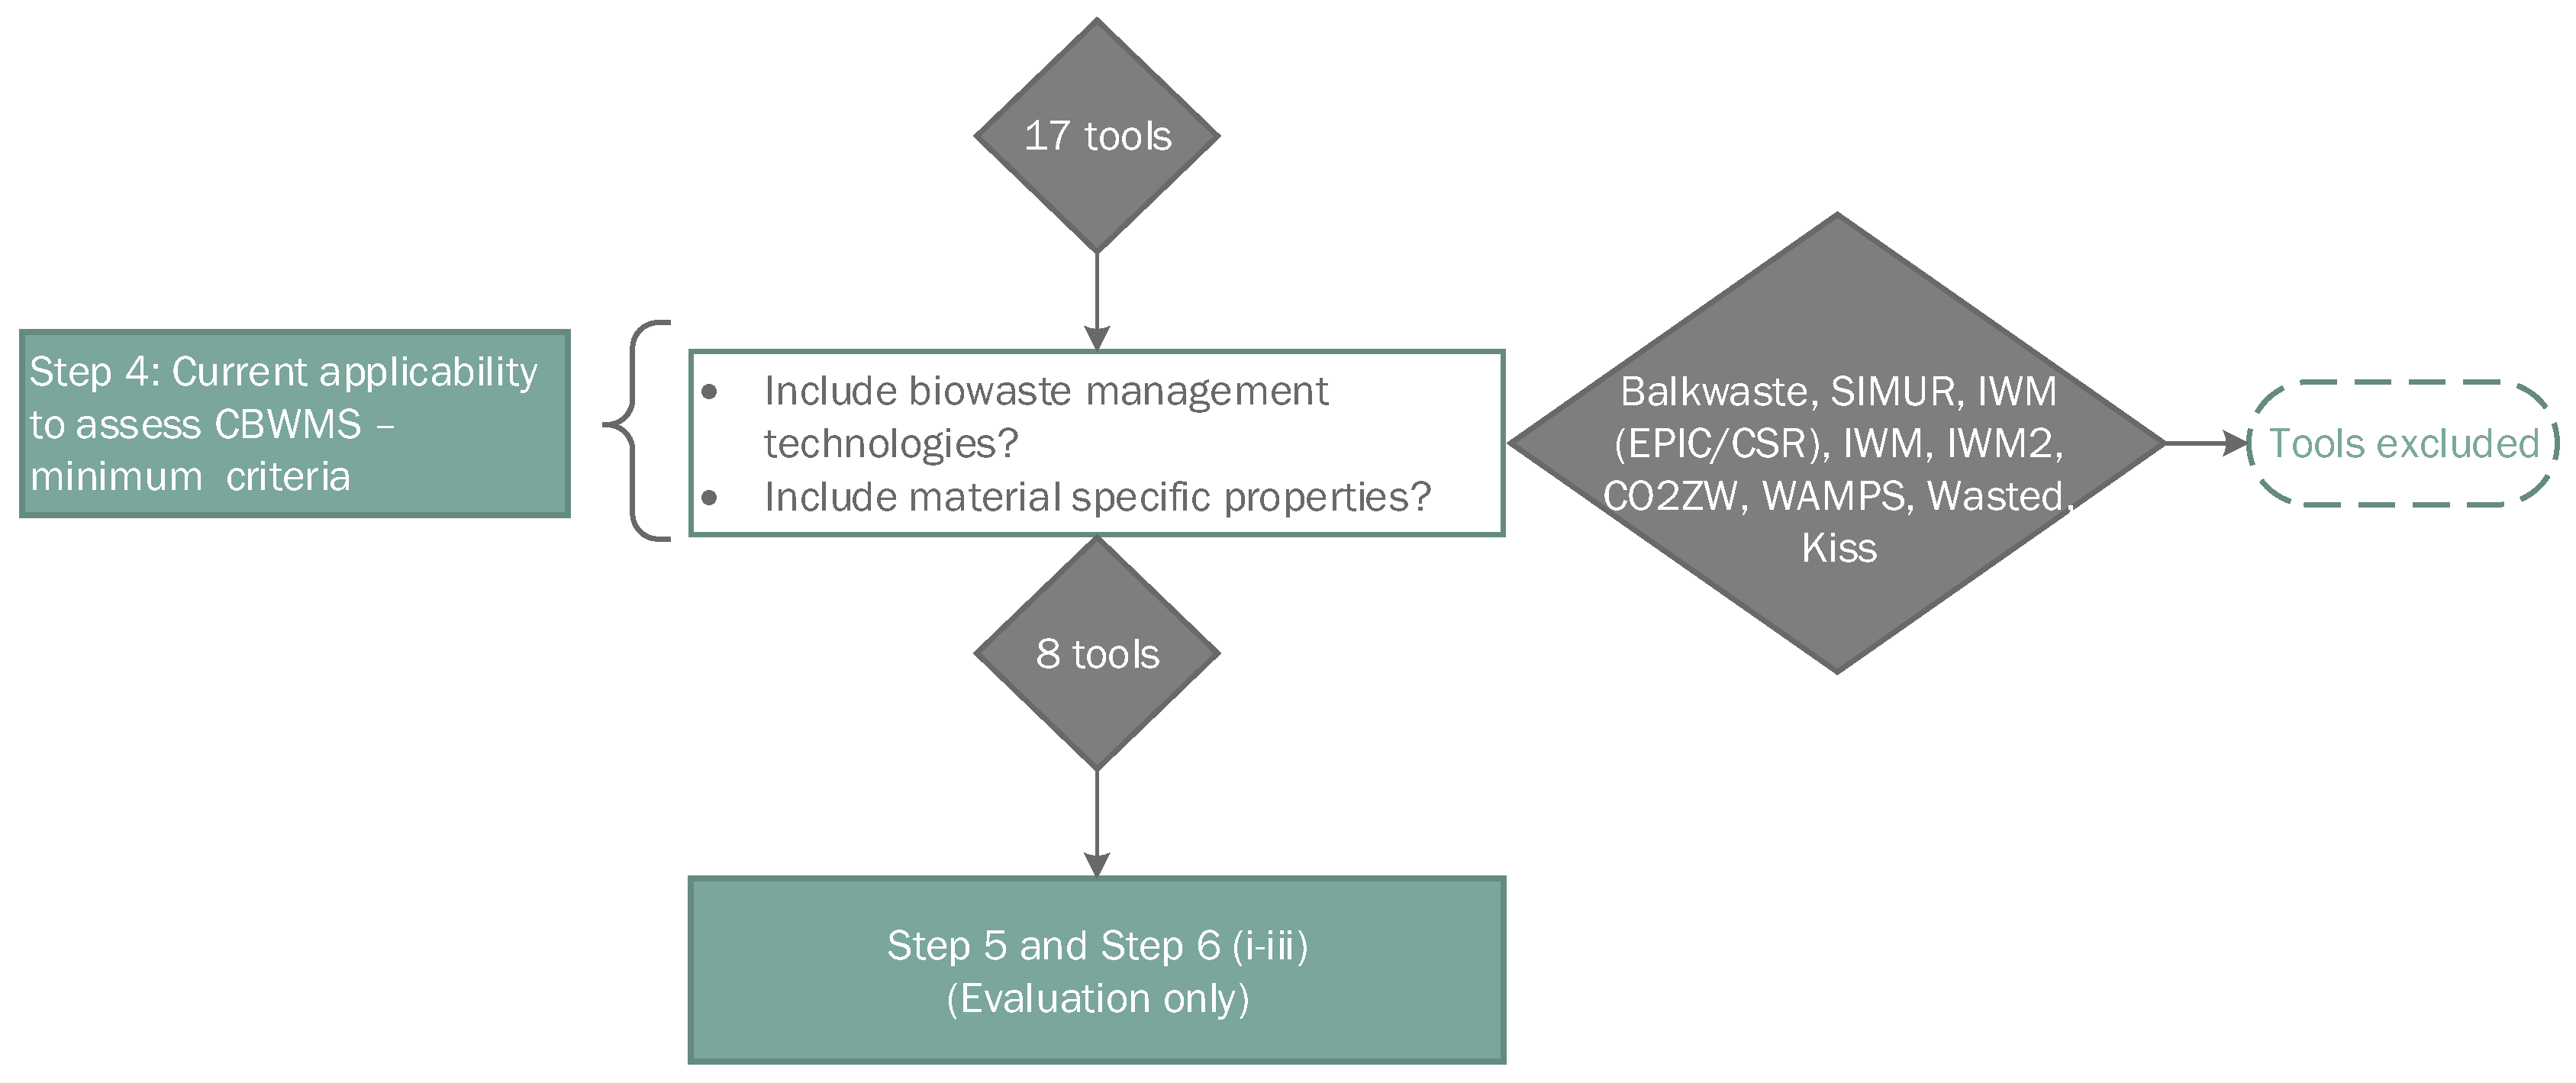
3.2. Minimum Criteria to Model CBWMS (Step 4)

Table 3 and the next subsections describe the outcomes of Step 4 mapping types of bioconversion technologies and to which extent material-specific properties are included.

3.2.1. Biowaste Treatment Technologies and Types

Most of the tools contain a generic anaerobic digestion (AD) process in their technology portfolio, except SIMUR, IWM-PL, MSW-DST and CO2ZW, that do not include any AD technology (Table 3). WRATE has the highest number of default AD technologies included (four), followed by WARM, IWM (EPIC/CSR) and IWM2, which all contain two default AD technologies. Balkwaste, EASETECH, SWOLF, LCA-IWM, ORWARE, WAMPS, WASTE, VMR and KISS all include one default AD technology (Table 3).
Fifteen of the seventeen tools consider composting while KISS and VMR exclusively include AD (Table 3). WRATE contains ten and EASETECH, SWOLF, MSW-DST, WAMPS and ORWARE four default composting technologies. IWM (EPIC/CSR) and Wasted include two and Balkwaste, SIMUR, WARM, IWM-PL, IWM2, LCA-IWM and CO2ZW one default composting technology (Table 3).

3.2.2. Material-Specific Properties

Table 3 shows to which extent material-specific properties (i.e., chemical properties and the elemental composition) are considered. Balkwaste, Simur, IWM, IWM2_UK, CO2ZW, Wasted and KISS do not include any material-specific properties while EASETECH, SWOLF, WARM, LCA-IWM, MSW-DST, WRATE, ORWARE and VMR have four or more material-specific properties included.
For example, EASETECH works with 53 physical properties and chemical elements characterizing each waste fraction and additionally 12 elements only characterized for biomass (e.g., sucrose and lignin content in sugar cane and soy meal). ORWARE works with a vector of 43 elements characterizing waste fractions including chemical composition (content of fat, proteins, cellulose, hemicellulose, lignin and rapidly degradable carbohydrates), elemental composition (e.g., N, P, C, Cd, Cu, and Zn), parameters of environmental relevance (e.g., NOx, SO2, HCl, PCB and dioxins) and process performance parameters (e.g., H2O, VS, and energy). In VMR, the waste composition is defined at three levels: (1) the waste or product flow (e.g., household waste or biogas); (2) the components including macro-impurities (e.g., content of glass and metal) and molecules (e.g., CH4 and CO2); and (3) the elemental composition (e.g., C, H, O, Al, and Fe).

3.2.3. Shortlisting (Step 4)

Nine tools were excluded as they did not include material-specific properties or the documentation available was insufficient to retrieve this information (for IWM-PL and WAMPS) (Table 3). Hence, eight tools (EASETECH, SWOLF, WARM, LCA-IWM, MSW-DST, ORWARE, WRATE and VMR) were shortlisted for a further evaluation in Steps 5 and 6 (Figure 4). Note that a screening of the parameters of Step 5 of the 17 tools of Step 4 is available in Table A4. However, a detailed evaluation was conducted for the shortlisted eight tools only (Section 3.3).

3.3. Detailed Evaluation of Current Applicability to Model CBWMS (Step 5)

The shortlisted tools apply waste properties to estimate up to four aspects: gaseous emissions, biogas generation, solid outputs and resource consumption. Table 4 provides an overview of whether waste-specific features are considered in the modelling of each of these aspects as well as whether the application of bio-based products is included in the tool.

3.3.1. Waste-Specific Gaseous Emissions

In seven tools (EASETECH, SWOLF, WARM_14, LCA-IWM, MSW-DST, ORWARE and WRATE), direct gaseous emissions during composting or curing of digestate are modelled considering the composition of the input waste (Table 5).
EASETECH, SWOLF, LCA-IWM and WRATE model gaseous emissions during aerobic digestion (composting or curing of digestate) in similar ways. They consider degradation of C- and N-containing matter for different waste fractions and apply emission factors describing the distribution of initial or degraded C and N- containing matter into different C- and N-containing gasses (Table 5). For example, in EAETECH, a dataset for a generic enclosed windrow composting facility (USA) is provided. In this dataset, degradation of organic carbon is proportional to volatile solids (VS) degradation, e.g., 74.56% for vegetable food waste and 26.23% for branches (garden waste). Degradation of N bound in the organic matter is the same for all fractions (65% as default). The type waste-specific direct emissions considered vary between the tools (Table 5). For example, SWOLF considers emissions of CO2, CH4, N2, NH3 and N2O and emissions of volatile organic compounds (VOCs) as a function of VS content (Table 5). WRATE include emission of CO2, CH4, NH3, N2O, and VOC and is the only tool including waste-specific chloride emissions. However, the direct VOC emissions are not waste-specific but depend on mass of total feedstock (i.e., kg VOCair/kg wastein).
WARM includes waste-specific emission factors for CH4 and N2O considering the different organic waste fractions present in the model (food waste, yard trimmings, grass, leaves, branches and mixed organics). For example, the emission factors for methane and nitrous oxide are 0.0055 tCO2-eq and 0.0396 tCO2-eq per ton wet weight food waste composted, respectively (Table 5). WARM currently assumes that the biogenic CO2 emissions occurring during composting are climate neutral and are therefore excluded. MSW-DST estimates CO2, NH3, and VOC emissions during composting and it is assumed that no CH4 is emitted during the composting process. Functions estimating emissions per dry ton of waste with various compositions can be seen in Equations (A1)–(A3) of Appendix B.
In ORWARE, emission of CO2 and CH4 is modelled considering different degrees of decomposition for what concerns the organic compounds contained in the input waste. For example, 30% of carbon in lignin, 90% in cellulose, 80% in sugars and 65% in proteins turns into CO2 gas and the remaining into humus. Considering that some anaerobic spots in the compost are present, methane emissions for composting is calculated as 0.35% of the CO2 produced. For proteins, emission of N-compounds (NH3, N2O and N2O) is also considered and is calculated based on Equation (1):
N loss   ( %   of   input ) = 0.55903     0.01108 × ( C / N )
The N—loss is distributed as displayed in Table 5. ORWARE also considers transfer of other compounds (VOC, CHX, AOX, Phenols, PCB and dioxins) for division into mature compost, gaseous emissions and degraded in the process (as per cent of input). For example, of the VOC present in the input waste, 1% goes to compost, 74% to gaseous emissions and 25% is degraded (refer to [25] for transfer coefficients for the other compounds). ORWARE is the only tool with waste-specific modelling of the degradation of such complex elements, while the other tools solely consider emissions per amount of treated waste.
SWOLF, EASETECH, LCA-IWM and ORWARE all include biofilters reducing the gaseous emissions. For example, in ORWARE the biofilter is modelled simulating the return of material captured by the filter into the compost (80% for N-NH3 and N-N2O and 50% CH4). The CH4 that is captured by the filter and stays in the compost is oxidized to CO2. Half of the N-containing compounds passing the biofilter are denitrified and pass the filter as N2 (i.e., 10% of the initial N-NH3 and N-N2O).

3.3.2. Waste-Specific Biogas Generation

The amount and composition of the generated biogas (CO2 and CH4) is waste-specific in six of the shortlisted tools (Table 6).
SWOLF, WARM and LCA-IWM model biogas conversion by considering the theoretical methane potential for specific biowaste fractions and yield coefficient (Table 6). In ORWARE, the biogas generated is proportional to the amount of degraded organic matter, which is modelled considering the degradation potential of the organic compounds contained in the waste (fat, carbohydrates, protein, etc.) and the retention time in the digester tank. For a continuous single stage mixed tank reactor in steady-state, the degradation ratio (D) is calculated according to Equation (2):
D = D 0 / ( 1 + 1 / ( k × R ) )
where D0 is the maximum degradation ratio, k is the first-order rate constant and R the hydraulic retention time (in days). The total gas production is further calculated from the quantity of organic compounds, the degradation ratio, and the proportion of methane in the biogas.
EASETECH includes a user-defined coefficient for biogas yield as a proportion of anaerobically degradable carbon specific for each waste fraction. Default values for biogas yield of 70% is given, but this value should be specified for each waste fraction. The user can apply theoretical ratios for CH4 in biogas (%) (default values for a thermophilic generic AD plant is, e.g., 83.72% for yard waste and 54.45% for vegetable food waste) or specify measured CH4 in biogas. The rest of the biogas consists of biogenic CO2. Partitioning of CO2 between gas and liquid phase is also accounted for (default 2.906% to the liquid phase) to keep track of the total biogas produced. There is a user-defined leaking coefficient (default 2%) representing leaks from pipes, valves, etc.
In WRATE, the amount of biogas-based electricity produced is linearly correlated to the quantity of biogenic carbon in the waste and it is not possible to see the quantity of methane produced. The basis for biogas modelling in VMR is microbiological reactions for anaerobic digestion considering the VS, the non-hydrolysable fraction of VS, the hydrolysis constant and the retention time. The hydrolysis constant is calculated considering the diameter and particle density of the biowaste feedstock (depending on pre-treatment). Finally, the biogas flow and composition are estimated assuming a complete reaction of the hydrolysable fraction involving C, H, N and S elements in the biowaste. Constant parameters for each biowaste fraction and equations are available in the documentation presented by Tanguay et al. [26].
The tools apply similar approaches when modelling combustion of biogas for energy production. As default in EASETECH, biogas can be combusted in a stationary engine producing both heat and electricity where 51% of the energy in methane is transferred to heat, 39% to electricity and 10% lost. In SWOLF, the collected biogas is either flared or combusted for energy recovery in a gas turbine or internal combustion engine. EASETECH and SWOLF include default technology-specific emission factors considering the amount of methane gas combusted (e.g., 3.93 kg biogenic CO2/m3 CH4 combusted in SWOLF) (Table 7). In WARM, methane yield is combined with energy or electricity conversion factors for each waste fraction (e.g., 201.4 kWh/ton food waste and 69.6 kWh/ton yard trimmings). In ORWARE, a range of alternatives for biogas conversion is available either in gas engines or by upgrading to vehicle fuel. The energy produced using biogas in a stationary engine is calculated considering the energy content in the methane gas and the resulting heat and electricity conversion efficiency (60% and 30%, respectively, and 10% loss). In LCA-IWM, the energy generated is linked to the amount and quality of the biogas, while air emissions are only related to type of technology not considering characteristics of the treated waste. The type of air emissions considered is not available.

3.3.3. Waste-Specific Bioproducts

Six tools (EASETECH, SWOLF, WARM, LCA-IWM, ORWARE and VMR) apply mass balance principles based on transfer coefficients to model the distribution of elements or input waste fractions between air emissions and solid output (i.e., compost and digestate) (Table 7). For example, in EASETECH, the non-degraded dry matter from each input waste fraction is distributed between solid output fractions (e.g., compost and rejects) according to user defined transfer coefficients. Default transfer coefficients are available. For example, 95% of the non-degraded dry matter of vegetable food waste goes to compost while 5% goes with the reject, and if present in the feedstock to composting, 85% rubber goes to compost and 15% to landfill [24]. The degraded dry matter is emitted to air as described in Section 3.3.1.
In SWOLF, ORWARE and LCA-IWM, transfer coefficient per element is applied. For example, in the composting process of ORWARE, the major part of N remaining in the compost after decomposition (Section 3.3.1) is organically bound in humid substances produced during composting. The rest is present in the final compost either as inorganic plant available NH4+ (1% of the total N remaining) and NO3 (6% of the total N remaining). In VMR, the non-hydrolysable fraction and fractions not involving C, H, N and S elements (e.g., heavy metals), which are not transformed to biogas, will remain in the digestate. EASETECH, LCA-IWM, ORWARE and VMR are the only tools including distribution of heavy metals contained in the waste based on the same assumption that all heavy metals present in the waste are unchanged and distributed to the solid outputs.
The bioproduct composition is not waste-specific in MSW-DST or WRATE. However, MSW-DST includes screening efficiency ratios for different waste fractions to estimate the amount and composition of the rejected materials. They also include dry matter reduction as a function of biowaste-specific CO2 emissions to determine the fraction of raw solid waste that will end up as finished compost. The moisture content and densities were also used in these calculations. Hence, it would be possible to estimate the fractional composition of the final compost, but this is not a standard function in the current interface of the tool. In WRATE, the composition of the material outputs (compost or digestate) is predefined (not waste-specific) where four grades of biotreated materials can be selected. However, the moisture content and calorific value depend on the characteristics of the input waste.

3.3.4. Waste-Specific Resource Consumption

Five tools include some features estimating resource consumption considering feedstock specific characteristics (EASETECH, SWOLF, MSW-DST, ORWARE and VMR) (Table 7). In EASETECH, the default resource consumptions are set on mass. However, it is possible for the user to implement resource consumptions related to the waste-specific features. In SWOLF, different materials will have different transfer coefficients and energy and emissions are allocated appropriately. For example, in the AD model, most of the branches remain in the overs, and therefore skip the reactor and go directly to aerobic curing piles. Hence, the electricity use for post-composting screening depends on how much the mass of each material was reduced during composting. Resource consumptions in MSW-DST are mostly independent of the waste quality. However, there are some waste-specific consumptions such as the power required for the hammer mill, which depends on whether the waste is pre-sorted. ORWARE also includes some waste-specific resource consumptions e.g., electricity consumed in an AD plant is approximately 5% of the energy in the produced biogas. VMR proposes a methodology to model the energy consumptions based on different operating settings and properties of the waste. For example, the efficiency of the trommel is based on the particle size of the waste and energy consumption during pre-treatment (shredding, classifying and recycling) is determined as a function of mass flow and moisture content of the waste.

3.3.5. Bioproduct Use

Six of the eight shortlisted tools include land-application modelling of treated biowaste, considering substitution of commercial fertilizer, emissions after application, carbon sequestration or resource consumption (Table 8).
Substitution of commercial fertilizers is generally modelled based on utilization ratios describing crop-uptake of nutrients in biowaste-derived fertilizers compared to commercial fertilizers considering the accumulated effect over time. In EASETECH, two types of utilization rates can be considered: one is based on simulations from the Daisy model (agro-ecosystem model) based on local soil conditions, and the other is based on legislations. For example, in Danish regulations for nutrients in organic fertilizers, the substitution ratio for N is 40% for anaerobically digested and 20% for composted municipal solid waste. For P and K, the rate is set to 100% as default. SWOLF and WARM apply the same substitution factor for N fertilizer (40%), but unlike EASETECH, SWOLF do not distinguish between compost derived from anaerobic or aerobic digestion and WARM does not account for substitution of compost derived after aerobic digestion at all. SWOLF also considers substitution of peat (applying a 1:1 substitution ratio). ORWARE uses P, K and mineral N substitution factor of 100%. For organic N, 30% utilization is assumed during the first year after application and 30% is utilized in the following years in addition to the nitrogen pool in the soil. The nitrogen pool is the difference between nitrogen input, plant uptake and losses during the first year. In WRATE, commercial mineral fertilizer is substituted 100% by the waste-derived compost. LCA-IWM considers full substitution of commercial fertilizers (N, P2O5 and K2O).
Emissions after application of compost or digestate are included in the tools to varying degrees (Table 8). As default option in EASETECH, the user can apply fate factors for C and N simulated by the Daisy model based on input of substances and avoided NPK substances. For example, nitrate loss to ground- and surface water, and as N2O, NH3 and N2 to air, is defined as a fraction of the nitrogen present in the treated biowaste and depends on the soil type (33%, 2.47%, 7.5% and 4.32%, respectively). Similarly, a fraction of input C is emitted as CO2 and CH4 and input P as PO3. Ammonium ions transferred to surface water are also accounted for. SWOLF only considers emissions of nitrogen to air and water (as NH3, N2O, and NO3) and WARM includes details on N2O and CH4 emissions. ORWARE models the additional emissions resulting from use of organic nitrogen instead of mineral nitrogen based on a detailed land-use model considering local conditions. N2 is calculated as a fraction of N lost though leachate, e.g., 30% for application on sandy loam under moderate drainage conditions and emissions of N2O are 1.25% of the fertilizer-N added. NH3 emissions are quantified as a fraction of ammonia-N in the compost and vary between 0.03 and 0.5 (typical value around 0.10) for Swedish conditions (according to the time of spreading, spreading technique and dry matter content of the waste). In WRATE and MSW-DST, the composition of the output products is not waste-specific. Hence, in WRATE, the emissions to groundwater (N, P, K, Cl, and heavy metals) and air (CO2) only depend on type of compost substituted. In MSW-DST, the emissions from 22 compounds are included and expressed per ton produced compost. The specific emission factors adopted are reported in [27]. LCA-IWM does not include emissions after application of compost or digestate. Only EASETECH, MSW-DST, ORWARE and WRATE consider emissions of heavy metals present in the compost and digestate to the soil compartment.
Carbon storage in soil is modelled in four of the shortlisted tools (EASETECH, SWOLF, ORWARE and WRATE) (Table 8). Ratios and the soil storage of C are estimated based on Daisy and local soil conditions in EASETECH. For example, in the case of application of anaerobically digested municipal biowaste on sandy loam soil with average DK Crop rotation, the C stored in soil is 13.2% of the applied C in a 100-year time horizon. SWOLF and WARM consider both direct storage and storage due to hummus formation (e.g., 0.10 kg C per kg C present in the applied compost and 0.19 kg C stored per kg C input in SWOLF). In WARM, data compiled in the soil application simulation model “Century” is used, e.g., 0.08 ton CO2, eq/ton food waste and 0.22 ton CO2, eq/ton mixed organics digested in a dry digester with no curing of digestate. Different ratios are provided for digestate with and without curing and for wet and dry AD. In WRATE, it is assumed that 2% of the carbon applied stays in the soil and in ORWARE a default value for storage is set to 9% for organic carbon from AD and 15% for organic carbon from composting. Four tools model the resources consumed during compost or digestate application on soil (EASETECH, SWOLF, WARM and ORWARE). For example, ORWARE applies a rate for energy used in MJ/ha specified for three types of spreaders.

3.3.6. Functional Unit

In all eight shortlisted tools, the functional unit can be classified as generation-based, i.e., an amount of waste generated in a specific study area for a specific period of time, accounting for the local characteristics of the generated waste (Table A3). However, the definition of the functional units is case-specific and the results derived from the tools can be adjusted to fit the functional unit defined in a specific study. For example, a generation-based functional unit can be converted to a unitary one if starting the assessment after the collection part, i.e., by looking at only the technology and not the entire WMS. In EASETECH, the functional unit can also be adjusted to be output-based (e.g., production of 1 m3 biogas from biowaste).

3.4. Future Applicability to Assess CBWMS (Step 6)

3.4.1. Feasibility to Analyse New Conditions (Step 6 (i))

EASETECH, SWOLF, MSW-DST, ORWARE and VMR allow changing default parameters including waste composition, material properties and energy mix and importing additional waste fractions (Table 9). This renders the tools flexible to represent local conditions other than those represented by the default data. WARM and WRATE display less flexibility as they do not allow modifying the material properties or adding additional waste fractions.

3.4.2. Feasibility to Modify and Create Processes (Step 6 (ii))

In four of the eight shortlisted tools (EASETECH, SWOLF, ORWARE and VMR), it is possible to modify and create new processes (Table 10). For example, the default AD plant in SWOLF (a single-stage, wet, mesophilic digester) can be altered and various combinations of dry, two-stage, and thermophilic digesters can be modelled by changing input parameters. EASETECH also includes empty processes templates that can be used as a basis for creating new processes. As such, emerging biowaste refinery technologies could be modelled in these tools. Direct import of background data is only possible in EASETECH and WRATE V4.

3.4.3. Accessibility and Transparency (Step 6 (iii))

Six of the shortlisted tools are currently available while two tools (LCA-IWM and VMR) are not (Table 11). LCA-IWM is no longer in use and VMR is under development and still not released. However, when the latter will be released, the background code will be open source. WARM and MSW-DST are freeware while SWOLF can be obtained upon request. Similarly, the academic version of WRATE is free of charge for education purposes. EASETECH is free of charge for academic use; however, the attendance to an EASETECH course is required.
None of the shortlisted tools were considered to have a high transparency (Table 5) as all information needed for a full evaluation of Steps 1–6 was not possible to retrieve in publicly available material. Three of the shortlisted tools (EASETECH, ORWARE and VMR) were evaluated as displaying medium transparency as the full evaluation was achieved though available documentation or personal communication with developers. This also applies for SWOLF, WARM and MSW-DST. However, these three tools also have a complete tool specification and were classified to have a medium/high transparency. LCA-IWM and WRATE were considered to have low transparency, as it was not possible to achieve complete evaluation. Details related to the transparency evaluation can be found in Table A5.

4. Discussion

4.1. Modelling of Elements Crucial for the Assessment of CBWMS—Waste-Specific Features

All shortlisted tools model the composition of the biowaste-based bioproduct considering the composition of the input waste except MSW-DST and WRATE and four tools consider waste-specific content of heavy metals in the final products (EASETECH, LCA-IWM, ORWARE and VMR). Application of the bio-treated material on soil is modelled in detail in some DSTs (EASETECH, SWOLF, WARM, ORWARE and WRATE) while some only include substitution of mineral fertilisers (LCA-IWM) and other exclusively includes emissions to surface water (MSW-DST). Only EASETECH and ORWARE consider both waste-specific heavy metal content in compost and the consequences it has when applied on soil.
These waste specific features are crucial for the tools to be applicable for the evaluation of CBWMS and for elaboration of legislations for the circular bioeconomy field. For example, modelling waste-specific content of micro-pollutants such as heavy metals in waste-derived compost is important to avoid accumulation in soil that can cause externalities in terms of adverse health impacts [6]. An average increase in zinc concentration of >45% from 1998 to 2014 is observed due to application of pig manure in Danish agricultural soils [29]. This will reach critical levels if no measures are implemented [29,30]. To avoid similar long-term challenges for CBWMS, it is crucial to design future DSTs capable of supporting a safe application of waste-derived compost. They must be able to compute waste-specific compost composition including micro-pollutants and include differential use of compost depending on various compost qualities and options for upgrading the quality of the compost by reducing heavy metal content (e.g., [31,32]).

4.2. Flexibility to Model New Emerging Technologies

Five of the eight shortlisted tools (EASETECH, SWOLF, MSW-DST, ORWARE and VMR) allow changing default parameters, rendering these tools flexible to represent site-specific conditions others than those represented by the default data. It is possible to modify and create new processes in four of the shortlisted tools (EASETECH, SWOLF, ORWARE and VMR). Direct import of background data is only possible in EASETECH and WRATE V4.
The flexibility for the tools to model new conditions and processes is highly important in order to consider the new technologies and associated products involved in the emerging biorefinery field such as bioplastics and enzymes. Hence, the feasibility to modify co-product substitution factors and import of new background processes data are crucial to model substitution of new bioproducts developed in biowaste refineries.

4.3. Further Developments to Improve the Assessment of CBWMS

Six of the eight shortlisted tools (EASETECH, SWOLF, WARM, LCA-IWM, ORWARE and VMR) include waste-specific modelling of gaseous emissions, biogas generation and bioproduct composition or use of bioproducts, which are key properties that are necessary for assessing CBWMS. However, certain features should be further developed to achieve a complete assessment of CBWMS. Specifically, the waste-specific composition of bioproduct should include micro-pollutants (such as in EASETECH and ORWARE) and not be limited to nutrients. Moreover, features similar to the modelling principles in VMR, should be developed. Here, calculation of complex chemical and physical interaction of each step of the waste treatment technology allows for estimation of emissions and resource consumptions rather than redesigning these interactions for each case study. This flexible modelling approach would render it possible to assess the sustainability of new process set-ups and technologies. Likewise, it would enable the tools to assess emerging technologies in the design phase responding to the newest technological developments within the bioeconomy sector and test new operational settings prior to invest and implement new technologies.
Most of the tools consider substitution of mineral fertilizers by applying waste-derived compost on soil. However, data on unquantified benefits of compost such as reducing the need for harmful or toxic pesticides and fungicides should also be implemented in the tools. For example, the use of compost may substitute or reduce the need for soil fumigation with methyl bromide (an ozone-depleting substance) to kill plant pests and pathogen. However, research is needed to analyse and quantify these benefits to include them in the LCIA part of the tools [33]. This requires the tools to be flexible to include data quantifying such benefits, i.e., to accommodate future developments in the LCIA methods.

5. Conclusions

This study identified and analysed 25 existing WMS-DSTs. In a comprehensive shortlisting procedure, eight tools were excluded due to lacking documentation and nine tools were excluded, since they did not include any material-specific property. Eight tools were shortlisted and analysed in detail in light of their potential applicability to model the environmental performance of CBWMS (EASETECH, SWOLF, WARM, LCA-IWM, MSW-DST, ORWARE, WRATE and VMR). It was found that the modelling approach and flexibility vary between the tools, influencing their suitability for assessing CBWMS.
Based on the findings in this study, it is recommended to use EASETECH, SWOLF, ORWARE or VMR (when available) when aiming to assess the sustainability of CBWMS. These tools are able to model waste-specific features, which are crucial for a proper assessment of CBWMS. Moreover, these tools: (1) are available or under development at the time of carrying out the present study (LCA-IWM is not); (2) allow modifying material properties or import additional waste fractions (WARM and WRATE do not); and (3) include AD process or can create one (MSW-DSTs does not include it and does not allow to create a new process). However, note that only EASETECH and ORWARE consider impacts when applying the waste-derived compost on soil. Hence, an external assessment of this should be conducted if selecting SWOLF or VMR.
A novel analysis of existing WMS-DSTs in the light of circular economy is provided in this study. Of twenty-five identified WMS-DSTs, only four tools are considered applicable for the environmental sustainability assessment of CBWMS. To further increase the understanding of how to improve the sustainability assessment of CBWMS and improve WMS-DSTs for this purpose, the performance of selected WMS-DSTs should be evaluated by applying them on a case study.

Author Contributions

Conceptualization, E.B.V., V.M.-S. and M.T.; Methodology, E.B.V.; Investigation, E.B.V.; Data curation, E.B.V.; Writing—Original Draft Preparation, E.B.V.; Writing—Review and Editing, E.B.V., M.T. and V.M.-S.; Visualization, E.B.V.; Supervision, M.T., V.M.-S.; and Funding Acquisition, M.T.

Funding

This project received funding from the European Union’s Horizon 2020 research and innovation program under grant agreement No 689229.

Acknowledgments

Efforts have been taken to ensure factual accuracy for the description of the shortlisted tools by consulting the developers of the tools. The authors are grateful to the developers that responded to our requests and provided valuable answers and feedback: A. Damgaard and A. Boldrin (EASETECH), J. Levis (SWOLF), K. Weitz (MSW-DST), O. Eriksson (ORWARE) and F. Tanguay-Rioux (VMR).

Conflicts of Interest

The authors declare no conflict of interest. The founding sponsors had no role in the design of the study; in the collection, analyses, or interpretation of data; in the writing of the manuscript, and in the decision to publish the results.

Appendix A

Table A1. Future planned updates of the eight shortlisted tools.
ToolsFuture planned updates
EASETECHA complex structure calculating chemical and physical interaction of each step of the waste treatment technology is under development. This will allow for estimation of emissions and resource consumptions at each step rather than redesigning these interactions for each case study
SWOLFNo known updates
WARM_v14No known updates
LCA-IWMNo known updates
MSW-DSTStep 4: Note that the forthcoming (end of 2018/early 2019) next version of the MSW-DST will include AD as well. It will use the same process models as SWOLF.
Step 6: Adding new processes and direct import of background process (will be possible in future version of the tool)
Next generation of the MSW-DST is currently under development with the US EPA and a test version is expected to be completed end of 2018/early 2019. The next generation MSW-DST is a version of SWOLF. It is expected that adding new processes and direct import of background process will be possible in future version of the tool.
ORWAREA second AD process is under development (Solid State Anaerobic Digestion)
WRATENo known updates
VMRCurrently at its early stage of development. A future version will be combined with a LCA module and it will be possible to change energy mix
Table A2. Identified WMS-DST for assessing environmental sustainability of municipal solid waste.
NameReferenceAim and ConceptTool TypeEnvironmental Impact IndicatorNumber of Waste FractionsLast UpdateDocumentation?
Balkwaste[34] Aims to support the decision maker throughout the various steps of municipal solid waste management planningStand aloneGreenhouse gas effect, emission to air, conventional fuel savings, water consumption, hazardous waste132011Yes
Wasptool[35]Examines and evaluates the effectiveness of possible waste prevention strategiesWeb-toolGenerated waste, waste reduction, diversion from landfill112017No
HOLIWAST[36]Comparisons of up to five stakeholder views or waste management policies. Data only available for “best available technologies” and user cannot modify the technology data. Web-toolNANA2007No
SIMUR [37]Models different waste collection and treatment options and evaluated the environmental impacts of different scenarios Stand aloneLCIA impact methodology—CML Version 3, august 2007 *162011 Yes
EASETECH[21,38,39]Comprehensive waste LCA and LCC tool developed at the Technical University of DenmarkStand alone on WindowsThe user can choose various LCIA methods e.g., ILCD *802018Yes
SWOLF[40,41]
AD and composting: [42,43]
Optimizable dynamic life-cycle assessment framework considering future changes in policy requirements, waste composition and energy system. Stand aloneLandfill diversion, and GHG emissions *(41)2014Yes
WARM_v14[34,44,45]Created by the U.S. EPA to help solid waste planners and organizations estimate GHG emission from different waste management practices. Stand aloneGHG emissions and energy reduction542016Yes
IWM (EPIC/CSR)[46]Aims to evaluate the environmental and economic performance of the various elements of their existing or proposed waste management systemsStand aloneGlobal warming, acidification, urban smog, health risks water quality impairment and land use disruption *82004Yes
IWM - PL[47,48]LCA and cost analysis quantifying potential environmental impacts and economic aspects of municipal waste management systemsNAEcopoints62011Yes
IWM2, UK[49] User-friendly model for waste managers Stand aloneFuels, Final Solid Waste, Air Emissions (GWP) and Water Emissions *92001Yes
LCA-IWM[50]Supports the decision making in the planning of urban waste management systems by allowing comparison of different scenarios. Stand alone LCIA method CML 2001102006Yes
MSW-DST[27,51]Aims to calculate life-cycle environmental trade-offs and full costs of different waste management or materials recovery programs.Stand aloneEnergy consumption, and emissions for 32 pollutants *262012Yes
ORWARE[23,52], AD [53], composting [25] Designed for strategic long-term planning of recycling and waste management. It is originally developed for environmental assessment of biodegradable liquid and organic waste, but can also handle treatment of mixed waste.Stand aloneGWP, acidification, eutrophication, photo oxidants, primary energy carriers, non-renewable energy carriers *12Applied in a study in 2017
[54]
Yes
SSWMSS, JapanNA NANANANA2009No
WISARDNAAims to assist decision makes when evaluating alternative waste management scenariosStand aloneNANA2000, still in use till 2009No
WRATE[55]Environmental assessment of waste management systemsStand aloneLCIA method CML 2001522017 Yes
CO2ZW [56] Calculates GHG emissions emanating from the waste operations of European municipalities.Stand aloneCarbon footprint62013Yes
LCA-LAND[57] Landfill modelStand aloneNo impact indicators—only emissionsNA1999Yes
MSWINANANANANA2003No
ARESNANANANANA2004No
WAMPS[58]
[59]
AD [23]
Screening LCA model applied to find optimal waste management solutions and alternative waste treatment technologies. The focus is on environmental aspects but also evaluates economic consequences Stand aloneGWP, eutrophication, acidification, photo-oxidant formation *112009Yes
IFEU projectNAGerman model for environmental assessment of waste systems based on the software UMBERETO. The detailed biological treatment module is not included in the official library of the UMBRETO software, but in the IFEU project specifically. Stand aloneNANA2002No
WASTED[60] Provides a comprehensive view of the environmental impacts of municipal solid waste management systems. Stand aloneNo impact indicators—only emissions62005Yes
VMR[26]Aims to be an open-source waste management tool with a detailed representation of the effects of operating conditions and input stream characteristics. NANot implemented at this stage19Under developmentYes
KISS[61] Calculates carbon footprint of different sorting and treatment systems in waste management. The model has been developed as part of the TOPWASTE project (The Optimal Treatment of Waste)Stand aloneCarbon footprint, resource recovery and loss132015Yes
* The estimation of the costs is also included.
Table A3. Step 3: Evaluation of general modelling specifications.
ToolsAssessment TypeSystem Boundaries of the Interconnected Waste Management SystemFunctional Unit TypeSubstitution
BalkwasteMFA and energy balanceGeneration, collection (including transport) and treatmentGeneration-basedYes
SIMURLife cycle thinkingGeneration, collection (including transport), treatment, final disposalGeneration-basedYes
EASETECHLCA and LCCGeneration (waste separation), collection, transport, processing technologies, disposal and application of output productsFlexible (unitary, generation, input and output-based)Yes
SWOLFLCA and LCCCollection, treatment, final disposal, land application, or remanufacturingGeneration-basedYes
WARM_v14Carbon footprint, LCA basedGeneration (incl. source reduction), collection (including transport), treatment, final disposal (land application or landfill)Generation-basedYes
IWM (EPIC/CSR)LCA and LCCCollection (including transport), treatment, final disposalUnitaryYes
IWM-PLLCA and LCCCollection (incl. transport), treatment and final disposalUnitaryyes
IWM2, UKLCA and economic assessmentGeneration, collection, treatment, final treatmentGeneration-basedYes
LCA-IWM, EULCA, economic and socialGeneration, temporary storage, collection, transport, treatment/final disposalGeneration-basedYes
MSW-DSTLCA + LCCGeneration, source reduction, collection, transport, treatmentGeneration-basedYes
ORWARELCAGeneration, collection (incl. transport), treatment and utilisation of products from waste treatmentGeneration-basedYes
WRATE, UKLCACollection, sorting, treatmentGeneration-basedYes
CO2ZW Carbon footprintGeneration, collection (including transport), sorting and treatmentGeneration-basedYes
WAMPSLCACollection (incl. transport), treatment, final disposalInput-basedYes
WastedLCAGeneration (predicted amounts), collection, material recovery, final disposal (landfill)Input-basedYes
VMRThe module will potentially be combined with LCA moduleGeneration (waste separation), collection, transport, processing technologies, disposal and application of output products Generation basedYes
KISS modelLCA based carbon footprint modelGeneration, collection (incl. transport), treatment, final disposalGeneration-basedYes
Table A4. Screening of parameters of Step 4 for the 17 tools shortlisted after Step 2.
ToolsWaste-Specific Emissions Waste-Specific Biogas GenerationWaste-Specific OutputsWaste-Specific ConsumptionsApplication of Treated Biowaste On Land
BalkwasteNoNANoNoNo
SIMUR NoNRNoNoYes
EASETECHYesYesYesPartiallyYes
SWOLFYesYesNo PartiallyYes
WARM_v14Yes YesYesNoYes
IWM (EPIC/CSR)PartiallyNANoNoNo
IWM-PLNANRNANAYes
IWM2, UKNoNANoNoYes
LCA-IWM, EUYesYesYesNoYes
MSW-DSTYes NRNo PartiallyYes
ORWAREYesYesYesPartiallyYes
WRATEPartiallyYesNo NoPartially
CO2ZW PartiallyNRNoNoNo
WAMPSNAYesNA3NAYes
WastedNoNANoNoNo
VMRNoYesYesPartiallyNo
KISS model NoNoNoNoYes
Table A5. Evaluation of transparency of the shortlisted WMS-DSTs considering where the information needed to enable an evaluation of the six steps was retrieved. The level of transparency was classified as: “High” if all information was available in documents, “Medium” if information was partially retrieved by direct contact with developers and partially by accessible documentation and “Low” if the full evaluation was not possible due to lacking documentation and lacking information from developers.
ToolsStep 1–3Step 4Step 5Step 6 (i)Step 6 (ii)Tool Specification Overall Evaluation
EASETECH[21][21]Inside tool [24] and confirmed [62][14] and confirmed [62][14] and developer [62]Not complete—but some information is available in [21] and user manual [39] and process documentation inside the tool [24] Medium
SWOLF[42,43][42,43][42,43][14] and confirmed [63][14] and developer [63]Yes—detailed process model documentations (e.g., [43,44]) Medium/high
WARM[33,44,45][33,44,45][33,44,45][14][14] and NAYes [33,44,45]Medium/high
LCA-IWM[50][50][50] or NANANRNot availableLow
MSW-DST[27,51][27,51][27,51][14] and developers [64] [14] and developers [64]Yes (https://mswdst.rti.org/resources.htm)Medium/high
ORWARE[23,25,52,53][23,54], AD [25,53] and developer [65][23,25,52,53] and developer [65]Developer [65]Developer [65]Not complete—but documentation of most process models are available (e.g., [25,53])Medium
WRATE[55][55] and inside tool [66][15,55] or NA[14]NA or [14]Not complete—but process documentation is available inside the tool [66] Low
VMR[26][26][26]Developer [28]Developer [28]Not completea Medium

Appendix B. Equations Estimating Waste-Specific Gaseous Emission in MSW-DST

CO 2 = 217.4 × F P + 237.3 × F Y + 370.5 × F F
NH 3 = 1.29 ( ± 1.38 ) F P + 5.15 ( + 1.37 ) F Y + 37.6 ( + 1.56 ) F F B 68.9 ( + 23.4 ) F P × F F
VOC = 4 , 162 ( ± 1701 ) F P + 831 ( ± 1890 ) F Y + 458 ( ± 2340 ) F F 7 , 558 ( ± 17 , 662 ) F P × F Y 6 , 006 ( ± 28 , 770 ) F P × F F
where FP, FY and FF are the dry fraction of paper, yard and food waste, respectively, ranging from 0 to 1 and with FP + FY + FF always equal to 1.

References

  1. McDonough, W.; Braungart, M. Cradle to Cradle: Remaking the Way We Make Things, 1st ed.; North Point Press: Suite, NY, USA, 2002. [Google Scholar]
  2. Bocken, N.P.; Olivetti, E.A.; Cullen, J.M.; Potting, J.; Lifset, R. Taking the circularity to the next level: A special issue on the circular economy. J. Ind. Ecol. 2017, 21, 476–482. [Google Scholar] [CrossRef]
  3. Molina-Moreno, V.; Leyva-Díaz, J.C.; Llorens-Montes, F.J.; Cortés-García, F.J. Design of indicators of circular economy as instruments for the evaluation of sustainability and efficiency in wastewater from pig farming industry. Water 2017, 9, 653. [Google Scholar] [CrossRef]
  4. Cullen, J.M. Circular economy: Theoretical benchmark or perpetual motion machine? J. Ind. Ecol. 2017, 21, 483–486. [Google Scholar] [CrossRef]
  5. Lee, J.; Pedersen, A.B.; Thomsen, M. Are the resource strategies for sustainable development sustainable? Downside of a zero waste society with circular resource flows. Environ. Technol. Innov. 2014, 1–2, 46–54. [Google Scholar] [CrossRef]
  6. Pizzol, M.; Smart, J.C.R.; Thomsen, M. External costs of cadmium emissions to soil: A drawback of phosphorus fertilizers. J. Clean. Prod. 2014, 84. [Google Scholar] [CrossRef]
  7. Thomsen, M.; Seghetta, M.; Mikkelsen, M.H.; Gyldenkærne, S.; Becker, T.; Caro, D.; Frederiksen, P. Comparative life cycle assessment of biowaste to resource management systems—A Danish case study. J. Clean. Prod. 2017, 142, 4050–4058. [Google Scholar] [CrossRef]
  8. Pivnenko, K.; Laner, D.; Astrup, T.F. Material cycles and chemicals: Dynamic material flow analysis of contaminants in paper recycling. Environ. Sci. Technol. 2016, 50, 12302–12311. [Google Scholar] [CrossRef] [PubMed]
  9. Eurostat. Municipal Waste Generation and Treatment, by Treatment Method. Available online: http://ec.europa.eu/eurostat/web/environment/waste/main-tables (accessed on 12 October 2018).
  10. Fava, F.; Totaro, G.; Diels, L.; Reis, M.; Duarte, J.; Carioca, O.B.; Poqqi-Varaldo, H.M.; Ferreira, B.S. Biowaste biorefinery in Europe: Opportunities and research and development needs. New Biotechnol. 2015, 32, 100–108. [Google Scholar] [CrossRef] [PubMed]
  11. Lokesh, K.; Ladu, L.; Summerton, L. Bridging the gaps for a “circular” bioeconomy: Selection criteria, bio-based value chain and stakeholder mapping. Sustainability 2018, 10, 1695. [Google Scholar] [CrossRef]
  12. Vea, E.B.; Romeo, D.; Thomsen, M. Biowaste valorisation in a future circular bioeconomy. Procedia Cirp 2018, 69, 591–596. [Google Scholar] [CrossRef]
  13. Winkler, J.; Bilitewski, B. Comparative evaluation of life cycle assessment models for solid waste management. Waste Manag. 2007, 27, 1021–1031. [Google Scholar] [CrossRef]
  14. Jain, P.; Dyson, B.; Tolaymat, T.; Ingwersen, W.A. Comparative Analysis of Life-Cycle Assessment Tools for End-of-Life Materials Management Systems. Available online: https://cfpub.epa.gov/si/si_public_record_report.cfm?Lab=NRMRL&dirEntryId=310582 (accessed on 15 October 2018).
  15. Gentil, E.C.; Damgaard, A.; Hauschild, M.; Finnveden, G.; Eriksson, O.; Thorneloe, S.; Kaplan, P.O.; Barlaz, M.; Muller, O.; Matsui, Y.; et al. Models for waste life cycle assessment: Review of technical assumptions. Waste Manag. 2010, 30, 2636–2648. [Google Scholar] [CrossRef] [PubMed]
  16. Chifari, R.; Martinez Sanchez, V.; Ventosa, I.P.; Guerro, T.; Sommer, G.; Lopez, M.; Degueurce, A.; Thiriet, P.; Dargent, E. D6.1—Methodology of Characterization of the Biowaste Management System in the DECISIVE Demonstration Sites: Current and New Systems Simulation for the LYON and CATALONIA Cases A Decentralised Management Scheme for Innovative. Available online: http://www.decisive2020.eu/wp-content/uploads/2018/03/Methodology-for-characterisation-of-the-biowaste-management-system-in-the-DECISIVE-demonstration-sites.pdf (accessed on 12 October 2018).
  17. Martinez-Sanchez, V.; Chifari, R.; Puig Ventosa, I.; Jofra Sora, M.; Vea, E.; Romeo, D.; Klinglmair, M.; Thiriet, P.; Scotti, M.; Walk, S. D5.1—Methodology for the Planning of Decentralised Biowaste Management. Available online: http://www.decisive2020.eu/wp-content/uploads/2018/03/DECISIVE_WP5_D5-1_release-01.pdf (accessed on 12 October 2018).
  18. Wolf, M.A.; Chomkhamsri, K.; Brandao, M.; Pant, R.; Ardente, F.; Pennington, D.W.; Manfredi, S.; de Camillis, C.; Goralczyk, M. ILCD Handbook—General Guide for Life Cycle Assessment—Detailed Guidance. Available online: http://www.citeulike.org/group/13799/article/11823307 (accessed on 11 October 2018).
  19. Laurent, A.; Clavreul, J.; Bernstad, A.; Bakas, I.; Niero, M.; Gentil, E.; Christensen, T.H.; Hauschild, M.Z. Review of LCA studies of solid waste management systems—Part II: Methodological guidance for a better practice. Waste Manag. 2014, 34, 589–606. [Google Scholar] [CrossRef] [PubMed]
  20. Besga, G. AGROLCA-Manager—Environmental Sustainability Software Tool for the Agroindustrial Sector. Available online: http://ec.europa.eu/environment/life/project/Projects/index.cfm?fuseaction=search.dspPage&n_proj_id=3998&docType=pdf (accessed on 11 October 2018).
  21. Clavreul, J.; Baumeister, H.; Christensen, T.H.; Damgaard, A. An environmental assessment system for environmental technologies. Environ. Model. Softw. 2014, 60, 18–30. [Google Scholar] [CrossRef] [Green Version]
  22. Bisinella, V.; Götze, R.; Conradsen, K.; Damgaard, A.; Christensen, T.H.; Astrup, T.F. Importance of waste composition for Life Cycle Assessment of waste management solutions. J. Clean. Prod. 2017, 164, 1180–1191. [Google Scholar] [CrossRef]
  23. Dalemo, M.; Sonesson, U.; Björklund, A.; Mingarini, K.; Frostell, B.; Jönsson, H.; Nybrant, T.; Sundqvist, J.O.; Thyselius, L. ORWARE—A simulation model for organic waste handling systems. Part 1: Model description. Resour. Conserv. Recycl. 1997, 21, 17–37. [Google Scholar] [CrossRef]
  24. The Technical University of Denmark. EASETECH. Available online: http://www.easetech.dk/model-description (accessed on 11 October 2018).
  25. Sonesson, U. Modelling of the Compost and Transport Process in the ORWARE Simulation Model. Available online: https://pub.epsilon.slu.se/3833/ (accessed on 11 October 2018).
  26. Tanguay Rioux, F.; Viau, S.; Majeau Bettez, G.; Spreutels, L.; Samson, R.; Legros, R. Development of a Tool for Waste Management Planning Based on the Integration of Material Flow Analysis and Life Cycle Assessment. Available online: https://slideblast.com/development-of-a-tool-for-waste-management-planning_5a96ade01723dd62a78e0c79.html (accessed on 11 October 2018).
  27. Komilis, D.; Ham, R.K. Life Cycle Inventory and Cost Model for Mixed Municipal And Yard Waste Composting. Available online: https://mswdst.rti.org/docs/compost_model_ocr.pdf (accessed on 11 October 2018).
  28. Tanguay-Rioux, F.; Department of Chemical Engineering, Polytechnique Montreal, Montréal, QC, Canada. Personal communication, 2018.
  29. Jensen, J.; Kyvsgaard, N.C.; Battisti, A.; Baptiste, K.E. Environmental and public health related risk of veterinary zinc in pig production—Using Denmark as an example. Environ. Int. 2018, 114, 181–190. [Google Scholar] [CrossRef] [PubMed]
  30. Jensen, J.; Larsen, M.M.; Bak, J. National monitoring study in Denmark finds increased and critical levels of copper and zinc in arable soils fertilized with pig slurry. Environ. Pollut. 2016, 214, 334–340. [Google Scholar] [CrossRef] [PubMed]
  31. Sharifi, Z.; Renella, G. Assessment of a particle size fractionation as a technology for reducing heavy metal, salinity and impurities from compost produced by municipal solid waste. Waste Manag. 2015, 38, 95–101. [Google Scholar] [CrossRef] [PubMed]
  32. Singh, J.; Kalamdhad, A.S. Reduction of heavy metals during composting—A review. Int. J. Environ. Prot. 2012, 2, 36–43. [Google Scholar]
  33. US EPA. Documentation for Greenhouse Gas Emission and Energy Factors Used in the Waste Reduction Model (WARM)—Management Practices Chapters. Available online: https://www.epa.gov/sites/production/files/2016-03/documents/warm_v14_management_practices.pdf (accessed on 15 October 2018).
  34. BALKWASTE—Waste Network for Sustainable Solid Waste Management Planning and Promotion of Integrated Decision Tools in the Balkan Region. Project’s Final Technical Report. Available online: http://ec.europa.eu/environment/life/project/Projects/index.cfm?fuseaction=search.dspPage&n_proj_id=3253#RM (accessed on 15 October 2018).
  35. The Web-Based WASP-Tool. Available online: http://wasptool.hua.gr/index.php?option=com_content&view=article&id=283&Itemid=106&lang=en (accessed on 12 October 2018).
  36. European Commission. Final Report Summary—HOLIWAST (Holistic Assessment of Waste Management Technologies). Available online: https://cordis.europa.eu/result/rcn/49637_en.html (accessed on 12 October 2018).
  37. BCN-Ecologia SIMUR Simulator. Available online: http://www.bcnecologia.net/en/conceptual-model/simulator-simur (accessed on 15 October 2018).
  38. Boldrin, A.; Neidel, T.L.; Damgaard, A.; Bhander, G.S.; Møller, J.; Christensen, T.H. Modelling of environmental impacts from biological treatment of organic municipal waste in EASEWASTE. Waste Manag. 2011, 31, 619–630. [Google Scholar] [CrossRef] [PubMed] [Green Version]
  39. EaseTech User Manuals; The Technical University of Denmark: Lyngby, Denmark, 2017.
  40. Levis, J.W.; Barlaz, M.A.; Decarolis, J.F.; Ranjithan, S.R. Systematic exploration of efficient strategies to manage solid waste in U.S municipalities: Perspectives from the solid waste optimization life-cycle framework (SWOLF). Environ. Sci. Technol. 2014, 48, 3625–3631. [Google Scholar] [CrossRef] [PubMed]
  41. Stanisavljevic, N.; Levis, J.W.; Barlaz, M.A. Application of a life cycle model for european union policy-driven waste management decision making in emerging economies. J. Ind. Ecol. 2018, 22, 341–355. [Google Scholar] [CrossRef]
  42. Levis, J.W.; Barlaz, M.A. Anaerobic Digestion Process Model Documentation. Available online: http://www4.ncsu.edu/~jwlevis/AD.pdf (accessed on 12 October 2018).
  43. Levis, J.W.; Barlaz, M. Composting Process Model Documentation. Available online: http://www4.ncsu.edu/~jwlevis/Composting.pdf (accessed on 12 October 2018).
  44. US EPA. Documentation for Greenhouse Gas Emission and Energy Factors Used in the Waste Reduction Model (WARM)—Organic Materials Chapters. Available online: https://www.epa.gov/sites/production/files/2016-03/documents/warm_v14_management_practices.pdf (accessed on 15 October 2018).
  45. US EPA. Documentation for Greenhouse Gas Emission and Energy Factors Used in the Waste Reduction Model (WARM)—Background Chapters. Available online: https://www.epa.gov/sites/production/files/2016-03/documents/warm_v14_management_practices.pdf (accessed on 15 October 2018).
  46. Haight, M. Technical Report: Integrated Solid Waste Management Model. 2004. Available online: https://uwaterloo.ca/integrated-waste-management-model-for-municipalities/sites/ca.integrated-waste-management-model-for-municipalities/files/uploads/files/tech_report_mar9_2004.pdf (accessed on 15 October 2018).
  47. Grzesik, K.; Usarz, M. A life cycle assessment of the Municipal Waste Management System in Tarnów. Geomat. Environ. Eng. 2016, 10, 29–38. [Google Scholar] [CrossRef]
  48. Grzesik, K. Application of IWM-PL model for Life Cycle Assessment (LCA) of municipal waste management in Kraków. Part 1. Geomat. Environ. Eng. 2013, 7, 35–55. [Google Scholar] [CrossRef]
  49. McDougall, F.; White, P.; Franke, M.; Hindle, P. Integrated Solid Waste Management: A Life Cycle Inventory, 1st ed.; John Wiley and Sons: Hoboken, NJ, USA, 2001. [Google Scholar]
  50. Den Boer, J.; Den Boer, E.; Jager, J. LCA-IWM: A decision support tool for sustainability assessment of waste management systems. Waste Manag. 2007, 27, 1032–1045. [Google Scholar] [CrossRef] [PubMed]
  51. Thorneloe, S.A.; Weitz, K.; Jambeck, J. Application of the US decision support tool for materials and waste management. Waste Manag. 2007, 27, 1006–1020. [Google Scholar] [CrossRef] [PubMed] [Green Version]
  52. Eriksson, O.; Frostell, B.; Bjö Rklund, A.; Assefa, G.; Sundqvist, J.O.; Granath, J.; Carlsson, M.; Baky, A.; Thyselius, L. ORWARE—A simulation tool for waste management. Resour. Conserv. Recycl. 2002, 36, 287–307. [Google Scholar] [CrossRef]
  53. Dalemo, M. The Modelling of an Anaerobic Digestion Plant and a Sewage Plant in the ORWARE Simulation Model, 1st ed.; Swedish University of Agricultural Sciences: Uppsala, Sweden, 1996. [Google Scholar]
  54. Hadin, Å.; Hillman, K.; Eriksson, O. Prospects for Increased Energy Recovery from Horse Manure—A Case Study of Management Practices, Environmental Impact and Costs. Energies 2017, 10, 1935. [Google Scholar] [CrossRef]
  55. Hall, D.; Turnbull, R.; Coleman, T.; Thomas, B.; Shiels, S.; Lythgo, K.; Al, E. WRATE User Manual V4.0. Available online: www.wrate.co.uk/Content/Files/wrate_manual.zip (accessed on 12 October 2018).
  56. Farreny, R.; Colman, S.; Gasol, C.; Rieradevall, J.; Sevigne, E.; Gabarrell, X. Universitat Autònoma de Barcelona. Carbon Footprint Tool for Waste Management in Europe (CO2ZW). Available online: http://co2zw.eu.sostenipra.cat/ (accessed on 12 October 2018).
  57. Nielsen, P.H.; Hauschild, M. Product specific emissions from municipal solid waste landfills. Int. J. LCA 1998, 3, 158–168. [Google Scholar] [CrossRef]
  58. Moora, H. Life Cycle Assessment as a Decision Support Tool for System Optimisation—The Case of Waste Management in Estonia. Ph.D. Thesis, Tallinn University of Technology, Tallinn, Estonia, 2009. [Google Scholar]
  59. Miliūte, J.; Staniškis, J.K. Application of life-cycle assessment in optimisation of municipal waste management systems: The case of Lithuania. Waste Manag. Res. 2010, 28, 298–308. [Google Scholar] [CrossRef] [PubMed]
  60. Diaz, R.; Warith, M. Life-cycle assessment of municipal solid wastes: Development of the WASTED model. Waste Manag. 2006, 26, 886–901. [Google Scholar] [CrossRef] [PubMed]
  61. Cimpan, C.; Wenzel, H. Foreground Systems Report Model—System Descriptions and LCI data for the KiSS Model. Available online: http://www.topwaste.dk/Models-publications/TOPWASTE%20Foreground%20system%20report%202015-10-19.pdf (accessed on 12 October 2018).
  62. Damgaard, A.; Department of Environmental Engineering, Technical University of Denmark, 2800 Kgs. Lyngby, Denmark. Personal communication, 2018.
  63. Levis, J.; Department of Civil, Construction, and Environmental Engineering. North Carolina State University, Raleigh, NC, USA. Personal communication, 2018.
  64. Weitz, K.; RTI International, Research Triangle Park, NC, USA. Personal communication, 2018.
  65. Eriksson, O.; Department of Building, Energy and Environmental Engineering, University of Gavle, Gavle, Sweeden. Personal communication, 2018.
  66. WRATE. WRATE tool Academic Version 2018. Available online: http://www.wrate.co.uk/Page/Download (accessed on 12 October 2018).
Figure 1. Main features included in a typical LCA WMS-DST. The focus of the review is on waste treatment processes and waste characteristics (in bold).
Sustainability 10 03720 g001
Figure 2. Methodological approach adopted for review of WMS-DSTs focusing on the applicability to assess CBWMSs.
Sustainability 10 03720 g002
Figure 3. Number of tools included and tools that were excluded in the shortlisting Steps 1–3.
Sustainability 10 03720 g003
Figure 4. Number of tools included and tools that were excluded in the evaluation and shortlisting of Step 4.
Sustainability 10 03720 g004
Table 1. Shortlisting steps (Steps 1–4) of the WMS-DST review method including scope of the identified tools (Step 1) and evaluation parameters and associated shortlisting criteria for Step 2 (general characteristics), Step 3 (general modelling characteristics) and Step 4 (minimum criteria for current applicability to assess CBWMS).
StepParameterShortlisting Criteria
1Environmental assessmentAssess sustainability (as a minimum one impact assessment indicator quantifying environmental performance) of WMS
1Waste typeMust evaluate municipal solid waste fractions
1Fractional waste compositionMust be able to work with various waste fractions
2DocumentationMust be included
2Last updateMust be updated after year 2000
3Assessment typeLife cycle-based thinking assessing a complete WMS
3Co-production modellingMust be included
4Biowaste treatment technologies included Minimum one
4Waste-specific propertiesMust be included (e.g., VFA content and methane generation potential)
Table 2. Evaluation steps (Steps 5–6) of the WMS-DST review method including detailed evaluation of current applicability to assess CBWMS (Step 5) and future flexibility and applicability to assess CBWMS (Step 6).
StepParameter
5 Waste-specific emissions
5 Waste-specific biogas generation
5 Waste-specific bioproducts
5 Waste-specific resource consumptions
5Modelling of bioproduct application
5Functional unit *
6 (i)Flexibility: feasibility to analyse new conditions
6 (ii)Flexibility: feasibility to add and modify existing processes and to directly import background processes from databases
6 (iii)Accessibility and transparency
* The functional units of the reviewed WMS-DSTs were classified in four major classes according to [19]: (1) unitary (a unitary measure, e.g., management of 1 ton of waste); (2) generation-based (waste generation in a delimited region for a specified period of time); (3) input-based (waste amounts entering a given facility); and (4) output-based (waste by-products, e.g., amounts of recovered energy or recycled material).
Table 3. Evaluation of minimum criteria for the current modelling of biowaste management technologies (Step 4).
ToolNameBioconversion TechnologiesMaterial-Specific Properties a
Anaerobic Digestion (AD)Compost
Balkwaste1 (type NA)1 (type NA)None
SIMUR -1 (windrow)None
EASETECH1 (one stage, wet thermophilic)4 (enclosed channel, enclosed windrow, open-air windrow and decentralised)High
SWOLF1 (wet single-stage mesophilic digester)4 (windrow, aerated static piles, gore cover system, and in-vessel systems)Medium
WARM_v142 (two single-stage and mesophilic; wet and dry)1 (windrow)Medium
IWM (EPIC/CSR)2 (wet/dry)2 (windrow and in-vessel)None
IWM-PL-1 (type NA)NA
IWM2, UK2 (wet and dry)1 (type NA)None
LCA-IWM1 (dry thermophilic) 1 (two-step windrow) Medium/high b
MSW-DST-4 (high and low quality windrow and yard waste and one static pile design)Medium
ORWARE1 (continuous single stage mixed reactor)4 (home, windrow, reactor and membrane)High
WRATE4 (2 large dry, 1 medium thermal 1 small low solid)10 (4 enclosed, 3 in vessel, 1 open windrow and 2 home composting)High
CO2ZW -1 (type NA)None
WAMPS1 (continuous single stage mixed reactor, thermophilic or mesophilic) c4 (home composting, open windrow, close windrow and reactor)NA
Wasted1 (type NA)2 (windrow and vessel)None
VMR1 (wet)-High
KISS model 1 (two-stage, mesophilic)-None
a High (>10 elements/properties), medium (4–10 elements/properties), low (1–3 elements/properties), none (0 elements/properties); b The exact number of properties included is not available (NA); c ORWARE AD module is used in the tool, refer to ORWARE [23] for information regarding AD process.
Table 4. Overview of tools shortlisted in Steps 1–4 including tool version and whether gaseous emissions, biogas generation and compost and digestate composition are modelled considering the input waste composition and if they include application of bio-treated material.
ToolsWaste-Specific Gaseous EmissionsWaste-Specific Biogas Generation Waste-Specific Bioproducts Waste-Specific Resource ConsumptionBio-Treated Material Application
EASETECHYesYesYesPartiallyYes
SWOLFYesYesYesPartiallyYes
WARM_v14YesYesYesNoYes
LCA-IWMYesYesYesNoYes
MSW-DSTYesNoNoPartiallyNo
ORWAREYesYesYesPartiallyYes
WRATEYesYesNoNoYes
VMR- aYesYesPartially- a
a VMR is at its early stage of development, hence composting, curing of digestate or application of these products is currently not implemented.
Table 5. Strategies adopted for modelling of direct emissions during composting or curing of digestate. Where applicable, data from default composting technologies are provided.
ToolsModelling Principles for C- and N- Containing EmissionsExample of Emissions Factors for C- and N- Containing Emissions during Composting aOther Emissions
CO2CH4N2ONH3N2VOCs
EASETECH a*Portion of degraded C or N (%)99.80.21.498.50.1-
SWOLF *Portion of degraded C or N (%)98.3 1.70.4495.6VOC (0.238 kg/ton VS)
WARM_v14Emission factors for various waste fractions e.g., for food waste and green waste (tCO2-eq/t wet weight)-0.0055 and 0.01390.0396 and 0.0609 ---
LCA-IWM *Portion of degraded C or N (%)-NANANANANA
MSW-DSTFunctions considering the content of paper, yard and food wasteEquation (A1) b--Equation (A2) b-Equation (A3) b
ORWARE *cC-emissions: decomposition of organic matter contained in input waste e.g., lignin. N-emissions: fraction of N-loss d (%) 30% of C 0.35% of CO2296274% of input VOC
WRATEFraction of input C and N NANANANA-VOC (% of wastein), Cl (% of Cl)
VMR-------
* Tools including a biofilter reducing emissions to air; a Example of dataset from generic enclosed windrow composting facility, USA [24]. Note that in the example dataset, 95% of CH4 is further oxidized to CO2 and 99% of the NH3 is oxidized; b Calculated according to Equations (A1)–(A3) in Appendix B; c Includes emissions of CHX, AOX, Phenols, PCB and dioxins, which are modelled as % of input VOC [25]; d Calculated according to Equation (1).
Table 6. The approach used for modelling biogas generation during AD and examples of energy conversion and emissions from default biogas combustion technologies available in the tools.
ToolsBiogas GenerationBiogas Combustion
Modelling PrinciplesEnergy ConversionEmissions
EASETECHBiogas yield as a portion of anaerobically degradable carbon for each fraction (default 70%) and user defined CH4 content in biogas (%)Default energy coefficients—51% CH4 is transferred to heat and 39% to electricity and 10% lost Emission factors a for stationary engine e.g., 0.0077 kg NOx/m3 CH4 and biogas leakage (2%)
SWOLFMethane potential for each fraction and obtained yield e.g., 86.64 m3/ton wet weight and obtained yield of 91% for vegetable food wasteEnergy conversion factor 9 CH4 MJ/kWh Emission factors b for gas turbine e.g., 0.0204 kg NOx/m3 CH4 and biogas leakage (3%)
WARM_v14Methane potential for each fraction and obtained yield e.g., 369 m3/ton dw and 90% methane yield reached for food wasteElectricity produced per waste fraction. For example, 201.4 kWh/ton food waste and 69.6 kWh/ton yard trimmings (for wet and dry AD)CH4 leakage (2%)
LCA-IWMMethane potential in biowaste (user defined). Default NAEnergy generated is linked to the amount and quality of the biogasNA
MSW-DST c---
ORWAREProportional to degraded organic matter calculated according to Equation (2), considering maximum degradation ratio, the first-order rate constant and the hydraulic retention time. Energy content in the methane gas and the heat and electricity efficiency (60% and 30% respectively in default gas engine)NA
WRATEEnergy produced is linearly correlated to the quantity of biogenic carbonEnergy produced is linearly correlated to the quantity of biogenic carbonNA
VMRConversion of microbiological reactions considering hydrolysis rates, degradable fraction, VS, particle size of the waste and retention time--
a Emission factors for 27 compounds incl. NMVOC, PM10, PM2.5, CO, N2O, NH3; b Emission factors for biogenic CO2, CH4, particulates, NOx, NMVOCs, SOx, NH3 CO and H2S are available; c Note that the current version of MSW-DST does not include any AD process module.
Table 7. Summary of the strategies considered for modelling of the content of nutrients and micro-impurities in the solid output bioproducts (compost or digestate).
ToolsModelling PrinciplesNutrients Considered *Micro Impurities
EASETECHMass balance principlesC, N, P and K Heavy metals remain in TS
SWOLFMass balance principles C, N, P and KNo
WARM_v14Mass balance principles N and CNo
LCA-IWMMass balance principlesC and NHeavy metal content is unchanged and distributed to the solid output
MSW-DSTNot waste-specific --
ORWAREMass balance principles C, N
P and K
Heavy metal content is unchanged and distributed to the solid output
WRATENot waste-specific--
VMRMass balance principlesC and N Heavy metal content is unchanged and distributed to the solid output
* For the decomposition modelling of N and C containing organic matter, refer to Section 3.3.1 on waste-specific emissions and Section 3.3.2 on waste-specific biogas modelling.
Table 8. Modelling of land application of treated biowaste.
ToolsSubstitution of FertilizerEmissions IncludedCarbon SequestrationResource Consumption
EASETECH40% for N and 100% for P, KCO2, CH4, NH3, N2O, NO3, N2, PO3 and heavy metalsFraction of C stored—depends on application frequencyYes (l Diesel/kg wet weight compost)
SWOLF40% for NNH3, N2O, NO3Fraction of C applied (0.29)Yes (Diesel/kg wet weigh compost/digestate)
WARM_v1440% for N and 100% for P aN2O and CH40.08 ton CO2, eq/tons food waste treatedYes
LCA-IWM100% substitution for N, P2O5 and K2ONoNoNo
MSW-DSTNo22 compounds in total including NO3, Na, K, and Cd. NoNo
ORWARE100% for P, K and mineral N, 30% during the first year and 30% for organic NNH3, N2O, NO3, N2 and heavy metalsYesYes (MJ/ha)
WRATE100% of commercial fertilizerCO2, N, P, K, Cl, heavy metalsFraction of C applied (2%)No
VMR----
a Only for anaerobic digested biowaste and it excludes the substitution of compost (aerobic digested biowaste).
Table 9. Comparison of the flexibility of the tools to analyse new conditions.
ToolsWaste CompositionMaterial PropertiesImport of Additional FractionsEnergy Mix
EASETECHYesYesYesYes
SWOLFYesYesPartially aYes
WARM_v14YesNoNoPartially b
LCA-IWMNANANANA
MSW-DSTYesYesPartially cYes
ORWAREYesYesYesYes
WRATEYesNoNoPartially d
VMRYesYesYesNo
a The tool includes a limited number of blank materials for which custom properties can be added (19 slots); b The user can select a default energy mix for the US national average or for a specific US state, but cannot specify a unique energy mix; c The tool includes a limited number of blank materials for which custom properties can be added (five “other” categories for paper, five for plastic, two for aluminium and a few additional slots); d Only the expert version of WRATE (V4) allows modifying the energy mix.
Table 10. Feasibility to modify existing processes and add new processes.
ToolsSubstitution RatiosTransfer CoefficientsEnergy ConsumptionsMethane PotentialAdd New ProcessesDirect Import of Background Data
EASETECHYesYesYesYes aYesEcoinvent and ELCD
SWOLFYesYesYesYesYesNo
WARM_v14NANANANoNoNA
LCA-IWM bNRNRNRNRNRNR
MSW-DSTNoNoNoNoNoNo
ORWAREYesYesYesYesYesNo
WRATEPartially c Partially cPartially cNoPartially cEcoinvent c
VMRYesYesYesYes YesNo
a This parameter is not used in the tool; however, the fraction of anaerobically degradable carbon can be modified to consider variation in methane generation potential; b LCA-IWM is not available, so the feasibility to modify processes is not relevant (NR); c Not possible in the academic or the freeware version, only in V4.
Table 11. Accessibility and means of access for the shortlisted tools and transparency evaluated as low, medium or high. For details of the evaluation of the transparency, refer to Table A5.
ToolsAvailable?Means of AccessTransparency
EASETECHYesFreeware for academic use (requires attendance in course), one-time fee for commercial useMedium
SWOLFYesFinal interface is being developed, but a prototype can be obtained upon request Medium/high
WARM_v14Yes Freeware Medium/high
LCA-IWMNo Not availableLow
MSW-DSTYesFreewareMedium/high
ORWAREYesBy request but is difficult to use with no preliminary knowledge as no user manual is availableMedium
WRATEYesBy request for academic institutions. Expert version is only available upon payment Low
VMRNoInterface is not yet developedMedium
a VMR is under development and still not released. However, when it will be released the background code will be open source [28].

