1. Introduction
As part of the expended efforts to reduce greenhouse gas emissions in recent years, the installation of renewable power sources (RESs) is continually increasing. Countries around the world are formulating plans to replace existing fossil-fuel-based power stations with RES [
1,
2,
3,
4]. The Korean power system is also planning to increase its RES penetration. According to the recently announced the 8th basic plan for the supply and demand of electricity, 60 GW of renewable power will be installed in the Korean power system by 2030. The total installed capacity of wind and photovoltaic power is planned to be 53 GW, and the ratio of solar power to wind power is expected to be 2:1. The peak load of the Korean power system in 2030 is expected to be approximately 100 GW. In effect, the scale of the wind power and photovoltaic power generation capacities will be 53% of the peak load.
Many parts of the RESs have characteristics that are different from those of conventional generators. One of the most important differences is fluctuation of the electrical power output. In the case of the conventional generator, the output can be controlled. Therefore, when the stability of the conventional generator is examined, no major problems are anticipated, even if it is operated at the rated output power. However, in the case of RES, such as the wind power generations and photovoltaics, the output cannot be arbitrarily adjusted. Based on these characteristics, the study of the cooperation of RESs must be able to reflect their output variations. To cope with such RES fluctuations, multiple research studies have been conducted on the effects of the mixing of various RESs and the utilization of energy storage system (ESS) [
5,
6,
7,
8]. Based on the penetration of RESs, the scale of the impact of their output fluctuations has changed. Correspondingly, studies of the impact of RES penetration on the individual power grid have been conducted [
9,
10,
11,
12,
13], in view of the increased importance of the penetration of RESs and their influences on the stability of the electric power system.
Changes in the static characteristics of the power system due to the penetration of RESs can be easily calculated. However, in the case of transient stability, it is not easy to analyze the effects of the penetration of RESs. In the MIGRATE report in Europe, the decrease in the transient stability margin owing to the increase of the penetration of RESs is specified as an important observation point [
14]. According to the results of this study, it can be observed that transient stability is improved initially according to the expansion of the penetration of RESs. However, according to the expansion of penetration of RESs, it has been documented that the transient stability has continually deteriorated [
9,
11]. Generally, when the specific inertia of the renewable power source is small, the RES output is replaced with the output of the conventional generators, thereby improving the transient stability response. However, when the ratio of the renewable power source was increased, the existing generator had to be stopped, and the transient stability deteriorated owing to the decrease of the system inertia [
15].
Various studies have been conducted to analyze the impact of expansion of RESs on transient stability [
16,
17,
18,
19]. Most of the studies have been based on simulations whereby the penetration of RESs affect the transient stability. However, only a limited number of prior studies exist which have investigated the main factor that affects the transient stability in the situation where the penetration of RESs has expanded. The study by Liu et al. explained the influence of RESs on the transient stability based on effective equal area criterion (EEAC) [
19]. In this study, it was shown that the main factor that affected the transient stability were the locations of the RESs and the adjustment of the output of conventional generators. However, this study was considered only when RESs directly replaced the output of the conventional generator.
This paper investigated the impact of the distributed penetration of RESs on transient stability. The major factors of change at transient stability are derived by configuration of hybrid method reflecting RES penetration. The simulation was conducted in the Korean power system in 2030. The penetration of RESs was distributed to individual buses based on the planned capacity in accordance to geographical region. The impact of RES penetration on the transient was provided as the change of the CCT in each area. Based on simulation, the impact of the penetration of RESs in the Korean power system was represented.
2. Dynamic Impact Analysis for RES with Hybrid Method
2.1. Equal Area Criterion (EAC) and Single Machine Equivalent (SIME) Configuration
The equal area criterion (EAC) is a method used to evaluate the transient stability of the power system. When a contingency occurs, the electric power of the generator decreases owing to a voltage drop, thus resulting in an acceleration of the generator. After the elimination of the fault, the generator is decelerated because the electric power is increased after the phase angle induced by the fault is increased. If the acceleration area is larger than the deceleration area, the generator is desynchronized.
To analyze the transient stability of the power system with EAC, the system must be modeled in a one machine infinite bus (OMIB) [
20]. However, the actual power system consists many generators and complex transmission system. Therefore, all generators are reduced as the one generator by SIME configuration. For this reduction, all system generators are classified into critical or non-critical group. The equivalent phase angles of these two groups are defined according to their central of angle (COA) values. The definition of angle difference and COA for each group is given as follows:
where:
= the rotor angle of the equivalent machine
= COA of the critical group
= COA of the non-critical group
= the rotor angle of the machine i, k
= the inertia of the machine i, k
= COA of the critical group
= COA of the non-critical group
Other parameters, including the angular velocity and acceleration, mechanical input, and electrical output, can be calculated based on the above definitions:
where:
= the rotor angle of the equivalent machine
= the angular velocity of the critical group
= the angular velocity of the non-critical group
= the rotor angle of the machine i, k
= COA of the critical group
= COA of the non-critical group
= mechanical input of the machine i, k
= electrical output of the machine i, k
2.2. Transient Impact Analysis of RES Penetration with the Hybrid Method
In this section, the impact of the RES penetration on the transient stability is derived from the SIME configuration. If the generator included in the critical group is stopped, it can affect to the transient stability. However, if the generator included in the non-critical group is stopped, impact of stopping generator can ignore. Therefore, only the situation where the stop of the generator included in the critical group is considered. In the case of the conventional generator that included in critical group with the RESs, mechanical input, and electrical output of the equivalent generator is changed as follows:
where:
= new mechanical input of the equivalent machine reflecting RES penetration
= new electrical output of the equivalent machine reflecting RES penetration
= mechanical input and inertia of the stropped generator
= amount of the RES penetration
= the ratio about RES output and electrical output reduction of the equivalent machine
Equations (6)–(8) represent the cases where the generator is stopped and the RES has been installed. Equation (6) represents the mechanical input of the equivalent generator reflecting stop of the conventional generator. Mechanical input of the equivalent generator decreases by the stop of the generator which is included in the critical group. In Equations (7) and (8), denotes the ratio of the RES power generation which contributes to the reduction of the electrical output. The value of is unity if the RES is installed in the same location as the generator of the critical group. Conversely, is zero when the installation position of the RES is electrically far away from the critical group. Equation (7) is the electrical output of the equivalent generator with RES penetration. Though, some type of the RES has a mechanical input and inertia, it cannot be applied to the mechanical input because it is connected to the power system through the inverter device and asynchronous characteristic. Equation (8) shows acceleration energy of the equivalent generator.
In Equation (8), change of the stop of the generator and RES expansion is canceled. However, impact of the contingency affect differently in mechanical input and electrical output. Mechanical input is not affected by the contingency. On the other hand, electrical output reduced by the power system voltage, especially during the contingency condition. Most of RESs have little risk about loss of synchronism and storing acceleration energy in the inertia. That is the reason why the impact of RES is applied to the electrical output of the equivalent generator.
To apply RES penetration in SIME as above Equations (6)–(8), RES should not be included in SIME configuration. It means that RES only applied in dynamic time domain simulation to affect the simulation result. By the RES penetration, the electrical output of the equivalent generator is changed. However, the mechanical input is affected by the stop of the generator only. Proposed SIME configuration reflecting RES penetration can provide the numerical margin to analyze the transient impact.
2.3. Change of the Power-Angle Curve by the RES Penetration
To understand the impact of the RES penetration on the transient stability, transient impact of the RESs derived from Equations (6)–(8) is applied in the power-angle curve. Power-angle curve is provided to explain the impact of the RES penetration with four scenarios.
Table 1 summarizes these scenarios.
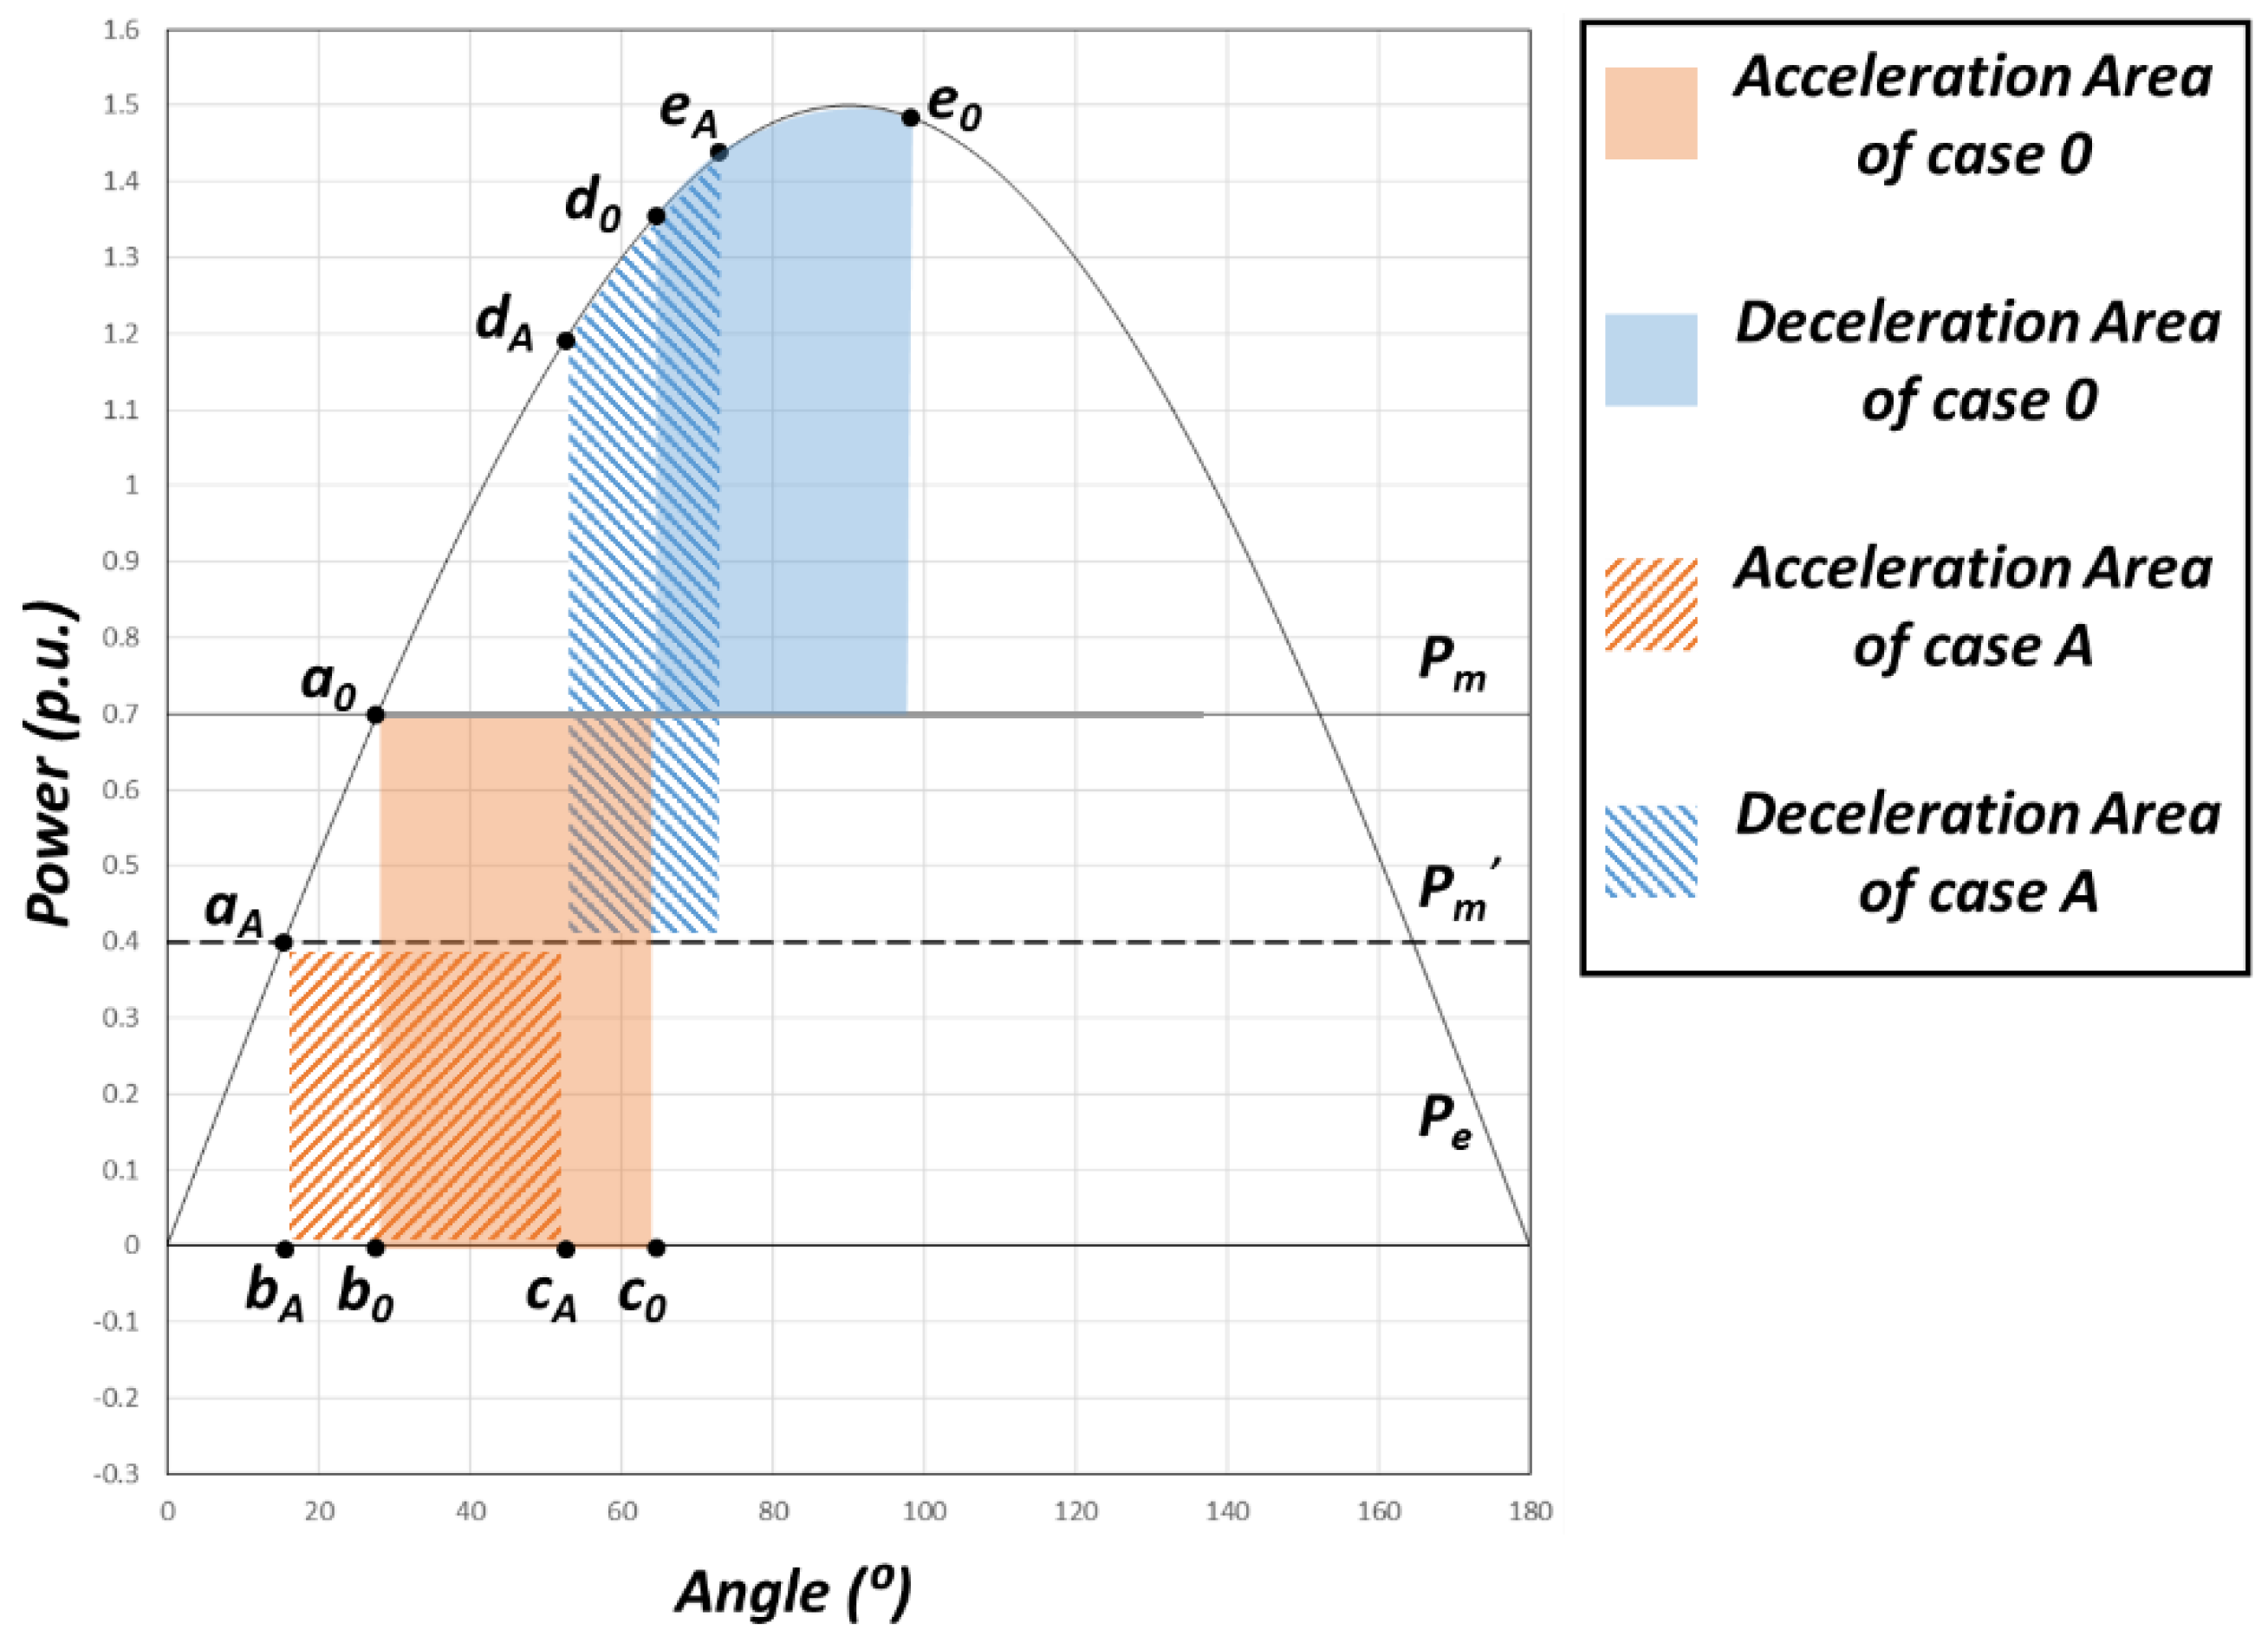
2.3.1. Case A—Reduction of Mechanical Input in Critical Group
Case A is the case where only the mechanical input decreases owing to the termination of the operation of the generator. Since there is no RES input,
is equal to zero. For convenience, inertia effects are ignored in this analysis.
Figure 1 depicts the power–angle curve in the case where a reduction of mechanical input has occurred. Points a–e respectively represent the operating points before the fault, at the instant at which the fault occurs, after the fault, after the fault clears, and the case at which the operating point has an angular velocity of zero. The subscript indicates the relevant scenario. The colored area shows the acceleration/deceleration area of the base case, and the diagonally highlighted area represents the area within which the scenario has been applied. As is known, the reduction in the mechanical input improves the transient stability.
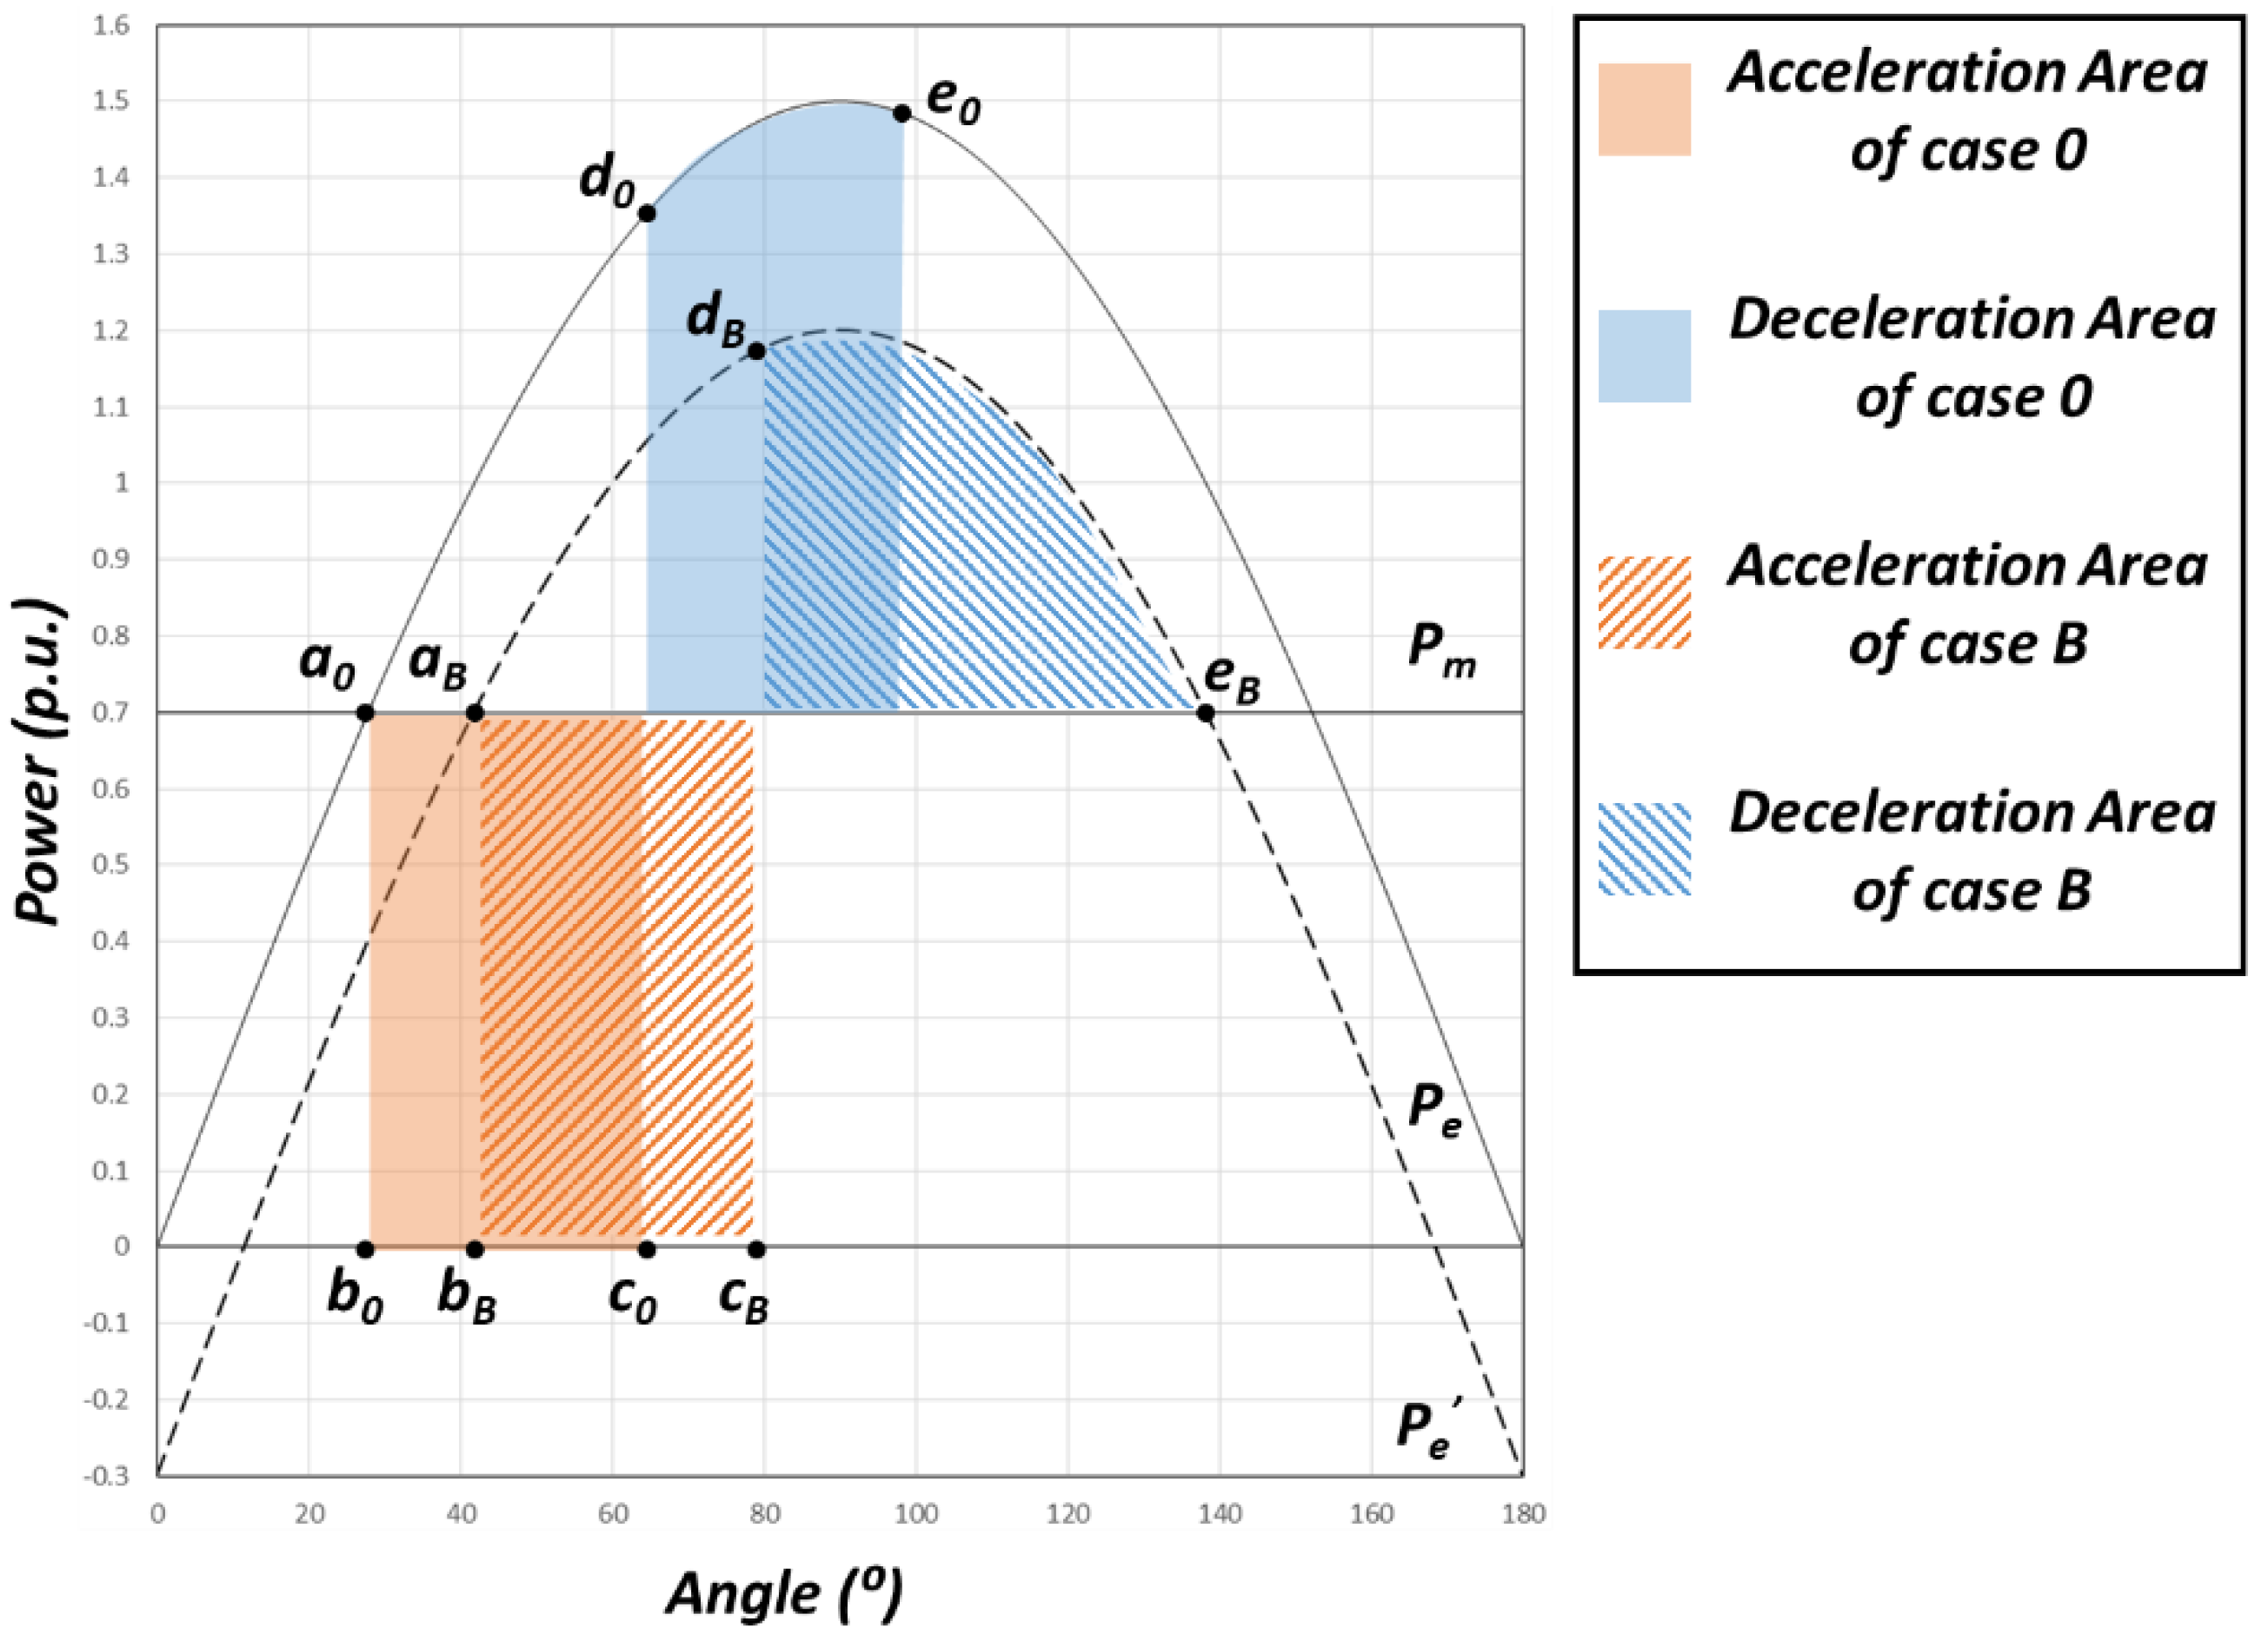
2.3.2. Case B—Increment of RES Power Generation in the Proximity of the Critical Group
Case B is the case where only the output of RES is increased. Since the generator is still in operation,
is zero. For convenience, inertia effects are ignored. However, unlike the mechanical input, the output of the RES becomes zero when the fault occurs. At the fault state, the RES cannot maintain the required electrical output.
Figure 2 shows the power–angle curve to which the installation of the RES is applied. The points displayed on the graph have the same meanings as those listed in
Figure 1. The effect of the penetration of the RES is exactly the opposite of the effect induced when the generator stopped. In reference to cases A and B, the influences seem to have the same magnitude but opposing trends. However, at the fault condition, it is very important that the output of the RES is zero. Correspondingly, the size of the acceleration area of Case B is the same as the base case. In case A, the size of the acceleration area decreased because the mechanical input decreased. However, owing to the change of the normal operating point and the reduction of the deceleration area, transient stability deteriorated.
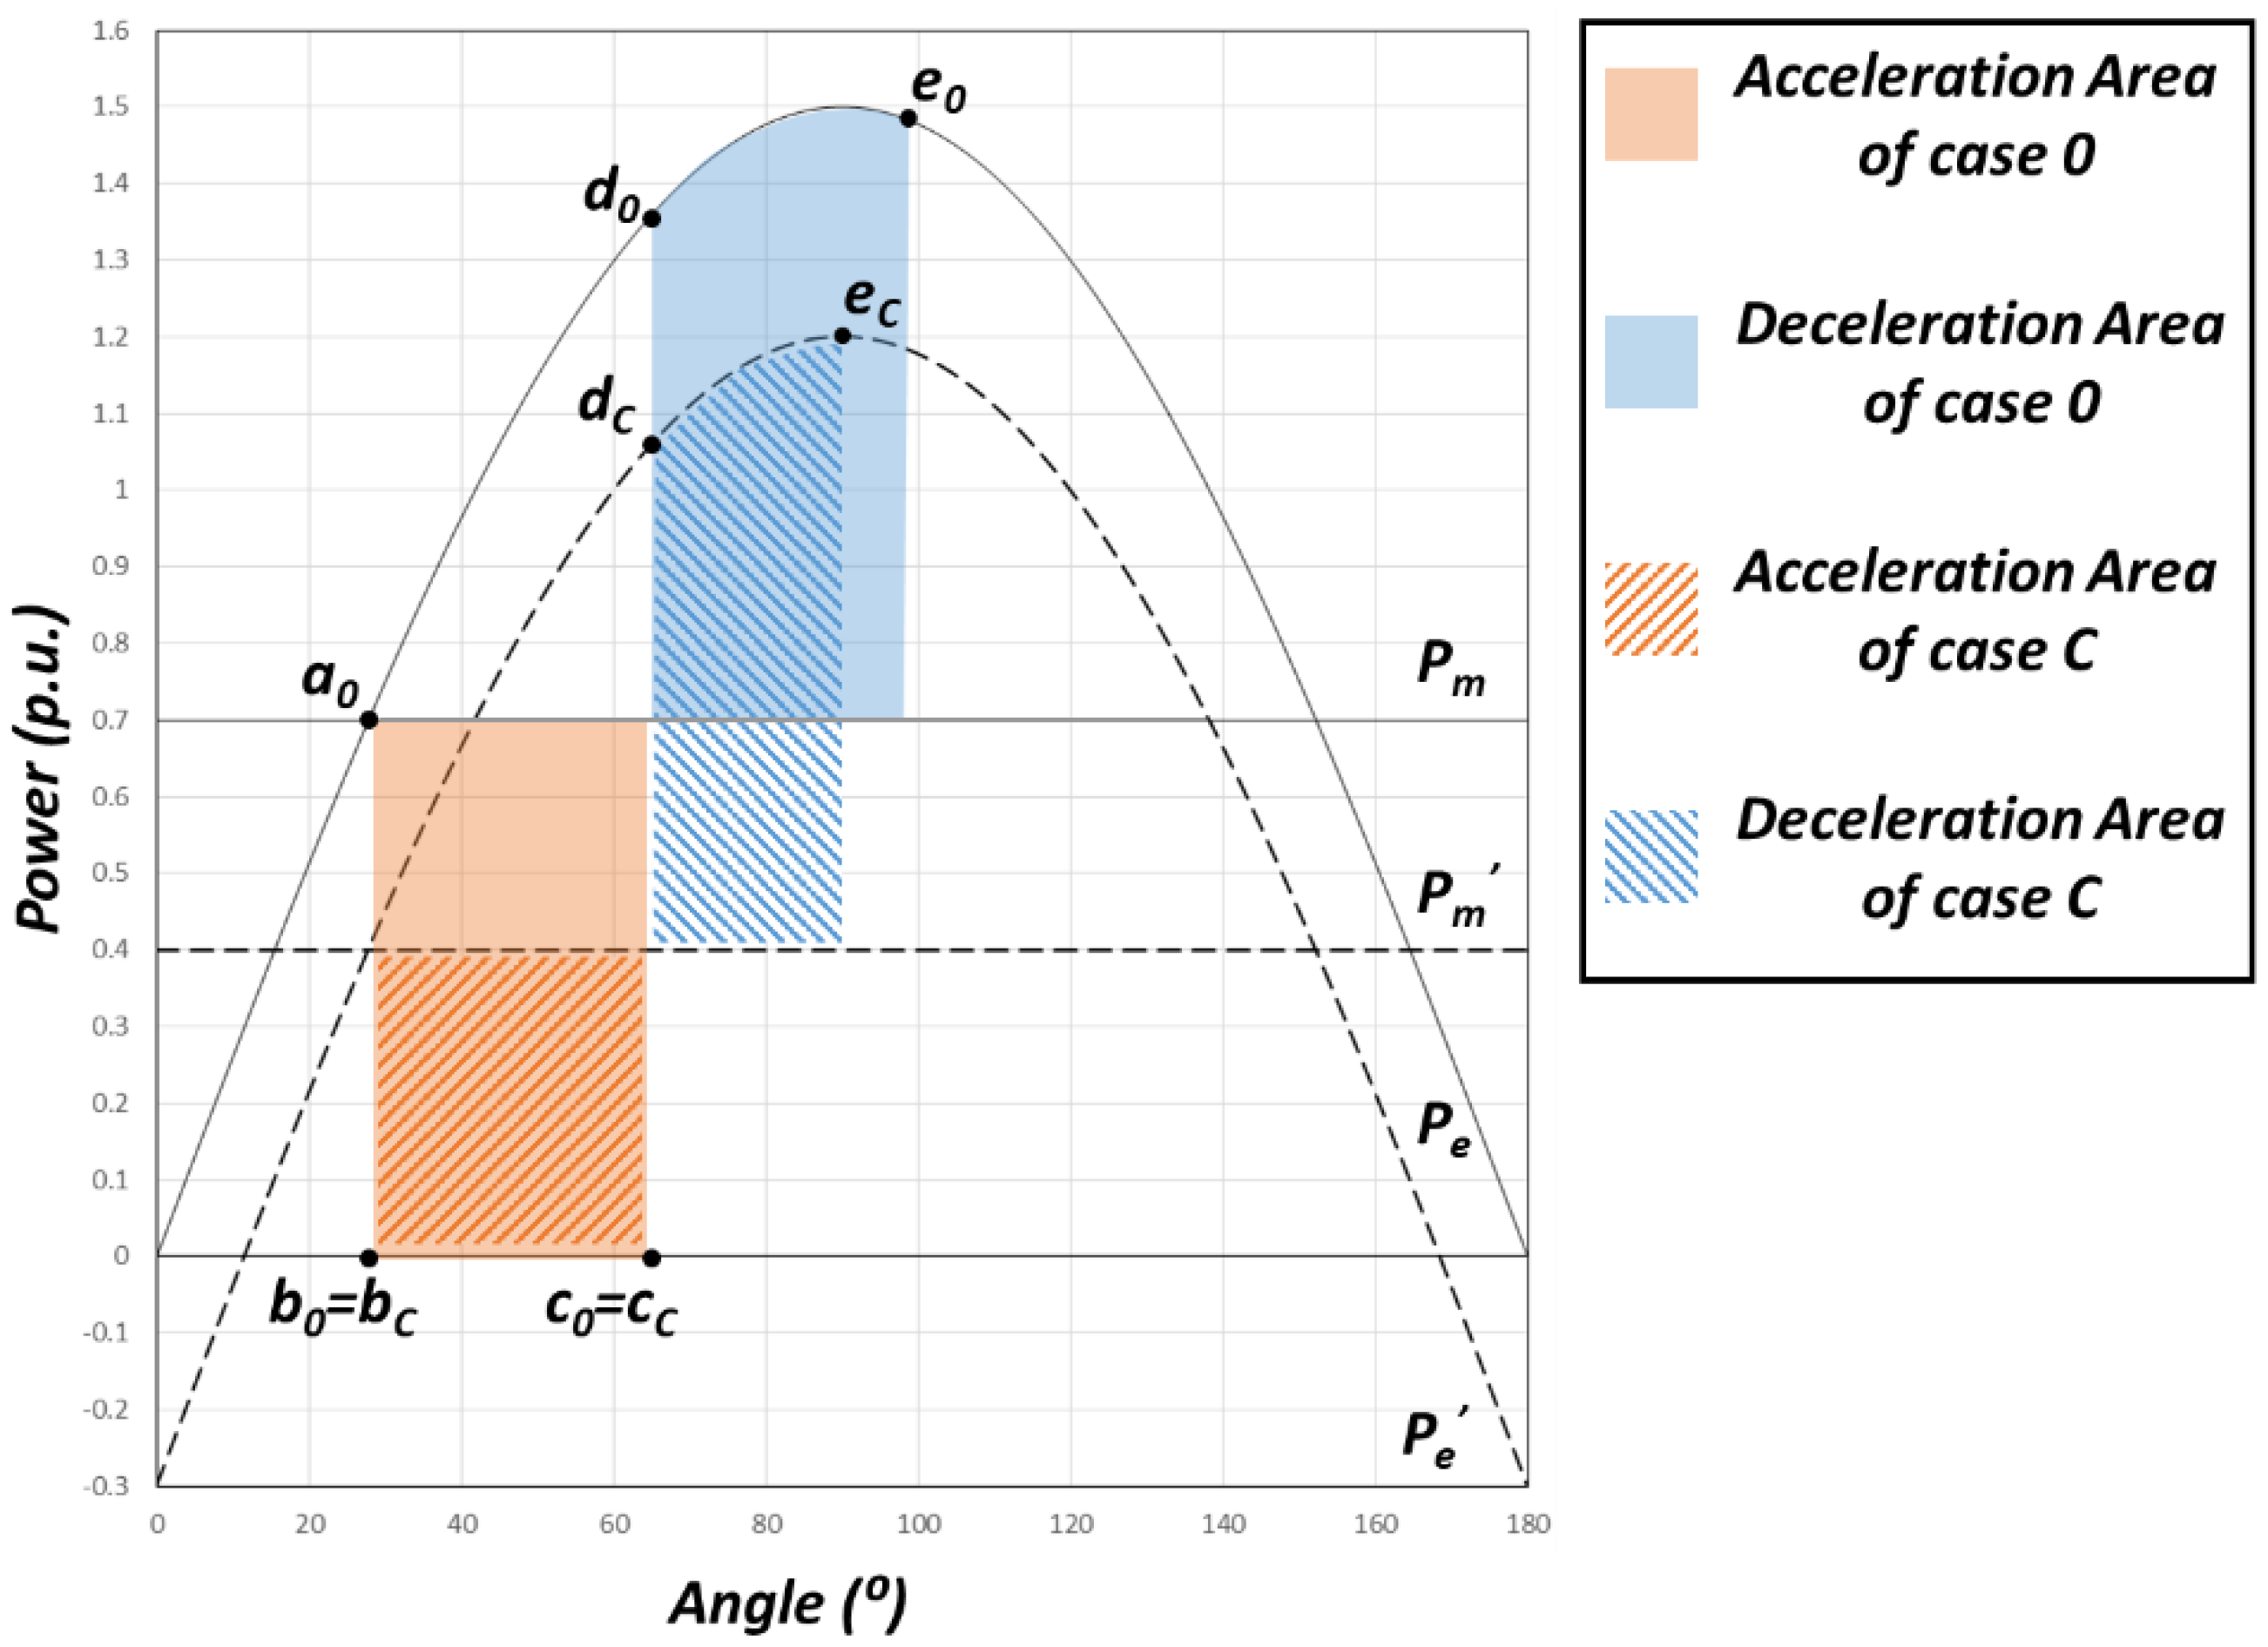
2.3.3. Case C—Replacement of Conventional Generator with RES
Case C is the case where the conventional generator is replaced by the RES. In this case,
is equal to unity and
is equal to
. For convenience, inertia effects are ignored here.
Figure 3 shows the power–angle curve for the case where the conventional generator is replaced by the RES. Since the output of the RES is not affected during the fault condition, only the change of the mechanical input is reflected in acceleration area changes. However, after the clearing of the fault, the deceleration area is the same as the base case. It means that transient stability is improved when the conventional generator replaced with RES like case C. In the general operating condition, this effect is greater because the value of
is less than one.
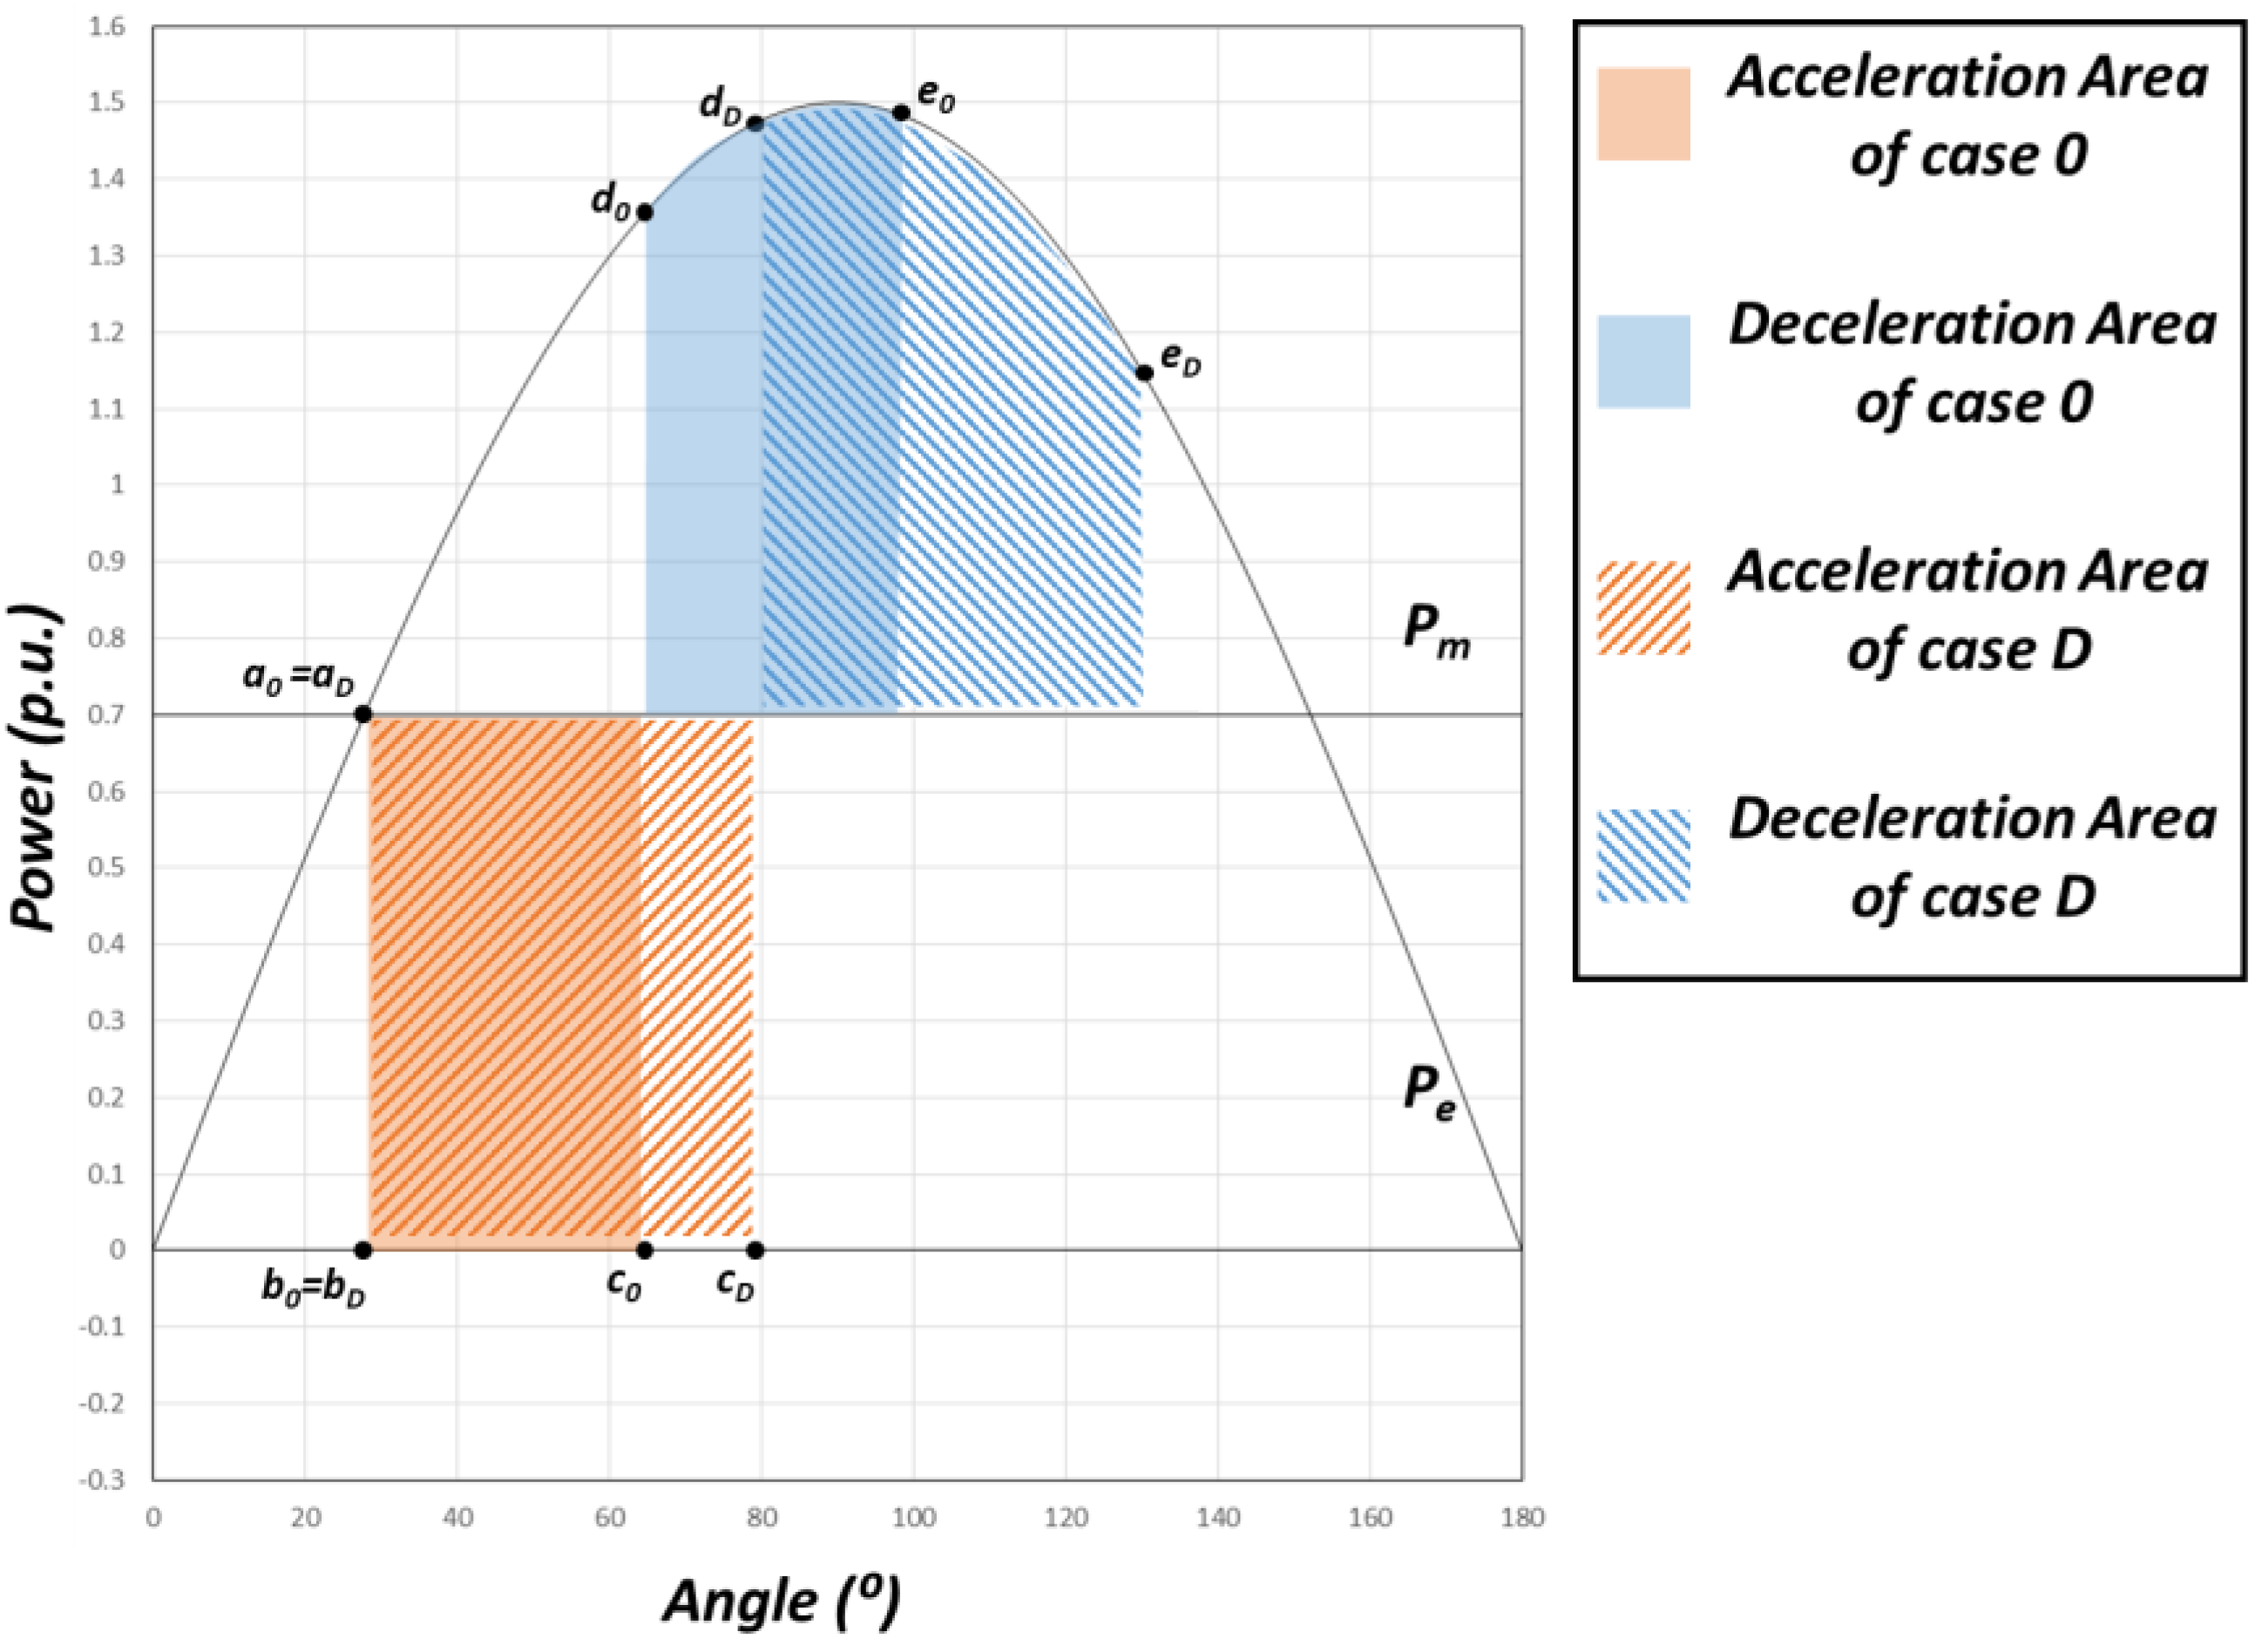
2.3.4. Case D—Decrease of the Inertia of the Generator in the Critical Group
Case D shows the effect of the change of the inertia of the generator on the power–angle curve. The change in the inertia does not impose distinct changes in the power–angle curve. The main change elicited by the inertia variations relates to the increase in the phase angle during the fault, i.e., the distance between points b and c. As the overall inertia of the critical group decreases, the distance between points b and c increases.
Figure 4 shows the change of the acceleration/deceleration areas induced by the reduction of the inertia. Since the change in the inertia does not cause a change in the mechanical input/electrical output, the power–angle curve is the same. When the same contingency occurs, the phase angle increases more than the base case. Such a change can cause transient instability.
2.3.5. Other Characteristics of RES Affecting Transient Stability
Based on prior considerations, the RES has dynamic characteristics that are different from conventional generation. In addition, the RES has a different transient characteristic than conventional generators. The part that greatly affects the transient stability is the voltage/reactive power characteristic. The RES is generally connected to an inverter, or is installed together with a reactive power compensator. Generally, reactive power compensation contributes to system transient stabilization. This effect does not apply to the SIME configuration, however, it does affect the simulation result and electrical output of the equivalent generator. The effect of the reactive power support is also reflected in the transient stability margin.
2.4. Impact of RES Penetration in Transient Characteristics
Cases A–D show the influences of the RES penetration on the transient stability. Case A shows that the termination of the operation of the conventional generator by the penetration of the RES improves transient stability. Conversely, Case B shows that the increase in the generation of RES deteriorates transient stability. Case C represents the concurrent effects of Cases A and B. The result of case C shows that the transient stability improves, even if the effects of cases A and B are concurrently reflected. Case D shows the influence of the change of the inertia. When the inertia of the generator decreases considerably, the transient stability can deteriorate. However, assuming that the inertia values of the generators in the power system do not differ considerably, it can be assumed that the impact of inertia can be neglected.
If the power system changes owing to the penetration of RES are the same as those elicited in case C, the transient stability of the power system will be improved. However, this response is different from that elicited based on the research results. The existing research results show that the transient stability is improved when the penetration of the RES is small. However, as the scale of RES penetration increases, the transient stability deteriorates considerably. The reason for this discrepancy is attributed to the increased imbalance of regional supply and demand by the penetration of the RES. The area associated with power generation increases owing to the penetration of the RES is not same as the area associated with power generation decreases owing to the penetration of the RES. Therefore, the general change of the electrical grid by the penetration of the RES is denoted by cases A and B, and not by case C. Additionally, the installation location of the RES is separated by a distinct distance to the critical group. This means that the adverse effects of the penetration of the RES are not observed when the scale is small. Therefore, when the scale of the RES penetration is small, the improvement effect elicited in case A is conspicuous. However, as the penetration scale of the RES increases, adverse effects attributed to case B start to become evident.
3. Future Korean Grid Scenario with Increased RES Penetration
3.1. Penetration of RESs in the Future Korean Power Grid
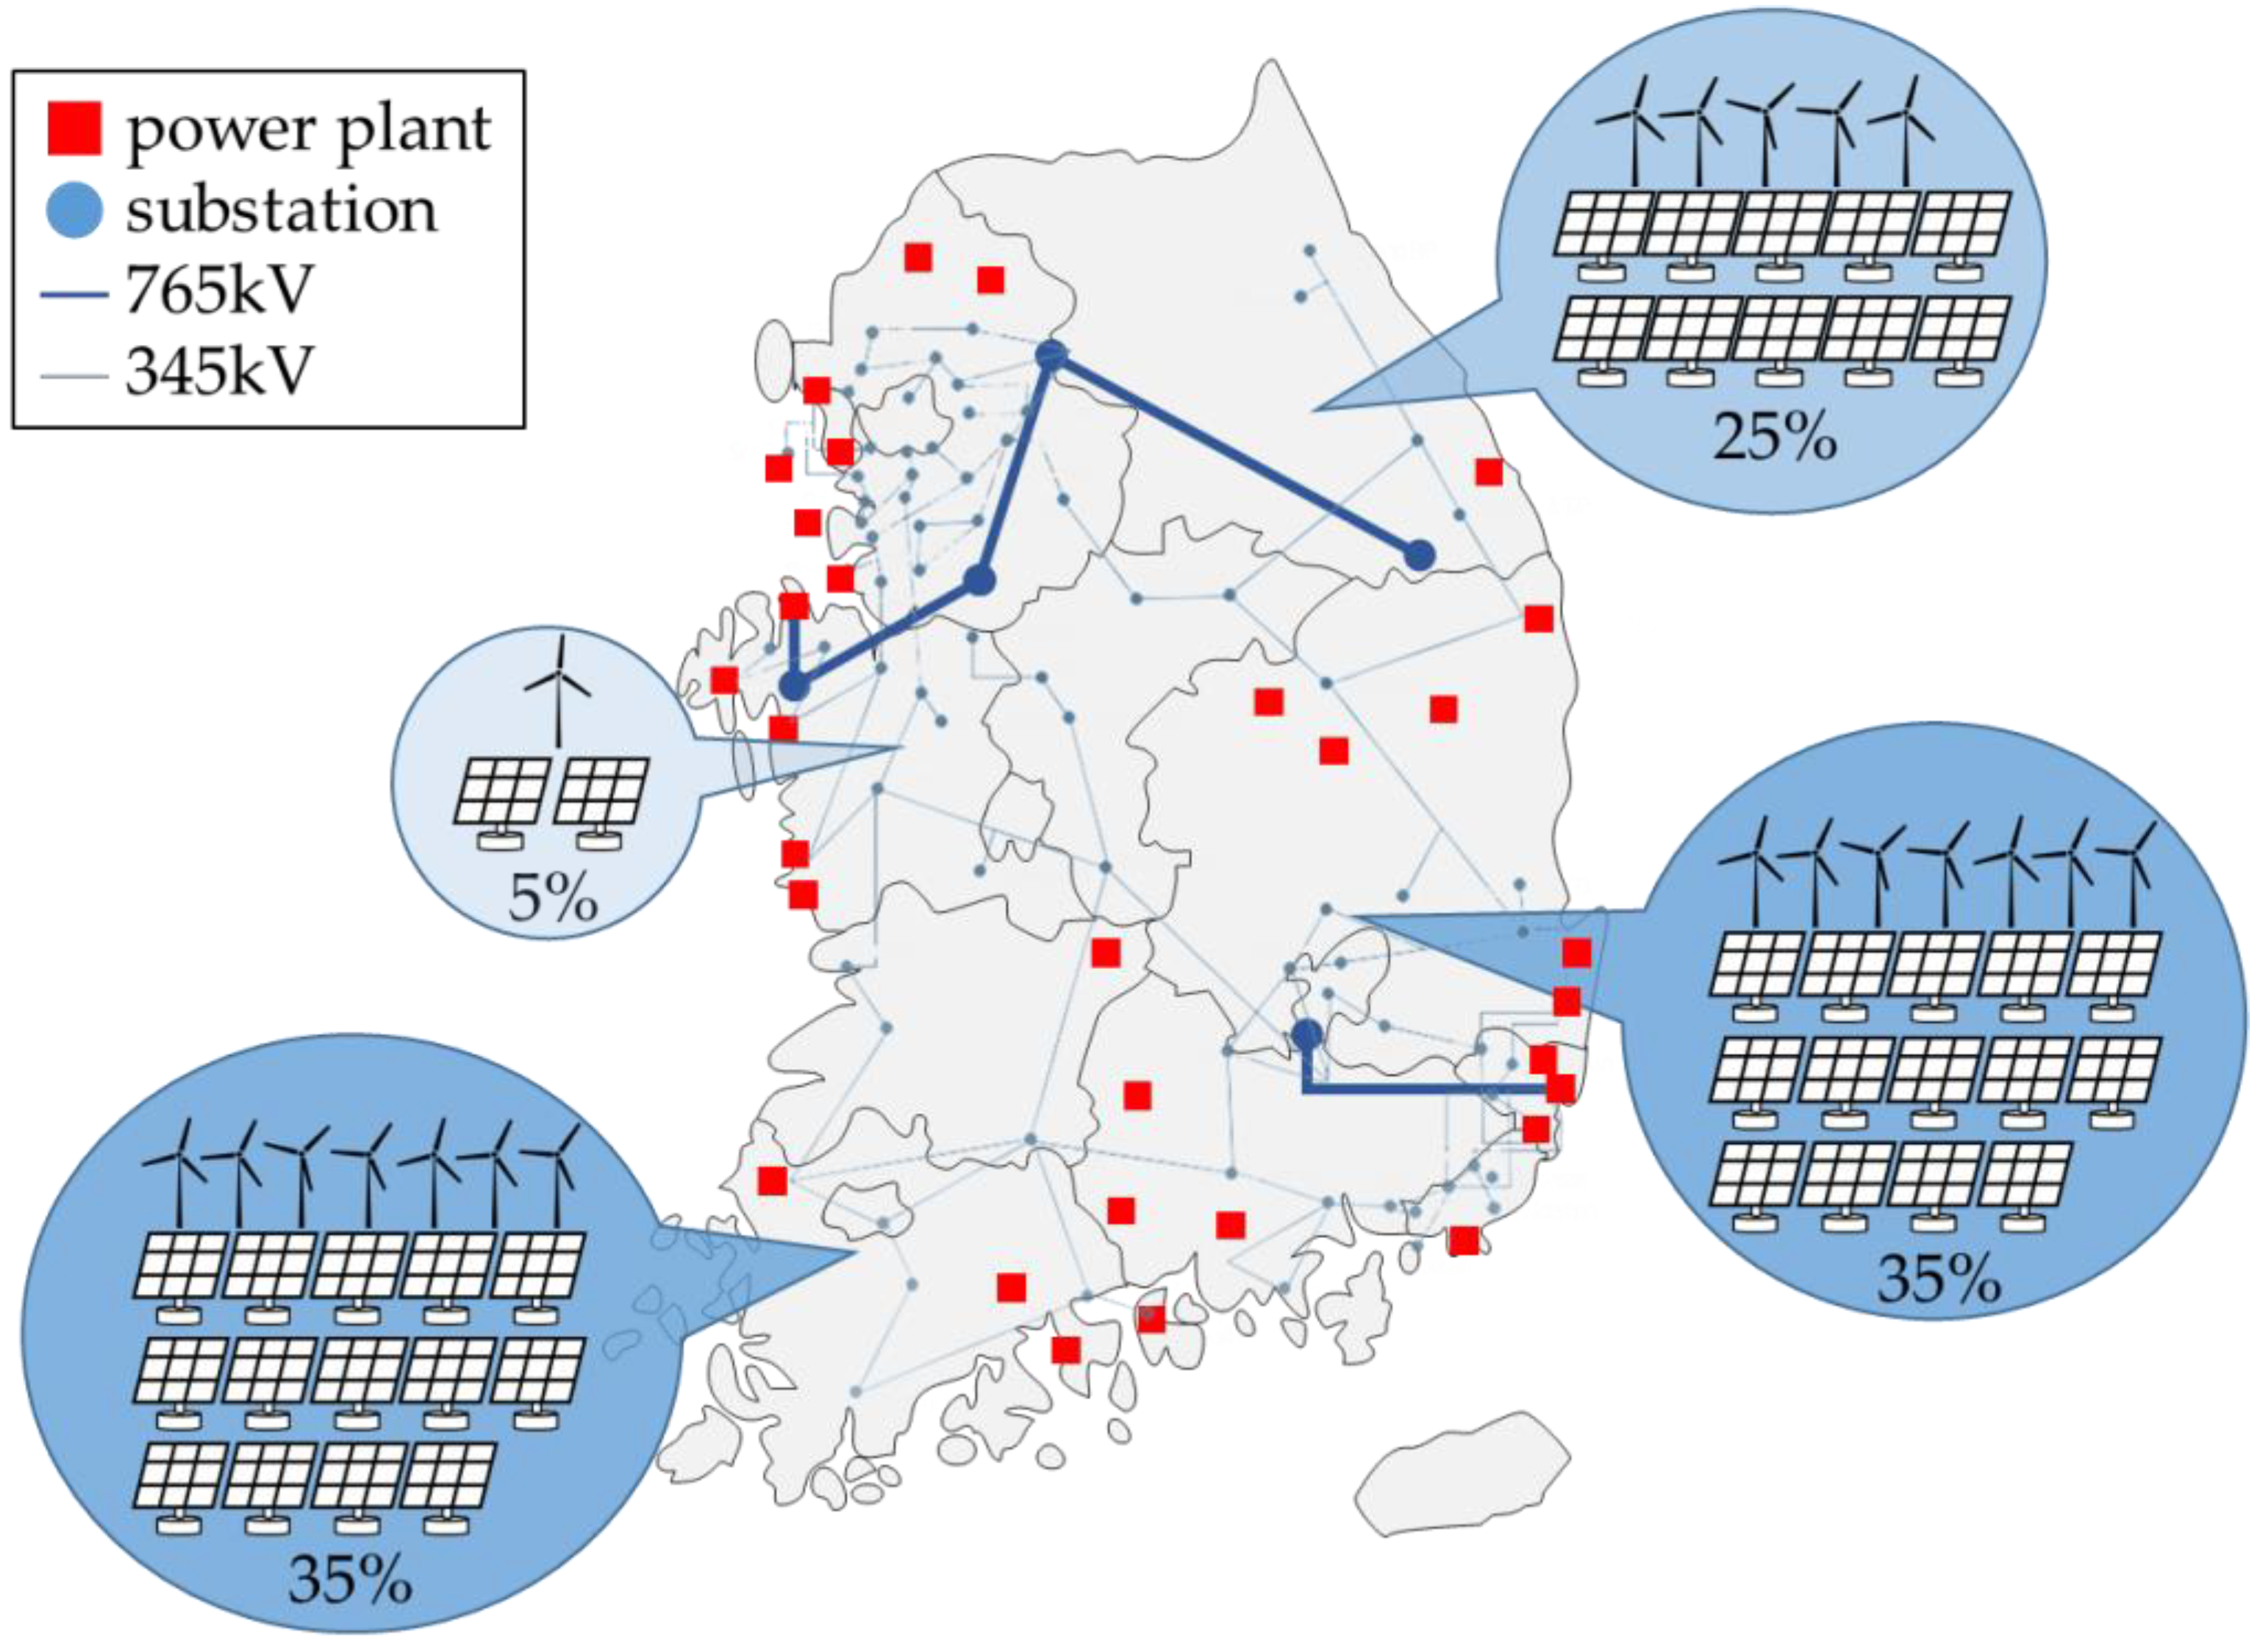
According to the plan, the scale of RES will increase to approximately 53 GW by 2030. At 2030, the peak load of the Korean electric power system will become 100 GW. Unlike the conventional generators, it is not possible to accurately ascertain the scale and locations of the RESs based on this plan. Therefore, in consideration of the generally known size, the capacity of RES is distributed in accordance to geographical area. The RES capacity ratio in accordance to geographical region was set at 0% for the capital area, 25% for the Gangwon area, 5% for the Chungcheong area, 35% for Honam area, 35% for the Yeongnam area. The composition of the RES considers a 2:1 distribution ratio of photovoltaic and wind powers. The scenario reflects the distribution of the future RESs of the Korean power system.
Figure 5 represents the outline of the RES penetration scenario.
3.2. Reactive Power Capability of RES
The characteristics of the RES vary depending on the energy source and design. For accurate power system analyses, the differences of RESs should be identified. In order to reflect these, the type, design, capacity, and location of the RESs that need to be installed must be known. However, it is impossible to accurately determine the RES capacity of each bus at the system planning stage. Specifically, in the case of RES, there is an increased possibility that many plants will be installed by many businesses. As a result, the installation plan of RESs is very inaccurate at the planning stage of the long-term power system. Therefore RESs are modeled with several assumptions.
The first assumption is that most of the RESs consist of wind and photovoltaic sources. 8th basic plan for the supply and demand of electricity will install RESs with a total capacity of 60 GW of which 53 GW is consisted of wind and photovoltaic sources. The second assumption is that the wind source consists mostly of type 3 or type 4 generators. According to the grid code of the Korean electric power grid, in the case of wind power generators, it is necessary to be able to output reactive power that corresponds to 0.95 p.f. of the rated power output [
3]. Therefore, the wind source was modeled as a type 3 or type 4 wind power generator capable of reactive power control. Furthermore, assuming that the operating characteristics of type 3 generators do not differ considerably from those for type 4 generators, all wind generator models are of type 4.
In the case of photovoltaics, it is assumed that the system is driven with a unity power factor because there is no grid code. There is no standard related to the voltage and reactive power of the photovoltaic source in the grid code of the Korean power system. Therefore, photovoltaic sources are not expected to produce reactive power for power system stability. The dynamic model of each RES utilizes the 2
nd-generation model of WECC. In this model, each element is defined as a module so that the characteristics of the RESs are properly described, and the modules are connected to each other as needed [
20,
21].
3.3. Allocation of the Capacity of RESs
Conventional power plants have large capacities and their positions are determined at the power system planning stage. Additionally, the construction period is long and it is mainly connected to the high-voltage bus of the system. Conversely, RES has a smaller capacity than conventional plants, and is distributed over a relatively large area. Given these characteristics, the modeling and evaluation methods for RESs differ from those used for conventional sources. Nevertheless, to analyze the effect of the RES penetration, a RES installation scenario is required. Nevertheless, to analyze the effect of the RES penetration, a RES installation scenario is required. In this study, the capacity of the RES distributed by the limits of individual buses. In the planning stage, if the limits of individual buses are violated, the bus cannot accept the RES installation. Therefore, it can be inferred that more RESs will be installed on the bus that have more margin. In this paper, RES penetration scenario is formed as follow process.
Step 1. Perform individual evaluations on all buses that are candidates for the RES installation. Apply RES to each bus, apply contingencies within two-levels, and verify the overload and load flow convergence. The maximum allowable capacity that does not cause overload and load-flow divergence is the RES capacity limit of each bus. At this time, the upper limit of the RES capacity can be arbitrarily set. In that case, if a problem does not occur when the upper limit is set in place, the limit capacity of the RES is maintained to the upper limit.
Step 2. Determine the total capacity of the RES and the ratio of each region. The regional capacity is distributed to the individual buses at the rate of the RES limit for each bus, as calculated in Step 1. The relevant equations are listed below:
where
is the RES capacity to be allocated to region a,
is the total capacity of the RES,
is the capacity ratio of region a,
is the RES capacity of the bus I included in region a, and
is the limit capacity of the bus i calculated in Step 1.
Step 3. Set the step of the penetration of the RES and increase the RES penetration step-by-step until the load flow calculation diverges. In this case, the dispatch of the supply and demand is based on the merit order.
4. Case Study
The voltage levels of the transmission facilities of KEPCO are 765 kV, 345 kV, and 154 kV. The contingency list includes double faults of transmission lines at the voltage level of 345 kV. However, transmission lines directly connected to the generator are excluded. The maximum RES penetration applied in this simulation was 30 GW. The composition of the RES considered a 2:1 ratio for the generated photovoltaic and wind powers. The scenario reflects the composition of the future RES of the Korean power system. Simulations were conducted with PSS/E to analyze the dynamic impact of the RES penetration.
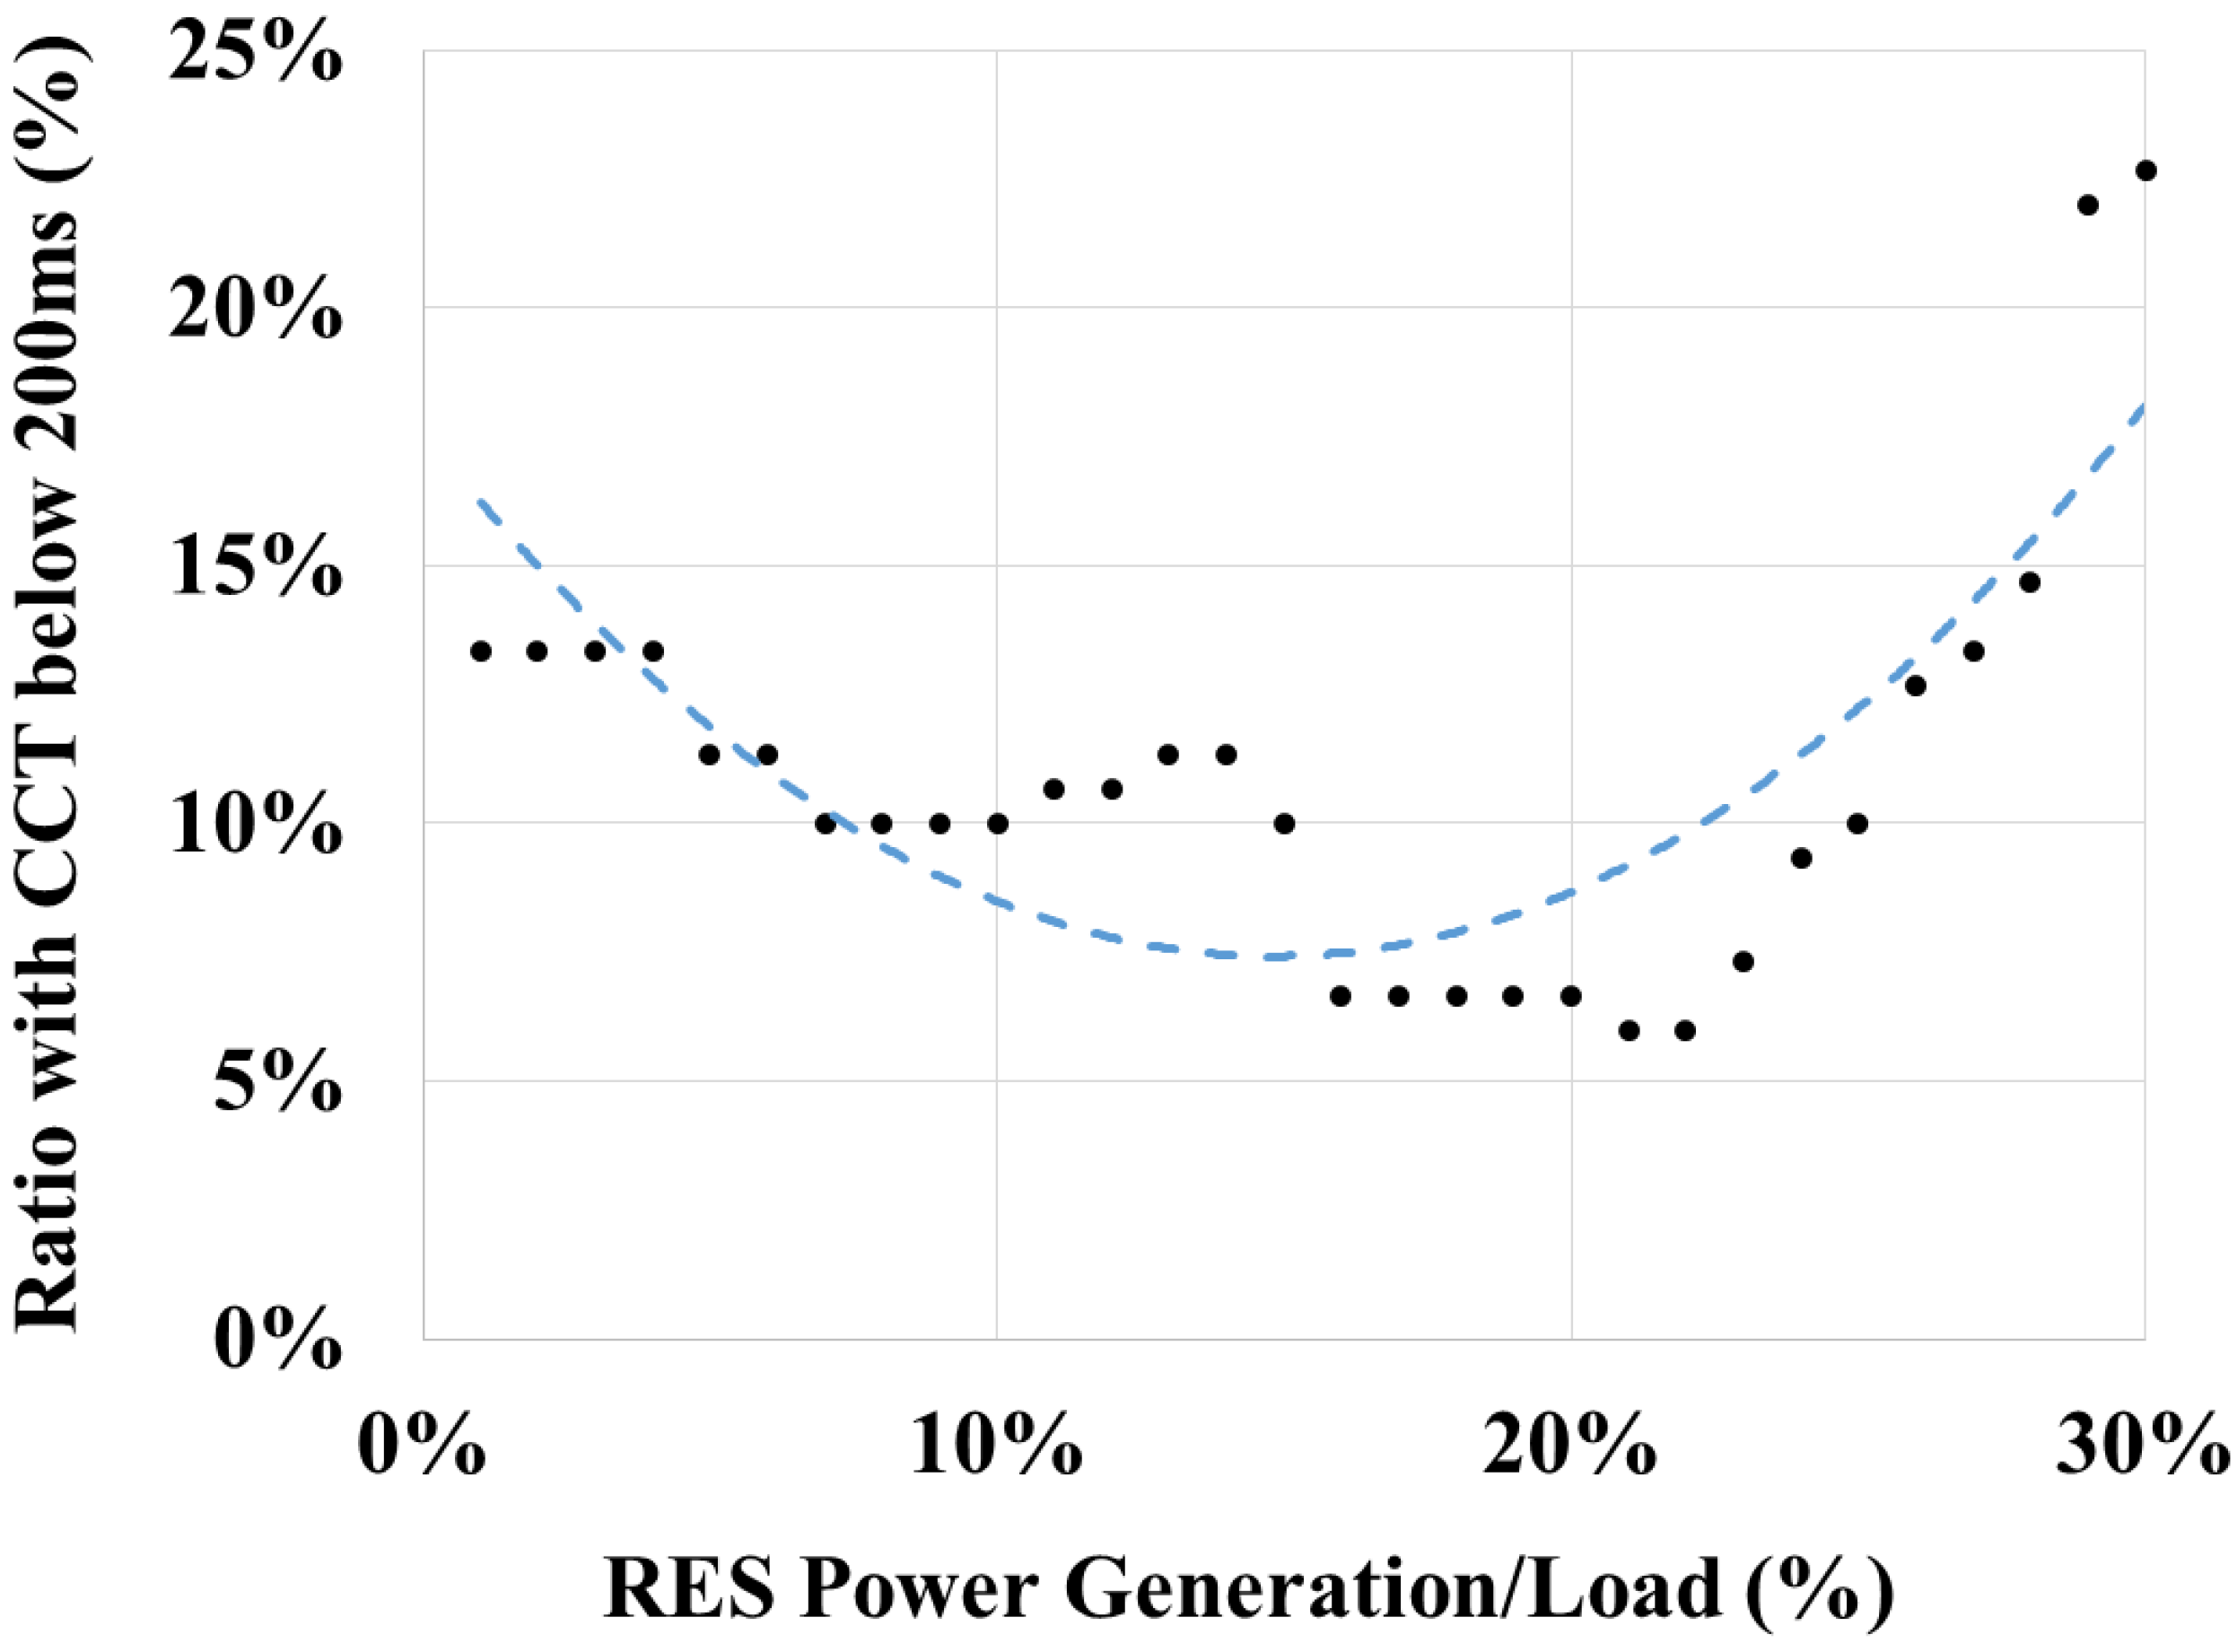
In conventional studies, a change in the transient stability was observed based on a number of contingencies with CCT that were less than the reference value. The number of contingencies smaller than the reference CCT value decreased initially, but increased abruptly subsequently. To observe the changes of the transient characteristics of the Korean electric power system based on the penetration of the RES, the number of contingencies with CCT values smaller than the reference CCT was estimated. The applied reference CCT value was 200 ms.
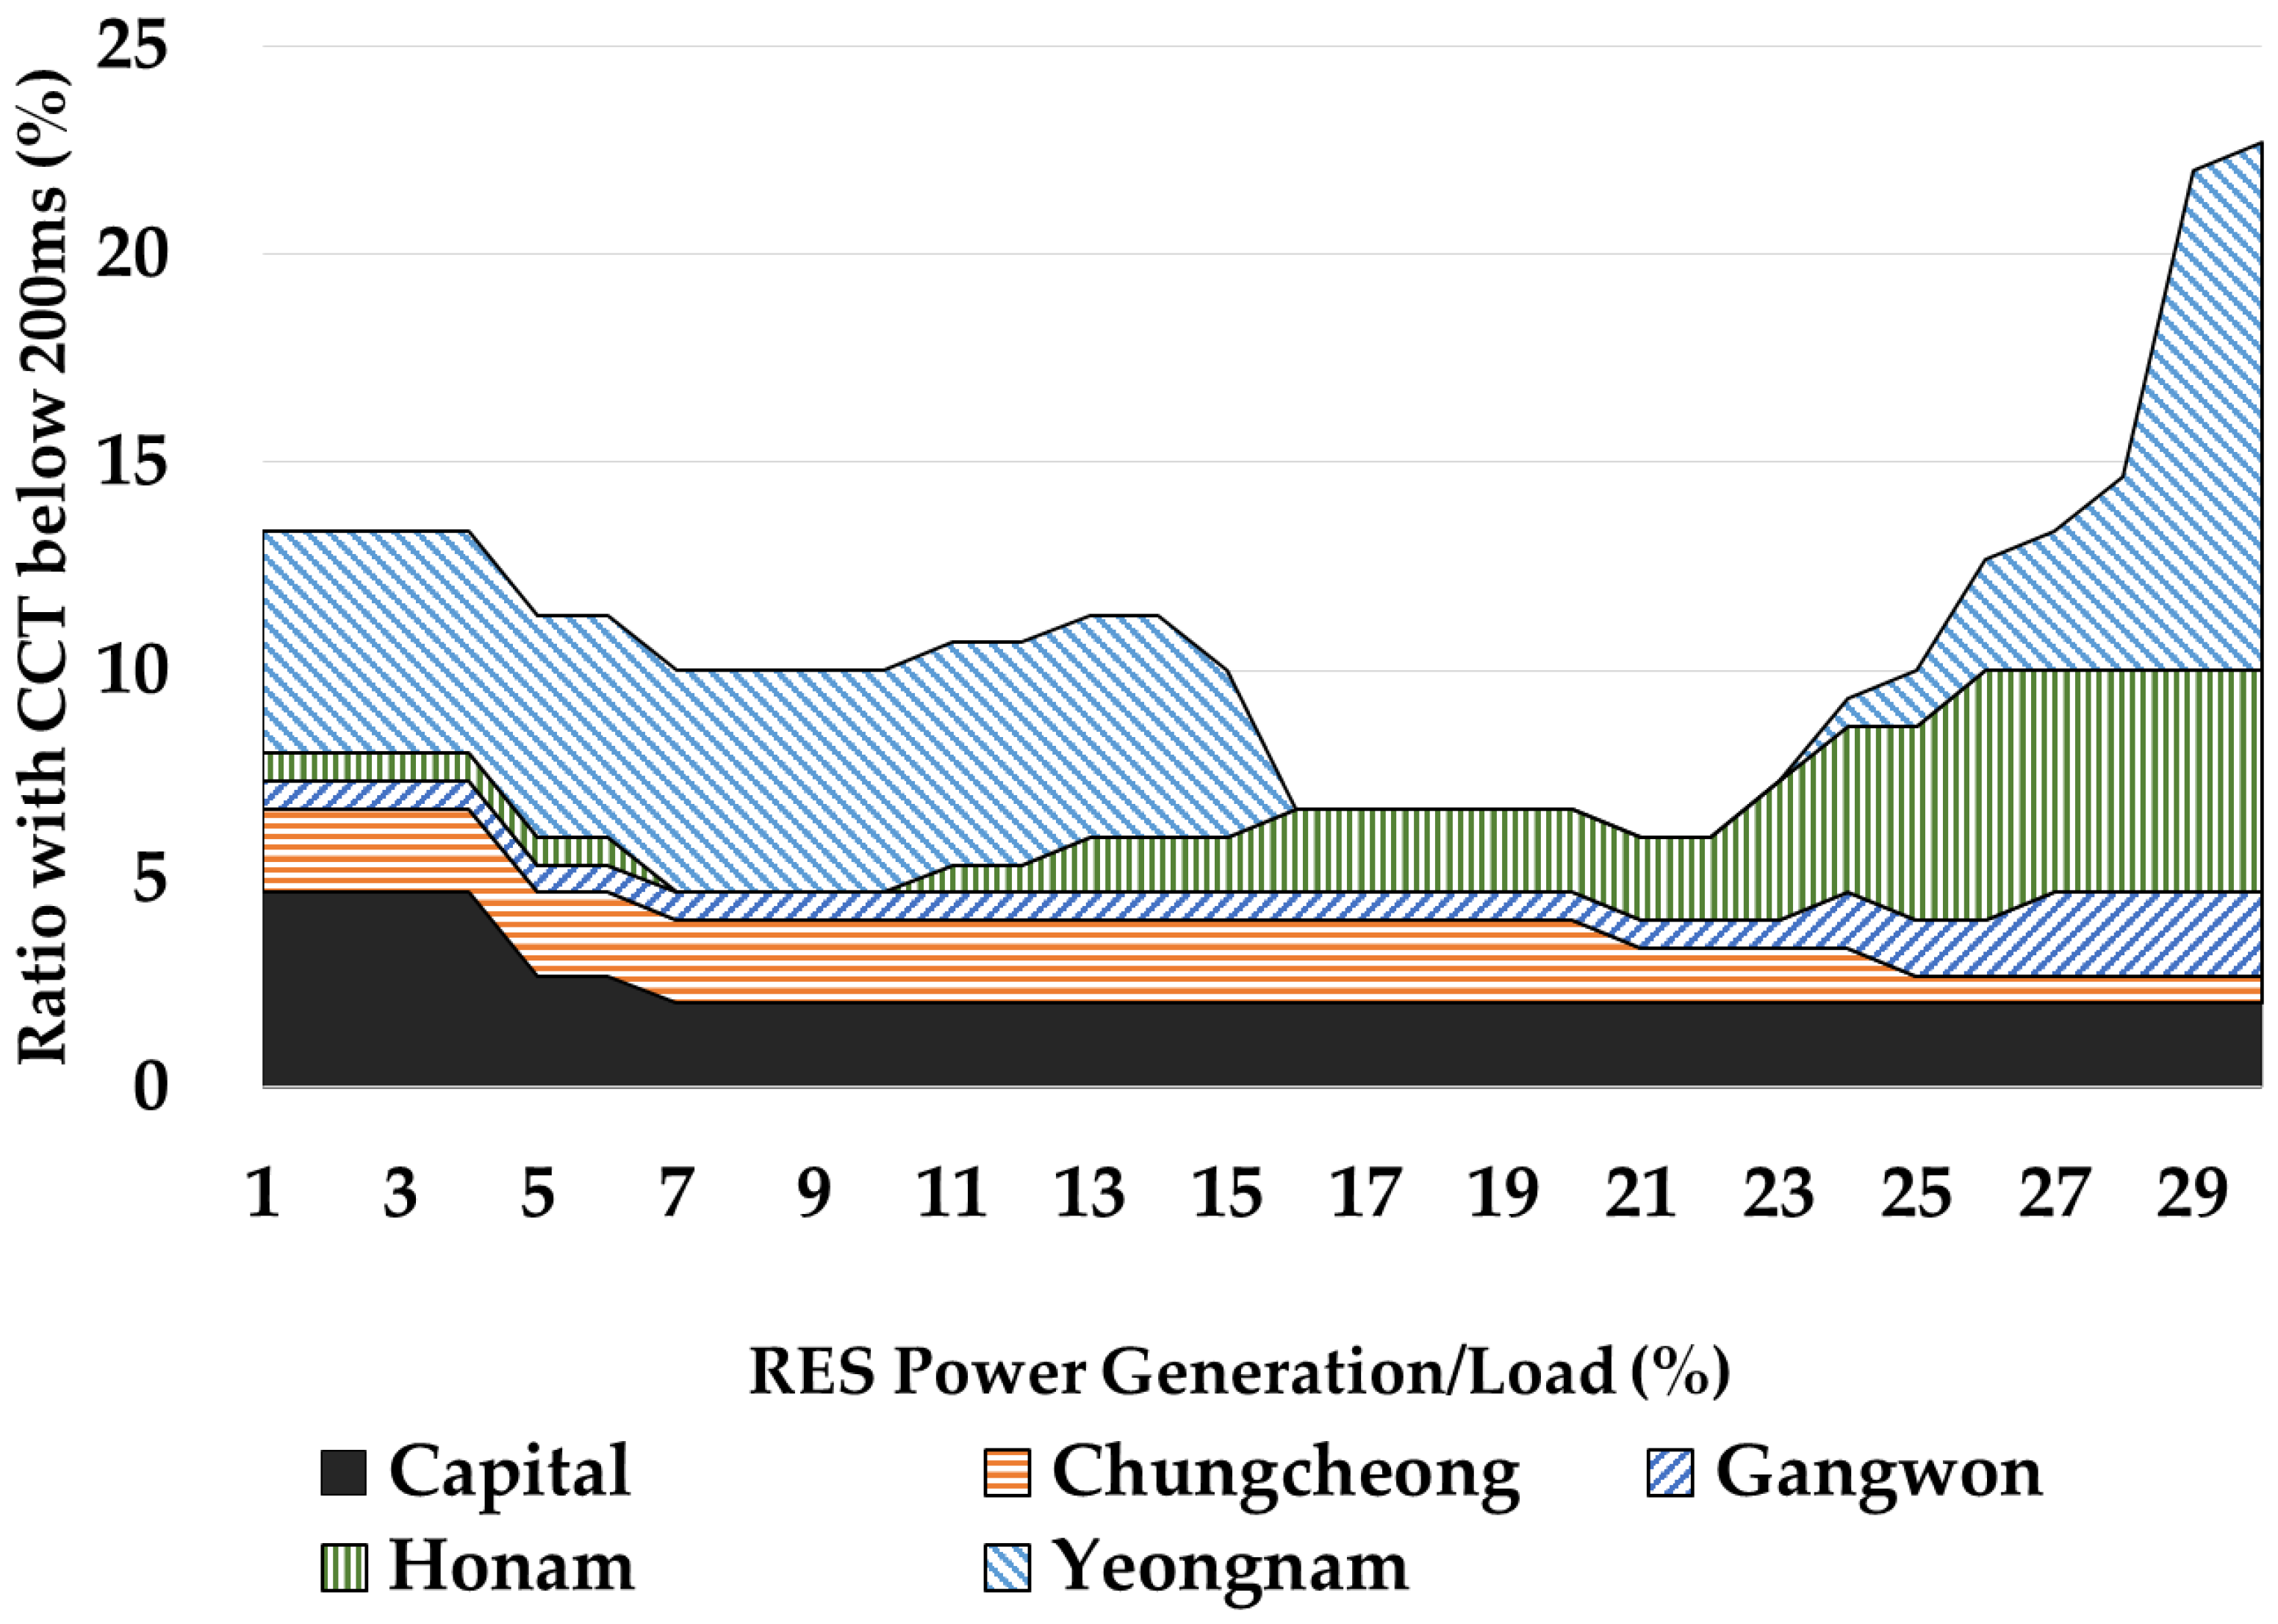
Figure 6 and
Figure 7 shows the proportion of contingencies with CCT values less than 200 ms according to the penetration of RES and the studied geographical areas. Similar to the existing research results, the proportion of contingency tends to decrease in the section where the penetration of RES is small. As shown, this tendency is reverses when the RES penetration increases more than 20 GW. Subsequently, the proportion of contingencies with CCT less than 200 ms increases abruptly as the RES penetration increases.
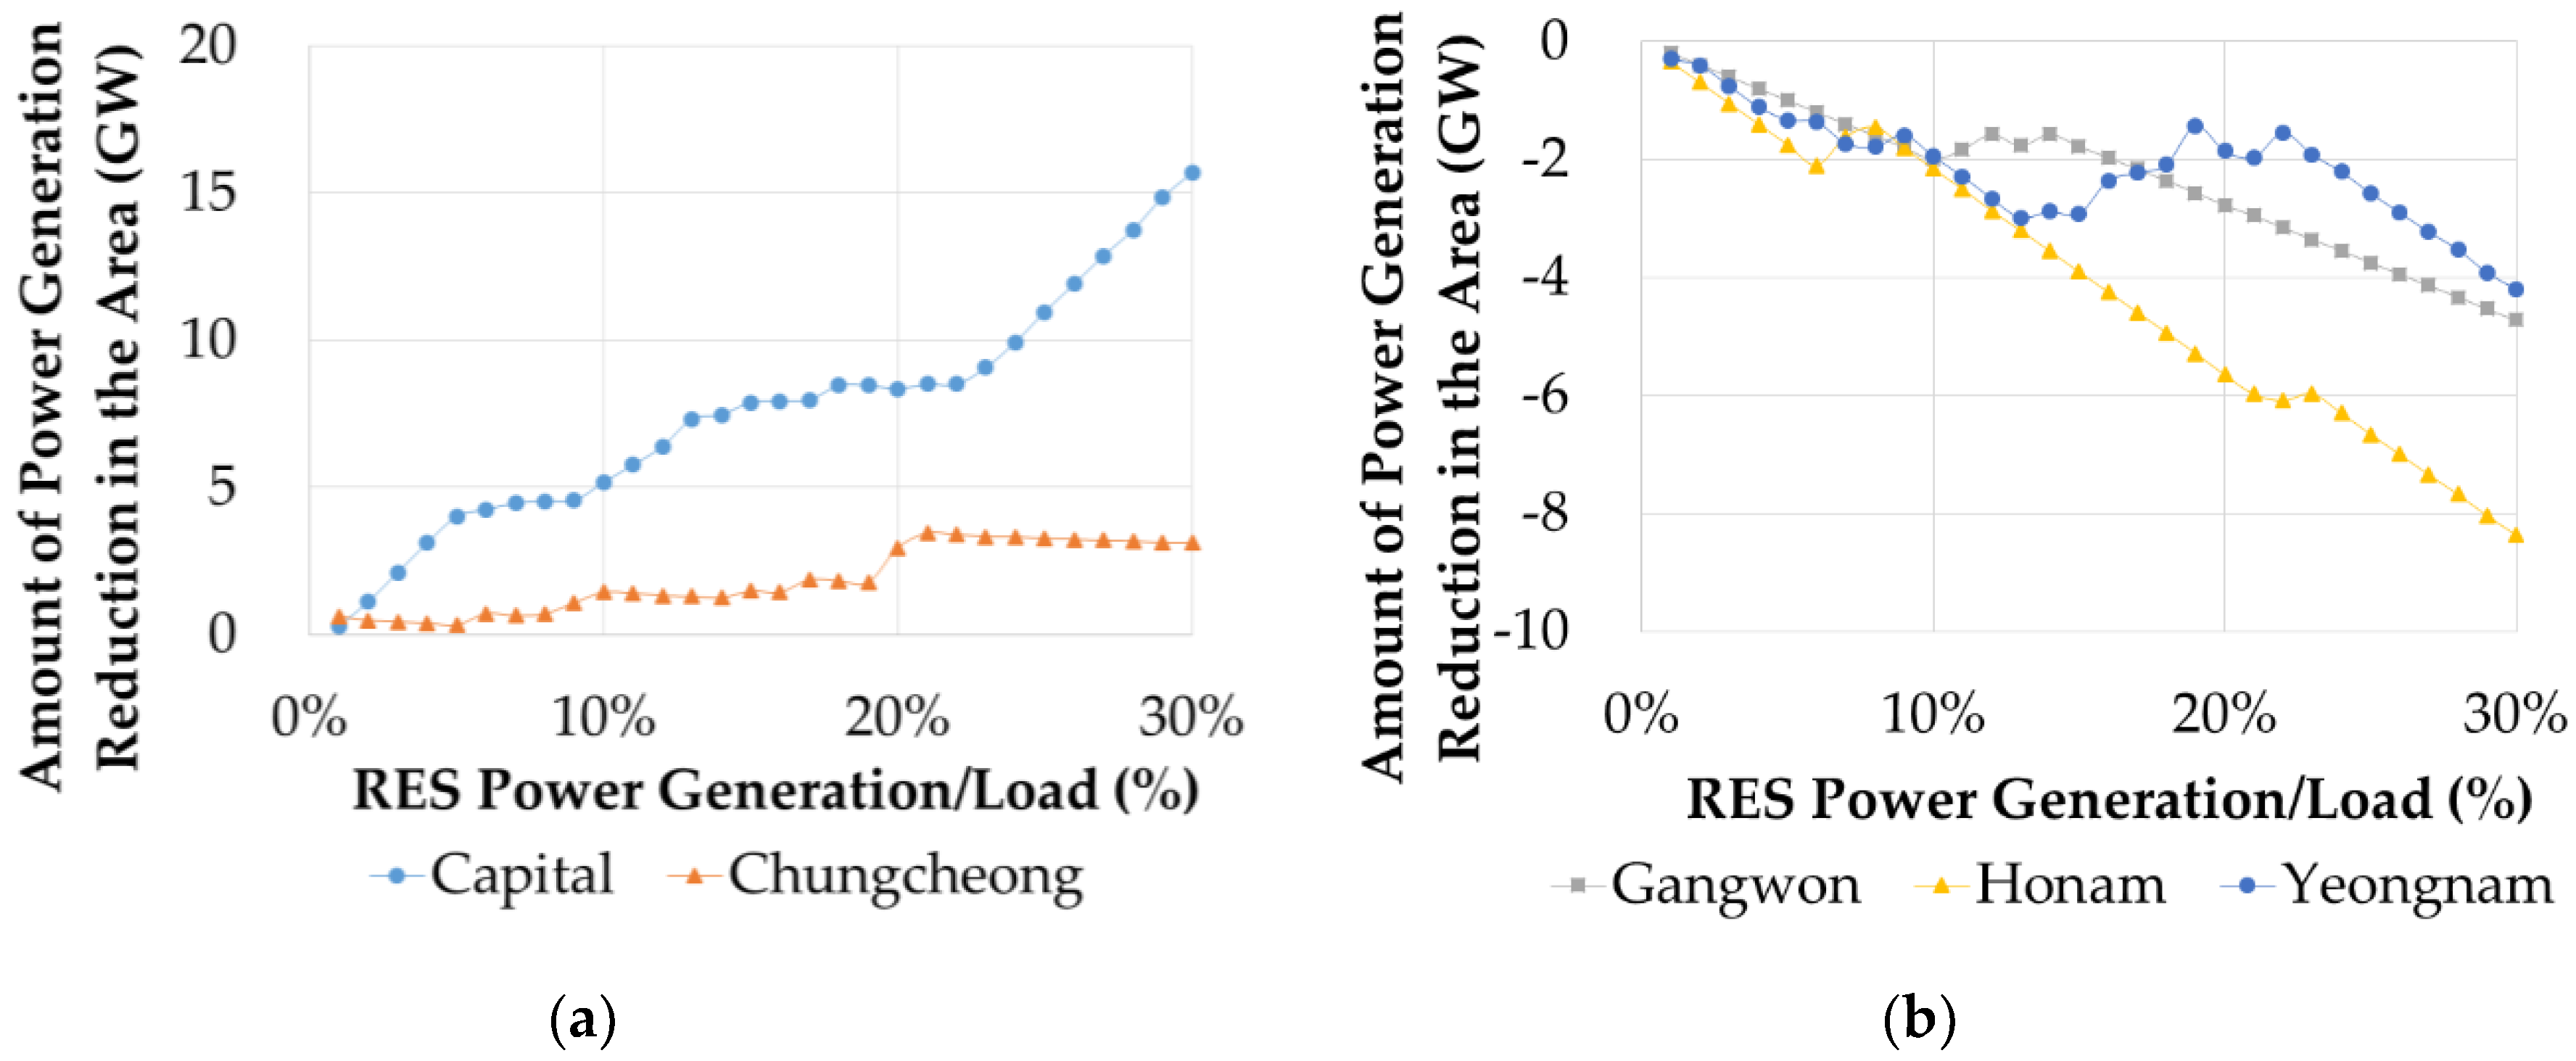
Figure 8 shows the decreases of the amounts of power generation in each geographical area according to the penetration of the RES. As shown, the amount of power generation decreases in the cases of the Capital and Chungcheong areas. Conversely, the amount of power generation increases in the cases of the areas of Gangwon, Honam, and Yeongnam. These outcomes considered the power generation amounts of the RES. In view of these results, it can be confirmed that imbalances of regional supply and demand occur based on the penetration of RES.
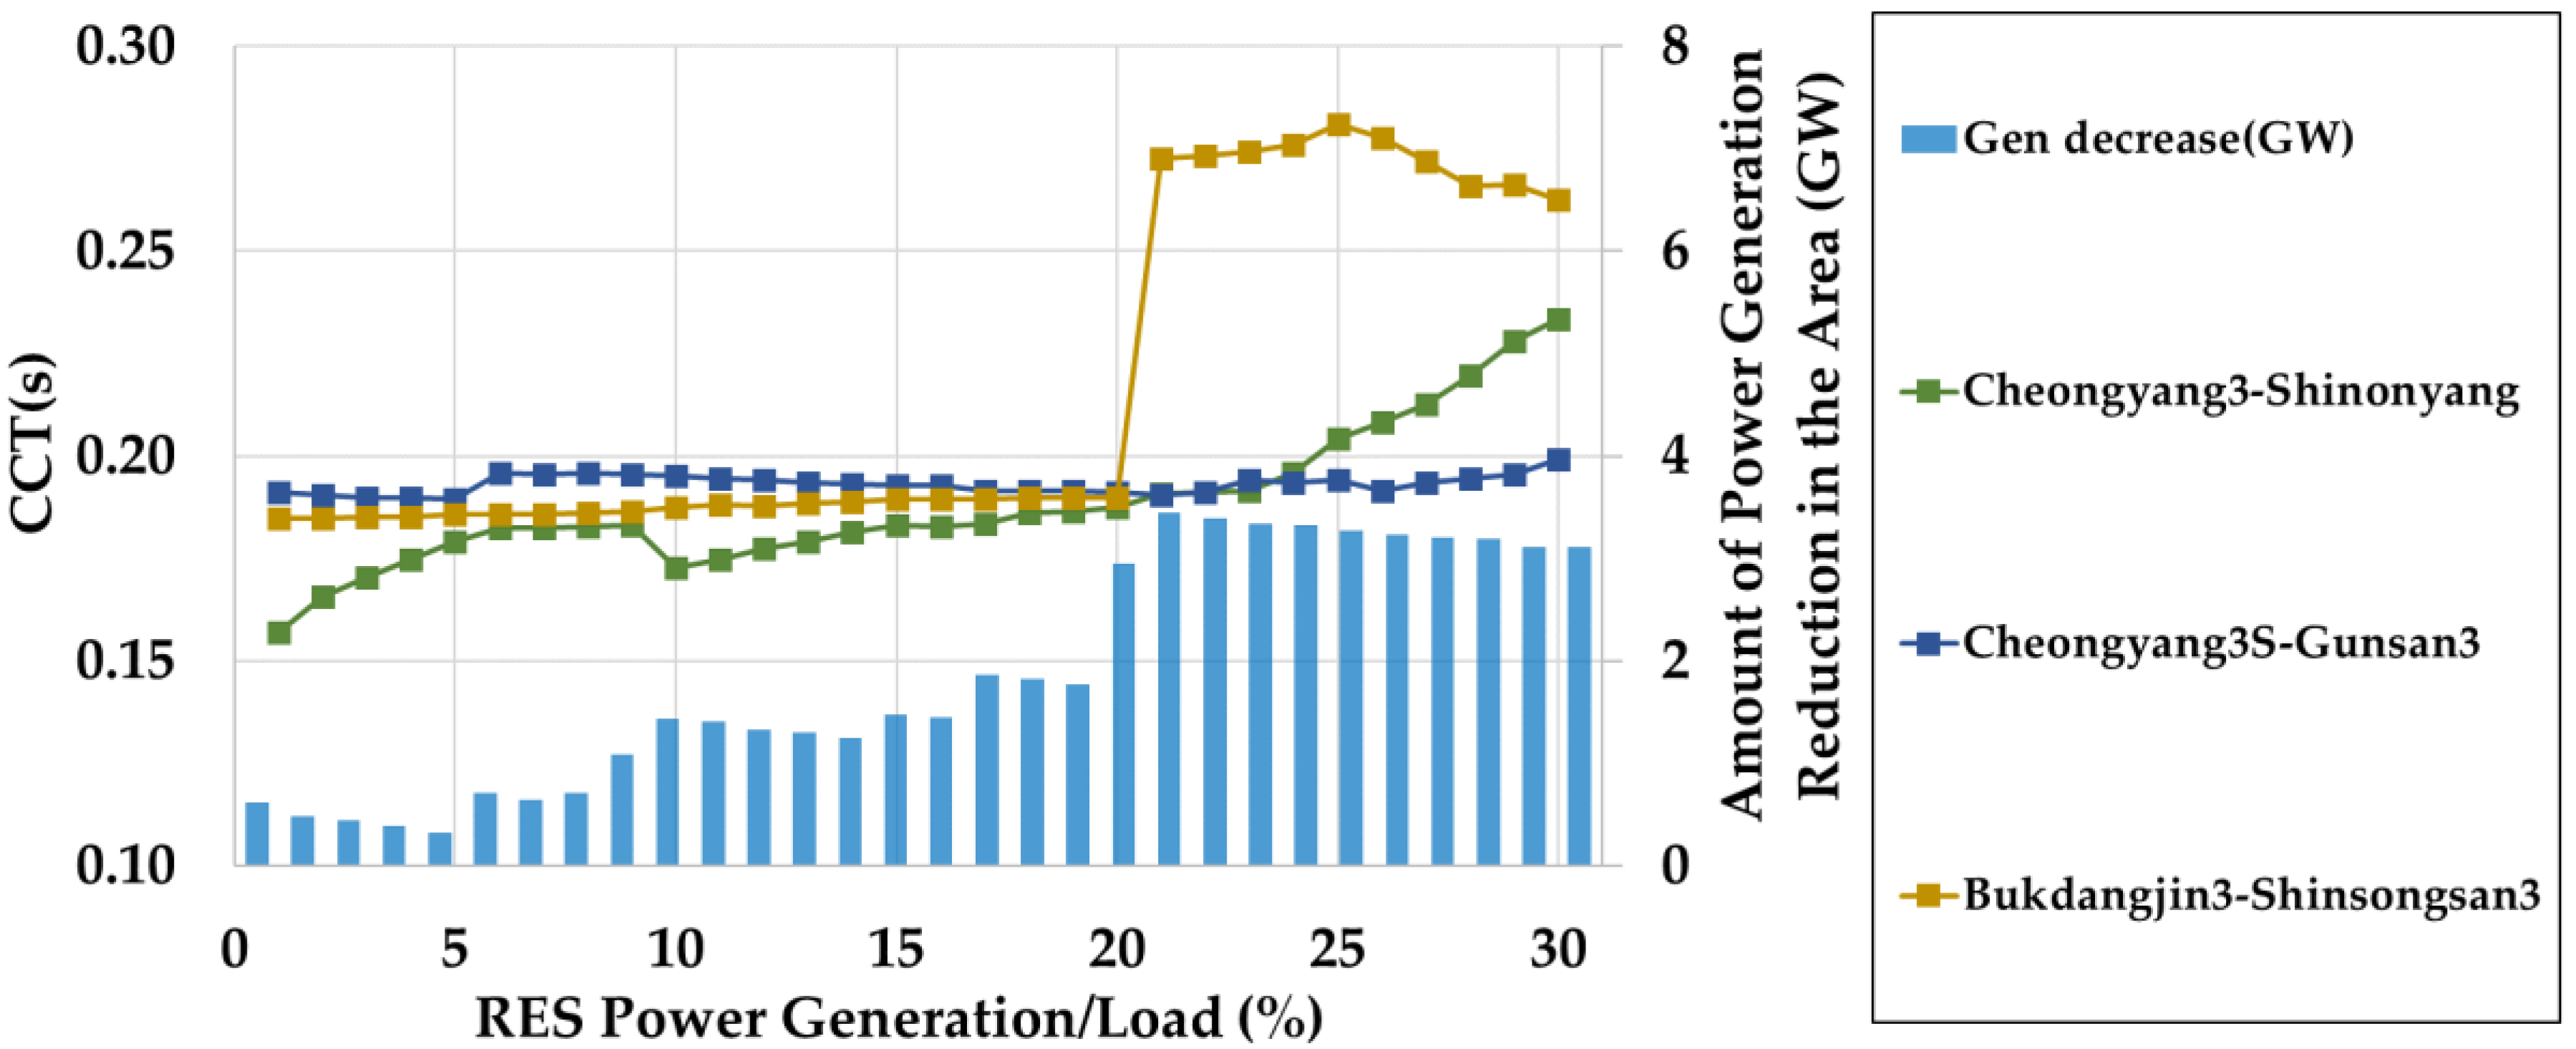
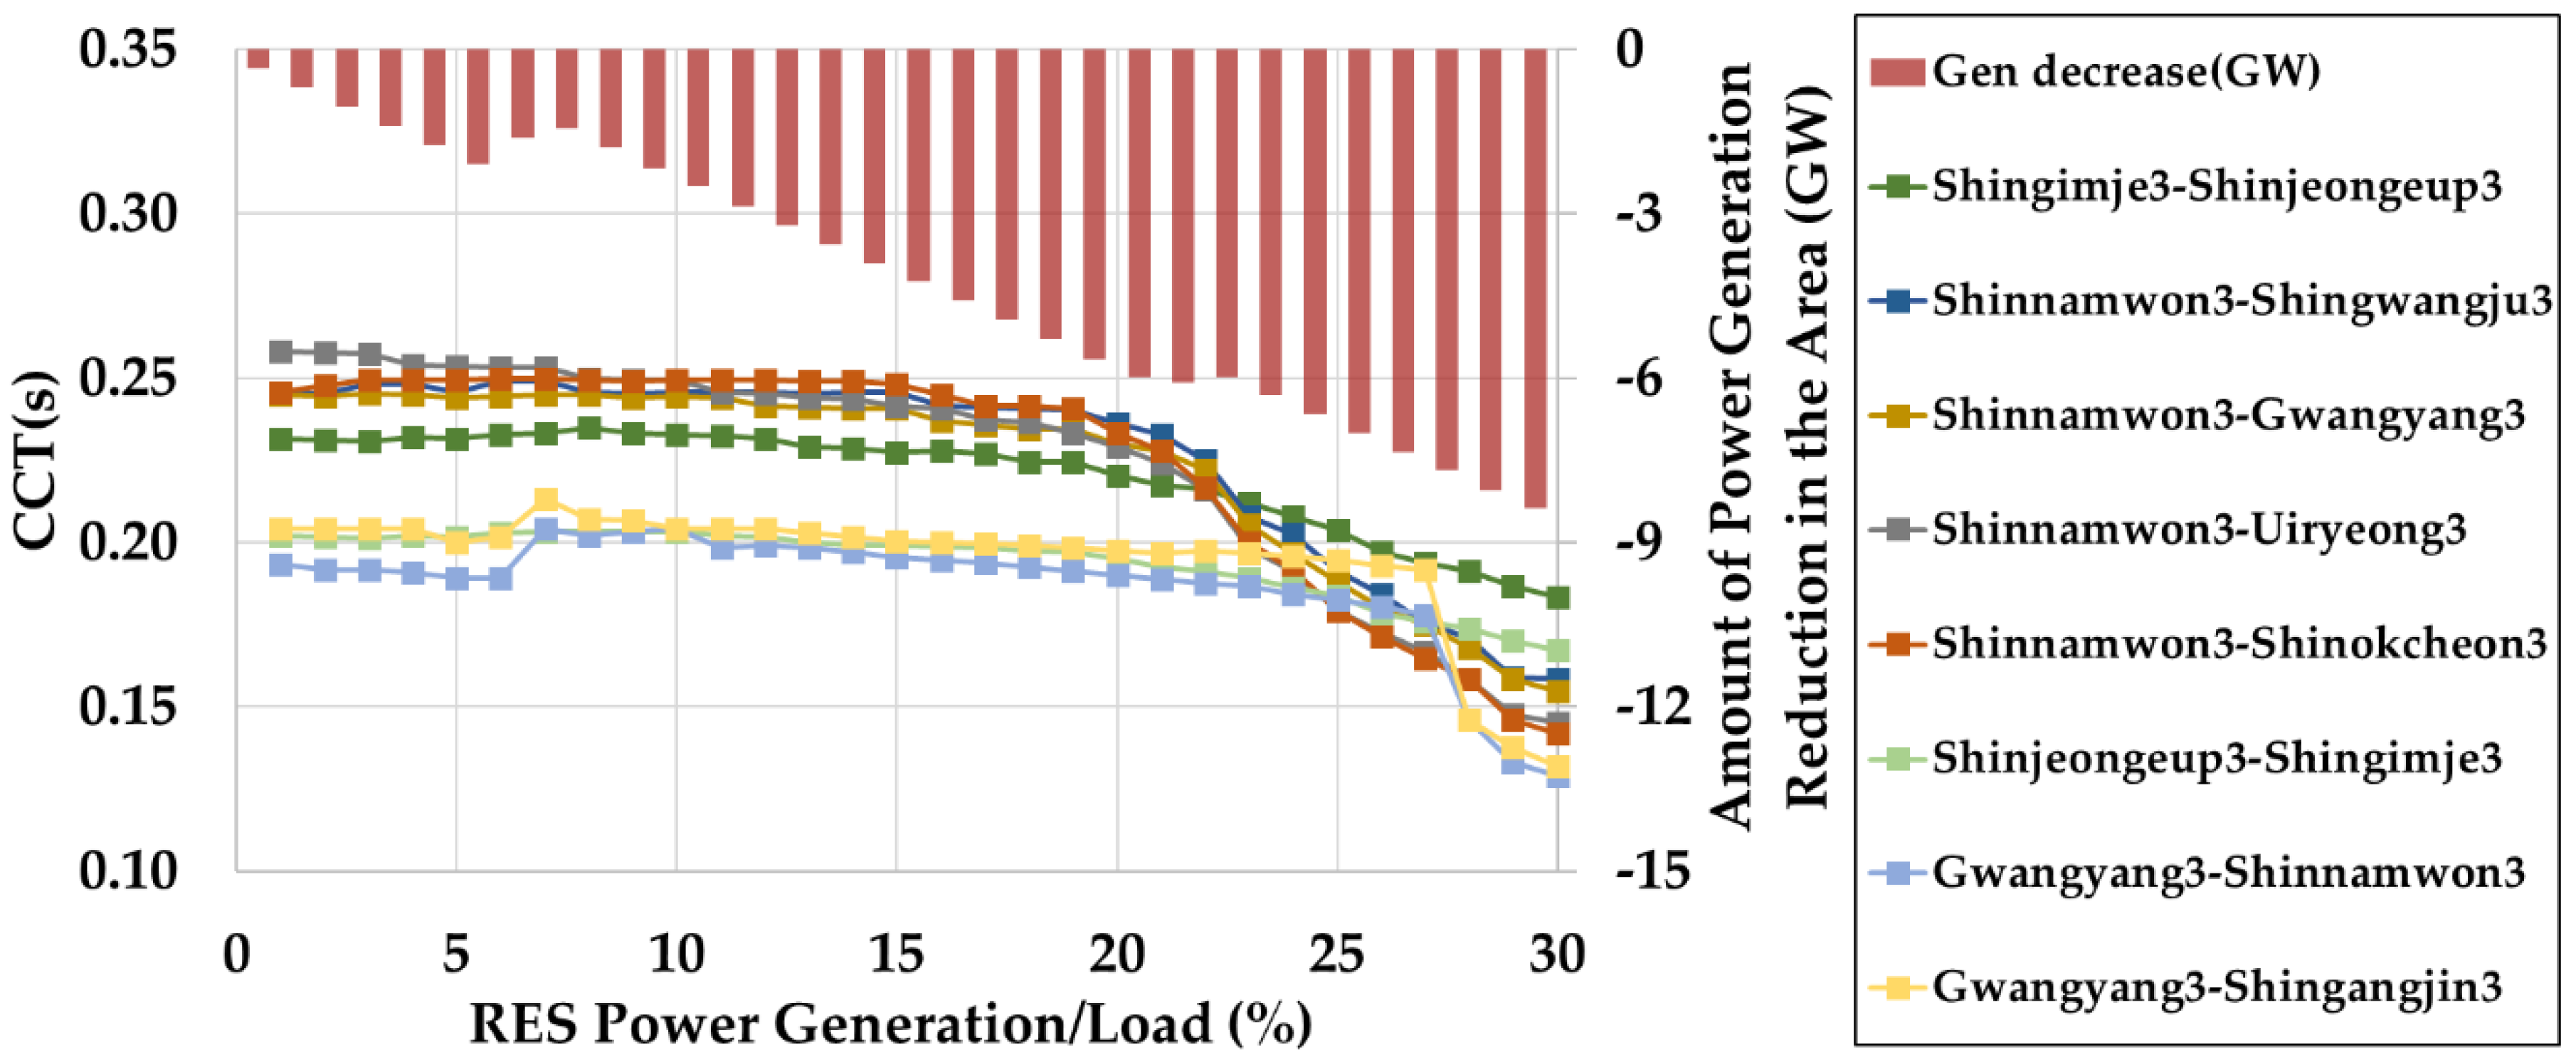
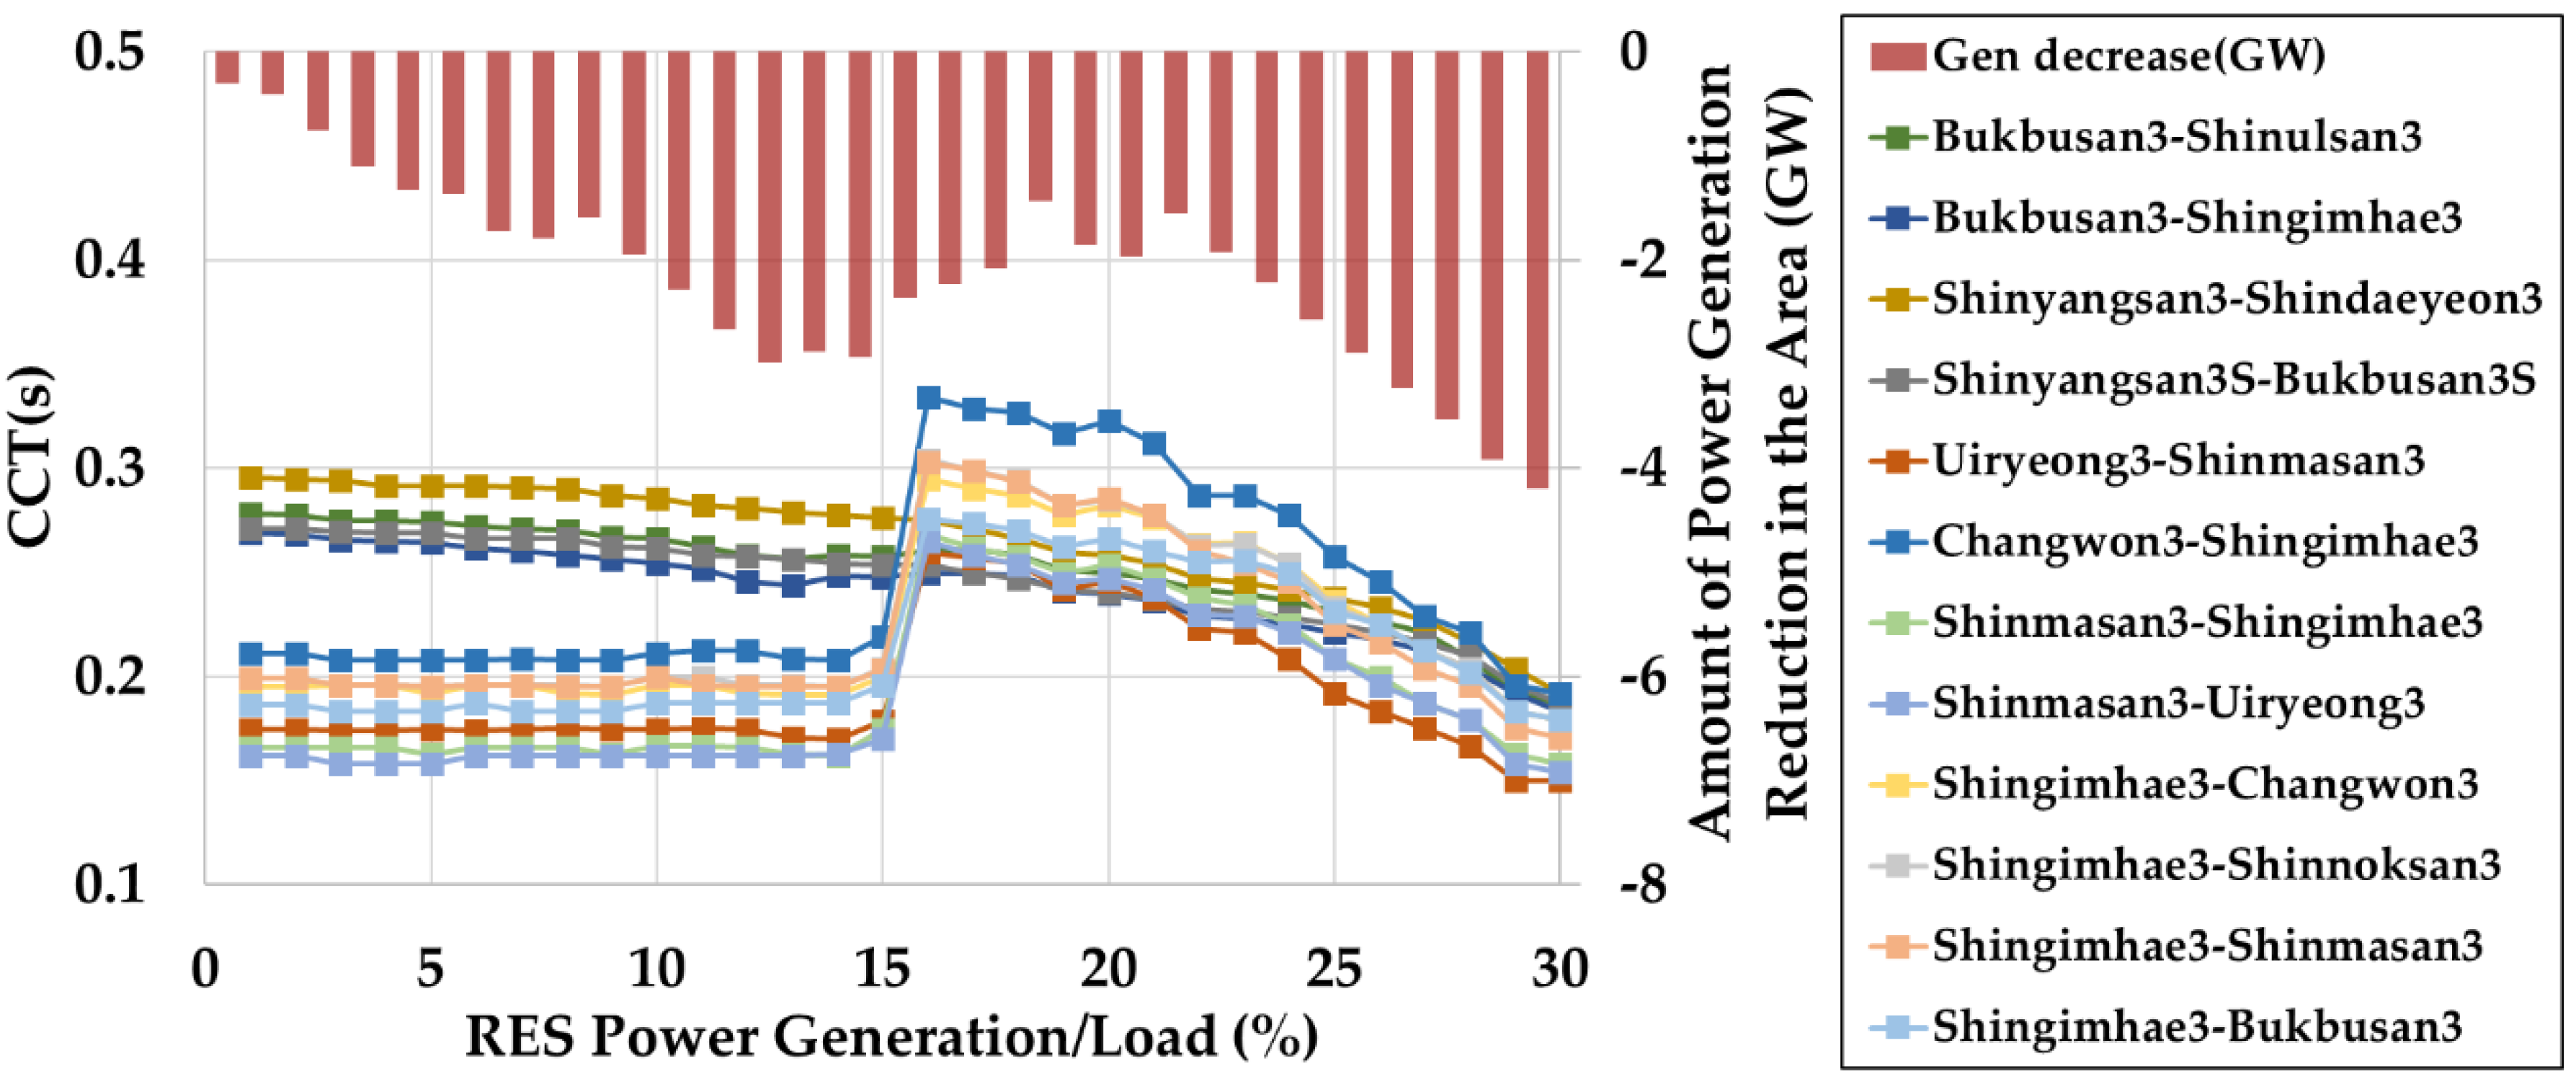
In the cases of the Capital and Chungcheong areas, the rates of the contingencies were sustainably reduced. This is consistent with the decreasing tendency in the power generation within the area. Conversely, in the case of the areas which is power generation decreased, and with the exception of the Gangwon area, the ratio tends to increase after the temporary decrease. This is similar to the decreasing trend in power generation within the area. An area that elicits a significant change as a function of the RES penetration is the Yeongnam area, whereby the change of power generation is large. It can be observed that the rate rapidly increases in the 15 to 20 GW section where the power generation in the respective areas decreases. In order to observe these trends in detail, changes in CCT and power generation in some areas are observed. These areas are Chungcheong, Honam, and Yeongnam. The Chungcheong area has large-scale power generation complexes, but the area’s power generation is reduced due to RES penetration. The Honam is the area where the generator is less than the load in the area. The Yeongnam area is a place where supply and demand are balanced, and there are generators with high generation cost.
Figure 9,
Figure 10 and
Figure 11 show the respective changes in the power generation amounts and CCT values in the areas of Chungcheong, Honam, and Yeongnam. It can be confirmed that the decreasing tendency of the power generation in the respective areas and the changes in the CCT tend to be similar based on these graphs. This indicates that the imbalance in the local supply and demand owing to the penetration of RES is the main cause of the change in the transient characteristics. In the case of the Chungcheong area, the amount of power generation in this area sharply decreases at 20 GW. As a result, the CCT value in the vicinity of this point also tends to increase. A similar phenomenon is observed at a power of 7 GW, even in the Honam area. In the case of the area of Yeongnam, this kind of influence is also observed. In the case of the Yeongnam area, the amount of power generation in the area increases for an RES penetration in the range of 0 to 15 GW. For RES penetrations in the range of 15 to 20 GW, the amount of power generation in the area decreases. Subsequently, the amount of power generation in the area increases again. As the power generation in the area increases, the CCT values in that area exhibits a continually decreasing trend, despite their small magnitude. However, the CCT value shows a rapidly increasing tendency for RES penetrations in the range of 15 to 20 GW. Subsequently, the CCT decreases according to the increase of the RES penetration.
It can be confirmed based on the conducted case study that the changes in the regional power generation owing to the RES penetration and transient stability are closely related. Generally, if the RES output within the area increases, the CCT tends to decline overall. Conversely, stopping the operation of the conventional generator is a factor that causes the CCT value to increase. However, the effect of the termination of the operation of the conventional generator is limited by the contingency that is affected by that generator. In addition, in the case of the RES penetration, its influences on the CCT values are observed within the entire area since it is constructed in a form that allows even distribution within the area. Analysis of the transient impact of the RES penetration based on the conducted case study confirmed that the variations in the power generation within the area can constitute distinct observation points.
5. Conclusions
The expansion of RES in future power systems constitutes an inevitable trend. To this present day, the capacity of the RES has been relatively small, which has not disturbed the stability of the power system. In addition, if the project is a large scale, the input location is determined in a manner similar to that for conventional generators. However, it is expected that in the future, RESs will be installed in the low-voltage grid as distributed power sources. Therefore, an analysis is necessary on the impact of the RES penetration in the future planning of the power system.
This study analyzed the impact of the expansion of RES penetration in the future Korean electric power system based on the transient characteristics, and analyzed the causes of such changes. To understand the changes of the transient characteristics elicited by the penetration of the RESs, the method to reflect RES to the SIME configuration is provided. Based on the modified method, the impact of the RES penetration was explained. It can be confirmed that the reduction of the conventional generation in the SIME configuration was contributed to the transient stabilization of the system. Conversely, the penetration of RESs adversely affected the transient stability of the system. Especially, it is confirmed that transient stability is improved when the conventional generator replaced with RES. Based on these facts, it was estimated that the transient characteristics worsened in the case where the regional power generation increased in accordance to the RES penetration. Conversely, in the area where the power generation within the area decreased, it was estimated that the transient characteristics improved.
The simulation was conducted in the Korean electric power system for the year 2030. A number of the contingency which has smaller CCT than 200 ms decrease when the RES penetration is small. At some point, however, the number of contingencies increases with increasing RES penetration. This phenomenon also observed in the previous Irish case. To confirm the major factors of the transient impact, a number of the contingencies and the change of power generation were observed by each area. By a result, it is confirmed that the number of contingencies and the regional power generation are related closely.


