A Framework for Empirical Assessment of Agricultural Sustainability: The Case of Iran

Abstract
:1. Introduction
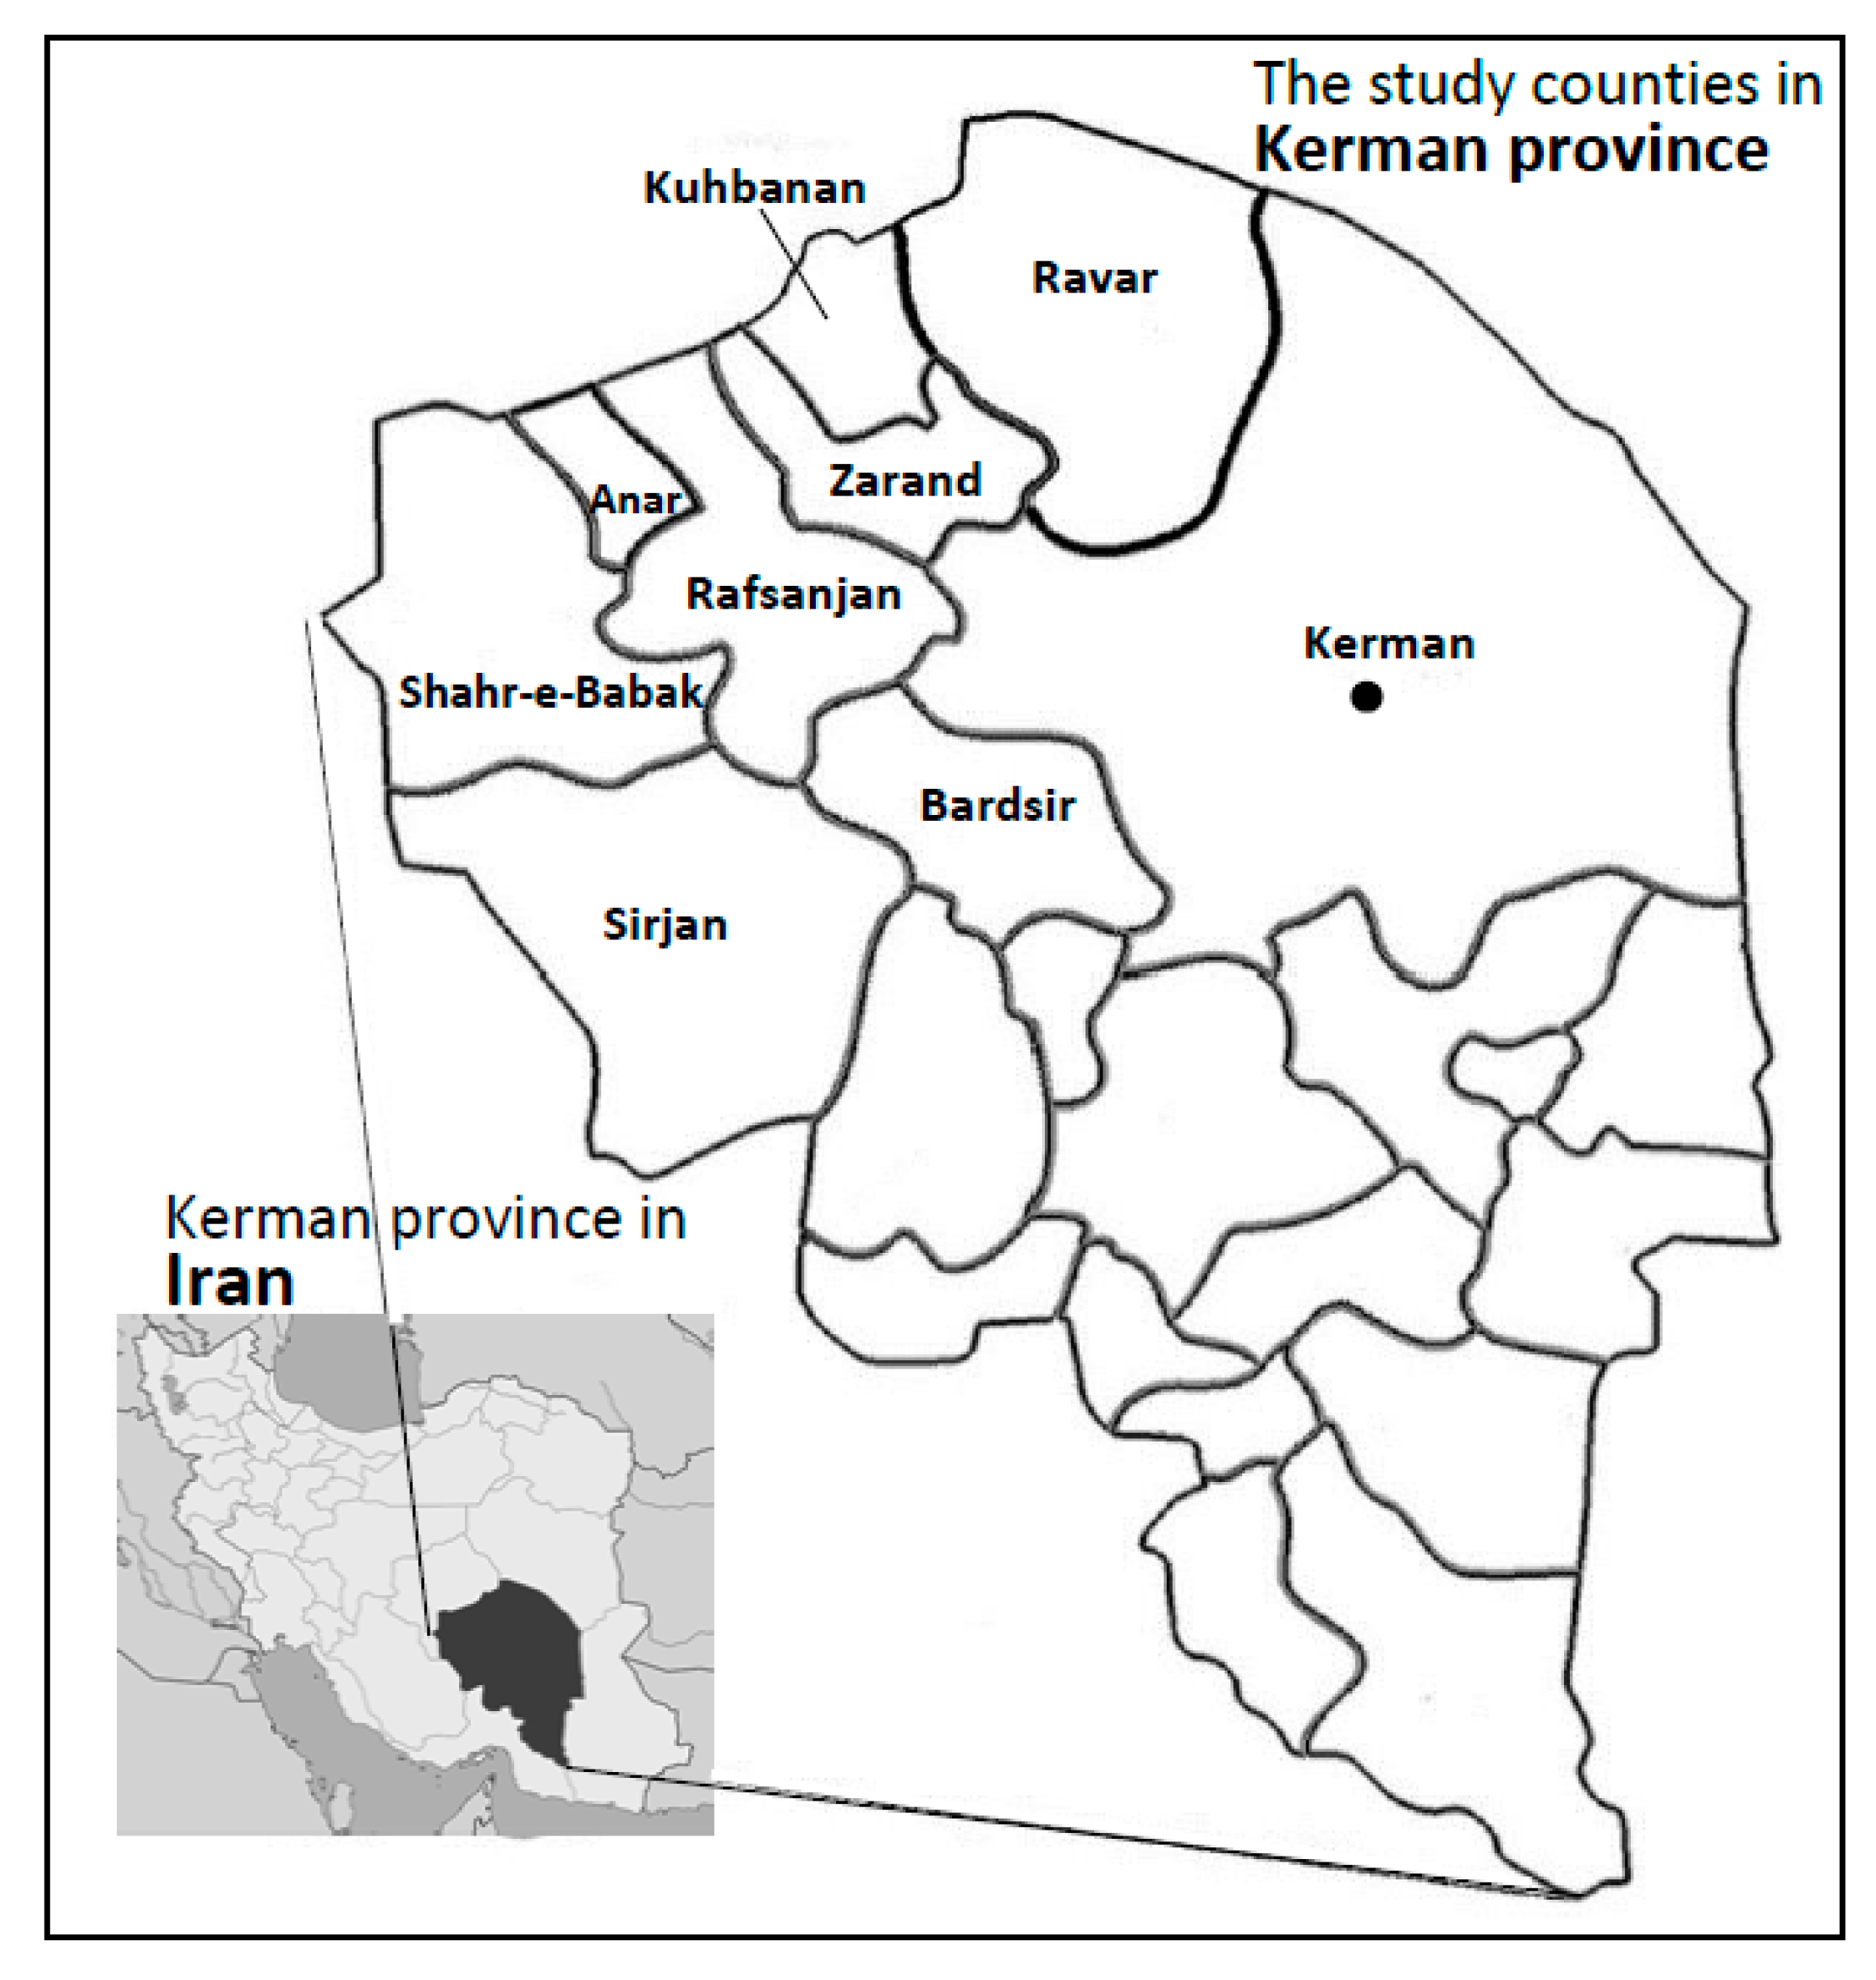
2. Case Study
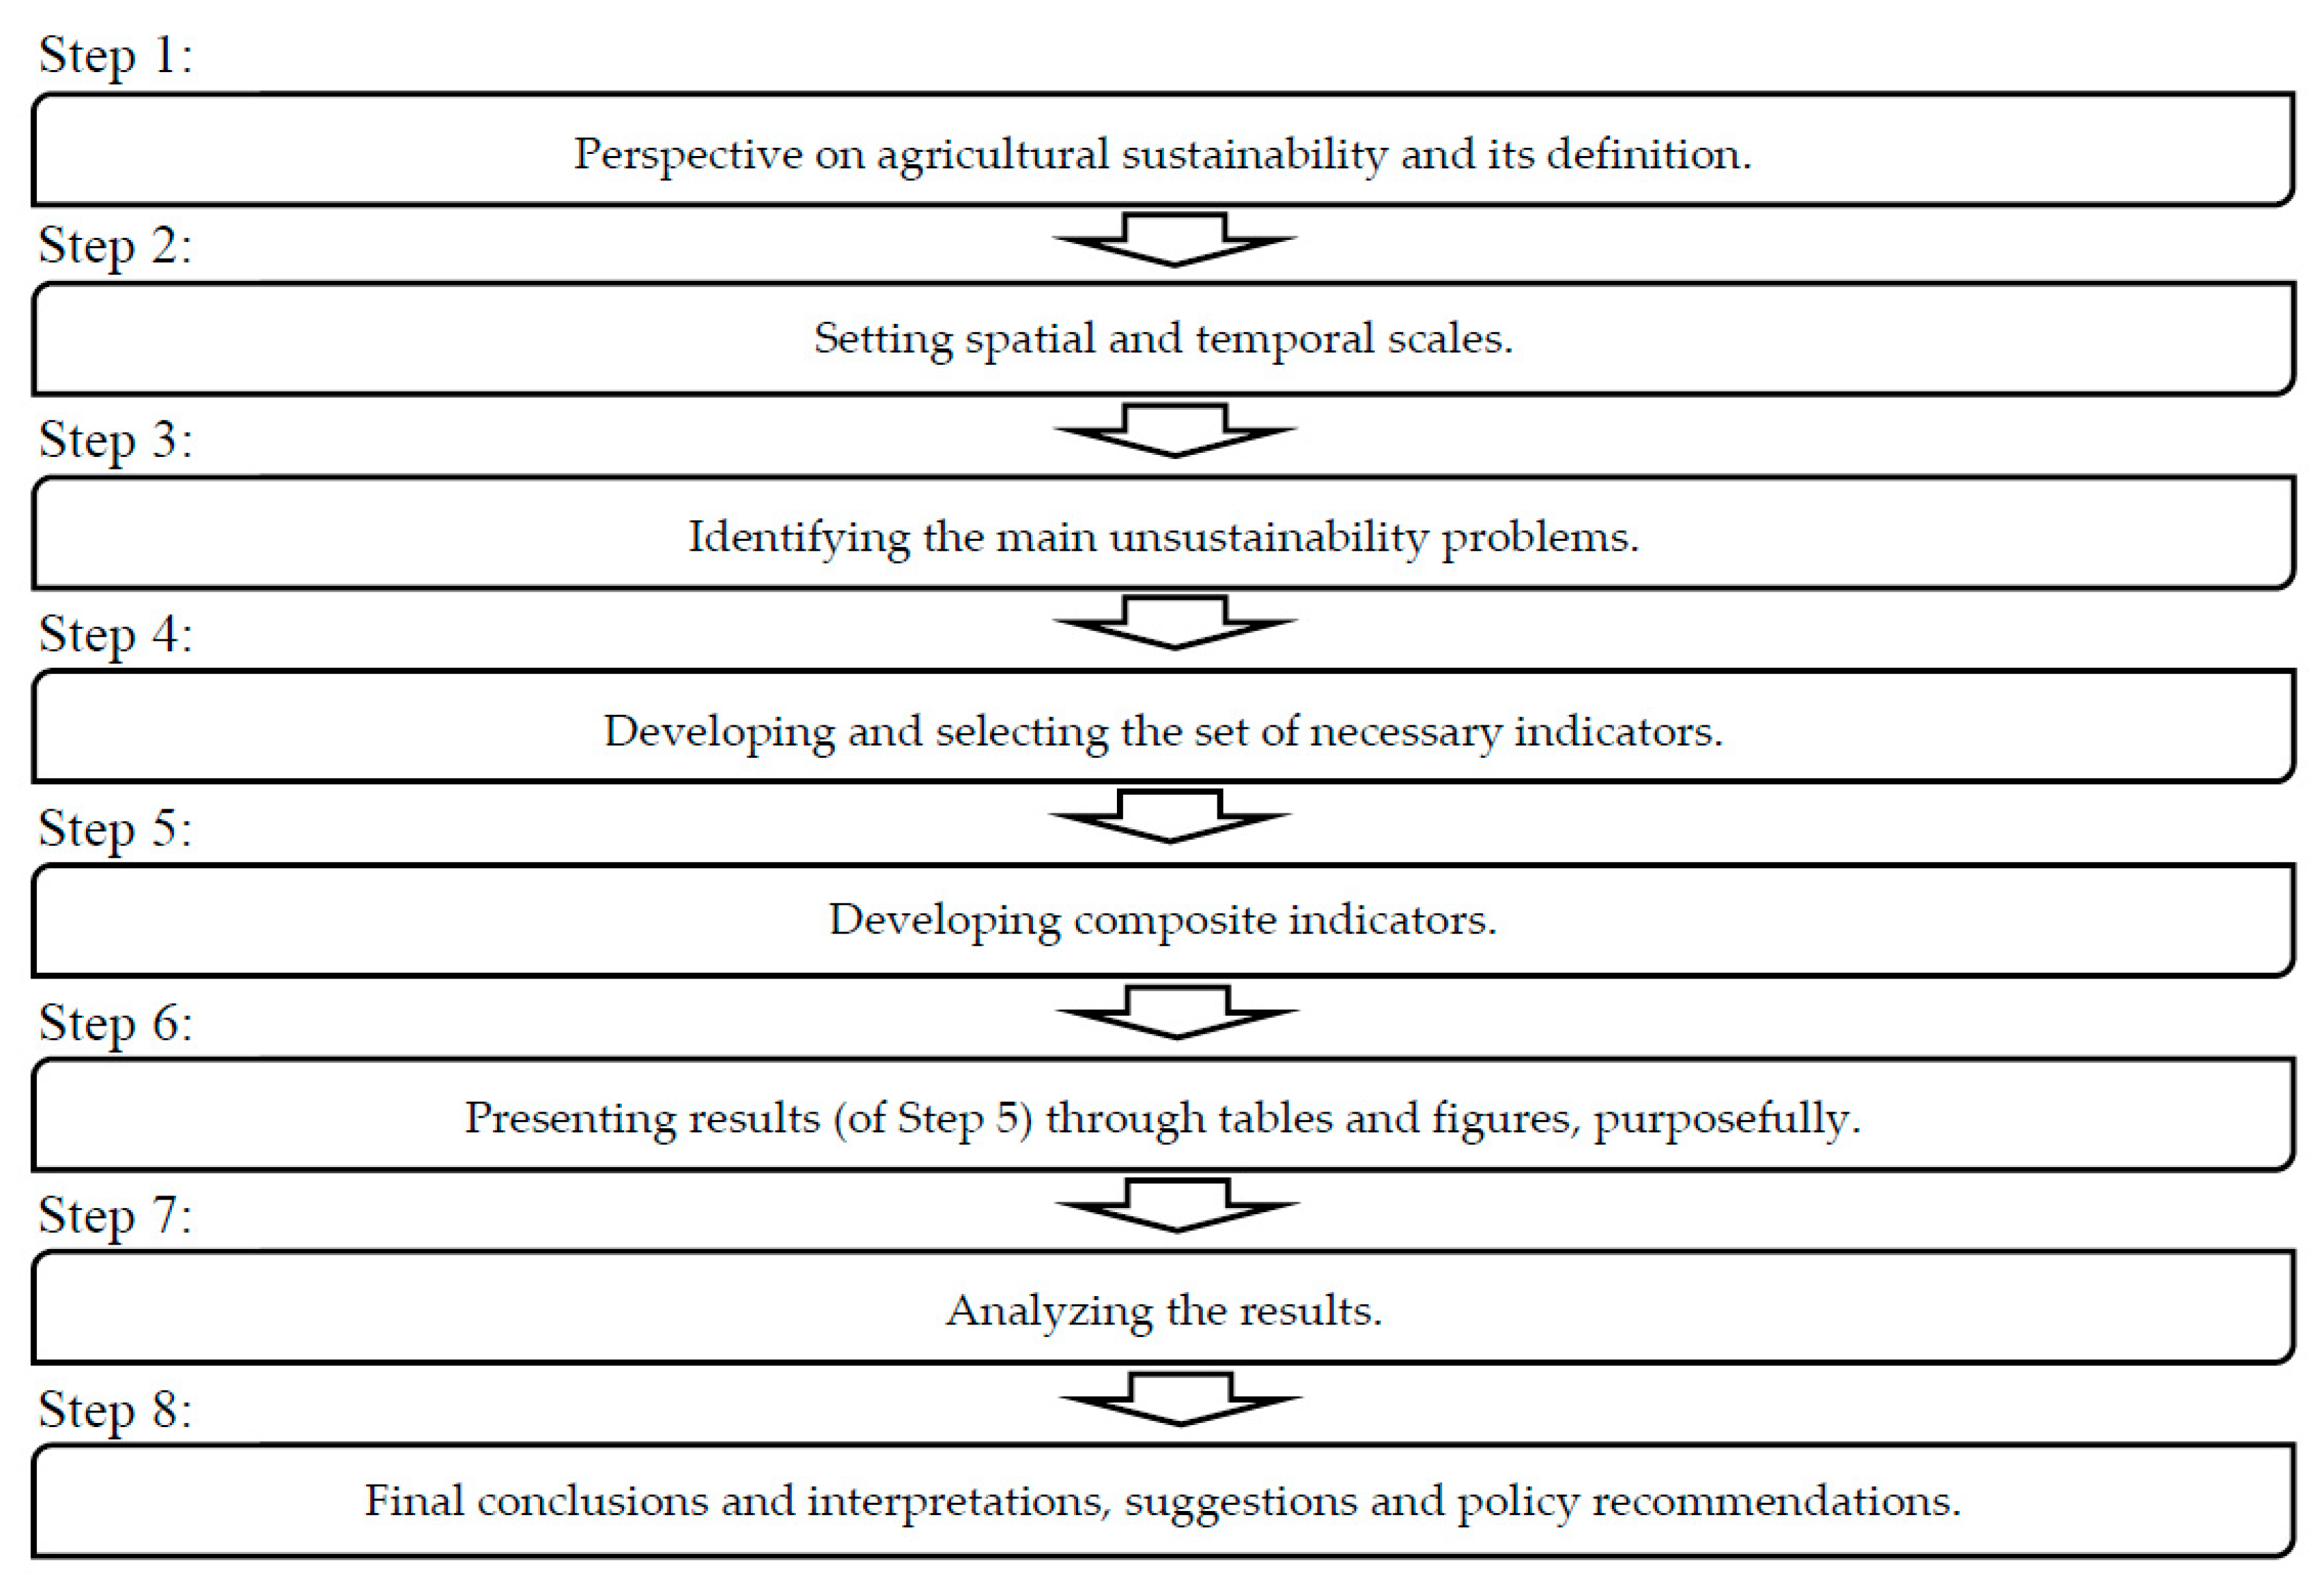
3. Methodology
3.1. Step 1: Perspective on Agricultural Sustainability and its Definition
3.2. Step 2: Setting Spatial and Temporal Scales (Social Construct)
3.3. Step 3: Identifying the Main Unsustainability Problems
3.4. Step 4: Developing and Selecting the Set of Necessary Indicators
- Consider all the indicators together as a set so that, firstly, its indicators do not represent identical and repeated effects; secondly, reflect all aspects of the underlying unsustainability problems identified in the previous step (i.e., Step 3).
3.4.1. Status Indicators
- Farm income: Iranian Rials per farm are a measure of the income and profitability of agricultural activity of producers and the financial viability/survival of the farmer’s household. It can also reflect the farmer’s capacity to invest in the farm.
- Insurance: The percentage of agricultural land under insurance is an indicator of minimizing the risk and income instability of farmers.
- Food self-sufficiency: This is a measure of the food security of the agricultural household resulting from the production of adequate food by subsistence farming or the ability to buy food. The percentage of 0.5 hectares and larger farms was used as a proxy.
- Discriminatory employment: The percentage of male and female farmer’s wage differential is a form of gender inequality in agriculture in the community, which shows social justice and the distribution of people’s income in the agriculture sector and its role in society. It can also indicate the trend of (positive or negative) changes in social justice among farmers and society over time.
- Crop productivity: It is measured as the physical yield of the major (kg/ha) and represents the efficiency of land use, which can indicate changes in production system technology and sustainability of agricultural productivity over time.
- Access to extension services: The number (N) of agricultural extension and services’ centers per ten thousand farms was used as a proxy for the level of access to extension services. This indicator is both a right and a kind of justice in the agricultural community, which is the basis for increasing knowledge, production and social-economic well-being that maintains and improves social justice in the society over time.
- Groundwater depletion: This is measured through the total annual depletion of deep, semi-deep wells, qanats (“It is a method of tapping groundwater without the use of lifting devices. By sinking a line of wells and then linking them with a gently sloping tunnel, the groundwater is brought from the higher ground until, after sometimes tens of kilometres, it reaches the surface to create what is, in effect, an artificial oasis (Lambton 1953)” [9] (p. 1612)) (or chain wells and dikes) and springs per hectare of agricultural land (m3/ha), which is a measure of the depletion of groundwater in agricultural lands and lowered water tables. Changes in this indicator over time reflect the changes in water resource management and its effect on the ability to maintain welfare in the future.
- Agrochemicals use: The amount of applied chemical fertilizers (kg/ha) in agricultural land, including total fertilizers nitrogen (urea + ammonium nitrate), phosphate (ammonium phosphate + triple superphosphate + superphosphate), and potassium (potassium sulfate + potassium chloride). This is a measure of the quantitative and qualitative degradation of agricultural land, due to the lack of protection in agricultural activity, which can also have adverse effects on the well-being of farmers and the society through pollution of the environment and products.
- Biodiversity: Here, the crop diversity as a proxy for biodiversity, a measure of protecting the environment, and its agricultural ecosystem, is used as follows:where H is the degree of crop diversity, Pi is the proportion of total harvested area belonging to the ith crop and s is the number of crops [24].
3.4.2. Driver Indicators
- Population growth: A measure of increased pressure for access to arable lands and, subsequently reduced yields and resource degradation, due to limited access to the appropriate technologies and institutions required.
- Farm size: Because small farms are often poor in terms of access to resources, and they are unable to invest in inputs of improving the soil fertility, productivity gradually decrease; therefore, the size of the farm can be a measure of access to resources in agriculture, greater productivity, and long-term profit.
- Education level: Farmer’s education has a positive effect on agricultural productivity [29], which can occur in a variety of ways, such as better access to information and possibly the earlier adoption of new technologies and hence, more efficient resource allocation [30,31]. Educated farmers are also more likely to conduct practices of improved soil fertility management [32] and environmentally sound management [33].
- Urbanization: Urbanization can cause scarcity of agricultural land, shortage of agricultural labor and, consequently, reduction in production, and a threat to food security through competition for resources, such as land, labor and water.
- Technology availability and application: In recent decades, applying appropriate technologies has been a driving force for improving water use efficiency, soil fertility, and pest management, and has, therefore, contributed to the improvement of crop productivity and sustainability [1,34]. In particular, the application of technologies that improve water use efficiency has both increased agricultural productivity and agricultural sustainability in developing countries [35,36].
- Levels of poverty: Poverty is widely accepted as a driving force for the degradation of resources [37].
- Governance and institutional capacities: “Governance is an essential driver of both agricultural productivity and sustainability in developing countries” [4] (p. 335). Moreover, “The capacity of institutions to provide public goods and services is critical for agricultural performance and sustainability” [4] (p. 335), as conventional institutional controls and practices play an important role in determining the final effectiveness of a specific set of agricultural policies or technological interventions [38,39].
- Producer organizations and social capital as participation: “Producer organizations in small-scale agriculture play an important role in improving market access by reducing transaction costs, increasing bargaining power, fostering technology adoption through social learning and increasing participation in policy dialogue and decision-making” [4] (p. 335). Improving social capital via the creation of producer groups, ultimately, increases yields, labor wages, water use efficiency and equality and decreases use of agrochemicals [40].
3.5. Step 5: Constructing Composite Indicators of Sustainability Status and Driver
- Indicator selection and data collection. After selecting the indicators in the previous step (i.e., Step 4), collecting their data and calculating the numerical indicators is done at this stage.
- Normalization of indicators. After calculating the indicators, their conversion to non-dimensional variables (normalization) is necessary before any aggregation, in order to allow them to be compared and to carry out arithmetical operations on them. For this purpose, there are various techniques [41]. In this study, the “min-max” normalization [8,16] was used as follows (Equation (1)) to change the values of all normalized indicators within dimensionless interval (0, 1), where zero is the worst possible value of the indicator (i.e., the least sustainable or the most unsustainable) and 1 is the best (i.e., the most sustainable) one:where, is the normalized value of observation x, and min(x) and max(x) are minimum (worst) and maximum (best) observations in the total sample, respectively [41].
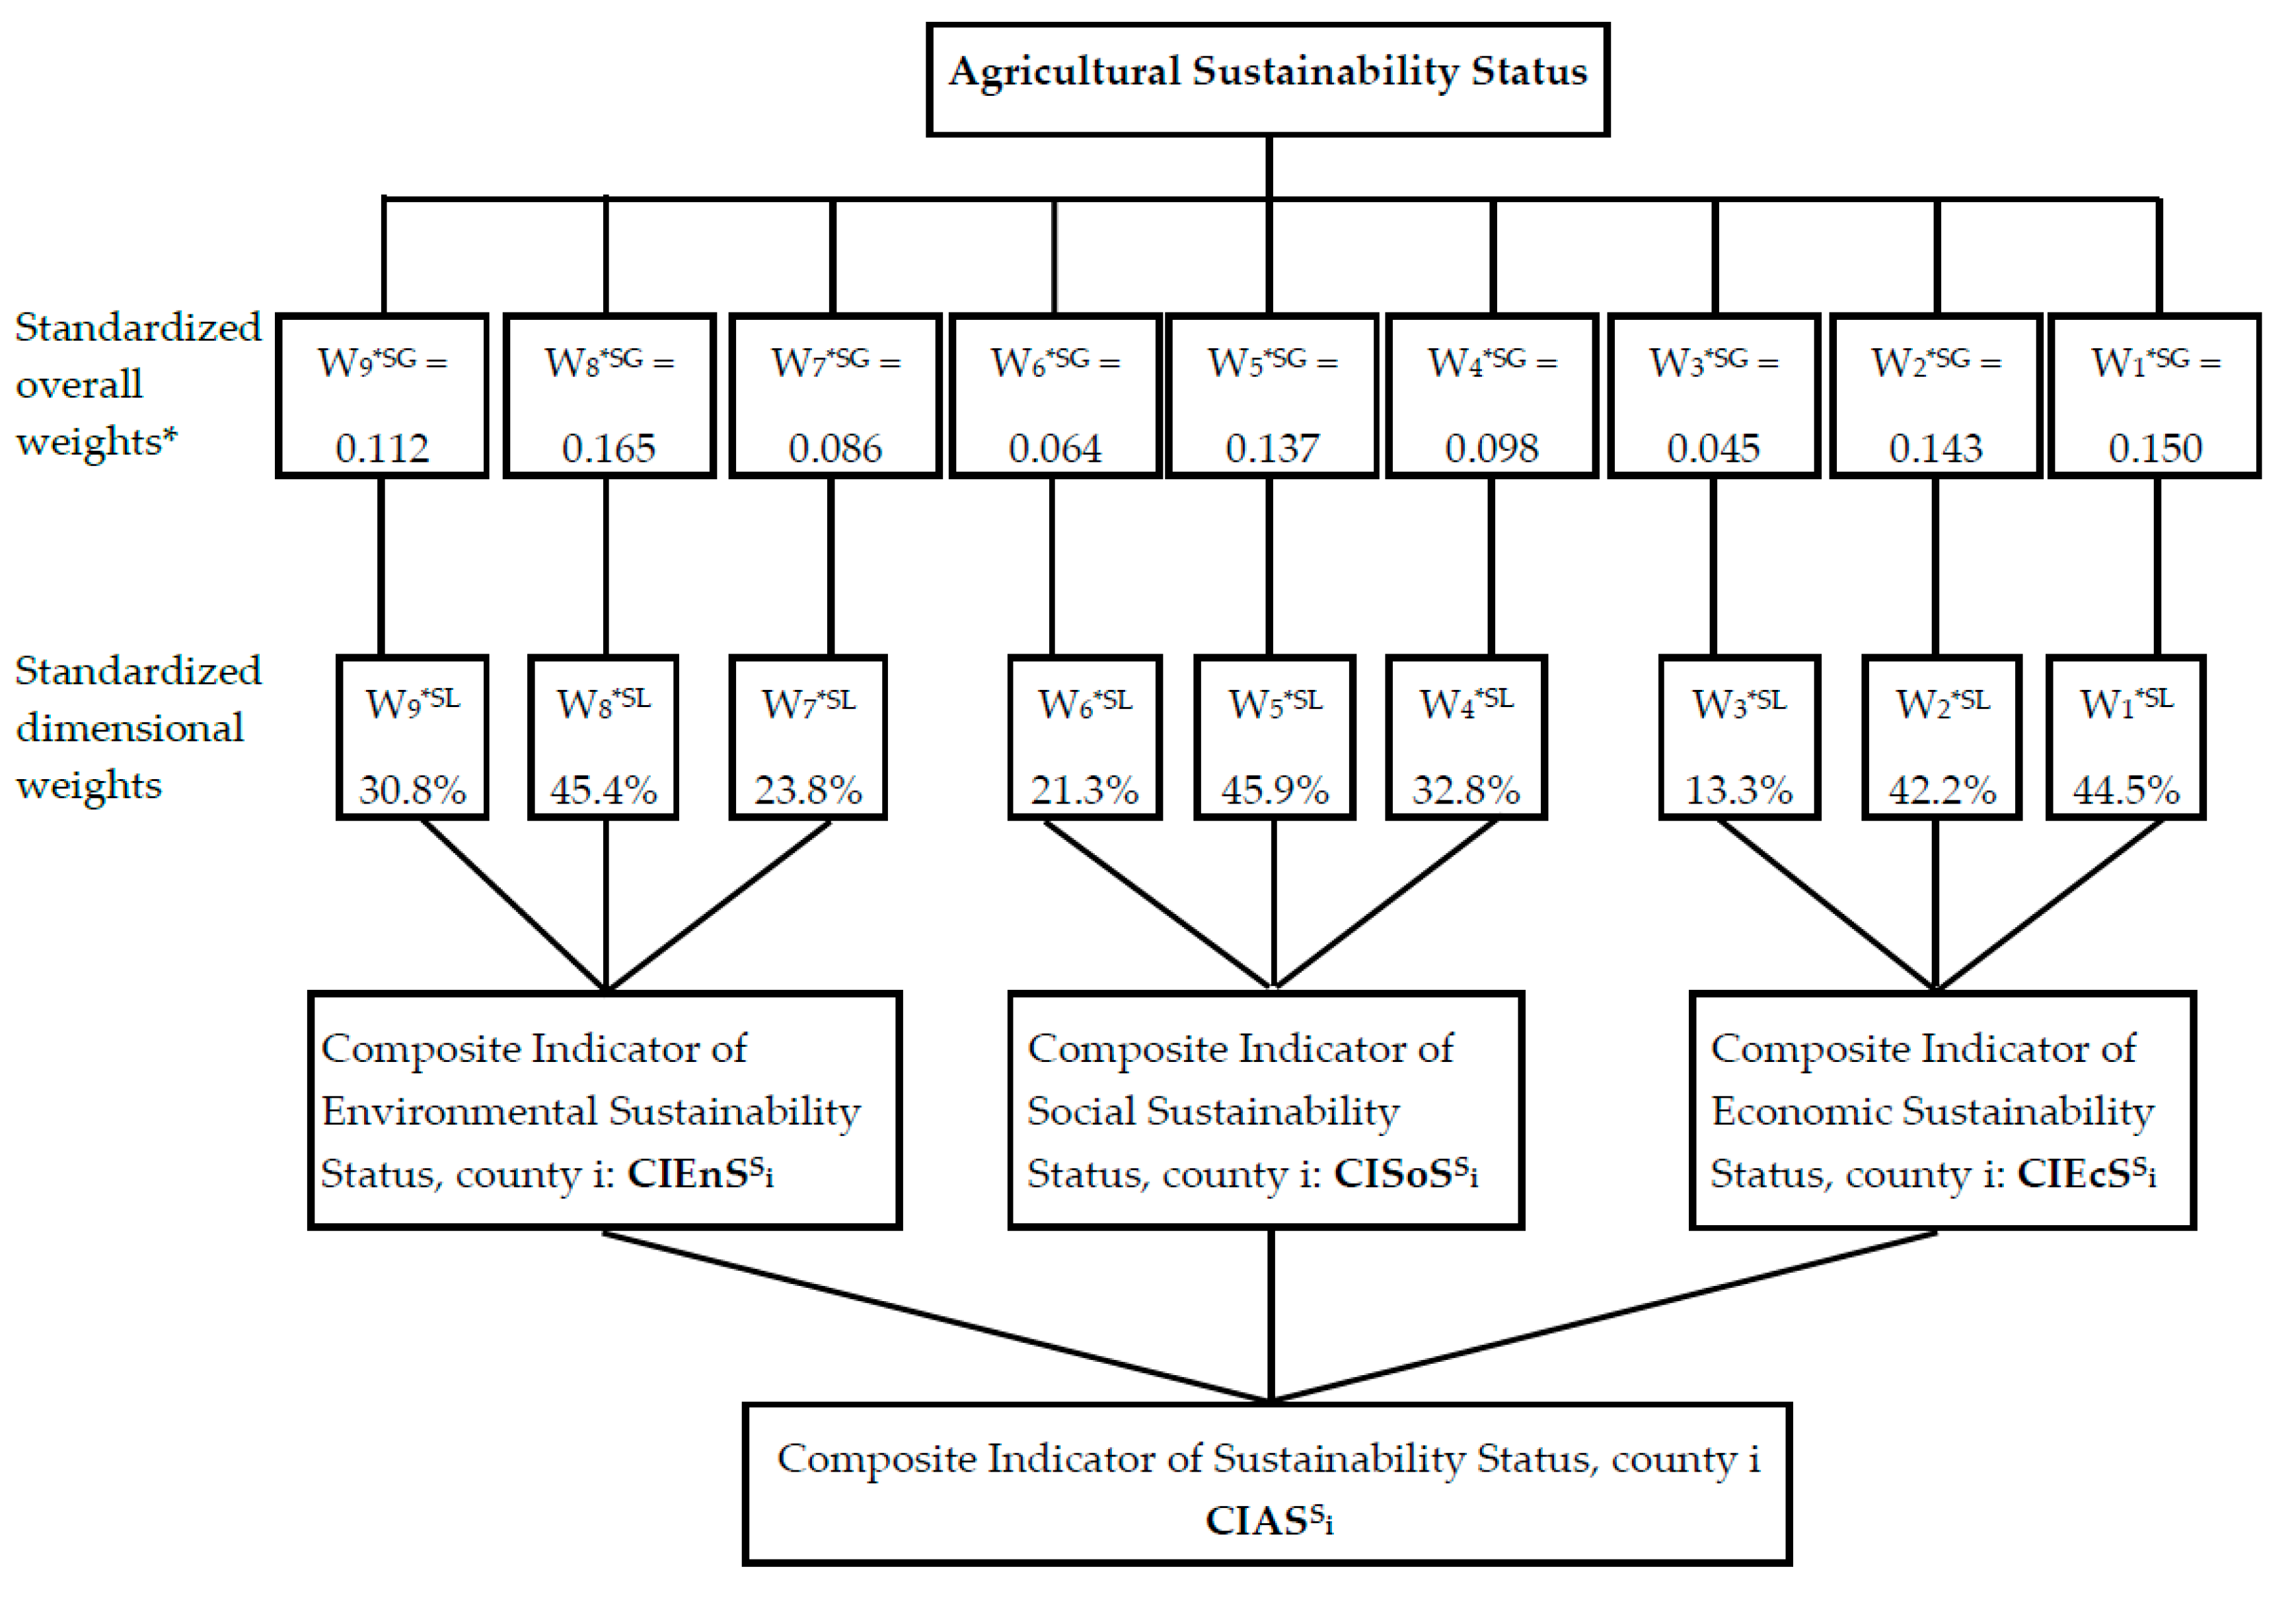
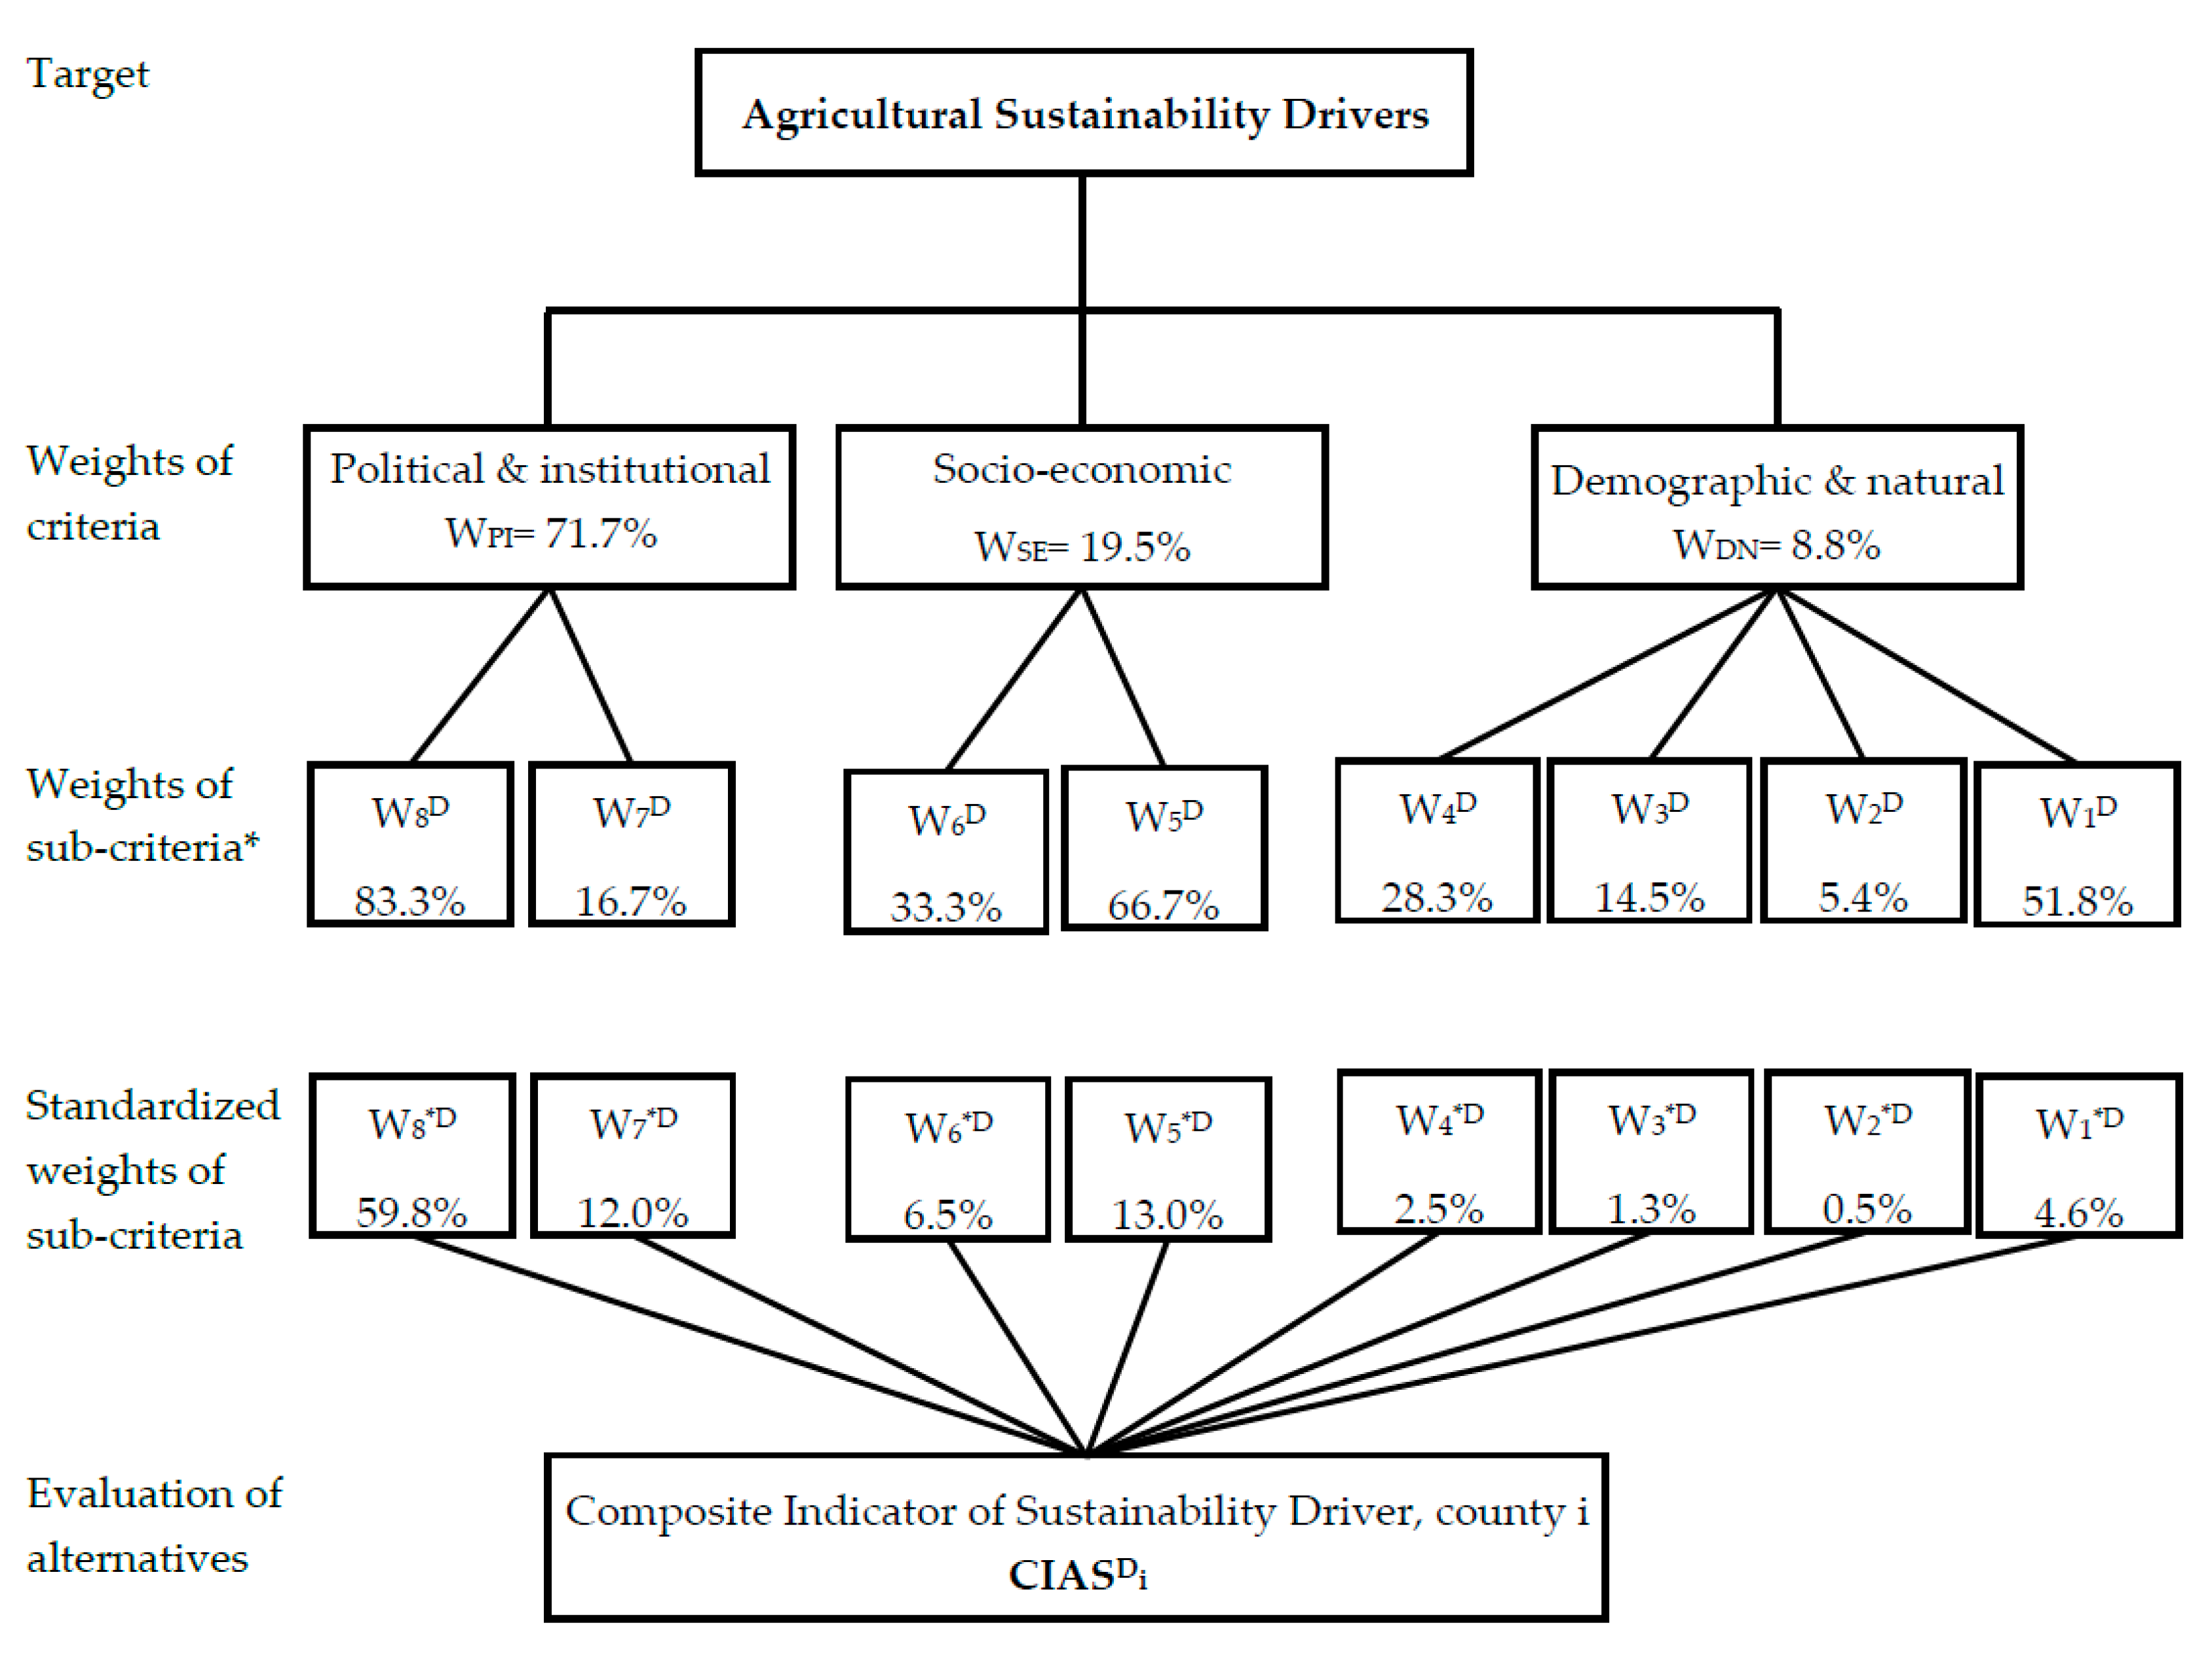
- Weighting indicators. The weighting step enables us to determine the relative importance of the individual base indicators. Weighting techniques for building indexes can be divided into “positive” or endogenous and “normative” or exogenous [42]. “The positive or endogenous techniques are those that allow us to obtain the weights of the base indicators via statistical procedures, without having to include value judgements of their relative importance. […] Normative or exogenous techniques attempt to assign different weights to the indicators as a function of the opinion of experts and external decision-makers” [16] (pp. 1067–1068). In order to consider sustainability as a social construct, the normative techniques including Fuzzy Pairwise Comparisons (FPC) and Analytic Hierarchy Process (AHP) have been used in the present study to introduce social preferences into the model and analysis for assigning different weights to indicators, as a function of the views of external decision makers (the groups mentioned above in Step 3).The fuzzy pairwise comparison method, introduced by Van Kooten et al. (1986) [43] as an alternative approach to assessing the hierarchy of goals among farmers, has been used by researchers, such as Boender et al. (1989) [44], Mendoza and Sprouse (1989) [45], Ells et al. (1997) [46], Basarir and Gillespie (2006) [47], and Berkhout et al. (2010) [48]. This method is similar to other pairwise comparison methods that ask the respondent to compare two options. But instead of being forced to make a binary choice between two options, the degree of preference (of one option over another) is extracted. The value of the scale of each option is based on the whole set of compared pairs (see References [43,47] for more details on the FPC method). Compared to the AHP method that the respondent has to select one of the discrete preference degrees, the advantage of the FPC is that the degree of preference for an option over another option is chosen from among continuous degrees [47].Considering the capabilities and advantages of the FPC method, this method was used to derive the relative importance of sustainability indicators. In this way, all possible combinations of these nine indicators were compared for each respondent by plotting a line of unit length between each indicator pair to represent relative preferences. The respondent was then asked to specify the preference for one over the other by putting a cross on the line. The cross in the middle of the line means the same relative importance of the two indices; however, if it is closer to each end, it indicates the greater preference of that indicator. The degree of preference of an indicator (jth) over another (kth), which is represented by Rjk, is measured as 1 minus the distance from the cross to that indicator (jth) (j is not equal to k). Based on the fuzzy preference matrix of Van Kooten et al. (1986) [43], the preference or weight, w, of each kth indicator is equal to:where, n is the number of status indicators equal to 9, so j and k vary from 1 to 9. The value of is in the range of 0 and 1. The larger , the more the importance of that indicator.In order to achieve the practical objectives of the study, including the determination of the economic, social and environmental sustainability status (i.e., the achievement of the relevant composite indicators), in addition to the main objective of agricultural sustainability (i.e., achieving the composite indicator of agricultural sustainability status), the FPC method is adapted. In this way, after deriving the weights of the base indicators, they were separately standardized (standardized weights should add up to one) for the construction of the composite indicators of each of the three dimensions and also for the construction of the overall sustainability composite indicator (Figure 3).The AHP technique, created by Saaty (1980, 1990) [49,50] that has been widely used as a tool for complex decision makings [51], is a structural but flexible technique for multi-criteria decision making [52], which can be adapted to build composite indices [16] (see References [53,54]). In the present study, it has been used to weigh the sustainability driver indices in the composite indicator construction process.The AHP approach is based on dealing with complex decision problems using its structure as a hierarchy of objective, criteria, and alternatives. Figure 4 shows the multi-level structure of sustainability driver indicators for this study. Relative importance or weight () of the criteria or sub-criteria that are connected to each node is obtained through their pairwise comparisons according to the relevant criterion (which is connected to the previous node). According to the Saaty scale [49], the values used to perform these pairwise comparisons are in the range of 1-9. Based on the quantitative judgments given by these comparisons, the Saaty matrices are constructed to determine the vector of weights () [52].
- Aggregation of indicators. After normalizing and weighting the base indicators, there is a need for functional form for aggregating them into a single index or (unique) composite indicator. In the present study, the “Weighted Sum of Indicators” (WSI) was used to construct the Composite Indicators of Economic Sustainability Status (CIEcSS), Social (CISoSS), Environmental (CIEnSS) and overall Agricultural Sustainability Status (CIASS), as well as to build the Composite Indicators of Agricultural Sustainability Driver (CIASD). Mathematically, WSI is a linear aggregation method that is used for a set of normalized indicators [with standardized weights] [16]:where is the agricultural sustainability composite indicator derived from a set of n indicators; is the normalized value of indicator k; and is the standardized weight of indicator k, which is calculated from the following equation:where, is the unstandardized weight of indicator k.Accordingly, the composite indicators constructed in this study will be:where, the superscripts S, L, G, and D refer to Status, Local (i.e., dimensional), Global or overall (i.e., all three dimensions together) and Driver, respectively.
- (A)
- Weak: Unsustainable
- (B)
- Moderate: Relatively unsustainable
- (C)
- Good: Relatively sustainable
- (D)
- Great: Sustainable
3.6. Data Sources
4. Results (Step 6. Providing Results through Tables, Charts and Sustainability Maps)
- I = sustainable: If the values of both CIASS and CIASD are in category D;
- II = relatively sustainable: If one is in category C and the other is in category C or D;
- III = relatively unsustainable: If one is in category B and the other is in category B or C or D;
- IIII = unsustainable: If at least one is in category A.
5. Discussion (Step 7. Different Comparisons and Analyses Based on the Results and Objectives of the Study)
- Comparison of the three dimensions of agricultural sustainability for the whole set of counties:In Table 4, the last picture of the three dimensions of sustainability status in the study counties of Kerman province (2015) indicates that the economic dimension has the least amount. This is while the social dimension (with a significant improvement compared to 2003) is slightly less than two times more than the economic dimension. In addition, the environmental dimension is more than two times better. Moreover, in comparing the trend of sustainability, it can be said that social and environmental sustainability have been improved, while economic sustainability has decreased.
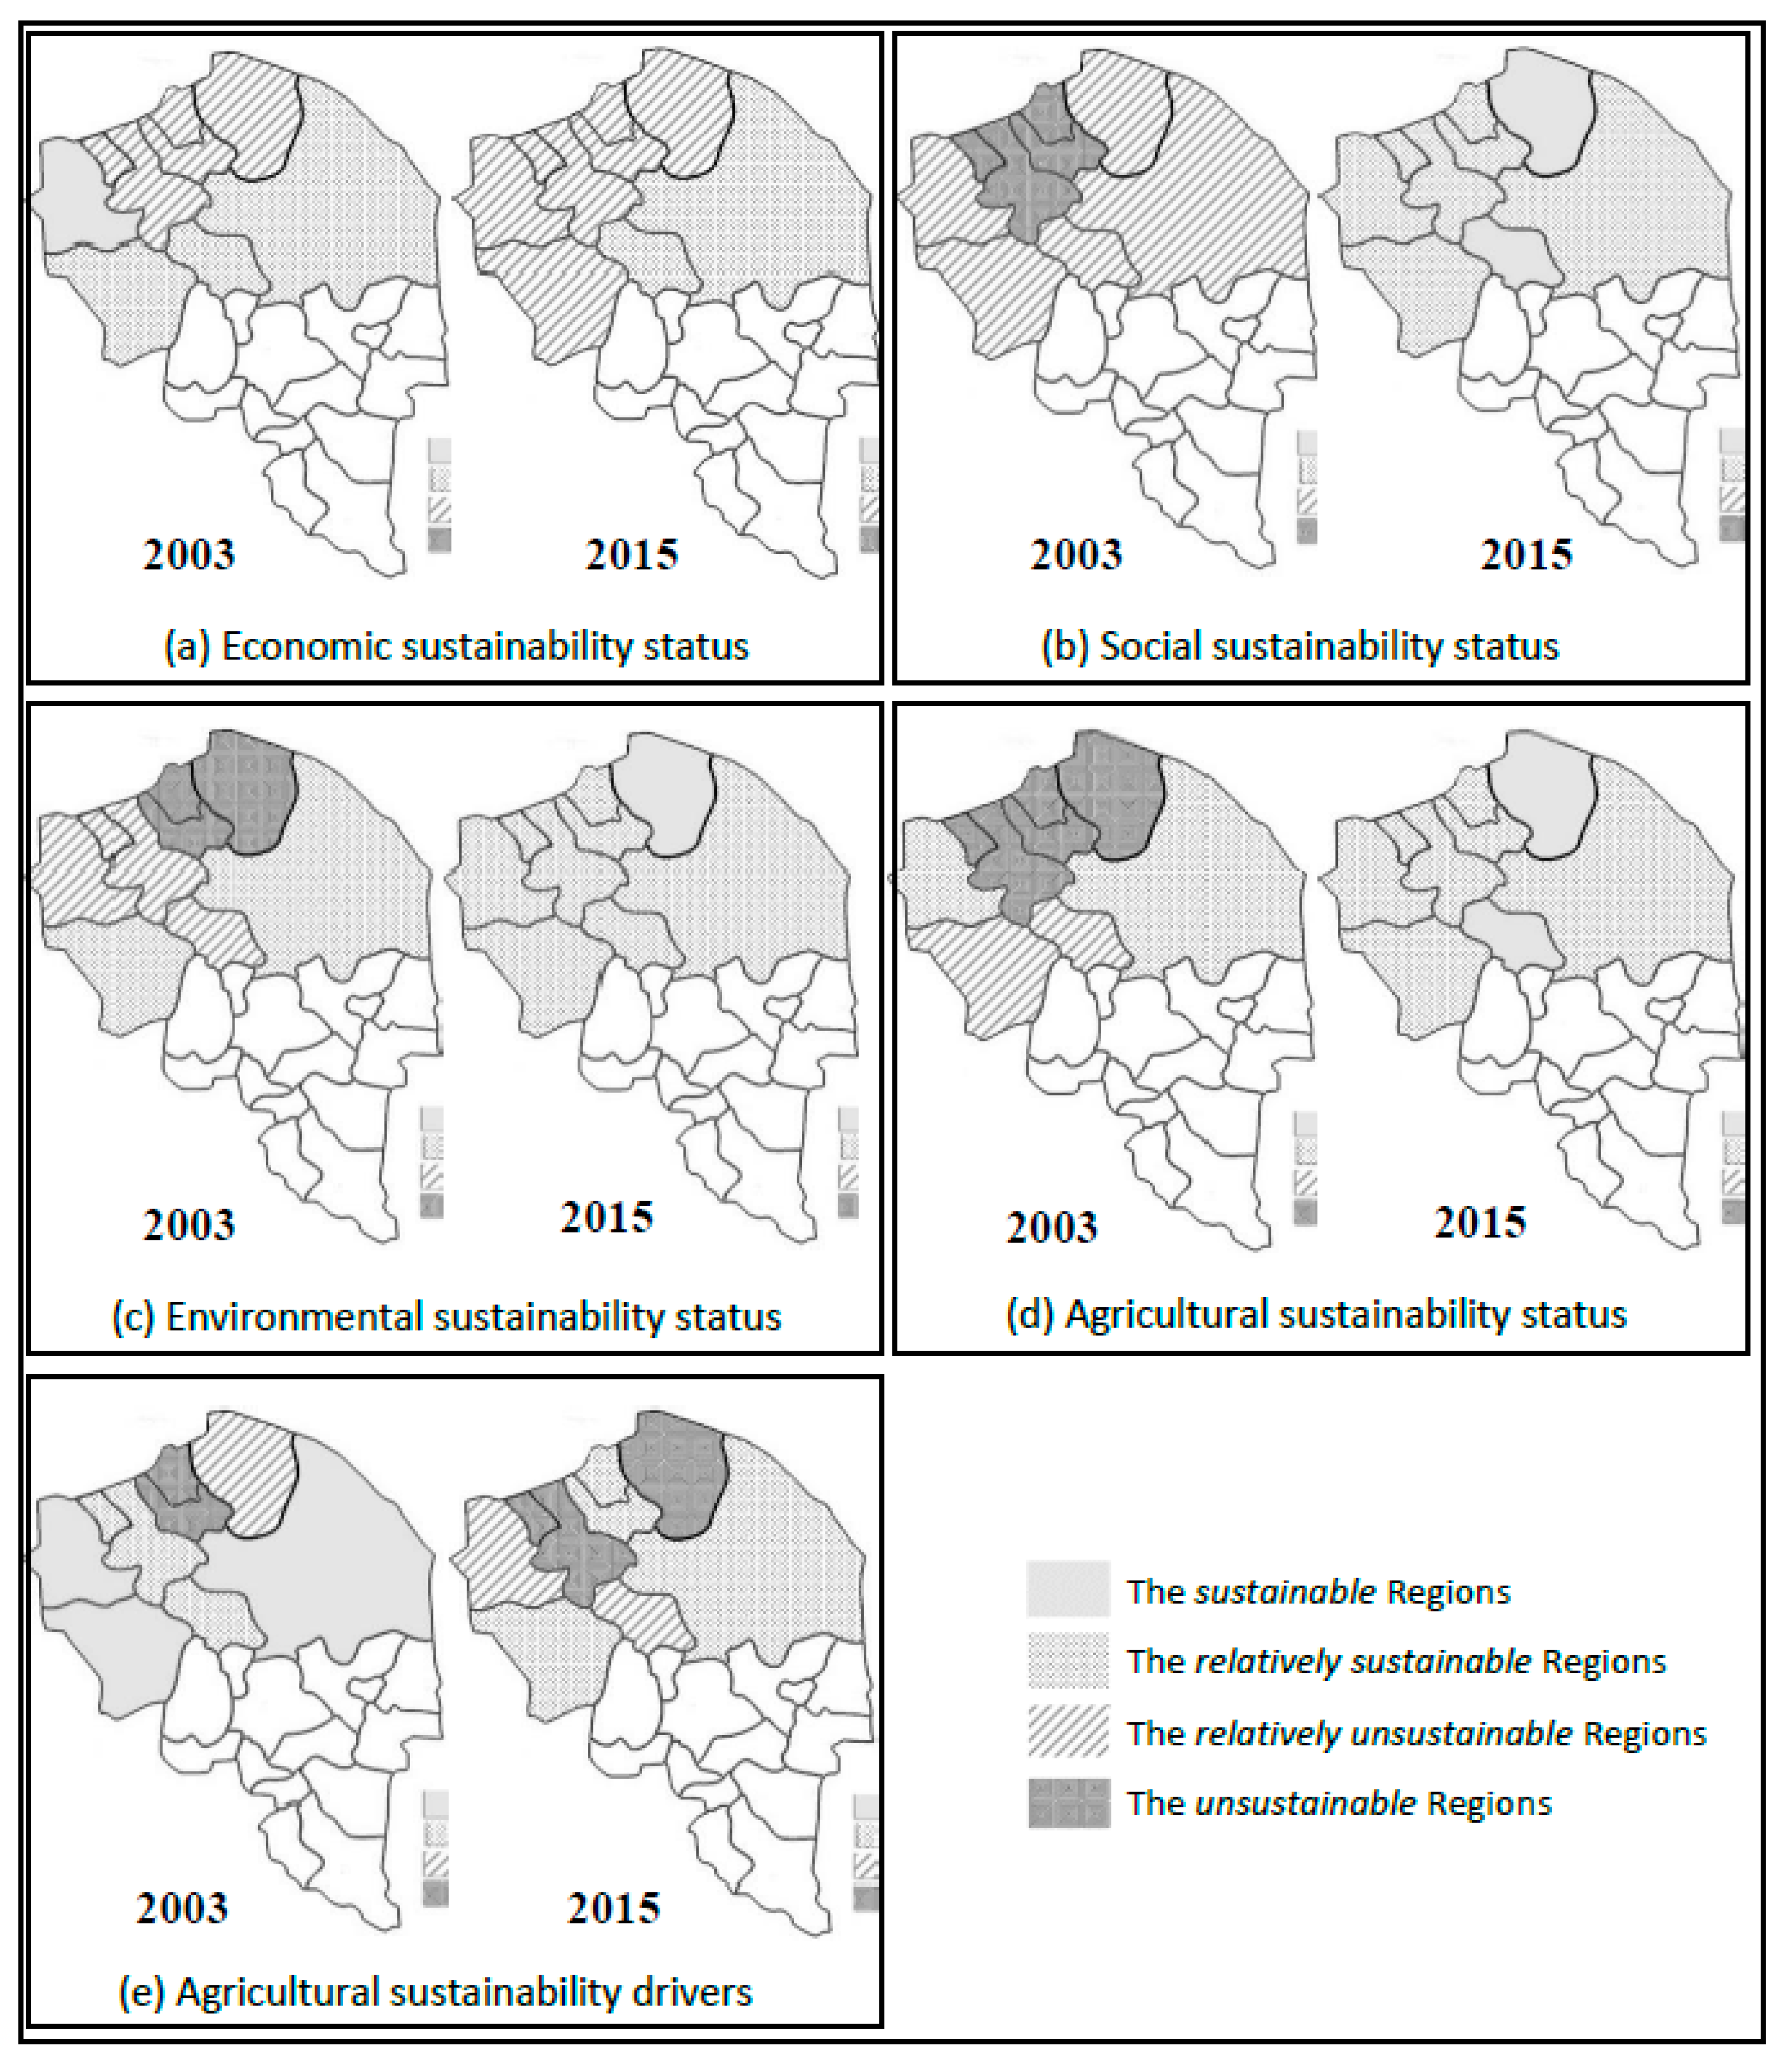
- Analysis of the sustainability status of the three dimensions (economic, social and environmental), and the overall sustainability status and drivers, as well as the comprehensive levels of agricultural sustainability of each county per year:This can be done by direct comparison of each indicator with its maximum value (i.e., 1). Of course, in order to easily observe and understand the results of this type of comparisons, the composite indicators were classified into the quadruple categories of unsustainable, relatively unsustainable, relatively sustainable and sustainable, and the results are visually presented through “Sustainability Maps” of (the study regions in) Kerman province in Figure 6. As shown in this figure, for example, Kerman county in terms of agriculture has a relatively sustainable economic and environmental status in 2003, and relatively unsustainable social status. The (overall) agricultural sustainability status in this county is relatively sustainable and is considered to be sustainable in terms of agricultural sustainability drivers. Based on the sustainability status of the three dimensions, the overall sustainability status and sustainability drivers, the county was found to be relatively sustainable in 2015.The comprehensive agricultural sustainability levels of each county, which classify the sustainability status and drivers together in the form of four levels of sustainability, were defined. This item can be seen in Figure 7 without making a global composite index. With the help of this figure, it can easily be seen that, for example, Zarand and Kuhbanan are in the “unsustainable” class in 2003 and the comprehensive level of agricultural sustainability in Kerman county corresponds to the “relatively sustainable” class in both periods (2003 and 2015).
- Review, comparison and analysis of agricultural sustainability status of each county in each of the three dimensions of economic, social and environmental, also its overall status and its drivers, as well as the comprehensive levels of agricultural sustainability over the years (2003 and 2015) means the analysis of the trend of sustainability change:The sustainability maps of Figure 6, which are based on the ISDM classification of composite indices, make this comparison easy. For example, in map (d) of this figure, it can be seen that the agricultural sustainability status of the counties of Bardsir, Ravar, Rafsanjan and Anar, Zarand and Kuhbanan, Sirjan, Shahr-e-Babak and Kerman in 2003 is relatively unsustainable, unsustainable, unsustainable, unsustainable, relatively unsustainable, relatively sustainable and relatively sustainable, respectively, which has been promoted to the “sustainable” for the first two counties (i.e., Bardsir and Ravar) and improved to the “relatively sustainable” for the other counties in 2015. Therefore, it can be easily understood that the agricultural sustainability status has been improved in all of the study counties of Kerman province.The possibility of this kind of comparison and analysis, especially for triple dimensions without using their overall composite indicator through the AMOEBA diagrams, is provided in Figure 5. In part (a) of this figure, it is observed that the agricultural sustainability status of Bardsir county has improved for all three economic, social and environmental dimensions in 2015, in comparison to 2003 (since the triangle with the full line of 2015 has completely covered the triangle with dotted lines in 2003), although the improvement in the social dimension is the highest and is the least in the economic dimension.In the particular case of the overall sustainability status and the sustainability drivers jointly, Figure 7 can be very helpful. From the Barometer of Agricultural Sustainability, the comprehensive levels of agricultural sustainability status and drivers for each of the counties in 2003, including one of the four levels of I: Sustainable; II: Relatively sustainable; III: Relatively unsustainable; and IIII: Unsustainable, will be compared in 2003 with 2015. Accordingly, the comprehensive level of agricultural sustainability of “Zarand and Kuhbanan” has been improved from unsustainable to relatively sustainable in 2015 and Sirjan from relatively unsustainable in 2003 to relatively sustainable in 2015 (i.e., sustainability improvement trend). The counties of Ravar and “Rafsanjan and Anar” in the unsustainable class, Bardsir county in the relatively unsustainable class, and Kerman in the relatively sustainable class have a relatively constant comprehensive level of agricultural sustainability. Shahr-e-Babak, with its downward trend, fell from a relatively sustainable class in 2003 to a relatively unsustainable in 2015.
- Comparison of different counties in each period (year) in each of the three dimensions and the overall status and drivers of sustainability, as well as the comprehensive levels of agricultural sustainability, and, finally, ranking or classification of their sustainability levels:This type of county comparison can be done in direct priority based on the results of the two tables (Table 4 and Table 5). For example, according to the CIASS in the last column of Table 4, Bardsir county (with 0.767) ranked first in 2015, followed by Ravar (0.737), and Kerman (0.685). The following ranking was Sirjan (0.603), Shahr-e-Babak (0.597), Zarand and Kuhbanan (0.591), and finally Rafsanjan and Anar (0.575), respectively.The composite indicators of CIASD in Table 5 show that Zarand and Kuhbanan (with a value of 0.517) had the highest potential agricultural sustainability level (or agricultural sustainability drivers) in 2015. The counties of Sirjan (0.506) and Kerman (0.500) ranked second and third, respectively. Bardsir (0.457), Shahr-e-Babak (0.345) and Ravar (0.245) ranked next. Finally, Rafsanjan and Anar (0.137) had the lowest potential sustainability level.Another tool for this kind of comparison and analysis is the output of the ISDM classification, which is shown in Figure 6 as sustainability maps in this study. This figure consists of five parts, from (a) to (e), corresponding to the five composite indicators of the present study that cover the study counties. Each part consists of two sustainability maps, corresponding to the two years examined (2003 and 2015). The counties have been categorized across different sustainability classes, and in each map, the sustainability level of each county is specified in that year. For example, in Figure 6d, the map of 2015, it can be easily seen that Bardsir and Ravar counties are sustainable, and the other counties (Rafsanjan and Anar, Zarand and Kuhbanan, Sirjan, Shahr-e-Babak and Kerman) are relatively sustainable in terms of agricultural sustainability status.Of course, the Barometer of Agricultural Sustainability (BAS) of Figure 7 can be also used to extract the comprehensive levels of sustainability of the counties in each of the years as well as the years in total, and compare them with each other. As shown in this figure, the comprehensive level of agricultural sustainability for none of the counties is sustainable. In 2015, Zarand and Kuhbanan, Sirjan and Kerman had the highest comprehensive levels of agricultural sustainability in the category “II: Relatively sustainable”. Bardsir and Shahr-e-Babak were in the category “III: Relatively unsustainable”, and Ravar and Rafsanjan, with the category “IIII: Unsustainable”, had the lowest comprehensive level of agricultural sustainability. Although in 2003, Kerman and Shahr-e-Babak were relatively sustainable, Sirjan and Bardsir were placed in the “relatively unsustainable” category, and “Rafsanjan and Anar”, Ravar and “Zarand and Kuhbanan” were in the “unsustainable” category.
6. Conclusions (Step 8. The Final Conclusions and Interpretations, Suggestions and, If Possible, Policy Recommendations)
- Agricultural sustainability levels vary in different regions and counties of Kerman province, and these levels also vary in different periods. However, the focus of this study was on the neighboring counties in the north of Kerman province with some common basic features—the dominant agricultural system is smallholding, the majority of them (five out of seven counties in 2003, equivalent to seven out of nine in 2015) had a major product of pistachios with more than 65% of the total area under cultivation and the main crop production of all dedicated to wheat.
- Based on the average values of the composite indicators of the three dimensions of the sustainability status of the counties in the years under study, the economic dimension had the lowest level of agricultural sustainability and the environmental dimension had the highest level.
- According to the definition of Comprehensive Levels of Agricultural Sustainability (Section 4), which represent the quadruple categories of sustainability status and drivers jointly: Three counties (Zarand i.e., ‘Zarand and Kuhbanan’, Ravar and Rafsanjan i.e., ‘Rafsanjan and Anar’) out of all seven counties studied in Kerman province were placed in the lowest class, unsustainable, in 2003. Sirjan and Bardsir were classified in the relatively unsustainable category and only two counties (Kerman and Shahr-e-Babak) were classified as relatively sustainable. While in 2015, two counties (Ravar and Rafsanjan i.e., ‘Rafsanjan and Anar’) were unsustainable, two counties (Shahr-e-Babak and Bardsir) were relatively unsustainable, and three counties (Zarand i.e., ‘Zarand and Kuhbanan’, Sirjan and Kerman) were classified as relatively sustainable. In sum, although the trend of changes in the comprehensive levels of agricultural sustainability is evaluated positively, more than half of the counties are still unsustainable or relatively unsustainable in 2015, and none have been entered into the category “I: Sustainable”.
- Effective application of the element of time, both in the definition of sustainability, in its dynamic modeling, and in the analysis of the results of sustainable -and unsustainable- trends of real agricultural issues;
- Purposeful selection of “Region: County” scale in a case study to show the power of the model and -carefully- selected and designed indicators, so that it can obtain results and reports for the larger scale of the “county/region”, as the political borders of the country, using the data collected directly from the smaller scale, i.e., every single agricultural holding through periodic censuses. In practice, this can be very important in state policy and planning, given the allocation of regional budgets, including political geographic boundaries;
- Introducing a coherent set of indicators that, on the one hand, can be mainly applied at different levels and multiple scales, and on the other hand, can reflect changes over time. Based on direct attention to the core problems of sustainability (i.e., agricultural unsustainability problems), these indicators can incorporate the sustainability status and drivers (or results and roots) of different dimensions (economic, social and environmental) and categories (demographic and natural, socio-economic, and political and institutional) into the process of modeling, indicator construction and final analyses;
- Applying different methods and techniques, especially to incorporate the concept of social constructs into the modeling process, and show their usefulness and compatibility with the proposed framework, such as FPC and AHP techniques; and,
- Providing a variety of analytical and visual tools, such as three dimensional composite indicators, overall indicators of agricultural status and driver, and especially sustainability maps and barometer of agricultural sustainability that are consistent with the proposed framework.
- Comprehensive level of agricultural sustainability (status and driver jointly or both actual and potential);
- Level of overall agricultural sustainability status and/or drivers (i.e., overall actual and overall potential);
- Level of agricultural sustainability dimensions and/or classes (e.g., economic, social and environmental);
- Level of base indicators, both for actual sustainability (status: Nine indicators) and potential (drivers: Eight indicators).
- (a)
- Scientific soundness: “Sustainability concept” is well-defined in our proposed framework (so that although it is a principles-based approach, it is also compatible with the Triple Bottom Line approach); “Methodological paradigms for the development of indicators” in our framework are both top-down (expert-led) and bottom-up (community/stakeholders-based); “Justification of indicator selection” is documented, as the logic of selecting the indicators and their relation to the agricultural sustainability are clearly described; “Data sources for indicators” in the proposed framework can include both primary and secondary data sources; “Use of qualitative and quantitative data to develop indicators” is possible within this framework; “Ability to consider sustainability issues across scales” is one of the main features of the framework. As can be seen in the suggested set of indicators, the method basically integrates and uses information on the sustainability issues of different scales over time; “Validation of indicators” was carried out through consultation and evaluation of experts and stakeholders (experts and farmers), and based on their comparisons; “Reference values for indicators” were relative ones in our case study, although in this framework, absolute reference values can also be used; “Data normalization” was performed for the base indicators by min-max normalization method; “Data aggregation” is used to construct a variety of composite indicators of the method as shown; “Sensitivity analysis”, although not done in this study, but in the proposed framework, can be done using different methods, such as econometrics and regression techniques; and, “Spatial applicability” of the introduced framework, in our case study, is its application at the regional level. However, according to its perspective, objectives and practical measures for its implementation, especially the criteria for selecting the indicators described above, it can be applied across farm, local, regional and national scales.
- (b)
- User-friendliness: “Learning dimension” of the proposed framework is realized through the empirical process of its implementation, since the application of an agricultural sustainability evaluation approach is itself a learning experience [62]; “Presentation of results” through numerical and graphical tables and figures is described in Step 6 of the framework, as shown in the results section; Being “available as software with video tutorials and with free access”, having “guidelines” and being used as part of a formal “certification procedure or advisory tool” have not yet been met, because the method was proposed for the first time in the current study. Of course, software development and free access, as well as providing instructions are possible. At the same time, the calculations for counties and regions based on the proposed framework can be documented and included as part of their advisory reports, in support of agricultural policy planning and decision making aimed at improving the governance of this sector.
Author Contributions
Funding
Conflicts of Interest
References
- World Bank. Agriculture for Development: World Development Report 2008; World Bank: Washington, DC, USA, 2007. [Google Scholar]
- Ligon, E.; Sadoulet, E. Estimating the Effects of Aggregate Agricultural Growth on the Distribution of Expenditures (English); World Bank: Washington, DC, USA, 2007. [Google Scholar]
- Christiaensen, L.; Demery, L.; Kuhl, J. The (evolving) role of agriculture in poverty reduction—An empirical perspective. J. Dev. Econ. 2011, 96, 239–254. [Google Scholar] [CrossRef] [Green Version]
- Van Pham, L.; Smith, C. Drivers of agricultural sustainability in developing countries: A review. Environ. Dev. Sustain. 2014, 34, 326–341. [Google Scholar]
- Talukder, B.; Blay-Palmer, A. Comparison of methods to assess agricultural sustainability. In Sustainable Agriculture Reviews; Lichtfouse, E., Ed.; Springer: Cham, Switzerland, 2017; Volume 25, pp. 149–168. ISBN 2210-4410. [Google Scholar]
- Pearson, C.J. Planning for agricultural sustainability. Int. J. Agric. Sustain. 2013, 11, 1–3. [Google Scholar] [CrossRef]
- Velten, S.; Leventon, J.; Jager, N.; Newig, J. What is sustainable agriculture? A systematic review. Sustainability 2015, 7, 7833–7865. [Google Scholar] [CrossRef]
- Haileslassie, A.; Craufurd, P.; Thiagarajah, R.; Kumar, S.; Whitbread, A.; Rathor, A.; Blummel, M.; Ericsson, P.; Kakumanu, K.R. Empirical evaluation of sustainability of divergent farms in the dryland farming systems of india. Ecol. Indic. 2016, 60, 710–723. [Google Scholar] [CrossRef]
- Yazdanpanah, M.; Hayati, D.; Zamani, G.H.; Karbalaee, F.; Hochrainer-Stigler, S. Water management from tradition to second modernity: An analysis of the water crisis in Iran. Environ. Dev. Sustain. 2013, 15, 1605–1621. [Google Scholar] [CrossRef]
- Baniasadi, M.; Zare Mehrjordi, M.R.; Mehrabi Boshrabadi, H.; Mirzaei, H.R.; Rezaei Estakhrooye, A. Assessing the environmental externalities of excessive groundwater withdrawals using the choice experiment method‒a case study of Kerman, Iran. Appl. Ecol. Env. Res. 2016, 14, 683–696. [Google Scholar] [CrossRef]
- Mehrabi Boshrabadi, H.; Villano, R.; Fleming, E. Technical efficiency and environmental-technological gaps in wheat production in Kerman province of Iran. Agric. Econ. 2008, 38, 67–76. [Google Scholar] [CrossRef]
- Plan and Budget Organization of Kerman Province. Economic, Social and Cultural Report of Kerman Province 2015; Plan and Budget Organization of Kerman Province: Kerman, Iran, 2017. [Google Scholar]
- Statistical Center of Iran. Available online: https://www.amar.org.ir/ (accessed on 14 September 2017).
- Reed, M.S.; Fraser, E.D.; Dougill, A.J. An adaptive learning process for developing and applying sustainability indicators with local communities. Ecol. Econ. 2006, 59, 406–418. [Google Scholar] [CrossRef]
- Roy, R.; Chan, N.W. An assessment of agricultural sustainability indicators in Bangladesh: Review and synthesis. Environmentalist 2012, 32, 99–110. [Google Scholar] [CrossRef]
- Gómez-Limón, J.A.; Sanchez-Fernandez, G. Empirical evaluation of agricultural sustainability using composite indicators. Ecol. Econ. 2010, 69, 1062–1075. [Google Scholar] [CrossRef]
- Nambiar, K.; Gupta, A.; Fu, Q.; Li, S. Biophysical, chemical and socio-economic indicators for assessing agricultural sustainability in the Chinese coastal zone. Agric. Ecosyst. Environ. 2001, 87, 209–214. [Google Scholar] [CrossRef]
- Hayati, D.; Ranjbar, Z.; Karami, E. Measuring agricultural sustainability. In Biodiversity, Biofuels, Agroforestry and Conservation Agriculture; Lichtfouse, E., Ed.; Springer: Dordrecht, The Netherlands, 2010; pp. 73–100. [Google Scholar]
- Farshad, A.; Zinck, J.A. Assessing agricultural sustainability using the six-pillar model: Iran as a case study. Agroecosyst. Sustain. Dev. Pract. Strateg. 2001, 137–151. [Google Scholar]
- Zinck, J.; Berroterán, J.; Farshad, A.; Moameni, A.; Wokabi, S.; Ranst, E.V. Approaches to assessing sustainable agriculture. J. Sustain. Agric. 2004, 23, 87–109. [Google Scholar] [CrossRef]
- López-ridaura, S.; Keulen, H.V.; Van Ittersum, M.; Leffelaar, P. Multiscale methodological framework to derive criteria and indicators for sustainability evaluation of peasant natural resource management systems. Environ. Dev. Sustain. 2005, 7, 51–69. [Google Scholar] [CrossRef]
- Vecchione, G. EU Rural Policy: Proposal and Application of an Agricultural Sustainability Index; Munich Personal RePEc Archive (MPRA) Paper no. 27032; MPRA: Munich, Germany, 2010. [Google Scholar]
- Pourzand, F.; Bakhshoodeh, M. Technical efficiency and agricultural sustainability–technology gap of maize producers in Fars province of Iran. Environ. Dev. Sustain. 2014, 16, 671–688. [Google Scholar] [CrossRef]
- Shannon, C.E.; Wiener, W. The Mathematical Theory of Communication (pp. 1–117); University of Illinois Press: Urbana, IL, USA, 1963. [Google Scholar]
- World Bank. Worldwide Governance Indicators; World Bank: Washington, DC, USA, 2017; Available online: http://databank.worldbank.org/data/download/WGI_excel.zip (accessed on 21 September 2017).
- Lio, M.; Liu, M.-C. Governance and agricultural productivity: A cross-national analysis. Food Policy 2008, 33, 504–512. [Google Scholar] [CrossRef]
- Kaufmann, D.; Kraay, A.; Mastruzzi, M. The Worldwide Governance Indicators: Methodology and Analytical Issues; World Bank Policy Research Working Paper No. 5430; World Bank: Washington, DC, USA, 2010. [Google Scholar]
- Kaufmann, D.; Kraay, A.; Mastruzzi, M. The worldwide governance indicators: Methodology and analytical issues. Hague J. Rule Law 2011, 3, 220–246. [Google Scholar] [CrossRef]
- Chen, J. Rapid urbanization in China: A real challenge to soil protection and food security. CATENA 2007, 69, 1–15. [Google Scholar] [CrossRef]
- Asadullah, M.N.; Rahman, S. Farm productivity and efficiency in rural Bangladesh: The role of education revisited. Appl. Econ. 2009, 41, 17–33. [Google Scholar] [CrossRef]
- Reimers, M.; Klasen, S. Revisiting the role of education for agricultural productivity. Am. J. Agric. Econ. 2013, 95, 131–152. [Google Scholar] [CrossRef]
- Odendo, M.; Obare, G.; Salasya, B. Factors responsible for differences in uptake of integrated soil fertility management practices amongst smallholders in western Kenya. Afr. J. Agric. Res. 2009, 4, 1303–1311. [Google Scholar]
- OECD. Environmental Indicators for Agriculture: Methods and Results; OECD: Paris, France, 2001; Volume 3. [Google Scholar]
- Cornia, G.A. Farm size, land yields and the agricultural production function: An analysis for fifteen developing countries. World Dev. 1985, 13, 513–534. [Google Scholar] [CrossRef]
- Tilman, D.; Cassman, K.G.; Matson, P.A.; Naylor, R.; Polasky, S. Agricultural sustainability and intensive production practices. Nature 2002, 418, 671. [Google Scholar] [CrossRef] [PubMed]
- Pretty, J.N.; Noble, A.D.; Bossio, D.; Dixon, J.; Hine, R.E.; Penning de Vries, F.W.; Morison, J.I. Resource-conserving agriculture increases yields in developing countries. Environ. Sci. Technol. 2006, 40, 1114–1119. [Google Scholar] [CrossRef]
- Hazell, P.; Wood, S. Drivers of change in global agriculture. Philos. Trans. R. Soc. Lond. B 2008, 363, 495–515. [Google Scholar] [CrossRef] [Green Version]
- Barrett, C.B.; Lee, D.R.; McPeak, J.G. Institutional arrangements for rural poverty reduction and resource conservation. World Dev. 2005, 33, 193–197. [Google Scholar] [CrossRef]
- Kaufmann, D.; Kraay, A.; Mastruzzi, M. Governance Matters Vii: Aggregate and Individual Governance Indicators 1996-2007; World Bank: Washington, DC, 2007. [Google Scholar]
- Pretty, J.; Ward, H. Social capital and the environment. World Dev. 2001, 29, 209–227. [Google Scholar] [CrossRef]
- Freudenberg, M. Composite Indicators of Country Performance: A Critical Assessment; OECD Science, Technology and Industry Working Papers, 2003/16; OECD: Paris, France, 2003. [Google Scholar]
- OECD, Organization for Economic Co-operation and Development—JRC, Joint Research Centre. Handbook on Constructing Composite Indicators: Methodology and User Guide; OECD: Paris, France, 2008. [Google Scholar]
- Van Kooten, G.C.; Schoney, R.A.; Hayward, K.A. An alternative approach to the evaluation of goal hierarchies among farmers. West. J. Agric. Econ. 1986, 40–49. [Google Scholar]
- Boender, C.; De Graan, J.; Lootsma, F. Multi-criteria decision analysis with fuzzy pairwise comparisons. Fuzzy Set. Syst. 1989, 29, 133–143. [Google Scholar] [CrossRef]
- Mendoza, G.A.; Sprouse, W. Forest planning and decision making under fuzzy environments: An overview and illustration. Forest Sci. 1989, 35, 481–502. [Google Scholar]
- Ells, A.; Bulte, E.; Van Kooten, G.C. Uncertainty and forest land use allocation in British Columbia: Vague priorities and imprecise coefficients. Forest Sci. 1997, 43, 509–520. [Google Scholar]
- Basarir, A.; Gillespie, J.M. Multidimensional goals of beef and dairy producers: An inter-industry comparison. Agric. Econ. 2006, 35, 103–114. [Google Scholar] [CrossRef]
- Berkhout, F.; Verbong, G.; Wieczorek, A.J.; Raven, R.; Lebel, L.; Bai, X. Sustainability experiments in Asia: Innovations shaping alternative development pathways? Environ. Sci. Policy 2010, 13, 261–271. [Google Scholar] [CrossRef]
- Saaty, T.L. The Analytic Hierarchy Process: Planning, Priority Setting, Resource Allocation; McGraw-Hill International Book Company: New York, NY, USA, 1980. [Google Scholar]
- Saaty, T.L. How to make a decision: The analytic hierarchy process. Eur. J. Oper. Res. 1990, 48, 9–26. [Google Scholar] [CrossRef]
- Golden, B.L.; Wasil, E.A.; Levy, D.E. Applications of the analytic hierarchy process: A categorized, annotated bibliography. In The Analytic Hierarchy Process; Golden, B.L., Wasil, E.A., Harker, P.T., Eds.; Springer: Berlin, Germany, 1989; pp. 37–58. [Google Scholar]
- Gómez-Limón, J.A.; Riesgo, L. Alternative approaches to the construction of a composite indicator of agricultural sustainability: An application to irrigated agriculture in the Duero basin in Spain. J. Environ. Manag. 2009, 90, 3345–3362. [Google Scholar] [CrossRef] [PubMed]
- Nardo, M.; Saisana, M.; Saltelli, A.; Tarantola, S.; Hoffman, A.; Giovannini, E. Handbook on Constructing Composite Indicators: Methodology and User Guide; OECD Statistics Working Paper; OECD: Paris, France, 2005. [Google Scholar]
- Nardo, M.; Saisana, M.; Saltelli, A.; Tarantola, S. Tools for Composite Indicators Building; Joint Research Centre-European Commission: Ispra, Italy, 2005. [Google Scholar]
- Allahyari, M.S.; Damalas, C.A.; Ebadattalab, M. Determinants of integrated pest management adoption for olive fruit fly (Bactrocera oleae) in Roudbar, Iran. Crop Prot. 2016, 84, 113–120. [Google Scholar] [CrossRef]
- Bell, S.; Morse, S. Sustainability Indicators: Measuring the Immeasurable, 2nd ed.; Earthscan: London, UK, 2008; ISBN 978-1-84407-299-6. [Google Scholar]
- Bell, S.; Morse, S. Measuring Sustainability: Learning from Doing; Routledge: London, UK, 2013. [Google Scholar]
- MacPherson, N. Assessing progress toward sustainability: A new approach. In A Sustainable World: Defining and Measuring Sustainable Development; Trzyna, T.C., Osborn, J.K., Eds.; IUCN: London, UK, 1995. [Google Scholar]
- Prescott-Allen, R. Barometer of sustainability: Measuring and communicating wellbeing and sustainable development. In An Approach to Assessing Progress toward Sustainability: Tools and Training Series; IUCN: Gland, Switzerland, 1997. [Google Scholar]
- Ko, T.G. Development of a tourism sustainability assessment procedure: A conceptual approach. Tour. Manag. 2005, 26, 431–445. [Google Scholar] [CrossRef]
- Rigby, D.; Woodhouse, P.; Young, T.; Burton, M. Constructing a farm level indicator of sustainable agricultural practice. Ecol. Econ. 2001, 39, 463–478. [Google Scholar] [CrossRef]
- Van Loon, G.W.; Patil, S.; Hugar, L. Agricultural Sustainability: Strategies for Assessment; SAGE: New Delhi, India, 2005. [Google Scholar]


| Methods | Brief Description | Some Advantages | Some Disadvantages |
|---|---|---|---|
| RISE | Developed by Swiss and international participants from scientific, societal, public administrations and agro-industry sectors for sustainability assessment at the farm level. | Uses principles-based approaches a for concept development; Presents results both numerically and graphically (radar charts) | Uses only a top-down approach b for developing indicators; Does not integrate information related to sustainability issues across scales |
| SAFE | Developed in a hierarchical, structured way based on a framework of principles, criteria, indicators and reference values. | Justification of indicators selection are documented; Applied at field, farm, landscape and national levels | Uses Triple Bottom Line approach; Uses only a top-down approach for developing indicators |
| IDEA | Based on research conducted since 1998 in France. It provides an operational tool for sustainability assessment at the farm level. | Uses principles-based approaches; Capable of aggregating indicators; Graphical results allow for monitoring across regions | Indicators were developed using a top-down approach; Unable to integrate issues across scales; Applied only at the farm level |
| MOTIFS | Based on the equal importance of social, ecological and economic dimensions of sustainability. | Results presentation system allows for a comprehensive overview and comparison of the indicators | Unable to integrate issues across scales; Not capable of aggregating data and indicators |
| SEAMLESS | It supports the integrated assessment of agricultural systems at multiple scales (field, farm, region, EU and global). | Uses both top-down and bottom-up approaches; Considers issues across scales in developing indicators | Uses Triple Bottom Line approach; Data are not normalized; Not capable of aggregating indicators |
| MESMIS | It is based on an operational framework building on feedback from a number of case studies and examined in a set of socio-ecological contexts. | Justifications of indicators selection are documented; Can use both qualitative and quantitative data to develop indicators | Indicators are based only on primary data sources; Does not consider the issues of integration across scales and/or over time |
| SAFA | It is an open and participatory process under FAO guidelines guiding sustainability assessment that can be used as a self-evaluation tool for producers and food manufacturers. | Uses principles-based approaches; Uses both top-down and bottom-up approaches; Justifications of indicators selection are documented; Considers the issues of integration across scales | Not capable of aggregating indicators; Validation of the indicators is based on comparison and expert appraisal (without stakeholder appraisal) |
| Sustainability Goals | Sustainability Problems | Indicators | Unit | Dimension |
|---|---|---|---|---|
| Increasing the well-being (of farmers and society) over time | Low and insufficient income of farmers, and its instability | Farm income | IRR/farm | Economic |
| Insurance | % | Economic | ||
| Food self-sufficiency | % | Social | ||
| Inappropriate and unequal employment conditions | Discriminatory employment | % | Social | |
| Improving production processes and capacities through time | Low efficiency and productivity of production processes | Crop productivity | kg/ha | Economic |
| Lack of access or inadequate access of farmers to the required knowledge and information | Access to extension services | value | Social | |
| Conserving the environment over time | Lack of protection, and depletion and a shortage of water resources | Groundwater depletion | m3/ha | Environmental |
| Soil loss and salinity | Agrochemicals use | kg/ha | Environmental | |
| Reduced biodiversity caused by lack of environmental protection and drought | Biodiversity | value | Environmental |
| Sustainability Classes | Sustainability Indicators | Definitions |
|---|---|---|
| Demographic and natural | Population growth | This was measured as % growth rate. |
| Farm size | It was measured by ha of agricultural land. | |
| Education level | Here, the education level of each region (i.e., county) was calculated as the weighted average of the four levels of education scores (uneducated = 0; primary and informal = 1; secondary and high schools = 2; upper secondary and higher = 3) with the weight of the “number of farmers per level”. (indicator: Score 0 to 3) | |
| Urbanization | This indicator was calculated as % of urban population. | |
| Socio-economic | Technology availability and application | In the present study, the % of the proportion of total cultivated land area belonging to the agricultural land area with modern irrigation technologies (including drip irrigation and/or rain irrigation) was used as a proxy for access level or availability and application of technology. |
| Levels of poverty | Poverty levels were measured as % of the rural population living below the poverty line in each region (i.e., county) during the year. | |
| Political and institutional | Governance and institutional capacities | Here, the average of six indices of control of corruption, government effectiveness, political stability and absence of violence/terrorism, rule of law, regulatory quality, voice and accountability—provided by the World Bank [25] *—were used as proxy for the “governance and institutional capacities” (For more information see: References [26,27,28]).* These indices are presented internationally and at the national level, so we used them for values that include no-dimensional scores of −2.5 to 2.5 for Iran and their annual changes for the study counties. |
| Producer organizations and social capital as participation | In the current study, this indicator was measured as the % of farmers participating in agricultural cooperatives. |
| County | CIEcSS | CISoSS | CIEnSS | CIASS | ||||
|---|---|---|---|---|---|---|---|---|
| 2015 | 2003 | 2015 | 2003 | 2015 | 2003 | 2015 | 2003 | |
| Bardsir | 0.462 | 0.413 | 0.959 | 0.423 | 0.893 | 0.641 | 0.762 | 0.499 |
| Ravar | 0.377 | 0.277 | 0.893 | 0.177 | 0.944 | 0.428 | 0.737 | 0.302 |
| Rafsanjan and Anar | 0.335 | 0.296 | 0.53 | 0 | 0.833 | 0.647 | 0.575 | 0.335 |
| Zarand and Kuhbanan | 0.276 | 0.292 | 0.592 | 0.046 | 0.883 | 0.333 | 0.591 | 0.233 |
| Sirjan | 0.368 | 0.487 | 0.618 | 0.304 | 0.81 | 0.756 | 0.603 | 0.53 |
| Shahr-e-Babak | 0.33 | 0.818 | 0.67 | 0.147 | 0.786 | 0.601 | 0.597 | 0.539 |
| Kerman | 0.507 | 0.529 | 0.743 | 0.172 | 0.802 | 0.849 | 0.685 | 0.539 |
| Mean | 0.379 | 0.445 | 0.715 | 0.181 | 0.85 | 0.608 | 0.65 | 0.425 |
| 0.412 | 0.448 | 0.729 | 0.538 | |||||
| Year | Bardsir | Ravar | Rafsanjan and Anar | Zarand and Kuhbanan | Sirjan | Shahr-e-Babak | Kerman |
|---|---|---|---|---|---|---|---|
| 2003 | 0.482 | 0.29 | 0.576 | 0.215 | 0.802 | 0.735 | 0.823 |
| 2015 | 0.457 | 0.215 | 0.137 | 0.517 | 0.506 | 0.345 | 0.5 |
© 2018 by the authors. Licensee MDPI, Basel, Switzerland. This article is an open access article distributed under the terms and conditions of the Creative Commons Attribution (CC BY) license (http://creativecommons.org/licenses/by/4.0/).
Share and Cite
Fallah-Alipour, S.; Mehrabi Boshrabadi, H.; Zare Mehrjerdi, M.R.; Hayati, D. A Framework for Empirical Assessment of Agricultural Sustainability: The Case of Iran. Sustainability 2018, 10, 4823. https://0-doi-org.brum.beds.ac.uk/10.3390/su10124823
Fallah-Alipour S, Mehrabi Boshrabadi H, Zare Mehrjerdi MR, Hayati D. A Framework for Empirical Assessment of Agricultural Sustainability: The Case of Iran. Sustainability. 2018; 10(12):4823. https://0-doi-org.brum.beds.ac.uk/10.3390/su10124823
Chicago/Turabian StyleFallah-Alipour, Siavash, Hossein Mehrabi Boshrabadi, Mohammad Reza Zare Mehrjerdi, and Dariush Hayati. 2018. "A Framework for Empirical Assessment of Agricultural Sustainability: The Case of Iran" Sustainability 10, no. 12: 4823. https://0-doi-org.brum.beds.ac.uk/10.3390/su10124823