Improvement of the K-Factor of USLE and Soil Erosion Estimation in Shihmen Reservoir Watershed


1
Disaster Prevention Technology Research Center, Sinotech Engineering Consultants, Taipei 11494, Taiwan
2
Department of Civil Engineering, National Taipei University of Technology, Taipei 11494, Taiwan
*
Author to whom correspondence should be addressed.
Sustainability 2019, 11(2), 355; https://doi.org/10.3390/su11020355
Submission received: 18 November 2018
/
Revised: 3 January 2019
/
Accepted: 8 January 2019
/
Published: 11 January 2019
(This article belongs to the Special Issue Soil Erosion and the Sustainable Management of the Landscape)
Abstract
:The estimation of soil erosion in Taiwan and many countries of the world is based on the widely used universal soil loss equation (USLE), which includes the factor of soil erodibility (K-factor). In Taiwan, K-factor values are referenced from past research compiled in the Taiwan Soil and Water Conservation Manual, but there is limited data for the downstream area of the Shihmen reservoir watershed. The designated K-factor from the manual cannot be directly applied to large-scale regional levels and also cannot distinguish and clarify the difference of soil erosion between small field plots or subdivisions. In view of the above, this study establishes additional values of K-factor by utilizing the double rings infiltration test and measures of soil physical–chemical properties and increases the spatial resolution of K-factor map for Shihmen reservoir watershed. Furthermore, the established values of K-factors were validated with the designated value set at Fuxing Sanmin from the manual for verifying the correctness of estimates. It is found that the comparative results agree well with established estimates within an allowable error range. Thus, the K-factors established by this study update the previous K-factor system and can be spatially estimated for any area of interest within the Shihmen reservoir watershed and improving upon past limitations.
1. Introduction
Due to the effects of climate change, the probability of extreme weather occurrence has increased in the last few decades [1]. In the mountainous regions of Taiwan, high intensity and long duration rainfall events leads to enormous magnitudes of sediment material to be carried down slope and downstream inducing emergency and disaster events [2,3]. These events have led to shifting in stream flows, enormous deluge flows, and sediment-related disasters that have damaged reservoirs and reduced their life span. The heavy siltation around these reservoirs has reduced their functionality as sources of potable water to nearby communities and villages [4]. This has led to great economic losses especially in farming communities and, due to the frequency of these events, great economic losses on a national scale.
In Taiwan, Shihmen reservoir is the third largest water storage facility and began operation in June, 1964 (see Figure 1). During the flood seasons of 2001 to 2005, typhoons Toraji, Nari, Aere, Haitang, Matsa, Talim, and Longwang struck Taiwan and caused serious sediment-related disasters. Large amounts of sediment were washed into the reservoir, resulting in increased turbidity both in the reservoir and its upstream watershed. Reservoir turbidity increased from normal levels (between 30–50 NTU, nephelometric turbidity units) to between 80,000–120,000 NTU. This far exceeded the capacity of water treatment plant and lowered its production, triggering water shortage [5]. It had tremendous impacts on the Taiwan public and industry. Therefore, the current greatest challenge for post-event recovery of service and return to normalcy for Shihmen reservoir is sedimentation [4,5]. Increases in sedimentation may be due to the effects of human development or natural factors and has direct impact by increasing turbidity and reducing reservoir storage volume. Sedimentation also affects the transportation systems, river course, and water supply. In typhoon seasons, there are massive volumes of sediment transported from the upstream area. This is mainly due to soil erosion from the surface runoff of bare slopes containing fine particle soils. It is difficult to control these sediment sources and remediation after events is limited and costly. The recent use of remote sensing technology has effectively estimated the sediment quantity generated by landslides. However, the amount of soil erosion is limited by its uneven temporal and spatial distribution and is influenced by the hydrological conditions, terrain characteristics, soil structure, and vegetation condition [6,7,8,9,10].
Currently, there is no clear prediction model that can effectively calculate soil erosion quantity [11]. Empirical equations and models to assess soil erosion have been established by taking consideration of site investigation, land use (e.g., forestry, grazing, and cultivation), land slope (e.g., length, gradient, shape, roughness, and aspect), inducing factors (e.g., rainfall distribution), and soil type characteristics (e.g., structure, texture, depth, and organic content). Some of the most well-known and easy-to-implement models are the soil loss equations such as USLE, MUSLE (modified universal soil loss equation), and RUSLE (revised universal soil loss equation) [9,12,13]. Therefore, academics as well as government agencies employ empirical formulas to estimate soil erosion. The most common method is USLE. Researchers have conducted on-site testing for the Shihmen reservoir watershed to study the effectiveness of different vegetation cover on the amount of soil erosion and compared with USLE estimation results. These results suggest significant differences between empirical formula estimation and actual on-site testing values. Researchers found that a key factor affecting the accuracy of USLE results is the K-factor [14,15,16]. Soil erodibility refers to soil susceptibility to erosion. It is affected by inherent soil properties. The best-estimated method of K-factor for the development of USLE was obtained by direct measurement of soil erosion from field plots [7,17]. This study performed field infiltration tests incorporated with the measurements of soil physical-chemical properties to fulfill the following objectives: (1) to solve the limitations of practical applications of USLE to the Shihmen reservoir watershed by increasing the number of reference points and the accuracy of K-factor; (2) to establish a geospatial distribution of the K-factor of the Shihmen reservoir watershed using GIS; (3) to verify the results of these tests by comparisons of the K-factor using the Soil and Water Conservation Bureau (SWCB) [18] value set and the improved value set in this study.
2. Materials and Methods
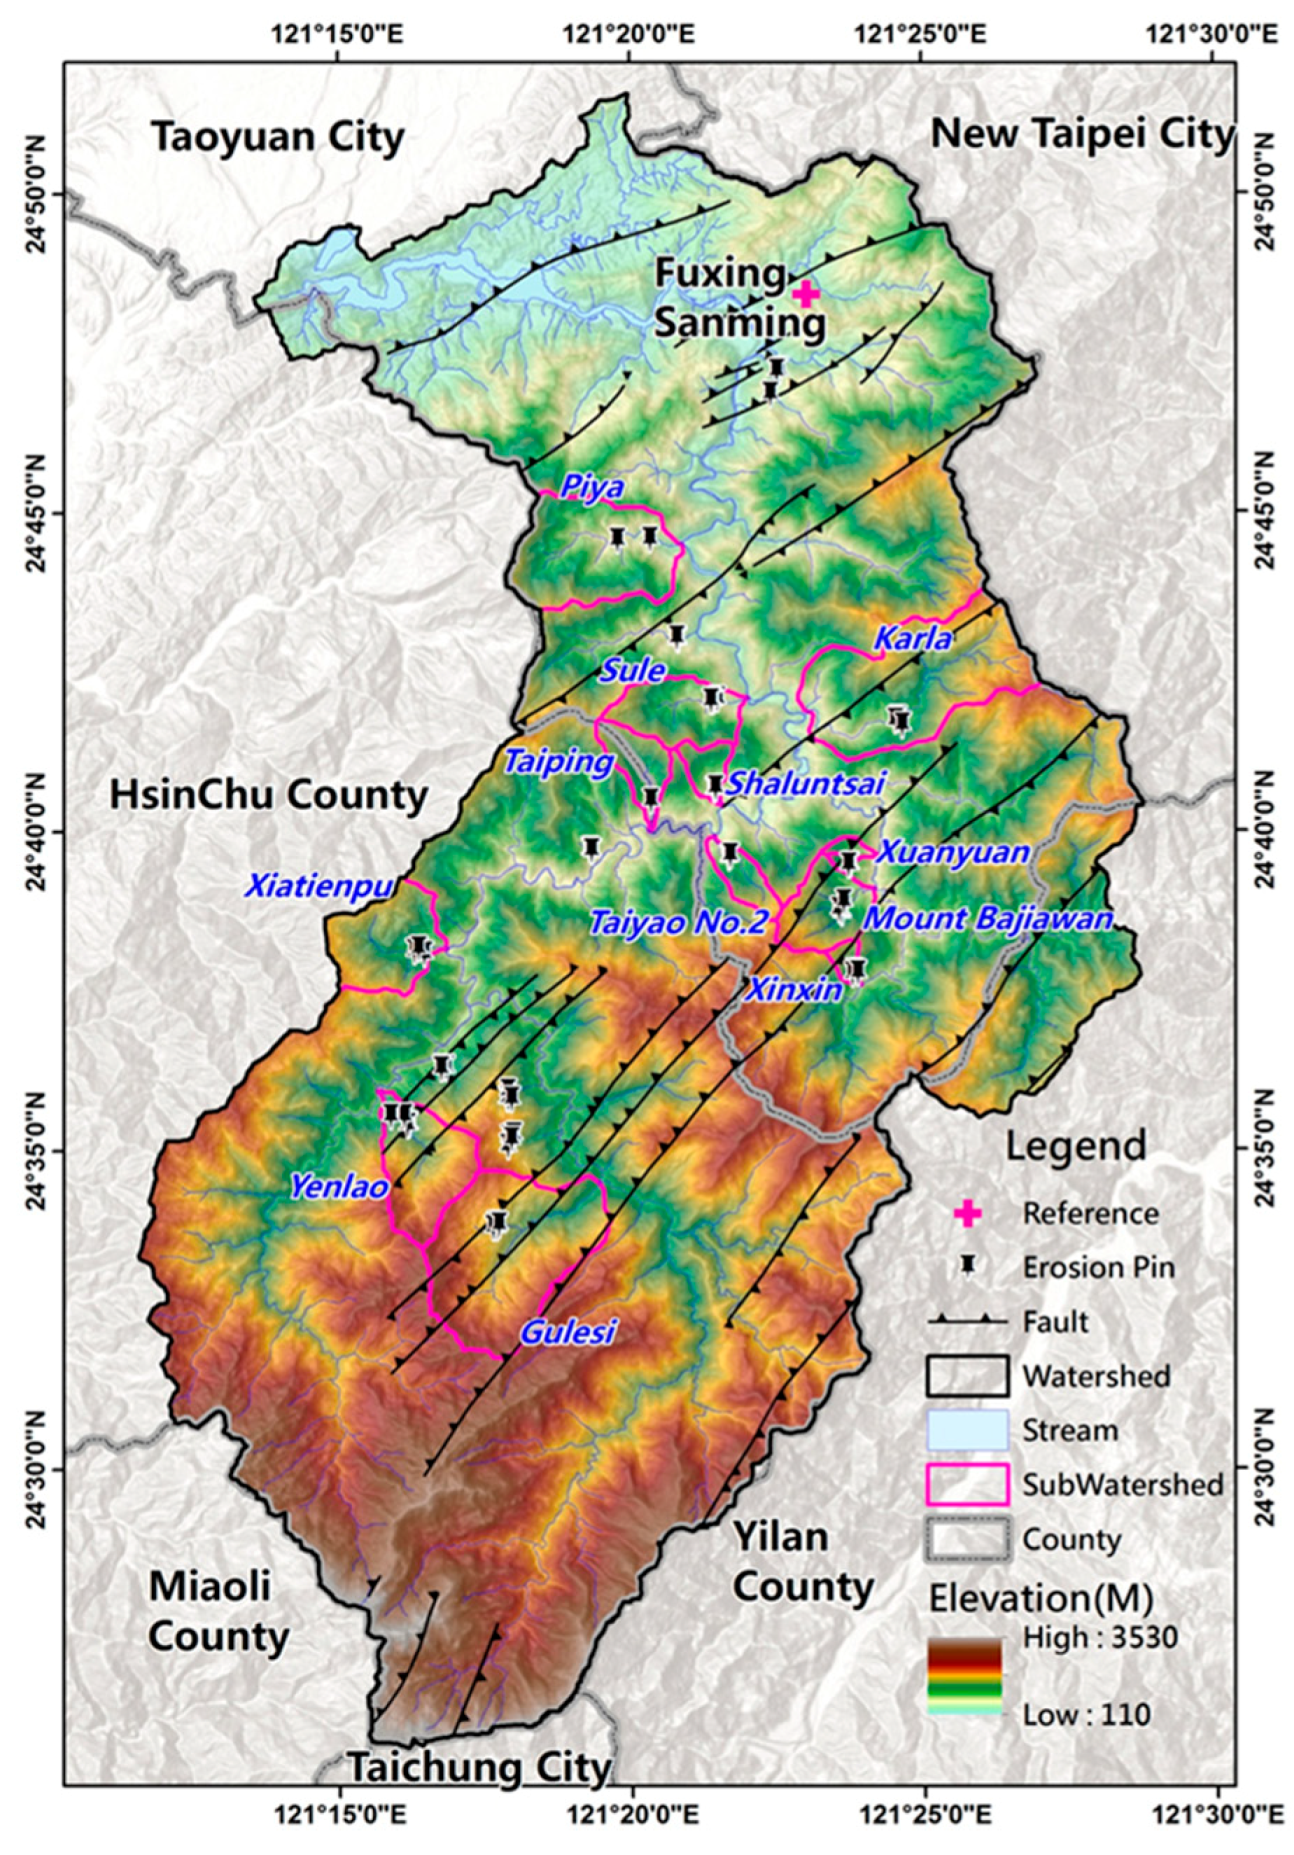
In the Taiwan Soil and Water Conservation Manual, K-factor was estimated by the reference values from 280 locations in Taiwan whose values were defined by only one is located within Shihmen reservoir watershed, and close to Fuxing Sanming (see Figure 1) [18]. This study utilizes the Shihmen reservoir watershed as the study area and considers 12 subwatersheds (namely Piya creek, Sule creek, Karla creek, Shaluntsai creek, Taiping creek, Taiyao no. 2 creek, Xiatienpu creek, Xuanyuan creek, Mount Bajiawan creek, Xinxin creek, Yenlao creek, and Gulesi creek at midstream and upstream of Shihmen reservoir watershed) to conduct a series of double rings infiltration tests and soil physical-chemical properties measurement to obtain rational soil erodibility factors and evaluate the impact of rainfall-induced soil loss on reservoir sedimentation.
2.1. Universal Soil Loss Equation
Taiwan Soil and Water Conservation Manual [18] clearly stipulates that whenever slopeland is involved in non-agricultural development, soil loss estimation before, during, and after development must be conducted. Furthermore, USLE [12] is recommended as the basis for soil loss estimation as shown in Equation (1). Its six main inputs for soil loss calculation reflect external and internal factors which specifically affect the rate of soil loss. Among them, external factors refer to rainfall erosivity (R), slope gradient (S), slope length (L), cover-management factor (C), and supporting practices factor (P). Internal factor refers to soil erodibility (K-factor). Soil erodibility mainly reflects the ability of soil to resist erosion, the impact of soil type on surface runoff quantity and its ability to resist surface runoff erosion. The six USLE factors often directly appear as individual, unique items to estimate the amount of soil erosion [12] as expressed in the following equation
where A is the annual average soil erosion per hectare (t ha−1 y−1); R is the annual average rainfall erosivity factor (MJ mm ha−1 h−1 y−1); K is the soil erodibility factor (t h MJ−1 mm−1); L is the slope length factor; S is the slope steepness factor; C is the vegetation cover and management factor; and P is the erosion control practice factor.
2.2. Study Area
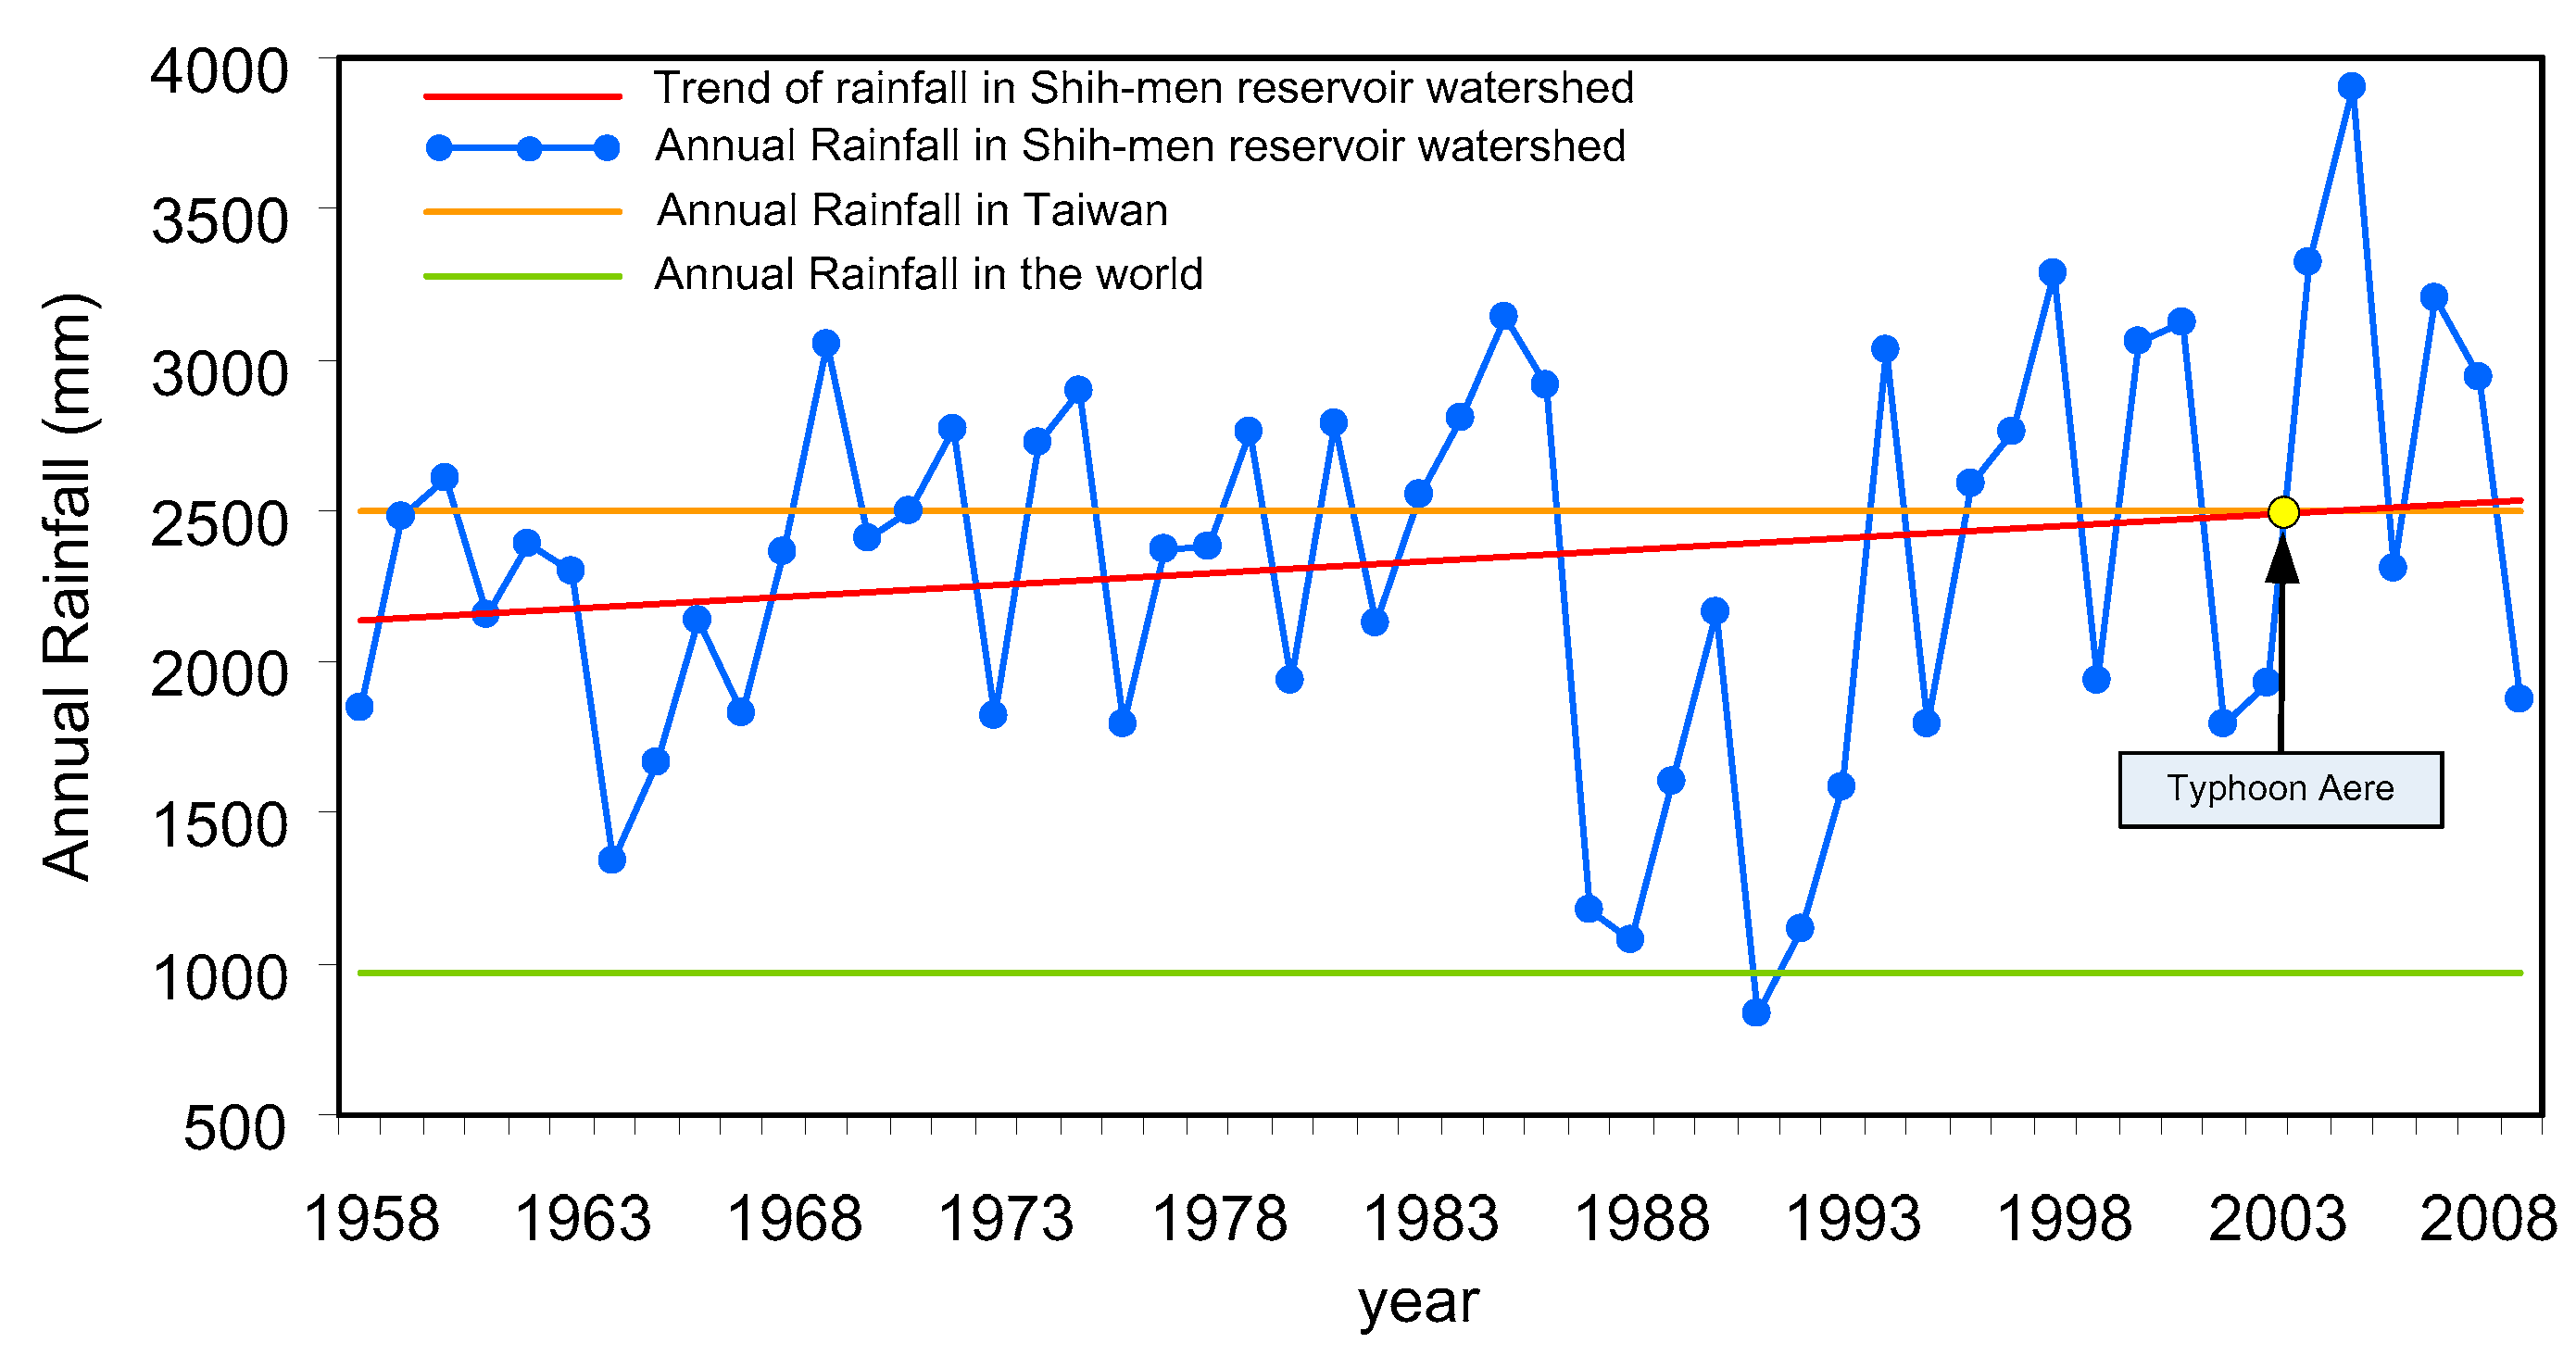
The study area is located in the Shihmen watershed. As shown in Figure 1. From north to south, Shihmen reservoir watershed has a unique terrain and geology. It has a complex river system and steep slopes. In terms of local administrative jurisdiction, the watershed includes Taoyuan, Hsinchu, and Yilan County. The transportation system of watershed relies heavily on highways, mountain roads, and forest roads. Most of the geological formations of Shihmen reservoir watershed are sedimentary rocks and mild metamorphic rocks. Fold lines and faults within the watershed go from northeast to southeast (see Figure 1). Almost all of its soil is stony soil, and the slope angle is generally between 20 to 45 degrees. The vegetation in the Shihmen reservoir watershed is generally coniferous and broadleaf forests, which are part of the national forest reserves. The mainstream in the Shihmen reservoir watershed is the Tahan river, upstream from the Tamsui river. The Tahan river has many tributaries with irregular patterns. The watershed is impacted by the subtropical monsoon climate with higher humidity and greater temperature changes. Research further suggests, from the historical trend of annual average rainfalls in Shihmen reservoir (as shown in Figure 2), that the average rainfall has markedly increased over the past 10 years. This is observed evidently after the 2004 typhoon Aere, where the watershed had the greatest annual average rainfall in Taiwan. The long-term impact of climate change indeed affects the hydrological condition.
The greatest sediment sources of Shihmen reservoir watershed are mainly contributions from upstream areas, after the effects of many extreme rainfall events. The heavy load of sediments transported after these events results in reduction of reservoir water storage. Immediately after the completion of the reservoir construction in 1963, typhoon Gloria hit northern Taiwan. The average accumulated rainfall was around 1375 mm, which broke the record of this watershed. This event detached and transported 19.43 × 10⁶ m3 of sediments to the Shihmen reservoir. However, typhoon Aere of 2004, with average accumulated rainfall of 967 mm, induced a large amount of sediment totalling 27.88 × 10⁶ m3 to be delivered and deposited in the reservoir, which exceeded the level of sedimentation by typhoon Gloria. Figure 3 shows the history of sedimentation in Shihmen reservoir. When typhoons affect this watershed, rapid sedimentation occurs at the Shihmen reservoir. Numerous studies have reported the causes of rapid sedimentation within Shihmen reservoir, especially in recent years. They are: (1) strong shaking/vibration induced by 1999 Chi-Chi earthquake mobilizing loose soil, fragmenting the surface layer of rock masses, opening prevalent cracks in the slopes of the watershed (see Figure 4a) and inducing induced widespread landslides and debris flows during heavy rainfall. (2) Climate change due to global warming induced more extreme weather conditions with higher rainfall intensity and longer duration (see Figure 2). (3) Silted-up check dams in the watershed inhibited the function of the dam in retaining the sediment yield from the upstream watershed (see Figure 4b,c). It is an important task to identify the distribution of sediments as a key step in solving the problem of reservoir sedimentation. After 2004’s typhoon Aere, SWCB commenced multiple programs of field investigation on distribution of sediment sources including landslide, river deposits, and soil erosion. From September 2008 to October 2011, SWCB monitored 55 sites by erosion pins (each site had 10 pins) (see Figure 4d) to measure surface erosion depth of vegetated slopes and to evaluate the effectiveness of remediation of slopes in suppressing soil loss [4].
2.3. Soil Erodibility Estimation
Previous research has maintained that, among the six USLE factors, there are great difficulties in the quantification of K-factor. This factor is a quantification index of in-situ soil resistance to the processes of separation and transportation. Therefore, it can be considered ‘soil erosion resistance’. Soil erosion resistance is affected by the weathering extent of the bedrock within soil as well as external terrain, topography, climate, vegetation coverage, development, soil and water conservation, erosion extents, etc. The soil erosion resistance decreases as the soil erodibility increases. The values expressed for K-factor is regional, varies spatially, and is low precision for estimating the soil erosion of large-scale watersheds. Moreover, it cannot differentiate the erosion differences in small areas or plots. These issues create deviations in soil erosion estimates. Also, these values may only be applicable to limited areas downstream and is not representative of the amount of soil erosion for each sub-watershed. Therefore, the estimated results based on these values are greater than real data from field measurement [4,11,19]. Many researchers have conducted in-depth studies to develop algebraic approximations or empirical equations for predicting the K-factor [13,17,19,20,21,22,23,24,25]. The establishment of the parameters employed in these equations to calculate K-factor factor require performing field and laboratory tests on different soil samples. The most common method of soil erodibility calculation is the soil erodibility nomograph [13]. The nomograph considers additional factors and the variability of on-site factors (i.e., organic matter, soil structure, permeability rate, particle size, content, etc.). The proposed equation for estimating K-factor [13] can be expressed as
where
The following section introduces field and laboratory tests including soil organic matter test, soil particle size test, and double rings permeability test for precisely calculating K-factor. The proposed procedure to calculate K-factor is shown in Figure 5. The K-factor map will be generated by spatial interpolation methods such Kriging method from all of the K-factor value set developed by this study.
2.3.1. Soil Organic Matter Test
The organic matter of a soil directly affects its particle size, aggregation, and fertility. Organic materials are usually yellow-brown to black. Hence, the more organic matter, the darker the color of a soil sample. Therefore, from this method the soil organic matter and drainage condition can be roughly determined by its color. There are many ways to measure soil organic materials, such as colorimetry, titration, combustion method, etc. In this study, soil organic material test was tested using the wet oxidation process [26] to conduct soil sample titration and calculate soil organic matter.
2.3.2. Soil Particle Size Test
Sieve analysis and Bouyoucos Hydrometer Method is conducted on the soil sample taken from the site to determine soil structure parameters. The granular structure of the soil samples can be determined by sieve analysis which assesses the particle size distribution of a granular material by allowing the material to pass through a series of sieves. Soil particle size is estimated by its natural sinking speed in water, and cumulative percentage is estimated by liquid unit of differential sedimentation time. Thus, the distribution of soil particle size is classified and recorded. Moreover, weight percentages of particle size distribution are targeted and complemented by comparison against soil structure class listed in Table 2 to determine soil structure parameter value of each set of tested soil sample as shown in Equation (1).
2.3.3. Double Rings Infiltration Test
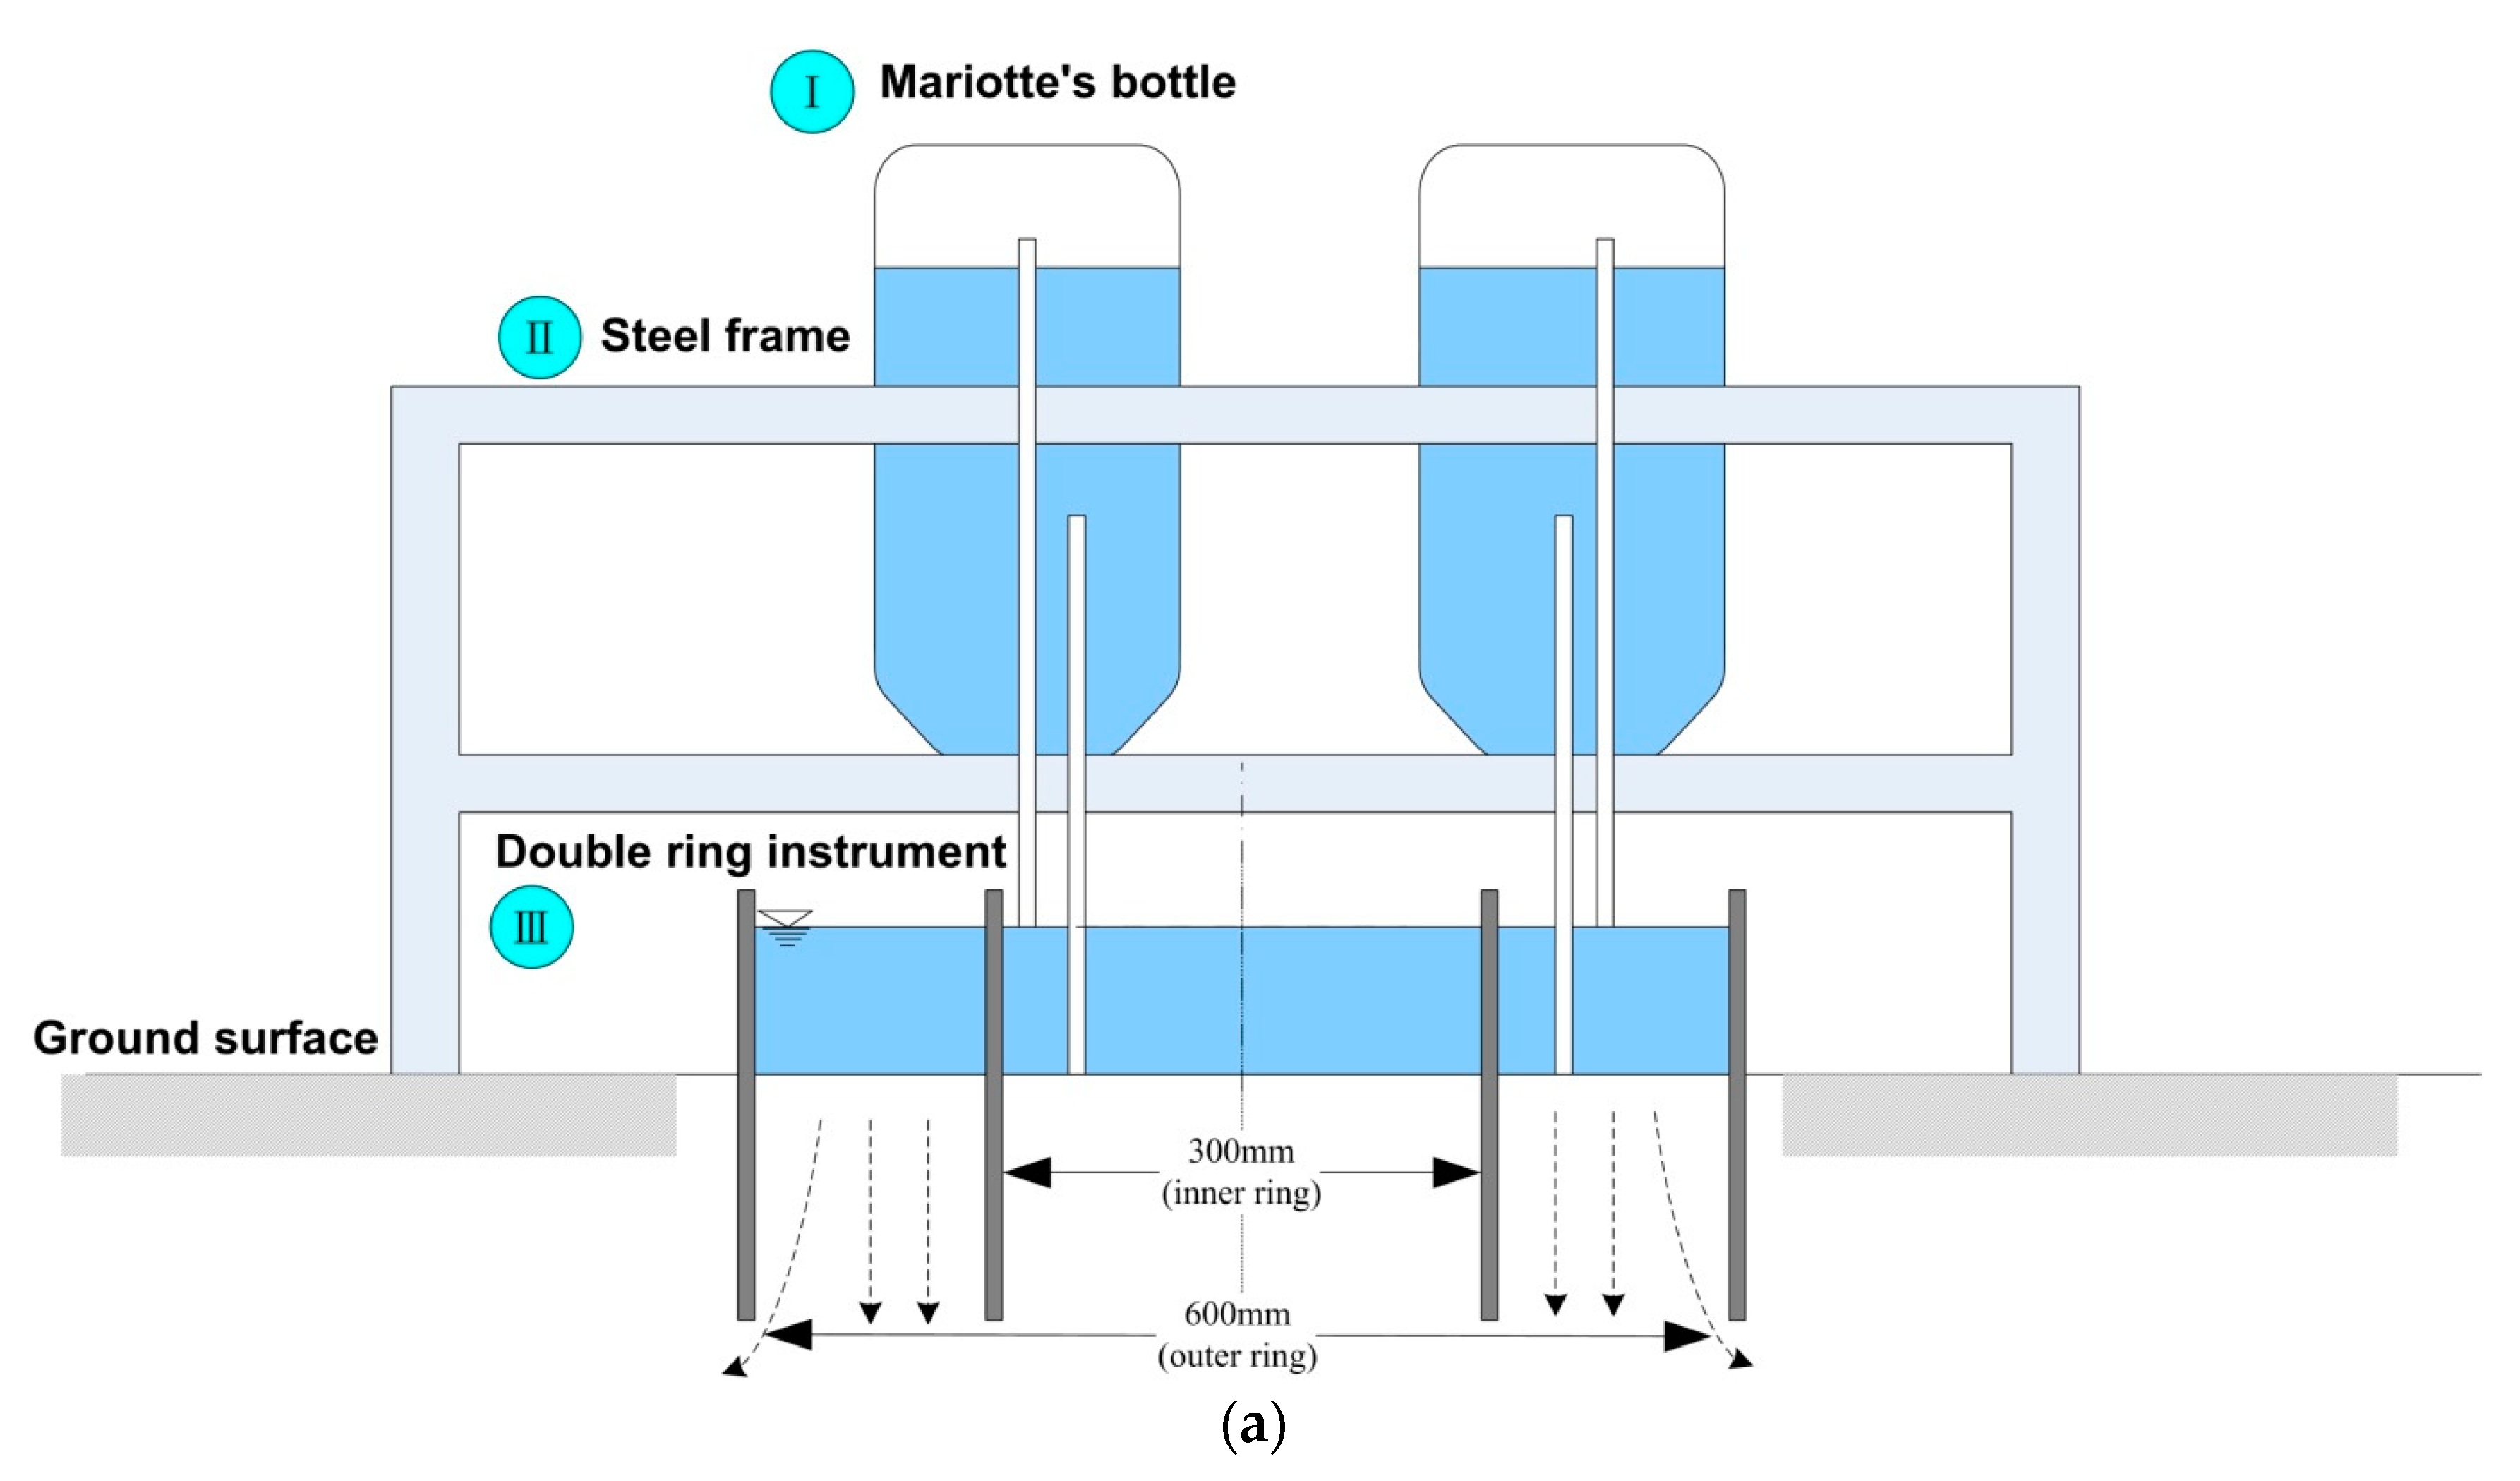
In general, soil permeability rate can be obtained via constant head or variable head tests of indoor saturated hydraulic conductivity or in-situ infiltration methods. The double rings infiltration test [27] is commonly used to estimate one dimensional vertical component flow of infiltration rate to understand the rainfall infiltration characteristics and rate. This test estimates surface soil vertical infiltration rate by the temporal change correlation of water level within Mariotte’s bottle to plot the infiltration curve. Horton infiltration equation is the most common method [28] and it reflects balanced soil infiltration rate under surface water accumulation and is represented in descending indices as
In the above equation, is the equilibrium infiltration rate, also known as saturated hydraulic conductivity. is the initial infiltration rate, and k is the coefficient of permeability; t is time.
The testing equipment in this study and their specifications are shown in Figure 6. When installing this equipment, a flat, smooth area greater than 1.2 m2 must be chosen to begin investigation. Additionally, all surface vegetation and rock debris must be completely removed. The selected location for this infiltration testing is positioned and recorded via GPS. The equilibrium infiltration rate () is estimated under different surface vegetation conditions in the tested area based on Horton infiltration equation. Additionally, this test estimates the equilibrium infiltration rate of each tested area. Soil permeability parameter for each testing set is obtained based on the corresponding infiltration rate referred to soil permeability class (see Table 2) for soil erodibility estimation.
3. Results and Discussion
This study considers 12 subwatersheds and within each subwatershed implements two soil sampling locations, one represents areas with vegetation cover and the other represents without vegetation cover (see Table 3). Therefore, a total 24 soil sampling locations are established in these areas (see Figure 1 and Figure 8). The double rings infiltration tests aim to simulate rainfall infiltrating soil to understand the surface infiltration behaviors under different environmental conditions in different locations. Soil organic matter test and soil particle size test for in-situ soil were conducted, and soil erodibility was estimated based on different soil types, textures, and contents. Soil erodibility estimation and soil loss comparison were carried out at these locations.
3.1. Results of Permeability Tests and Soil Organic Matter Measurements
The relevant results of the double rings permeability tests and the infiltration curves were plotted as shown in Figure 7. Simulations of the whole soil infiltration process, according to the Horton infiltration equation and using the results obtained in this study, suggests the equilibrium infiltration rates in the studied area fall between 5.508 and 192.96 (mm h−1). The results show that the equilibrium infiltration rate of soil samples within a subwatershed is greater for samples without vegetation cover than with vegetation cover (see Table 3). The greatest difference is at Mount Bajiawan creek subwatershed (II01 versus II02) and the lowest is at Piya creek (IA01 versus IA02). Among the sampling locations, the dense vegetation at Xiatienpu Torrent watershed has the highest equilibrium infiltration rate (IG02), and the exposed area at Xinxin River watershed has the lowest rate (IA02). It is observed that when rainfall volume is greater than a soil’s infiltration capacity, surface runoff increases. The increase in surface erosion by runoff shows that the soil has achieved its infiltration equilibrium capacity, which is a constant for each in-situ soil type. A low infiltration rate can be a sign of a dense soil with low porosity, while a higher infiltration rate is supporting evidence that the soil may be loosely packed or a coarse soil with channels for water infiltration. Moreover, fractured underlying bedrock may influence infiltration by encouraging fluid movement. A low infiltration rate correlates with a low infiltration equilibrium capacity.
Soil organic matter measurements determined that the organic matter of 24 soil samples were between 0.27–11.73%. The presence of organic matter is higher in areas of dense vegetation than exposed or cleared slope areas due to the vegetative cover acting as a source of organic matter. In case soil that has more the organic matters, this increases the specific surface area of soil to directly promote retention capacity of soil. The percentages range of the soil samples can be classified as 4~18% of very fine particles and flake/coarse particles, 12~65% of fine particles, medium/coarse particles, and soil coarse particles, and 2~15% of silt and very fine particles. Consequently, the main soil particle consists of coarse sand within Shihmen reservoir watershed. Therefore, the K-factor of 24 soil sampling within 12 subwatersheds can be progressively calculated using Equation (2) and the detailed results are listed in Table 3. The results show that the K-factor at Shihmen reservoir watershed is the highest at Piya creek sub-watershed (0.0077) and the lowest is at Taiping creek and Xuanyuan creek subwatersheds (0.0010).
3.2. K-Factor Comparison
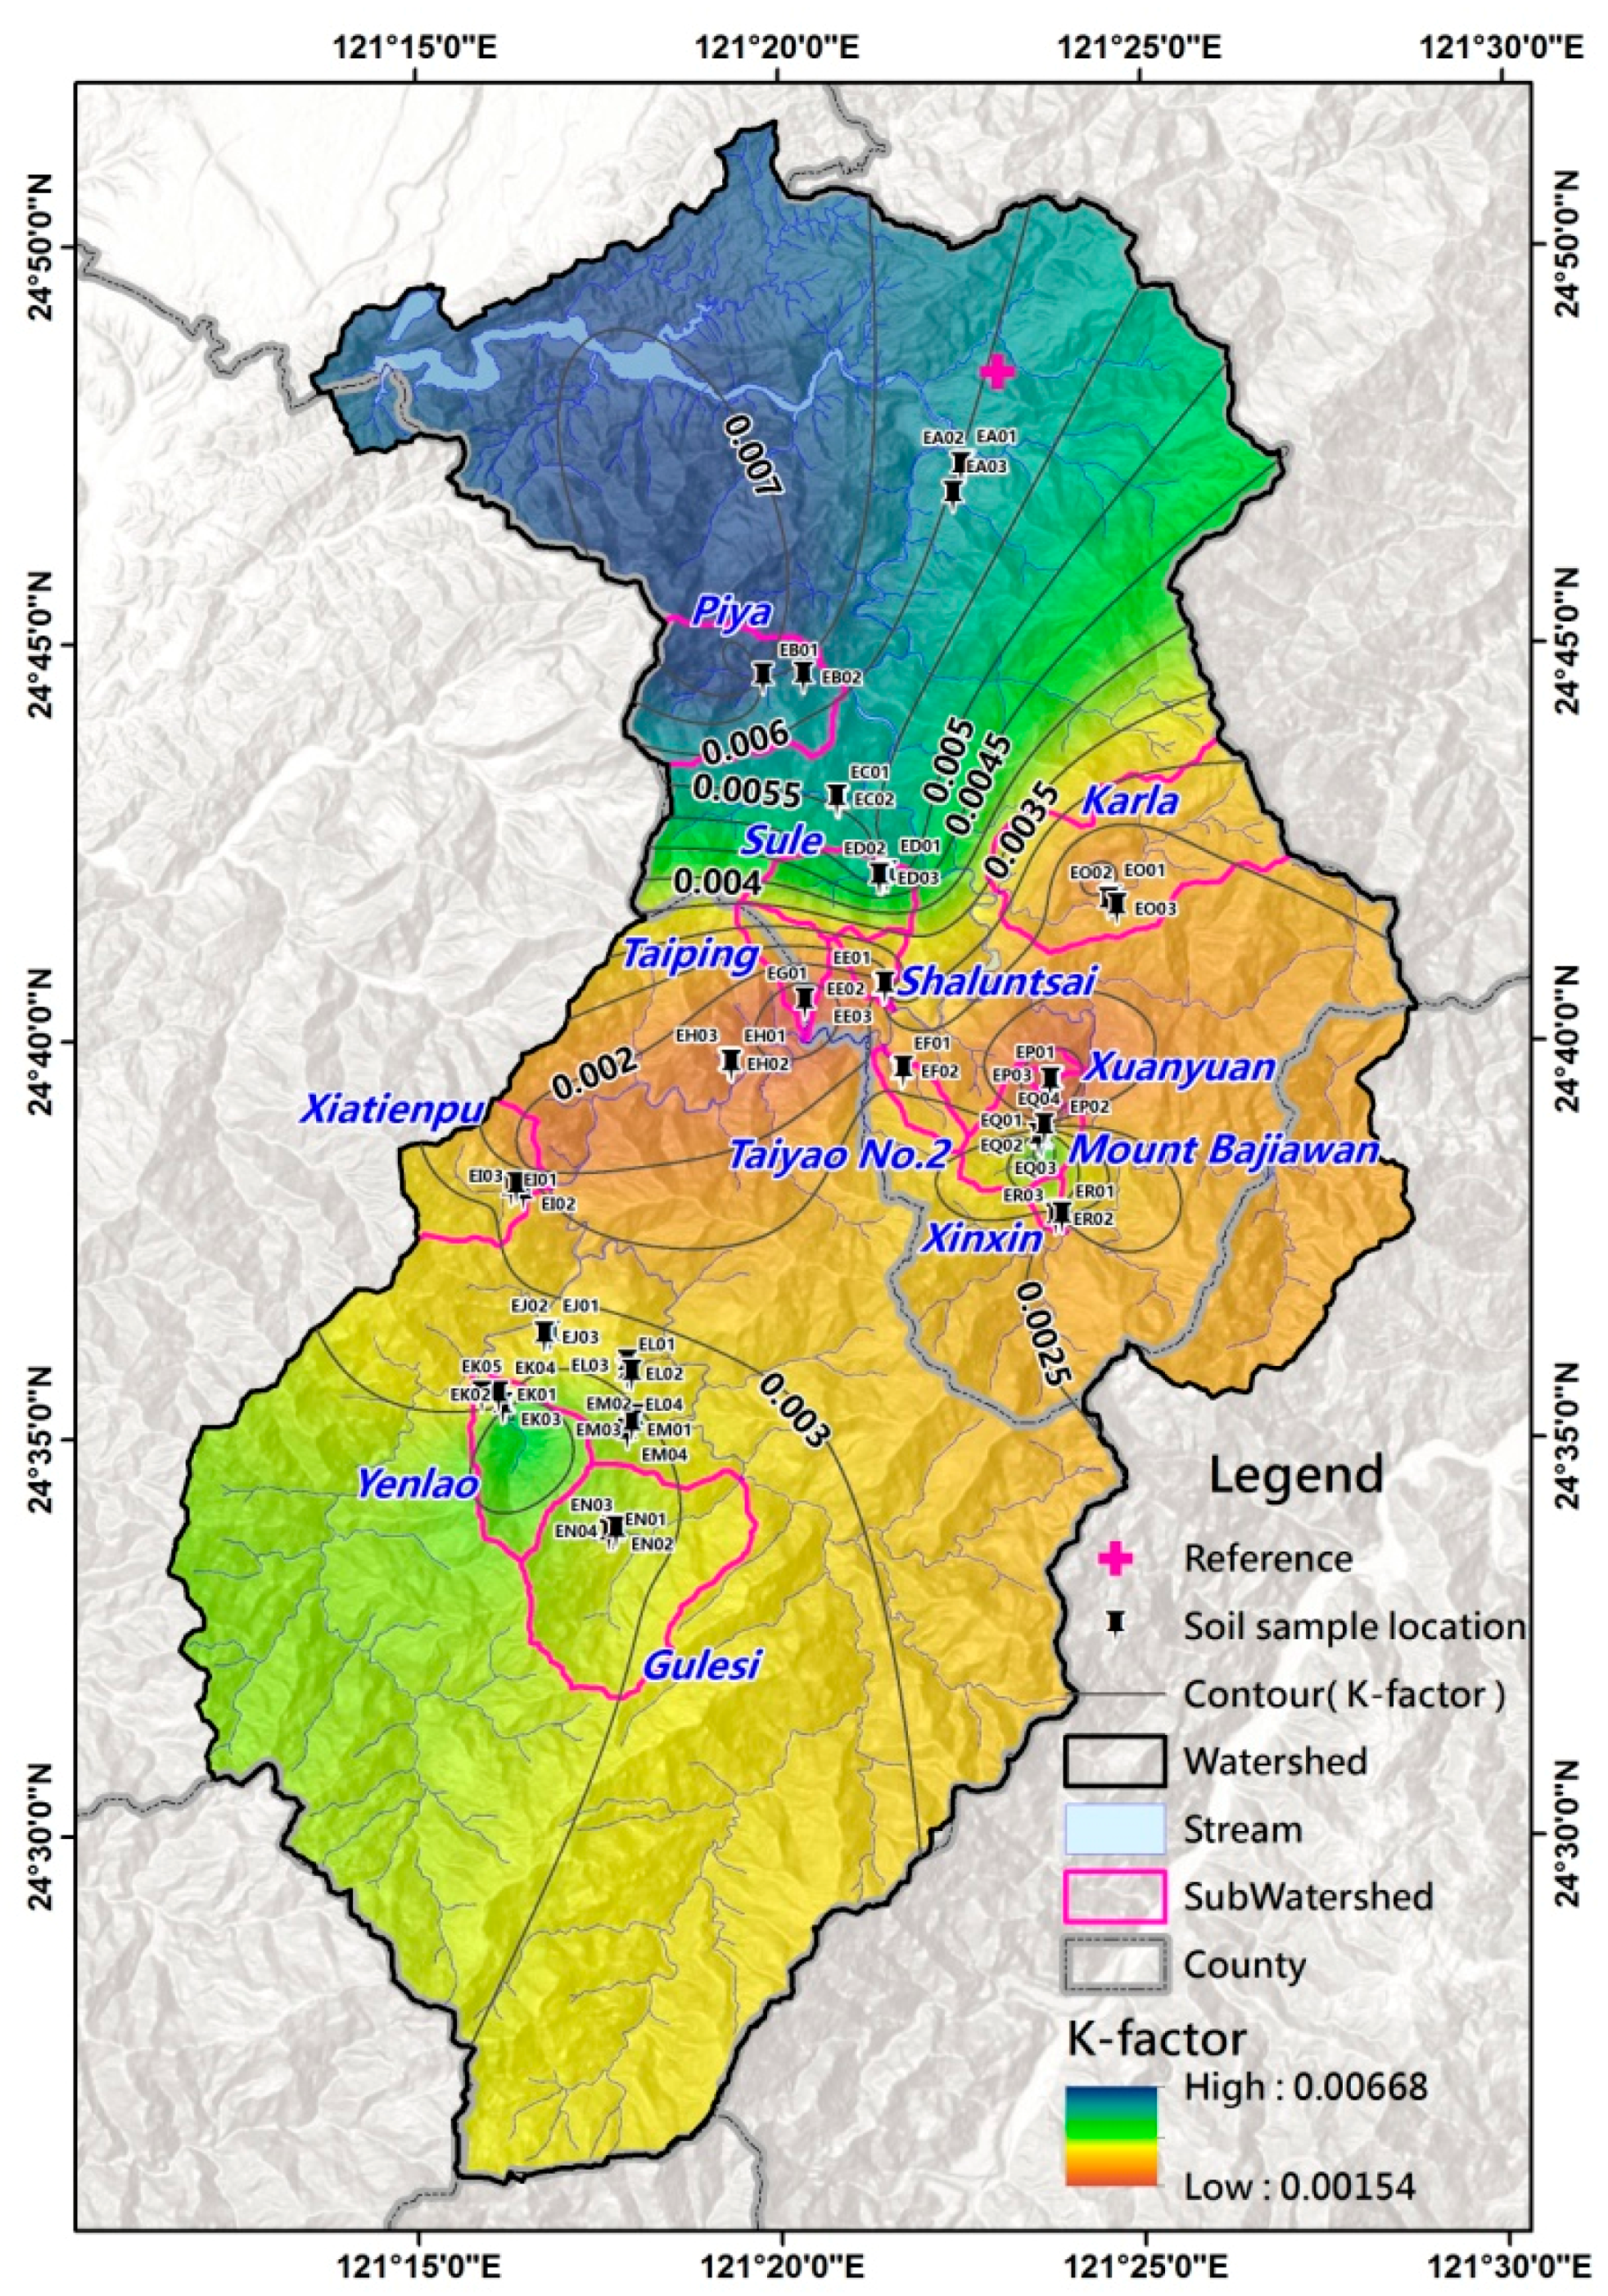
For spatial prediction, this study used Kriging method to interpolate and generate the K-factor map for the entire Shihmen reservoir watershed as shown in Figure 8. The K-factor values ranged from 0.00154 to 0.00668 and the average value is 0.003247. In this figure, the greatest and lowest K-factor value are in close proximity with Piya and Xuanyuan creeks, respectively. Generally, in Shihmen reservoir watershed, the soil erodibility downstream is greater than upstream. It is inferred that the soil erosion under rainfall event conditions in the downstream regions will be higher than in the central and upstream regions. For verification, this study estimated the K-factor value for the location at Fuxing Sanming in the Shihmen reservoir watershed is 0.003724 which is close to the given values of 0.0040 listed in the Taiwan Soil and Water Conservation Manual [18]. It is supported that 10% is an acceptable percent error during the current scientific research for watershed simulation [29]. The error in the comparative results of this study is 7% which is lower than 10% and is applicable for practical use in the Shihmen reservoir watershed. This validates the estimation in this study as a valuable reference for soil erosion analysis and for soil conservation planning. Therefore, the proposed map (see Figure 8) delivers an accurate and verifiable K-factor value for any specific location within Shihmen reservoir watershed.
3.3. Soil Erosion Validation
For validation of the proposed K-factor, this study employed USLE equation as shown in Equation (2) to derive the spatial distribution of soil erosion in the Shihmen reservoir based on two value sets of K-factors value, one which is proposed by this study and the other is the designated value of the Taiwan Soil and Water Conservation Manual [18]. This was followed by a comparison with real values from 55 sites monitored by erosion pins to validate with both estimated results and actual data, which can explain the advantage and increase of soil erosion estimation accuracy when only one K-factor reference value in Taiwan Soil and Water Conservation Manual [18] has been converted into regional and localized variables in spatial domain. Accordingly, Liu et al. [30] expressed that the equivalent depth () of the soil erosion for a study area can be calculated as
where
- A = total amount of soil erosion (MT) calculated by USLE as shown in Equation (1)
- de = the equivalent depth of the soil erosion (mm)
- area = area of sub-watershed (ha)
- γ = unit weight of soil (MT m−3) assuming that γ = 1.5 MT m−3
The preceding equation is utilized to calculate the amount of soil erosion in the 12 subwatersheds (including all of soil sampling locations). The comparative results with erosion pin data are listed in Table 4. The K-factor proposed by this study and the SWCB K-factor for the 12 subwatersheds are utilized to calculate USLE, while the other five factors remain constant, to compare the impact of the K-factor value sets on soil loss values. Most estimates are higher than the actual measured values from erosion pin, where the average value is greater than the measured value by approximately 1.09 to 1.43 times. The proposed method in this study is closer to the average measured value (6.28 mm versus 6.85 mm) (the average of the equivalent depth of the soil erosion in the 12 sub-watersheds). Regarding the difference between the actual value (erosion pins) and estimated value (USLE) of the soil erosion for each subwatershed, the error is calculated and listed in Table 5. Table 5 shows that for the improved K-factor implemented in USLE, the minimum error is 2.85%, the average is 40.16% and the maximum is 129%. With the K-factor designated by SWCB, the minimum error is 6.55%, the average is 62.17% and the maximum value of 207.35%. The proposed method of the study has a significant improvement over the SWCB values when compared by the error results. These results of this study reduce the estimation error averagely by 0.56 times lower than the SWCB K-factor when comparing USLE with erosion pin results in Shihmen reservoir watershed.
4. Conclusions
Soil erodibility is a sensitive parameter, which is related significantly to regional characteristics, soil structure, and weathering extent. As previously stated, K-factor designated by Taiwan Soil and Water Conservation Manual [18] has existed in Shihmen reservoir watershed for some time and was the standard method. The direct application of this value homogenizes and ignores the regional variability of soil erosion behavior. Kinnell [17] has pointed out the best estimated methods of soil erodibility are direct measurements on field plots. This study has obtained the soil permeability and structure parameters by field and laboratory tests to establish the regional K-factor values of the Shihmen reservoir watershed successfully. The reference K-factor values of Fuxing Sanmin within Shihmen reservoir watershed designated by Taiwan Soil and Water Conservation Manual [18] has been compared with the improved K-factor in this study. Furthermore, these improved K-factor adopted into USLE show good agreement with average real data from erosion pins. In conclusion, the results, methodology, and substantial observations can be summarized as follows:
- This study employed a series of field tests to measure changes in water infiltration by the double rings infiltration tests. The advantages of the double ring infiltration test are that this test avoids disturbing the soil and directly obtains the soil permeability parameters close to the actual situation. After validation of case areas, it is found that the improved K-factor decreases the error in accuracy between soil erosion equation estimates and the measurements by soil erosion pins. Thus, the improved K-factors updates the previous single value employed by the SWCB and can be implemented in any area of interest within the watershed.
- In view of the results of improved K-factor map in this study, this map provides an easy-to-use reference of soil erosion resistance and indicates zones of high soil erosion risk. It is worth noting that the K-factor of downstream with Shihmen reservoir watershed is greater than that of the middle and upper portions. This situation obviously reflects that land utilization is still developing by frequent human activities and soil-fixation plants can be employed for soil improvement to reduce soil loss and increase the productivity of agriculture in the watershed.
- The results show that the proposed method is feasible, which can help users to reduce the uncertainty of the choice of parameters when using USLE. Moreover, the key contribution is the procedure proposed by this study introduces a local test method for K-factor determination that can yield an improved K-factor map for countries like Taiwan. Additionally, this method can be employed for data scarce regions, such as small island developing states (SIDs) and less developed countries (LDCs), which have historically had limitations in their achievements on scientific research in K-factor analysis and USLE.
- This study effectively improves the data quality for the K-factor in Shihmen reservoir and is conducive to planning soil and water conservation requirements according to the local soil types in the given area. The procedure highlighted can provide a reference for improving the applicability of soil erosion estimation and the practical use of soil and water conservation
Author Contributions
Conceptualization, B.-S.L. and C.-K.C.; Software, C.-K.C.; Validation, B.-S.L. and C.-K.C.; Formal analysis, C.-K.H.; Investigation, C.-K.H.; Data curation, H.-C.H.; Writing—original draft preparation, B.-S.L. and K.T.; Writing—review and editing, B.-S.L., K.T., and C.-K.C.; Visualization, C.-K.C.; Supervision, B.-S.L.; Project administration, B.-S.L.; Funding acquisition, B.-S.L.
Funding
This study was partially supported by the Taiwan Soil and Water Conservation Bureau (grant numbers SWCB-100-008).
Acknowledgments
The financial assistance in funding this research work is gratefully appreciated.
Conflicts of Interest
The authors declare no conflict of interest.
References
- Intergovernmental Panel on Climate Change (IPCC). Summary for Policymakers; Part of the Working Group III Contribution to the Fifth Assessment Report of the Intergovernmental Panel on Climate Change; IPCC: Geneva, Switzerland, 2014. [Google Scholar]
- Chen, S.C.; Chou, H.T.; Chen, S.C.; Wu, C.H.; Lin, B.S. Characteristics of rainfall-induced landslides in Miocene formations: A case study of the Shenmu watershed, Central Taiwan. Eng. Geol. 2014, 169, 133–146. [Google Scholar] [CrossRef]
- Lin, C.W.; Chang, W.S.; Liu, S.H.; Tsai, T.T.; Lee, S.P.; Tsang, Y.C.; Shieh, C.L.; Tseng, C.M. Landslides triggered by the 7 August 2009 Typhoon Morakot in southern Taiwan. Eng. Geol. 2011, 123, 3–12. [Google Scholar] [CrossRef]
- Soil and Water Conservation Bureau (SWCB). An Analysis on Historical Migration of Sediment Disaster in Shihmen Reservoir Watershed; SWCB: Nantou, Taiwan, 2011. (In Chinese)
- Hsiao, C.Y.; Lin, B.S.; Chen, C.K.; Chang, D.W. Application of airborne LiDAR technology in analyzing sediment-related disasters and effectiveness of conservation management in Shihmen Watershed. J. GeoEng. 2014, 9, 55–73. [Google Scholar]
- Ananda, J.; Herath, G. Soil erosion in developing countries: A socio-economic appraisal. J. Environ. Manag. 2003, 68, 343–353. [Google Scholar] [CrossRef]
- Humberto, B.C.; Rattan, L. Water erosion. In Principles of Soil Conservation and Management; Springer: Berlin/Heidelberg, Germany, 2008; pp. 21–53. [Google Scholar]
- Strand, R.I.; Pemberton, E.L. Reservoir Sedimentation Technical Guidelines for Bureau of Reclamation; U.S. Bureau of Reclamation: Denver, CO, USA, 1982.
- Wischmeier, W.H.; Smith, D.D. Predicting Rainfall-Erosion Losses from Cropland East of the Rocky Mountains: Guide for Selection of Practices for Soil and Water Conservation; Agricultural Handbook No. 282; U.S. Department of Agricultural: Washington, DC, USA, 1965.
- Zhang, L.; O’Neill, A.L.; Lacey, S. Modelling approaches to the prediction of soil erosion in catchments. Environ. Softw. 1996, 11, 123–133. [Google Scholar] [CrossRef]
- Lin, B.S.; Thomas, K.; Chen, C.K.; Ho, H.C. Evaluation of Soil Erosion Risk for Watershed Management in Shenmu Watershed, Central Taiwan Using USLE Model Parameters, Central Taiwan. Paddy Water Environ. 2016, 14, 19–43. [Google Scholar] [CrossRef]
- Wischmeier, W.H.; Smith, D.D. Predicting Rainfall Erosion Losses; A Guide to Conservation Planning; Agricultural Handbook; No. 537; Agricultural Research Service, United States Department of Agriculture: Washington, DC, USA, 1978.
- Wischmeier, W.H.; Johnson, C.B.; Cross, B.V. A soil erodibility nomograph for farmland and construction sites. J. Soil Water Conserv. 1971, 26, 189–193. [Google Scholar]
- Wann, S.S.; Hwang, J.I. Soil erosion on hillslopes of Taiwan. J. Chin. Soil Water Conserv. 1989, 20, 17–45. (In Chinese) [Google Scholar]
- Wu, C.C.; Lo, K.F.; Lin, L.L. Handbook of Soil Loss Estimation; National Pingtung University of Science and Technology: Pingtung, Taiwan, 1996. (In Chinese) [Google Scholar]
- Lin, L.L.; Chang, S.T. Study of soil erodibility factor estimation equations. J. Chin. Soil Water Conserv. 2008, 39, 355–366. (In Chinese) [Google Scholar]
- Kinnell, P.I.A. Event soil loss, runoff and the Universal Soil Loss Equation family of models: A review. J. Hydrol. 2010, 385, 384–397. [Google Scholar] [CrossRef]
- Soil and Water Conservation Bureau (SWCB). Taiwan Soil and Water Conservation Manual; SWCB: Nantou, Taiwan, 2017. (In Chinese)
- Lin, B.S.; Chen, C.K.; Hsu, C.K.; Thomas, K.; Chen, W. Establishing the soil erodibility index using the application of double rings and Soil Physical-chemical properties Testing. In Proceedings of the International Symposium on Remote Sensing 2018, Pyengchang, Korea, 9–11 May 2018. [Google Scholar]
- EI-Swaify, S.A.; Dangler, E.W. Erodibilities of selected tropical soils in relation to structural and hydrological parameters. In Soil Erosion: Prediction and Control; Soil Conservation Society of America: Ankeny, ID, USA, 1976; pp. 104–114. [Google Scholar]
- Panagos, P.; Meusburger, K.; Ballabio, C.; Borrelli, P.; Alewell, C. Soil erodibility in Europe: A high-resolution dataset based on LUCAS. Sci. Total Environ. 2014, 479–480, 189–200. [Google Scholar] [CrossRef] [PubMed]
- Römkens, M.J.M.; Roth, C.B.; Nelson, D.W. Erodibility of selected clay subsoils in relation to physical and chemical Properties. Soil Sci. Soc. Am. J. 1977, 41, 954–960. [Google Scholar] [CrossRef]
- Torri, D.; Poesen, J.; Borselli, L. Predictability and uncertainty of the soil erodibility factor using a global dataset. CATENA 1997, 31, 1–22. [Google Scholar] [CrossRef]
- Wang, B.; Zheng, F.; Guan, Y. Improved USLE-K factor prediction: A case study on water erosion areas in China. Int. Soil Water Conserv. Res. 2016, 4, 168–176. [Google Scholar] [CrossRef]
- Young, R.A.; Mutchler, C.K. Erodibility of some Minnesota soils. J. Soil Water Conserv. 1977, 32, 180–182. [Google Scholar]
- Nelson, D.W.; Sommers, L.E. Total Carbon, Organic Carbon and Organic Matter. In Chemical and Microbiological Properties; American Society of Agronomy: Madison, WI, USA, 1982; pp. 539–577. [Google Scholar]
- Parr, J.R.; Bertrand, A.R. Water infiltration into soils. Adv. Agron. 1960, 12, 311–363. [Google Scholar]
- Horton, R.E. An approach toward a physical interpretation of infiltration capacity. Soil Sci. Soc. Am. Proc. 1940, 5, 399–417. [Google Scholar] [CrossRef]
- Moriasi, D.N.; Arnold, J.G.; Van Liew, M.W.; Bingner, R.L.; Harmel, R.D.; Veith, T.L. Model evaluation guidelines for systematic quantification of accuracy in watershed simulations. Trans. ASABE 2007, 50, 885–900. [Google Scholar] [CrossRef]
- Liu, Y.H.; Li, D.H.; Chen, W.; Lin, B.S.; Seeboonruang, U.; Tsai, F. Soil erosion modeling and comparison using slope units and grid cells in Shihmen reservoir watershed in northern Taiwan. Water 2018, 10, 1387. [Google Scholar] [CrossRef]
- Soil and Water Conservation Bureau (SWCB). Establishment of Rainfall Kinetic Energy Evaluating Equation and Modification of Annual Rainfall EROSION index in Northern Taiwan; SWCB: Nantou, Taiwan, 2015. (In Chinese)
Figure 1.
Geographical map illustrating the soil sample sites of mapping K-factor for the Shihmen reservoir watershed.
Figure 1.
Geographical map illustrating the soil sample sites of mapping K-factor for the Shihmen reservoir watershed.

Figure 2.
Average annual rainfalls in Shihmen reservoir watershed.

Figure 3.
History of sedimentation in Shihmen reservoir.

Figure 4.
Sediment sources, impact and monitoring within Shihmen reservoir watershed. (a) Large-scale landslide along the river flank. (b) Long-term deposition in river bed. (c) Ronghua check dam in the trunk river which is silted up with sediment. (d) Erosion pins measurement on the monitored sites.

Figure 5.
Proposed procedure for the generation of the improved K-factor map.

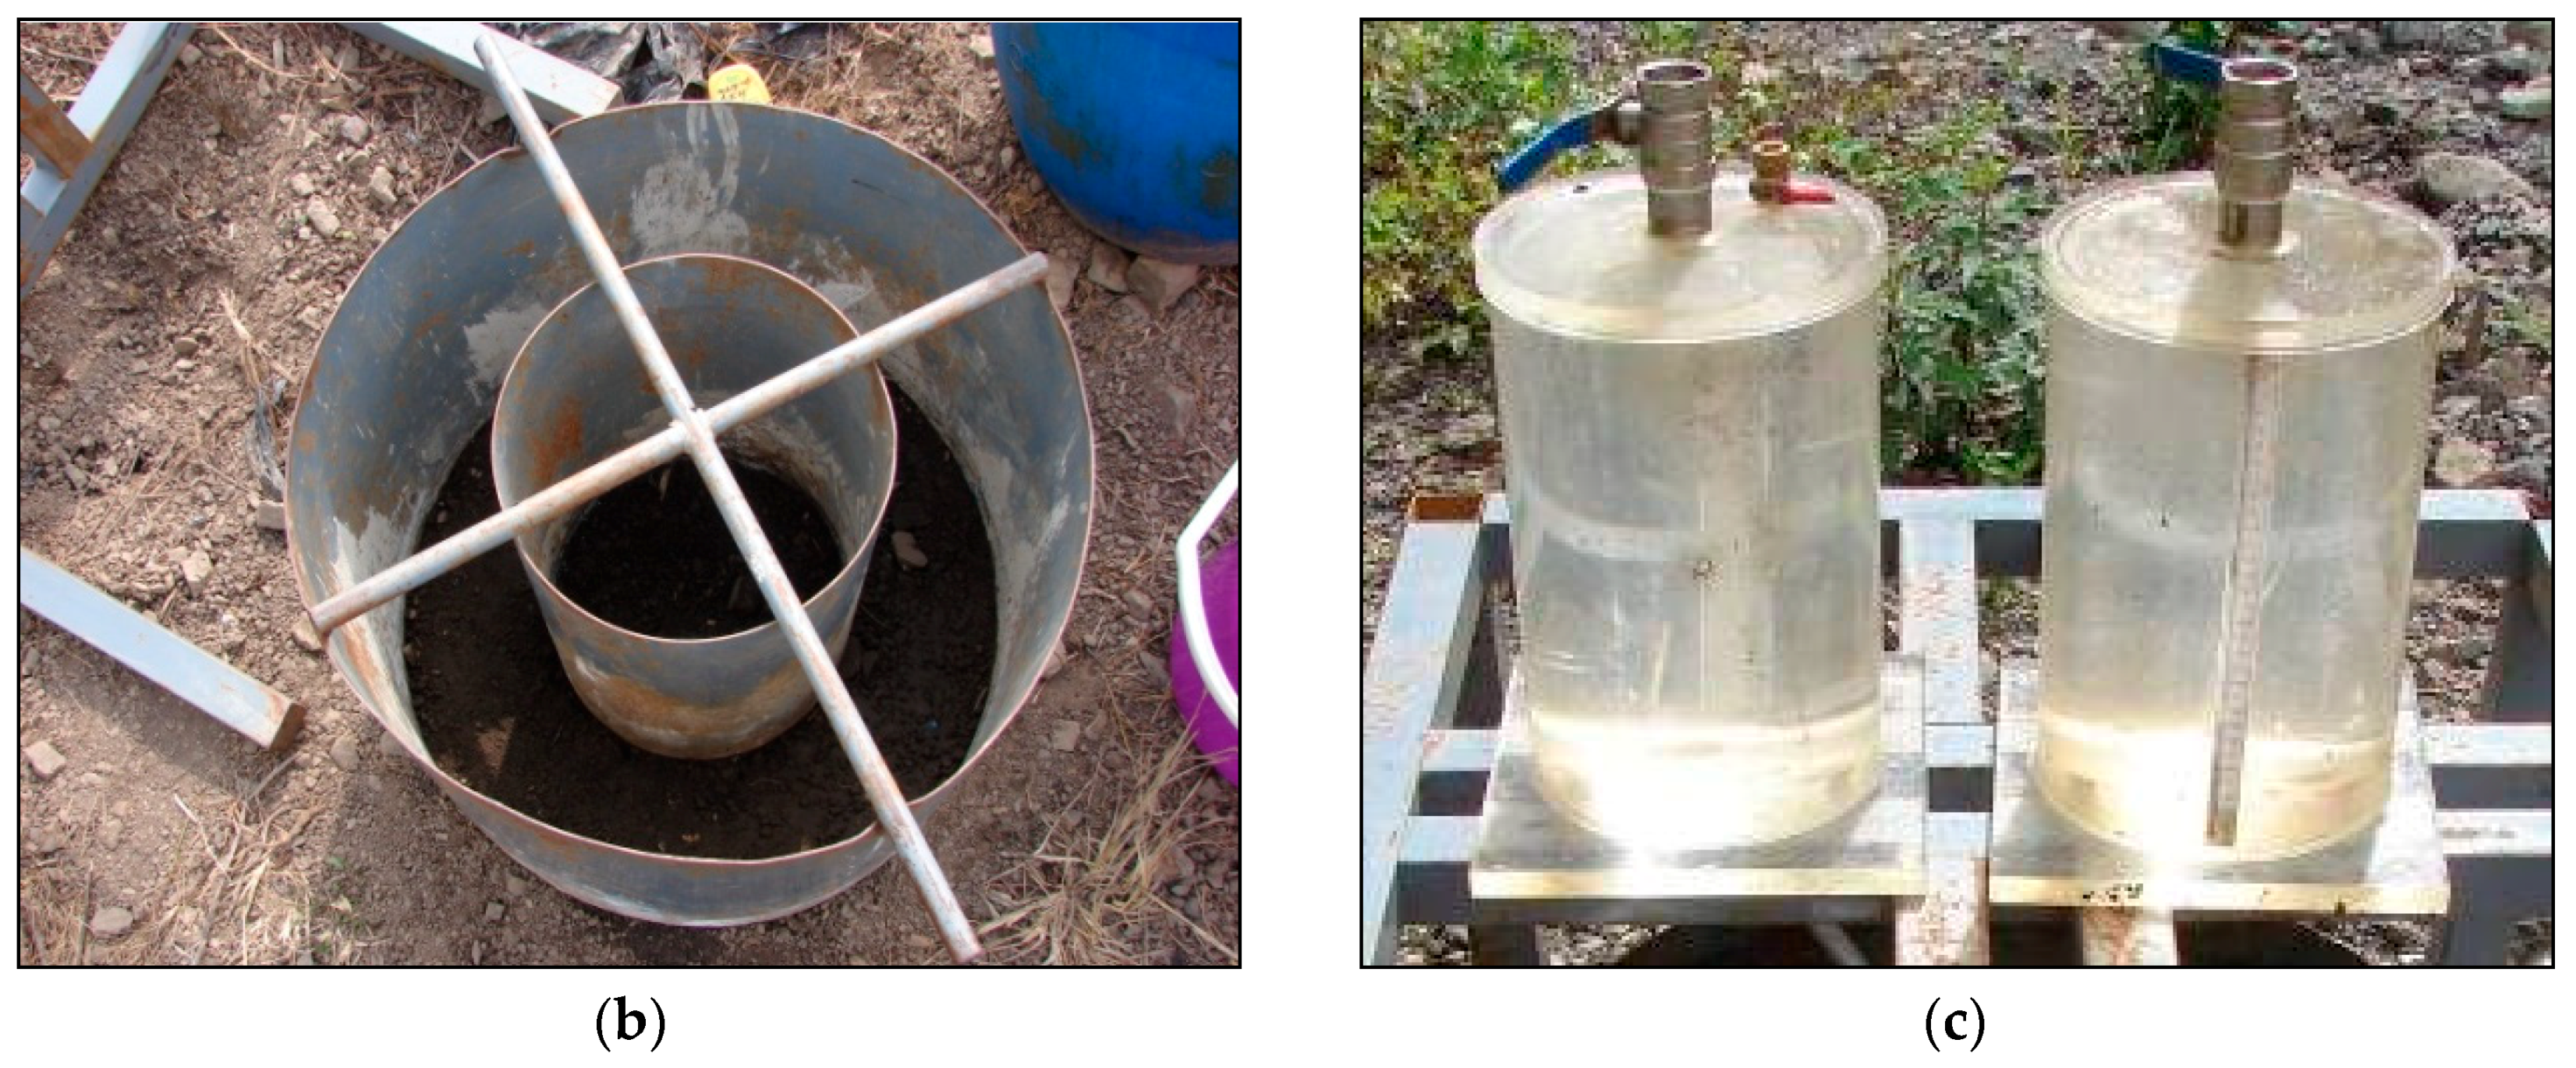
Figure 6.
The adopted double rings infiltration test. (a) Schematic layout of double rings infiltration test. (b) Photo of double ring instrument. (c) Photo of Mariotte’s bottle.
Figure 6.
The adopted double rings infiltration test. (a) Schematic layout of double rings infiltration test. (b) Photo of double ring instrument. (c) Photo of Mariotte’s bottle.


Figure 7.
Results of the double rings infiltration test for 24 soil samples with the 12 sub-watersheds.
Figure 7.
Results of the double rings infiltration test for 24 soil samples with the 12 sub-watersheds.

Figure 8.
Improved K-factor map of the Shihmen reservoir watershed.


Table 1.
Classes of soil structure in Taiwan.
| Structure Class (b) | Particle Size (mm) |
|---|---|
| 1–very fine granular | <1.0 |
| 2–fine granular | 1.0–2.0 |
| 3–medium or coarse granular | 2.0–10.0 |
| 4–blocky, platy or massive | >10.0 |
Table 2.
Classes of soil permeability in Taiwan.
| Permeability Class (c) | mm h−1 |
|---|---|
| 1 (very fast) | >125.0 |
| 2 (fast) | 62.5~125.0 |
| 3 (moderate) | 20.0~62.5 |
| 4 (moderate slow) | 5.0~20.0 |
| 5 (slow) | 1.25~5.0 |
| 6 (very slow) | <1.25 |
Table 3.
Results of the improved K-factor for the 24 soil samples within 12 sub-watersheds.
| NO. | Soil Organic Matter Test | Soil Particle Size Testing | Double Rings Infiltration Test | K-Factor | ||||
|---|---|---|---|---|---|---|---|---|
| Organic Matter Content (%) | Soil Structure Class | Silt and Very Fine Content (%) | Sand Content (%) | Soil Permeability Class | fc | (t h MJ−1 mm−1) | ||
| a | b | d | e | c | mm h−1 | |||
| Piya creek | IA01 * | 0.7 | 2 | 7 | 53 | 4 (moderate slow) | 5.508 | 0.0064 |
| IA02 # | 0.39 | 2 | 10 | 46 | 4 (moderate slow) | 5.976 | 0.0077 | |
| Sule creek | IB01 * | 5.11 | 2 | 7 | 50 | 4 (moderate slow) | 14.472 | 0.0051 |
| IB02 # | 0.81 | 3 | 4 | 45 | 3 (moderate) | 28.44 | 0.0056 | |
| Karla creek | IC01 * | 7.32 | 3 | 7 | 25 | 2 (fast) | 96.12 | 0.0016 |
| IC02 # | 1.35 | 3 | 12 | 44 | 1 (very fast) | 177.48 | 0.0026 | |
| Shaluntsa creek | ID01 * | 4.99 | 2 | 6 | 62 | 3 (moderate) | 56.52 | 0.0018 |
| ID02 # | 3.6 | 3 | 10 | 33 | 2 (fast) | 69.12 | 0.0033 | |
| Taiping creek | IE01 * | 11.57 | 3 | 2 | 26 | 2 (fast) | 101.52 | 0.001 |
| IE02 # | 10.6 | 3 | 5 | 34 | 2 (fast) | 123.84 | 0.0011 | |
| Taiyao No.2 creek | IF01 * | 3.79 | 2 | 13 | 56 | 2 (fast) | 92.52 | 0.002 |
| IF02 # | 0.81 | 3 | 12 | 45 | 1 (very fast) | 174.6 | 0.003 | |
| Xiatienpu creek | IG01 * | 4.26 | 3 | 12 | 48 | 1 (very fast) | 178.2 | 0.0016 |
| IG02 # | 0.93 | 3 | 12 | 45 | 1 (very fast) | 192.96 | 0.0029 | |
| Xuanyuan creek | IH01 * | 11.73 | 3 | 7 | 39 | 2 (fast) | 140.76 | 0.001 |
| IH02 # | 1.51 | 3 | 9 | 47 | 1 (very fast) | 154.08 | 0.0012 | |
| Mount Bajiawan creek | II01 * | 1.05 | 2 | 10 | 43 | 3 (moderate) | 24.984 | 0.0039 |
| II02 # | 0.5 | 3 | 8 | 46 | 2 (fast) | 84.6 | 0.0042 | |
| Xinxin creek | IJ01 * | 5.88 | 2 | 10 | 46 | 3 (moderate) | 35.136 | 0.0023 |
| IJ02 # | 4.45 | 3 | 10 | 40 | 2 (fast) | 91.8 | 0.0035 | |
| Yenlao creek | IK01 * | 3.99 | 3 | 15 | 12 | 2 (fast) | 72.72 | 0.0031 |
| IK02 # | 3.21 | 3 | 14 | 29 | 2 (fast) | 75.96 | 0.0046 | |
| Gules creek | IL01 * | 5.38 | 2 | 10 | 65 | 3 (moderate) | 57.96 | 0.0035 |
| IL02 # | 0.27 | 3 | 7 | 46 | 2 (fast) | 116.28 | 0.0037 | |
Note: (1) a, b, c, d, and e refer to the parameters of Equation (2); (2) Symbol *, # mean with vegetation cover and without vegetation cover respectively.
Table 4.
Comparative results of the two K-factor values.
| Sub-Watershed | Erosion Pins (mm) | This Study | SWCB [18] | ||
|---|---|---|---|---|---|
| The Improved K-Factor (t h MJ−1 mm−1) | Equivalent Soil Erosion Depth (de) (mm) | The Designated K-Factor (t h MJ−1 mm−1) | Equivalent Soil Erosion Depth (de) (mm) | ||
| Piya creek | 4.15 | 0.006013 | 9.51 | 0.004 | 6.33 |
| Sule creek | 5.78 | 0.004165 | 7.79 | 0.004 | 7.48 |
| Karla creek | 6.71 | 0.002635 | 7.28 | 0.004 | 11.06 |
| Shaluntsa creek | 3.97 | 0.002922 | 6.28 | 0.004 | 8.59 |
| Taiping creek | 6.56 | 0.002600 | 4.55 | 0.004 | 6.99 |
| Taiyao No.2 creek | 4.08 | 0.002492 | 7.81 | 0.004 | 12.54 |
| Xiatienpu creek | 3.01 | 0.002568 | 4.26 | 0.004 | 6.63 |
| Xuanyuan creek | 6.71 | 0.001889 | 4.53 | 0.004 | 9.60 |
| Mount Bajiawan creek | 10.67 | 0.002744 | 8.72 | 0.004 | 12.71 |
| Xinxin creek | 8.06 | 0.002998 | 8.29 | 0.004 | 11.06 |
| Yenlao creek | 6.79 | 0.003605 | 8.22 | 0.004 | 9.12 |
| Gules creek | 8.92 | 0.003383 | 4.99 | 0.004 | 5.90 |
| Average | 6.28 | 0.003168 | 6.85 | 0.004 | 9.0 |
Table 5.
Error between the results of erosion pins and USLE from this study and SWCB.
| Error (%) | This Study | SWCB [18] |
|---|---|---|
| Min | 2.85 | 6.55 |
| Mean | 40.16 | 62.17 |
| Max | 129.16 | 207.35 |
© 2019 by the authors. Licensee MDPI, Basel, Switzerland. This article is an open access article distributed under the terms and conditions of the Creative Commons Attribution (CC BY) license (http://creativecommons.org/licenses/by/4.0/).
Share and Cite
MDPI and ACS Style
Lin, B.-S.; Chen, C.-K.; Thomas, K.; Hsu, C.-K.; Ho, H.-C. Improvement of the K-Factor of USLE and Soil Erosion Estimation in Shihmen Reservoir Watershed. Sustainability 2019, 11, 355. https://0-doi-org.brum.beds.ac.uk/10.3390/su11020355
AMA Style
Lin B-S, Chen C-K, Thomas K, Hsu C-K, Ho H-C. Improvement of the K-Factor of USLE and Soil Erosion Estimation in Shihmen Reservoir Watershed. Sustainability. 2019; 11(2):355. https://0-doi-org.brum.beds.ac.uk/10.3390/su11020355
Chicago/Turabian StyleLin, Bor-Shiun, Chun-Kai Chen, Kent Thomas, Chen-Kun Hsu, and Hsing-Chuan Ho. 2019. "Improvement of the K-Factor of USLE and Soil Erosion Estimation in Shihmen Reservoir Watershed" Sustainability 11, no. 2: 355. https://0-doi-org.brum.beds.ac.uk/10.3390/su11020355
Note that from the first issue of 2016, this journal uses article numbers instead of page numbers. See further details here.