Spatial Analysis of Social Vulnerability to Floods Based on the MOVE Framework and Information Entropy Method: Case Study of Katsushika Ward, Tokyo


Abstract
:1. Introduction
2. Data and Methods
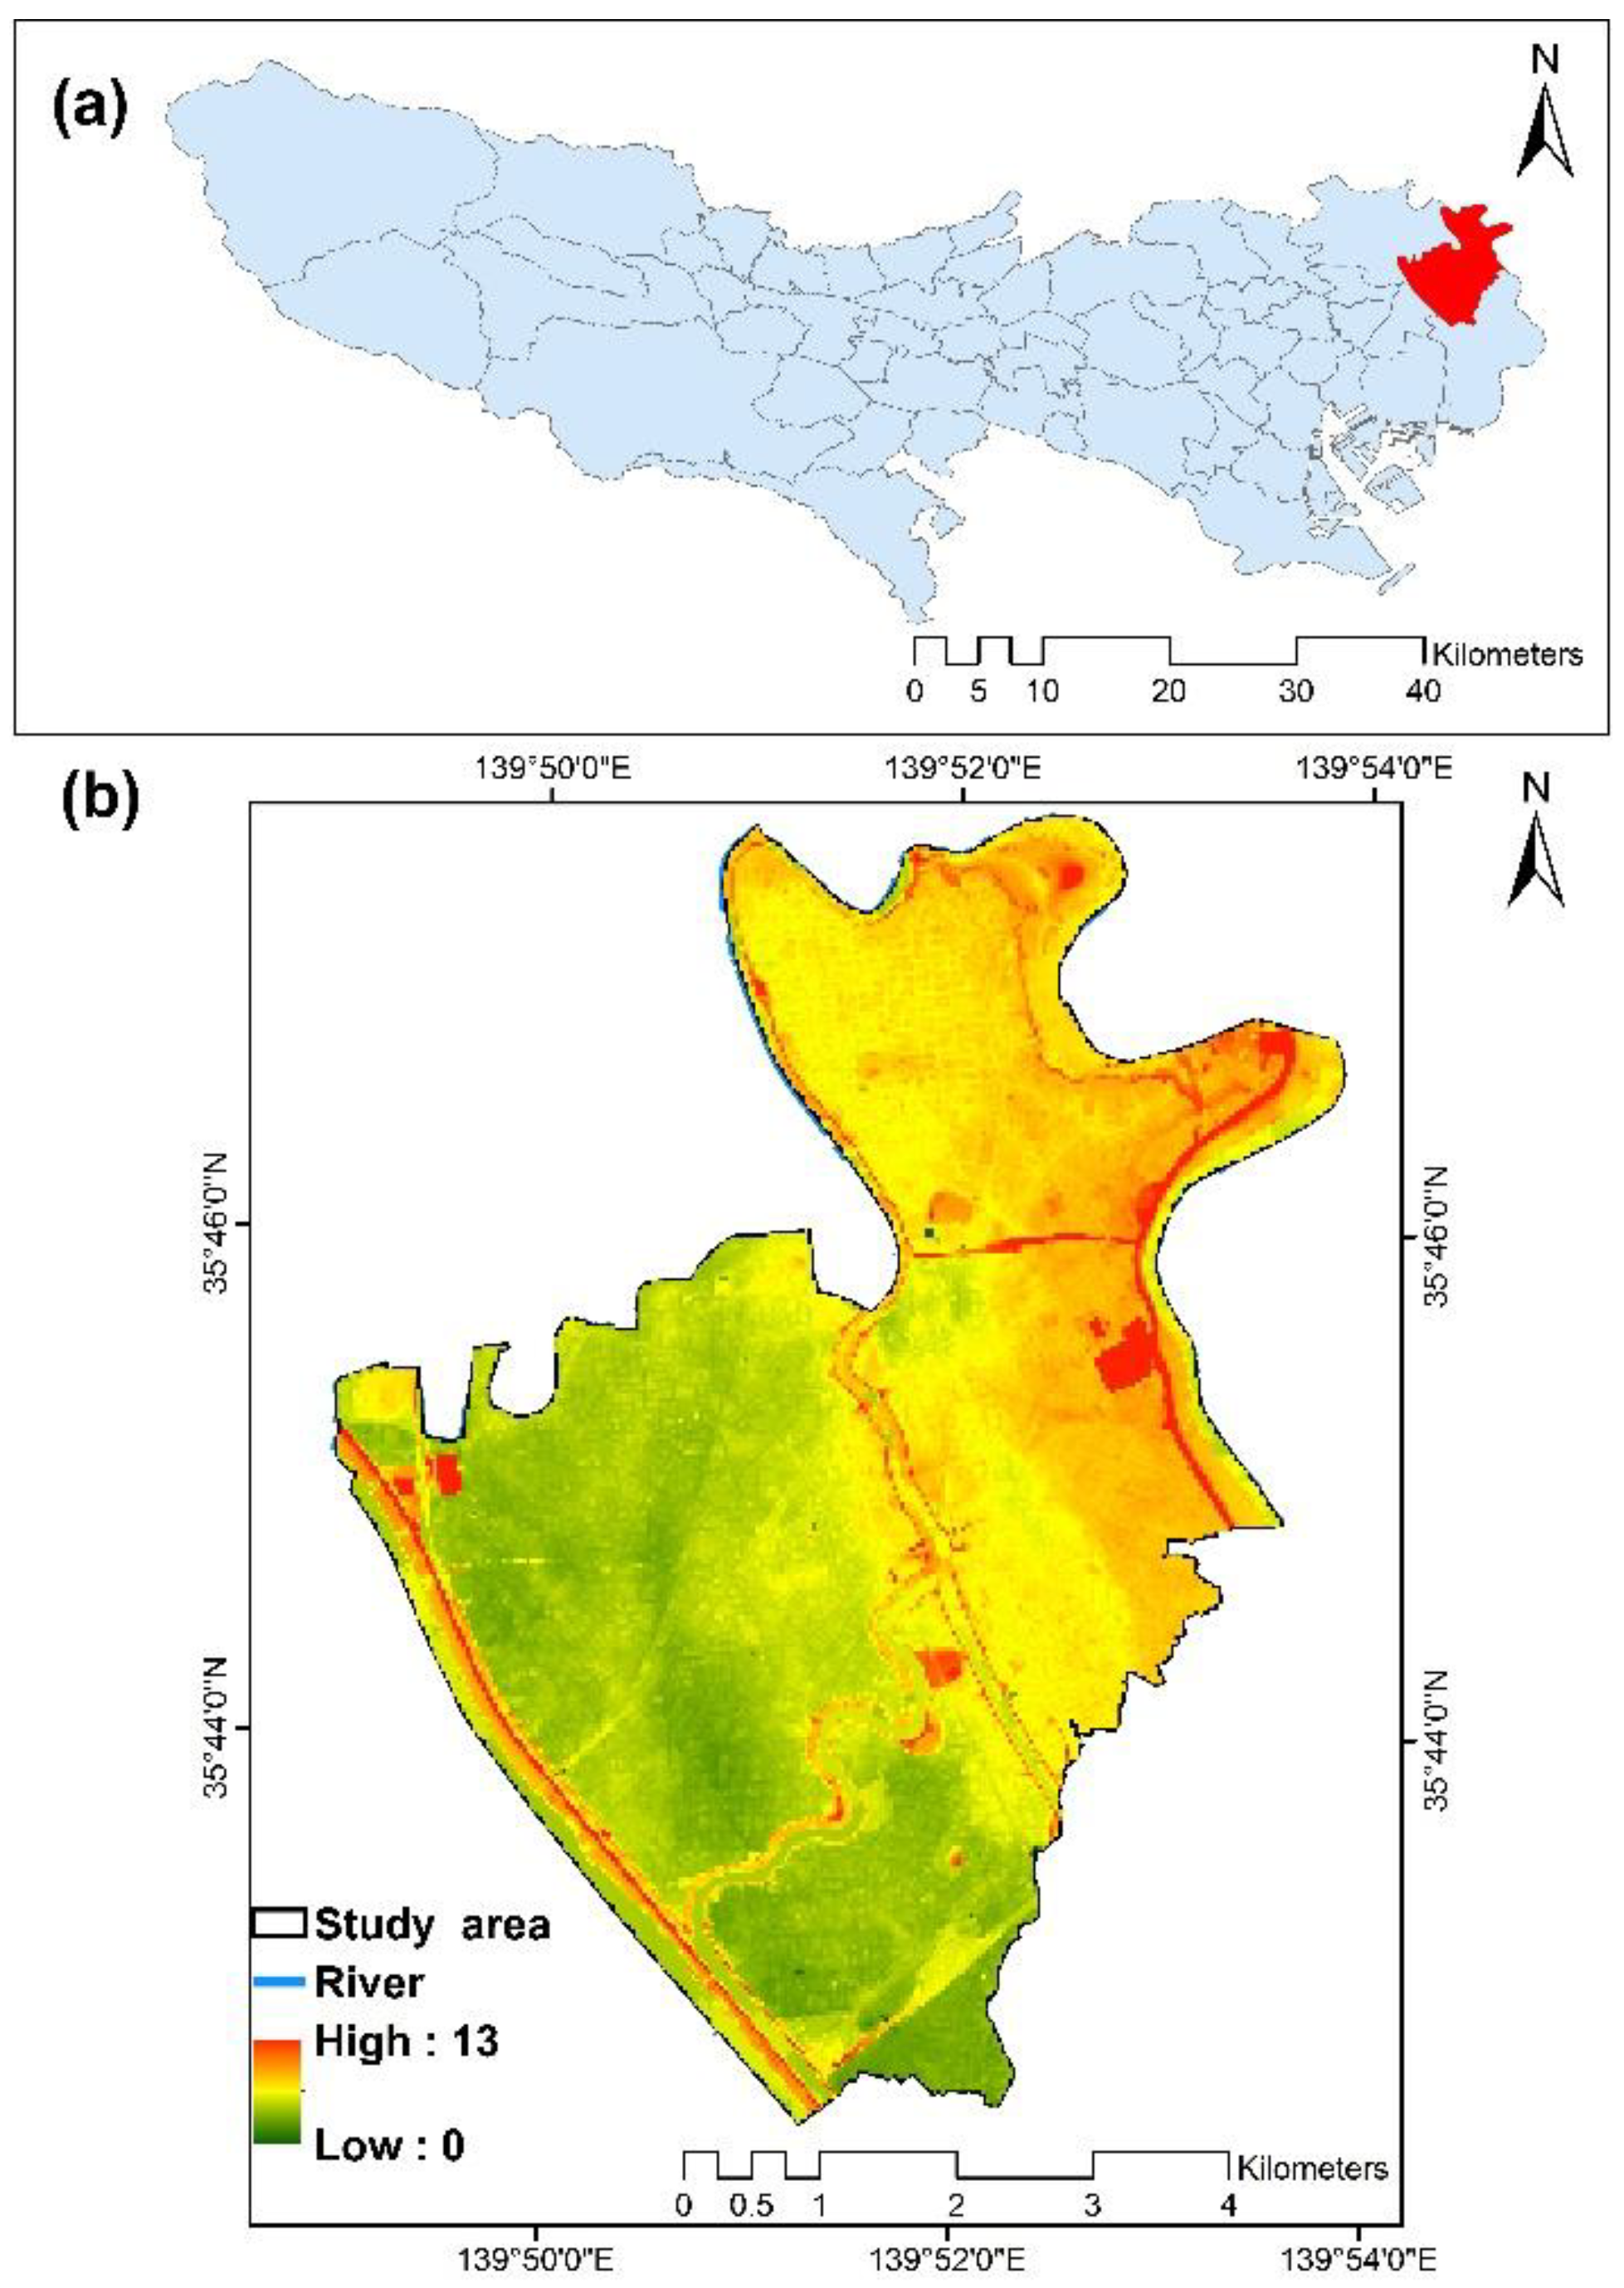
2.1. Study Area
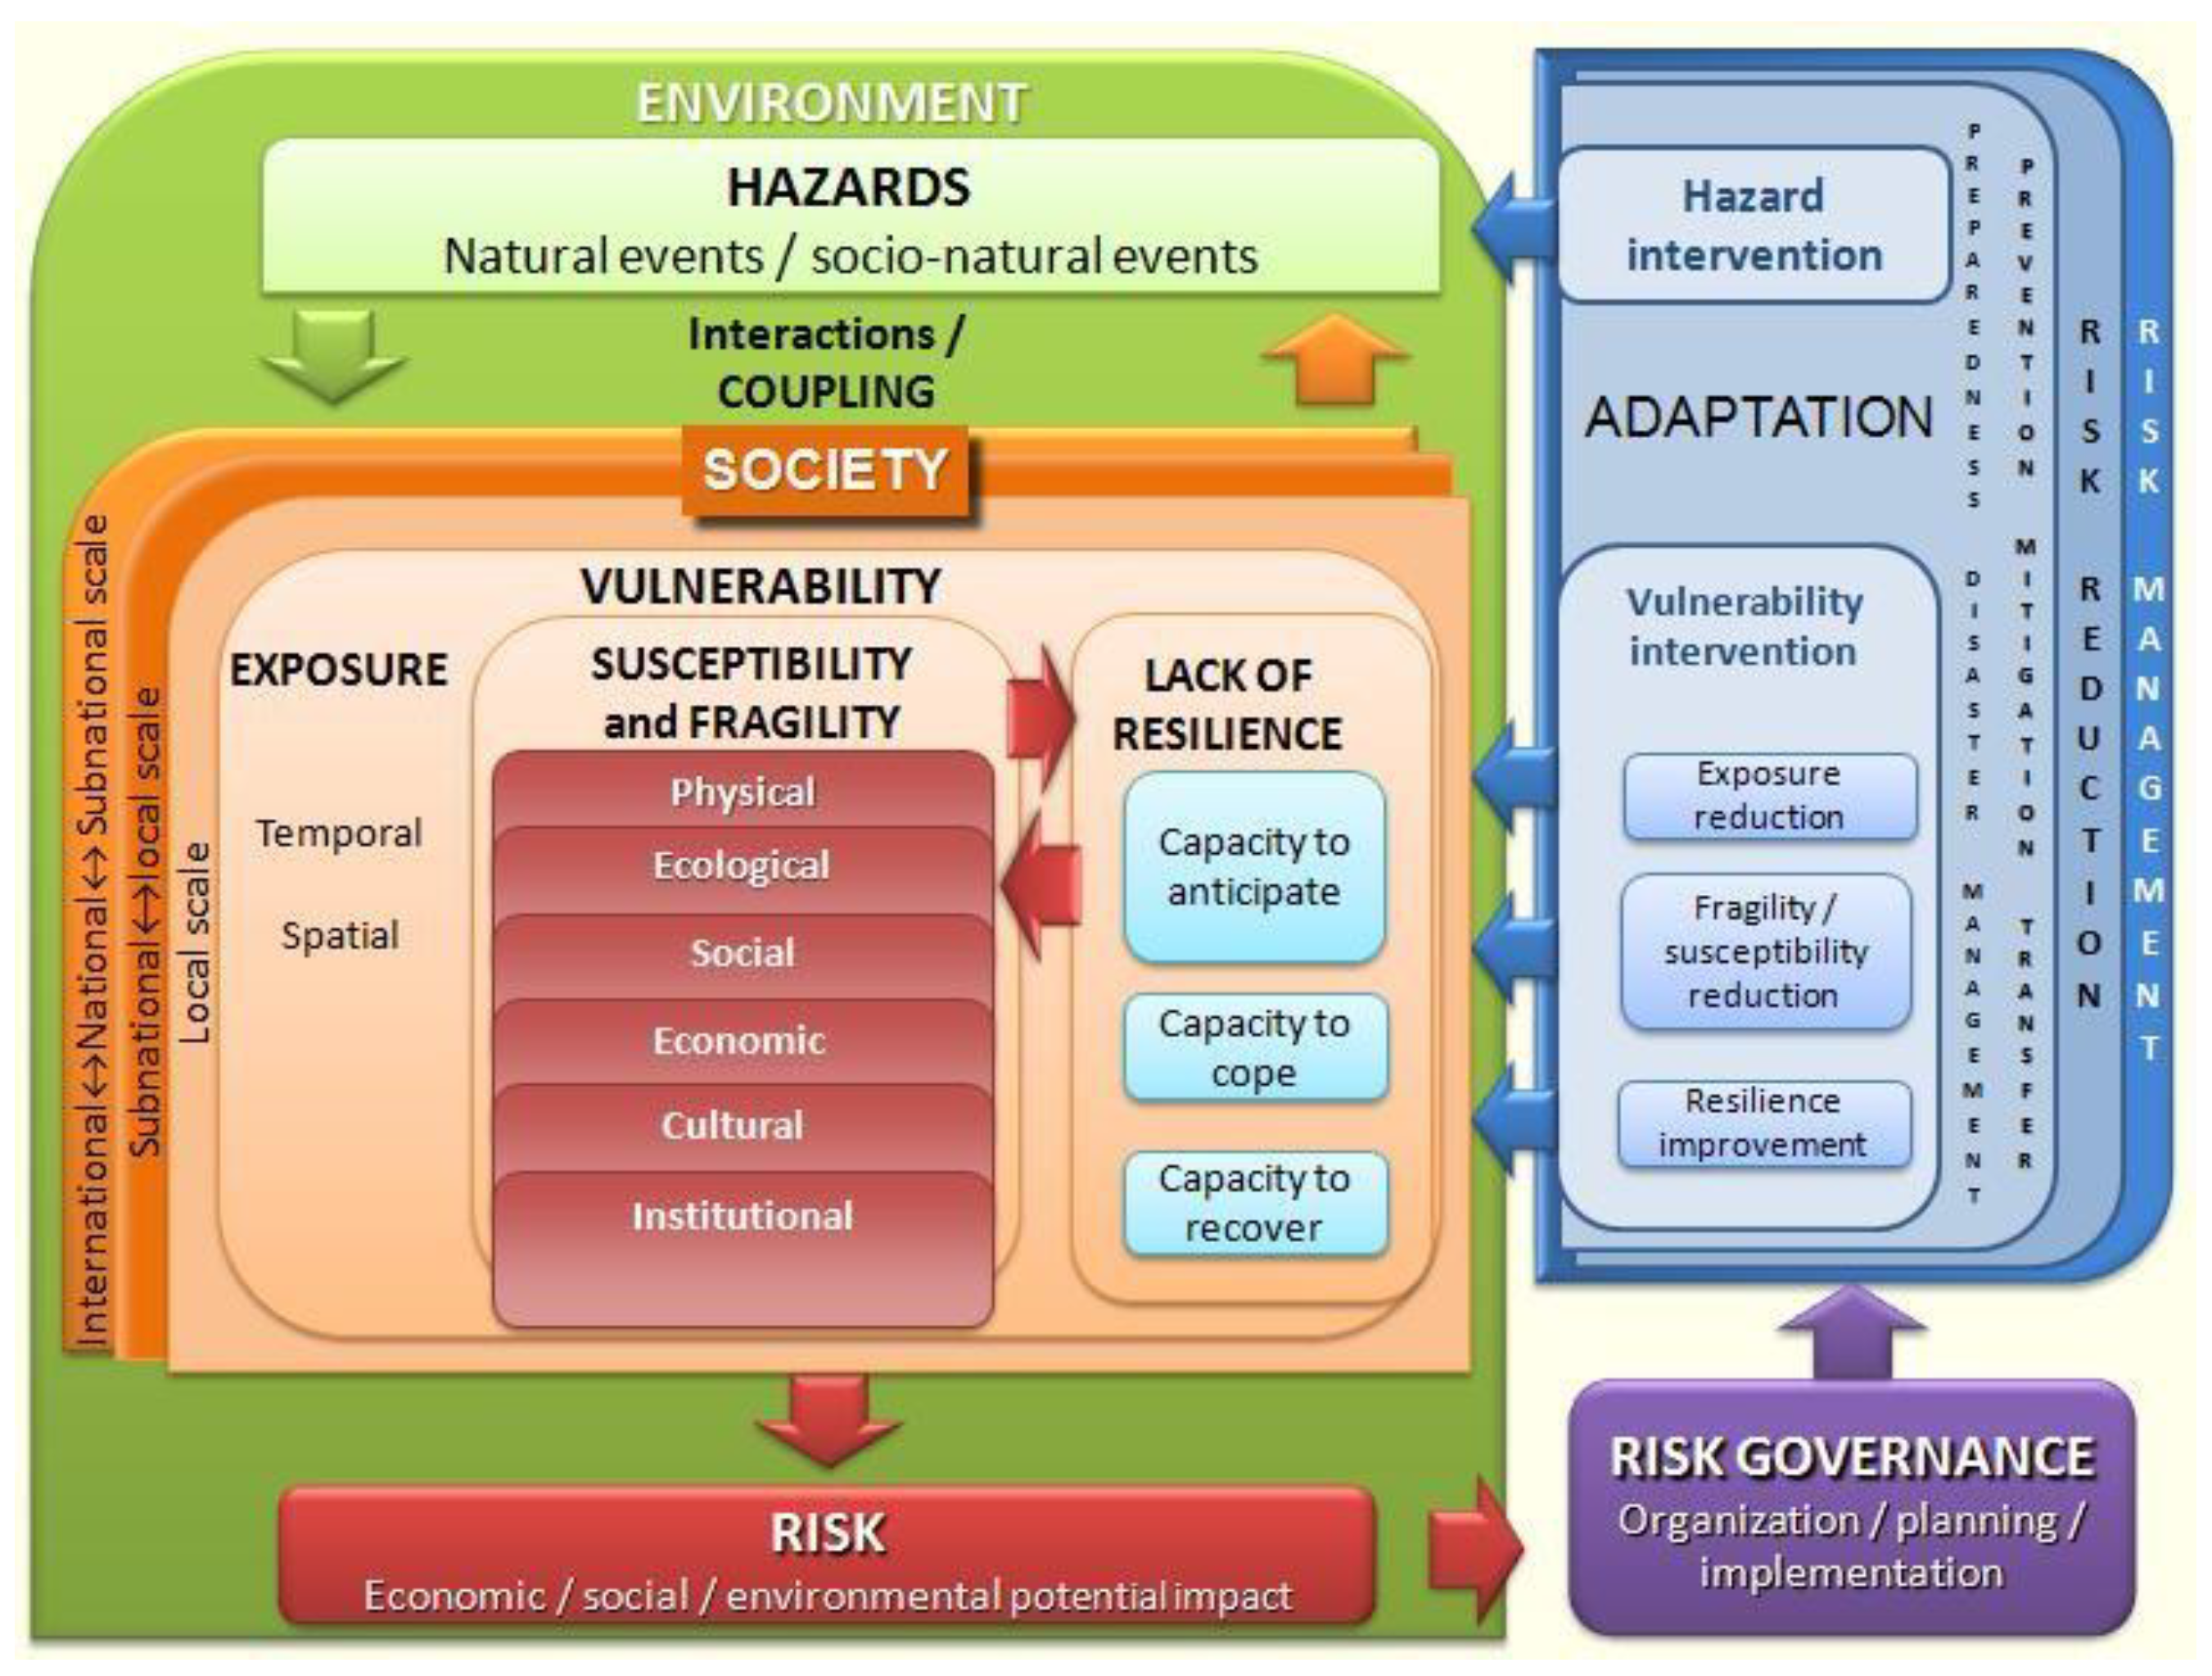
2.2. MOVE framework
2.3. Data Collection and Processing
2.3.1. Data Used for Research
2.3.2. Selection of Indicators
2.3.3. Standardization
2.4. Information Entropy Method
2.5. Calculation of the Social Vulnerability of Floods
3. Results
4. Discussion
5. Conclusions
- (1)
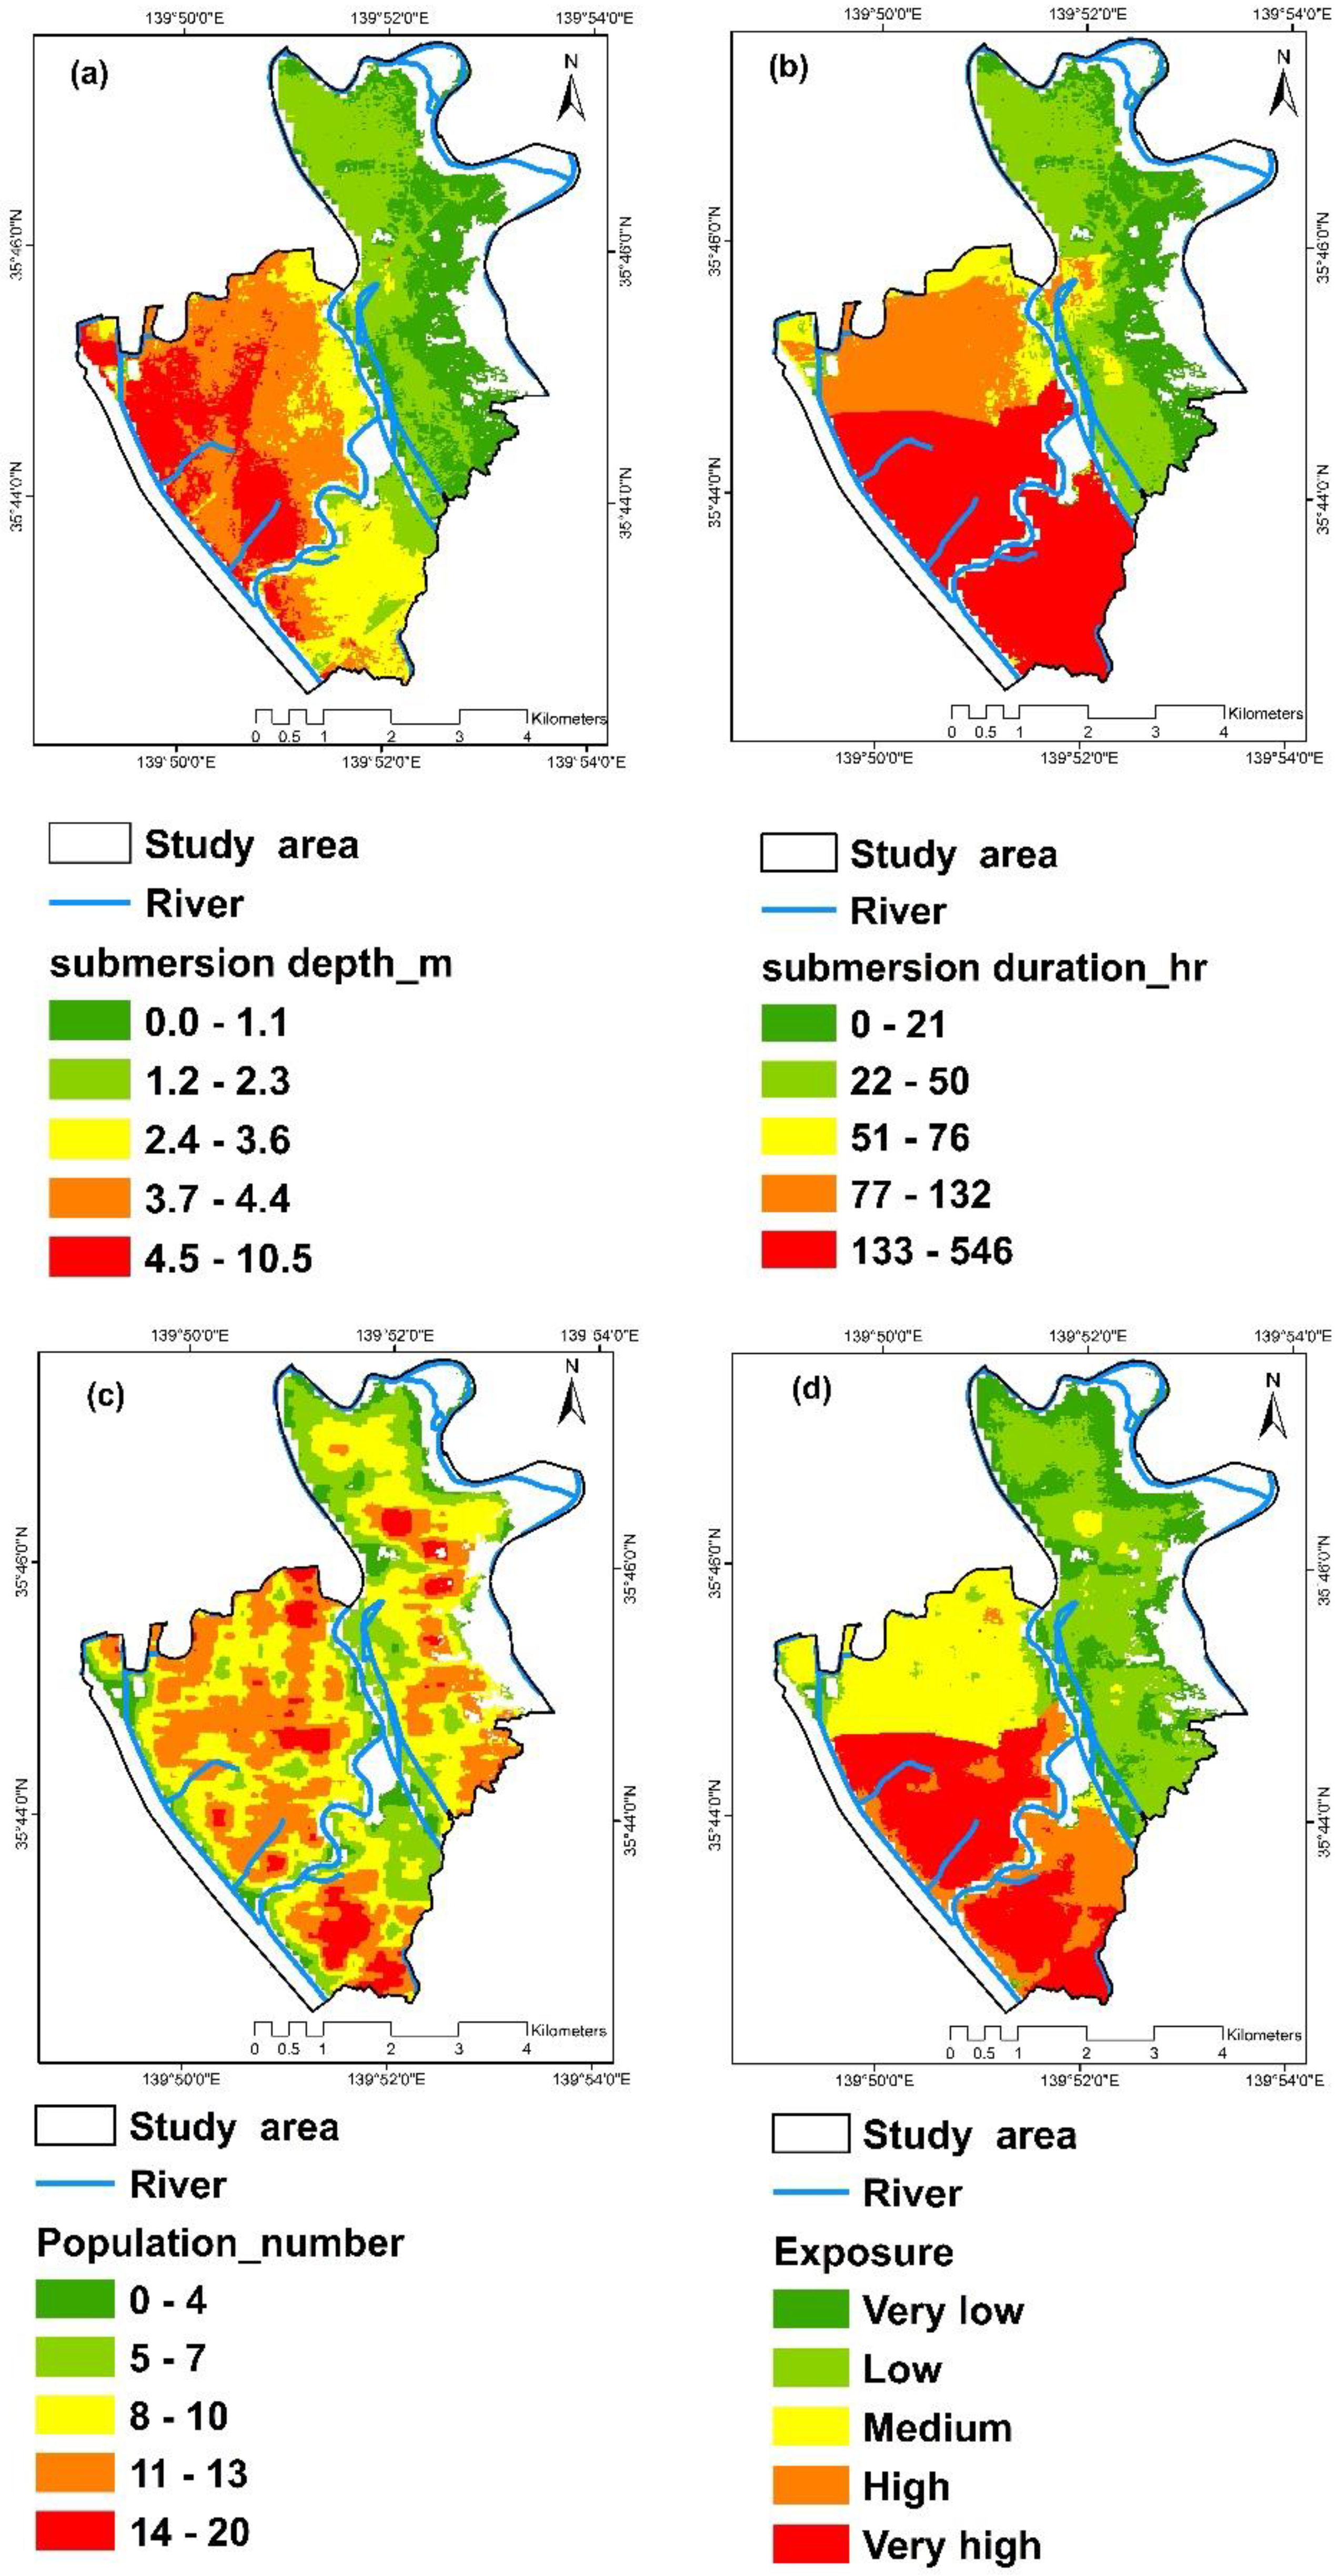
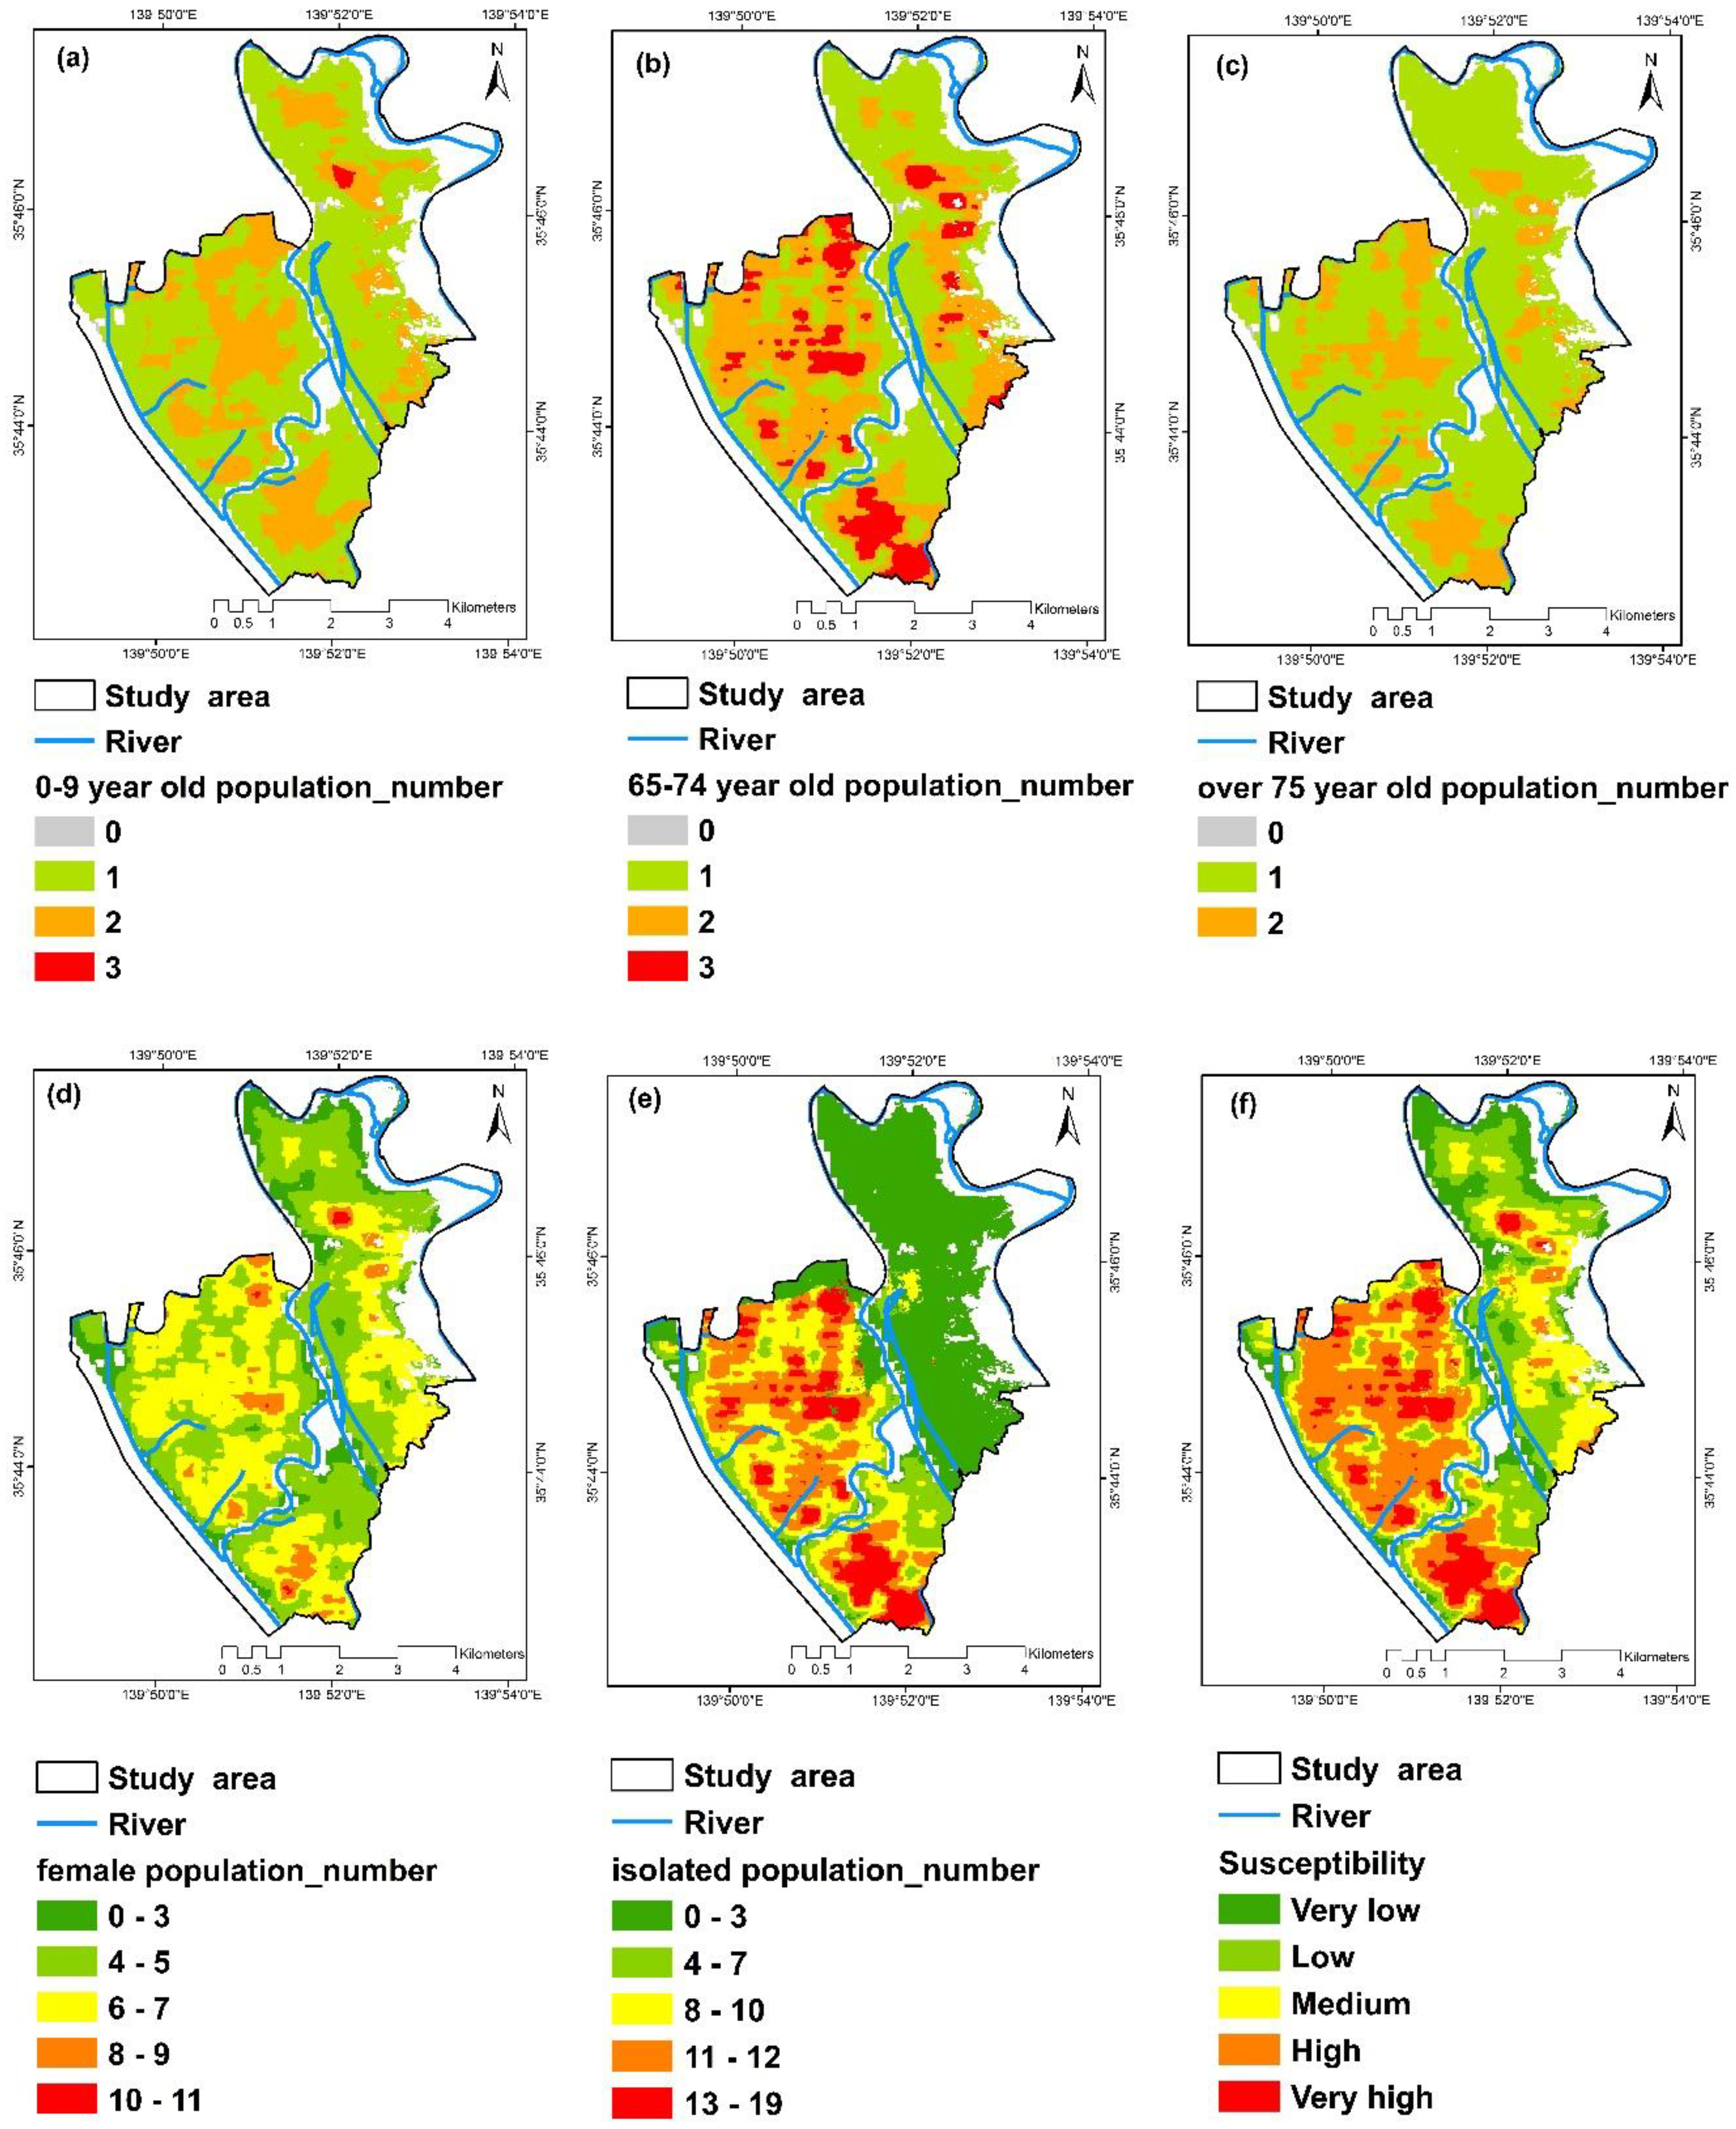
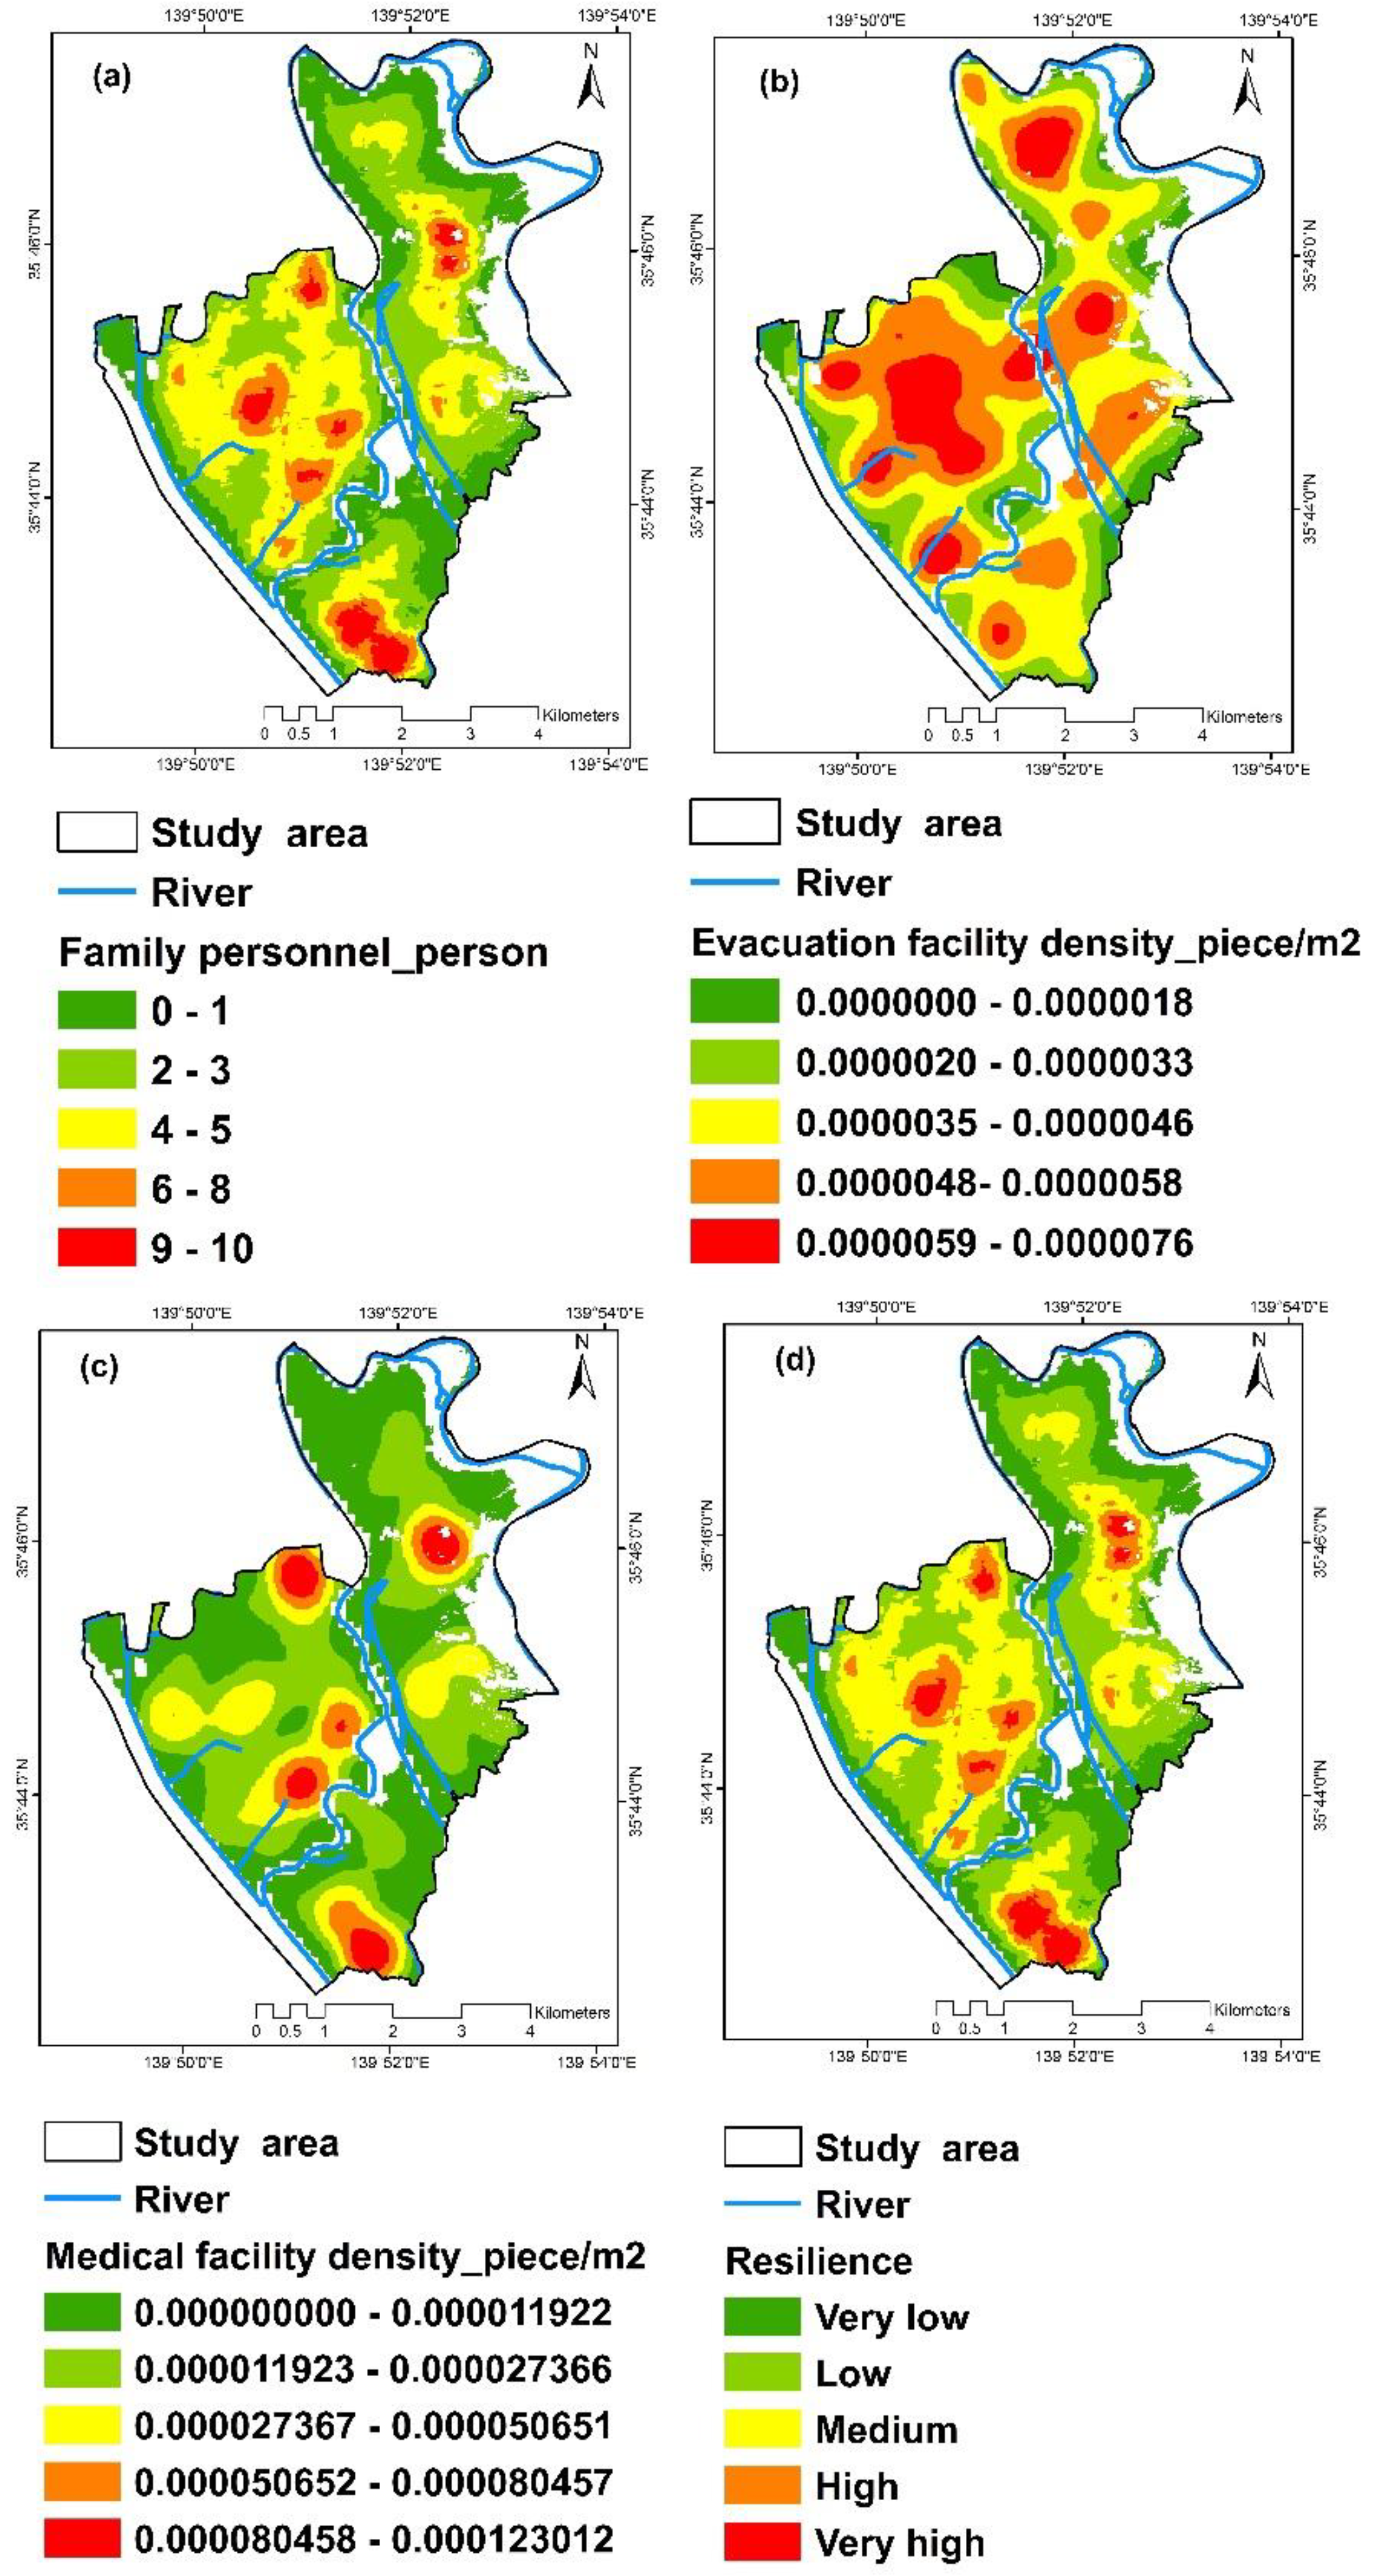
- The analysis was performed in three different aspects: The degree of exposure to social vulnerability, susceptibility, and resilience. The index system was constructed with 11 indicators: Floating depths, flood duration, population, 0 to 9 years old population, 65 to 74 years old population, over 75 years old population, female population, isolated population, medical facility density, evacuation facility density, and number of households. The numbers were subsequently used to analyze the information entropy method and GIS, and the spatial distribution of the social vulnerability of floods in the Tokyo Katsushika Ward was visualized.
- (2)
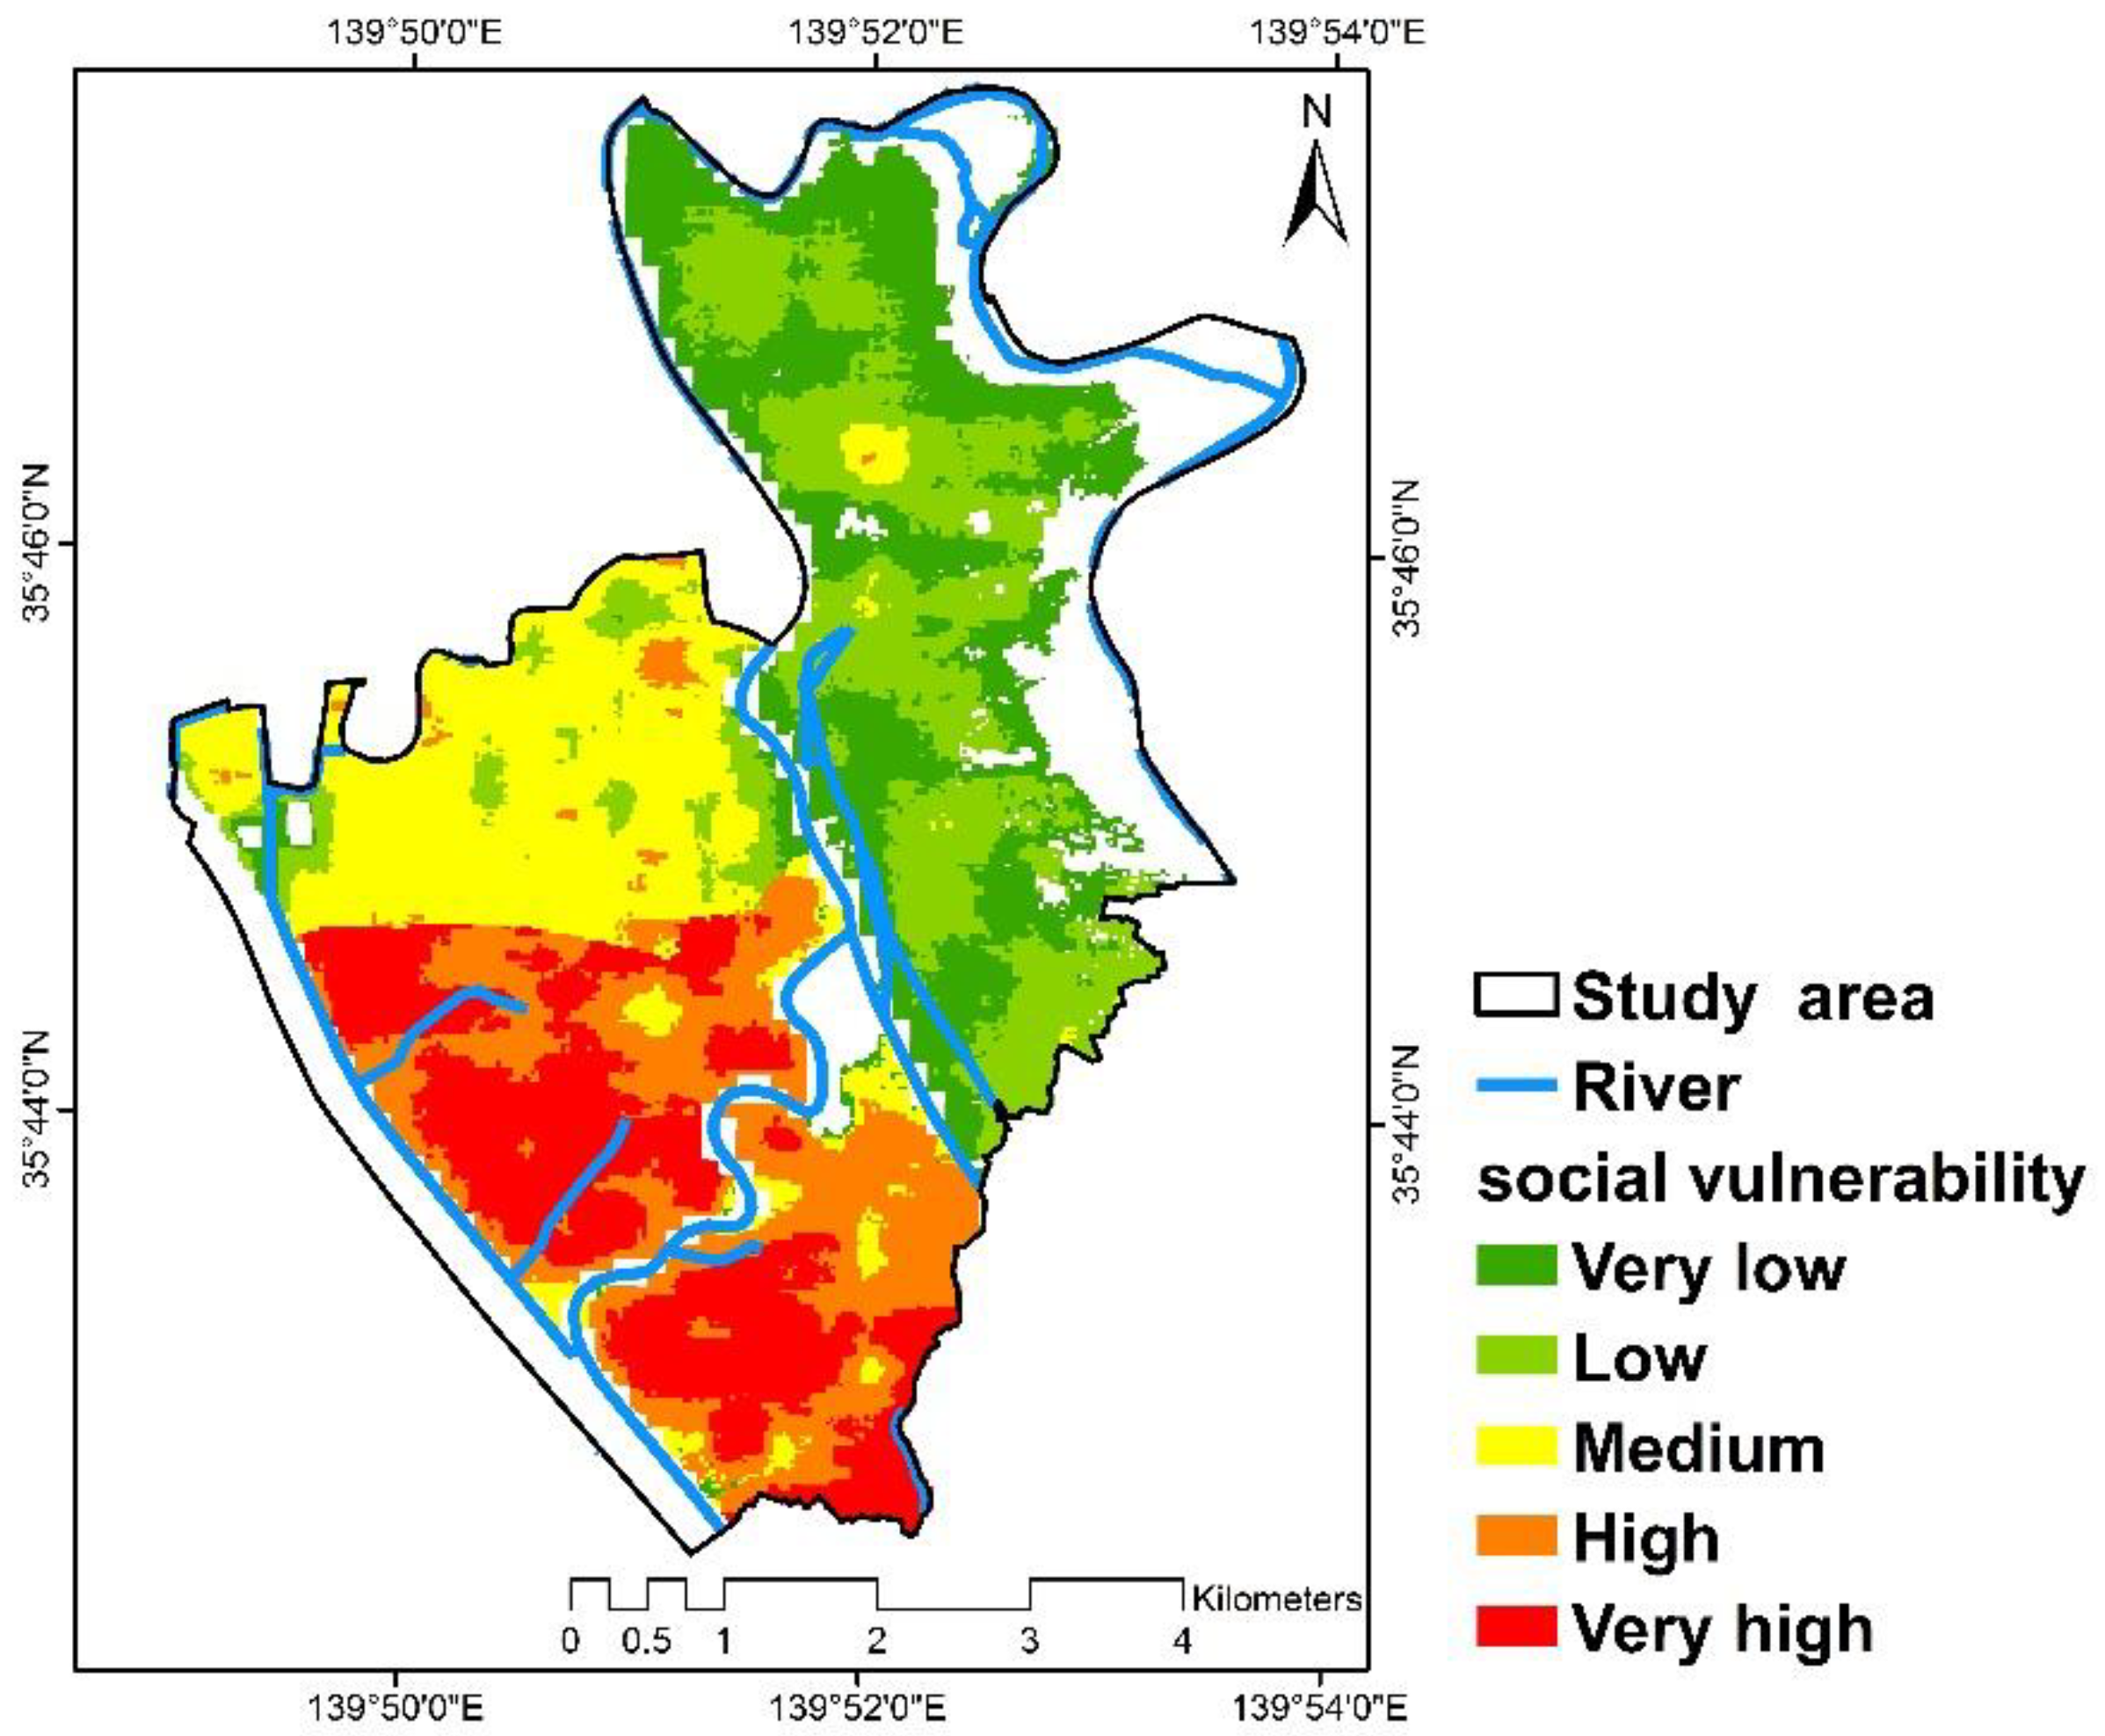
- From the perspective of social vulnerability, the western region of the Katsushika Ward was found to be at greater risk than the eastern region. In addition, the situation in the southwestern region was more dangerous than that in the northwestern region, and the distribution contained certain commonalities and heterogeneities. The general measures for flood protection were not considered based on large areas and heterogeneity.
- (3)
- It is necessary to evaluate and analyze the social vulnerability to floods based on the characteristics of an area. Social vulnerability is related primarily to the exposure rate and susceptibility. It is extremely difficult to reduce social vulnerability when flood prevention measures to reduce exposure are insufficient. Only after improving the flood prevention measures can social vulnerability be reduced. It is necessary to focus on vulnerable people in the analysis from the point of view of susceptibility and to address their challenges.
Author Contributions
Funding
Conflicts of Interest
References
- IPCC. Climate Change 2014: Impacts, Adaptation and Vulnerability. Contribution of Working Group 2 to the Fifth Assessment Report of the Intergovernmental Panel on Climate Change; Barros, V.R., Field, D.J., Dokken, M.D., Mastrandrea, K.J., Mach, T.E., Eds.; Cambridge University Press: Cambridge, UK; New York, NY, USA, 2014. [Google Scholar]
- Miwa, A.; Yuki, Y. Construction and consideration of social disaster vulnerability index based on living style of elderly people, From the analysis for all the houses in Kita Ward; Osaka city. Trust Soc. 2013, 1, 1–22. [Google Scholar]
- IPCC. Global Warming of 1.5 °C. Summary for Policy Makers; IPCC: Geneva, Switzerland, 2018. [Google Scholar]
- Wisner, B.P.; Blaikie, P.M. At Risk: Natural Hazards, People’s Vulnerability and Disasters, 2nd ed.; Routledge: London, UK, 2004. [Google Scholar]
- Clark, E.; Moser, S.C. Assessing the vulnerability of coastal communities to extreme storms, the case of Revere. Mitig. Adapt. Strateg. Glob. Chang. 1998, 3, 59–82. [Google Scholar] [CrossRef]
- Adger, W.N. Vulnerability. Glob. Environ. Chang. 2006, 16, 268–281. [Google Scholar] [CrossRef]
- Borg, R.P.; Indirli, M. The ANDROID case study; Venice and its territory: Vulnerability and resilience in multi-hazard scenarios. Proced. Econ. Financ. 2014, 18, 825–836. [Google Scholar] [CrossRef]
- Fernandez, P.; Mourato, S. Social vulnerability assessment of flood risk using GIS-based multicriteria decision analysis. A case study of Vila Nova de Gaia (Portugal). Nat. Hazards Risk 2016, 7, 1367–1389. [Google Scholar] [CrossRef]
- He, Y.; Huang, X. Assessment and influencing factors of social vulnerability to rapid urbanization in urban fringe, A case study of Xi’an. Acta Geogr. Sin. 2016, 71, 1315–1328. [Google Scholar]
- Younus, M.; Kabir, M. Climate change vulnerability assessment and adaptation of bangladesh: Mechanisms, Notions and Solutions. Sustainability 2018, 10, 4286. [Google Scholar] [CrossRef]
- Zhou, L. From natural vulnerability to social vulnerability, Paradigm shift in disaster research. Thinking 2012, 2, 11–15. [Google Scholar]
- Rygel, L.; O’sullivan, D.A. Method for Constructing a Social Vulnerability Index; An Application to Hurricane Storm Surges in a Developed Country. Mitig. Adapt. Strateg. Glob. Chang. 2006, 11, 741–764. [Google Scholar] [CrossRef]
- Rahman, M.A. Social Vulnerability to Flood: An Integrated Spatial Assessment in the United States; Association of American Geographers: Washington, DC, USA, 2018. [Google Scholar]
- Bogaidi, J.J.; Birkmann, J. Vulnerability assessment: The first step towards sustainable risk reduction. In Disasters and Society: From Hazard Assessment to Risk Reduction; Logos Verlag Berlin: Berlin, Germany, 2004; pp. 1–83. [Google Scholar]
- Mavhura, E.; Manyena, B. An approach for measuring social vulnerability in context: The case of flood hazards in Muzarabani district, Zimbabwe. Geoforum 2017, 86, 103–117. [Google Scholar] [CrossRef]
- Foster, G.; Williamson, J. A review of current literature on the impact of HIV/AIDS on children in sub–Saharan Africa. Acquir. Immune Defic. Syndr. 2000, 14, S275–S284. [Google Scholar]
- Kablan, M.K.; Dongo, K. Assessment of social vulnerability to flood in urban Côte d’Ivoire using the MOVE framework. Water 2017, 9, 292. [Google Scholar] [CrossRef]
- Abson, D.J.; Dougill, A.J. Using principal component analysis for information-rich socio-ecological vulnerability mapping in Southern Africa. Appl. Geogr. 2012, 35, 515–524. [Google Scholar] [CrossRef]
- de Sherbinin, A.; Bardy, G. Social vulnerability to floods in two coastal megacities, New York City and Mumbai. Vienna Yearb. Popul. Res. 2015, 13, 131–165. [Google Scholar] [CrossRef]
- Rufat, S.; Tate, E. Social vulnerability to floods: Review of case studies and implications for measurement. Int. J. Disaster Risk Reduct. 2015, 14, 470–486. [Google Scholar] [CrossRef] [Green Version]
- Turner, B.L.; Kasperson, R.E. A framework for vulnerability analysis in sustainability science. Proc. Natl. Acad. Sci. USA 2003, 100, 8074–8079. [Google Scholar] [CrossRef] [Green Version]
- Cutter, S.L. Vulnerability to environmental hazards. Prog. Hum. Geogr. 1996, 20, 529–539. [Google Scholar] [CrossRef]
- Parker, D.; Tapsell, S. Deliverable 2.1. Relations between different types of social and economic vulnerability. Final draft report submitted to EU project ‘Enhancing resilience of communities and territories facing natural and na-tech hazards’. 2009. Available online: https://www.researchgate.net/publication/264474096_Relations_between_different_types_of_social_and_economic_vulnerability (accessed on 5 December 2018).
- Cutter, S.L. The vulnerability of science and the science of vulnerability. Ann. Assoc. Am. Geogr. 2003, 3, 1–12. [Google Scholar] [CrossRef]
- Turner, B.L.; Matsond, P.A. Illustrating the coupled human-environment system for vulnerability analysis, three case studies. Proc. Natl. Acad. Sci. USA 2003, 100, 8080–8085. [Google Scholar] [CrossRef]
- Birkmann, J.; Cardona, O.D. Framing vulnerability, risk and societal responses, the MOVE framework. Nat. Hazards 2013, 67, 193–211. [Google Scholar] [CrossRef]
- Mustafa, D. Structural causes of vulnerability to flood hazard in Pakistan. Econ. Geogr. 1998, 74, 289–305. [Google Scholar] [CrossRef]
- Gaillard, J.C.; Liamzon, C.C. Natural disaster, a retrospect into the causes of the late- 2004 typhoon disaster in Eastern Luzon, Philippines. Environ. Hazards 2007, 7, 257–270. [Google Scholar] [CrossRef]
- Younus, M. An assessment of vulnerability and adaptation to cyclones through impact assessment guidelines: A bottom-up case study from Bangladesh coast. Nat. Hazards 2017, 89, 1437–1459. [Google Scholar] [CrossRef]
- Birkmann, J. Measuring vulnerability to promote disaster-resilient societies: Conceptual frameworks and definitions. In Measuring Vulnerability to Natural Hazards: Towards Disaster Resilient Societies; United Nations University Press: Tokyo, Japan, 2006. [Google Scholar]
- Ge, Y.; Shi, P.J. Improvement and application of vulnerability assessment methodology for flood hazards in China: Using Changsha Prefecture as a case study. J. Nat. Disaster 2005, 14, 54–58. [Google Scholar]
- Wu, J.; Chiang, Y. The development and analysis on natural disaster statistics index system in Taiwan. J. Geogr. Sci. 2008, 51, 65–84. [Google Scholar]
- Chen, L.; Xu, W.; Zhou, X.; Ma, Y.; Yuan, Y.; Qian, X.; Ge, Y. The research on social vulnerability assessment of natural disasters: Taking Shanghai as an example. J. Catastrophol. 2012, 27, 98–100. [Google Scholar]
- Uchiyama, K. The spatial distribution of social vulnerability to environmental hazards, A case study of Kobe City at the Great Hanshin-Awaji Earthquake. Collect. Assoc. Jpn. Geogr. Tsukuba. Japan. 2017.
- Anderson, B.L.; King, D. Mitigation of the impact of tropical cyclones in northern Australia through community capacity enhancement. Mitig. Adapt. Strateg. Glob. Chang. 2005, 10, 367–392. [Google Scholar] [CrossRef]
- Wang, L.; Liao, X. The Social vulnerability of urban flooding disaster in Hsinchu city. J. Eng. Environ. 2018, 38, 94–113. [Google Scholar]
- Tetsuya, O. The current status and future perspectives of flood risk management. JICE Rep. Rep. Jpn. Inst. Constr. Eng. 2017, 31, 2–7. [Google Scholar]
- Cannon, T. Gender and climate hazards in Bangladesh. Gender Dev. 2002, 10, 45–50. [Google Scholar] [CrossRef]
- Ikeda, K. Gender Differences in Human Loss and Vulnerability in Natural Disasters, A Case Study from Bangladesh. Indian J. Gender Stud. 1995, 2, 171–193. [Google Scholar] [CrossRef]
- Snith, K. Environmental Hazards: Assessing Risk and Reducing Disaster; Routledge: London, UK, 2003. [Google Scholar]
- Asaka, M.; Shigeo, T. A confirmatory study on the influence of questionnaire seismic intensity and social vulnerability in Kobe city of the Great Hanshin-Awaji Earthquake on building damage and direct death number. J. Reg. Saf. 2009, 11, 89–96. [Google Scholar]
- Fatemi, F.; Ardalan, A. Social vulnerability indicators in disasters, Findings from a systematic review. Int. J. Disaster Risk Reduct. 2017, 22, 219–227. [Google Scholar] [CrossRef]
- Kundzewicz, Z.W.; Kanae, S. Flood risk and climate change, global and regional perspectives. Hydrol. Sci. J. 2014, 59, 1–28. [Google Scholar] [CrossRef]
- Lin, W. Empirical Analyzing the Relationship between Direct Economic Damage Caused by Natural Disasters and Economic and Social Factors, toward to Improve Safety and Security. Econ. Rev. Kyoto Univ. 2015, 188, 79–91. [Google Scholar]
- Sané, O.D.; Gaye, A.T. Social vulnerability assessment to flood in Medina Gounass Dakar. J. Geogr. Inf. Syst. 2015, 7, 415–429. [Google Scholar] [CrossRef]
- Welle, T.; Depietri, Y.; Angignard, M.; Birkmann, J.; Renaud, F.; Greiving, S. Vulnerability assessment to heat waves, floods, and earthquakes using the MOVE framework, Test Case Cologne, Germany. Assess. Vulnerabil. Nat. Hazards 2014, 91–124. [Google Scholar] [CrossRef]
- Depietri., Y.; Welle, T. Social vulnerability assessment of the Cologne urban area (Germany) to heat waves, links to ecosystem services. Int. J. Disaster Risk Reduct. 2013, 6, 98–117. [Google Scholar] [CrossRef]
- Hagenlocher, M.; Delmelle, E. Assessing socioeconomic vulnerability to dengue fever in Cali, Colombia: Statistical vs expert-based modeling. Int. J. Health Geogr. 2013, 12, 36–50. [Google Scholar] [CrossRef]
- Bizimana, J.P.; Twarabamenye, E.; Kienberger, S. Assessing the social vulnerability to malaria in Rwanda. Malar. J. 2015, 14, 2–523. [Google Scholar] [CrossRef] [PubMed]
- Williams, H.T.; Muhammed, B.U. Modelling Social Vulnerability to Malaria Risk in Katsina-Ala Local Government Area, floods, Benue State Nigeria. J. Geogr. Environ. Earth Sci. Int. 2018, 14, 2454–57352. [Google Scholar]
- Fekete, A. Assessment of Social Vulnerability River Floods in Germany; United Nations University, Institute for Environment and Human Security: Tokyo, Japan, 2010. [Google Scholar]
- Atsuyuki, S.; Jiang, Y. The national census is calculated by using the population of any regions. Aichi Univ. Inf. Media Cent. Bull. 2015, 25, 1–15. [Google Scholar]
- The United Nations Office for Disaster Risk Reduction. Terminology on Disaster Risk Reduction; The United Nations Office for Disaster Risk Reduction: Geneva, Switzerland, 2009. [Google Scholar]
- Daniels, R.J. On Risk and Disaster, Lessons from Hurricane Katrina; University of Pennsylvania Press: Philadelphia, PA, USA, 2006. [Google Scholar]
- Jain, Y.K.; Bhandara, S.K. Min max normalization based data perturbation method for privacy protection. Int. J. Comput. Commun. Technol. 2011, 2, 45–50. [Google Scholar]
- Shannon, C. A Mathematical Theory of Communication. Bell Syst. Tech. J. 1948, 27, 379–423. [Google Scholar] [CrossRef]
- Zhang, X. Entropy weight theory based integrated evaluation model of natural disasters. J. Nat. Disasters 2009, 18, 190–192. [Google Scholar]
- He, Q. Estimating the Reliability of Composite Scores; Office of the Examinations and Qualifications Regulator (Ofqual): Coventry, England, 2009. [Google Scholar]
- Yukawa, S.; Hatayama, M. A Study on flood evacuation in congested areas using network equilibrium model. Presented at Research Meeting on Civil Engineering Planning, Yamanashi, Japan, 21 November 2010. [Google Scholar]
- Tetsuya, O. A Study on the vulnerability assessment of inundation areas in the event of a large-scale flood in the Tokyo metropolitan area. Adv. River Eng. (under review). 2010. [Google Scholar]
- Takanashi, T. The hazard assessment and classification of Tokyo low-lying area during flood damage, Bulletin of graduate studies, Science and engineering. Chuo Univ. 2016, 46. Available online: http://ir.c.chuo-u.ac.jp/repository/search/binary/p/8813/s/7068/ (accessed on 5 December 2018).
- The National Resilience Promotion. Result of Vulnerability Assessment. 2018. Available online: https://www.cas.go.jp/jp/seisaku/kokudo_kyoujinka/hyouka.html (accessed on 5 December 2018).
- Katsushika City Official. Katsushika City Arakawa Flood Disaster Map. 2017. Available online: http://www.city.katsushika.lg.jp/kurashi/1000063/1004031/1004779.html (accessed on 5 December 2018).
- Akagi, A. The water disaster prevention initiatives in Katsushika area. River Front. 2017, 86, 12–16. [Google Scholar]


| Evaluation Item | Index | Description | Nature |
|---|---|---|---|
| Exposure | population (number) | The greater the population, the higher is the degree of exposure [17] | + |
| Submersion depth (m) | The deeper the flood depth, the higher is the degree of population exposure [51] | + | |
| Submersion time (h) | The longer the submersion time, the higher the degree of population exposure [2] | + | |
| Susceptibility | 0–9 years old population (number) | Children cannot evacuate on their own [17] | + |
| 65–74 years old population (number) | Cannot evacuate on their own [2] | + | |
| Over 75 years old population (number) | Cannot evacuate independently, the degree of necessary care is high [2] | + | |
| Female population (number) | The higher the population is, the higher the sensitivity [40,41] | + | |
| the isolated population (number) | The higher the population is, the higher the sensitivity [2] | + | |
| Resilience | Density of medical facilities (number/m2) | The higher the density is, the higher the capacity [17] | − |
| Family personnel (number) | The more people in the family, the higher the ability to respond [40] | − | |
| Density of evacuation facility (number/m2) | The higher the density is, the higher the response capability [17] | − |
| Evaluation Item | Index | Weight |
|---|---|---|
| Exposure | Population (number) | 0.1154 |
| Submersion depth (m) | 0.1161 | |
| Submersion time (hr) | 0.1142 | |
| Susceptibility | 0 to 9 years old population (number) | 0.0175 |
| 65 to 74 years old population (number) | 0.0841 | |
| Over 75 years old population (number) | 0.0433 | |
| Female population (number) | 0.1131 | |
| the isolated population (number) | 0.0736 | |
| Resilience | Density of medical facilities (number/m2) | 0.1101 |
| Family personnel (number) | 0.1005 | |
| Density of evacuation facility(number/m2) | 0.1121 |
© 2019 by the authors. Licensee MDPI, Basel, Switzerland. This article is an open access article distributed under the terms and conditions of the Creative Commons Attribution (CC BY) license (http://creativecommons.org/licenses/by/4.0/).
Share and Cite
Lianxiao; Morimoto, T. Spatial Analysis of Social Vulnerability to Floods Based on the MOVE Framework and Information Entropy Method: Case Study of Katsushika Ward, Tokyo. Sustainability 2019, 11, 529. https://0-doi-org.brum.beds.ac.uk/10.3390/su11020529
Lianxiao, Morimoto T. Spatial Analysis of Social Vulnerability to Floods Based on the MOVE Framework and Information Entropy Method: Case Study of Katsushika Ward, Tokyo. Sustainability. 2019; 11(2):529. https://0-doi-org.brum.beds.ac.uk/10.3390/su11020529
Chicago/Turabian StyleLianxiao, and Takehiro Morimoto. 2019. "Spatial Analysis of Social Vulnerability to Floods Based on the MOVE Framework and Information Entropy Method: Case Study of Katsushika Ward, Tokyo" Sustainability 11, no. 2: 529. https://0-doi-org.brum.beds.ac.uk/10.3390/su11020529