Spatial Explicit Assessment of Urban Vitality Using Multi-Source Data: A Case of Shanghai, China


1
Department of Land management, Zhejiang University, Hangzhou 310058, China
2
Department of Urban Land, Laboratory of Rural-Urban Construction Land Economical and Intensive Use, Beijing 100812, China
3
Land Planning Department, Shanghai Institute of Geological Survey, Shanghai 200072, China
4
School of Construction Management and Real Estate, Chongqing University, Chongqing 400045, China
*
Author to whom correspondence should be addressed.
Sustainability 2019, 11(3), 638; https://0-doi-org.brum.beds.ac.uk/10.3390/su11030638
Submission received: 15 December 2018
/
Revised: 22 January 2019
/
Accepted: 22 January 2019
/
Published: 26 January 2019
Abstract
:Identifying urban vitality in large cities is critical for optimizing the urban fabric. While great attention has been paid to urban vitality in developed countries, related studies have been rarely conducted in developing countries. In this study, we defined urban vitality as the capacity of an urban built environment to boost lively social activities and developed a framework for measuring urban vitality using the dimensions of built environment, human activities, and human–environment interaction. Taking Shanghai, China as a case, we conducted a measurement of urban vitality using multi-source data. The results show that Shanghai follows a monocentric vital pattern within the outer ring road, with urban vitality declining from the central urban core to the city periphery. While the old urban cores tend to show high urban vitality, Pudong New Area is mostly dominated by low vitality. Three clusters with high urban vitality were identified: the old urban area, the Lujiazui CBD, and residential agglomeration areas. We conducted validation of the measuring results using phone usage density. Urban vitality showed a positive correlation with phone usage density, indicating a high accuracy of assessment. We also discovered that European-style block planning, zoning plan, mixed-functional development, urban renewal regulation, and migrant concentration were playing leading role in urban vitality of Shanghai.
1. Introduction
Accompanied by the unprecedented worldwide urbanization from the 20th century onward, large cities have witnessed economic prosperity and cultural diffusion. Within the large cities, urban problems such as urban sprawl, residential vacancy, population loss, and ecosystem degradation [1,2,3,4] have increasingly made life inconvenient for city residents, reducing the diversity of urban fabric, and even degrading the sustainability of the urban system. Such challenges have raised wide concerns on urban life among scholars, planners, and governors within the Western countries. Increasing studies have used urban vitality to understand the intricate social and economic order underlying the seeming disorder of large cities [5]. Urban vitality has been often used to prescribe planning principles to achieve a balance between human activity and the urban environment [6]. The theory has provided a new perspective for exploring practicable urban planning, as revealed from massive exemplar planning projects (e.g., Atlantic Yards Project in Brooklyn). The interpretive framework of urban vitality has resonated in numerous urban planning theories, such as new urbanism and smart growth [7,8,9]. Such practical and theoretical achievements made by urban vitality within Western countries inform us that it is crucial for sustainable urban development.
Over past decades, scholars, planners, and authorities have given great attention to urban vitality. For example, Jacobs [5] proposed that human activity and life place constituted the diversity of city life, which boosts urban vitality. In practical terms, urban vitality can be cultivated since the urban fabric satisfies diverse urban planning principles, including mixed use, small blocks, aged buildings, and development intensity. Lynch [10] defined urban vitality as the degree to which the form of the settlement supported the vital functions and biological requirements and capabilities of human beings. Maas [11] defined three components of urban vitality: the continuous presence of people in streets and public spaces, their activities and opportunities, and the environment within which these activities occur. Montgomery [12] defined urban vitality as pedestrian flows during a whole day, the number of cultural events and celebrations over the year, the presence of active street life, and the extent to which a place feels lively in general, highlighting the significance of human activities in urban vitality. However, so far there has no widely accepted definition of urban vitality.
Despite of lacking a consensus on definitions, an increasing body of empirical researches have been conducted to analyze urban vitality, which can be classified into two streams. The first stream investigates urban vitality based on Jacobs’s diversity conditions. Jacobs argues that urban vitality is the synergetic product of diverse planning principles. Most of literatures have been devoted to explore the contribution of planning principles to urban vitality in a couple of US–European and Asian cities [13,14,15,16,17,18,19,20,21]. Under the framework, human flow related indicators are often used to represent urban vitality. Although literatures have used multiple-source data and different methodologies, they seem to concur with Jacobs’s claim that (1) diverse principles at work in an area are a confirmation of urban vitality, and (2) the volume of human flow is an appropriate proxy for urban vitality. The second stream investigates urban vitality based on the viewpoint that urban vitality can be regarded as a determinant for an urban environment facilitating maximum scope for human activity [10]. For example, Ravenscroft [22], Zarin, et al. [23], and Jin, et al. [24] defined urban form related indicators (commercial rent, adequate corridors, road junction density, etc.) to retrieve urban vitality. Meanwhile, the relationship between urban form and urban vitality has increasingly attracted attentions from academics. There are growing evidences that urban form puts significant effects on urban vitality [25]. Although extensive literatures have revealed the proactive role of urban vitality playing in urban development and planning, there is still a knowledge gap since we have neither a commonly accepted measuring system nor an integrated index for urban vitality. Therefore, a universal urban vitality index is urgently needed for empirical study.
A plethora of investigations have been dedicated to dissect the features of urban vitality within megacities in developed countries. In Northern America, the megacities exhibit scattered hotspots with high urban vitality. For example, Jacobs [5] profiled hazy decentralized patterns of urban vitality through daily observation. Evidence suggests that the downtowns in Manhattan, Pittsburgh, and Cincinnati are characterized by low urban vitality, while the slum area in the north of Boston shows sufficient vibrancy. In Chicago, high vitality areas are found in the subcenters that are featured with mixed land use, good accessibility, and livability [26]. In European and Asian cities, nevertheless, vitalized elements tend to concentrate in downtown areas and thus be more prone to show a monocentric pattern. A large body of literatures have examined that within European and Asian cities, high urban vitality areas were often located in the central city, such as in Amsterdam [16], Milan [15], Seoul [13,14]. However, the limited literatures available have explored the intra-urban vital features in the context of developing countries, such as Chinese megacities.
As the biggest developing country, China has an enormous city system with 125 large cities in 2010, being 4.5 times the number in 1978 [27]. According to State Statistical Bureau [28], the ratio of urban population in China has increased from 18% in 1978 to 55% in 2016, and it is expected to continually increase in the near feature. At the same period, Chinese cities are also experiencing many issues that are challenging urban vitality, such as leapfrogged industrial zones far away from the city centers [29], ghost cities with massive vacant houses [30], and sprawled urbanized areas with low density of population [31]. These developmental accomplishments and pains have raised concerns about how to comprehend urban vitality in the specific context of Chinese mega-cities and what are the unique characteristics that are urgent to be explored. So far, while most scholars have been explored multi-city vitality from a comparative perspective [19,24,26], little attention is committed to intra-urban vitality. It is necessary to identify the peculiarity of urban vitality within a megacity, which may provide insightful views for fine-scale urban planning.
However, since urban vitality is related with multi-dimensions of urban fabric, environment features, and human activity, the measurement requires fine-scale indicators and a spatially explicit approach. Recently, the big data, characterized by high-volume, real-time, accurate location, and open-source, has provided new opportunity for spatially explicit measurement on urban vitality. Big data has been increasingly used in measuring urban vitality, such as mobile phone calls [16,18], social media data [19,21], and points of interest (POI) [24,26]. In present work, multi-source big data was used to measure urban vitality, which promoted the measurement to be pragmatic and spatially explicit.
To address such gaps, this study uses Shanghai, China as a case to shed insight on the features of urban vitality in developing cities and to identify the low vitality areas that need the intervention of urban planning. This paper is organized as follows. Following the introduction, Section 2 introduces the conceptual framework of urban vitality. Section 3 describes the methodology adopted in the study. Section 4 reports the results of analysis. Section 5 and Section 6 provide discussion and conclusion, respectively.
2. Conceptual Framework
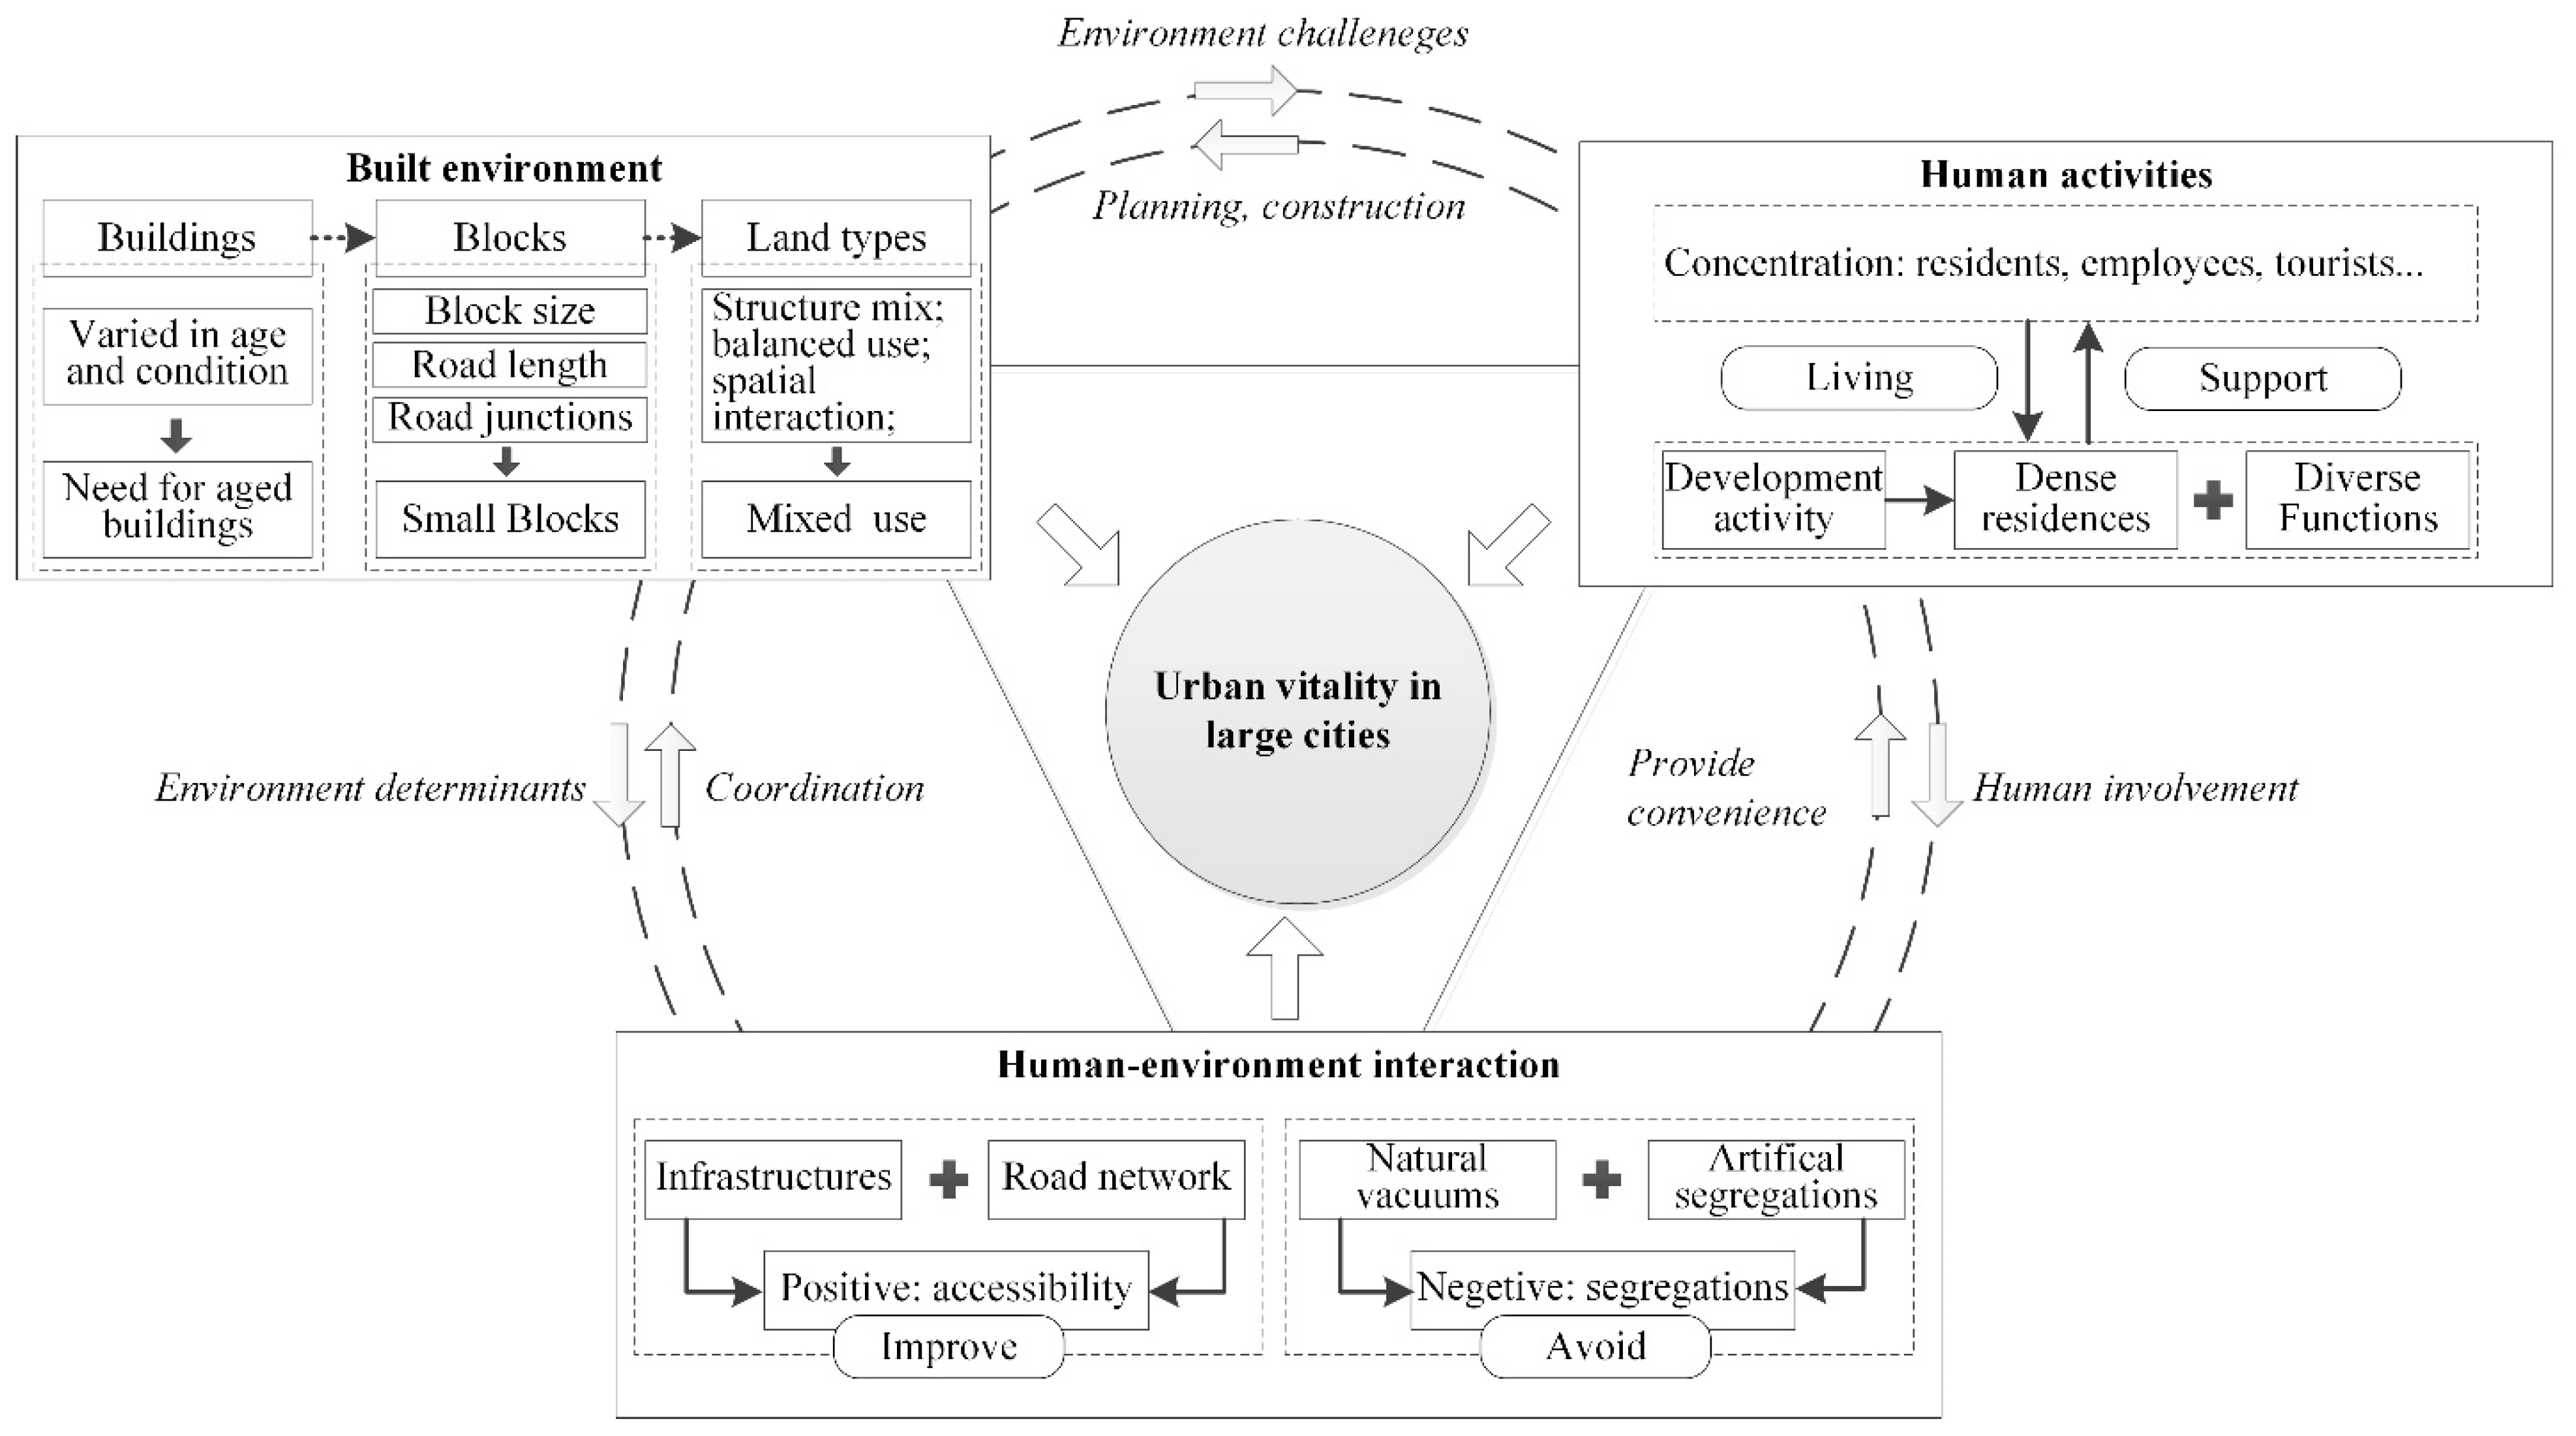
The prerequisite work for measuring urban vitality is understanding its definition and principal dimensions. Urban vitality in previous works has been often defined as a dense concentration of people as well-organized dense functional spaces generated adequate interactions and activities. This definition emphasized the continuous presence of human flow or activity in the specific built environment. The literature in the developed countries often measured urban vitality from two essential dimensions–human activity and built environment [5,10,11,12,17,24]. We argued that apart from the two dimensions, the interaction between built environment and human activity need to be considered in the specific context of developing countries. Many large cities in those countries are experiencing unprecedented urban spatial reconstruction accompanying with rapid population growth, the interaction between built environment and human activity is extremely drastic. Some interactions (e.g., large mono-functional infrastructure construction) may wreck the urban fabric, while some interactions (e.g., road network planning) may stimulate human activity. Therefore, in the paper, urban vitality is defined as the capacity of a specific built environment to boost lively social activities in our conceptual framework, which is determined by human activity, built environment, and human–environment interaction.
The three dimensions contribute positively to the molding of urban vitality and act upon each other. While the built environment (e.g., building, block, land use) can be considered as a determinant to produce human activities (e.g., living, working activities), human beings in turn change or adapt to such built environment through urban planning and construction. Human–environment interaction may pose positive or negative impacts on human activity and built environment, thereby affecting the urban vitality. The overall framework is depicted in Figure 1.
The details of three dimensions are given as follows. First, the built environment can be regarded as the groundwork for urban vitality. It refers to man-made surroundings that provide spaces for everyday human activities. From the perspective of urban vitality, the built environment includes the psychical factors ranging from building and block to land use. For example, the coexistence of aged and modern buildings is representative of cultural diversity that may be helpful to form an attractive urban environment to motivate the concentration of human flow. The smaller block featured by shorter roads provides more walking and social contact opportunities for human daily interactions. Mixed land use renders mixed urban functions to meet population’s various demands, which stimulates the continuous occurrence of human activity with different purposes.
Human activity refers to the proxy reflecting the degree how humans interact and participate in the urban life, which is extensively used to measure urban vitality [24,32]. Human activities to characterize urban vitality comprise two interacting elements: population concentration and development activity. Large cities have an adequately dense concentration of people that leads to substantial demands for living, employment, recreation, and others. In return, only a large city with a dense concentration of residences and diverse urban functions can support a large population. Logically, the more intensive human activities are, the higher the urban vitality.
Human–environment interaction refers to developmental strategy or urban planning that aims to provide better service for humans, with significant influences on built environment. It is likely to be reflected in daily life issues including accessibility and physical segregation [5]. Good accessibility means shrinking commute distance and increasing human activities. The belief that high-quality built environment needs not only accelerated pedestrian flow but also more routes for traffic has convinced many cities to improve accessibility [13,22]. On the other hand, physical segregation impedes human activity as it acts as an obstacle to pedestrian activity through natural vacuums and artificially isolated spaces. It also wrecks urban fabric by fragmentating urban functions, which frequently appear along large monofunctional landscapes and facilities, such as riverfronts, skyways, and expressways [14].
3. Methodology
3.1. Study Area
The area within the outer ring road of Shanghai is chosen for our study, which covers 662.51 km2 and involves 117 townships (also called as sub-districts) (Figure 2). The area accommodated about 13 million inhabitants in 2010. Regarded as one of the financial, trade, economic, and shipping hub in the world, Shanghai harnessed 11.42% of China’s gross domestic product with 1.76% population of China in 2015, ranking the top 1 in Chinese cities. Benefiting from its remarkable economic growth, Shanghai’s urbanized population ratio has grown from 59.0% in 1978 to 89.3% in 2011. The urban area expanded dramatically in Shanghai, with an annual increase rate of 3% from 2000 to 2020 [33]. It has also witnessed a large population influx from the country and abroad. At present, Shanghai is one of the most densely populated cities in the world. In the last century, Shanghai has evolved into a polycentric city with “one central city and six sub-centers (Xujiahui, Jiangwan-Wujiaochang, Zhenru, Huamu, Zhangjiang, and Jinqiao)”. With the relocation of manufacturing industries from the central city to the suburbs, Shanghai is regarded as a livable city constituted of dense built-up areas, whose residential and commercial lands account for 92.53% of the total area.
In terms of spatial scale, sub-district (street/township), is employed as the basic spatial unit to measure urban vitality, where municipal policies are enacted and implemented [31]. Besides, compared with urban vitality at other scales (counties, cities, metropolitan areas) listed by Zeng, Song, He and Shen [26], sub-district is the smallest geographical unit, at which the aggregated urban fabric can be identified [34].
3.2. Selection of Urban Vitality Indicators
As mentioned above, urban vitality indicators are chosen from dimensions of built environment, human activities, and human–environment interaction.
(a) Built environment indicators are selected from three sub-levels: building, block, and land use. The indicators include aged building, block size, road junction, road length, land structure mix, balanced use, and land spatial interaction.
Aged building is included in measuring urban vitality. Aged buildings, mostly located in the central urban area, are usually the officially protected monuments or cultural sites in the context of developing countries. We argue that such aged buildings are representative of cultural inheritance in an urban area. In present work, the indicator is used to represent a multifarious blend of cultural diversity and incremental neighborhood change that may attract a dense concentration of inhabitant and visitor [5,35].
Block size, road length, and road junction are used to measure the features of block. While large rectangular blocks reduce the number of sidewalk intersections, small blocks are needed for a diverse built environment and thus promote pedestrian volume by reducing walking distances and slowing the speed of vehicles [36]. In this case, they contribute not only to a better walking environment but also to better-circulating traffic flow. Short road lengths and frequent road junctions are actually beneficial for providing more contact opportunities for city residents.
Land structure mix, land spatial interaction, and balanced use are used to measure structures, spatial distributions, and functions of mixed land use, respectively. The entropy index is widely used to assess land use mix, which takes into account the relative percentage of multifarious land use types. Land spatial interaction [37] is used to measure mixed degree by dividing a sub-district’s area by length of land interaction boundaries [38]. Balanced use is further used to estimate the balance degree between primary and secondary land uses [13,14]. “Primary use” denotes areas that bring populations together, including residential area, office, industrial land, entertainment land, recreation land, and education facility; “secondary use” denotes service-oriented areas, including commercial land and public service land.
(b) Human activities indicators include population density, labor force, residential area ratio, the density and mixture of POI.
Population density and labor force have been identified as appropriate indicators to measure human activities [13,26,39]. Population density lays the foundation for lively social activity and urban vitality. Only a sufficiently concentrated population can generate intensive human activities. Labor force, the principal force of production and consumption in developing countries, is also closely associated with urban vitality. Given that labor force constitutes 81.25% of Shanghai’s population in 2010, it plays a significant role in urban economic activity.
Residential area ratio, which reflects the density and intensity of human settlement, is a valid indicator for characterizing development intensity. High-density dwellings provide accommodation for large population that produces urbanity. To support inhabitants and migrants, Shanghai’s urban core has large residential area consisting of hundreds of towering apartments.
POI density can be regarded as an accurate indicator of urban function [17,18,24]. Generally speaking, the higher the POI density, the more intensive the development density. Moreover, to uncover the diversity of urban function, mixture of POI was added. Using POI-based mixed use to measure urban function that can identify developmental activities inside a land parcel is more precise than using land-based mixed use [40].
(c) Human–environment interaction indicators are linked to residents’ daily life and include road network, subway station, bus stop, road vacuum, viaduct segregation, and river vacuum.
Road network is a frequently used indicator for assessing a city’s accessibility [26]. Good road networks heighten urban internal communication, reduce transportation costs, and provide commuting options for citizens.
Subway stations and bus stops are acknowledged for being the two primary backbones in the public transportation system in Shanghai. Shanghai provides convenient public transit services through 2000 bus lines and 15 urban subway lanes that stretch from the urban core to the periphery.
Road vacuum is selected as a metric because road buffer areas along railway and expressways impede human activities [15]. Generally speaking, railway and expressways are fenced in to keep people out, with the purpose for safety. Meanwhile, invisible confines that induce dead end are created by such related safety regulations.
Viaduct segregation is also chosen because viaducts separate two sides of a road and severely impede pedestrian activity across the road. Aiming at establishing a convenient transport system, Shanghai plans a tangled system of viaducts and frequent overpasses in both urban core and the periphery, which imposes unavoidable burdens on humans’ daily activity.
The river vacuum has a notably negative effect on social activity since riverfront areas (river vacuums) are usually depopulated lands, intertidal zones, as well as wharfs with infrequent human activities. Even though some of these areas have been transformed into urban parks or green open spaces, they still have limited social activities in most of the time because of their special locations [5].
3.3. Measurement of Urban Vitality Indicators
Urban vitality indicators were processed through multi-source data and various methods (Table 1). Land use planning data were used to derive residential area ratio, viaduct segregation, and river vacuum. With no clear marking on land use, viaduct segregation was further identified by street view of Baidu Map (a popular navigation website in China). Urban built-up land extracted from land use planning was used to calculate land structure mix, balanced use, and land spatial interaction. Road maps form Baidu Online Map were used to extract road network, road length, road junction, and road vacuum. We derived block size by combining land use planning and road maps. Population density and labor force at the sub-district level were obtained from China’s Sixth National Census. POI data was used to analyze POI density, subway station, and bus stop. Mixture of POI was derived based on its 14 categories according to ESRI China’s criterion. Finally, nearly 1500 aged buildings were recorded and geocoded according to the conservation list of historic buildings.
The original values of all indicators were rescaled into standardized values through min–max normalization method that ranged from 0 to 1, indicating an increasing positive effect on urban vitality. Except block size, road length, road vacuum, viaduct segregation, and river vacuum, the others are all positive indicators. All indicators were rescaled into sub-district in order to uniform the unit of analysis.
3.4. Derivation of Urban Vitality
The projection pursuit model (PPM) was adopted to integrate the indicators and derive urban vitality. The primary advantage of PPM is its use low-dimensional orthogonal projections of data to reveal characteristics in high-dimensional data [42,43]. With dimensional reduction eliminating data redundancy, the significance of multivariate indicators can be easily detected through a projection value. In our PPM, based on conceptual framework, multidimensional indicators were projected on a single-dimensional value for urban vitality, built environment, human activity, and human–environment interaction, respectively. The PPM includes following steps:
(1) Creating a projection index. Assuming that is a dimensional unit vector where refers to the number of indicators affecting urban vitality. The data with dimensions were then condensed into a single-dimensional projection value . The process was calculated by the equation
where refers to the projection eigenvector, refers to th data in the th indicator, refers to the projection direction of projection value .
(2) Establishing the objective function . Establishing the objective function should comply with two rules. First, to extract the data character of the combined structure from the multidimensional factors, the projection value should mine enough variation information from to ensure that the standard deviation can be distributed widely to the utmost. Second, the dispersion features should be such that the local density of reaches a peak, so that while the local projection points are centralized in several clusters, the clusters are dispersed as a whole. Under these circumstances, the objective function can be calculated as
where refers to the mean value of sequence , is window radius of local density, and is the distance between the projection value and . refers to the unit step function. The function will be 1 if , or it will be 0 if .
(3) Optimizing the projection function. When the sample set is given, the variation of the projection index is solely determined by the projection direction . Thus, there must be numerous projection directions exposing different futures of the data structure. It is necessary to determine the best projection direction with the greatest possibility of predicting futures of high dimensional data. Improvements in projection direction can be calculated using the formula
The former equation is dedicated to the maximal objective function, and the latter calculates the constraint condition. However, this is a complex nonlinear optimization based on the optimization variables , which is impracticable to utilize conventional approaches to crack. In our study, the real coding-based accelerating genetic algorithm (RAGA) was used to improve the projection function.
(4) Computing the projection value. The projection value is computed by putting the best projection directions obtained by Step (2) into Equation (1). Built environment, human activities, human–environment interaction, and urban vitality were calculated via approaches, respectively. The greater the projection values, the greater the magnitude of these indicators.
3.5. Validation of Urban Vitality Using Mobile Phone Usage
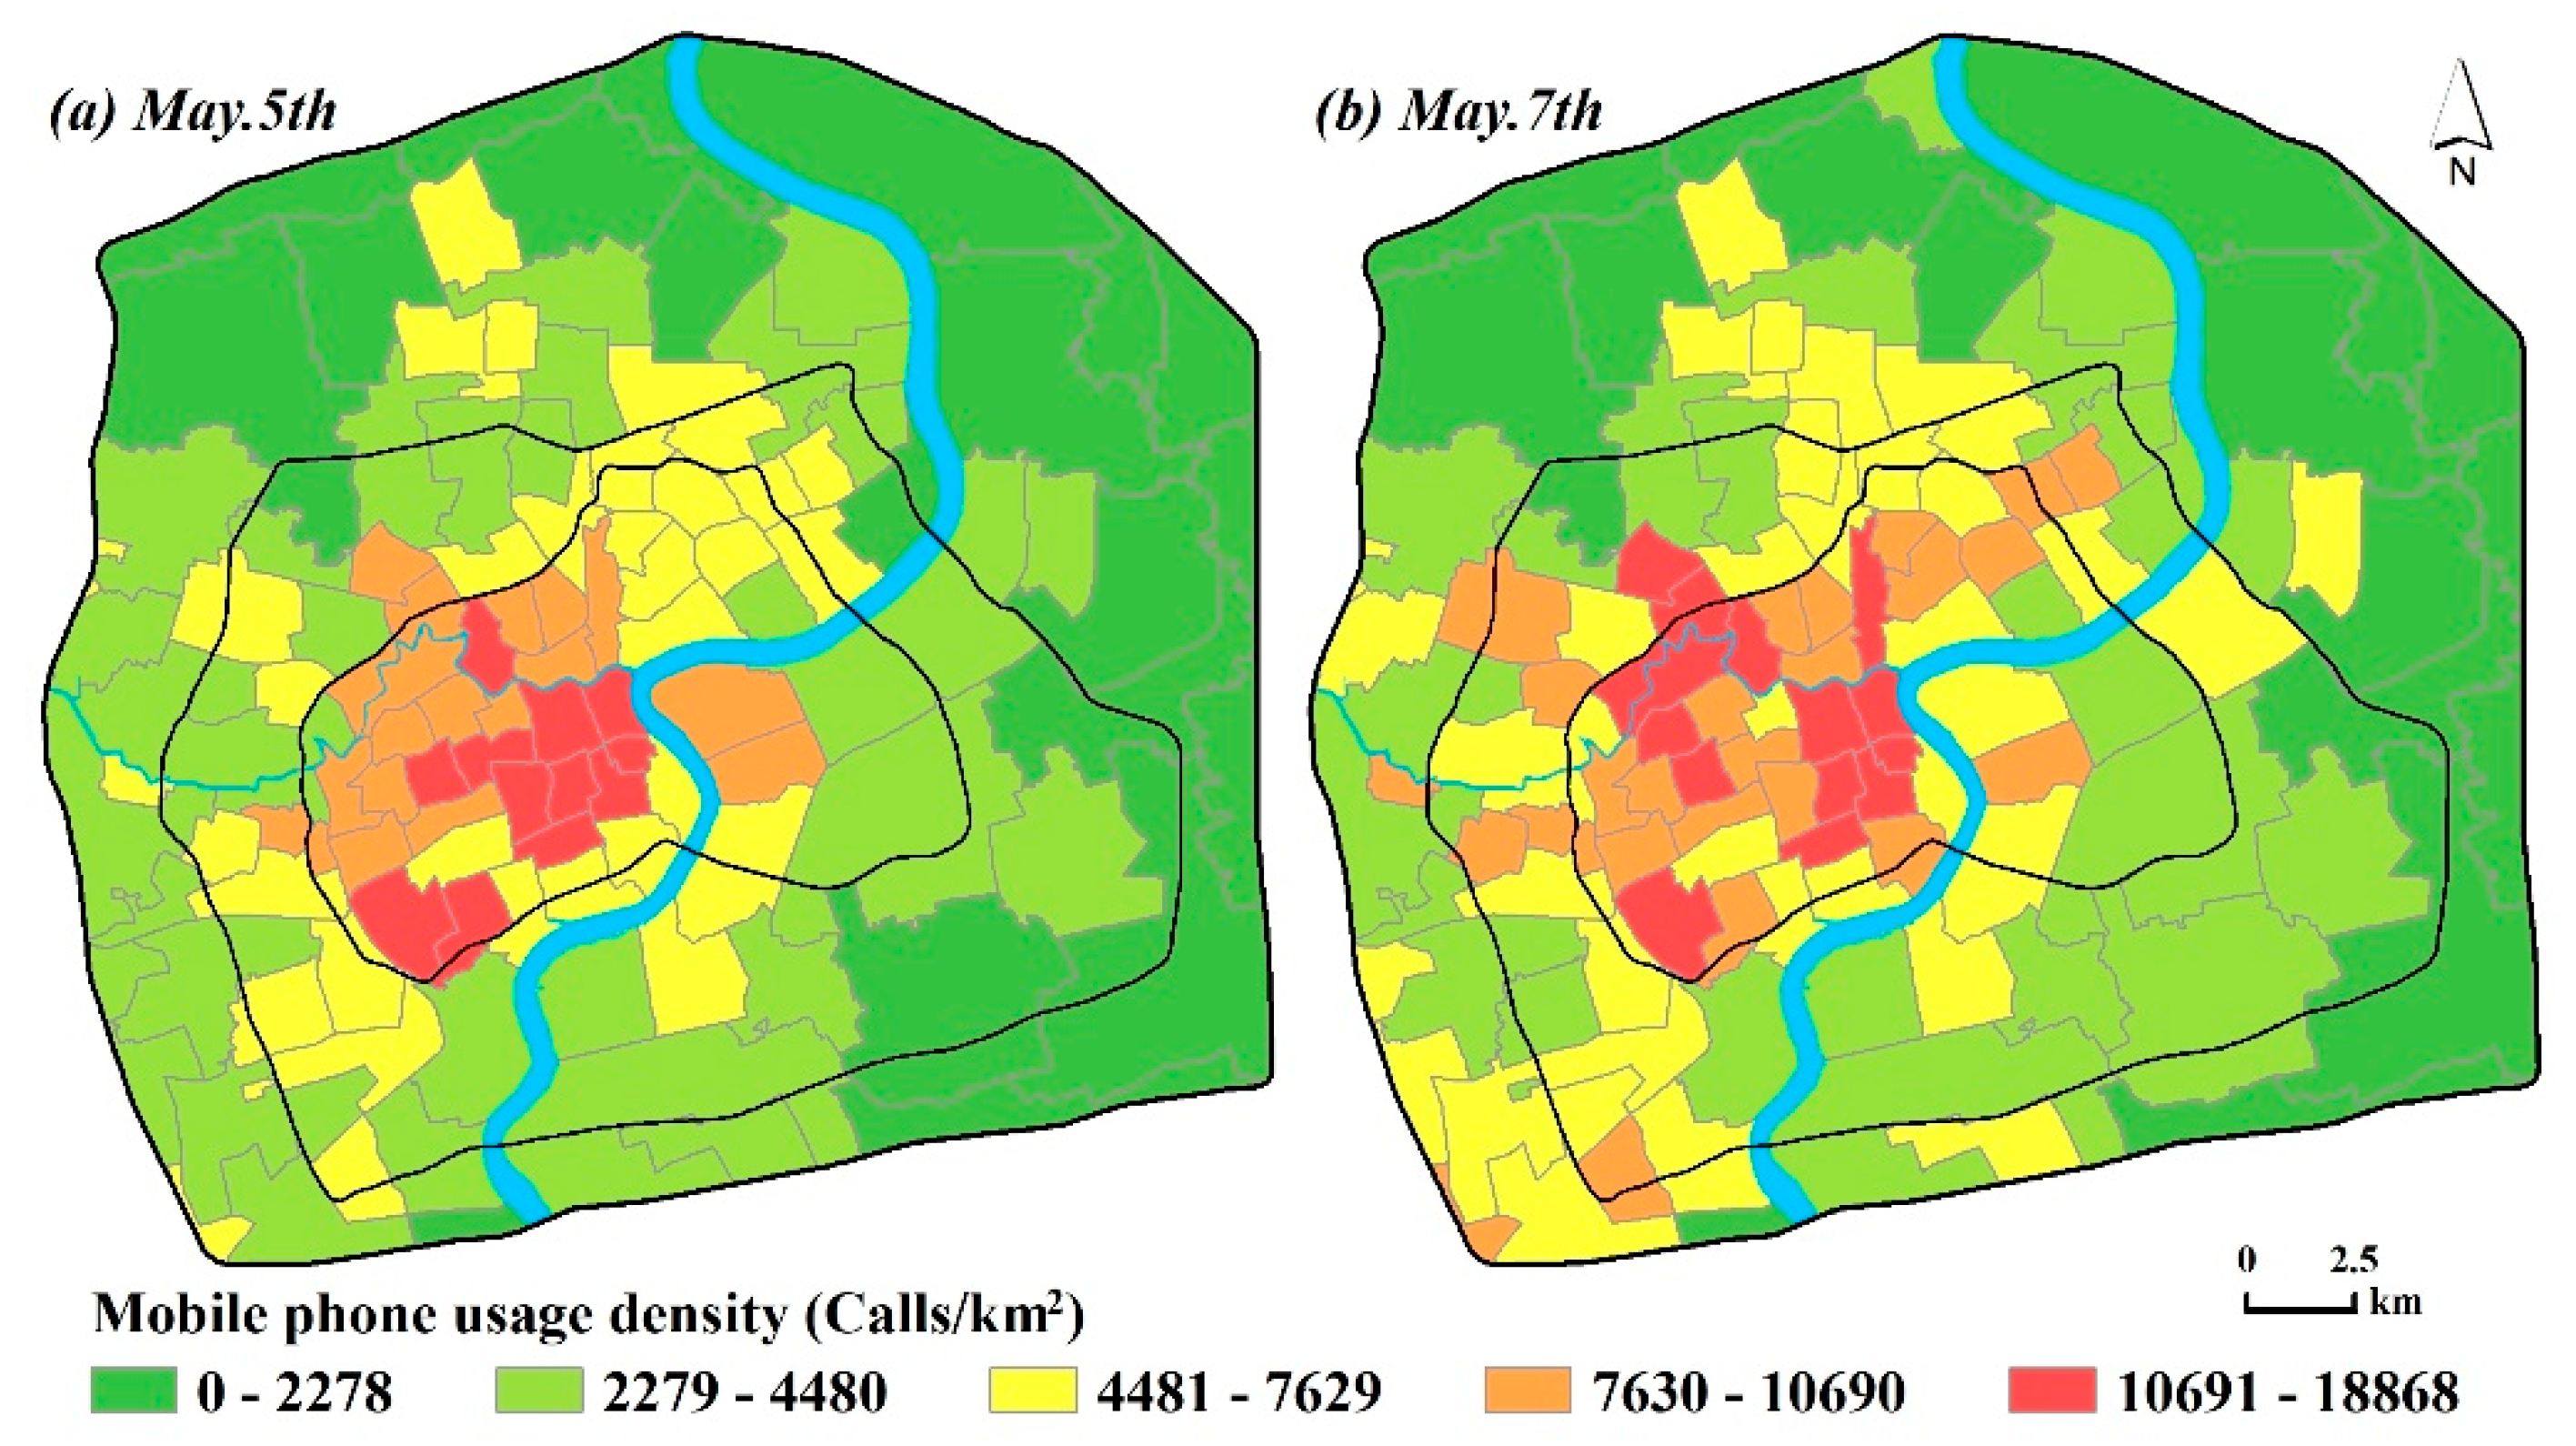
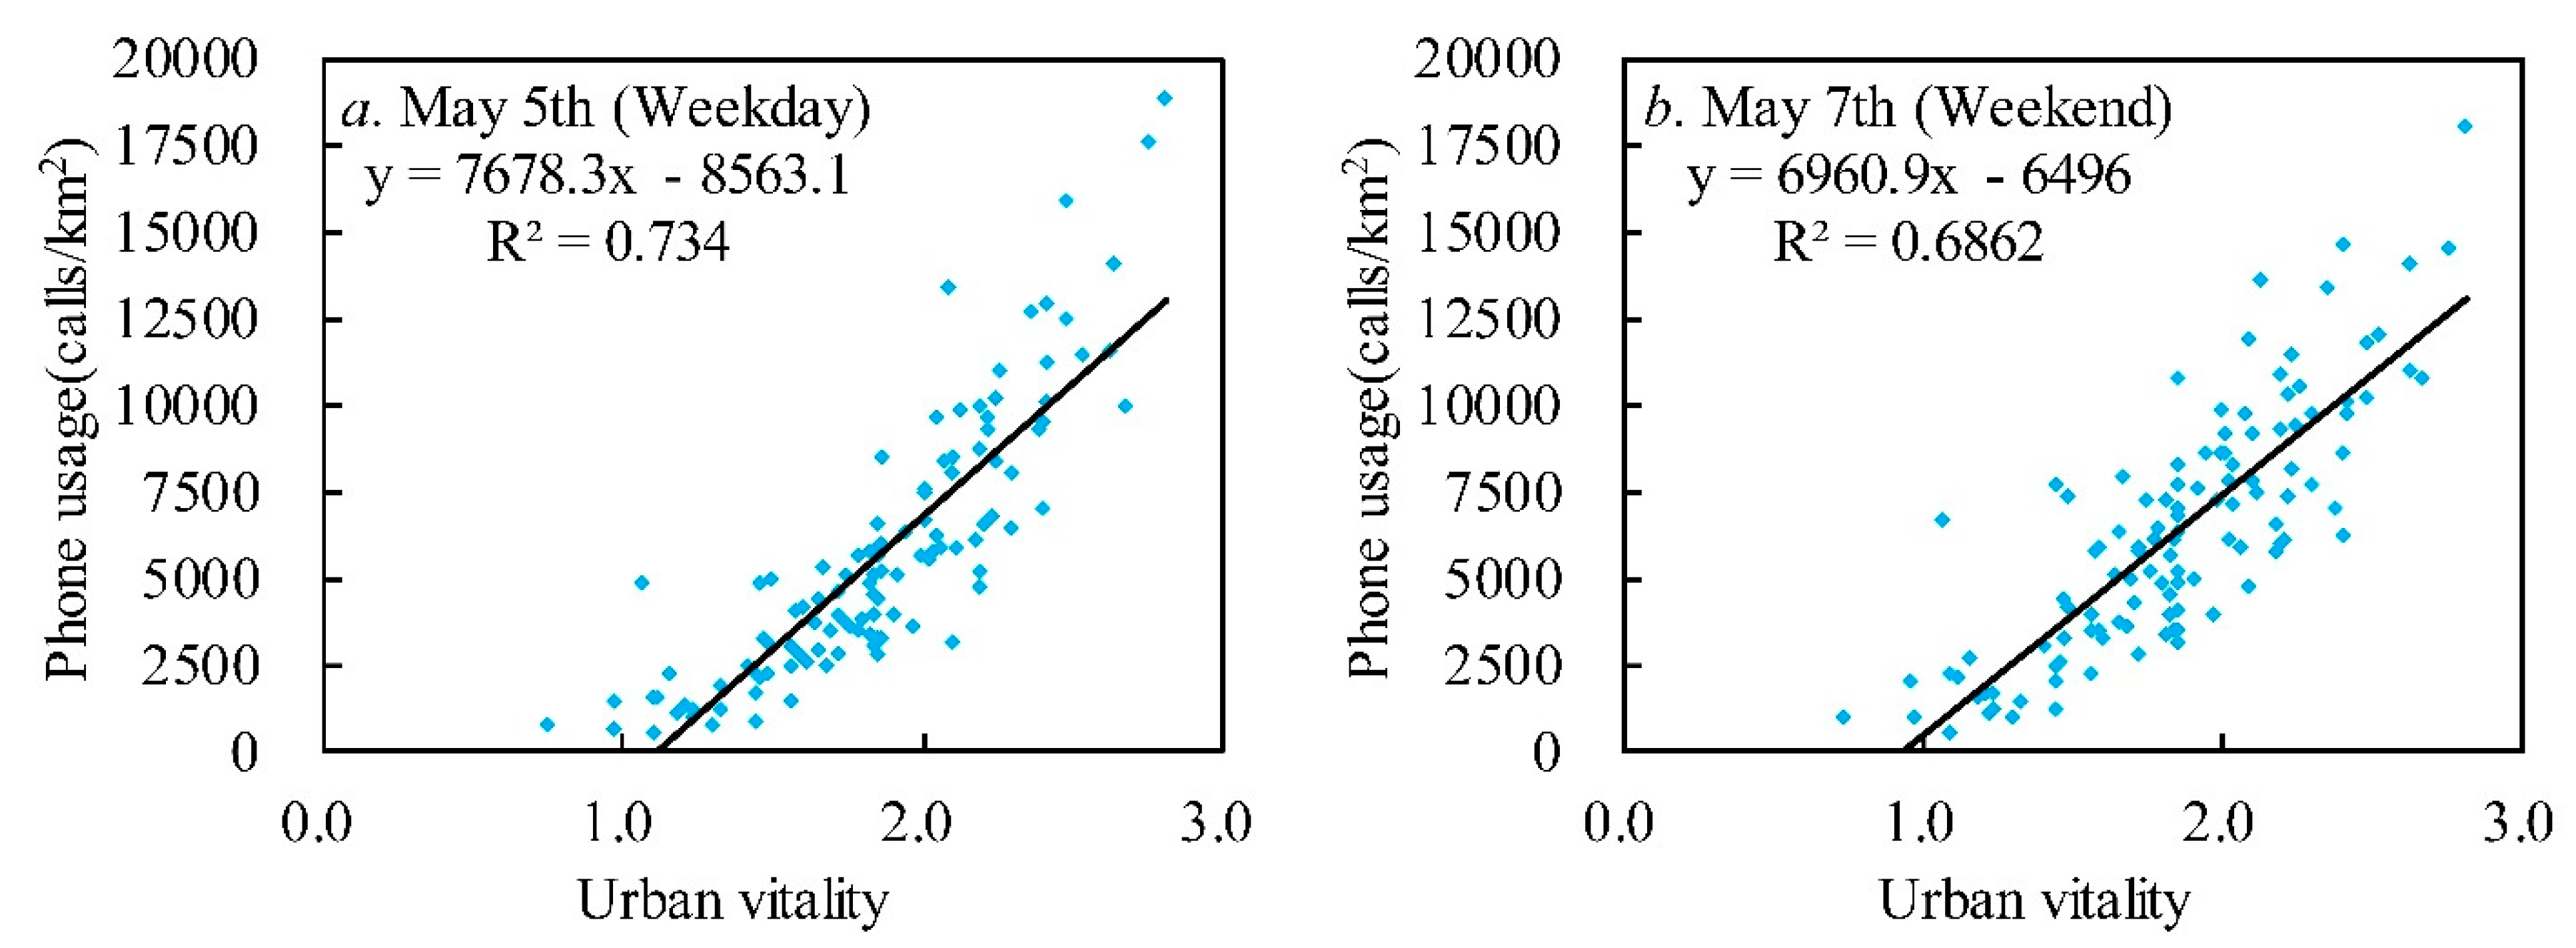
The previous literatures suggest that human flow is a proxy for validating urban vitality, and the denser the human flow, the stronger the urban vitality [5,44]. The dataset available from mobile phone call opens new possibility for validating the spatial concentration of population at the sub-district level [15]. Mobile phone call records, a spatially explicit location-based dataset that could infer caller locations, were used to validate the results. We collected the data from 17,365 cell towers that record the number of mobile phone calls at a given time, which were distributed across the entire study area [15,16,17]. The mobile phone calls per cell tower were collected in 3:00 p.m. on May 5 and May 7, 2017, respectively. Based on the data, we counted the accumulated calls in each sub-district. Following previous literatures, we proposed hypothesis that an urban area with more mobile phone calls was likely to be more vibrant. The results were therefore validated by correlating urban vitality with mobile phone calls per km2 using linear regression where regarded urban vitality and the index of mobile phone calls per km2 of sub-district as the independent variable and dependent variable , respectively.
4. Findings
After computed through PPM, urban vitality and three dimensions were graded by using Jenks (Figure 3).
4.1. Built Environment
An abrupt break of built environment value between two banks of Huangpu River can be observed (Figure 3a). While diverse built environment is distributed in the west bank of Huangpu River, homogenous built environment dominates the east bank.
In the west bank, two types of diverse built environment are identified, with built environment values being more than 1.34. The first type is dominated by aged buildings and small blocks along the Huangpu River and the Suzhou River, such as Waitan, Nanjingdonglu, and Nanjingxilu. The second type is characterized by mixed land use centering on Xujiahui and Jingan Temple, such as Xujiahui, Shimenerlu, and Tianpinglu. In the east bank, most of sub-districts are inferior in the dimension, with values being below 1.19. However, Lujiazui is the exception with its built environment being 1.51. The land structure mix and mean road length are 0.78 and 73 m, respectively, ranking 5th and 15th in all sub-districts, respectively.
4.2. Human Activities
Visual inspection (Figure 3b) shows that human activities decline from the central areas to the city periphery, also exhibiting a polycentric pattern. 13 sub-districts are clustered in Huangpu district, Hongkou district, and Jingan district, with human activities values being over 1.01. Several urban sub-centers also show intensive human activities, especially Wujiaochang and Xujiahui. Our results reveal that those sub-districts have a concentration of population with high-density development activities. However, a ring-shaped pattern can be found in Shanghai with the sparsest human activities along the outer ring road.
Interestingly, human activities are also intensive beyond the inner ring road, such as those occurring in Gumei and Jinyangxincun. While Gumei and Jinyangxincun rank high in population density (7th and 9th) and residential area ratio (3rd and 34th), POI density and mixture of POI are low. This result suggests that while they accommodate a large population, their urban functions are weaker than those of central sub-districts.
4.3. Human–Environment Interaction
First, the spatial pattern of high values, shown in Figure 3c., reveal two distinctive unattached clusters: the Waitan–Sichuanbeilu area and Xujiahui–Jingansi area. The Waitan–Sichuanbeilu area has a comprehensive road network and a dense concentration of public transport stops, which offsets the negative interaction posed by viaduct segregation. In contrast, we find that sub-districts centering on the Xujiahui–Jingansi area are inclined to be characterized by limited viaduct segregation and natural vacuums.
Second, nine sub-districts with value being more than 1.21 appear in a scattered pattern along the middle ring road. The mean values of road network, subway station, and bus stop are 14.6 km/km2, 16 stops, 161 stops, respectively, approximating to those of central sub-districts.
4.4. Urban Vitality Results
Figure 3d depicts a monocentric spatial pattern of urban vitality in Shanghai. Sub-districts with high urban vitality are distributed within the inner ring road, with 14 sub-districts centering on the old urban cores—the Bund, Nanjing Road, Huaihai Road, Renming Park, Jingan Temple, Xujiahui. In comparison, sub-districts with low urban vitality are located along the outer ring road. The result also shows a gap of urban vitality between the old urban area and Pudong New Area. The evidence is that only one sub-district of high urban vitality and two sub-districts of relatively high urban vitality are found in the Pudong New Area.
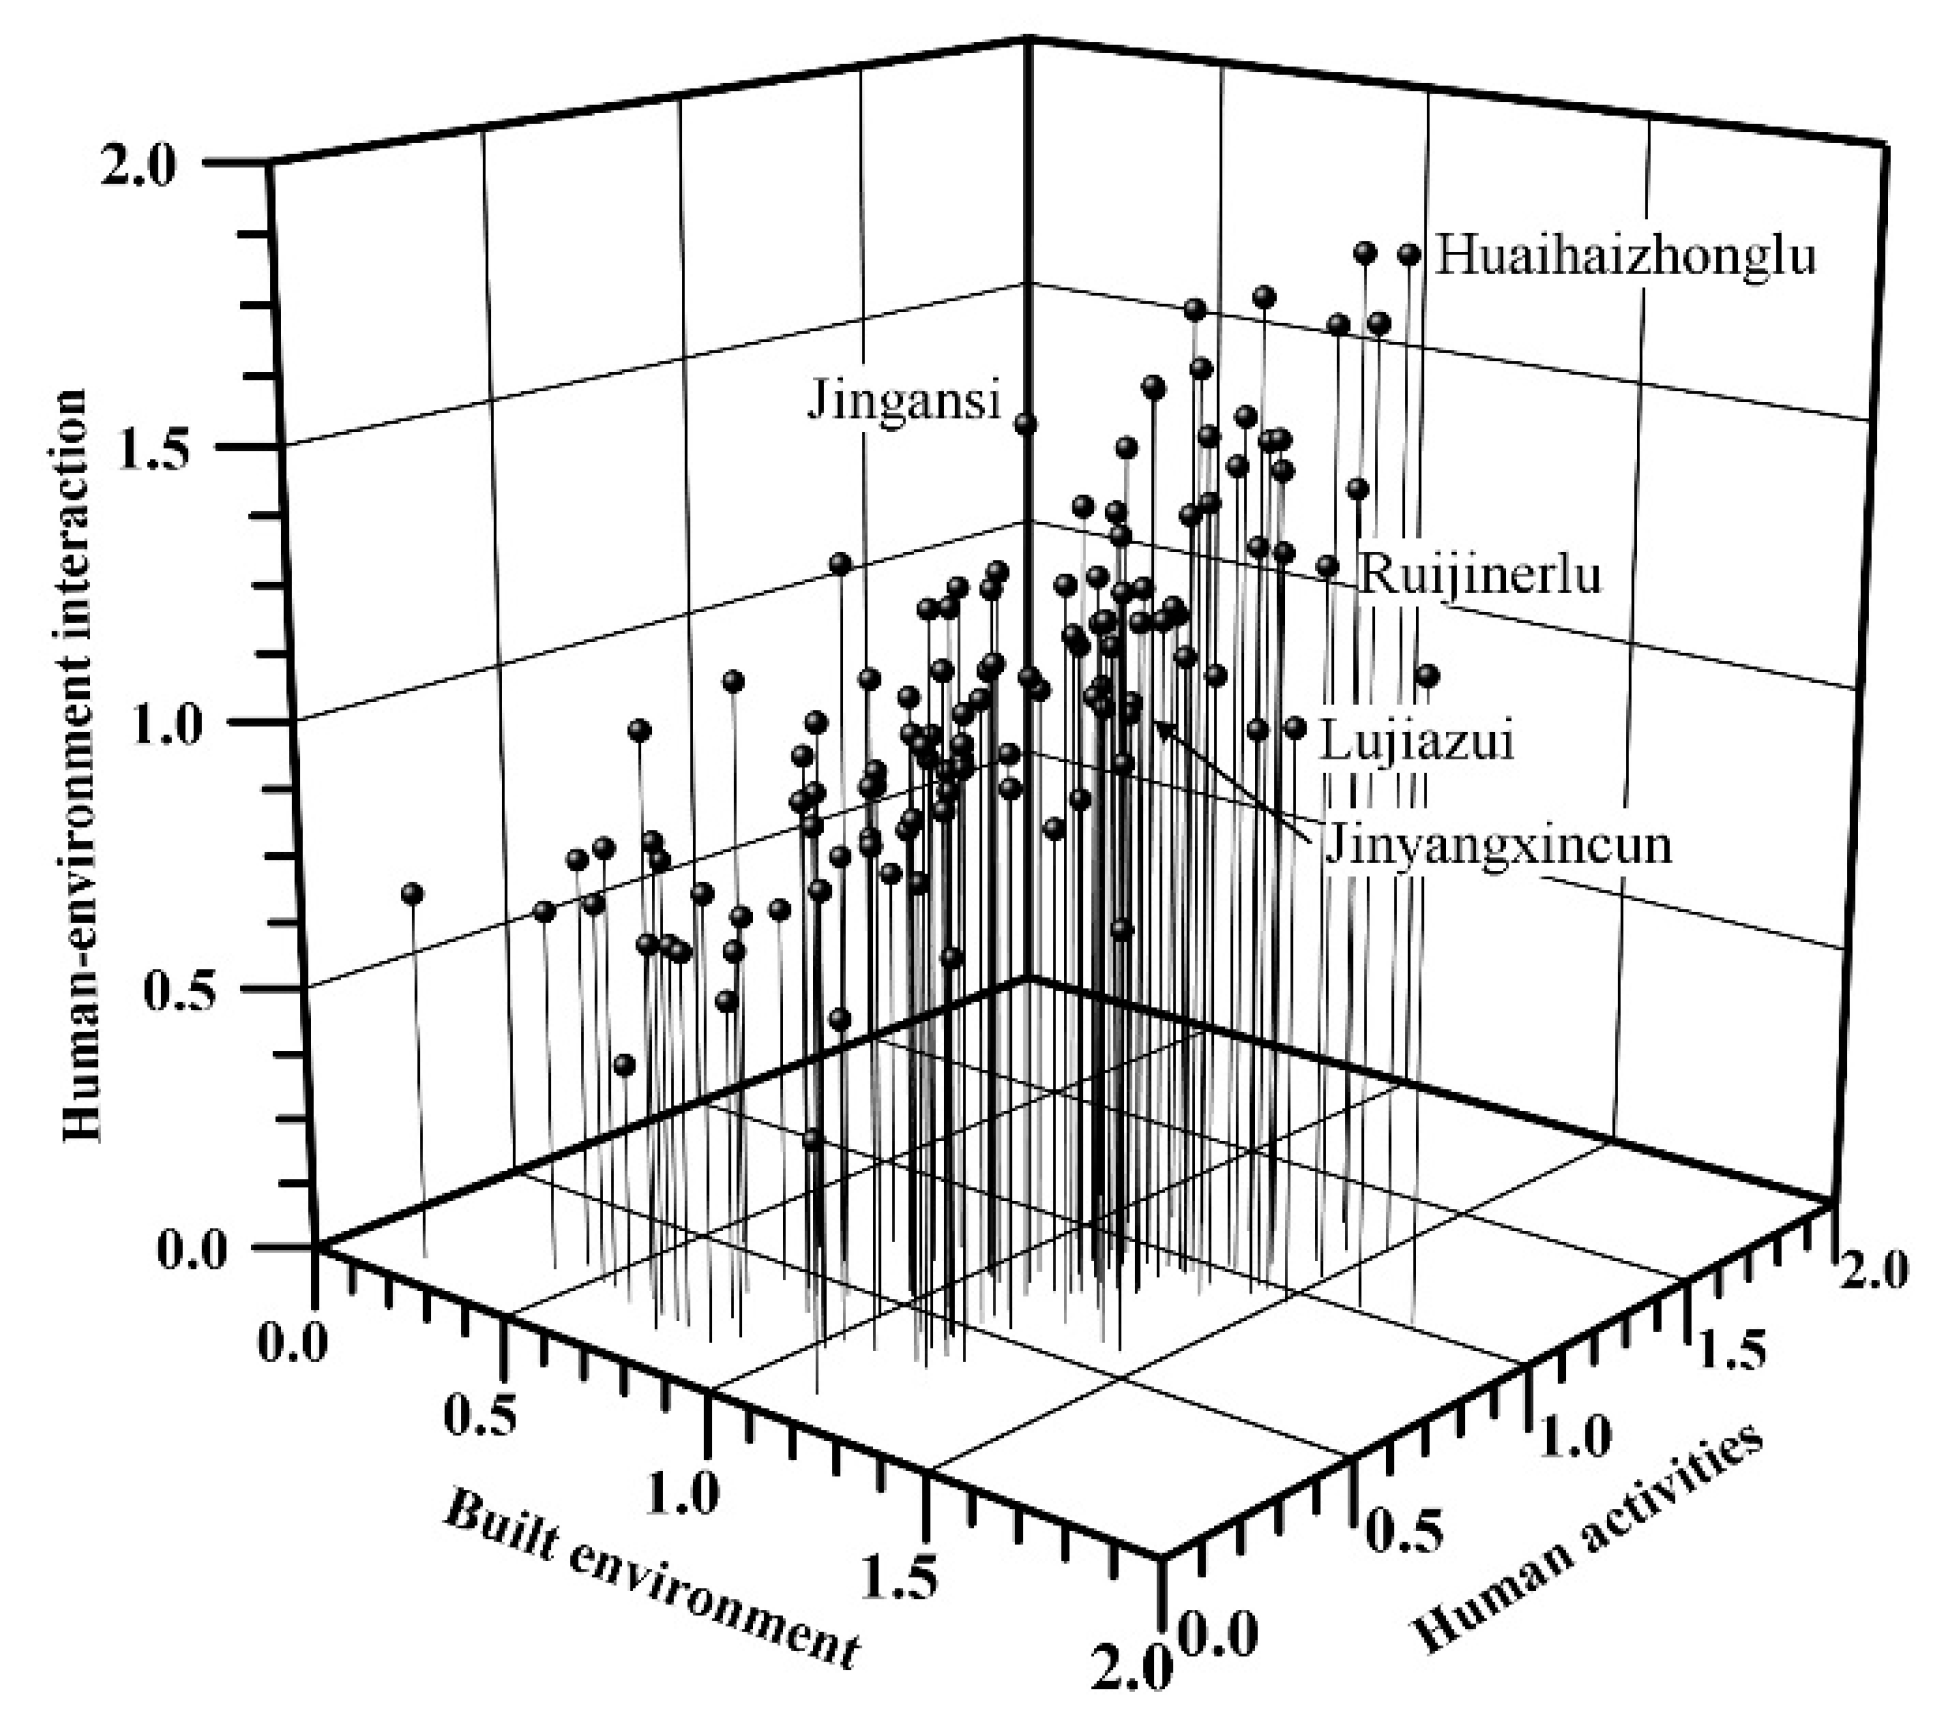
Urban vitality was further explored as a multidimensional phenomenon depicted in the three-dimensional diagram (Figure 4). Due to different concepts of the three dimensions, we argued that different dimensional patterns revealed different features of urban vitality. Therefore, three types of high urban vitality in Shanghai based on three-dimensional values, features, and locations were identified: old urban areas, CBD, and residence-oriented area. Old urban areas usually show high urban vitality based on two or three dimensions. Among old urban areas, six sub-districts have high values in all three dimensions. Jingansi, Hunanlu, and Tianpinglu are more affected by the built environment and human–environment interaction, while Ruijinerlu, Nanjingxilu, and Laoximen are dominated by the built environment and human activities. Lujiazui CBD is only prominent in its built environment. Jinyangxincun is identified as a residence-oriented area that is planned for floating population by master plan. While Jinyangxincun has low value in the built environment and human–environment interaction, it ranks relatively high in human activities and has a potential for increasing urban vitality in the near future.
4.5. Urban Vitality Validation
We testified the relationship between the spatial distribution of mobile phone usage density and urban vitality. As shown in Figure 5, sub-districts with high-dense phone usage mostly appear in the west bank of the Huangpu River or along the Suzhou River. The phone usage density on both days decreases rapidly from the central areas to the periphery, which coincides with the distribution of urban vitality. The relationship was further confirmed through correlation analysis, as revealed from significant Spearman’s correlation coefficients of 0.857 (May 5) and 0.828 (May 7), respectively.
The results of regression analyses of the two variables are shown in Figure 6. The fitness values of R2 are 0.734 and 0.6862, respectively, indicating high accuracy of the validation. The validation illustrates that while sub-districts of high urban vitality are fertile grounds for high-density phone usage, low urban vitality tends to foster less phone usage. Concretely speaking, a vibrant urban area that possesses mixed land use, smaller block, and better accessibility, is likely to boost human flows, which confirms our hypothesis.
5. Discussion
The results show that Shanghai follows a monocentric vital pattern within the outer ring road, with urban vitality declining from the central urban core to the city periphery. While Shanghai’s monocentric vitality pattern echoes the feature from the existing studies in European and Asian cities [13,15,16,24], it is distinct from that of Northern America cities where tend to be highly decentralized [5,26]. The specific features of urban vitality in Shanghai may be due to the following drivers. While small block planning and urban renewal regulation largely explain why the old Shanghai has high urban vitality, mixed development, and migrant concentration may contribute to superior vitality in Lujiazui CBD and residence-oriented areas, respectively. Large block zoning is the possible reason for low urban vitality in newly developed areas.
5.1. Urban Planning
5.1.1. European-Style Block Planning in Old Shanghai
The highest urban vitality in old Shanghai is due to its long-term impact by European-style block planning. European-style blocks, quite commonly occurred in European cities before the phase of motorization, are characterized by a unity of massive small blocks or elongated buildings, with dense outspread paths [45,46]. Since Shanghai was opened in the 19th century, the planning thought was brought in the Shanghai’s concession areas. In the late 19th century, within the concession area along the west bank of Huangpu river, the Shanghai Municipal Council (SMC) planned dense intervals that most are smaller than 100 m between two roads, and plenty of intervals only ranged from 40 m to 50 m [47]. In 1920, given the inferior traffic induced by the coexistence of tramcar, automobiles, and pedestrian activities, the SMC promulgated the first traffic regulation, which categorized roadways into carriageways and footways. The regulation then facilitated the emergence of footways between roadways or dwelling blocks, which helped forming widespread road network. The road densities in the former international settlement and French Concession developed from 5.3 km/km2, 18.3 km/km2 in 1913 to 10.7 km/km2, 9.6 km/km2 in 1940, respectively [48], which were even denser than hodiernal criteria.
Given the dense road network concentrating in the limited concession areas, blocks are segmented by small road network, aligning with the pattern in traditional European cities. As shown from the block layout around the Nanjing road (a part of the international settlement) in Figure 7a, the blocks are featured by serried buildings and irregular paths, where the interiors of the block become open corridors, accessible among the exterior and interior.
5.1.2. Zoning Plan in Pudong New Area
A large proportion of Pudong New Area has relatively low urban vitality, apart from the Lujiazui and its surrounding areas. Pudong New Area is affected by modern zoning plan, which forms a monotonous built environment. Since Pudong was approved as a national-level new area in 1990s, it was divided into five zones for specialized industries, including Lujiazui–Huamu (tertiary industry), Jinqiao–Qingningsi (export goods processing industry), Gaoqiao–Waigaoqiao (petrochemical and shipping industry), Zhoujiadu–Liuli (export goods processing industry), and Zhangjiang–Beicai (high-tech industry) [49,50]. In 2000s, Sanlin and Chuansha were added as two additional specialized zones aiming to develop World Expo and logistic industry, respectively.
Zoning plan allows these specialized zones to preferentially supply large-scale industrial land in suburb, which facilitates to accommodate enterprises and factories. Stimulated by this industry-oriented land development strategy, local authorities make efforts to establish industrial parks and transport network. Such overemphasis of industry development in numerous sub-districts easily triggers monotype land development. For example, industrial land and traffic land in the Jinqiao export processing zone (JEPZ) occupy 41.22% and 10.45% of their areas, respectively. Meanwhile, zoning plan tends to feature grid-pattern road network composed of dense urban expressways, with sparse outspread paths (Figure 7b,c). Under the circumstance, many industrial parks and neighboring residential communities are divided into large number of independent large-scale closed blocks with an enterprise or a residential community, forming regular layouts [45]. The plan is similar to American’s Euclidean zoning that is featured by the segregation of urban land into independent spatial units. It therefore results in absent road junctions and ‘human touch’, leading to severe road vacuums [14,45]. Consequently, monotype land use, regular large-scale blocks, and road vacuums render many sub-districts of Pudong as hardest-hit areas for low urban vitality.
5.2. Urban Development and Renewal
5.2.1. Mixed-Functional Development in Lujiazui
Lujiazui, as a newly developed CBD in Pudong New Area, has relatively high value of urban vitality. Mixed-functional urban development plays leading role in diverse built environment in Lujiazui, as implied by the high value of land structure mix (0.78) and balanced use (0.85). Lujiazui initiated mixed-functional development though land resource configuration after approval of the Lujiazui financial development zone by the central government in 1990 (Table 2). The Lujiazui center planning (1993) designed the layout combining the business districts with central green space and riverside parks. After then, Lujiazui focused on displacing low-rise residence and manufacturing enterprises with office buildings, with the aim to accommodate transnational corporations and financial institutions. Meanwhile, green space experienced rapid expansion as Lujiazui put leisure place as the priority for public infrastructure. Entering the 21th century, the development of residence and commercial facility were tremendously affected as China enjoyed the economic growth. The Shanghai Master Plan (1999–2000) proposed the CBD (Lujiazui and the Bund) should be endowed with adequate space for residence, shopping, and recreation, in addition to finance and trade. Numerous commercial facilities (e.g., Super Brand Mall, International Financial Center Mall, Jinmao Life Center) sprung up along the Century Avenue. Benefiting from Shanghai’s housing system reformed, Lujiazui also leased the vast majority of lands for residential communities from 2000 to 2010, which were developed as six high-end residential communities (higher than 100,000 yuan/m2) clustered in its southwest. In 2010, mixed function area composed of business district, leisure space, trading area, and river-view residential community, was already formed.
Recently, the aim of building a ‘global city’ facilitated people-oriented planning to attach importance to balanced urban functions. This encouraged the form of life-related functions but weakened industrial development in Lujiazui. The 13th Five-Year Plan (2016–2020) emphasized this momentum, planning functional development projects of green belts, recreational park and cultural facilities at the stock areas. Lujiazui then focused on converting stock industrial lands according to their surrounding functional orientations and features. Number of riverside stock industrial lands were transformed to recreational parks and cultural facilities. For example, the project transforming from Shanghai shipyard to public cultural facility (1862 Theater) was completed in 2017.
5.2.2. Urban Renewal with Historic Area Reserving Regulation
Urban renewal facilitates urban vitality in historic reserving area, as revealed by the retention rate (64.9%) of aged buildings within inner ring road. Urban renewal movements, especially prohibiting the demolition of aged buildings and reconstruction of reserved blocks (Lilong), retain small blocks and multi-era buildings in old Shanghai. Since the rapid urban renewal in 1990s, many aged blocks located in old urban area were demolished and turned into decent communities or shopping malls. At that time, the rough urban renewal is likely to spoil vital urban fabric and diversified buildings. To crack this issue, Shanghai government approved five batches of historic building list from 1989 to 2015, which prohibited the demolition of multi-style historic architectures. Moreover, Shanghai delimited the historic blocks and streets to regulate rebuilding and engineering criteria in their surroundings, as response to extensive urban renewal. In 2017, Shanghai conducted a survey of historic buildings that more than 50 years within the outer ring road.
Benefiting from proactive regulations, a majority of aged blocks and streets were reserved. In 2007, Shanghai government listed 144 historic streets and 64 banned-widening streets, which were mostly located in Huangpu district, Hongkou district, and Jingan district. Another two lists to reserve 250 historic blocks were published in 2017, and almost of 72% of the historic blocks were situated in these three central districts. The lists also identified Shanghai’s 44 historic areas, with nine historic areas located within the inner ring road. The lists forbidden massive urban renewal projects occur within reserved blocks or streets. The regulation helped the retention of old-fashioned urban fabric and modern development, contributing to vital built environment in old Shanghai.
5.3. Migrant Concentration
Migrant concentration can be related to the intensive human activities, directly fostering urban vitality through the concentration of migrant and labor force in the peripheral sub-districts, such as Jinyangxincun. Since the 2000s, with manufacturing industry relocating from the central city to the industrial parks and development zones, large migrant populations tended to concentrate in the inner suburbs [51]. According to the China’s Sixth Census, suburban sub-districts in Pudong and Minhang received the largest inflow of migrants, evolving into densely populated areas, such as Jinyangxincun and Dongminglu. Those sub-districts, adjacent to industrial parks or development zones, were thus firstly planned as residence-oriented areas to accommodate migrants. For example, the 10th Five-Year Plan (2001–2005) planned for an inflow of 210,000 inhabitants into the Gumei sub-district, which was adjacent to the Caojinghe and Hongqiao Development Zones.
Meanwhile, large population concentration boosts housing needs, leading to dense commodity housings developing in peripheral sub-districts. These commodity housings particularly meet the need of employees and migrators, who prefer to affordable housing prices and superior location to industrial parks or development zones. It is worth noting that local authorities dedicate themselves to developing peripheral low-price land and improving public facilities, with the aim to accommodate inter- or intra-city immigrant population. In 2014, 13 of 22 sub-districts near or outside the middle ring road has high residential land ratio. Although these peripheral sub-districts are temporarily short of infrastructure inferred from POI mixture, concentrated population and intensive residential development indicate potential for high urban vitality in the near future.
5.4. Policy Enlightenments and Research Limitations
Our work provides some policy enlightenments for rapid urbanized large cities in developing countries, such as how to avoid homogeneous built environment and increase human flow. As for Shanghai, Pudong New Area occupies massive peripheral land by new towns, suburban high-tech parks, and development zones. Many newly developed urban areas are occupied by monotonous land use and thus need to aggregate urban functions and improve infrastructures to attract human flow (e.g., employees, investors, and workers). In fact, Shanghai has stepped forward in mixing urban functions to cope with such developmental issues in new urban areas. For example, the Zhangjiang high-tech zone (ZHZ) has 31.21% residential land, 8.41% recreational land, and 6.95% commercial land, with 33.02% industrial and research land. Its mixture of POI and density of bus stop rank 11th and 3th among all sub-districts, respectively. Building multi-functional new urban areas may alleviate the detrimental impacts of bald build environment, thereby helping avoid monotype land development and attract population concentration.
Meanwhile, planners and policy makers need to increase their awareness of traditional cultural protection, such as preserving old communities. In Shanghai, sub-districts with high urban vitality (e.g., Xintiandi, the Bund, Nanjing Road) take advantage of the old urban communities and preserve their vibrant characteristics, such as mixed land use and aged buildings. Unfortunately, the past decades have also seen many Chinese cities transforming old urban areas into monotonous modern communities. This finding of preserving old communities and streets can provide a guideline for other Chinese cities which are undergoing large-scale urban renewal [24].
Nonetheless, the paper still has some limitations, which are needed to be addressed in future studies. First, although we have identified the relationships among these three dimensions, we seldom measure their mutual relationships. The coordination between the built environment and human activities is agreed to be the heart of urban vitality, but the impacts and feedback of these two components are complicated and need to be further clarified. Secondly, in light of Jacobs’s theory, large cities must have a sufficiently concentrated population to deliver the services needed in community. However, due to data unavailability, we only have considered population density of inhabitants, which failed to address recurrent populations as Jacobs did. The measurement of recurrent populations for other purposes (e.g., trade, tourism, or hospitalization) can be incorporated into the future study. Thirdly, we paid little attention on the issue how population increases drive the demand for amenities to maintain the vitality. We considered that the population concentration has a double-edge effect on urban vitality. The over-crowded population may create congestion and dis-amenity that lower vitality. However, the issue will be explored in further study.
6. Conclusions
While rich literatures are devoted to explore intra-urban vitality in Western and North America, such studies in Chinese cities are still in initial stage. To bridge the gap, this study provides a new conceptual framework and a measurement of urban vitality in large Chinese cities.
We defined urban vitality as the capacity of an urban built environment to boost lively social activities, which is a trinity determined by built environment, human activity, and human–environment interaction. We measured urban vitality by PPM from three dimensions using multi-source data. Our findings show that compared with Shanghai’s vibrant old area, built environment in the Pudong New Area tends to be monotonous. Human activity decreases from the urban core to the periphery but also exhibits a polycentric pattern with sub-peak in sub-centers. The human–environment interaction shows two unattached clusters of high value that one has good accessibility and the other has few segregations and vacuums. Shanghai follows monocentric vital pattern that indicates a descending trend from urban core to the periphery. The areas centering on the old urban cores—the Bund, Nanjing Road, Huaihai Road, Renming Park, Jingan Temple, Xujiahui—show the highest vitality, whereas Pudong New Area has only three sub-districts with high vitality. High urban vitality areas in Shanghai can be mainly identified as old urban areas, the Lujiazui CBD, and residence-oriented areas. The validation that mobile phone usage density has a positive correlation with the distribution of urban vitality, indicating high accuracy of measurement.
Urban vitality in Shanghai seems to be closely related to urban planning. While European-style block planning that is featured with massive small blocks and dense outspread road networks leads to high vitality in old Shanghai area, sub-districts in Pudong New Area are vulnerable to scarce vitality induced by large block zoning plan. The city’s urban development and renewal strategies may contribute to its vitality in different areas. Although Lujiazui experiences rapid urbanization, mixed-functional development promotes the sub-district’s vitality by streamlining land configuration. Urban renewal retains multi-era buildings, communities, and blocks through a historic area reserving regulation, which heightens old urban area’s urban vitality. The large number of migrant population and its enormous housing needs also foster the potential for high vitality in the residence-oriented areas.
Author Contributions
Conceptualization, W.Y. and Y.L.; Formal analysis, Y.C. and Q.Z.
Funding
This research was funded by the Strategic Priority Research Program of Chinese Academy of Sciences, Pan-Third Pole Environment Study for a Green Silk Road (Pan-TPE) (XDA20040400); National Natural Science Foundation of China (41671533, 41771534, 41871169, 51508513); the Fundamental Research Funds for the Central Universities.
Conflicts of Interest
The authors declare no conflict of interest.
References
- Batty, M. Empty buildings, shrinking cities and ghost towns. Environ. Plan. B Plan. Des. 2016, 43, 3–6. [Google Scholar] [CrossRef] [Green Version]
- Deng, C.; Ma, J. Viewing urban decay from the sky: A multi-scale analysis of residential vacancy in a shrinking U.S. city. Landsc. Urban Plan. 2015, 141, 88–99. [Google Scholar] [CrossRef]
- Hamidi, S.; Ewing, R. A longitudinal study of changes in urban sprawl between 2000 and 2010 in the United States. Landsc. Urban Plan. 2014, 128, 72–82. [Google Scholar] [CrossRef]
- Fang, W.; Quan, T.; Lei, W. Post-Katrina population loss and uneven recovery in New Orleans, 2000–2010. Geogr. Rev. 2014, 104, 310–327. [Google Scholar]
- Jacobs, J. The Death and Life of Great American Cities; Random House: New York, NY, USA, 1961; 458p. [Google Scholar]
- Wickersham, J. Jane Jacob’s critique of zoning: From Euclid to Portland and beyond. Boston Coll. Environ. Aff. Law Rev. 2001, 28, 547–563. [Google Scholar]
- Sternberg, E. An integrative theory of urban design. J. Am. Plan. Assoc. 2000, 66, 265–278. [Google Scholar] [CrossRef]
- Grant, J. Mixed use in theory and practice: Canadian experience with implementing a planning principle. J. Am. Plan. Assoc. 2002, 68, 71–84. [Google Scholar] [CrossRef]
- Calthorpe, P. The Next American Metropolis: Ecology, Community, and the American Dream; Princeton Architectural Press: New York, NY, USA, 1993. [Google Scholar]
- Lynch, K. Good City Form; MIT Press: Cambridge, MA, USA, 1984; 514p. [Google Scholar]
- Maas, P.R. Towards a Theory of Urban Vitality; University of British Columbia: Vancouver, BC, USA, 1984. [Google Scholar]
- Montgomery, J. Making a city: Urbanity, vitality and urban design. J. Urban Des. 1998, 3, 93–116. [Google Scholar] [CrossRef]
- Sung, H.; Go, D.; Choi, C. Evidence of Jacobs’s street life in the great Seoul city: Identifying the association of physical environment with walking activity on streets. Cities 2013, 35, 164–173. [Google Scholar] [CrossRef]
- Sung, H.; Lee, S. Residential built environment and walking activity: Empirical evidence of Jane Jacobs’ urban vitality. Transp. Res. Part D: Transp. Environ. 2015, 41, 318–329. [Google Scholar] [CrossRef]
- De Nadai, M.; Staiano, J.; Larcher, R.; Sebe, N.; Quercia, D.; Lepri, B. The death and life of great Italian cities: A mobile phone data perspective. In Proceedings of the 25th International World Wide Web Conference, Montreal, QC, Canada, 11–15 April 2016. [Google Scholar]
- Jacobs-Crisioni, C.; Rietveld, P.; Koomen, E.; Tranos, E. Evaluating the impact of land-use density and mix on spatiotemporal urban activity patterns: An exploratory study using mobile phone data. Environ. Plan. A 2014, 46, 2769–2785. [Google Scholar] [CrossRef]
- Yue, Y.; Zhuang, Y.; Yeh, A.G.O.; Xie, J.; Ma, C.; Li, Q. Measurements of POI-based mixed use and their relationships with neighbourhood vibrancy. Int. J. Geogr. Inf. Sci. 2017, 31, 658–675. [Google Scholar] [CrossRef]
- Li, C.; Wang, M.; Wang, J.; Wu, W. The Geography of City Liveliness and Land Use Configurations: Evidence from Location-Based Big Data in Beijing; Spatial Economics Research Centre, LSE: London, UK, 2016. [Google Scholar]
- Long, Y.; Huang, C.C. Does block size matter? The impact of urban design on economic vitality for Chinese cities. Environ. Plan. B 2018. [Google Scholar] [CrossRef]
- Wu, C.; Ye, X.; Ren, F.; Du, Q. Check-in behaviour and spatio-temporal vibrancy: An exploratory analysis in Shenzhen, China. Cities 2018, 77, 104–116. [Google Scholar] [CrossRef]
- Ye, Y.; Li, D.; Liu, X. How block density and typology affect urban vitality: An exploratory analysis in Shenzhen, China. Urban Geogr. 2018, 39, 631–652. [Google Scholar] [CrossRef]
- Ravenscroft, N. The vitality and viability of town centres. Urban Stud. 2000, 37, 2533–2549. [Google Scholar] [CrossRef]
- Zarin, S.Z.; Niroomand, M.; Heidari, A.A. Physical and social aspects of vitality case study: Traditional street and modern street in Tehran. Procedia Soc. Behav. Sci. 2015, 170, 659–668. [Google Scholar] [CrossRef]
- Jin, X.; Long, Y.; Sun, W.; Lu, Y.; Yang, X.; Tang, J. Evaluating cities’ vitality and identifying ghost cities in China with emerging geographical data. Cities 2017, 63, 98–109. [Google Scholar] [CrossRef]
- Wu, J.; Ta, N.; Song, Y.; Lin, J.; Chai, Y. Urban form breeds neighborhood vibrancy: A case study using a GPS-based activity survey in suburban Beijing. Cities 2018, 74, 100–108. [Google Scholar] [CrossRef]
- Zeng, C.; Song, Y.; He, Q.; Shen, F. Spatially explicit assessment on urban vitality: Case studies in Chicago and Wuhan. Sustain. Cities Soc. 2018, 40, 296–306. [Google Scholar] [CrossRef]
- Zhou, S.; Dai, J.; Bu, J. City size distributions in China 1949 to 2010 and the impacts of government policies. Cities 2013, 32, S51–S57. [Google Scholar] [CrossRef]
- State Statistical Bureau. China Statistical Yearbook 2017; China Statistic Press: Beijing, China, 2017.
- Huang, Z.; He, C.; Zhu, S. Do China’s economic development zones improve land use efficiency? The effects of selection, factor accumulation and agglomeration. Landsc. Urban Plan. 2017, 162, 145–156. [Google Scholar] [CrossRef]
- Jiang, Y.P.; Mohabir, N.; Ma, R.F.; Zhu, P.Y. Sorting through neoliberal variations of ghost cities in China. Land Use Policy 2017, 69, 445–453. [Google Scholar] [CrossRef]
- Yue, W.; Liu, Y.; Fan, P. Measuring urban sprawl and its drivers in large Chinese cities: The case of Hangzhou. Land Use Policy 2013, 31, 358–370. [Google Scholar] [CrossRef]
- Marquet, O.; Miralles-Guasch, C. Neighbourhood vitality and physical activity among the elderly: The role of walkable environments on active ageing in Barcelona, Spain. Soc. Sci. Med. 2015, 135, 24–30. [Google Scholar] [CrossRef]
- Han, J.; Hayashi, Y.; Cao, X.; Imura, H. Application of an integrated system dynamics and cellular automata model for urban growth assessment: A case study of Shanghai, China. Landsc. Urban Plan. 2009, 91, 133–141. [Google Scholar] [CrossRef]
- Zhang, C.; Li, X. Urban redevelopment as multi-scalar planning and contestation: The case of Enning Road project in Guangzhou, China. Habitat Int. 2016, 56, 157–165. [Google Scholar] [CrossRef]
- King, K. Jane Jacobs and the need for aged buildings: Neighborhood historical development pace and community social relations. Urban Stud. 2013, 50, 2407–2424. [Google Scholar] [CrossRef]
- Hess, P.M.; Moudon, A.V.; Snyder, M.C.; Stanilov, K. Site design and pedestrian travel. Transp. Res. Rec. 1999, 1674, 9–19. [Google Scholar] [CrossRef]
- Song, Y.; Merlin, L.; Rodriguez, D. Comparing measures of urban land use mix. Comput. Environ. Urban 2013, 42, 1–13. [Google Scholar] [CrossRef]
- Manaugh, K.; Kreider, T. What is mixed use? Presenting an interaction method for measuring land use mix. J. Transp. Land Use 2013, 6, 63–72. [Google Scholar] [CrossRef]
- Gowharji, W.F. A Computational Tool for Evaluating Urban Vitality Using Kendall Square Development Proposals as a Case Study; Massachusetts Institute of Technology: Boston, MA, USA, 2016. [Google Scholar]
- Jiang, S.; Alves, A.; Rodrigues, F.; Ferreira, J.; Pereira, F.C. Mining point-of-interest data from social networks for urban land use classification and disaggregation. Comput. Environ. Urban Syst. 2015, 53, 36–46. [Google Scholar] [CrossRef] [Green Version]
- Sung, H.; Lee, S.; Cheon, S. Operationalizing Jane Jacobs’s urban design theory. J. Plan. Educ. Res. 2015, 35, 117–130. [Google Scholar] [CrossRef]
- Friedman, J.H.; Turkey, J.W. A projection pursuit algorithm for exploratory data analysis. IEEE Trans. Comput. 1974, 23, 881–890. [Google Scholar] [CrossRef]
- Jones, M.C.; Sibson, R. What is Projection Pursuit? J. R. Stat. Soc. 1987, 150, 1–37. [Google Scholar] [CrossRef]
- Lunecke, M.G.H.; Mora, R. The layered city: Pedestrian networks in downtown Santiago and their impact on urban vitality. J. Urban Des. 2017, 23, 336–353. [Google Scholar] [CrossRef]
- Wang, Z.; Li, L.; Li, Y. From super block to small block: Urban form transformation and its road network impacts in Chenggong, China. Mitig. Adapt. Strateg. Glob. Chang. 2014, 20, 683–699. [Google Scholar] [CrossRef]
- Panerai, P.; Castex, J.; Depaule, J.C.; Samuels, I. Urban Forms: The Death and Life of the Urban Block; Architectural Press: Oxford, UK, 2004. [Google Scholar]
- Yang, W.; Guo, D.; Lu, P.; Huo, Y. Shanghai Gonglushi; China communication Press: Beijing, China, 1989. [Google Scholar]
- Zhang, S.; Ding, L. Historical analysis on public transportation development in Shanghai consession. City Plan. Rev. 2013, 38, 50–56. (In Chinese) [Google Scholar]
- Wu, V. The Pudong Development Zone and China’s economic reforms. Plan. Perspect. 1998, 13, 133–165. [Google Scholar] [CrossRef]
- Gaubatz, P. China’s urban transformation: Patterns and processes of morphological change in Beijing, Shanghai and Guangzhou. Urban Stud. 1999, 36, 1495–1521. [Google Scholar] [CrossRef]
- Liao, B.; Wong, D.W. Changing urban residential patterns of Chinese migrants: Shanghai, 2000–2010. Urban Geogr. 2014, 36, 109–126. [Google Scholar] [CrossRef]
Figure 1.
Conceptual framework for urban vitality measurement.

Figure 2.
Location of Shanghai.

Figure 3.
Urban vitality measurement in Shanghai. (a) Result of built environment; (b) Result of human activities; (c) Result of human-environment interaction; (d) Result of urban vitality.
Figure 3.
Urban vitality measurement in Shanghai. (a) Result of built environment; (b) Result of human activities; (c) Result of human-environment interaction; (d) Result of urban vitality.

Figure 4.
Three-dimensional diagram of ranking urban vitality.

Figure 5.
Spatial distribution of phone usage density. (a) Phone usage density on May 5th; (b) Phone usage density on May 7th.
Figure 5.
Spatial distribution of phone usage density. (a) Phone usage density on May 5th; (b) Phone usage density on May 7th.

Figure 6.
Scatterplots of the phone usage and urban vitality for sub-districts of Shanghai. (a) Scatterplot of urban vitality with mobile phone usage on May 5th; (b) Scatterplot of urban vitality with mobile phone usage on May 7th.
Figure 6.
Scatterplots of the phone usage and urban vitality for sub-districts of Shanghai. (a) Scatterplot of urban vitality with mobile phone usage on May 5th; (b) Scatterplot of urban vitality with mobile phone usage on May 7th.

Figure 7.
European-style block planning and zoning plan in Shanghai. (a) Block layout around the Nanjing road; (b) Industry zones in Waigaoqiao Free Trade Zone; (c) Regular block form in Puxinglu sub-district.
Figure 7.
European-style block planning and zoning plan in Shanghai. (a) Block layout around the Nanjing road; (b) Industry zones in Waigaoqiao Free Trade Zone; (c) Regular block form in Puxinglu sub-district.


Table 1.
Selected indicators for measuring urban vitality.
| Indicator | Definition | Methods | Data Sources |
|---|---|---|---|
| Built environment | |||
| Aged building | Number of aged buildings in a sub-district | Overlay analysis | (a)(f) |
| Block size | Mean area of blocks in a sub-district | Total block area/Block number | (b)(c) |
| Road length | Mean road length between two road junctions | Topology method | (c) |
| Road junction | Number of all four-way intersections | Topology method | (c) |
| Land structure mix | Entropy index of land use type | Entropy index | (b) |
| Balanced use | Balancing index for primary use and secondary use | Balancing index [41] | (b) |
| Land spatial interaction | Total contiguous edge length of different land type in a sub-district in km/km2 | Land interaction method [38] | (b) |
| Human activities | |||
| Population density | Population density of each sub-district | Total Population/Sub-district area | (d)(f) |
| Labor force | Number of labor force (14–65 years old) | Labor force/Total population | (d) |
| Residential area ratio | The residential area ratio of a sub-district | Spatial extraction | (b) |
| POI density | Point density of POI in a sub-district | Total POIs/Total population | (e) |
| Mixture of POI | Entropy index of 14 categories for POI mix | Entropy index | (e) |
| Human–environment interaction | |||
| Road network | Total length of roads in a sub-district in km/km2 | Road network/sub-district area | (c) (f) |
| Subway station | Point density of subway stations in a sub-district | Total subway stations/sub-district area | (e)(f) |
| Bus stop | Point density of bus stops in a sub-district | Total bus stops/sub-district area | (e)(f) |
| Road vacuum | Area percentage of railway, expressway in a 50 m and 30 m buffer, respectively | Spatial extraction and buffer analysis | (c)(f) |
| Viaduct segregation | Area percentage of viaducts or overpasses in a 20 m buffer | Buffer analysis and spatial extraction | (c)(f) |
| River vacuum | Area percentage of main stream in a 20 m buffer | Buffer analysis and spatial extraction | (b)(f) |
Data sources: (a) Nearly 2000 aged buildings from the conservation list of historic building; (b) Land use planning map from the Shanghai Planning and Land Resource Bureau; (c) Road maps from online map; (d) China’s sixth national census data; (e) POI data; (f) Administrative map.
Table 2.
Urban functional development in Lujiazui.
| Phase | Urban Developmental Context | Functional Features |
|---|---|---|
| Before 1990 | No systematic functional planning | Lujiazui was occupied by low-rise residence and manufacturing enterprises |
| 1990–2015 | Urbanization is a priority; Shanghai established Pudong New Area and took finance sector as the priority for Lujiazui | Office building grew at a fast speed; Infrastructure development highlighted high-quality environment, designating massive leisure spaces; Lujiazui can be classified into business district, leisure space, trading area, and river-view residence community |
| (2000–2010) | Economic growth facilitated booming housing market and commercial facilities construction; housing system reform finished | Massive high-end communities and Lujiazui trading area clustered along the Huangpu river, and Century Avenue, respectively |
| 2015–present | Lujiazui aims to build a global hub for economic, finance, and trade | Functional equilibrium is emphasized |
© 2019 by the authors. Licensee MDPI, Basel, Switzerland. This article is an open access article distributed under the terms and conditions of the Creative Commons Attribution (CC BY) license (http://creativecommons.org/licenses/by/4.0/).
Share and Cite
MDPI and ACS Style
Yue, W.; Chen, Y.; Zhang, Q.; Liu, Y. Spatial Explicit Assessment of Urban Vitality Using Multi-Source Data: A Case of Shanghai, China. Sustainability 2019, 11, 638. https://0-doi-org.brum.beds.ac.uk/10.3390/su11030638
AMA Style
Yue W, Chen Y, Zhang Q, Liu Y. Spatial Explicit Assessment of Urban Vitality Using Multi-Source Data: A Case of Shanghai, China. Sustainability. 2019; 11(3):638. https://0-doi-org.brum.beds.ac.uk/10.3390/su11030638
Chicago/Turabian StyleYue, Wenze, Yang Chen, Qun Zhang, and Yong Liu. 2019. "Spatial Explicit Assessment of Urban Vitality Using Multi-Source Data: A Case of Shanghai, China" Sustainability 11, no. 3: 638. https://0-doi-org.brum.beds.ac.uk/10.3390/su11030638
Note that from the first issue of 2016, this journal uses article numbers instead of page numbers. See further details here.