How to Allocate Carbon Emission Permits Among China’s Industrial Sectors Under the Constraint of Carbon Intensity?

Department of Economics and Management, North China Electric Power University, Baoding 071003, China
*
Author to whom correspondence should be addressed.
Sustainability 2019, 11(3), 914; https://0-doi-org.brum.beds.ac.uk/10.3390/su11030914
Submission received: 11 January 2019
/
Revised: 3 February 2019
/
Accepted: 7 February 2019
/
Published: 11 February 2019
(This article belongs to the Collection Advanced Methodologies for Sustainability Assessment: Theory and Practice)
Abstract
:With the official launch of China’s national unified carbon trading system (ETS) in 2017, it has played an increasingly important role in controlling the growth of carbon dioxide emissions. One of the core issues in carbon trading is the allocation of initial carbon emissions permits. Since the industry emits the largest amount of carbon dioxide in China, a study on the allocation of carbon emission permits among China’s industrial sectors is necessary to promote industry carbon abatement efficiency. In this study, industrial carbon emissions permits are allocated to 37 sub-sectors of China to reach the emission reduction target of 2030 considering the carbon marginal abatement cost, carbon abatement responsibility, carbon abatement potential, and carbon abatement capacity. A hybrid approach that integrates data envelop analysis (DEA), the analytic hierarchy process (AHP), and principal component analysis (PCA) is proposed to allocate carbon emission permits. The results of this study are as follows: First, under the constraint of carbon intensity, the carbon emission permits of the total industry in 2030 will be 8792 Mt with an average growth rate of 3.27%, which is 1.57 times higher than that in 2016. Second, the results of the carbon marginal abatement costs show that light industrial sectors and high-tech industrial sectors have a higher abatement cost, while energy-intensive heavy chemical industries have a lower abatement cost. Third, based on the allocation results, there are six industrial sub-sectors that have obtained major carbon emission permits, including the smelting and pressing of ferrous metals (S24), manufacturing of raw chemical materials and chemical products (S18), manufacturing of non-metallic mineral products (S23), smelting and pressing of non-ferrous metals (S25), production and supply of electric power and heat power (S35), and the processing of petroleum, coking, and processing of nuclear fuel (S19), accounting for 69.23% of the total carbon emissions permits. Furthermore, the study also classifies 37 industrial sectors to explore the emission reduction paths, and proposes corresponding policy recommendations for different categories.
1. Introduction
The greenhouse effect refers to the phenomenon in which greenhouse gases, such as carbon dioxide and methane effectively absorb the same gases on the Earth’s surface and atmosphere, and infrared radiation is emitted by clouds. A certain degree of the greenhouse effect is beneficial to the survival and development of human society, keeping the average temperature of the Earth’s surface at a temperature suitable for human life [1]. However, due to the excessive combustion of fossil energies, the emission of large amounts of carbon dioxide has aggravated the greenhouse effect, which has brought enormous challenges to human society, such as rising sea levels, the increase of pests and diseases, and land desertification [2]. To alleviate the harm caused by the greenhouse effect, the international community has made greater efforts. In December 2015, the 21st United Nations Climate Change Conference was officially held in Paris, France, at which the Paris Agreement was adopted, which set out the specific goal of "controlling the rise of global average temperature within 2 °C compared with pre-industrial levels and controlling temperature rise by 1.5 °C [3]. As the world’s largest emitter of carbon dioxide, China will inevitably assume more and more responsibility for reducing emissions. In 2016, China submitted the approval document for the Paris Climate Change Agreement to the United Nations, promising to reach the carbon dioxide emissions peak in 2030 [4] and to diminish carbon intensity by 60%–65% in 2030 [5].
In order to deliver the above carbon reduction promise, the Chinese government has attempted to adopt a series of measures with the purpose of abating carbon emissions. The most prominent accomplishment is the construction of the carbon trading market [6]. Since 2013, China has launched regional pilot carbon trading markets in Shenzhen, Guangdong, Hubei, Chongqing, Beijing, Shanghai, and Tianjin [7]. After three years of piloting, a national carbon emissions trading system was officially initiated on December 19, 2017. It is expected to become the largest carbon trading market in the world. The initial allocation of carbon emission permits is considered a crucial part for the establishment of a carbon trading market, significantly affecting carbon trading costs and the emission reduction efficiency [8]. Furthermore, the industrial sector, consuming more than 70% of the nation’s energy, is the focus of energy savings and emission reductions [9]. To develop the carbon trading market and improve industrial emission reduction efficiency, it is necessary to explore how to properly allocate carbon emission permits in the industrial sectors.
Much research exists on the issue of the distribution of carbon emission quotas from different perspectives. At the national level, Wei et al. allocated emission reductions to 137 countries on the premise of "common but differentiated responsibilities" and guaranteed the economic growth of each country [10]. Chiu et al. distributed carbon emission quotas to 24 European Union Member States [11]. There are also many scholars who have studied the carbon emission permits between provinces. Qin et al. used multi-standard decision analysis methods and the setting of different scenarios to study the distribution of carbon emission rights in the eastern coastal areas of China [12]. Yi et al. and Jiang et al. studied the distribution of carbon emission rights among provinces [13,14]. In recent years, the allocation of carbon permits among industrial sectors has begun to attract people’s attention. Yang et al. adopted an entropy approach to allocate China’s carbon emission permits to 39 industrial sectors in 2020 [15]. Zhao et al. used a combination of input-output and the information entropy approach to allocate carbon emission permits among 41 sectors of China [16].
The allocation principles play a crucial role in the distribution of carbon emission permits. Fairness and efficiency are recognized as the most important principles. The principle of fairness is usually associated with the notion of allocation justice [17]. It is divided into different categories depending on the objects concerned. Egalitarianism implies that people living in every region and country have the right to equal carbon emissions [18]. Sovereignty means all countries have equal right to pollute and to be protected from pollution, advocating distribution permits according to historical emissions [19]. Historical responsibility refers to the distribution of carbon permits based on the state’s responsibility for rising temperatures [20]. The ability to pay indicates carbon emission permits are supposed to be distributed inversely according to a country’s gross domestic product (GDP) considering the abatement costs [21]. Apart from these, polluter-pays equity, vertical equity, and horizontal equity represent the fairness of different perspectives, respectively. The principle of efficiency is mainly related to the economic efficiency of carbon abatement; that is, to maximize returns with the minimum investment. An et al. adopted a new data envelopment analysis (DEA) model to allocate carbon permits in China at a minimum cost [22]. Miao et al. distributed carbon permits among China’s different provinces depending on a non-radial zero sums gains DEA model [23]. In recent years, an increasing amount of literature has studied the allocation of carbon rights by combining fairness and efficiency. Qin et al. applied efficiency and equity to examining permits’ allocation in China’s east coastal areas based on a multi-criteria decision analysis model. Zhang et al. established a comprehensive index based on efficiency and fairness of the distribution of carbon emission permits among the 39 industrial sectors of China [24].
In terms of research methods, the most common method for carbon emission permits’ allocation is the indicator method, including single indicator and multi-indicator methods. The multi-indicator method, integrating different allocation criteria, can more fully and rationally allocate emission permits, and has attracted increasing attention. For this method, the weights of different indicators play a crucial role, which represents the relative importance of indicators. Currently, the method of determining the index weight can be generally divided into three types: The subjective weight approach, objective weight approach, and combined weight approach. The subjective weight approach determines the weights based on the personal knowledge and preference of experts, which may be arbitrary, thus fewer studies have adopt the subjective weight method alone. Objective weight methods, depending on data characteristics (i.e., the degree of discrimination) instead of subjective preference, have been widely applied in the study of the allocation of carbon emissions permits. Yang et al., Zhao et al., Liu et al., and Li et al. used the entropy method to balance the indicator weights [15,16,25,26]. Li et al. adopted the maximum deviation method to calculate the weights of different indicators [27]. Wang et al. allocated carbon emission permits among the provinces of China using the improved technique for order preference by similarity to an ideal solution (TOPSIS) method [28]. However, it does not consider the relative importance of different indicators to carbon emission permits; that is, it is unfavorable for those indicators with low discrimination, but high importance. Some scholars have noticed this flaw and thus, have adopted a combined weight approach. For example, Han et al. and Feng et al. combined the AHP with the information entropy approach to overcome this problem [29,30].
The second most commonly used allocation method is the optimization method. Data envelopment analysis (DEA) is one of the typical optimization methods, which is very popular when studying the allocation of carbon emission permits. Pang et al. and Zhang et al. hired the ZSG-DEA model to allocate carbon allowances among countries [24,31]. Similarly, Zeng et al. distributed carbon emission permits using a ZSG-DEA model at the level of regions [32]. Xiong et al. built a weighted ZSG-DEA model to allocate the energy consumption quota among the provinces of China [33]. Besides, the hybrid method, when incorporated with different approaches, is capable of reflecting various concepts and principles for permits’ distribution. A hybrid method by Yu et al. combined the Shapley decomposition with a fuzzy c-means clustering algorithm to allocate regional carbon abatement responsibilities of China [34]. Taking regional cooperation into account, Zhang et al. proposed a hybrid method coupled Shapley approach with the gravity model and entropy approach [8].
In summary, the previous literature offers an important basis for this article, but there is still room for improvement. According to the above, in view of the research field, most research on carbon emission permits’ allocation has focused on national and regional research, and less on the distribution among industrial sectors. However, only by combining regions and industrial sectors can carbon emission reduction targets be achieved effectively thus the study of the allocation of carbon emission permits among industrial sectors is necessary. Secondly, from the perspective of allocation criteria, there is few existing literature that considers the abatement cost, which is the most concerning issue for policymakers. Therefore, this paper employs the DEA model to calculate the carbon marginal abatement cost of 37 industrial sectors, and uses it as a distribution criterion, together with the other three criteria of carbon emission responsibility, potential, and capacity, to constitute the allocation system of industrial carbon emission permits. Third, from the research method, this paper uses a hybrid model to combine multi-indicator allocation methods and DEA models to explore a reasonable and effective allocation scheme for carbon permits. In addition, in determining the multi-criteria weights, this paper considers subjective and objective methods, integrating the analytic hierarchy process (AHP) and principal component analysis (PCA) method. Fifth, in the sectoral carbon emissions’ estimation, this paper considers both indirect carbon emissions from thermal power and the heating supply and direct carbon emissions from fossil fuel consumption, which more accurately estimate the actual carbon emissions of each sub-sector.
2. Materials and Methods
2.1. Research Framework
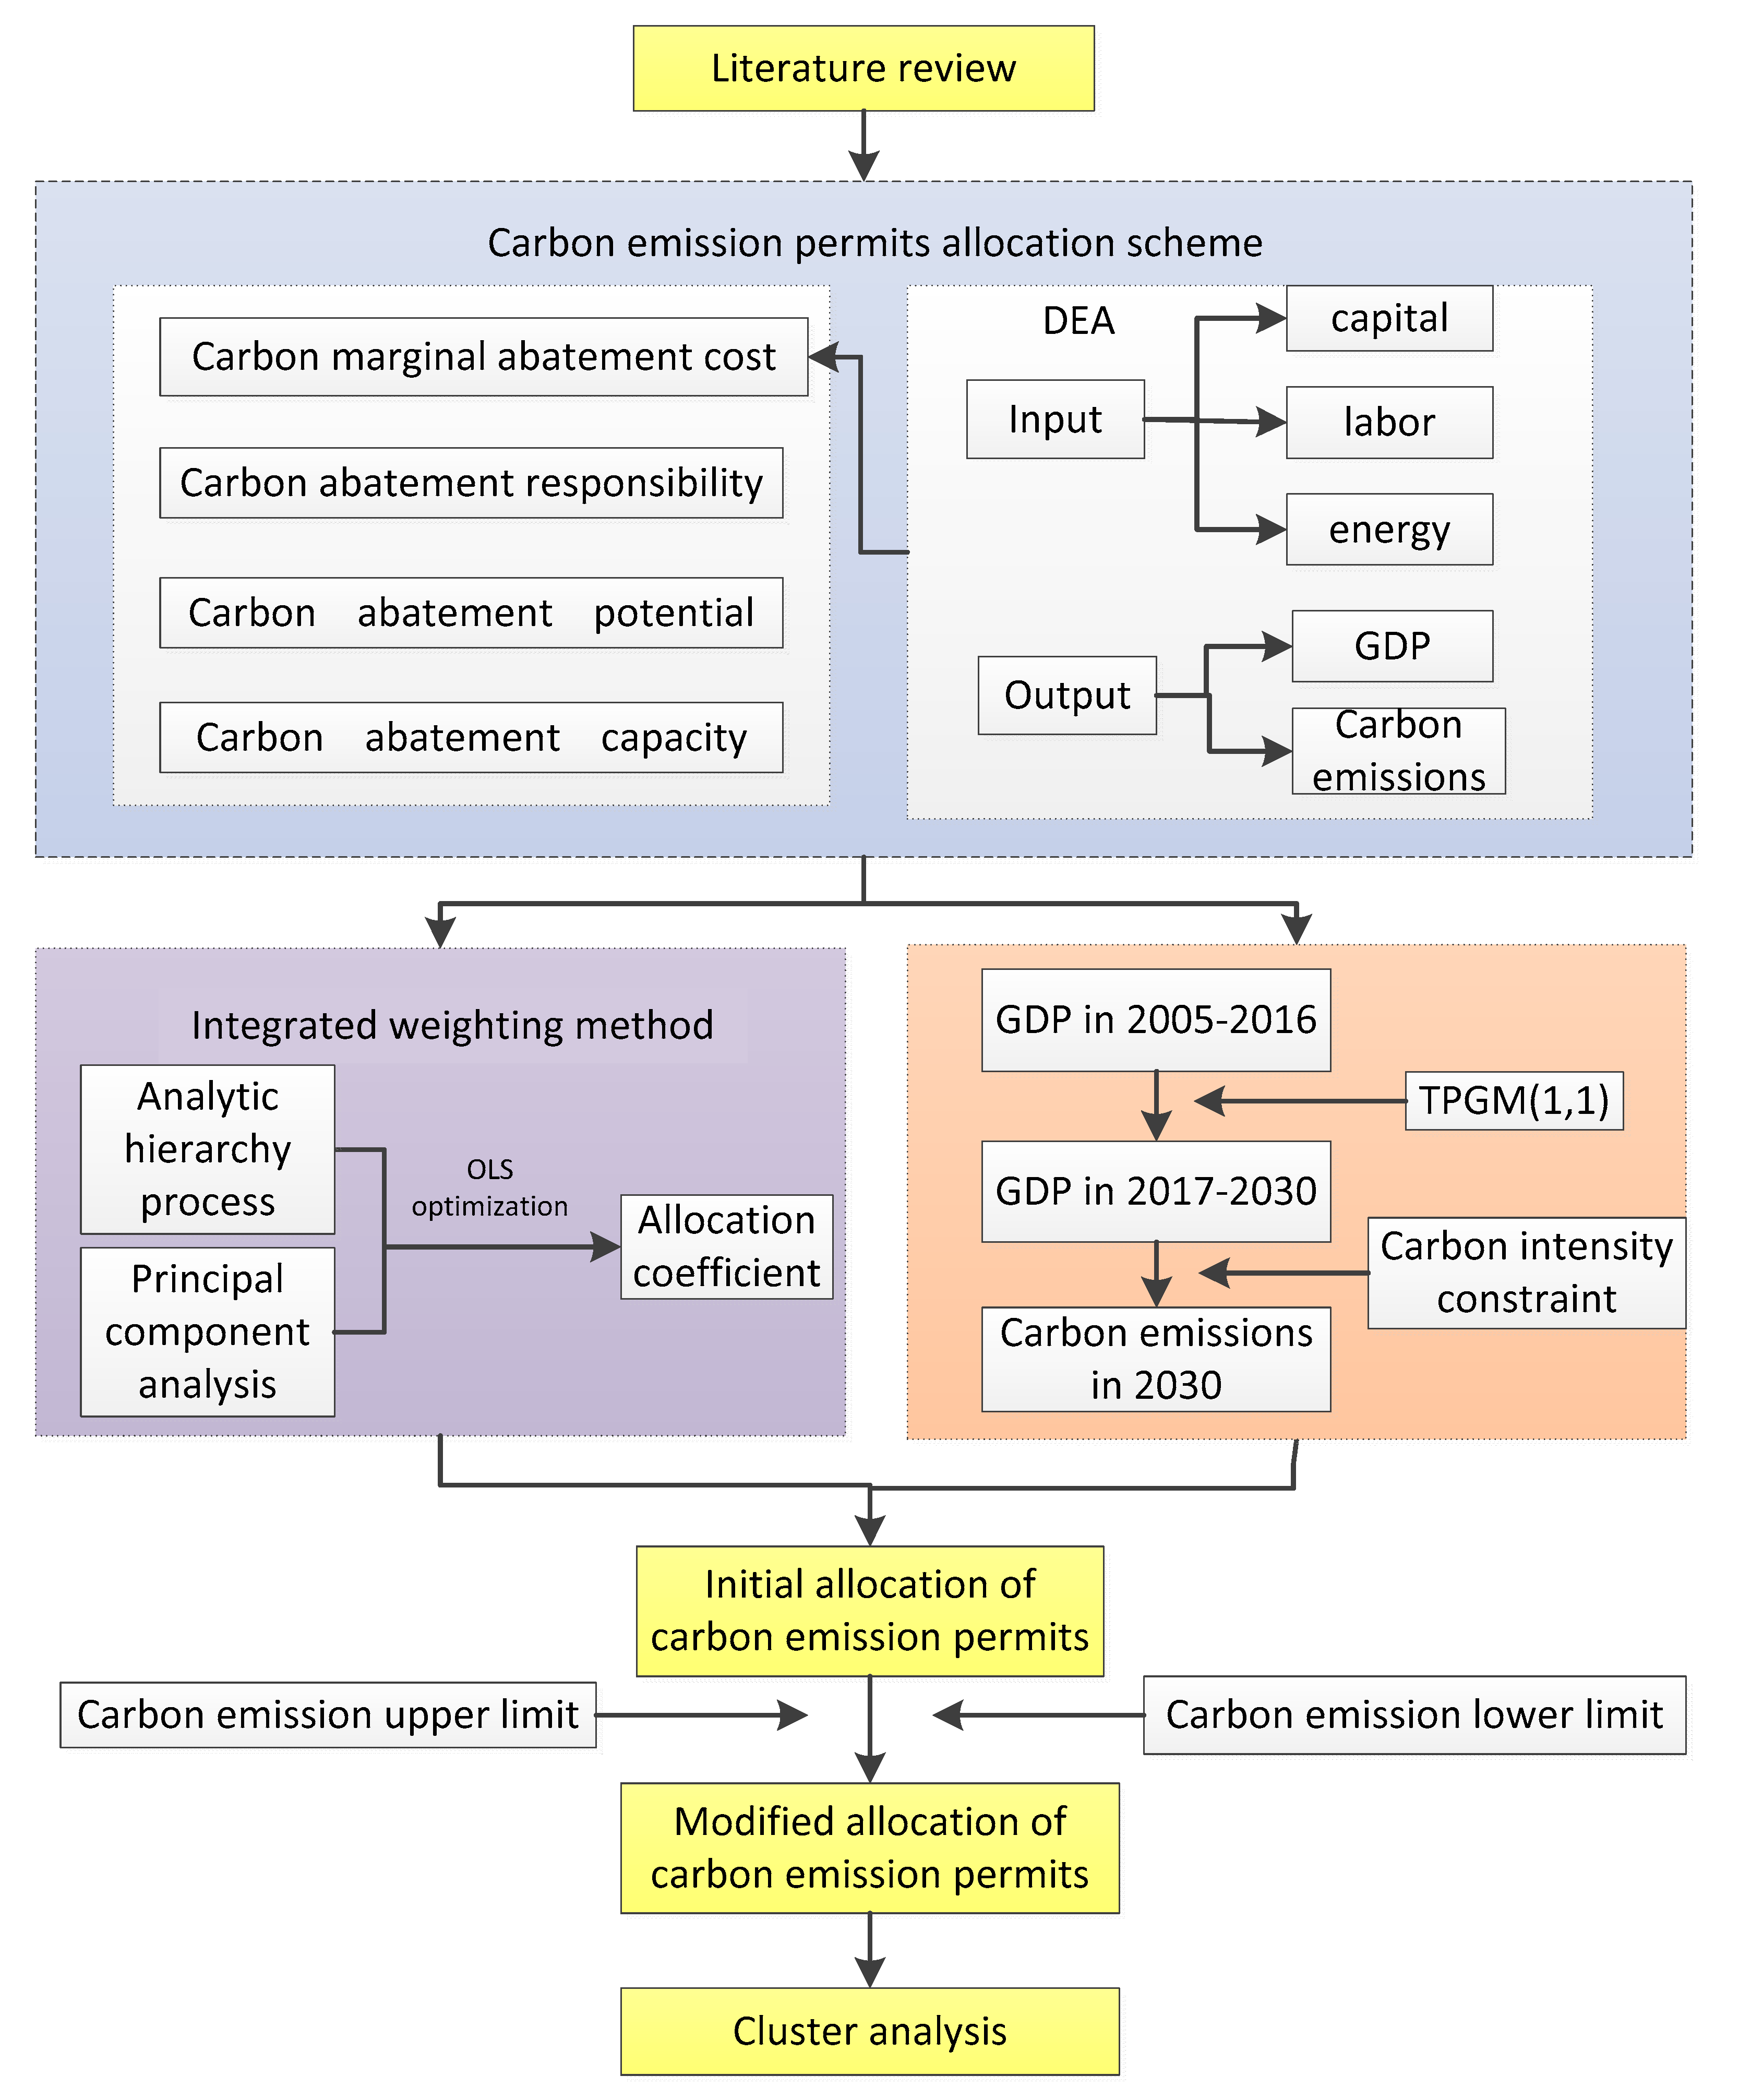
Figure 1 displays the research process for this article. First, this study proposes an industrial carbon emission permits allocation scheme based on previous research. The specific sub-sectors are listed in Table 1. Then, the carbon marginal abatement costs of each industrial sector are calculated using the DEA model. Next, the improved grey prediction model TPGM (1,1) is employed to predict the industrial GDP from 2017 to 2030 to obtain the total carbon emission permits in the industry. Fourth, the allocation weights are determined according to the integrated weight method proposed in this paper. Thus, the initial carbon emission permits can be obtained. Additionally, carbon emission permits are adjusted according to the upper and lower limits of each sector calculated by the carbon intensity reduction target. Finally, to explore the industrial emission reduction path, this paper clusters 37 sub-sectors and proposes specific policy recommendations for each category.
2.2. New Scheme for Carbon Emission Permits Allocation
To ensure economic growth, China must achieve carbon emission reduction targets with as little economic cost as possible. Therefore, this study firstly defined the carbon marginal abatement cost imitated by data envelopment analysis (DEA) as a criterion of carbon permits allocation, connected with the other three criteria, including carbon abatement responsibility, potential, and ability. Table 2 shows the specific indicators and their meanings in the new allocation scheme.
2.3. Three-Parameter Grey Prediction Model for Carbon Emissions
To allocate the carbon emission permits among industrial sectors, the total carbon emissions in the industry (represented as ICE) of China should first be predicted. To integrate with the national carbon reduction targets that the carbon intensity will fall by 60–65% compared with 2005 levels, carbon emissions can be estimated by multiplying the industrial value added (GDP) and carbon intensity (I) based on Equation (1). So, the GDP of the total industry in 2030 is required to be predicted. The grey model (GMs), proposed by Professor Deng (1982), is widely applied in a small sample forecasting model for annual socio-economic indicators. However, the traditional model GM (1,1) is only applicable to sequences with near homogeneous exponential growth characteristics, which greatly limits the use of the grey model. To predict industrial GDP more accurately, this paper uses a three-parameter grey prediction model (TPGM (1,1)), proposed by Zhan liqing et al. [35], which can realize unbiased simulation of both homogeneous and non-homogeneous exponential series.
The TPGM (1,1) employs the accumulated generating operation to gain an exponentially increasing sequence.
where is original sequence, is calculated by applying the equation, . The model of TPGM (1,1) is expressed as:
where a, b, and c stand for the parameters of TPGM (1,1); is the sequence of the mean generation of consecutive neighbors from ,.
The whitenization differential equation (also called the grey reflection equation) can be obtained according to Equation (2).
A least squares estimation can be applied to calculate the estimated values of , , and :
where:
Through the solving of the whitenization equation, the time response function can be acquired:
The restored response function is gained by Equations (6) and (7):
2.4. Direction Distance Function (DDF)
In the input-output analysis, including the undesired output of emissions, the directional distance function (DDF) method proves more reasonable than the traditional method in dealing with carbon emission variables. Not only does the DDF method try to reduce the inputs and undesirable output, and raise the desirable outputs at the same time, but it can also effectively identify the negative externalities of carbon emissions [36]. Therefore, the DDF method is used by more and more researchers to measure the carbon emission efficiency and marginal abatement costs.
In this model, the fixed assets, industrial energy consumption, and industrial labor act as model inputs, with carbon emissions as the undesirable output, and industrial output as the desirable output. Then, the model was constructed as follows:
where stands for a weighting coefficient for the intensity vector; represents the effective distance from the current decision-making unit to the low-carbon production frontier; and refers to three input vectors, including the fixed asset investment, energy consumption, and labor number. and represent desirable output and undesirable output, respectively. The directional vector points out the direction and relative preference to change the inputs and outputs. Referring to Zhou et al. [37], the study introduced the direction vector, , the purpose of which is to decrease the undesirable outputs and to increase the desirable outputs while the input remains unchanged.
According to the relationship between the DDF optimization model and the profit function, the carbon marginal abatement cost of the undesired output can be derived:
where is the price vector of the expected output, undesired output; respectively correspond to the Lagrangian multiplier vector of the expected output and the undesired output constraint, which can be obtained by the dual programming of the DDF optimization model.
2.5. Integrated Weight Method
The integrated weight approach, combining the subjective and objective weight approaches, has been applied more and more widely because it not only avoids subjective randomness, but also can obtain satisfactory results. In this paper, we distributed the carbon emission quota using the combined weight method, combining the analytic hierarchy process (AHP) method with the principal components analysis (PCA) method.
Step 1. Data preparation.
The specific data required is shown in Table 2.
Step 2. Calculate the weights of the indicator by the PCA method.
Principal components analysis (PCA) is a dimensionality reduction method that finds out the most important aspects of the data to replace the original data. It is widely applied in areas, such as data compression, to eliminate redundancy and data noise cancellation.
- Non-dimensionalization of actual values using standardized methods based on Equation (10), and then calculate the covariance matrix of dimensionless data:
- Calculate the covariance matrix of matrix Y, and calculate the eigenvalues and eigenvectors of the covariance matrix. Each eigenvalue, , corresponds to one eigenvector, .
- The eigenvalues are sorted in descending order, and the top of them are selected, which should meet the conditions shown as Equation (11). Additionally, the corresponding eigenvectors are respectively used as column vectors to form the eigenvector matrix, V.
- Calculate the weight of the indicator .
Step 3. Calculate the weight of the indicator by the AHP method.
The main idea of the AHP method is to quantify the qualitative problem by standardizing the decision-maker’s judgment of the problem, as proposed by Saaty in the mid-1970s [38]. AHP includes a single-layer model and multi-layer model. Since there are only four indicators in the study, the single-layer model is adopted.
The specific process is as follows:
- (1)
- Construct judgement matrix B.
Each criterion has different degrees of importance to the target measurement. Therefore, Saaty et al. [34] proposed the method of establishing a contrast matrix by comparing two factors. is generally used to stand for the relative importance between factor i and factor j.
- (2)
- Calculate the relative weight of each indicator.
The indicator weights can be acquired by solving Equation (13):
where w represents the weight vector, B stands for the judgment matrix, and denotes the largest eigenvalue.
- (3)
- Consistency test.
To assure the reasonableness of the comparison matrix (thus avoiding inconsistent situations, such as and ), it is essential to examine the consistency of the comparison matrix.
Specific methods can be found by referring to Feng et al. [30].
Step 4. Calculate the comprehensive weight.
To balance subjective preferences and the objective authenticity of decision-making, and to achieve subjective and objective unity, the deviation of the judgment results of the subjective and objective weights should be as small as possible. Therefore, a least squares decision model is established according to Wang et al. [39].
where represents the normalized raw data; refers to the indicator weight obtained by the PCA method, and stands for the index weight obtained by the AHP method; denotes the combined weight of each indicator.
2.6. Allocation of the 2030 Intensity Reduction Target
The Chinese government has promised that China will take measures to reduce the carbon intensity by 60–65% compared with the 2005 levels. The industrial sector assumes greater responsibility as the main source of carbon emissions in China, thus the industrial carbon intensity is supposed to be 65% lower than that of 2005. Then, the carbon emission permits and emission reduction for 37 industrial sectors are estimated by applying the following equation:
where denotes industrial added value in year t, converted to the constant price in 2005; represents the industrial carbon emissions in year t; is the carbon intensity in year t. represents the emission permits’ increment of sub-sector i in 2016–2030. stands for the carbon emission permits of the total industry in 2030 under the constraints of the carbon intensity target; is the actual carbon emissions of the total industry in 2016; means the allocation weight from the integrated weight approach. refers to the carbon emissions from sub-sector i in 2030 under the constraints of the carbon intensity target; denotes the actual carbon emissions from sub-sectors i in 2016.
The carbon emissions from the sub-sector in 2030 in the case of constant carbon intensity can be calculated by using Equations (20) and (21).
where represents the emissions from each sub-sector with constant carbon intensity; stands for the carbon emissions for the total industry in 2030 with constant carbon intensity; means the actual carbon emissions for the total industry in 2016; refers to the average historical emission share of 37 sub-sectors in 2012–2016.
Then, the emission reductions, , for each sub-sector can be estimated by Equation (21):
2.7. Data
Industrial carbon emissions (CE) can be divided into two parts, comprising direct emissions from fossil fuel burning and indirect emissions from electricity consumption [36]. Therefore, industrial carbon emissions can be expressed as Equation (22):
expresses the direct carbon emissions and represents the indirect carbon emissions.
This paper selected 16 fossil energy sources to calculate , including coal, clean coal, other coal washing, coke, other gas, coke oven gas, other coking products, crude oil, kerosene, gasoline, diesel, liquefied petroleum gas, fuel oil, other petroleum products, refinery gas, and natural gas. Carbon emission coefficients of different energy sources were calculated using Equation (23) according to the 2006 IPCC Guidelines for National Greenhouse Gas Inventories (see Table 3):
where i represents the different types of fossil energy, E denotes the fossil energy consumption, CV is the average low calorific value, CR expresses the carbon oxidation rate, CF refers to the carbon content of the unit calorific value, and P indicates the conversion coefficient of carbon dioxide and carbon.
The indirect carbon emission is equal to the electric power consumption multiplied by the electric emission coefficient. This paper chooses 0.7173 tce/t as the power carbon emission coefficient according to Wang et al. [40].
Data on the quantity of labor and energy consumption of sub-sectors are derived from the China Statistical Yearbook (CSY) (2005–2017). The added value of the industrial sub-sector (2005–2007) comes from the CSY (2006–2008). However, the CSY no longer announces the added value of sub-sectors after 2008. This paper estimates the added value of sub-sectors in 2008–2016 according to the annual growth rate of the added value announced by the National Bureau of Statistics.
3. Results
3.1. The Estimated Results of Carbon Emissions in the Industry
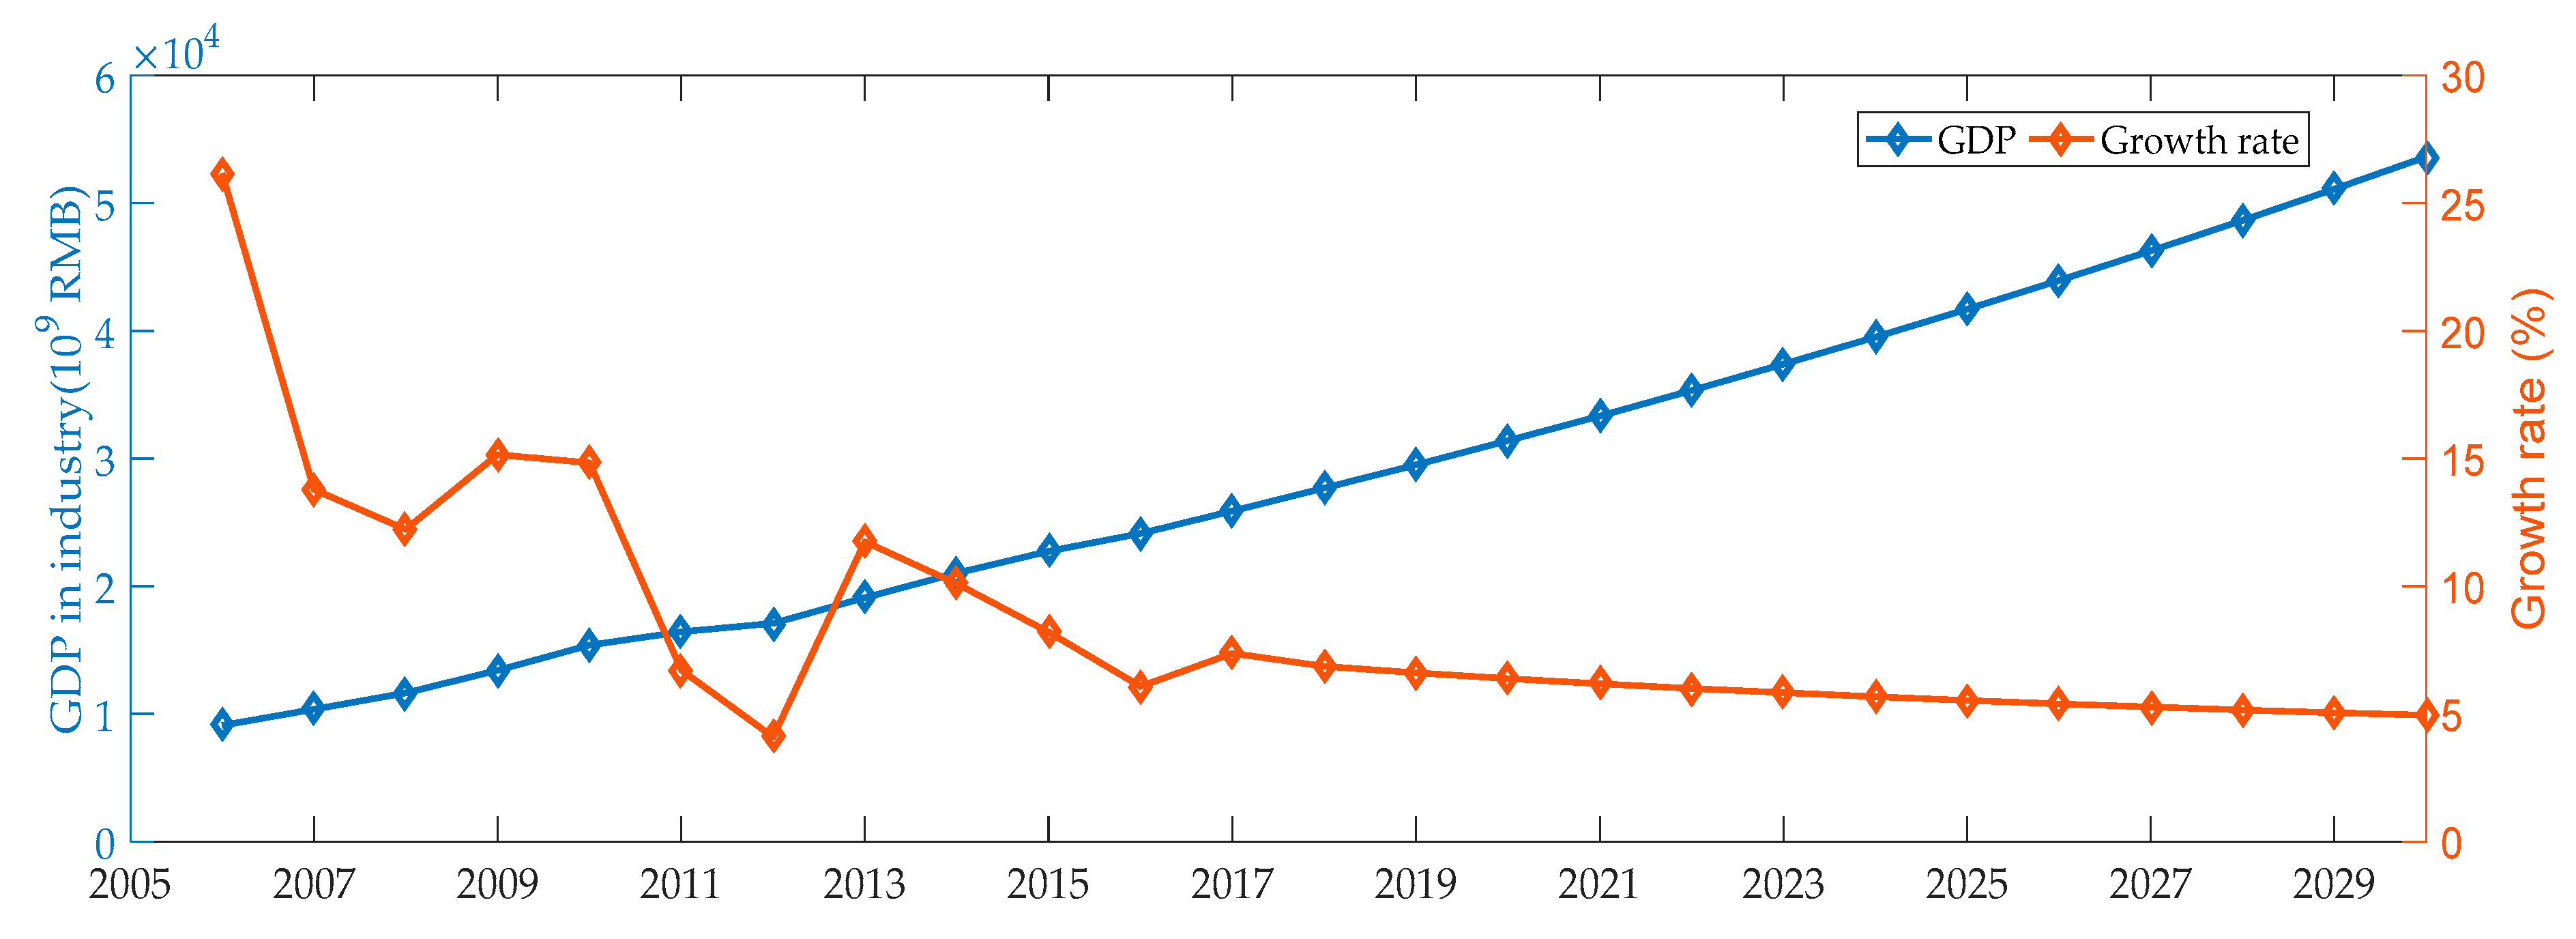
The three-parameter grey model (TPGM (1,1)) is implemented in this section to predict the values of GDP. Table 4 displays the history value, fitting value, error, and relative error. It can be found from the results that the TPGM (1,1) has a good fitting effect with an average relative error of 2.24%, thus this model can be used to predict future industrial GDP. The forecast results of industrial GDP in 2017–2030 are shown in Figure 2. As can be seen, the industrial added value will increase to 53,629 billion yuan (2005 price) in 2030, with a declining growth rate. It can be attributed to China’s entry into the later stage of industrialization in which the industrial structure will continue to escalate, and the situation of GDP growth driven by industrial development has gradually changed.
It is necessary for the industry of China to undertake major emission reduction responsibilities since it is the main source of carbon emissions. Considering China’s commitment to reducing carbon intensity by 60%–65% and the high abatement responsibility of the industry, this paper sets the carbon intensity reduction target for the industrial sector to 65%. Using Equation (1), the total industrial carbon emission permits will be 8792 Mt in 2030, and the carbon emission increment permits of 2017–2030 will be 3178 Mt.
3.2. Carbon Marginal Abatement Cost based on the DEA Model
Marginal emission reduction costs can be used to measure the performance of different industrial sectors from a cost perspective, which reflects the size of the economic costs that different sectors of industry must pay for emission reductions under the current input and low-carbon production technology conditions. Figure 3 displays the marginal cost of the emission reduction of China’s industry in 2012–2016.
From the results, the average marginal abatement cost of China’s industry was 14,300 RMB/ton of carbon in 2012–2016. There are 19 sectors with marginal abatement costs of more than 30,000 RMB, which are basically light industries and high-tech industries, such as the manufacturing of foods, manufacturing of tobacco, manufacturing of computers, communication, and other electronic equipment, manufacturing of textile, wearing apparel, and accessories, etc. The sector with the highest marginal abatement costs is the manufacturing of tobacco, with marginal abatement costs of 147,814 RMB/ton. Some sectors have lower marginal abatement costs of less than 10,000 RMB, including the smelting and pressing of ferrous metals and production of raw chemical materials and chemical products, supply of electric power and heat power, and the manufacturing of non-metallic mineral products, which are energy-intensive heavy chemical industries with a low energy efficiency and waste of resources. From the perspective of vertical time variation, the marginal abatement costs of most sectors are slowly increasing with the advancement of low-carbon production technologies. Only the marginal abatement costs of the nine sectors, including the extraction of petroleum and natural gas, smelting and the pressing of ferrous metals, mining, and processing of ferrous metal ores, have declined, indicating that there is a certain waste of resources in these industries.
3.3. Integrated Allocation Weight
Based on the introduction of Section 2.5, to obtain the subjective indicator weights using the AHP method, a judgement matrix is required by comparing the relative importance of any two indicators. The four indicators of carbon margin abatement costs, historical carbon emission, carbon intensity, and GDP were selected as the basis for allocating permits, expressed as and , respectively. First, to ensure the normal production of industrial sectors, there is no doubt that historical emissions are the most important basis for distribution. Second, China is a developing country in the industrialization stage when economic growth is the main task of the country. Therefore, the economic cost of emission reduction is chosen as the second important criterion. Third, if an industrial sector does not have the potential or space to reduce carbon emissions, it does not make sense even if it has a high-ability. However, if a sector has potential, but no capacity, the government can adopt subsidies and other policies to promote carbon emission reduction. So, carbon intensity is considered as being more important than GDP for the allocation of carbon emission permits. Therefore, the relative importance of the four criteria are set as: Then, the comparison matrix was established as shown in Table 5.
Using Equation (13) and the judgement matrix, the weights of four indicators were calculated and are shown as Table 6. Carbon emission reduction responsibility gets the largest weight (0.5579) while emission reduction ability takes the smallest weight (0.0569), suggesting that historical emissions occupy the most important place in the allocation of industrial carbon emission permits derived using AHP.
Then, the analytic hierarchy process (PCA) was applied to obtain the objective indicator weights by Matlab R2016a, which are listed in Table 6. From the results, the carbon intensity indicator gets the largest weight (0.3219), indicating that the indicator has the largest variance among the industrial sectors compared to the other three indicators. That is, the biggest imbalance exists in the carbon intensity indicator among 37 industrial sub-sectors. The historical carbon emission indicator and margin carbon abatement cost indicator has a close variance, thus they gain close weights of 0.3193 and 0.2983, respectively. However, the differences in the GDP between the industrial sectors are least obvious, so it is granted the smallest weight (0.0605).
Combining the AHP and PCA method, the integrated weights can be calculated using the least squares optimization model, which is listed in Table 6. Carbon emission reduction responsibility undertakes the largest weight of 0.4281. In the process of industrialization in China, some high-energy sub-sectors consume a large amount of fossil energy, such as the iron and steel sector, the electric power sector, and the petrochemical sector. Therefore, these sectors need to assume a greater responsibility for reducing emissions to mitigate the greenhouse effect. The carbon margin abatement cost possesses a weight of 0.2913. The industrial sectors with larger emission reduction costs should take less responsibility for emission reduction. Economic growth remains the main task of China for a long time into the future, so it is vital to ensure economic growth while meeting emission reduction targets. The emission reduction potential has a similar weight to abatement costs, which is 0.2219. A larger emission reduction potential is supposed to be consistent with more emission reduction tasks. The carbon intensity representing the emission reduction potential has a lot to do with industry characteristics, for instance, some raw material sectors, such as the processing of petroleum, which have a greater carbon intensity, suggesting a greater potential; while some light industrial sectors, such as the manufacturing of tobacco, have a smaller carbon intensity. The industrial added-value referring to the carbon abatement capacity takes the smallest weight as 0.0587. Sectors with a high output have the ability to invest in energy-saving and emission-reduction technologies to improve the energy efficiency and reduce carbon emissions.
3.4. Allocation of Carbon Emission Permits Among Industrial Sectors
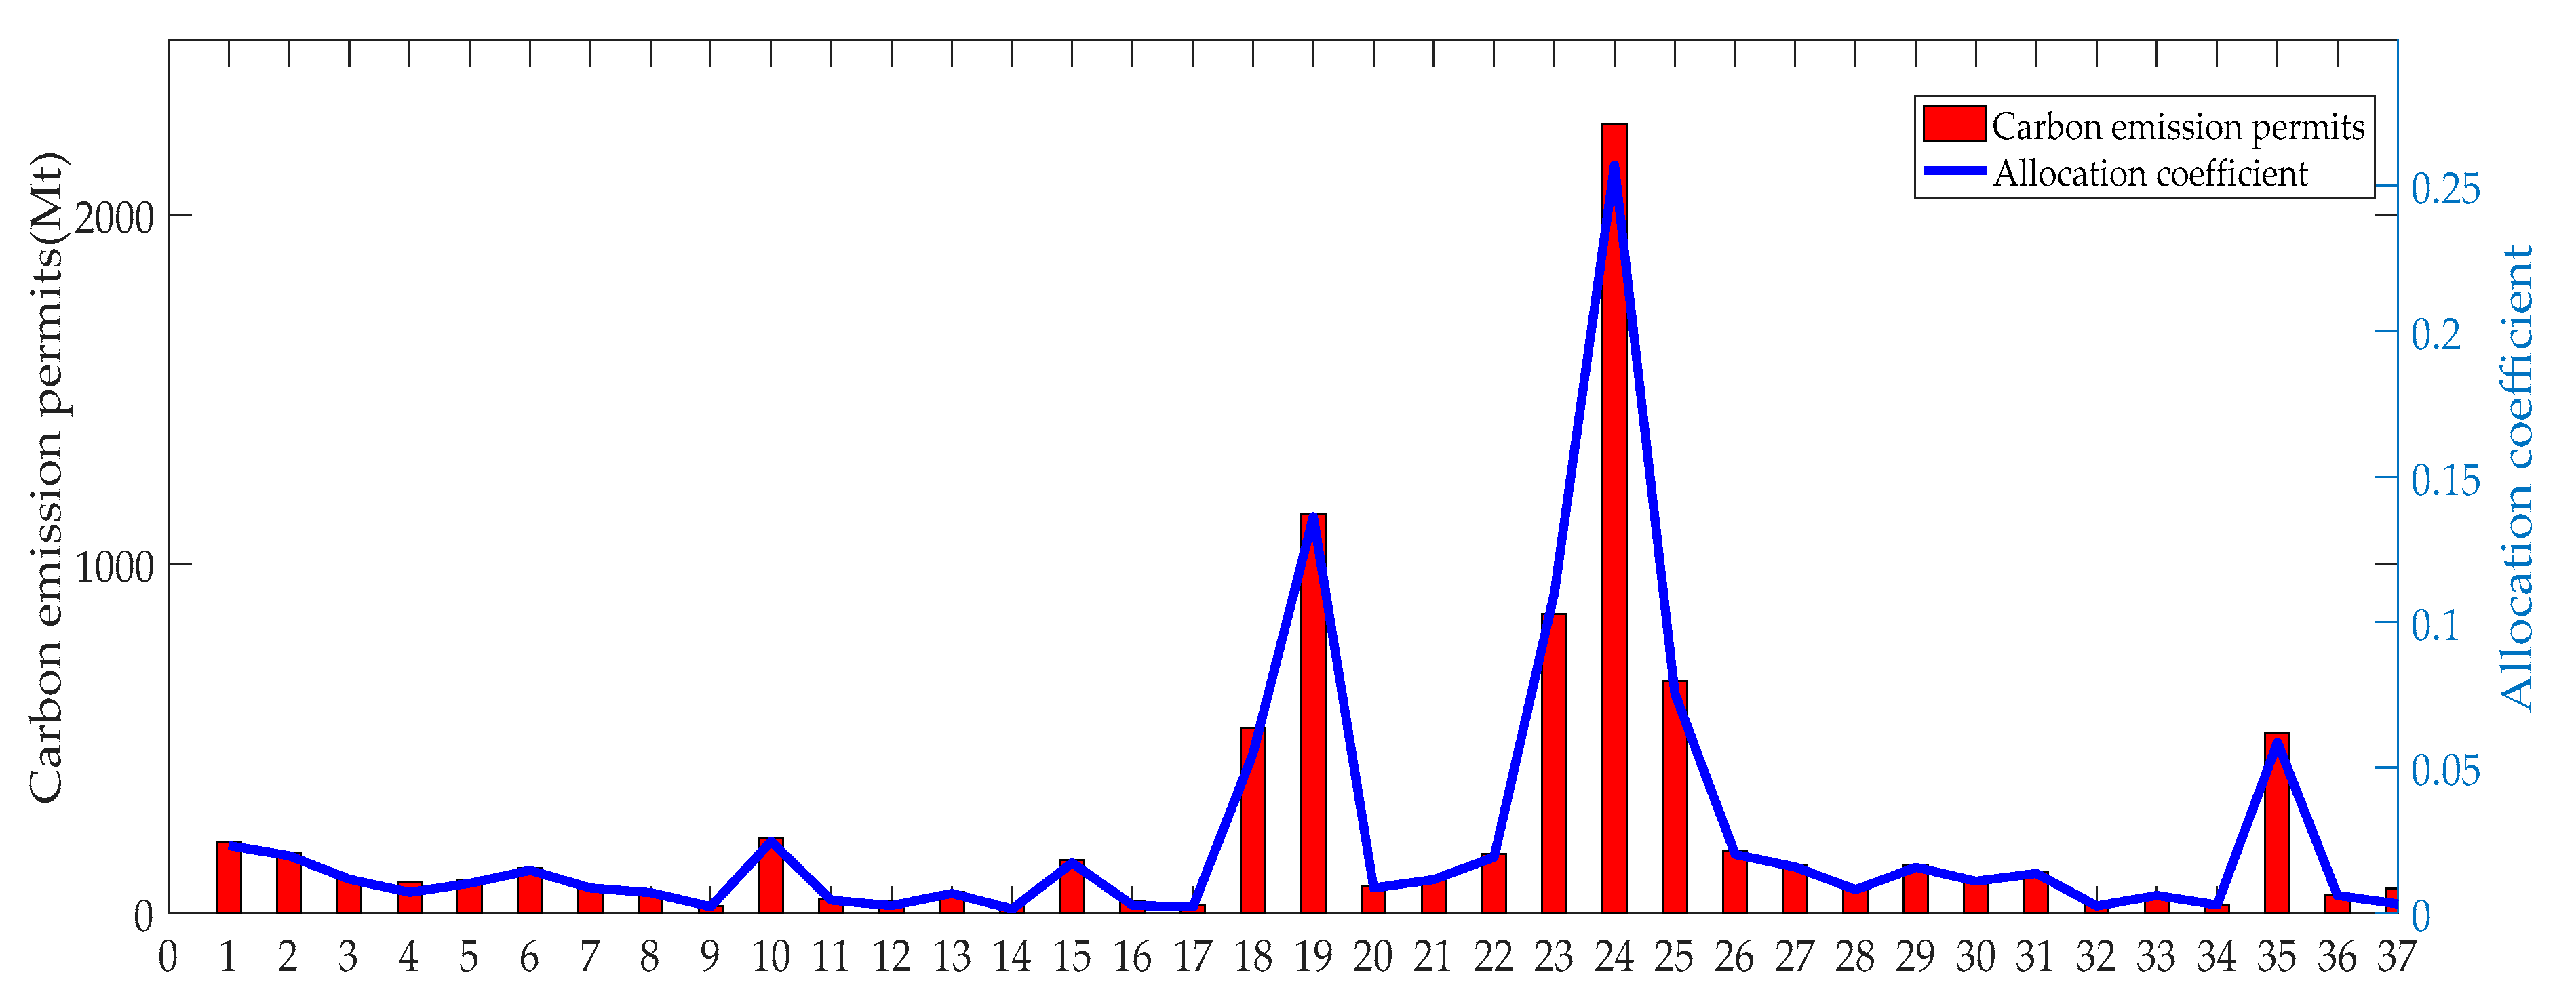
Using Equations (15)–(19), the allocation coefficients of the carbon emission permits of 37 industrial sectors can be calculated. Figure 4 exhibits the allocation coefficient and carbon emission permits in 2030 of each sector. The carbon emission permits distributed among industrial sectors vary widely due to the diverse characteristics of different sectors. There are six sectors that possess a higher allocation coefficient, which is above 5%, including the smelting and pressing of ferrous metals (25.71%), manufacturing of raw chemical materials and chemical products (13.62%), manufacturing of non-metallic mineral products (11.01%), smelting and pressing of non-ferrous metals (7.55%), production and supply of electric power and heat power (5.86%), and the processing of petroleum, coking, and the processing of nuclear fuel (5.47%), with the amounts of 2261 Mt, 1198 Mt, 968 Mt, 664 Mt, 515 Mt, and 481 Mt, respectively. Fourteen industrial sectors have a, allocation coefficient distributed between 1% and 2.5%, and more sectors (17) are granted a weight less than 1%. The three sectors with the smallest carbon emission permits are the manufacturing of tobacco (0.22%), manufacturing of measuring instruments and machinery (0.21%), and the manufacturing of furniture (0.13%).
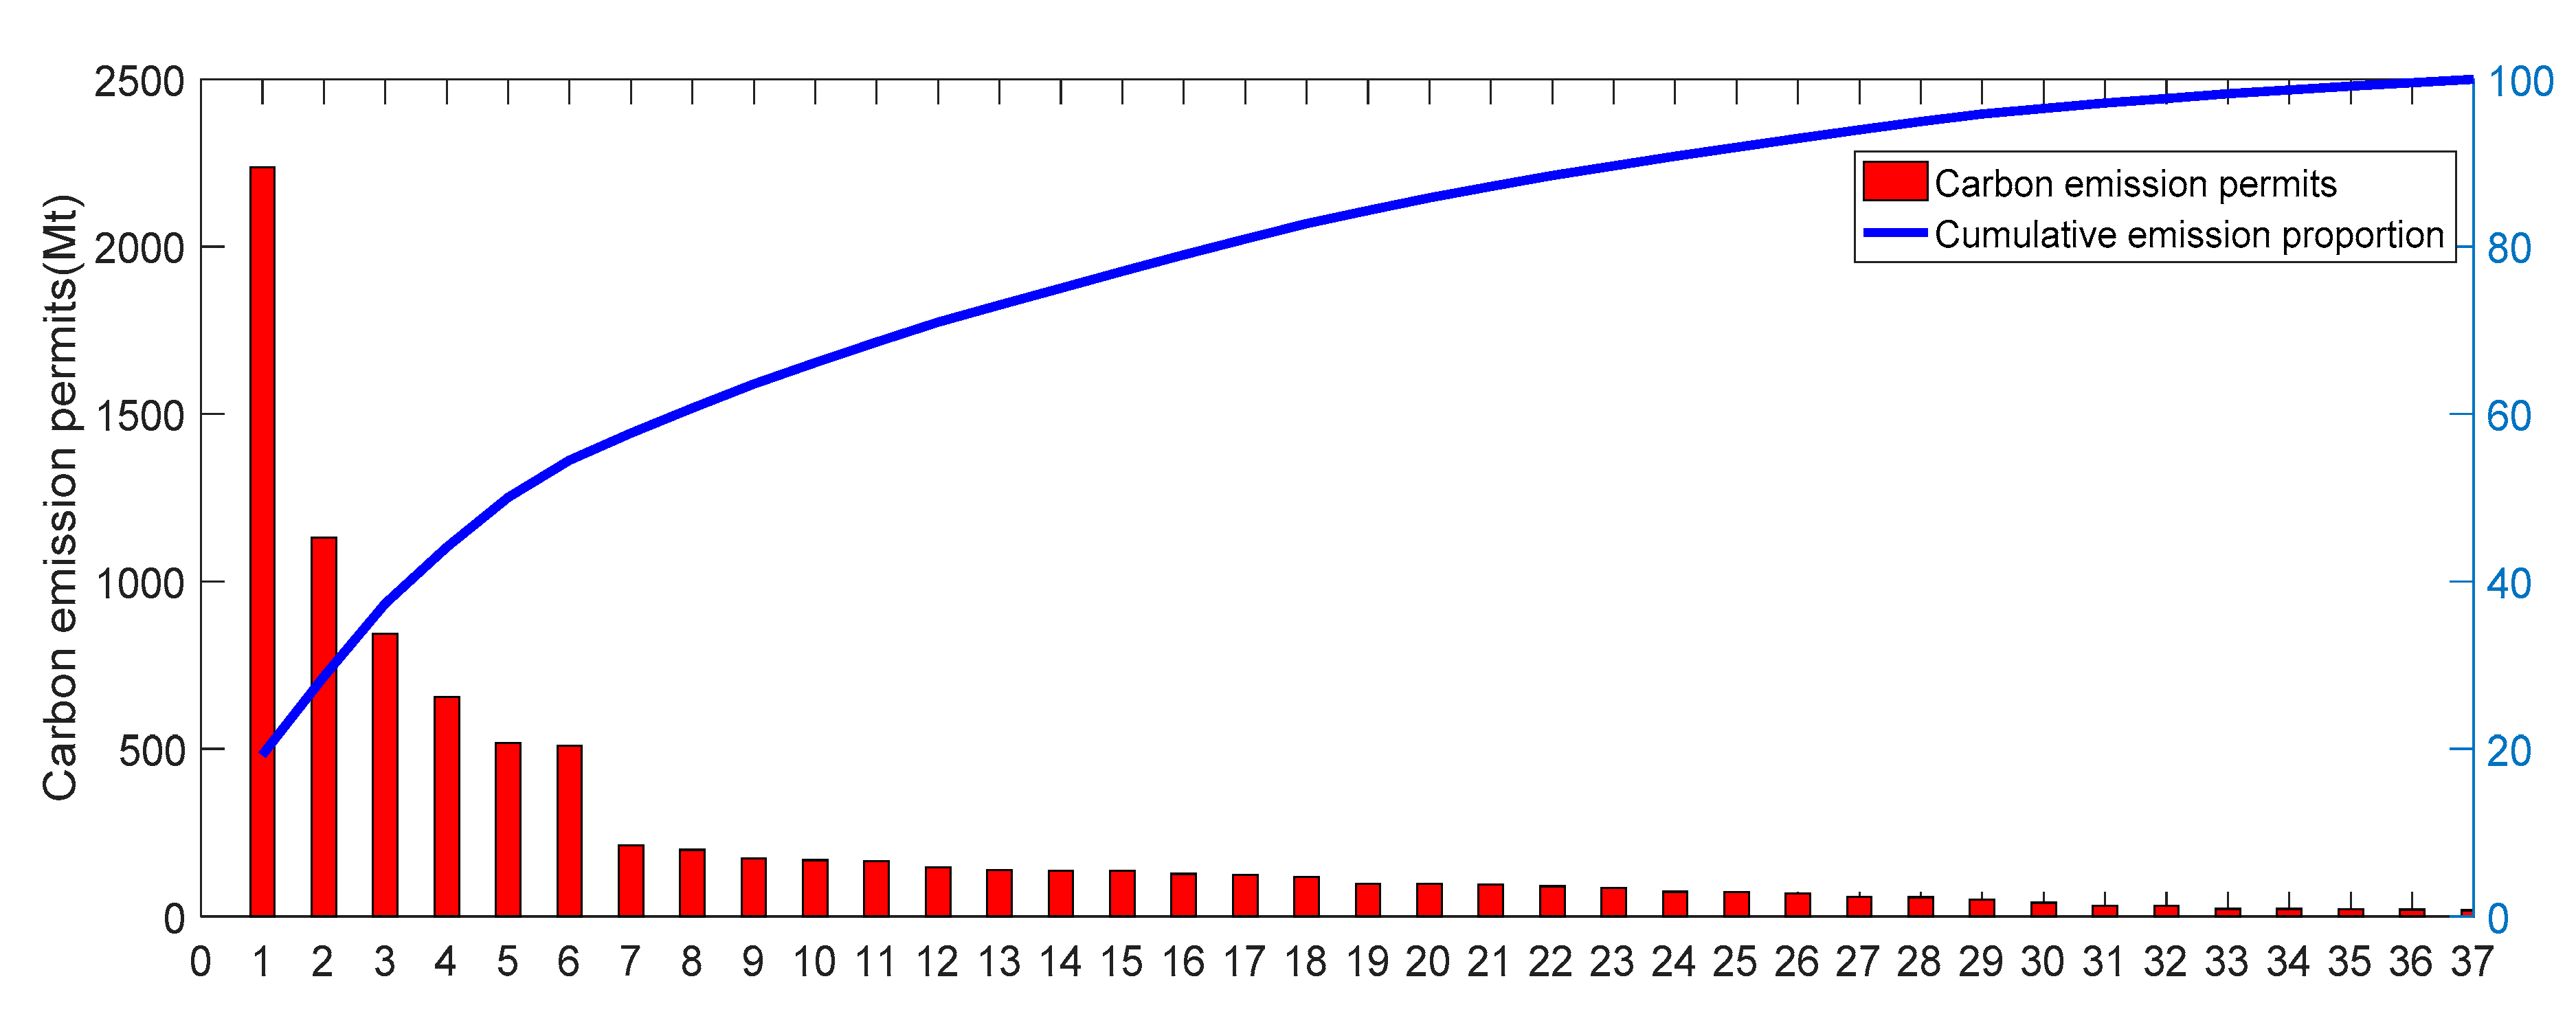
Figure 5 reflects the carbon emission permits of 37 sub-sectors in descending order and the cumulative carbon emissions’ share in 2030 estimated by the proposed method. It was found that most of the carbon emission permits are concentrated in a few sectors, while most sectors get only small amounts of permits. The top six sectors obtained the major part of the industrial carbon emission permits, with a total of 6087 Mt, accounting for 69.23% of the industrial emission license. These sectors (S24, S19, S23, S25, S35, S18) are the cornerstone of the country, providing energy and raw materials to other industries and it is difficult for the economy to survive and develop without them. On the one hand, to ensure the normal development of the national economy, these industrial sectors must be allocated sufficient carbon emission permits. On the other hand, these sectors have great potential for emission reductions, and the government must take targeted measures to tap this potential to achieve emission reduction targets.
3.5. Sensitivity Analysis
To illustrate the effectiveness of the proposed method, this section is implemented by analyzing the sensitivity of the methods proposed in this article. The hybrid method proposed in this paper has two most prominent features: First, it considered the carbon marginal abatement cost of the industrial sectors; second, it adopted the integrated weight method. Therefore, we verified the effectiveness of the proposed method from these two aspects.
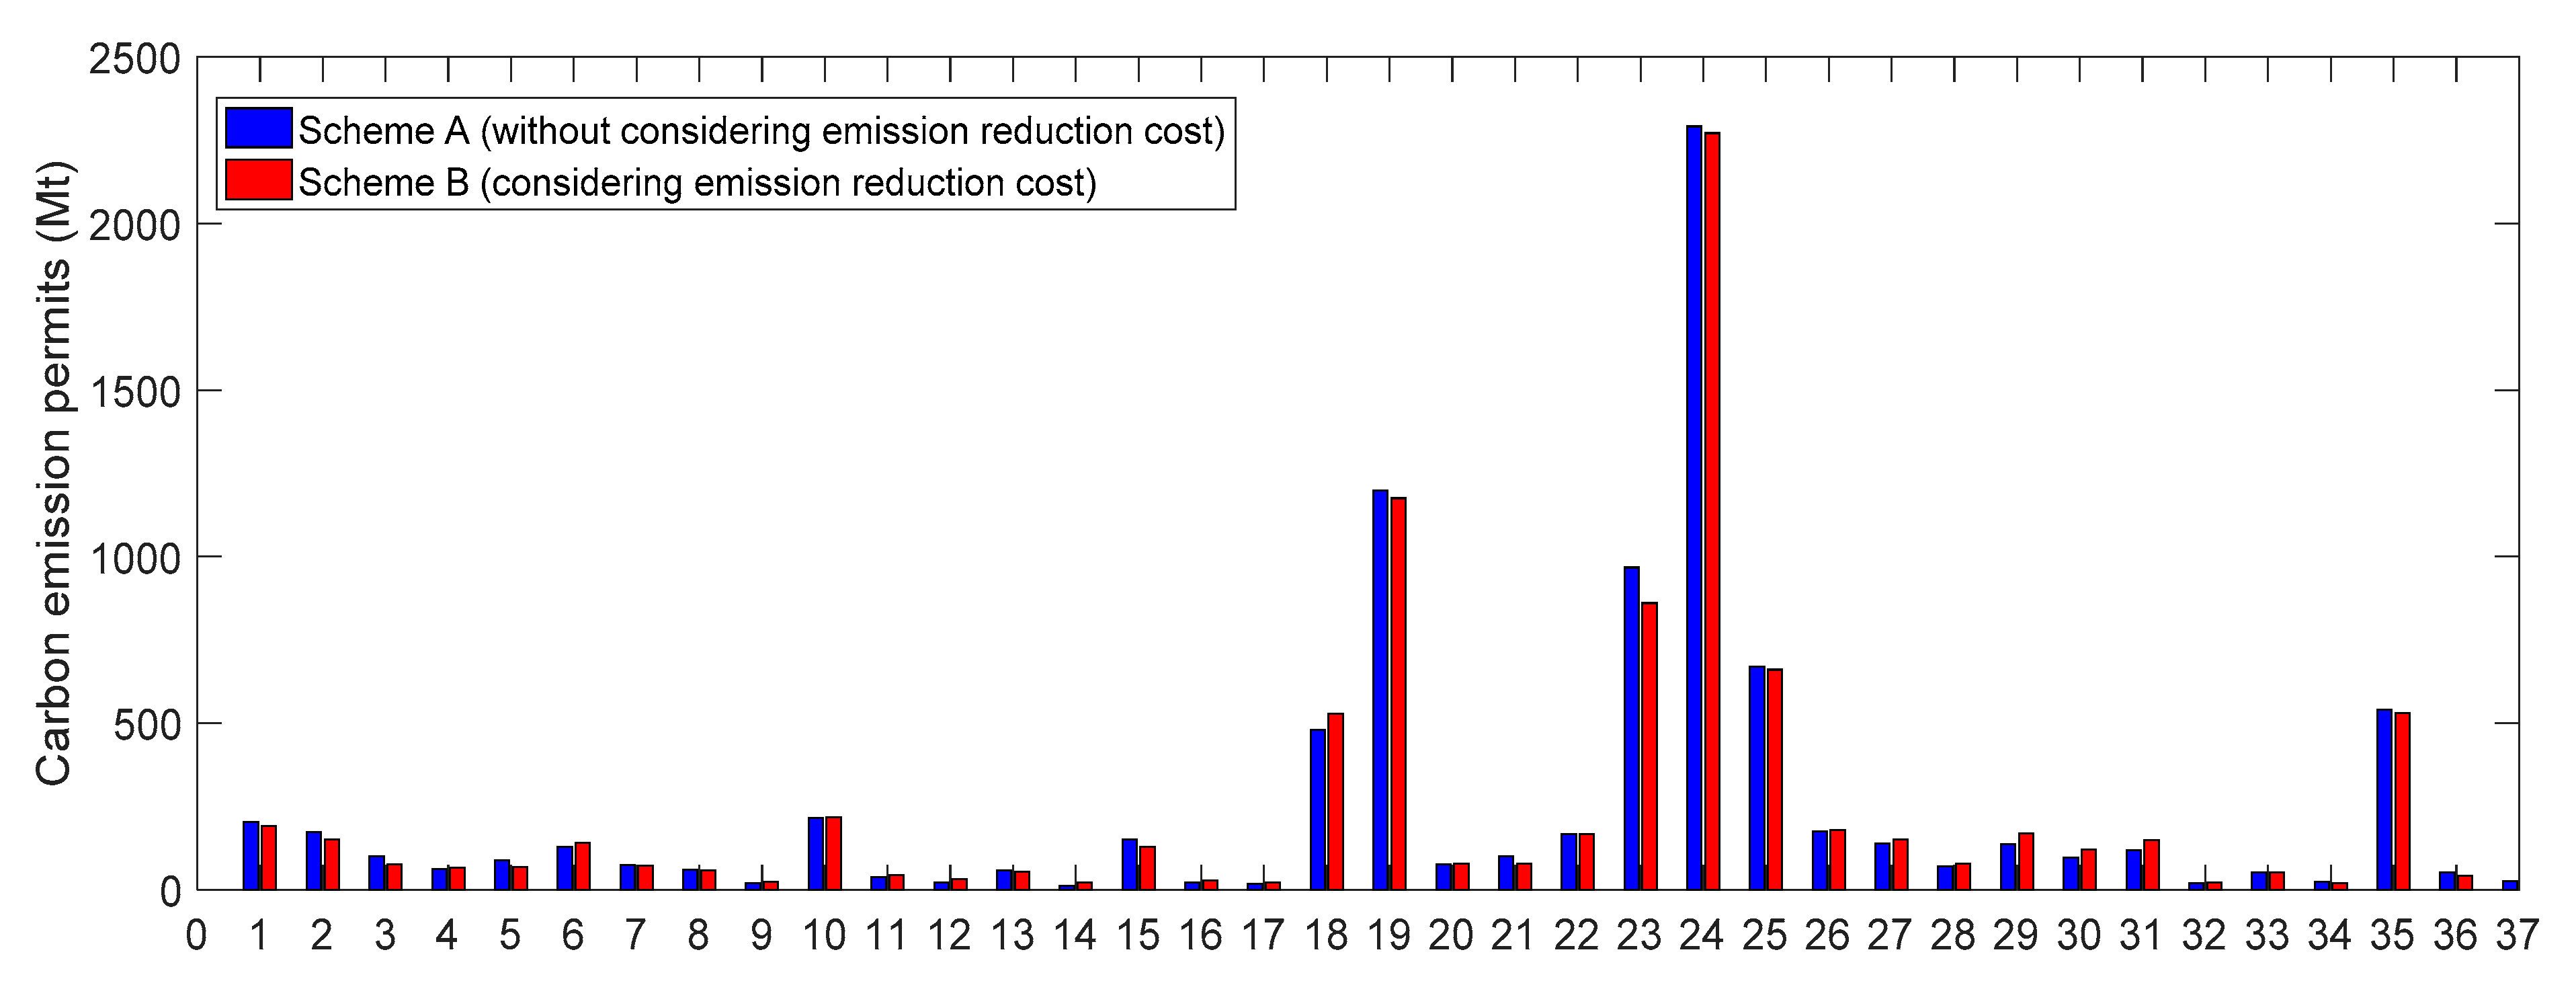
First, a new allocation scheme (Scheme A) was established considering the carbon abatement responsibility, carbon abatement potential, and carbon abatement capacity, which excludes carbon marginal abatement costs. Figure 6 shows the difference between the new scheme and the proposed scheme in this paper (Scheme B). The results show that although the results of the two allocation schemes are very similar, there are still differences. Scheme B allocates a lesser amount of carbon emission permits than scheme A for some sectors with lower abatement costs, such as the smelting and pressing of ferrous metals (S24), manufacturing of non-metallic mineral products (S23), extractive industry (S1, S2, S3, S4, S5), and so on, while scheme B allocates more carbon emission permits than scheme A for some sectors with higher abatement costs, such as the manufacturing of computers, communication, and other electronic equipment (S31), manufacturing of electrical machinery and equipment (S30), and so on.
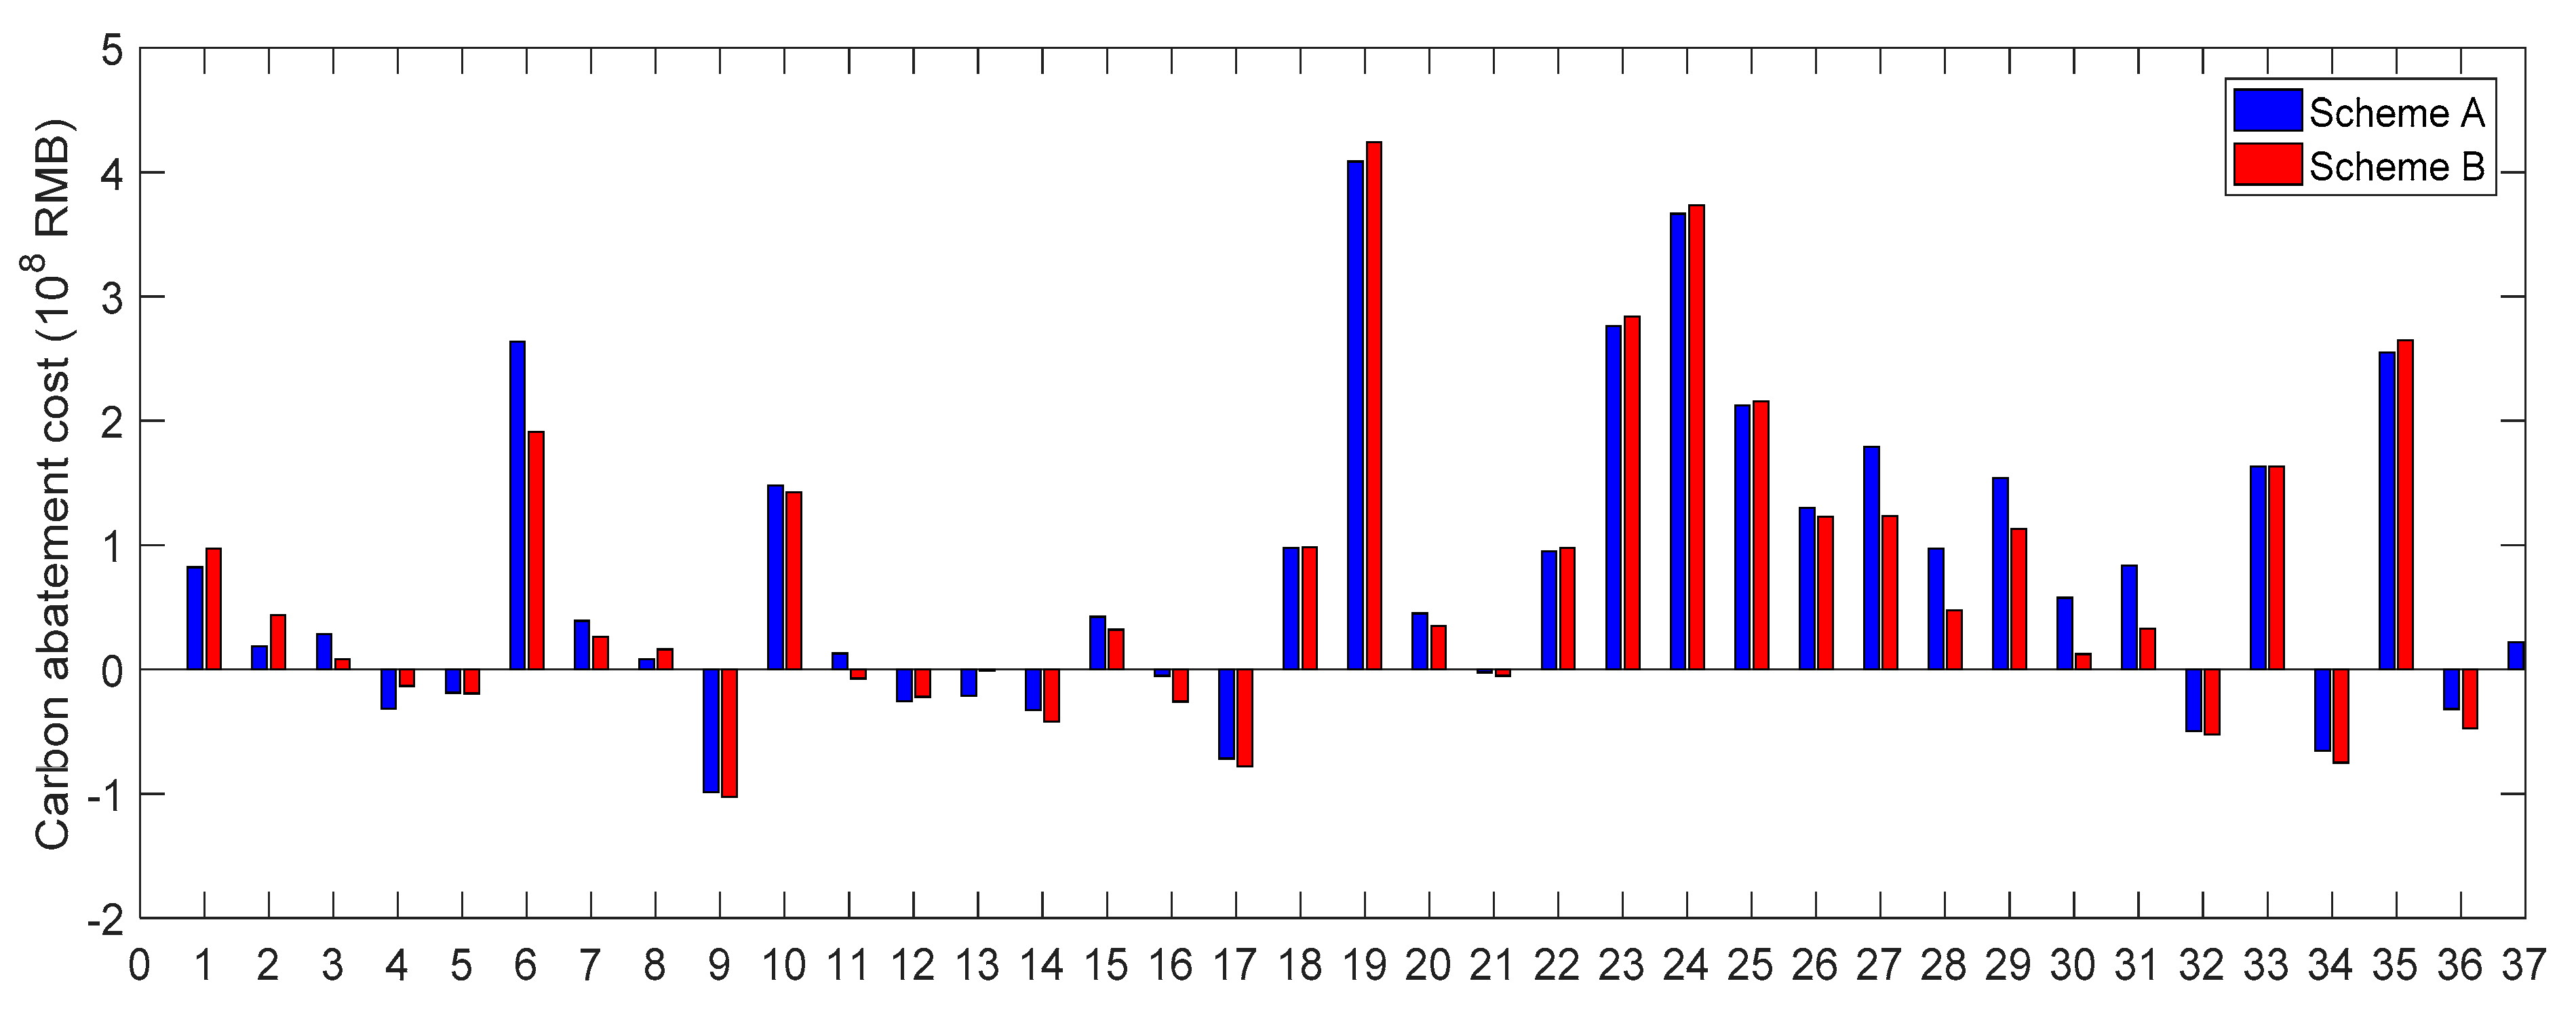
According to Equations (19)–(21), we obtained the emission reductions that each sub-sector should undertake. Combined with the marginal abatement cost for each sub-sector obtained in Section 3.2, the abatement costs of each sub-sector can be estimated. Figure 7 shows the abatement costs for the 37 industrial sectors of the two schemes. As can be seen, there are some sub-sectors whose carbon emission reduction costs are less than 0, which means that these sectors are allocated sufficient carbon emission permits and do not need to reduce their carbon emissions. These sectors should spend money on production or research and development rather than energy saving and emission reduction. Other sectors whose carbon emission reduction costs are greater than 0 need to inject sufficient funds into energy savings and emission reduction to complete emission reduction tasks. Comparing the two allocation schemes, there are 24 sub-sectors with higher emission reduction costs in scheme A than in scheme B, and 13 sub-sectors with lower emission reduction costs in scheme A than in scheme B. However, the total abatement cost in scheme A is 347 million yuan more than that in scheme B according to the estimated results. This means that the allocation scheme proposed in this paper can reduce the cost of emission reduction and meet the needs of China’s current development.
Second, the combined weight method integrates subjective actual conditions with objective numerical features to determine more reasonable weights. To verify the superiority of the combined weight method, the subjective weight method (AHP) and objective weight method (entropy method) were also used alone in this section. Figure 8 shows the Lorenz curves of the AHP, entropy method, and combined method. It can be found that the entropy method comes close to the line of prefect efficiency, followed by the combined method and AHP method. It suggests that the allocation scheme derived using the subjective allocation method (AHP) has the highest concentration, that is, it is the most uneven, while this extremely imbalanced allocation is mitigated when the objective weight method (entropy) is used. However, due to the inherent characteristics of the different sub-sectors, an excessive balanced allocation scheme may ignore the rationality of emission reduction, leading to excess pressure on some sectors, and an over-concentrated scheme may lead to inefficient emission reduction. Therefore, a suitable degree of balance is the key to the allocation of emission permits, and the combined weight method solves this problem effectively, which is more suitable for the allocation of carbon emission permits.
Through the above analysis, it was proven that the proposed hybrid allocation scheme can help decision makers to develop carbon emission permits’ allocations for the industrial sectors.
4. Discussion
To promote the industry to achieve the goal of carbon intensity reduction more efficiently, it is necessary to conduct classified research on 37 industrial sectors to identify different features. In the allocation of carbon emission permits, carbon reduction responsibilities occupy the most important position according to Section 3.3. However, the carbon reduction capacity played a leading role in implementing emission reduction measures, which makes it possible for companies to increase the research and application of energy-saving and emission-reducing equipment with the support of funds. Therefore, based on the carbon abatement responsibility and carbon reduction capacity of different sectors, the 37 sectors of China’s industry were classified into different types. The result is shown as Table 7.
First, the six sectors were classified as major emission reduction sectors, including the smelting and pressing of ferrous metals, processing of petroleum, raw chemical materials and chemical products, non-metallic mineral products, smelting and pressing of non-ferrous metals, and the production and supply of electric power and heat power, which have a high-responsibility and high-capacity. China has accelerated the establishment of a sound carbon trading system, and these sectors should be the first sectors to be considered in the system. Based on years of pilot work, the national unified carbon market was officially launched in 2017, and the power industry was first included because of its good data foundation. With the continuous deepening of the carbon market construction process, these sectors are supposed to be gradually included in the unified carbon market. One the other hand, the government should adopt mandatory carbon abatement measures to limit the carbon emissions of these sectors. Punishment should be imposed on enterprises violating energy and environment policies and regulations to encourage enterprises to take the initiative to assume social responsibility. The strengthening of supply-side reform practice is necessary to change the economic structure of high-carbon emission sectors, which will not only reduce the emission reduction pressure of these sectors, but also improve the situation of excessive pressure on resources and the environment caused by an unreasonable emission structure.
Second, nine sectors have a high-responsibility and low-capacity, such as the mining and washing of coal, extraction of petroleum and natural gas, mining and processing of ferrous metal ores, paper and paper products, etc. Although the carbon abatement capacity of such sectors is relatively weak, these sectors are still key targets for emission reduction due to the large space for emission reduction. In the short-term, the Chinese government should strengthen financial subsidies for emission reduction to promote the industry’s mitigation enthusiasm, especially by increasing subsidies for energy-saving technology research and development, which is an important measure to improve the energy efficiency of the industry. In the long run, to achieve sustainable development in these sectors, two aspects deserve more attention. First, the competitiveness of these sectors needs to improve; only when they are strong enough can they take the initiative to pay attention to environmental problems. Second, the application of renewable resources and the development of new energy should be strengthened. Reducing sectors’ dependence on fossil energy can fundamentally control carbon emissions.
Third, 11 industrial sectors have a high-capacity and low-responsibility, including the manufacturing of computers, communication, and other electronic equipment, manufacturing of automobiles, manufacturing of electrical machinery and apparatus, etc. These sectors are supposed to take advantage of the high carbon abatement capacity and strengthen their investment in research and development (R&D) of energy conservation and emission reduction technologies.
The fourth category has the characteristics of low-responsibility and low-capacity. Such sectors have a smaller emission reduction space and less effects on the target of carbon emission reduction in the overall industry. Therefore, under the premise of maintaining the current level of carbon emissions, they should focus on economic growth and invest more funds in high-end products, rather than energy-conservation and emission-reduction, to make contributions to building an industrial power.
5. Conclusions
This study proposed a novel scheme to allocate industrial carbon emissions quotas using an integrated approach combined by the AHP and PCA method. The new scheme proposes the carbon marginal abatement cost, carbon abatement responsibilities, carbon abatement potential, and carbon abatement capacity as the allocation criteria. Some main conclusions were obtained as follows.
First, to realize the industrial emission reduction goals at the lowest cost, carbon marginal abatement costs are an indispensable criterion for allocating carbon emission permits. Second, the industrial added value will increase to 53,629 billion yuan (2005 price) by 2030 using TPGM (1,1), with an average growth rate of 5.87%. The total industrial emission permits will be 8792 Mt in 2030, and carbon increment permits will be 3178 Mt. Third, the average marginal abatement cost of China’s industry was 14,300 RMB/ton of carbon in 2012–2016. Light industrial sectors and high-tech industrial sectors have a higher abatement cost, while energy-intensive heavy chemical industries have a lower abatement cost. Fourth, according to the allocation results, six industrial sectors, including the smelting and pressing of ferrous metals (S24), manufacturing of raw chemical materials and chemical products (S18), manufacturing of non-metallic mineral products (S23), smelting and pressing of non-ferrous metals (S25), production and supply of electric power and heat power (S35), and the processing of petroleum, coking, and processing of nuclear fuel (S19), obtained chief carbon emissions permits of 6087 Mt, accounting for 69.23% of the total carbon emission permits. Fifth, based on the carbon abatement responsibility and carbon abatement capacity, the 37 industrial sectors were classified into four types: High-responsibility and high-capacity sectors, high-responsibility and low-capacity sectors, high-capacity and low-responsibility sectors, and low-responsibility and low-capacity sectors. For the different categories, the government should implement targeted policies to achieve industrial sector emission reduction targets at the lowest cost.
In addition, there are still some limitations in this paper that need future research. This article only discusses how to allocate carbon emission permits among industrial sectors. However, the allocation of carbon emission permits between regions and provinces is also particularly important. Only by realizing the combination of regions and the industry can we achieve the extensiveness of the carbon trading market and establish a more reasonable carbon trading system. The question of how to combine industrial and regional carbon emission permits allocation to form a complete carbon permits allocation system requires further study.
Author Contributions
Conceptualization, J.Z.; Formal analysis, Y.L.; Methodology, X.X. and X.H.
Funding
This research received no external funding.
Conflicts of Interest
The authors declare no conflict of interest.
References
- Schmithüsen, H.; Notholt, J.; König-Langlo, G.; Lemke, P.; Jung, T. How increasing CO2 leads to an increased negative greenhouse effect in Antarctica. Geophys. Res. Lett. 2015, 42, 422–428. [Google Scholar] [CrossRef]
- Larsen, N.K.; Strunk, A.; Levy, L.B.; Olsen, J.; Bjørk, A.; Lauridsen, T.L. Strong altitudinal control on the response of local glaciers to Holocene climate change in southwest Greenland. Quat. Sci. Rev. 2017, 168, 69–78. [Google Scholar] [CrossRef]
- United Nations Convention and Declaration Search System. 2015. Paris Agreement. Available online: http://www.un.org/zh/documents/view_doc.asp?symbol=FCCC/CP/2015/L.9/Rev.1 (accessed on 20 December 2018).
- Guo, R.; Zhao, Y.; Shi, Y. Low carbon development and local sustainability from a carbon balance perspective. Resour. Conserv. Recycl. 2017, 122, 270–279. [Google Scholar] [CrossRef]
- Dong, F.; Long, R.; Li, Z.; Dai, Y. Analysis of carbon emission intensity, urbanization and energy mix: Evidence from China. Nat. Hazards 2016, 82, 1375–1391. [Google Scholar] [CrossRef]
- Cong, R.; Lo, A.Y. Emission trading and carbon market performance in Shenzhen, China. Appl. Energy 2017, 193, 414–425. [Google Scholar] [CrossRef]
- Hu, Y.J.; Li, X.Y.; Tang, B.J. Assessing the operational performance and maturity of the carbon trading pilot program: The case study of Beijing’s carbon market. J. Clean. Prod. 2017, 161, 1263–1274. [Google Scholar] [CrossRef]
- Zhang, Y.J.; Wang, A.D.; Da, Y.B. Regional allocation of carbon emission quotas in China: Evidence from the Shapley value method. Energy Policy 2014, 74, 454–464. [Google Scholar] [CrossRef]
- Chen, W.; Wu, F.; Geng, W. Carbon emissions in China’s industrial sectors. Resour. Conserv. Recycl. 2016, 117, 264–273. [Google Scholar] [CrossRef]
- Wei, Y.M.; Wang, L.; Liao, H.; Wang, K.; Murty, T.; Yan, J. Responsibility accounting in carbon allocation: A global perspective. Appl. Energy 2014, 130, 122–133. [Google Scholar] [CrossRef]
- Chiu, Y.H.; Lin, J.C.; Liu, J.K. An efficiency evaluation of the EU’s allocation of carbon emission allowances. Energy Sour. Part B Econ. Plan. Policy 2015, 10, 192–200. [Google Scholar] [CrossRef]
- Qin, Q.; Liu, Y.; Li, X.; Li, H. A multi-criteria decision analysis model for carbon emission quota allocation in China’s east coastal areas: Efficiency and equity. J. Clean. Prod. 2017, 168, 410–419. [Google Scholar] [CrossRef]
- Jiang, H.Q.; Shao, X.X.; Zhang, X.; Bao, J.Q. A study of the allocation of carbon emission permits among the provinces of China based on fairness and efficiency. Sustainability 2017, 9, 2122. [Google Scholar] [CrossRef]
- Yi, W.J.; Zou, L.; Guo, J.; Wang, K.; Wei, Y.M. How can China reach its CO2 intensity reduction targets by 2020? A regional allocation based on equity and development. Energy Policy 2011, 39, 2407–2415. [Google Scholar] [CrossRef]
- Yang, B.C.; Liu, C.Z.; Su, Y.P.; Jing, X. The allocation of carbon intensity reduction target by 2020 among industrial sectors in China. Sustainability 2017, 9, 148. [Google Scholar] [CrossRef]
- Zhao, R.; Geng, Y.; He, Y. Allocation of carbon emissions among industries/sectors: An emissions intensity reduction constrained approach. J. Clean. Prod. 2016, 142, 3083–3094. [Google Scholar] [CrossRef]
- Rose, A. Reducing conflict in global warming policy: The potential of equity as aunifying principle. Energy Policy 1990, 18, 927–935. [Google Scholar] [CrossRef]
- Saran, S. Global governance and climate change. Glob. Gov. 2009, 15, 457–460. [Google Scholar] [CrossRef]
- Ringius, L.; Torvanger, A.; Holtsmark, B. Can multi-criteria rules fairly distribute climate burdens? OECD results from three burden sharing rules. Energy Policy 1998, 26, 777–793. [Google Scholar] [CrossRef]
- Bhagwati, J. Reflections on climate change and trade. Brookings Tr. Forum 2009, 2008, 171–176. [Google Scholar]
- Rose, A.; Zhang, Z.X. Interregional burden-sharing of greenhouse gas mitigation in the United States. Mitig. Adapt. Strateg. Glob. Chang. 2004, 9, 477–500. [Google Scholar] [CrossRef] [Green Version]
- An, Q.X.; Wen, Y.; Xiong, B.B.; Yang, M.; Chen, X.H. Allocation of carbon dioxide emission permits with the minimum cost for Chinese provinces in big data environment. J. Clean. Prod. 2017, 142, 886–893. [Google Scholar] [CrossRef]
- Miao, Z.; Geng, Y.; Sheng, J. Efficient allocation of CO2 emissions in China: A zero sum gains data envelopment model. J. Clean. Prod. 2016, 112, 4144–4150. [Google Scholar] [CrossRef]
- Zhang, Y.J.; Hao, J.F. Carbon emission quota allocation among China’s industrial sectors based on the equity and efficiency principles. Ann. Oper. Res. 2017, 255, 117–140. [Google Scholar] [CrossRef]
- Liu, Z.; Geng, Y.; Dong, H. Efficient distribution of carbon emissions reduction targets at the city level: A case of Yangtze River Delta region. J. Clean. Prod. 2018, 172, 1711–1721. [Google Scholar] [CrossRef]
- Li, Y.B.; Li, Z.; Wu, M.; Zhang, F.; De, G. Regional-level allocation of CO2 emission permits in China: Evidence from the Boltzmann distribution method. Sustainability 2018, 10, 2612. [Google Scholar] [CrossRef]
- Li, L.; Li, Y.; Ye, F.; Zhang, L. Carbon dioxide emissions quotas allocation in the Pearl River Delta region: Evidence from the maximum deviation method. J. Clean. Prod. 2018, 177, 207–217. [Google Scholar] [CrossRef]
- Wang, Y.; Zhao, H.; Duan, F.M.; Wang, Y. Initial provincial allocation and equity evaluation of China’s carbon emission rights—Based on the improved TOPSIS method. Sustainability 2018, 10, 982. [Google Scholar] [CrossRef]
- Han, R.; Tang, B.J.; Fan, J.L.; Liu, L.C.; Wei, Y.M. Integrated weighting approach to carbon emission quotas: An application case of Beijing-Tianjin-Hebei region. J. Clean. Prod. 2016, 131, 448–459. [Google Scholar] [CrossRef]
- Feng, Z.Y.; Tang, W.H.; Niu, Z.W.; Wu, Q.H. Bi-level allocation of carbon emission permits based on clustering analysis and weighted voting: A case study in China. Appl. Energy 2018, 228, 1122–1135. [Google Scholar] [CrossRef]
- Pang, R.Z.; Deng, Z.Q.; Chiu, Y.H. Pareto improvement through a reallocation of carbon emission quotas. Renew. Sustain. Energy Rev. 2015, 50, 419–430. [Google Scholar] [CrossRef]
- Zeng, S.; Xu, Y.; Wang, L.; Chen, J.; Li, Q. Forecasting the allocative efficiency of carbon emission allowance financial assets in China at the provincial level in 2020. Energies 2016, 9, 329. [Google Scholar] [CrossRef]
- Xiong, S.Q.; Tian, Y.S.; Ji, J.P.; Ma, X.M. Allocation of energy consumption among provinces in China: A weighted ZSG-DEA model. Sustainability 2017, 9, 2115. [Google Scholar] [CrossRef]
- Yu, S.; Wei, Y.M.; Wang, K. Provincial allocation of carbon emission reduction targets in China: An approach based on improved fuzzy cluster and Shapley value decomposition. Energy Policy 2014, 66, 630–644. [Google Scholar] [CrossRef]
- Zhan, L.Q.; Shi, H.J. Methods and model of grey modeling for approximate non-homogeneous exponential data. Syst. Eng. Theory Pract. 2013, 33, 689–694. [Google Scholar]
- Zhang, J.G.; Yang, H.J. Evaluation of provincial energy-saving and emission reduction efficiency based on DDF-DEA three-stage model. China Popul. Resour. Environ. 2018, 28, 24–31. [Google Scholar]
- Zhou, P.; Ang, B.W.; Wang, H. Energy and emission performance in electricity generation: A non-radial directional distance function approach. Eur. J. Oper. Res. 2012, 221, 625–635. [Google Scholar] [CrossRef]
- Saaty, T.L. The Analytical Hierarchy Process: Planning, Priority Setting, Resource Allocation; RWS Publication: Pittsburg, PA, USA, 1980. [Google Scholar]
- Wang, C.Q.; Zhang, Y.N.; Xu, W.L. Research of determining index weights based on least squares method in post-evaluation process. J. Jilin Univ. 2010, 28, 513–518. [Google Scholar]
- Wang, Y.; Bi, Y.; Wang, E.D. Scene prediction of carbon emission peak and emission reduction potential estimation in Chinese industry. China Popul. Resour. Environ. 2017, 27, 131–140. [Google Scholar]
Figure 1.
Research framework.

Figure 2.
Forecast results of GDP in the industry.

Figure 3.
Carbon marginal abatement cost for 37 industrial sectors in 2012–2016.

Figure 4.
The allocation result of carbon emission permits in industrial sectors.

Figure 5.
Carbon emission permits of 37 sub-sectors in descending order.

Figure 6.
Comparison of different allocation schemes.

Figure 7.
The abatement cost of different allocation schemes.

Figure 8.
Lorenz curve with different weighting methods.


Table 1.
Industrial sectors included in the calculation.
| Sector | Name |
|---|---|
| S1 | Mining and Washing of Coal |
| S2 | Extraction of Petroleum and Natural Gas |
| S3 | Mining and Processing of Ferrous Metal Ores |
| S4 | Mining and Processing of Non-Ferrous Metal Ores |
| S5 | Mining and Processing of Nonmetal Ores |
| S6 | Processing of Food from Agricultural Products |
| S7 | Manufacture of Foods |
| S8 | Manufacture of Beverages |
| S9 | Manufacture of Tobacco |
| S10 | Manufacture of Textile |
| S11 | Manufacture of Textile Wearing Apparel, Footwear, and Caps |
| S12 | Manufacture of Leather, Fur, and Feather |
| S13 | Processing of Timber |
| S14 | Manufacture of Furniture |
| S15 | Manufacture of Paper and Paper Products |
| S16 | Printing, Reproduction of Recording Media |
| S17 | Manufacture of Articles for Culture, Education, and Sport Activity |
| S18 | Processing of Petroleum, Coking, Processing of Nuclear Fuel |
| S19 | Manufacture of Raw Chemical Materials and Chemical Products |
| S20 | Manufacture of Medicines |
| S21 | Manufacture of Chemical Fibers |
| S22 | Manufacture of Rubber and Plastics Products |
| S23 | Manufacture of Non-metallic Mineral Products |
| S24 | Smelting and Pressing of Ferrous Metals |
| S25 | Smelting and Pressing of Non-ferrous Metals |
| S26 | Manufacture of Metal Products |
| S27 | Manufacture of General Purpose Machinery |
| S28 | Manufacture of Special Purpose Machinery |
| S29 | Manufacture of Transport Equipment |
| S30 | Manufacture of Electrical Machinery and Equipment |
| S31 | Manufacture of Computers, Communication, and Other Electronic Equipment |
| S32 | Manufacture of Measuring Instruments and Machinery |
| S33 | Other Manufacture |
| S34 | Recycling and Disposal of Waste |
| S35 | Production and Supply of Electric Power and Heat Power |
| S36 | Production and Supply of Gas |
| S37 | Production and Supply of Water |
Table 2.
New scheme for carbon emission permits’ allocation.
| Dimension | Indicator | Description |
|---|---|---|
| Carbon marginal abatement cost | Simulated by the DEA method | Input: Capital, labor, energy consumption |
| Output: industrial output, carbon emissions | ||
| Carbon abatement responsibility | Historical cumulative carbon emissions | emissions |
| Carbon abatement potential | Carbon emissions intensity | emissions/industrial GDP |
| Carbon abatement Capacity | GDP | GDP in each sector |
Table 3.
Carbon emission coefficients of types of fossil energies.
| E | CV (kJ/kg) | CF(t/TJ) | CR (%) | CO2 Emission Coefficient (kg-CO2/kg) |
|---|---|---|---|---|
| coal | 20,908 | 26.37 | 94 | 1.90 |
| clean coal | 26,377 | 25.77 | 94 | 2.34 |
| other coal washing | 8374 | 25.41 | 94 | 0.73 |
| coke | 28,435 | 29.5 | 93 | 2.86 |
| coke oven gas | 16,746 | 13.58 | 99 | 0.83 |
| other gas | 10,463 | 12.2 | 99 | 0.46 |
| other coking products | 35,999 | 29.42 | 93 | 3.61 |
| crude oil | 41,816 | 20.1 | 98 | 3.02 |
| gasoline | 43,070 | 18.9 | 98 | 2.93 |
| kerosene | 43,070 | 19.5 | 98 | 3.02 |
| diesel | 42,652 | 20.2 | 98 | 3.10 |
| fuel oil | 41,816 | 21.1 | 98 | 3.17 |
| liquefied petroleum gas | 50,179 | 17.2 | 98 | 3.10 |
| refinery gas | 45,998 | 18.2 | 99 | 3.04 |
| other petroleum products | 41,868 | 20 | 98 | 3.01 |
| natural gas | 38,931 | 15.3 | 99 | 2.16 |
Table 4.
The fitting result of GDP. The industrial added value is the sum of the added value of 37 sub-sectors, which was converted to the 2005 price.
Table 4.
The fitting result of GDP. The industrial added value is the sum of the added value of 37 sub-sectors, which was converted to the 2005 price.
| Year | Actual Value | Fitting Value | Error | Relative Error (%) |
|---|---|---|---|---|
| 2005 | 7,218.70 | 7,218.70 | 0.00 | 0.00 |
| 2006 | 9,107.57 | 9,445.43 | 337.86 | 3.71 |
| 2007 | 11,363.92 | 10,731.25 | −632.67 | 5.57 |
| 2008 | 11,630.88 | 12,055.46 | 424.58 | 3.65 |
| 2009 | 13,392.63 | 13,419.19 | 26.57 | 0.20 |
| 2010 | 15,379.66 | 14,823.64 | −556.03 | 3.62 |
| 2011 | 16,412.65 | 16,270.00 | −142.65 | 0.87 |
| 2012 | 17,085.03 | 17,759.55 | 674.51 | 3.95 |
| 2013 | 19,091.53 | 19,293.56 | 202.03 | 1.06 |
| 2014 | 21,019.00 | 20,873.36 | −145.64 | 0.69 |
| 2015 | 22,742.43 | 22,500.32 | −242.11 | 1.07 |
| 2016 | 24,122.63 | 24,175.84 | 53.21 | 0.22 |
| Average relative error | 2.2358 | |||
Table 5.
The comparison matrix.
| 1 | 1/3 | 3 | 5 | |
| 3 | 1 | 5 | 7 | |
| 1/3 | 1/5 | 1 | 3 | |
| 1/5 | 1/7 | 1/3 | 1 |
Table 6.
Indicator weights of the different methods.
| AHP method | 0.2633 | 0.5579 | 0.1219 | 0.0569 |
| PCA method | 0.3193 | 0.2983 | 0.3219 | 0.0605 |
| Integrated method | 0.2913 | 0.4281 | 0.2219 | 0.0587 |
Table 7.
The results of the classification.
| Category | Sector Name |
|---|---|
| Class 1 | Processing of Petroleum, Coking, and Processing of Nuclear Fuel |
| Manufacture of Raw Chemical Materials and Chemical Products | |
| Manufacture of Non-metallic Mineral Products | |
| Smelting and Pressing of Ferrous Metals | |
| Smelting and Pressing of Non-ferrous Metals | |
| Production and Supply of Electric Power and Heat Power | |
| Class 2 | Mining and Washing of Coal |
| Extraction of Petroleum and Natural Gas | |
| Mining and Processing of Ferrous Metal Ores | |
| Mining and Processing of Non-Ferrous Metal Ores | |
| Mining and Processing of Nonmetal Ores | |
| Manufacture of Paper and Paper Products | |
| Manufacture of Chemical Fibers | |
| Manufacture of Textile | |
| Manufacture of Rubber and Plastics Products | |
| Class 3 | Manufacture of Computers, Communication, and Other Electronic Equipment |
| Manufacture of Transport Equipment | |
| Manufacture of Electrical Machinery and Apparatus | |
| Processing of Food from Agricultural Products | |
| Manufacture of Special Purpose Machinery | |
| Manufacture of General Purpose Machinery | |
| Manufacture of Metal Products | |
| Manufacture of Medicines | |
| Manufacture of Textile, Wearing Apparel, and Accessories | |
| Manufacture of Foods | |
| Class 4 | Leather, Fur, Feather, and Its Products |
| Manufacture of Furniture | |
| Printing and Reproduction of Recording Media | |
| Manufacture of Measuring Instruments and Machinery | |
| Other Manufacture | |
| Utilization of Waste Resources | |
| Production and Supply of Water | |
| Manufacture of Tobacco | |
| Manufacture of Articles for Culture, Education, and Sport Activity | |
| Processing of Timber | |
| Production and Supply of Gas | |
| Manufacture of Beverages |
© 2019 by the authors. Licensee MDPI, Basel, Switzerland. This article is an open access article distributed under the terms and conditions of the Creative Commons Attribution (CC BY) license (http://creativecommons.org/licenses/by/4.0/).
Share and Cite
MDPI and ACS Style
Zhou, J.; Li, Y.; Huo, X.; Xu, X. How to Allocate Carbon Emission Permits Among China’s Industrial Sectors Under the Constraint of Carbon Intensity? Sustainability 2019, 11, 914. https://0-doi-org.brum.beds.ac.uk/10.3390/su11030914
AMA Style
Zhou J, Li Y, Huo X, Xu X. How to Allocate Carbon Emission Permits Among China’s Industrial Sectors Under the Constraint of Carbon Intensity? Sustainability. 2019; 11(3):914. https://0-doi-org.brum.beds.ac.uk/10.3390/su11030914
Chicago/Turabian StyleZhou, Jianguo, Yushuo Li, Xuejing Huo, and Xiaolei Xu. 2019. "How to Allocate Carbon Emission Permits Among China’s Industrial Sectors Under the Constraint of Carbon Intensity?" Sustainability 11, no. 3: 914. https://0-doi-org.brum.beds.ac.uk/10.3390/su11030914
Note that from the first issue of 2016, this journal uses article numbers instead of page numbers. See further details here.