Article

Water Availability Assessment of Shale Gas Production in the Weiyuan Play, China

1
Key Laboratory of Water Cycle & Related Land Surface Processes, Institute of Geographic Sciences and Natural Resources Research, Chinese Academy of Sciences, Beijing 100101, China
2
University of Chinese Academy of Sciences, Beijing 100049, China
3
State Key Laboratory of Water Resources & Hydropower Engineering Sciences, Wuhan University, Wuhan 430000, China
4
PetroChina Research Institute of Petroleum Exploration and Development, Beijing 100083, China
5
Yangtze Valley Water Environment Monitoring Center, Wuhan 430010, China
*
Authors to whom correspondence should be addressed.
Sustainability 2019, 11(3), 940; https://0-doi-org.brum.beds.ac.uk/10.3390/su11030940
Submission received: 17 January 2019 / Revised: 3 February 2019 / Accepted: 5 February 2019 / Published: 12 February 2019

Abstract

:
Innovations and improvements in hydraulic fracturing and horizontal well technologies have contributed to the success of the shale gas industry; however, the industry is also challenged by freshwater use and environmental health issues, and this makes precise quantification of water consumption important. The objective of this study was to better understand water sustainability and availability of the projected shale gas from 2018 to 2030 in the Weiyuan play, China. The water footprint framework was used to quantify the potential water use and environmental impacts on different time scales. The results showed that the water use per well ranged from 11,300 to 60,660 m3, with a median of 36,014 m3, totaling ~ 3.44 Mm3 for 97 wells. Yearly evaluation results showed that the gray water footprint was the main contributor and accounted for 83.82% to 96.76%, which was dependent on the different treatment percentage scenario. The monthly environmental impact results indicated that the annual streamflow statistics were more likely to prevent water withdrawal. Water quality issues may be alleviated through recycling and retreatment measures that improve current waste water management strategies. Resource regulators should manage their water resources by matching water demand to water availability or replenishment.

1. Introduction

Fossil fuels (especially coal and oil) account for 65% of carbon emissions [1], and China is a country with a fossil-based energy system (Figure A1), which has committed to peak its carbon emissions by 2030 at the Paris climate change agreement [2]. Fuel switching is a pivotal and vital way to mitigate climate change and environmental pollution [3,4]. Shale gas, a clean-burning and efficient energy resource, has become a hot topic, particularly in regard to the advantages of reducing a country’s overdependence on high-pollution energy resources [3,5,6]. China’s shale gas reserves are 31.57 trillion m3, ranking first in the world’s shale gas reserves, and these are the largest global reserves of technically recoverable shale gas [7,8]. Shale gas is a promising option for China’s decarbonized energy transition with respect to carbon emission reduction and abundant reserves. The Chinese government is focused on shale gas production development and has also set a target to increase the annul shale gas production from 30 billion m3 in 2020 to 100 billion m3 in 2030 [9].
The vigorous innovation and reform improvements in horizontal wells and hydraulic fracturing (HF) technologies have contributed to the flourishing development of the shale gas industry, while they also have caused environmental issues, including both water scarcity and contamination [10,11,12,13,14]. Nowadays, the main source of HF water is from regional water resources, and the volume of water used is increasing and place growing demands on regional water, which may cause a conflict with regional water consumption activities, such as irrigation and industrial water use [15]. Water scarcity may be a limiting factor for sustainable shale gas development, not only in semiarid regions globally but also in seasonally water-deficient areas in more humid settings [16,17]. In addition, water contamination caused by wastewater disposal, and determined by the volume and quality of flowback and produced (FP) water generated from shale gas wells, has also captured global attention [18,19,20]. Furthermore, water quality degradation is related to water depletion, and the problem of water quality can be expected to intensify as water scarcity increases.
Water footprint assessment (WFA) is a widely used analytical tool for quantifying the water quantity and quality impacts [21,22]. The water footprint quantitatively evaluates water pollution and can more intuitively reflect the impact of water pollution on the amount of water availability [22]. Previous studies have evaluated the water footprint of the shale gas industry and provided a wide range of water use, while they mostly focused on water consumption volume [23,24,25], and few studies have quantified the volume of wastewater influence generated from shale gas production in detail.
Some studies have attempted to evaluate the water issues regarding the sustainability of shale gas development in the Sichuan Basin [26,27,28,29,30]. However, due to the lack of detailed onsite data, most of them focused on roughly evaluation of water use and production, only a limited number of recent studies provide onsite data on HF water use [26,27,28,29,30,31]. This study builds on previous work in the major China Sichuan Basin and aims to focus on water use and wastewater generation and their impacts on local water resources by providing actual and systematic data on shale gas production. The water issues in-depth evaluation could provide valuable insights for managing water use and the shale gas sustainability industry. We also evaluate water use on the county and province scales.
The Sichuan Basin is China’s largest and most productive and economically viable shale gas basin, accounting for 40% of the country’s shale reserves [27,28,30,32,33] (Figure 1). China’s first vertical shale gas well and horizontal well are in the Weiyuan play. The Weiyuan play is an ideal case study because it has the most complete geological, engineering, and economic information with an adequate history and detailed records on water use and gas and FP water production.
The objectives of this study were to evaluate: 1) the historical trends in water use for HF and FP water; 2) the future trends in HF water demand and FP water in 2020 or 2030; and 3) strategies for water use supply and management for FP water in regional shale gas plays. The data used in this study were from the Weiyuan play in southern Sichuan Basin (Figure 1).

2. Materials and Methods

2.1. Site Description

The Weiyuan shale gas play, one of the Chinese national shale gas demonstration zones, is the forerunner field for shale gas exploration in China. Encompassing an area of approximately 6500 km2. As much of the production is mainly from Weiyuan County (Figure 1), Weiyuan County was the focus for the current water supply and demand analysis in this study. The climate is a type of mid-subtropical humid climate, with an annual average precipitation of 1091.22 mm and evaporation of 603.68 mm. The annual mean temperature is 17.30 °C. Approximately 81.7% of the rainfall of the year is concentrated from May to October. The primary surface water source is the Weiyuan River, a tributary of the Yangtze River.
The Weiyuan shale discovery well was drilled in 2010, and today there are more than 150 wells drilled and nearly 100 shale gas wells currently producing. Thousands of wells may be drilled and hydraulically fractured in the coming decades. The Upper Ordovician Wufeng Formation to Lower Silurian Longmaxi Shale Formation have revealed ample shale gas resources and are the primary target formations in the field. These formations occur at depths of 1.5–4.5 km, with an average thickness of 35 - 40 m.

2.2. Data Collection and Analysis

The Weiyuan play is the first shale gas exploration field in Sichuan Basin, China. The data used to analyze Weiyuan’s shale gas development were from an onsite production database, which is recorded and stored by Petro China (Petro China is a Chinese state-owned oil and gas company and is the China’s second biggest oil producer.), the Weiyuan field operator. Gas/water production data from between August 2011 and December 2017, encompassing a total of 97 shale gas wells, were collected and analyzed. The sampled wells are represented as purple dots in Figure 1. Evaporation, precipitation, and temperature data from 1960 to 2017 were sourced from the China meteorological data network (http://data.cma.cn/data/detail/dataCode/). The and energy consumed were sourced from the Statistical Yearbook of China. The streamflow daily records data were derived from Hydrological Yearbooks published by the Hydrologic Bureau of the Ministry of Water Resources of China.

2.3. Water Footprint Assessment

The water footprint framework, widely used for quantifying water quantity and quality impacts, was used to obtain a better understanding of the potential water and environmental impacts caused by the shale gas industry [34]. This study calculated the water footprint and evaluated the impact of expected shale gas expansion based on field data and the projected energy plan from 2018 to 2030; this study focused on water footprint accounting and environmental sustainability assessment.

2.3.1. Water Footprint Accounting

Water footprint accounting includes the blue water footprint (WF-blue, directly measured actual water volume consumed), green water footprint (WF-green, associated with precipitation), and gray water footprint (WF-gray, indirectly measured water volume required to assimilate pollutants in wastewater generation). Because very small amounts of rainwater is consumed in the shale gas industry, the water footprint accounting used in the shale gas industry only includes WF-blue and WF-gray. Data for the water footprint calculations were derived from the available records and verified by Petro China.

Blue Water Footprint (WF-blue)

WF-blue is the water volume actually consumed by each well and was calculated by summing the drilling, equipment maintenance and HF water volume based on the actual field data. This analysis assumed that none of the FP water was treated for reuse for the development of new wells or any other beneficial reuse [35]. WF-blue was calculated as follows [34]:
WF-blue = HF water + Drilling water + Equipment maintenance water

Gray Water Footprint

WF-gray evaluates the water volume needed to assimilate the pollutant load of the wastewater discharge, and it is an indicator associated with the water pollution process. According to the Water Footprint Evaluation Manual, the gray water footprint is determined by the pollutants that need the most dilution; thus, the WF-gray is calculated by [34]:
WF-gray = max[WF1-gray, …, WFi-gray]
where WF-gray is the total gray water footprint, m3; and WFi-gray is the gray water footprint of the i-th pollutant, m3.
FP water discharge was directly released into the fixed drainage pipes, without partial loss of pollutants, which could be considered point source pollution. And the load can be estimated by measuring the effluent volume and the concentration of a chemical in the effluent. Thus, the calculation is as follows [34]:
W F i g r a y = L i C i m a x C i n a t
where WFi-gray is the gray water footprint of the i-th pollutant, m3; Li is the emission of the i-th pollutant; and Ci-max (kg/m3) is the maximum mass concentration of the i-th pollutant allowed by the local water quality environmental standard of the discharge zone and calculated with reference to the Chinese ambient water quality standards to evaluate the ability of the receiving water body [34]. The Class III water quality standard of the Surface Water Environmental Quality Standard of China (GB3838-2002) was the maximum concentration allowed by the water quality environmental standard. Ci-nat (kg/m3) is the natural concentration of the i-th pollutant in the receiving water body. Due to the lack of basin-specific natural background concentration data and to keep WF-gray conservative, the Ci-nat value was assumed to be zero for the analysis [34]. The gray water footprint of a pollutant is determined by the emissions of the pollutant, the initial concentration in the water, and the allowable concentration. A summary of the collected FP water quality data sources is presented in Table A1 (Appendix A.1).

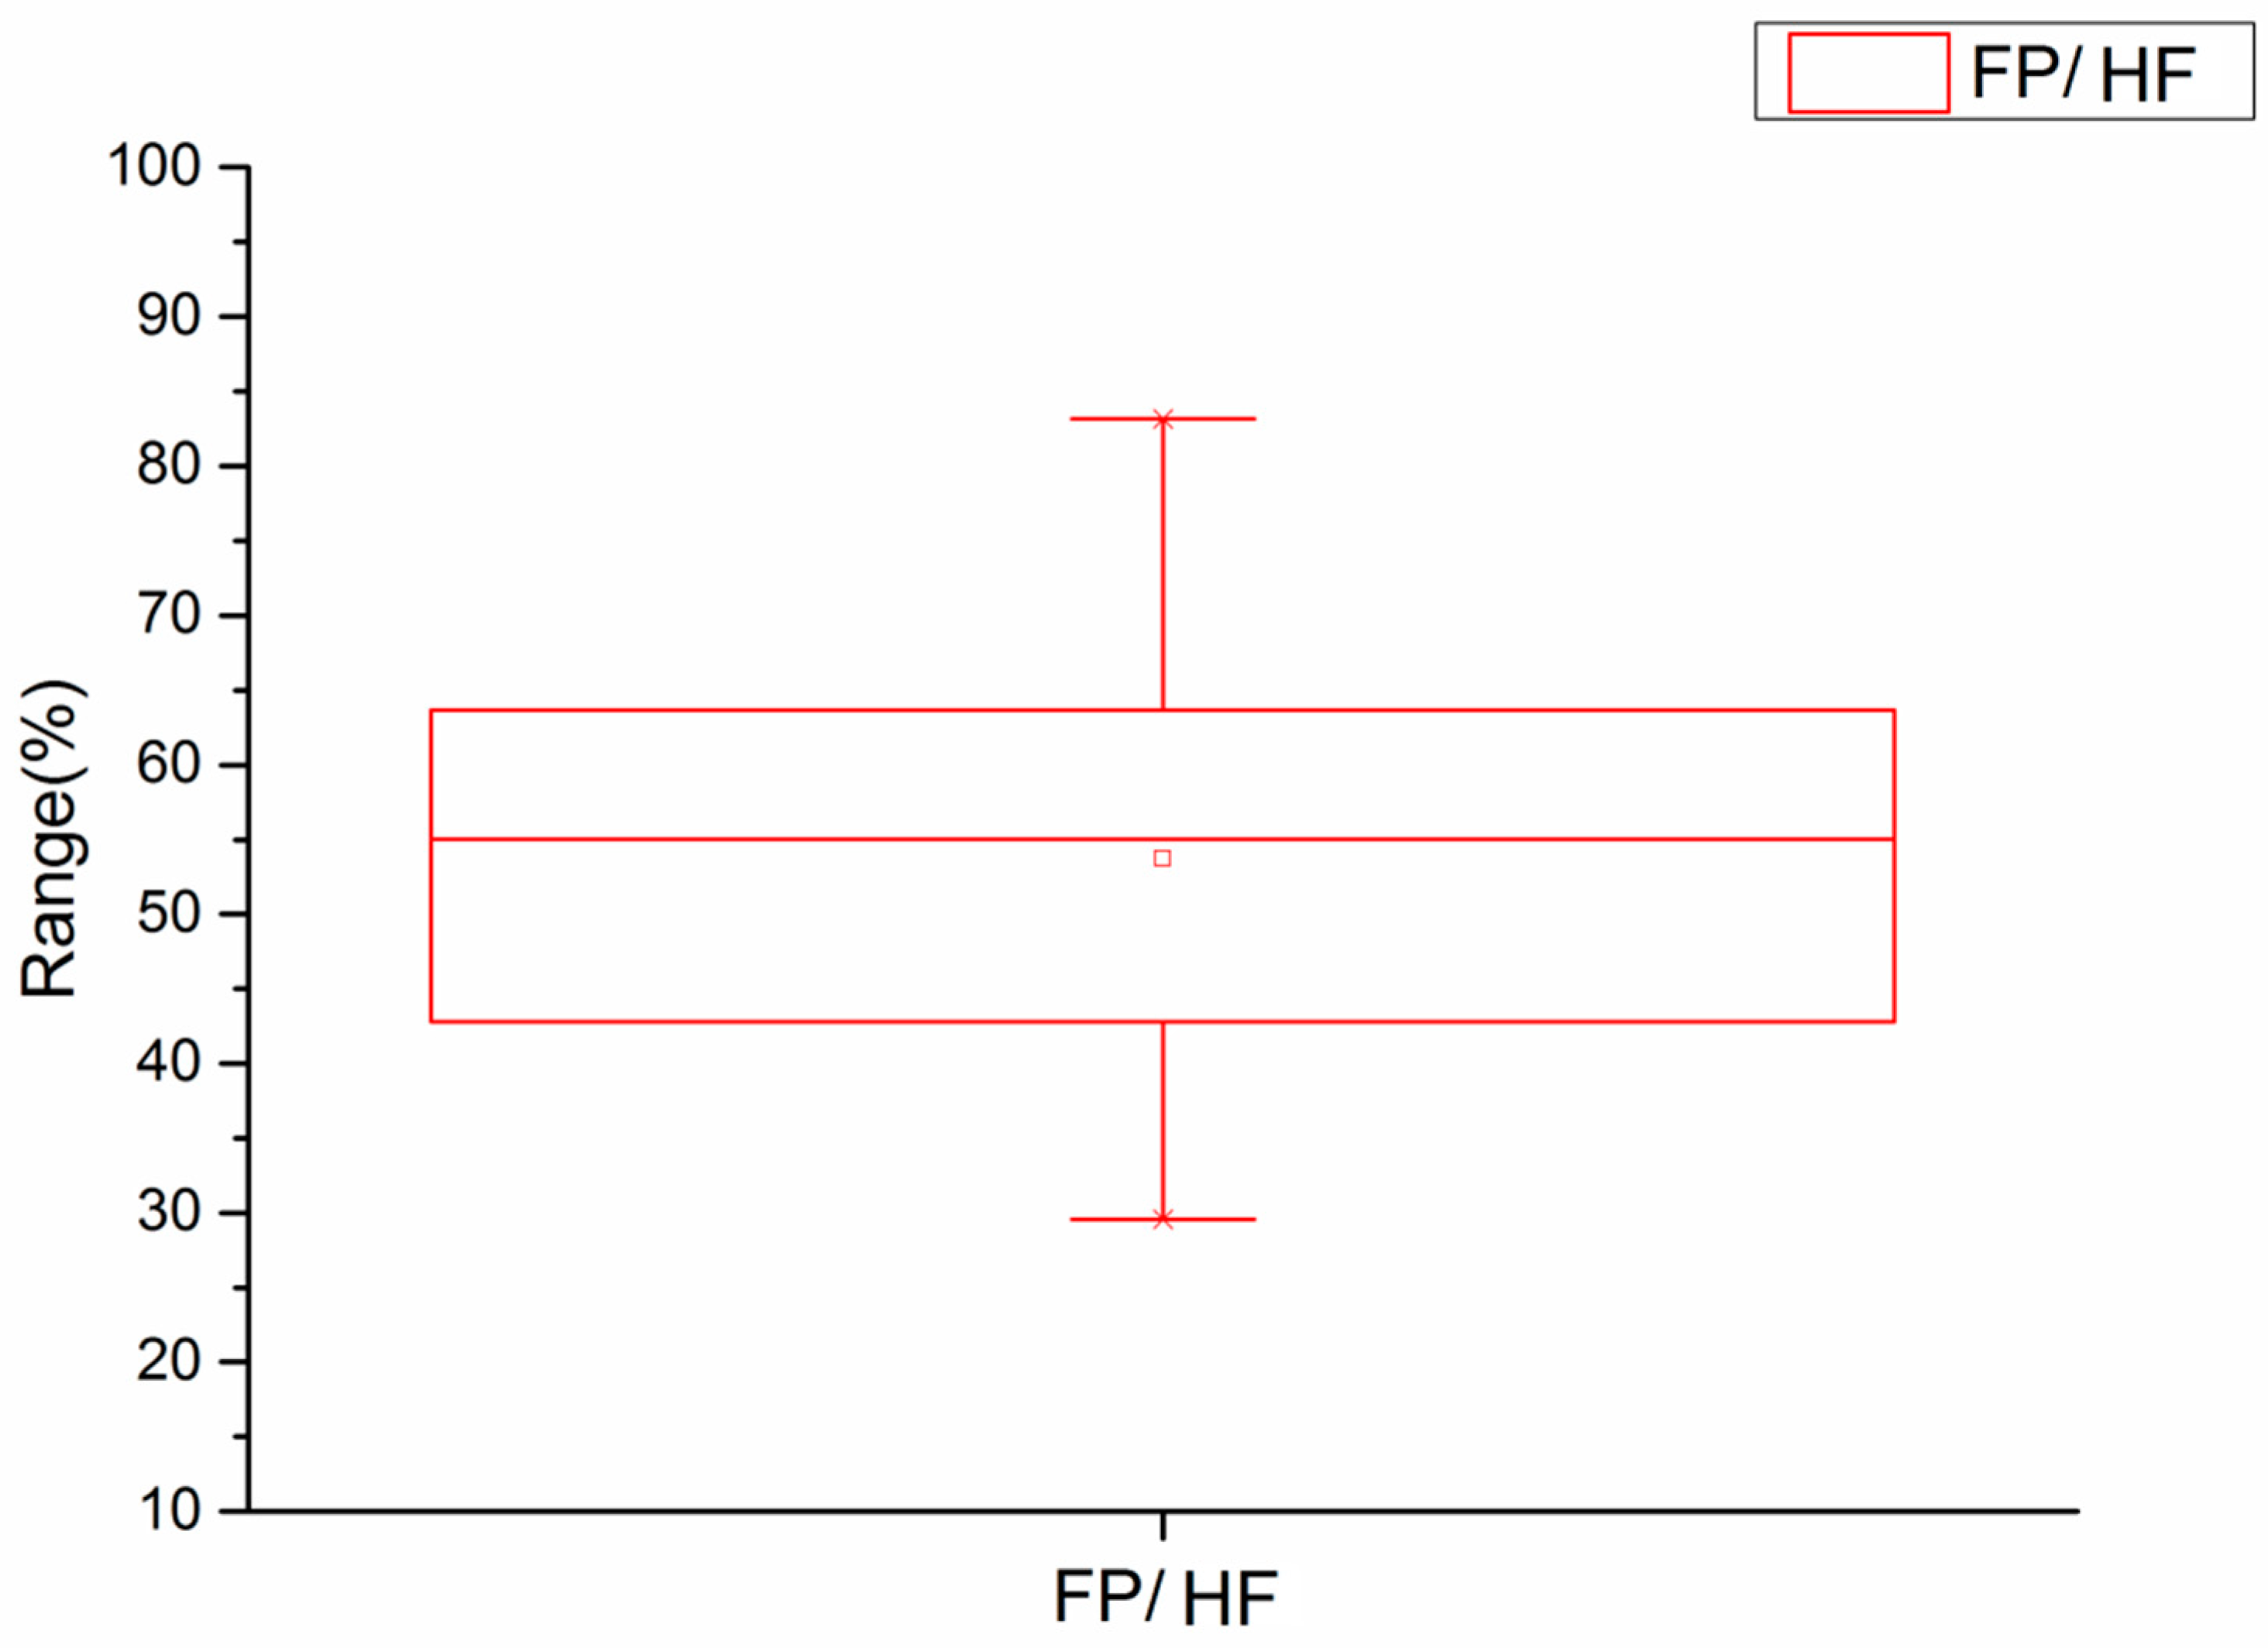
Scenarios for FP Water Recycling and Reuse

Equation 3 shows that the WF-gray volume is linearly correlated with the mass of pollution with respect to the volume of the FP water. After treatment and recycling or reuse, the volume of the FP water may be reduced. In the field investigation, most of the FP water returning to the surface was processed by an onsite treatment facility, and approximately 50–80% of the FP water generated was recycled or reused. Given that up to 50–80% of the FP water was estimated to be recycled, the actual returned and discharged liquid was set to calculate the volume of the gray water in different scenarios: (1) the returned liquid is directly discharged without treatment (Scenario A); (2) 50% of the total liquid volume is recycled (Scenario B); and (3) the amount of recycled liquid discharged reaches 80% of the total liquid volume (Scenario C). The calculation results of WF-gray in the different scenarios are listed in the following Results section.

2.3.2. Sustainability Assessment

Environmental Sustainability of WF-blue Scarcity

WS-blue (an indicator of the sustainability of WF-blue scarcity) refers to the shortage of water resources for local water consumption in this study, and it can be expressed as the ratio of the blue water footprint to the available blue water. Because water consumption for the Weiyuan play is mainly withdrawal from the Weiyuan River, the amount of blue water availability (WA-blue) is calculated as the natural runoff (Rnat) minus environmental flow requirements (EFR) [34].
WA-blue = Rnat-EFR
W S b l u e = W F b l u e W A b l u e
WS-blue is equal to or greater than 100%, which means that WF-blue exceeds WA-blue and that WA-blue has been fully consumed and is not sustainable.
Due to the poor streamflow gauging stations and the lack of consistent and long-term records of streamflow observations, flood frequency analysis was difficult in the Weiyuan River. Precipitation is less affected by human activities and could be used for improving the 7Q10 model for the EFR assessment (Appendix A.2; hereafter, 7Q/75% model). The results showed that the reference year was 2015 with an annual precipitation of 1075.78 mm; thus, the streamflow in 2015 was the representative hydrological year.

Environmental Sustainability of the WF-gray Pollution Level

The water pollution level (WPL) is an indicator of the sustainability of WF-gray, and it is the ratio of WF-gray to the actual runoff (Ract) of the catchment. WPL refers to the shortage of water resources caused by pollutant discharge [34]:
W P L = W F g r e y R a c t
where WF-gray is the gray water footprint and Ract is the actual runoff. WPL is the sustainability criteria level of WF-gray. If WPL > 100%, the available water resources are not sufficient to assimilate pollutants and the catchment is not sustainable. Since the streamflow in 2015 was selected as the representative hydrological year, it has also been used for Ract calculated in WF-gray sustainability evaluation.

3. Results and Discussion

The onsite historical water use and shale gas production range from 2015 to 2017 in the Weiyuan play was analyzed, and the potential impacts of shale gas production on local water resources and future trends from 2018 to 2030 under the plans of Petro China and China’s policy were also estimated by the water footprint model. This study included an estimate of future water need and FP water volumes based on the future well inventory by 2020 and 2030 under the plans of Petro China and China’s policy projections derived from ~ 3 years of historical onsite field data (from 2015 to 2017). WFA is a useful tool to quantify local water consumption from a water quantity and quality perspective to evaluate local water resource sustainability and to identify options for time-dependent water adjustment and management.

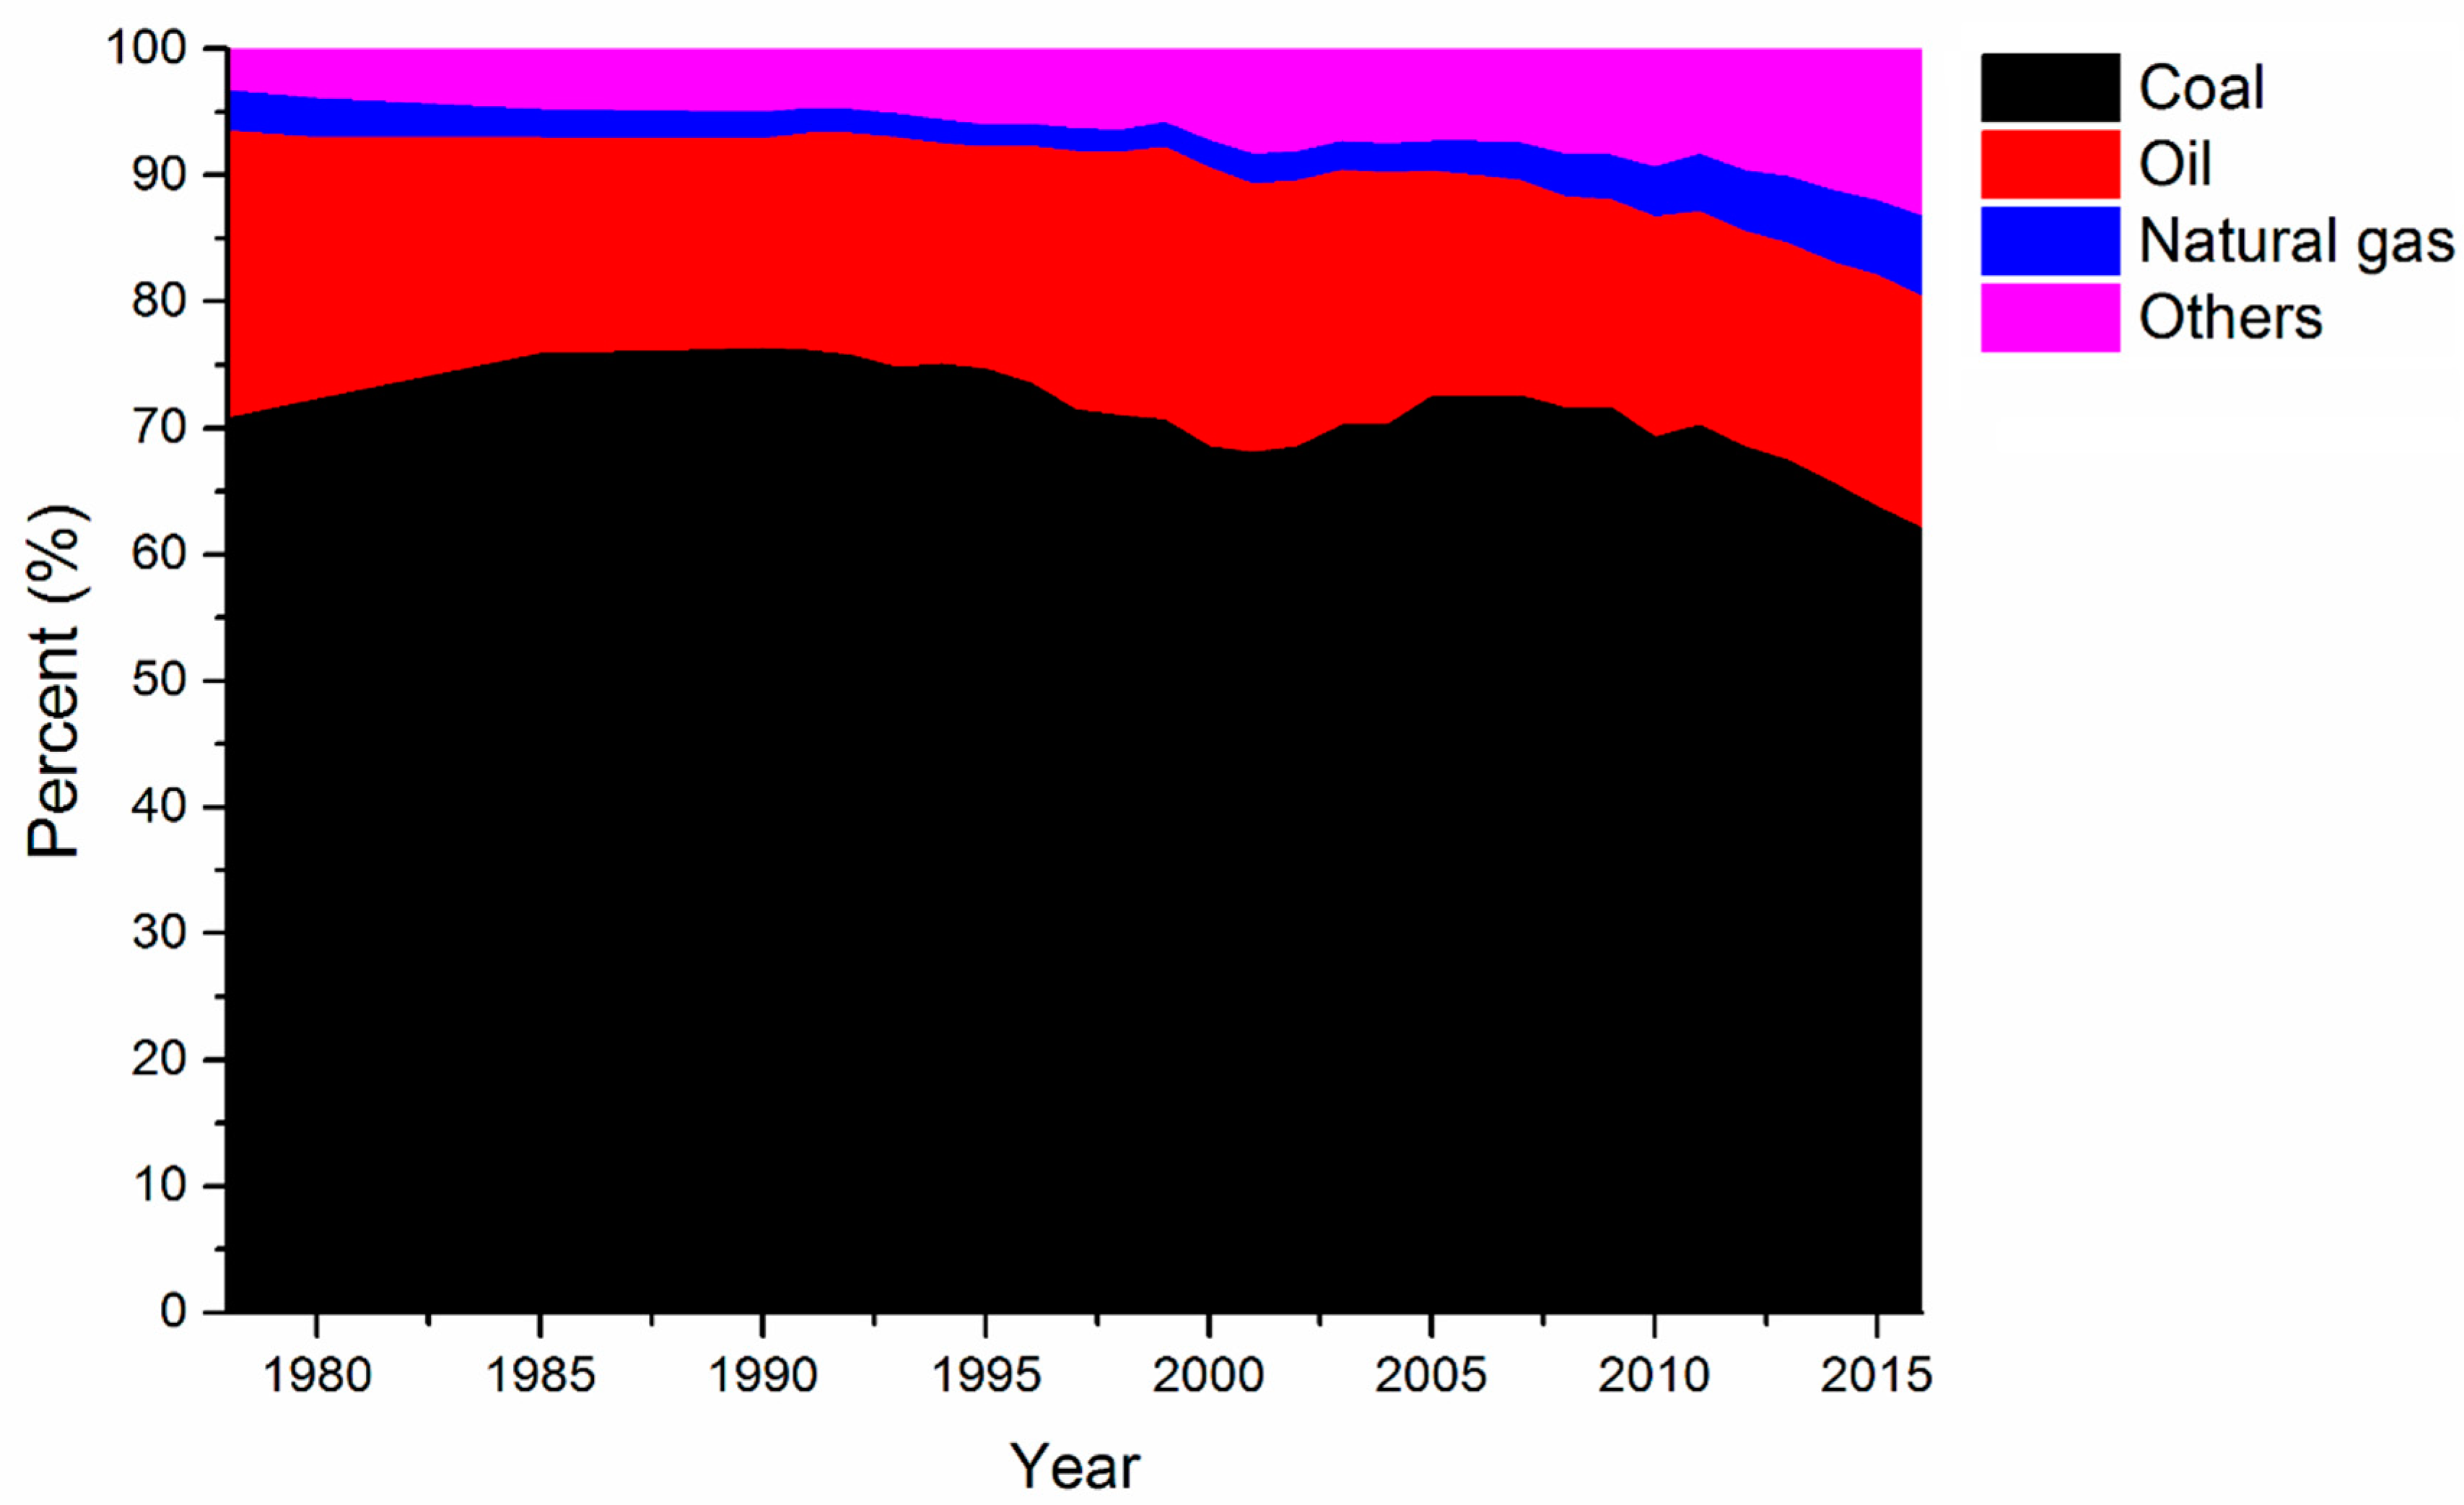
3.1. Energy Use Recovery

Monthly median gas production rates (m3 per day) were calculated from shale gas wells in the Weiyuan gas field over the first 31 months of production (Figure 2). Decline curves were developed for shale gas production to determine the estimated ultimate recovery (EUR). Due to the characteristics of shale formation, the EUR assumes that the wells will be productive for a 30-year period [35]. The EUR of a gas production without any restimulation was assumed to be between 0.33 and 0.49 million m3 per well, with a median of 0.41million m3 per well and a mean of 0.46 billion m3/well (Appendix A.3). The projected number of future wells in Weiyuan play can be inferred by the Petro China’s annual production goals of 5 billion m3 by 2020 and 2030, respectively (Appendix A.4); the number of projected wells in the production period (2018 ~ 2020) should be approximately 225, an average of 75 wells per year, and the new production wells in the stable production period (2021 ~ 2030) will be approximately 540, an average of 54 wells per year.

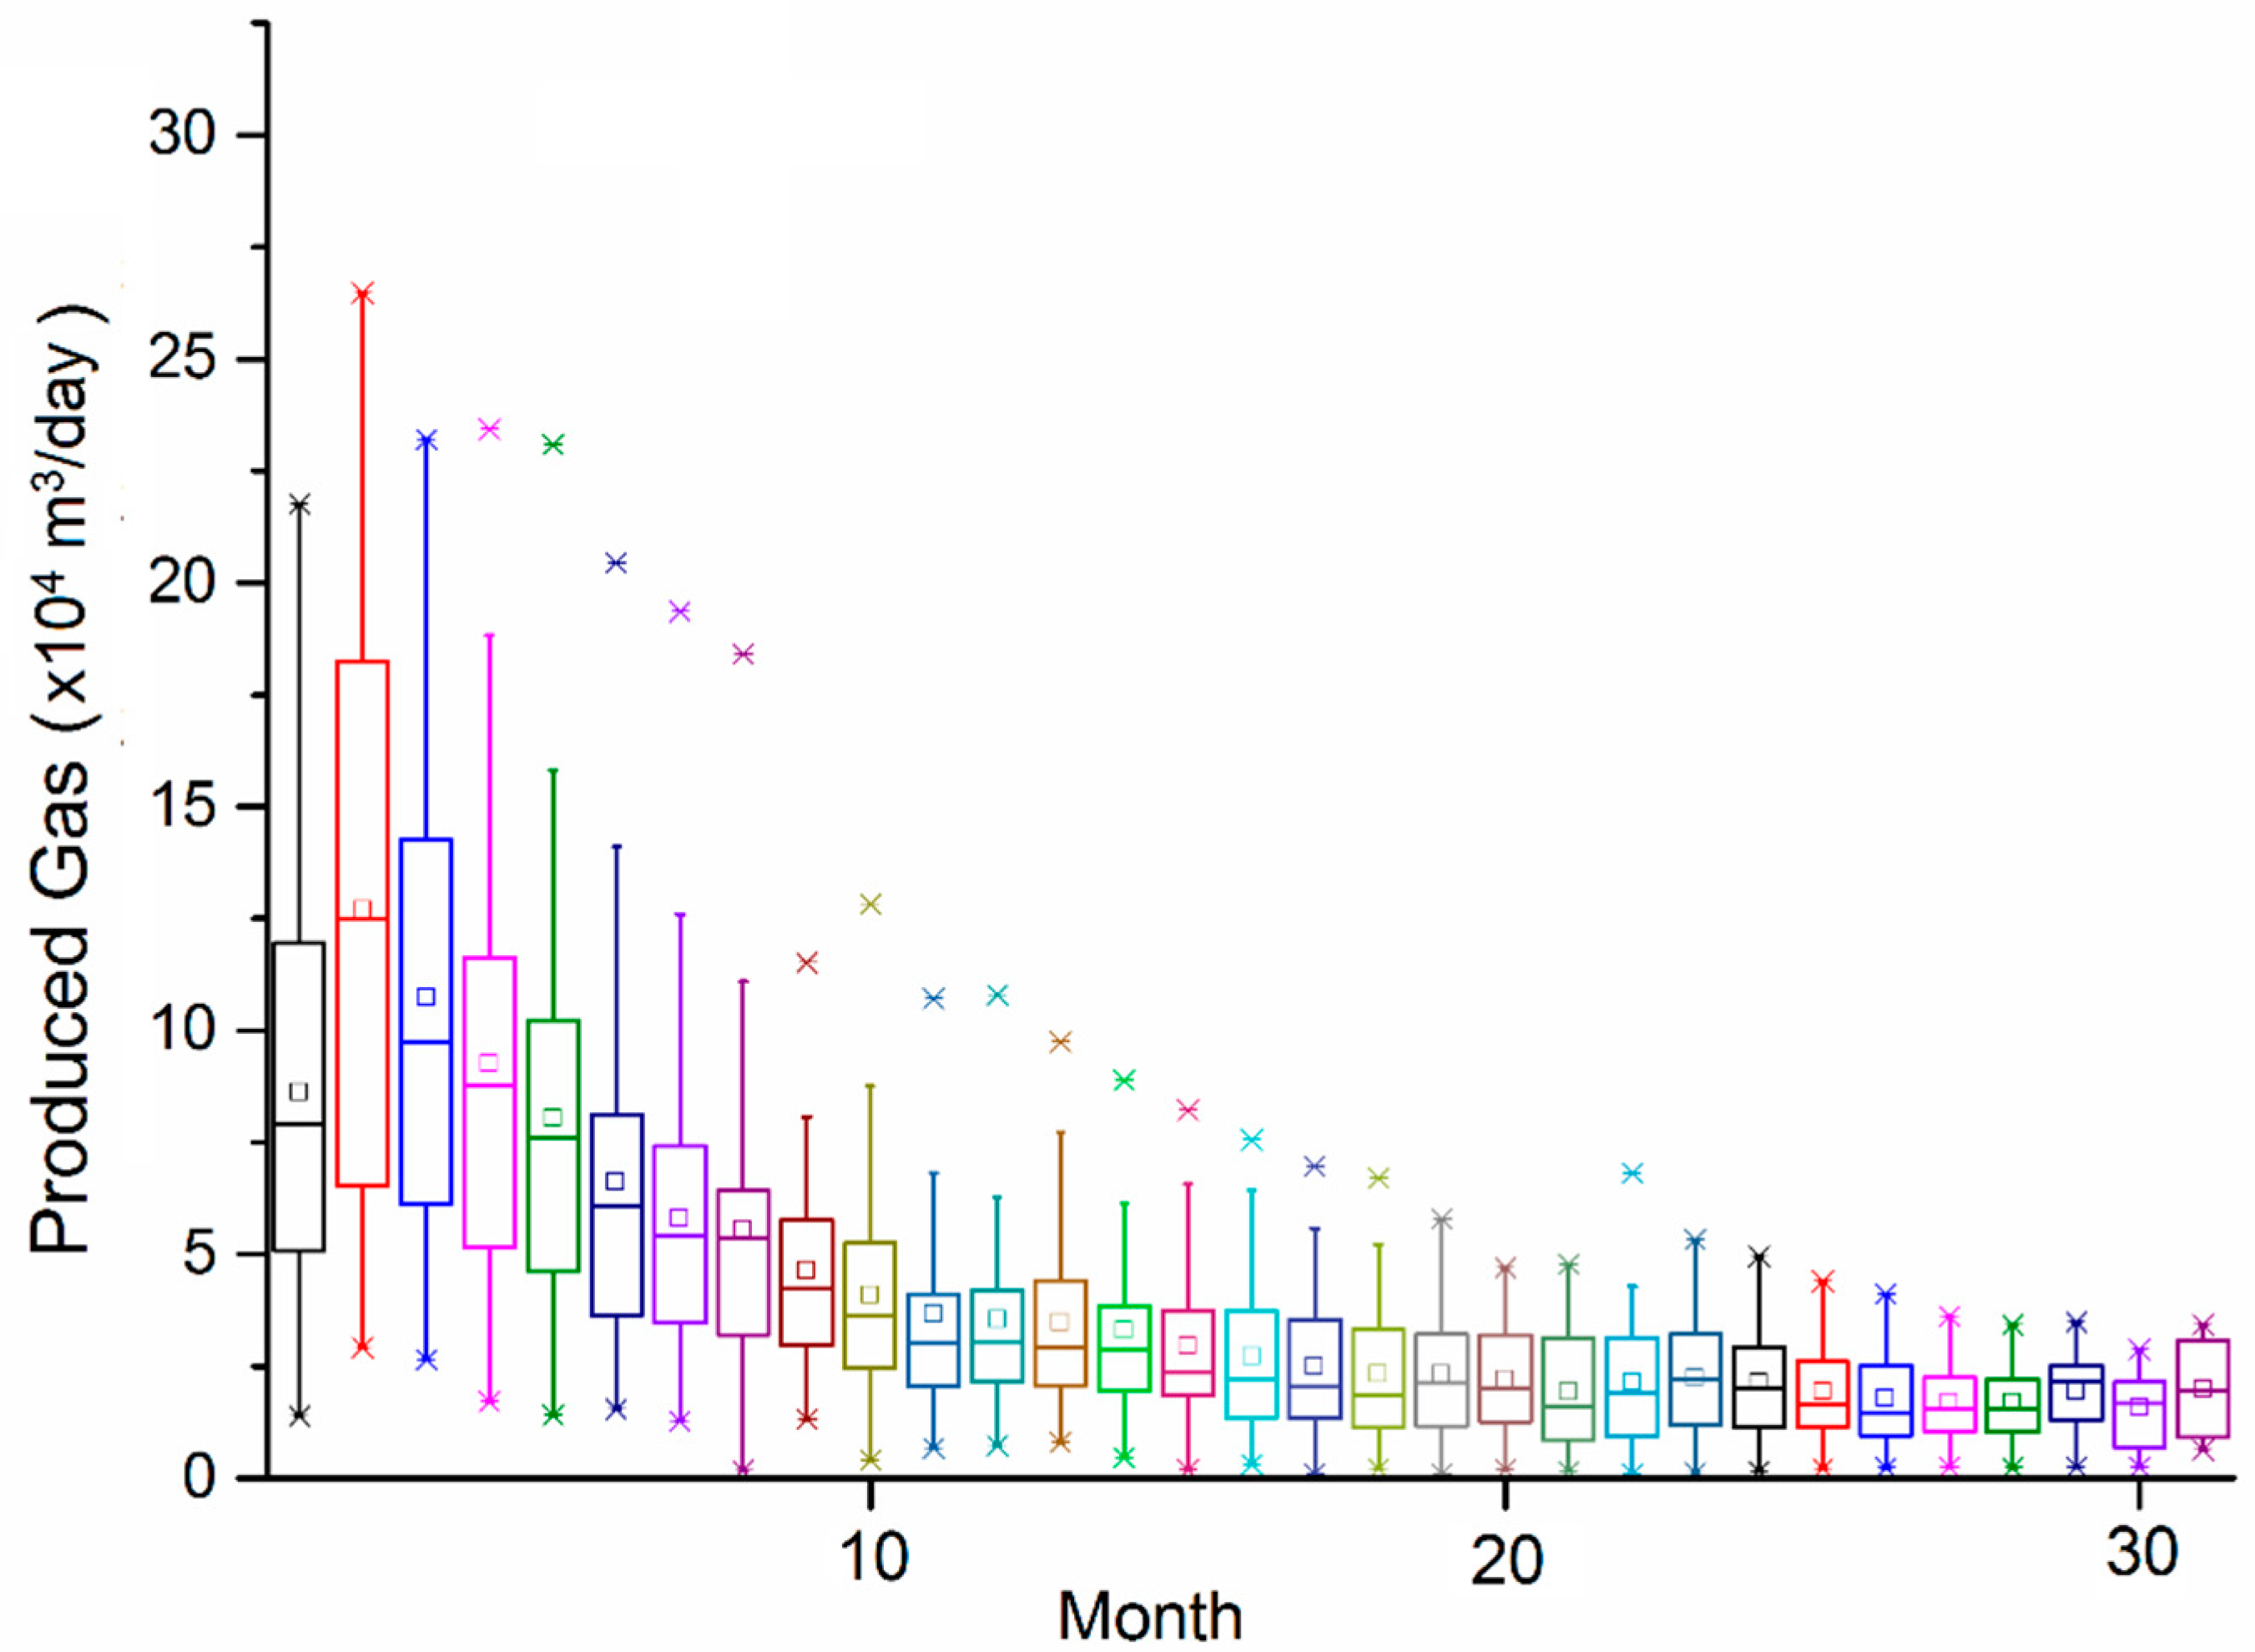
3.2. Water Use Trends
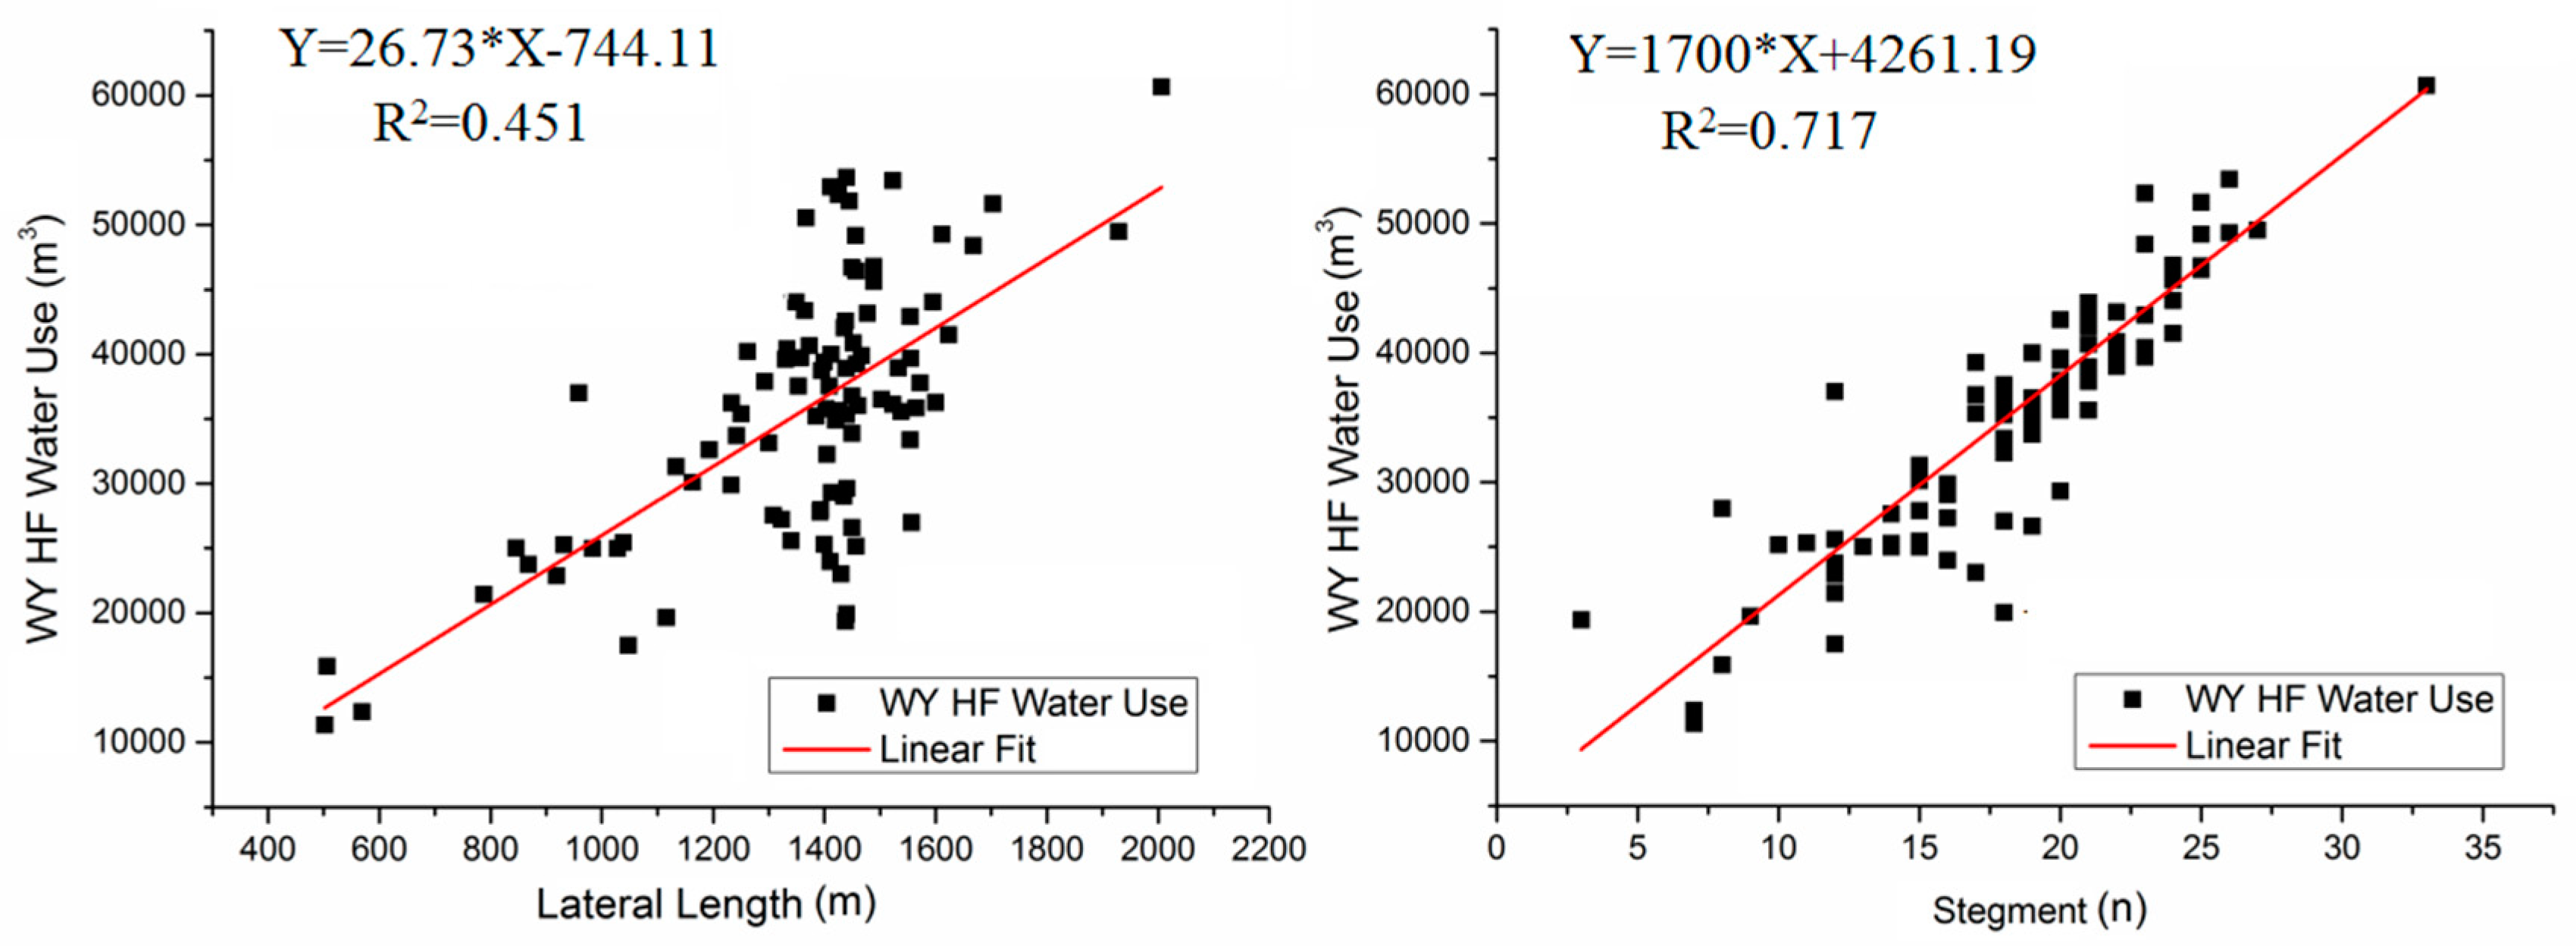
3.2.1. Water Use

Basic parameters such as fracturing fluid volume, horizontal lateral length, well depth and number of design segments were analyzed (Table 1). The depth of the shale gas wells ranged from 2677 m to 4380 m, with a median of 3678 m; the fractured horizontal lateral length was between 502 m and 2006 m, with a median of 1420 m; the number of design segments ranged from 3 to 33 segments, with a median of 20; and the injected fluid volume ranged from 11351.3 to 60664.73 m3/well, with a median of 36013.94 m3/well, similar to the average (35509.69 m3/well) (Table 1). Most of the injected fluid was composed of low-viscosity slick water.
Water intensity was employed for estimating HF water use per meter, and every segment was also calculated (Table 2). The volume of fracturing fluid ranged from 1107.60 to 6456.46 m3/segment, with a median of 1874.93 m3/segment; the average was approximately 1986.78 m3/segment; the volume of fracturing fluid per meter ranged from 13.47 to 38.59 m3, with a median of 25.88 m3, and the average was approximately 26.18 m3. The lengths of single horizontal segments ranged from 57.36 to 479.33 m, with a median of 71.44 m and an average of 79.87 m.
The comparative analysis showed that the mean injected fluid volumes increased from 32727.11 m3/well in 2015 to 37768.60 m3/well in 2017, and the mean water consumption per meter of the shale gas wells also increased from 24.23 m3/m in 2015 to 27.24 m3/m in 2017. The number of design segments also increased from 16 in 2015 to 21 in 2017 (Table 2). However, the lateral length, shale gas well depth and volume of fracturing fluid for a single fracturing segment were slightly different. The water intensity changed with the number of HF stages, and both the water consumption and energy recovery increased with more HF stages. These results may be related to factors of the fracturing technology and operators.
Linear regression analysis was carried out between water consumption for single well fracturing and the fractured horizontal lateral length and between water consumption for single well fracturing and the number of fracturing segments (Figure 3). Figure 3a shows the relationship between the fractured horizontal lateral length and the water consumption per well; the results show that the correlation coefficient R-Squared was 0.451, and the corresponding water intensity (I) was 26.73 m3/m. Figure 3b displays the relationship between water use per well and the number of stages; the correlation coefficient R-Squared was 0.717, and the corresponding slope coefficient was 1700.00 m3/segment. The correlation between water consumption for single well fracturing and the fractured horizontal lateral length was better than that between water consumption for single well fracturing and the number of fracturing stages. The result was likely related to the construction technologies, and the HF design may be on the segmented construction.
The results showed that HF construction may be more inclined to the number of segments to calculate the volume of the fracturing fluid. Thus, the linear regression model of single well fracturing water consumption to the fracturing segment was established. The current single-stage injection volume was normalized to a water intensity (I) of 1700 m3 per segment, plus an intercept value of 4261.19 m3 (Figure 3b).
Y = 1700*X + 4261.19
where Y is HF water consumption per well, m3 and X is the number of segments for each well.
Based on the estimated water intensity results and the Petro China technical plan for shale gas production, the total water demand for the development of the Weiyuan field was predicted. The wide range of water use values for individual wells can be accounted for by the number of HF stages. As the number of segments and horizontal length increase, the water use also increases.

3.2.2. Water Footprint Accounting

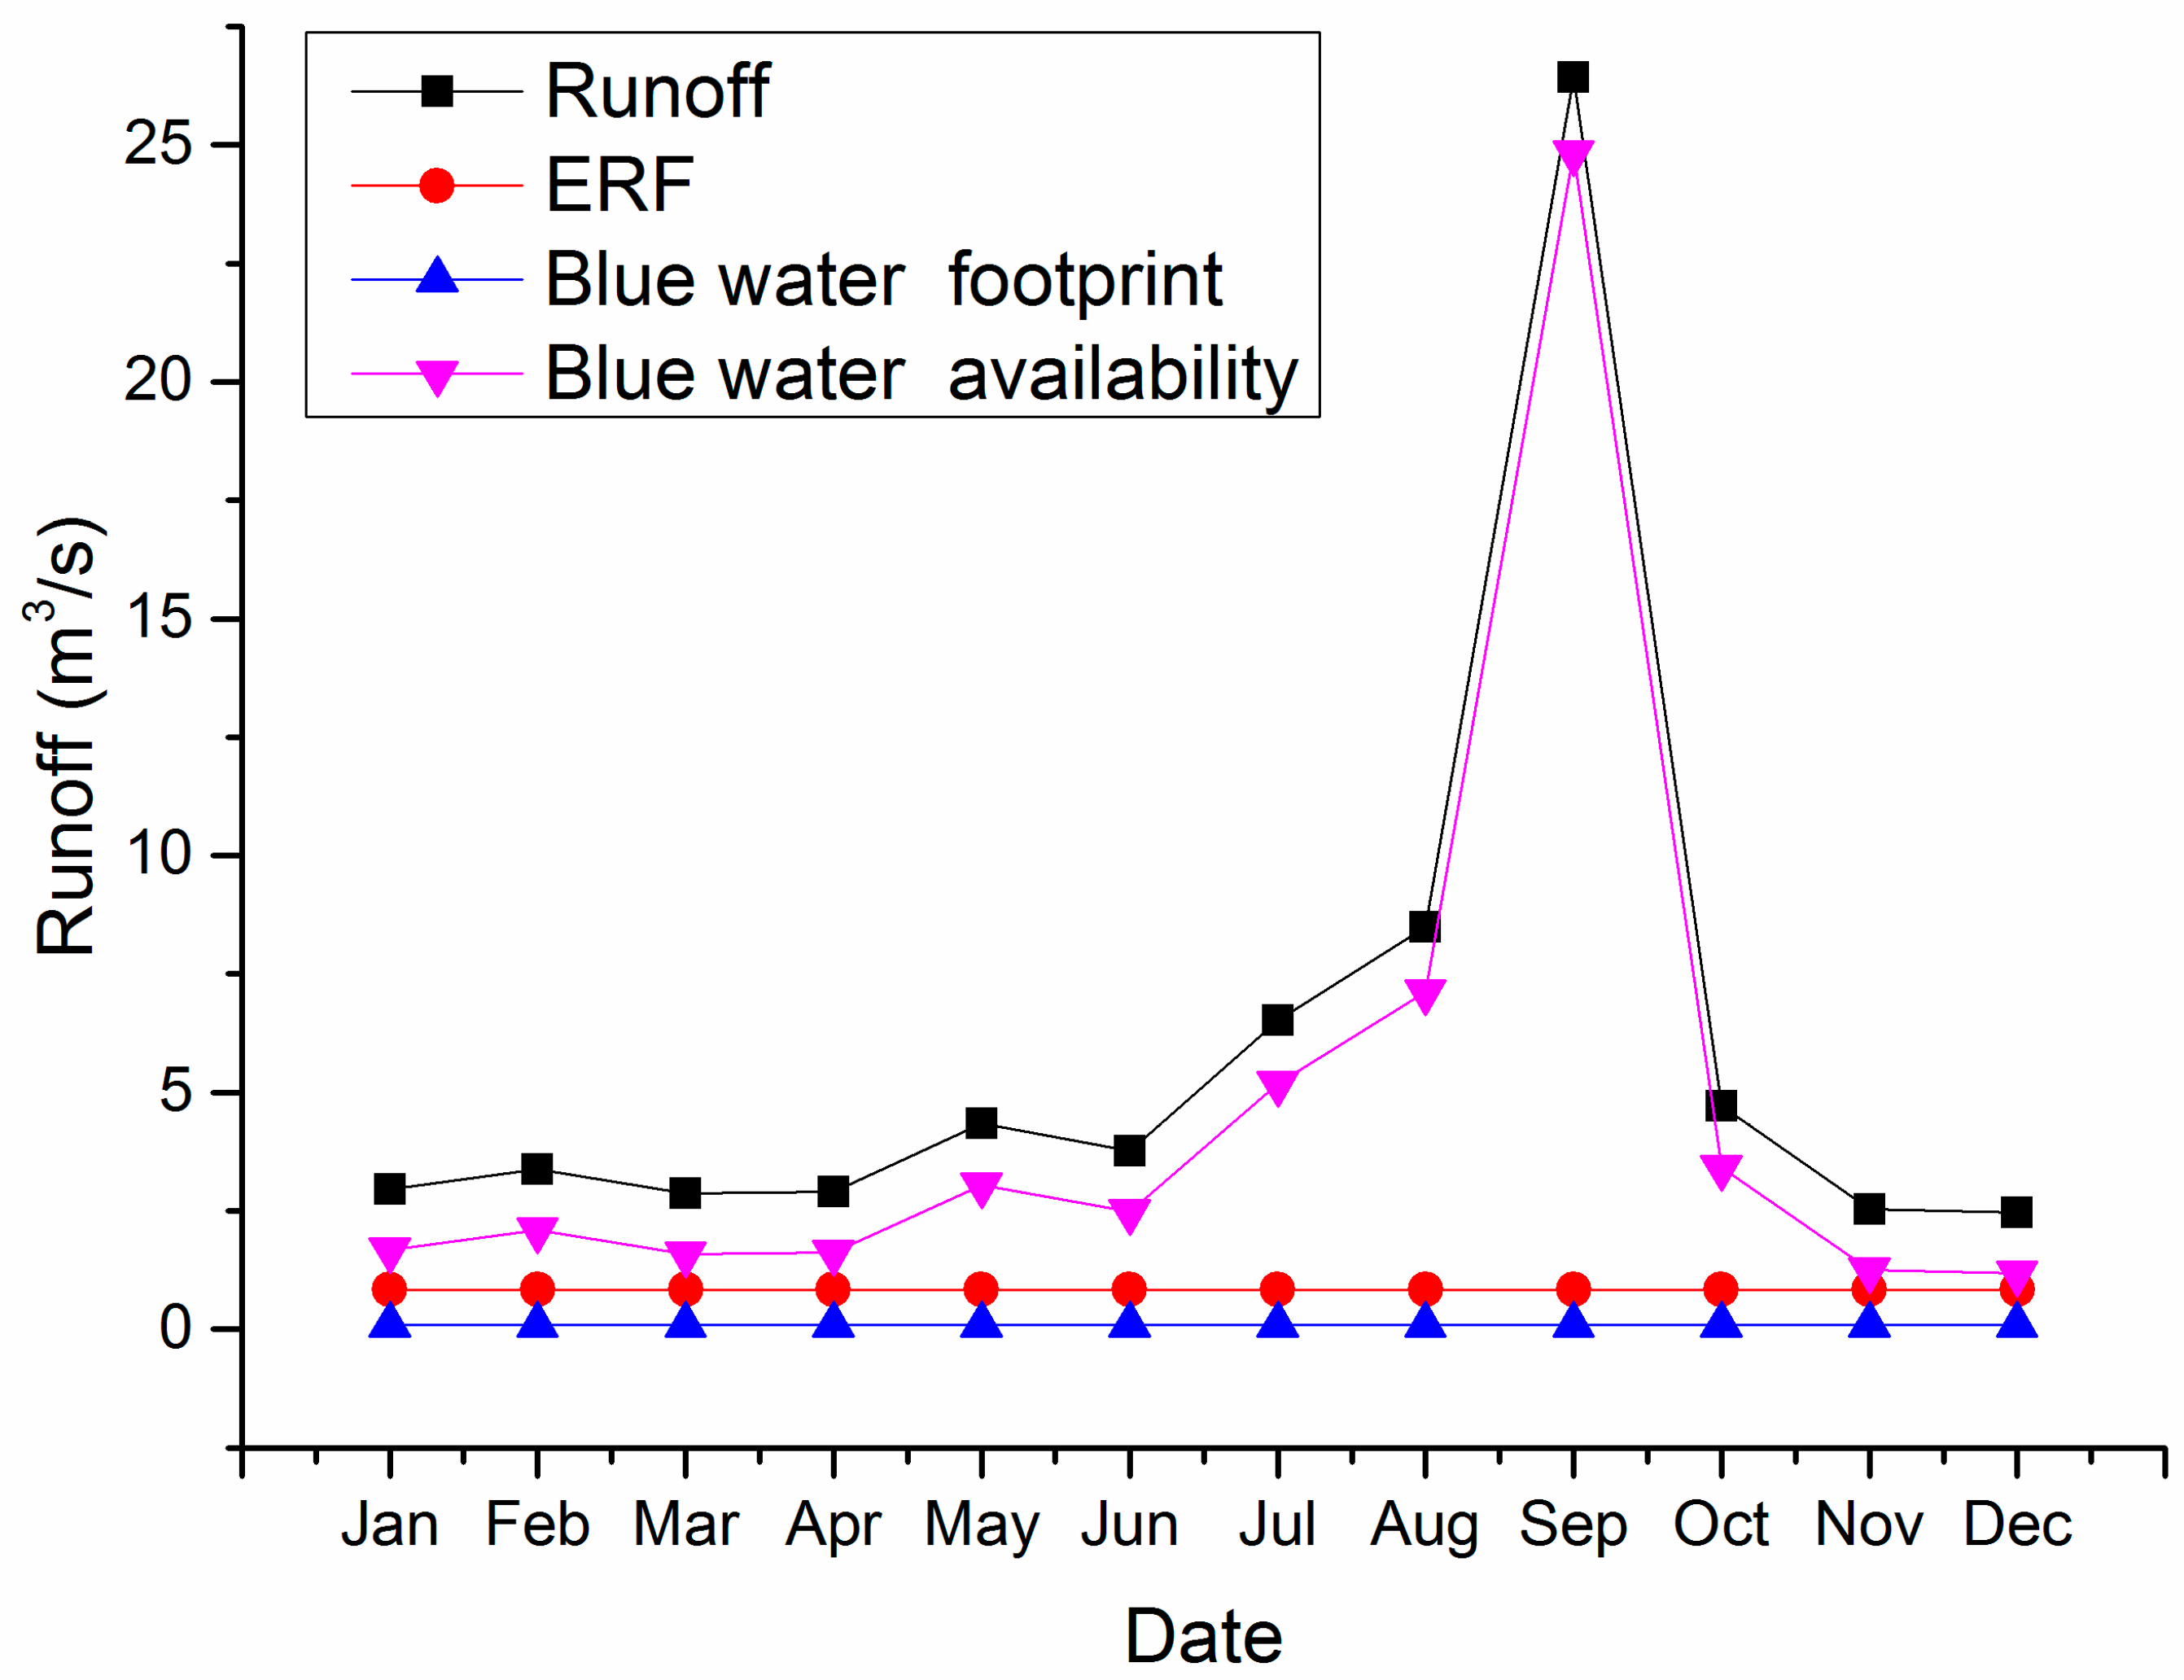
Evaluation of WF-blue during Shale Gas Production

The segment fluctuation tendency and the fractured horizontal lengths divided into 15 to 25 segments; most of them were focused in the range from 18 to 22. According to Equation 7, the water consumption for single well fracturing ranged from 29761.19 to 46761.19 m3. Based on the field data, WF-blue was the sum of the HF fluid volume (the main water-consuming activity), drilling water consumption and equipment maintenance water consumption. Based on the onsite data from 2015 to 2017, the water consumption of drilling and equipment maintenance accounted for a small proportion, which ranged from 2% to 5%, and to keep WF-blue conservation, this calculation takes the maximum value of 5% (Table 3).
Surface water is the dominant water source for Weiyuan’s shale gas production, similar to the other shale plays [36,37]. The water source for Weiyuan play is derived from the Weiyuan River. A pair of major pipeline projects has been developed by operators for providing water. The cumulative water use for 97 wells from 2015 to 2017 totaled ∼ 3.44 Mm3, representing ~ 0.99% of the average annual surface runoff of the Weiyuan River of ~ 346 Mm3, and ∼0.78% of the total surface water resources of Weiyuan County of ∼440 Mm3. In the projected 2018–2020 and 2021–2030 periods, the estimated WF-blue was 3.01 Mm3 per year and 2.17 Mm3 per year, which was 0.68% and 0.62%, respectively, of the total surface water resources of Weiyuan County and was 0.87% and 0.63%, respectively, of the average annual surface runoff of the Weiyuan River. These results showed that this volume was negligible relative to the average annual surface runoff of the Weiyuan River and the total surface water resources of Weiyuan County and Sichuan Province (with an annual total surface water resource of 261.6 billion m3 in Sichuan Province).

Evaluation of WF-gray during Shale Gas Production

Monthly water production rates (m3 per day) were calculated over the first 29 months of production (Figure 4). Decline curve analysis was also applied to analyze FP water generation, similar to the decline curves applied to shale gas production (Appendix A.5). The generation of FP water peaked in the first few months and then declined, predominantly reflecting the flowback water volume (Figure 4). The accumulated volume of wastewater was 107.24×10⁴ m3, varying from 4625.44 to 33224.53 m3 per well, with an average of 18813.51 m3 per well. The ratio of FP to HF water was calculated and ranged from 12.84% to 109.64%, with an average of 55.34% (Figure A4).
WF-gray water use results are shown in Table 3 and are consistent with the average WF-blue consumed and the total water footprint in the Weiyuan field. The ratio of WF-blue to WF-gray was also calculated (Table 3). Scenarios A, B and C present a similar trend, with WF-blue accounting for a small percentage, ranging from 3.24% to 16.18%, while WF-gray accounted for a large percentage (ranging from 83.02% to 96.76%). The WF-gray changed greatly from 18.63 to 93.12 million m3 per year in the period from 2018 to 2020 and from 13.41 to 67.05 million m3 per year in the period from 2021 to 2030. The total water footprint varied from 21.64 to 96.14 million m3 per year in the period from 2018 to 2020 and varied from 15.58 to 69.22 million m3 per year in the period from 2021 to 2030. The WF-gray volume in projected years was estimated to approximately 3.88% to 26.91% of the average annual surface runoff of Weiyuan River, approximately 3.05 ~ 21.16% of the total surface water resources in Weiyuan County, and approximately 0.05% to 0.36% of the total surface water resources in Sichuan Province.

3.3. Environmental Impact Assessment

The water consumption of the Weiyuan play shale gas development mainly comes from surface water resources and withdrawal from the Weiyuan River. The average annual surface runoff of the Weiyuan River is approximately 346 million m3. Due to the limited streamflow data, the flood frequency analysis was difficult, and the 7Q/75% method was used for the EFR assessment calculated in Weiyuan River (Appendix A.2).
Because the runoff is time-dependent, it varies within the year and from month to month; thus, a yearly basis is often not accurate enough to cover the severity in individual periods, and the WS-blue and WPL calculation may also be monthly (Table 4). During six months of the year (wet season: May–October), the water scarcity was clearly lower than the other six months (dry season: January–April, November and December) (Table 4 and Figure 5). During all twelve months, WF-blue had a slight effect on WA-blue; the available water resource was sufficient, and the water resource was sustainable. The monthly EFR over all months of the year in Figure 5 were far below the monthly blue water availability in this catchment of approximately 0.84 m3/s. The monthly WS-blue calculation was used to assess the WF-blue sustainability (Table 4). The values ranged from 0.39% (September) to 8.07% (December). These results suggest that both the yearly and monthly WF-blue may have a negligible influence on local water resources.
WF-gray was used to indirectly evaluate water use sustainability with respect to the environmental impacts caused by FP water. The monthly division of the time dimension was considered in this study, and the monthly evaluation WPL results of WF-gray for different scenarios are listed in Table 4. Monthly WPL results showed that in different scenarios, WPL varied substantially and showed a gradient decline with the retreatment FP water volume. In scenario A, B and C, the WPL in the wet season (May–October) was lower than that in the dry season (January–April, November, and December), consistent with the actual situation. Scenario A results showed that the WPL in the dry season was similar to or surpassed the limited WPL (100%), indicating that the available water resources are not sufficient to assimilate pollutants and that the catchment is not sustainable. While in scenarios B and C, the whole WPL was less than 100% from 2018 to 2030, WPL was positively correlated with the volume of FP water. These findings indicated that the FP water volume of the Weiyuan play has a great influence on local water resources, and additional water treatment and reuse strategies should be implemented and refined before discharge; thus, the ecological environment is less impacted. The monthly basis calculation can more accurately and effectively evaluate the water resource sustainability, reflecting the actual pollution of water bodies at various time periods.

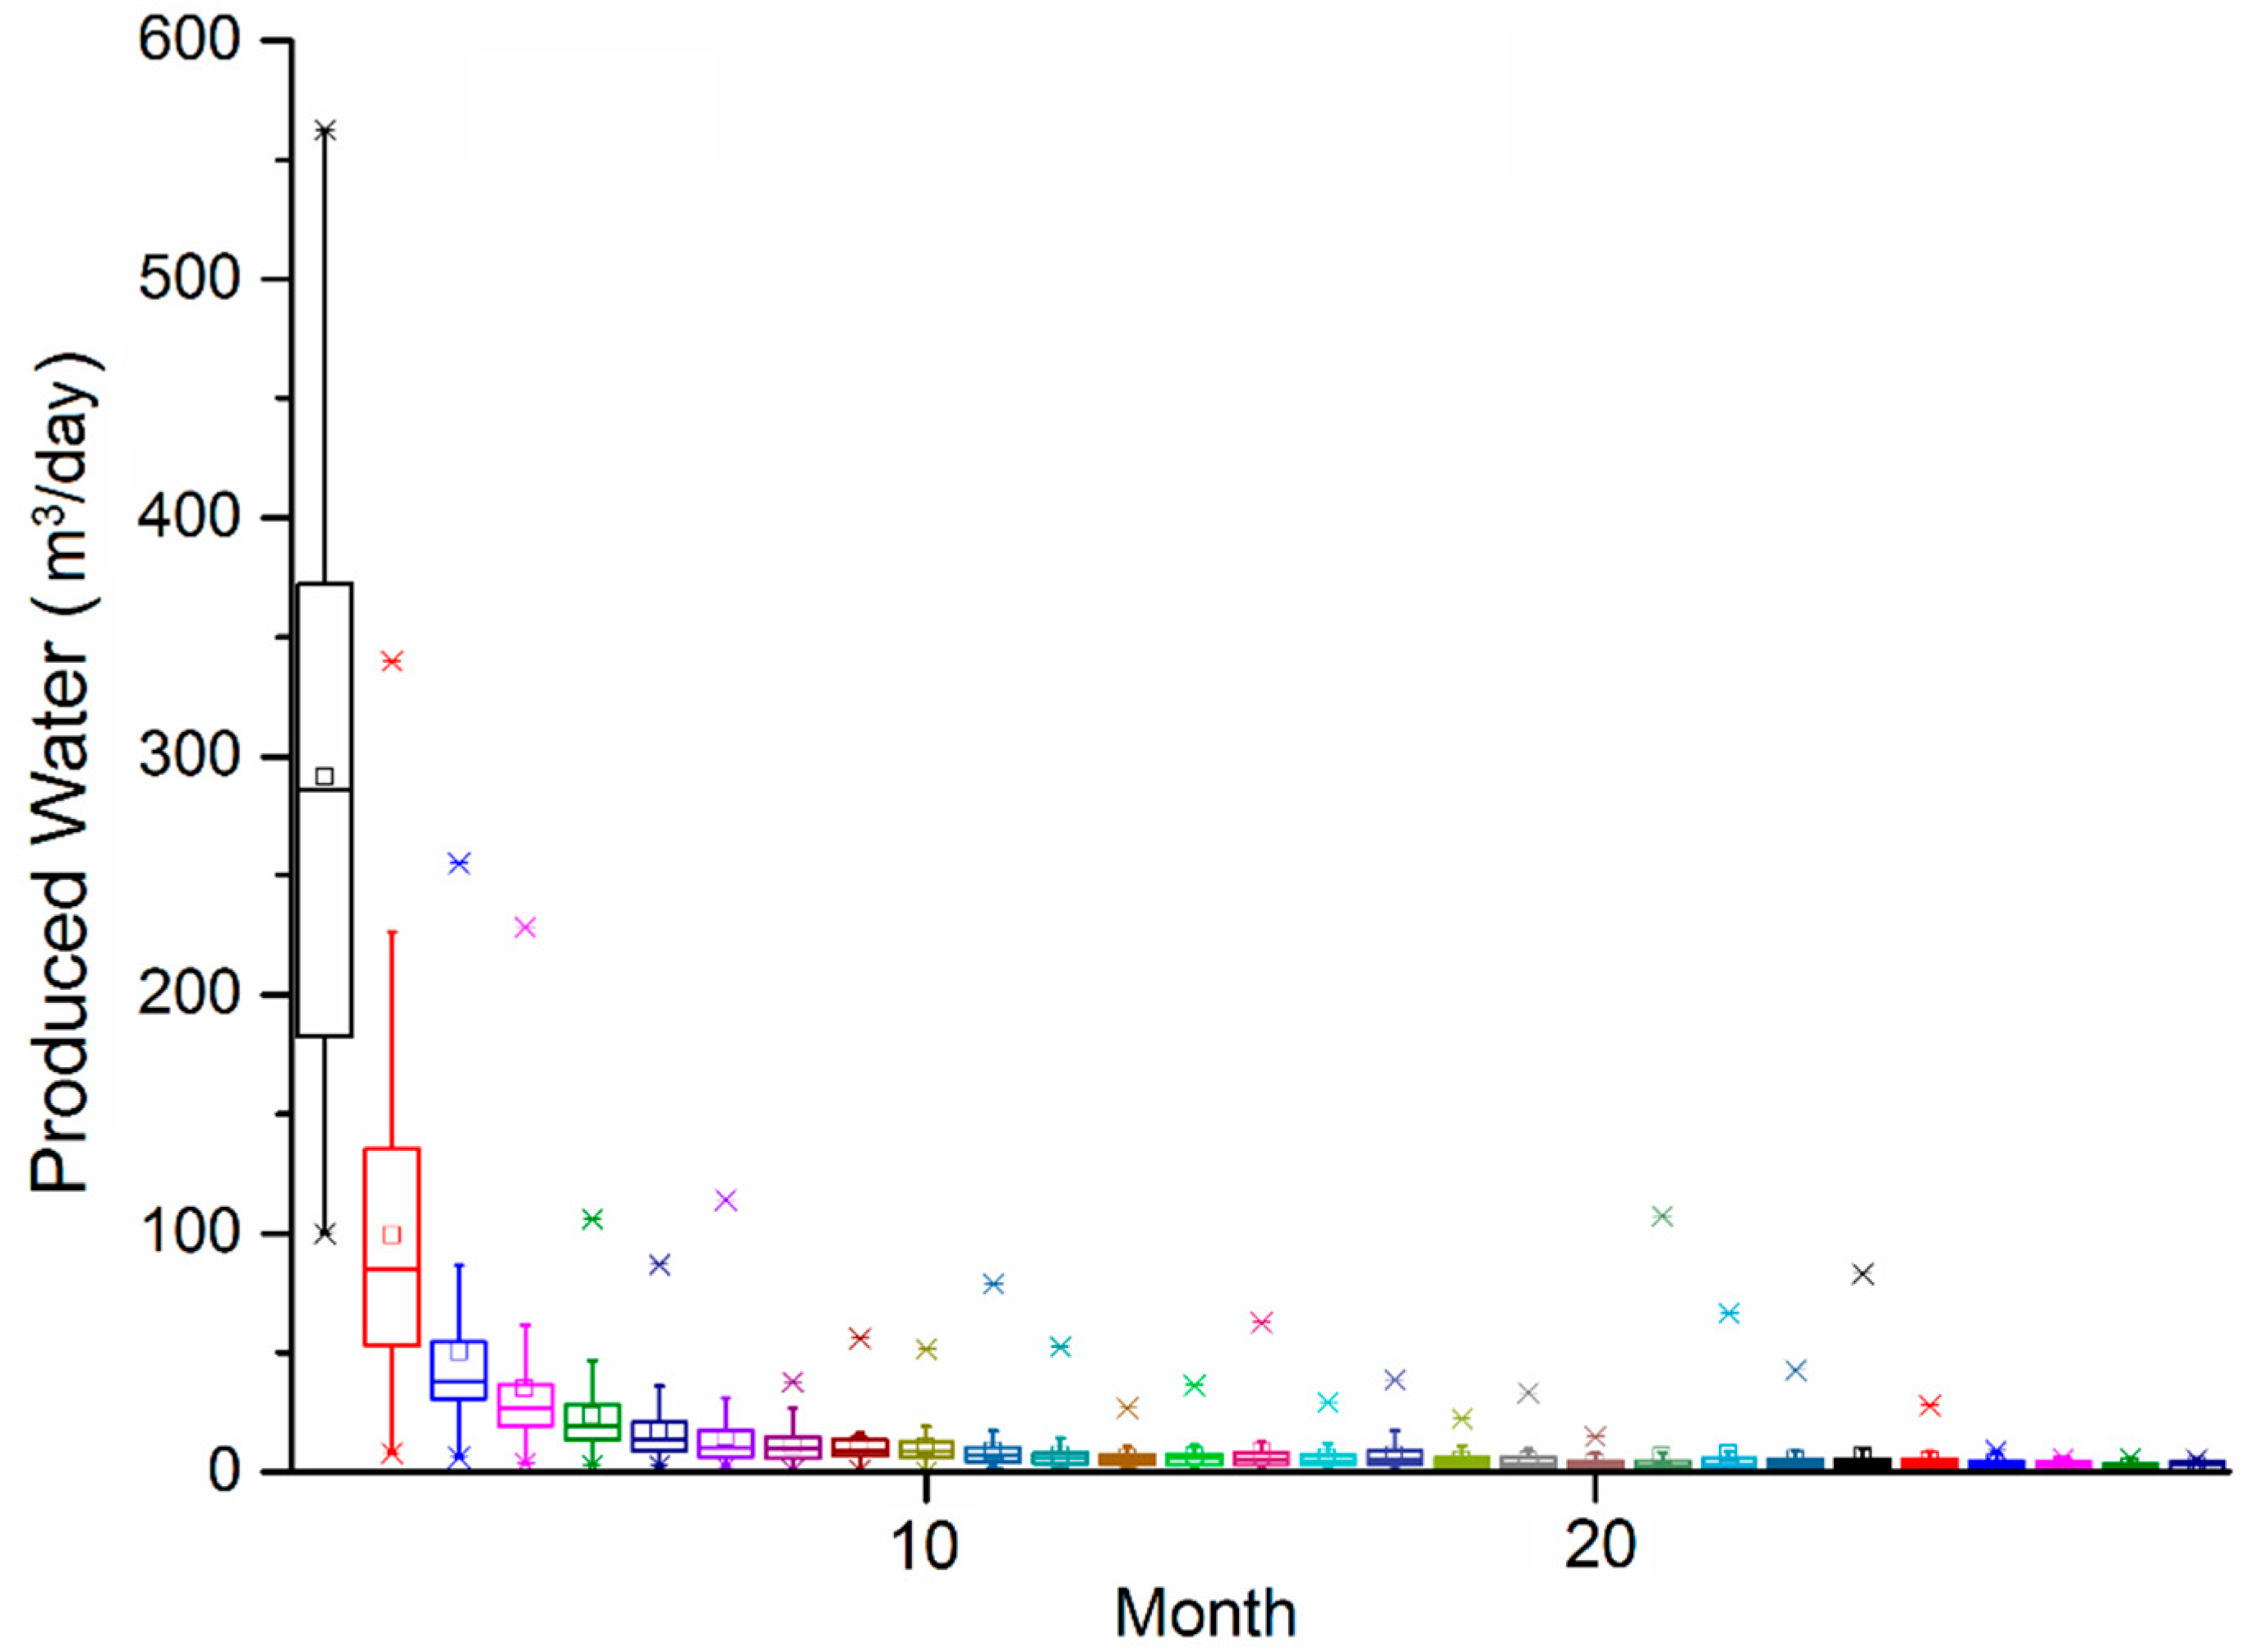
3.4. Flowback-produced Water Volume Trends and Management

FP water, which typically contains salts and high levels of toxic elements, has become a major challenge for local water resource sustainability, owing to the increase in induced pollution and the environmental and human health risks. WF-gray was used to indirectly evaluate water use sustainability with respect to the environmental impacts caused by FP water. The monthly division of the time dimension was considered in this study, and the monthly evaluation WPL results of WF-gray for different scenarios are listed in Table 4.
Currently, the primary approach for managing FP water is recycling, treatment and reuse or rejection. The onsite treatment facility for FP water (by chemical precipitation, flocculation sedimentation, multistage filtration, sterilization, etc., to remove or reduce the concentration of suspended solids) is employed by Petro China [38]. However, there are several challenges with reusing FP water. The variability in FP water quality throughout the different field wells and at different times after hydraulic fracking (transition from a water quality that resembles the HF fluid to a water quality that is similar to the formation water quality) may create challenges for waste water management when considering the complex and various additives [39].
Furthermore, the technologies for recycled flowback water do not work very well, and high total dissolved solids with some chemical additives are still present; the high salinity in recycled FP water could not match the hydraulic fracking fluid quality requirements, and thus freshwater is the main source in the shale gas industry [40].

3.5. Potential Research Needs for Managing the Water Availability of Shale Gas Production

Shale gas is the promising energy option for the Chinese energy system transition for the Paris Agreement carbon emission goal of 2030. The Chinese government is focused on shale gas production, while it also participates in many debates in regard to exploration technologies neglecting effects related to water scarcity and environmental health. Water sources are mainly fresh river surface water. Parameters and trends, including lateral length, fracking segment, well depth, fracking fluid volume and water intensity, were analyzed to understand the controls on determining the primary dynamic drivers of water use for shale gas production in the Weiyuan play. Our analysis indicated that in the Weiyuan play, water use for HF varies with lateral length, especially with the number of design segments, indicating that the operators’ technologies played a critical role in HF and shale gas production.
The water volume consumed by shale gas drilling and production was found to vary with different wells. Water intensity was employed to estimate the water use volume in water used per unit lateral segment (m3/segment). Based on the water footprint accounting, the estimated WF-blue was 3.01 Mm3 per year and 2.17 Mm3 per year in the projected 2018–2020 and 2021–2030 periods, respectively, which was highly positive correlated with the lateral lengths and fracking segments [36]. Although the water volume requirements for shale gas production are significantly lower than the volume of total local water resources (e.g., approximately 0.68% and 0.62% of the total surface water resources in Weiyuan County and approximately 0.0012% and 0.0010% of the total surface water resources in Sichuan Province for the projected 2018–2020 and 2021–2030 periods, respectively), the impacts of water withdrawal for shale gas development could cause a temporal reduction in monthly natural stream flows and depletion of local seasonal water resources (Table 4). In addition, mean total annual water use in Sichuan Province is dominated by irrigation (approximately 60%, Table A3), and shale gas production may have a conflict with seasonal water quantity scarcity.
In addition, although freshwater sources are abundant in the Sichuan Basin, future water availability is uncertain because of potential regulatory and legal constraints provided by the Ministry of Water Resources of China, including the ‘Applying the Strictest Water Resources Control System’, ‘Three red lines’, and ‘The Action Plan for Prevention and Treatment of Water Pollution’. In the past 40 years, the rainfall and runoff in the Sichuan Basin have shown a long-term decline, which shows a drying trend that could lead to increasingly serious drought events [41,42]. For example, two droughts in 2006 and 2011 caused severe short-term water crises and serious losses to the human economy and life in this region [42]. In summary, regional water resources are declining, which may limit shale gas development. Reasonable management strategies are essential and will play a critical role in continued shale gas production.
Furthermore, due to the high proportion for the whole water footprint, the WF-gray volume in projected years attracted great attention (approximately 3.05 ~ 21.16% of the total surface water resource in Weiyuan County and approximately 0.05% to 0.36% of the total surface water resource in Sichuan Province). In addition, the monthly WPL results indicated that the WPL may threaten local water resource sustainability in the dry season. The technology for treatment, reuse and recycling of FP water should be a focus of future research. However, the high salinity of the FP water and disposal of FP water may preclude this option. Additionally, some of the parameters exceed the desired range for reuse and recycling, making reuse and recycling challenging (Table A1). An onsite treatment facility and earthen pits were used in Weiyuan play for FP water disposal, and these methods could decrease the risk of contamination from spills and significantly reduce truck traffic. As most FP water disposal is currently retreated, and considering advances in desalination technology, FP water could serve as a potential water source for HF in the future, which would help to dispose of FP water, minimize the short-term total freshwater use and alleviate the pressure on regional water sources [43].

3.6. Limitations of the Method

The water footprint research in a typical shale gas production field, proposed here, has several limitations. For example, it is suitable in the rough estimate of energy use recovery and WF-blue and WF-gray characteristics since the insufficient field wells and produced water data and the results may be affected by the number of observation shale gas wells. However, the 3 years of records for the 97 observation wells selected are typical, reasonably and scattered, and the time series is complete and with sufficient data sequences which can basically represent the trend of the water used and wastewater produced. The calculation results were influenced by the amount of data, while they can provide reasonable explanation and confidence evidence.
Due to the calculation of WF-gray mainly dependent on the water quality which is a complex system process and may need a big and long time series number of data, and this time we have collected a total of 57 FP water samples from day 11 to day 401 after hydraulic fracturing, which could be modelled by the water footprint model method.

4. Conclusion

Shale gas is a promising energy option for the Chinese energy system transition for the Paris Agreement carbon emission goals of 2030. The Chinese government is focused on shale gas production, while it also participates in many debates in regard to exploration technologies neglecting effects related to water scarcity and environmental health. Parameters and trends, including lateral length, fracking segment, well depth, fracking fluid volume and water intensity, were analyzed to understand the controls on determining the primary dynamic drivers of water use for shale gas production in the Weiyuan play. Our analysis indicated that water use for HF varies with lateral length, especially with the number of design segments, indicating that the operators’ technologies played a critical role in HF and shale gas production in China.
This study included an estimate of future water need and FP water volumes based on the future well inventory by 2020 and 2030 under the plans of Petro China and China’s policy projections derived from ~ 3 years of historical onsite field data (from 2015 to 2017). WFA is a useful tool to quantify local water consumption from a water quantity and quality perspective to evaluate local water resource sustainability and to identify options for time-dependent water adjustment and management. This study provides insights for quantifying the water footprint on different time scales (yearly and monthly). These results showed that WF-gray made the main contribution, accounting for 83.02% to 96.76% of the whole water footprint, and the monthly WPL results indicated that WF-gray may threaten the sustainability of local water resources in the dry season. Reuse and retreatment for managing the water footprint are considered an urgent environmental health issue. The WF-blue (3.24% to 16.18%) and monthly WS-blue calculation deduced that WF-blue may have a negligible influence on the sustainability of local water resources. However, the regional water resources are declining, and reasonable management strategies are essential for increasing shale gas production. The operators should be responsible for their water footprint and should take action to ensure that their water footprint is sustainable.
All of these issues point out the need for further research on future water management with respect to water scarcity and wastewater salinity disposal in reuse and recycling to optimize the management of increasing volumes of FP water. Advances in desalination and treatment technologies may allow reused and recycled FP water to serve as a water source for HF in the near future.

Author Contributions

“conceptualization, Jun Xia and Xia Wu; data curation, Baoshan Guan, Ping Liu, Xia Wu and Xinming Yan; methodology, Lei Zou; validation, Si Hong and Hu Sheng; investigation, Si Hong and Lifeng Yang; writing—original draft preparation, Xia Wu.; writing—review and editing, Lei Zou.”

Funding

This research was supported by the Strategic Priority Research Program of the Chinese Academy of Sciences, Grant No. XDA23040304, funded by the National Natural Science Foundation (41890822) and the National Key R&D Program of China (2017YFA0603702).

Acknowledgments

The authors acknowledge colleagues from the Petro China Research Institute of Petroleum Exploration and Development for their help with this study.

Conflicts of Interest

No conflict of interest exists in the submission of this manuscript, and the manuscript is approved by all the authors for publication. I would like to declare on behalf of my co-authors that the work presented here is an original research that has not been published previously and not under consideration for publication elsewhere, in whole or in a part.

Appendix A

Additional supporting information may be found under the Appendix Section for this article. The Appendix includes additional information on methodology, background information, maps and tabulated data.
Figure A1. China Primary Energy Consumption and Composition 1978–2016 (data source: China Statistical Yearbook Energy (2017)).
Sustainability 11 00940 g0a1

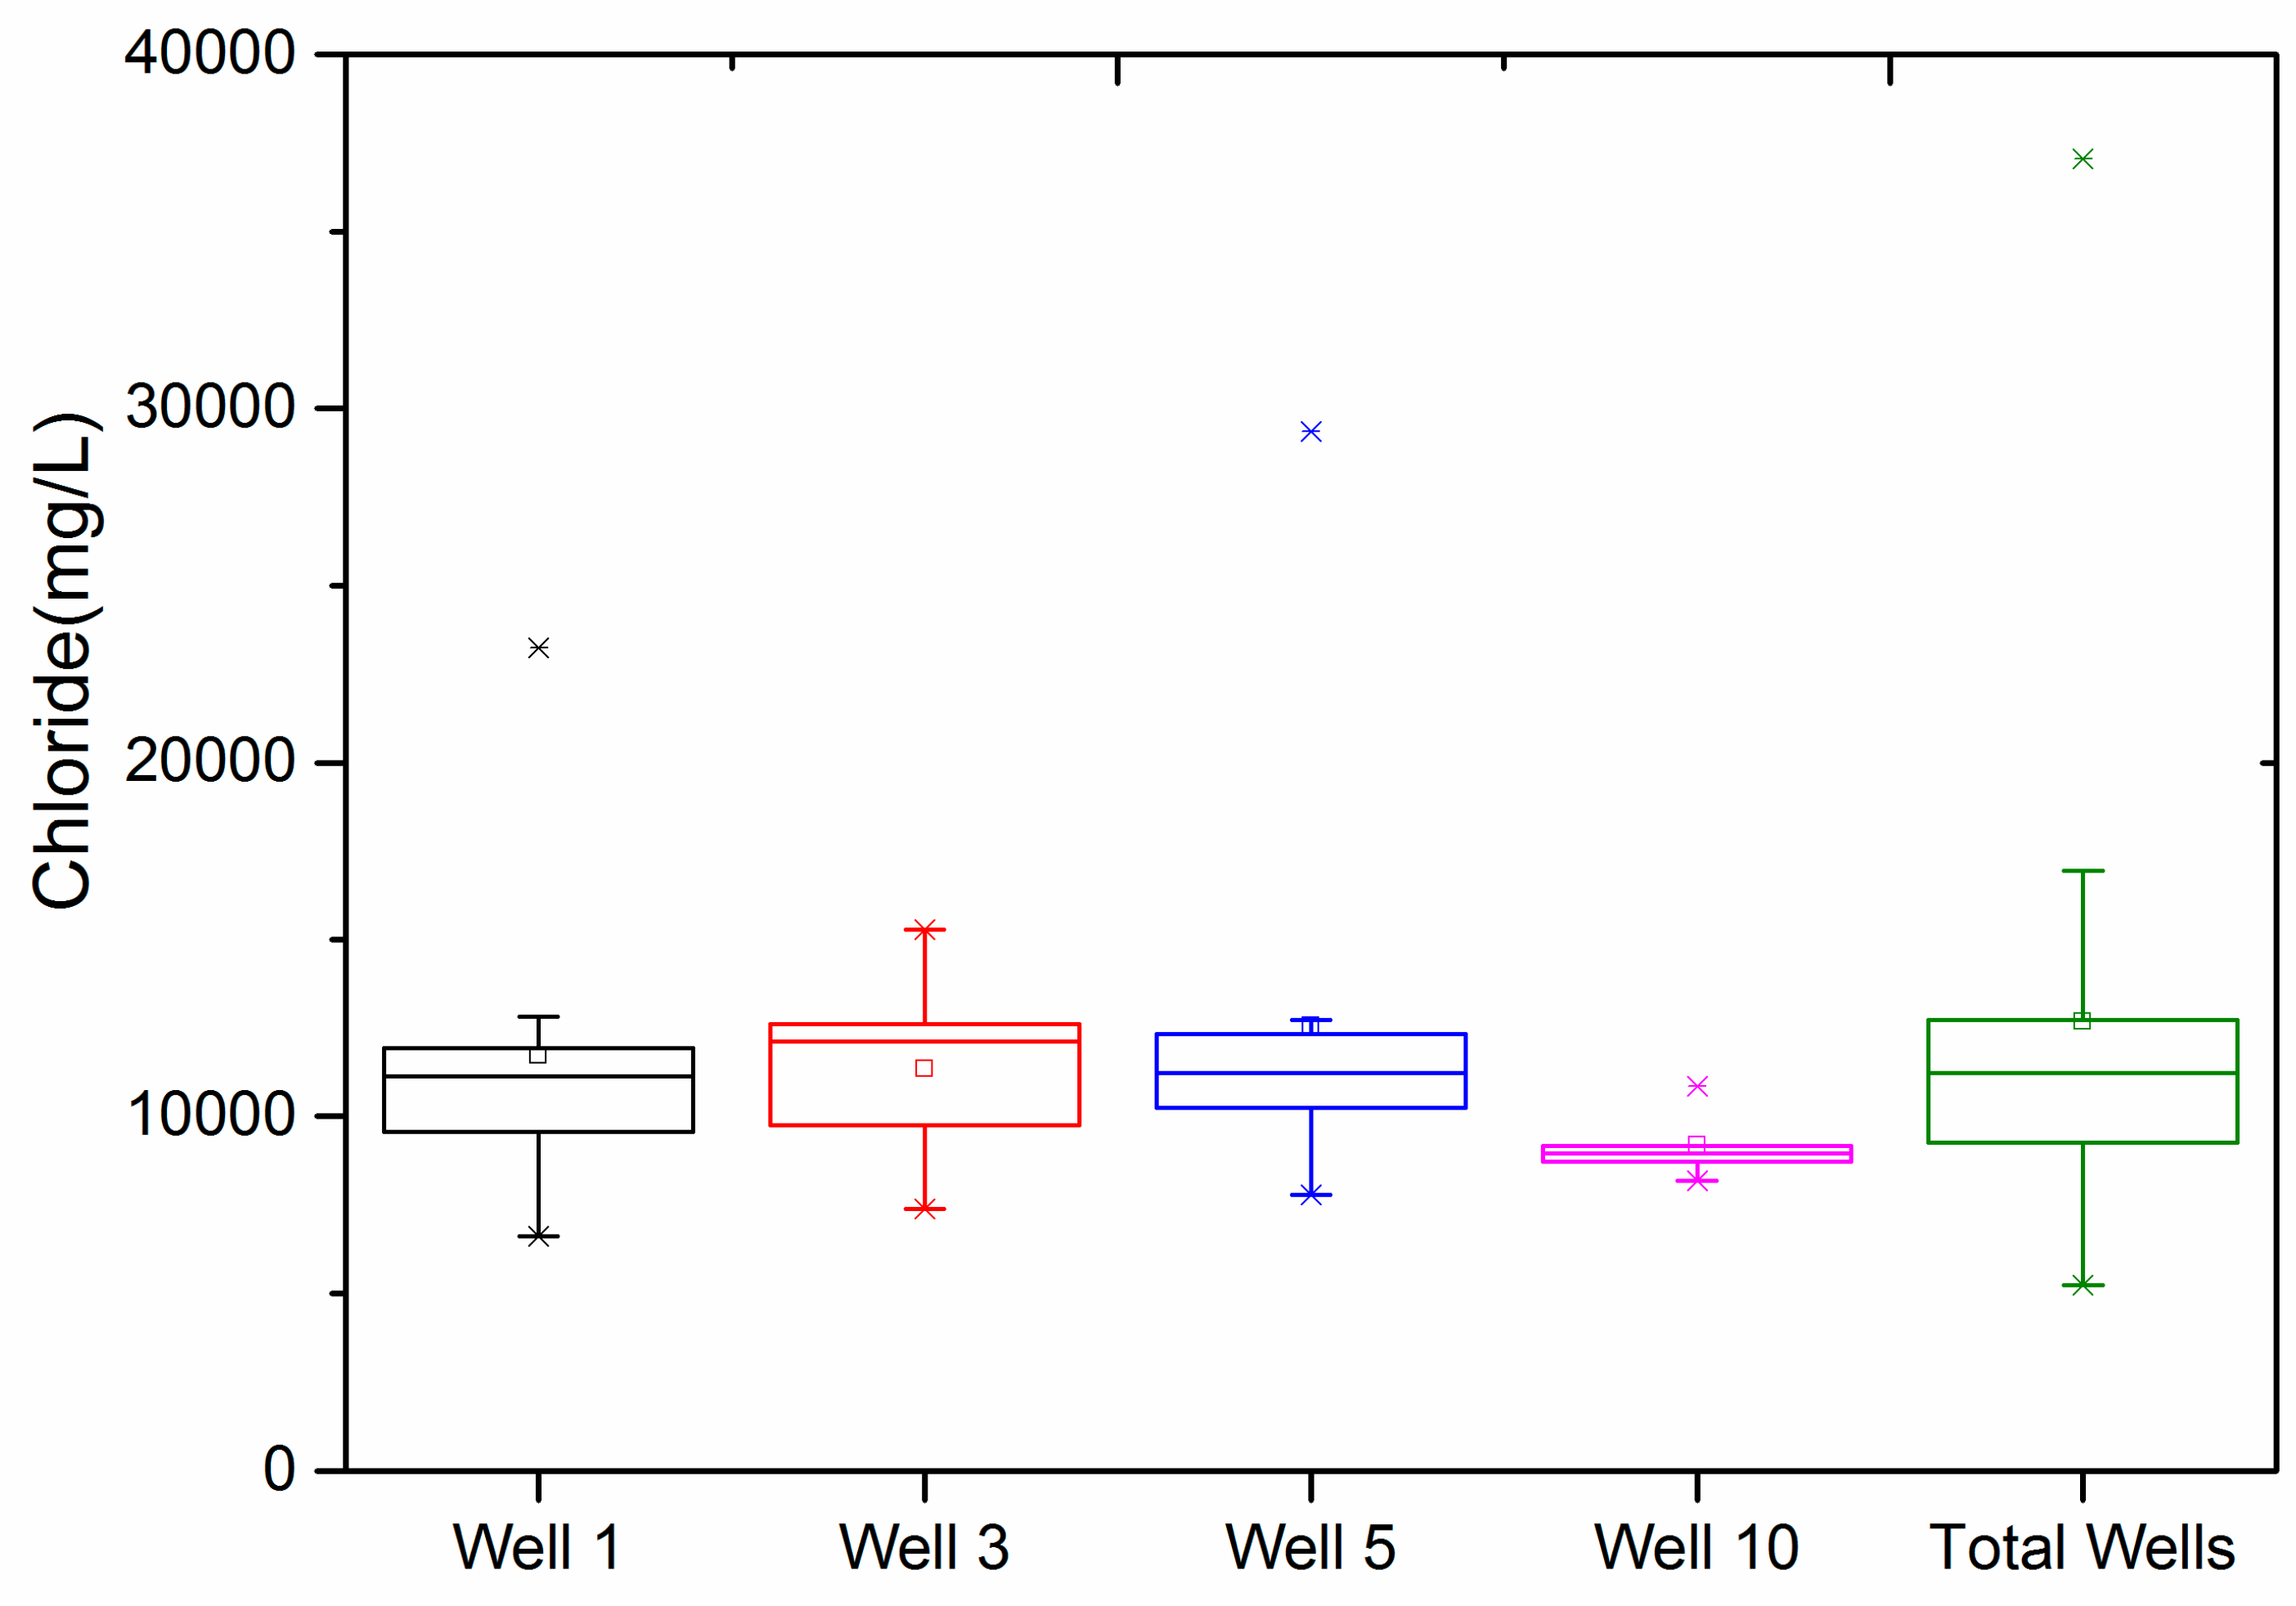
Appendix A.1. FP Water Quality Data

A total of 57 FP water samples were collected from four different wells in the Weiyuan play from day 11 to day 401 after hydraulic fracturing. Concentrations were measured using ICP-OES, PerkinElmer Optima 5300DV (cations: Al, As, Ba, Ca, Ca, Fe, K, Mg, Mn, Mo, Na, Pb, Sr, and so on), and Dionex ICS-2100 (anions: F, Cl, Br, and SO4) in the Institute of Geographical Sciences and Natural Resources Research, Chinese Academy of Sciences (Table A1). The Class III water quality standard of the Surface Water Environmental Quality Standard of China (GB3838-2002) was the maximum allowed concentration by the water quality environmental standard. Class III water quality is mainly applicable to the secondary protection areas of centralized drinking water surface water sources, fish and shrimp wintering fields, migratory passages, aquaculture areas and other fishery water areas and swimming areas. Combined with the results of field water sampling and referenced guidelines, chlorine (Cl) was found to be a key pollutant (Table A1 and Figure A2).
Table A1. Water quality parameters of flowback/produced water relative to desired quality for reuse.
ParameterMean(mg/L)Referenced Guideline
pH6.19
Al0.52
As1.2550μg/l
B26.42
Ba1.30
Ca125.55
Cd0.035 μg/l
Co0.01
Cr0.2950 μg/l
Cu0.041 mg/l
Fe0.080.3 mg/l
K75.01
Li12.78
Mg1.95
Mn3.680.1 mg/l
Mo0.00
Na4485.00
Ni0.14
P14.91
Pb0.2410 μg/l
Se0.0210 μg/l
SiO222.99
Sr28.73
V12.76
Zn0.61
F6.181 mg/l
Cl9020.62250 mg/l
SO4276.54250 mg/l
Br79.92
Figure A2. Box plots for each month of shale gas production in the Weiyuan play.
Sustainability 11 00940 g0a2

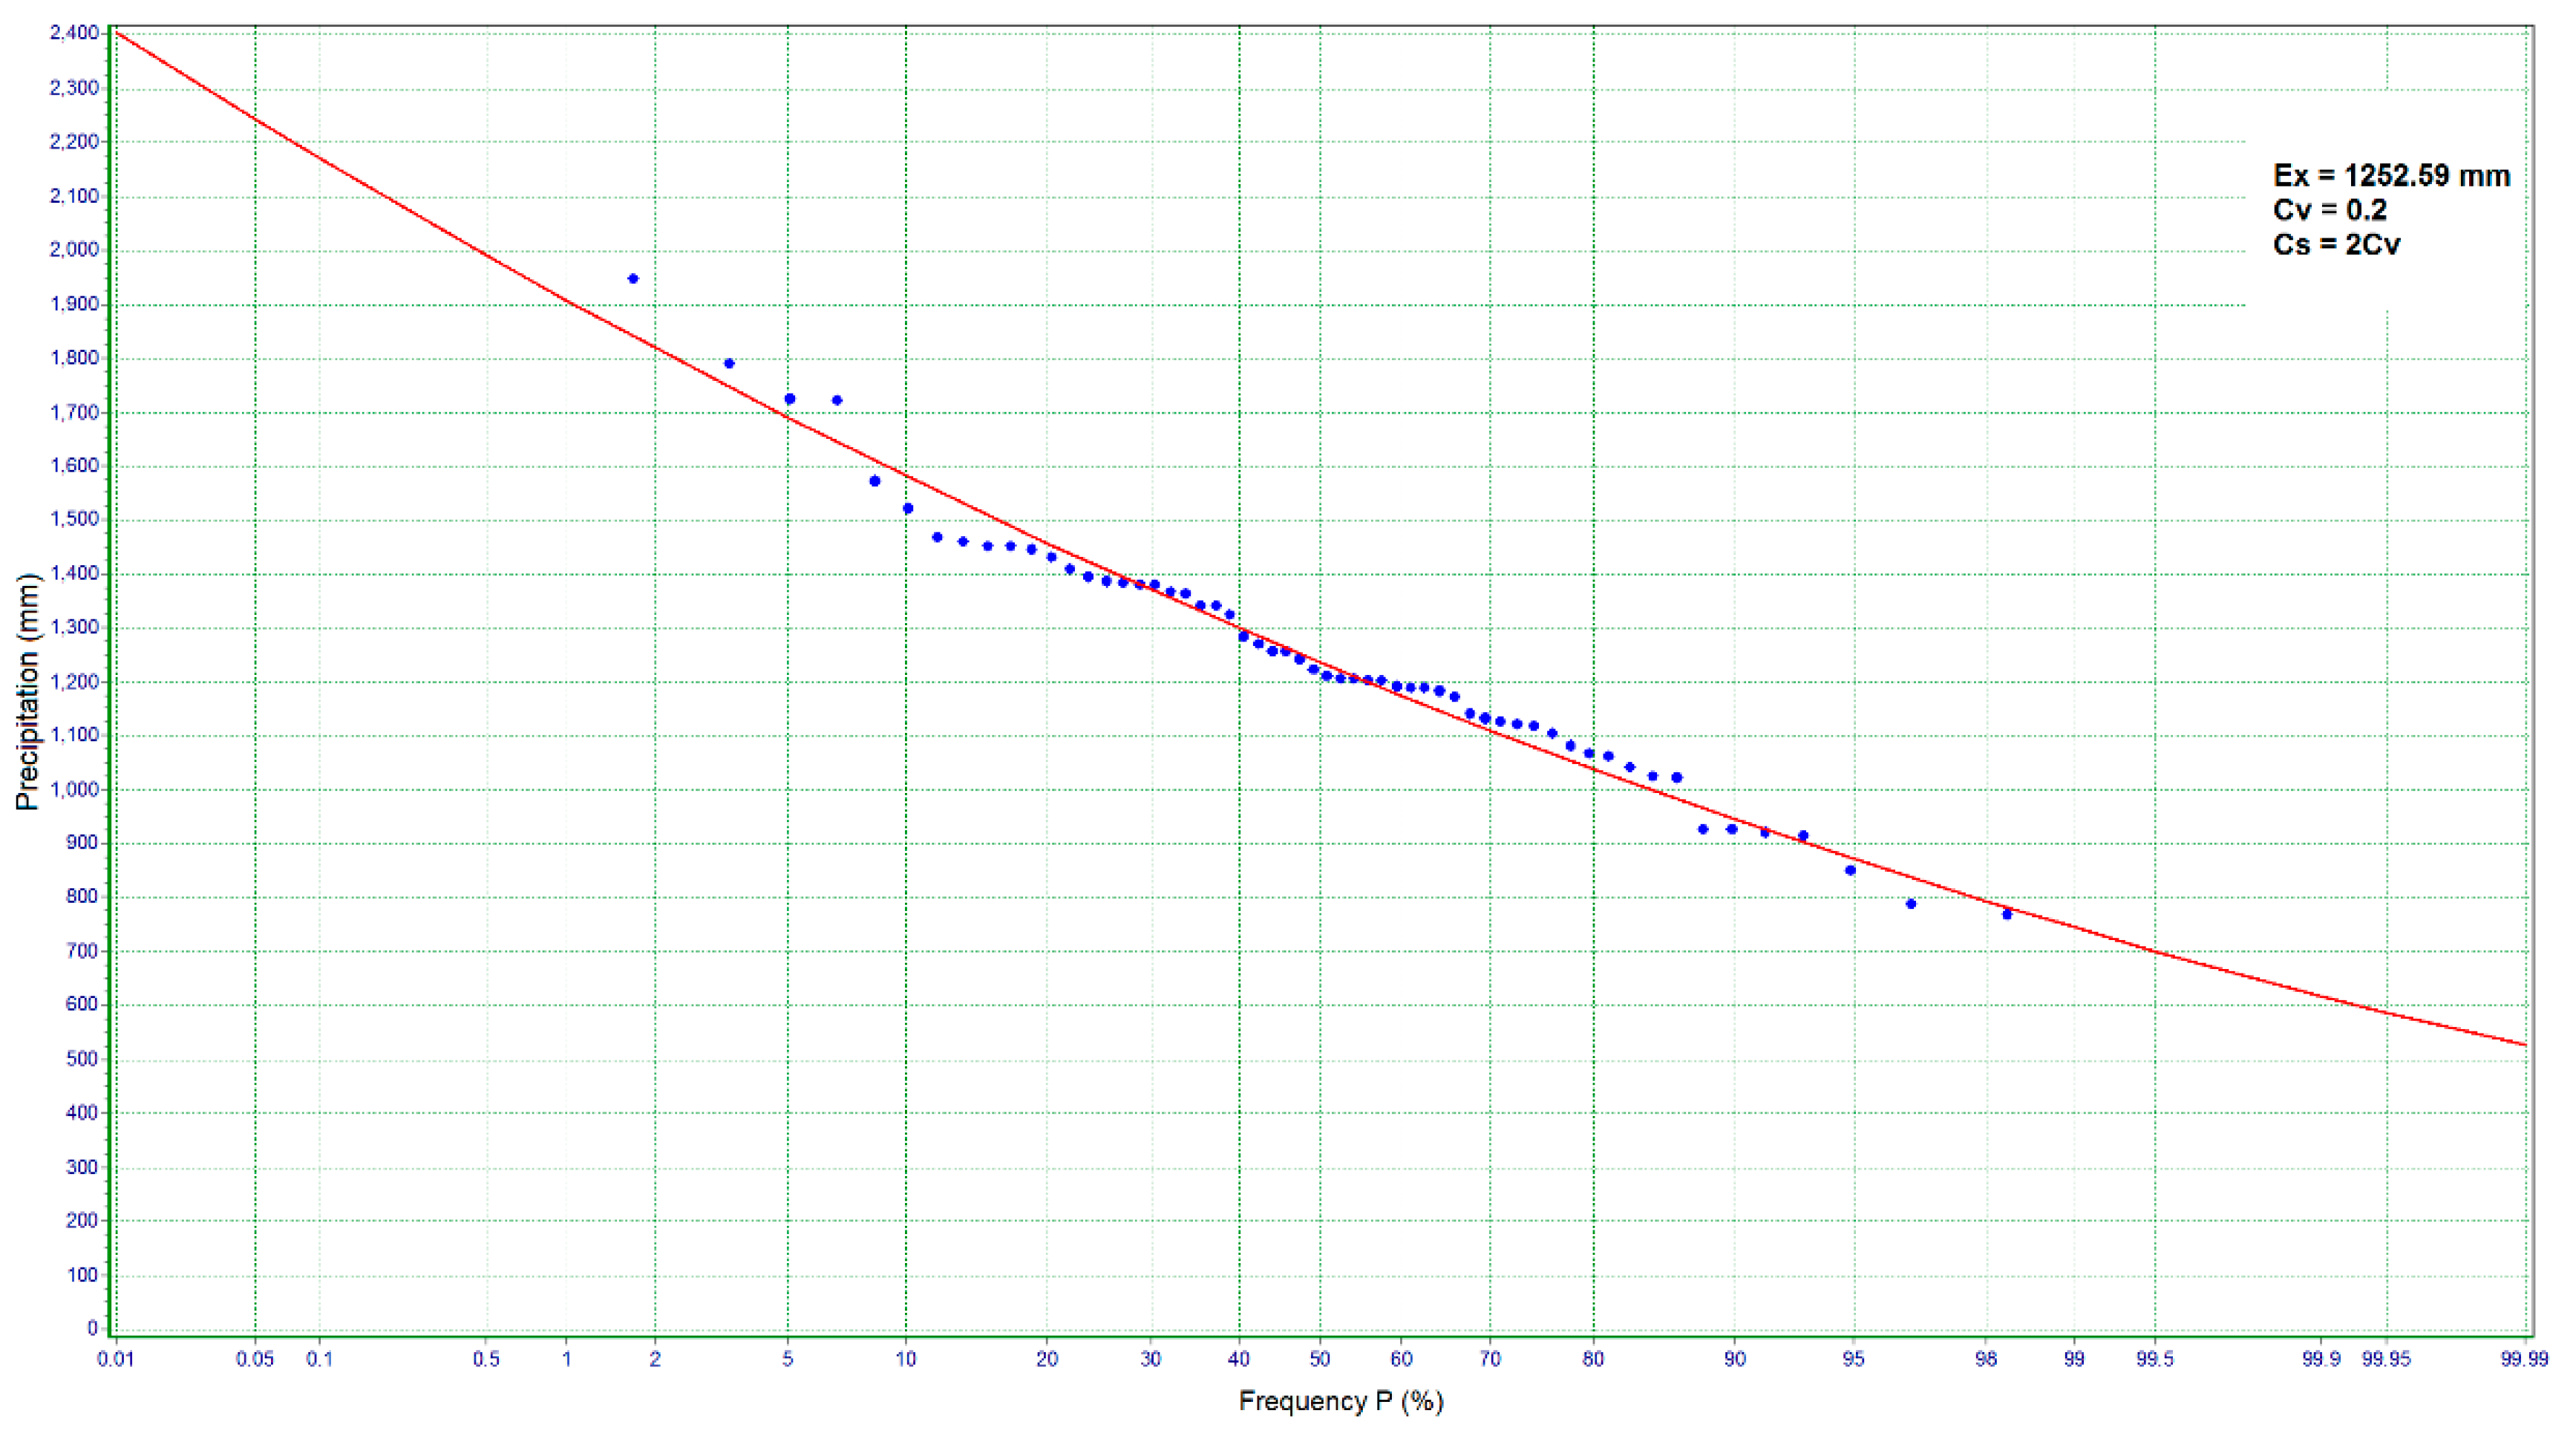
Appendix A.2. Improved Environmental Flow Requirements Model

Due to the poor streamflow gauging stations and the lack of consistent and long-term records of streamflow observations, flood frequency analysis was difficult in the Weiyuan River. Precipitation is less affected by human activities, and this study utilized precipitation gauging station data to improve the 7Q10 method for the environmental flow requirements assessment. The analysis consists of three steps (hereafter 7Q/75%): (a) the Pearson Type III (P-III) frequency distribution of a long series of precipitation data in the basin is used to determine the designed water quantity at the frequency P = 75% of the incoming water; (b) the same or a similar year is used as the representative precipitation year in the natural period; and (c) the average amount of water or the mean monthly average flow that represents the last 7 days of the hydrological year is taken as the minimum ecological flow of the river.
The P-III distribution is a widely used technique for flood flow estimation and is recommended for hydrological frequency analysis by the Ministry of Water Resources of China. Therefore, the P-III distribution was selected for the precipitation frequency analysis in this study. The probability density function is provided in Appendix A.2.1. The recurrence interval and return period are defined as the reciprocal of the exceedance probability (P), which indicates the long-term average interval relative to the design precipitation.
Based on the P-III distribution, the reference years (high-rainfall year, average year and dry year) were determined on specified frequencies by analyzing the frequency of the long-term annual precipitation data of the Weiyuan River from 1960 to 2017 (Figure A3). L-moments were effective linear combinations of probability-weighted moments and were more likely to produce satisfactory results in the hydrologic frequency analysis and applied to the parameter estimation fitted to the P-III distribution. All the goodness of fits for the P-III curves in Figure A3 are above 0.95. The P-III curves show good agreement between the observed and simulated peak values. The three parameters of mean value, coefficient of variation (Cv) and coefficient of skewness (Cs) were 1252.59 mm, 0.2 and 0.4, respectively. The frequency analysis results for annual precipitation are listed in Table 3. Frequency values of 25%, 50%, and 75% were chosen as the levels of reference years (high-rainfall year, average year, and dry year, respectively). The reference years can be obtained on the basis of the calculated annual precipitation under different frequencies and their corresponding representative years. Therefore, the reference years for high-rainfall, average and dry years were 1992, 2005, and 2015, respectively (Table A2).
Table A2. Frequency analysis for annual precipitation at Weiyuan station.
Frequency (%)Annual Precipitation (mm)Representative YearReference Year
51572.301990
251269.301992The high-rainfall year
501235.932005The average year
751075.782015The dry year
95870.912017
The results also indicate that complex terrain, drainage area, and reservoir construction are important factors that impact hydrologic model performance. A 25% exceedance probability (P25), for example, is the value of discharge exceeded at a point on a stream only 25% of the time and is therefore a high-flow statistic, whereas P75 and P90 refer to values of stream discharge that are exceeded 75% and 90% of the time, respectively, and are therefore low-flow statistics. Exceedance probabilities of 25, 50, 75, 80, 85, 90, and 95% were inferred directly from each flow duration curve.
Figure A3. Comparison of flood-frequency curves based on observed peak flows, CGDPA, and TMPA precipitation-driven simulations in the Jialing and Tuojiang River basins; note CI: confidence interval.
Sustainability 11 00940 g0a3

Appendix A.2.1. Appendix A.1 (A.1)

The probability density and distribution function of the P-III distribution is expressed as:
f ( x ) = β α / τ ( α ) ( x α 0 ) α 1 e β ( x α 0 )
P = P ( x x p ) = β α / τ ( α ) x p ( x α 0 ) α 1 e β ( x α 0 ) d x
where τ ( α ) is the gamma function of α; and α, β, and α 0 are the shape, scale, and location parameters, respectively (α> 0, β > 0). These parameters are related to the expected value (Ex), coefficient of variation (Cv), and coefficient of skewness (Cs) of the distribution through the following equations:
α = 4 C s 2
β = 2 E x C v C s
α 0 = E x ( 1 2 C v C s )  

Appendix A.3. Methods for Estimated Ultimate Recovery

The method for estimating the number of future wells in the shale gas industry is mainly calculated using the well spacing method (Nicot and Scanlon, 2012) or by calculating the estimated ultimate recovery (EUR) of a single well (Goodwin et al., 2014). The well spacing area method mainly considers the complete exploitation and utilization of the block, and does not need to be based on national or regional energy planning. The calculation result is the maximum number of shale gas development wells. Based on the actual conditions, this paper combines the energy plans of Petro China and China’s policy projections to estimate the EUR of a single well.
The conventional estimation methods for EUR mainly include the production decline method, analytical method, and numerical simulation method. The conventional gas reservoir production decline method is most common with Arps decline, and shale gas has a specific decline analysis method due to different development methods and flow mechanisms, including correction of the Arps decline, expansion index decline, Duong, modified Duong, power index decrease, correction of the power exponential decrement and other methods.
The extended exponential method is based on the fact that the decline rate of shale gas wells decreases with time, and the conventional exponential decline model is improved. This method can characterize the early decline of shale gas well production and the slow decline in the later stages. The basic equation is as follows:
q ( t ) = q i exp [ ( t / τ ) n ]
Ln [ q i q ] = τ n t n
where qi is the initial rate of flow, 104 m3/d; and n defines the production decline index.
Petro China measured and verified the volume of FP water and gas production and then recorded and stored this information in a production database. The daily FP water and gas production records for each well through December 31, 2017, are collected from the onsite production database. MATLAB’s least squares curve fitting toolbox was used for curve fitting the collected shale gas well production data, thus inferring future gas production for each well. The data were fit to a power exponential decline curve (S1). The fitting results of the field production data from an area with 60 shale gas wells showed a production time of more than 2 years. The decline curve generated was used to estimate the EUR for each well, resulting in an EUR of 0.46 billion m3/well.

Appendix A.4. Calculation Methods for Shale Gas Production

Shale gas development in the Weiyuan field is already underway, with an estimated 97 wells completed by 2017 that produced 2.78 billion m3 of natural gas. The projected annual production was calculated by multiplying the estimated annual number of new production wells by the estimated annual production from the extended exponential decline curve. The total production calculation is built on the results of the projected annual production combined with legacy production, which was calculated by multiplying the number of wells previously drilled by their estimated annual production based on the age of the wells and the extended exponential decline curve:
T o t a l   p r o d u c t i o n   ( y e a r i ) = i = n n = 30 A i B i
where A is the median annual production for the calculated year based on the extended exponential decline curve estimate and B is the number of new wells drilled in the calculated year. This process was replicated, and extrapolated production estimates were used to estimate the ultimate oil and gas recovered for each well.

Appendix A.5. Calculation Methods for FP Water Volume Per Well

Monthly water production data for 60 shale gas wells over 29 months were collected from CNPC’s production database. MATLAB’s Curve-Fitting Toolbox with a least squares fitting curve was used to infer the future water production for each well. The data were fit to the Arps decline curve estimate (Arps, 1945). The Arps equation is as follows:
q ( t ) = q i ( 1 + b D i t ) 1 / b
where qi is the initial gas (or water) production rate, m3/d; Di represents the initial decline rate, 1/d; and b is a curvature constant, with a value of 0.654.
Water production data from 60 shale gas wells were analyzed up to December 31, 2017. The accumulated volume of wastewater was 107.24×10⁴ m3 in the Weiyuan shale gas field, ranging from 4625.44 to 33224.53 m3 per well, with an average of 18813.51 m3 per well.
Table A3. Total water use by category for Sichuan province (data source: China Statistical Yearbook (2017)).
YearTotal (Billion m3)Irrigation (Billion m3)Industrial (Billion m3)Domestic (Billion m3)Ecological (Billion m3)Per Capita Water Consumption (m3/person)
200320.9912.175.613.040.17241.6
200421.0412.125.653.10.17214.1
200521.2312.185.683.170.2259.3
200621.5112.125.753.420.22262.7
200721.411.875.93.440.19262.6
200820.7611.365.773.450.18255.3
200922.3512.366.163.630.2273.8
201023.0312.736.293.80.21283.8
201224.5914.585.474.290.25305
201324.2513.945.834.010.47299.7
201423.6914.544.474.250.42291.6
201526.5515.675.544.830.51324.9
201626.7315.595.584.980.58324.7
Figure A4. Ratio of flowback and produced (FP) water to hydraulic fracturing (HF) water.
Sustainability 11 00940 g0a4

References

  1. United States Environmental Protection Agency. 20 Global Greenhouse Gas Emissions Data. Available online: https://www.epa.gov/ghgemissions/global-greenhouse-gas-emissions-data (accessed on 19 January 2017).
  2. United Nations Treaty Collection. “Paris Agreement”. 8 July 2016. Available online: http: // refhub.elsevier.com/S1674-9278(15)30005-8/sref9 (accessed on 8 July 2016).
  3. Guo, M.; Xu, Y.; Chen, Y.D. Catching environmental noncompliance in shale gas development in China and the United States. Resour. Conserv. Recycl. 2017, 121, 73–81. [Google Scholar] [CrossRef]
  4. Dong, C.; Dong, X.; Gehman, J.; Lefsrud, L. Using BP Neural Networks to Prioritize Risk Management Approaches for China’s Unconventional Shale Gas Industry. Sustainability 2017, 9, 979. [Google Scholar] [CrossRef]
  5. Hu, D.; Xu, S. Opportunity, challenges and policy choices for China on the development of shale gas. Energy Policy 2013, 60, 21–26. [Google Scholar] [CrossRef]
  6. Li, W.; Liu, Y.; Xiao, S.; Zhang, Y.; Chai, L. An Investigation of the Underlying Evolution of Shale Gas Research’s Domain Based on the Co-Word Network. Sustainability 2018, 10, 164. [Google Scholar]
  7. U.S. Energy Information Administration. Technically recoverable shale oil and shale gas resources: an assessment of 137 shale formations in 41 countries outside the United States; U.S. Department of Energy: Washington, DC, USA, 2013.
  8. U.S. Energy Information Administration. World Shale Resource Assessments; Department of Energy: Washington, DC, USA, 2014.
  9. National Development and Reform Commission. Energy production and consumption revolutionary strategy (2016–2030). Available online: www.ndrc.gov.cn /zcfb/zcfbtz/ 201704/ W020170425509386101355 (accessed on 29 December 2016).
  10. Gregory, K.B.; Vidic, R.D.; Dzombak, D.A. Water Management Challenges Associated with the Production of Shale Gas by Hydraulic Fracturing. Elements 2011, 7, 181–186. [Google Scholar] [CrossRef]
  11. Vengosh, A.; Jackson, R.B.; Warner, N.; Darrah, T.H.; Kondash, A. A Critical Review of the Risks to Water Resources from Unconventional Shale Gas Development and Hydraulic Fracturing in the United States. Environ. Sci. & Technol. 2014, 48, 8334–8348. [Google Scholar]
  12. Gregory, K.; Mohan, A.M. Current perspective on produced water management challenges during hydraulic fracturing for oil and gas recovery. Environ. Chem. 2015, 12, 261–266. [Google Scholar] [CrossRef]
  13. Yost, E.E.; Stanek, J.; Burgoon, L.D. A decision analysis framework for estimating the potential hazards for drinking water resources of chemicals used in hydraulic fracturing fluids. Sci. Total Environ. 2017, 574, 1544–1558. [Google Scholar] [CrossRef]
  14. Hadian, S.; Madani, K. The Water Demand of Energy: Implications for Sustainable Energy Policy Development. Sustainability 2013, 5, 4674–4687. [Google Scholar] [CrossRef]
  15. Skoulikaris, C.; Filali-Meknassi, Y.; Aureli, A.; Amani, A.; Jiménez-Cisneros, B.E. Information-Communication Technologies as an Integrated Water Resources Management (IWRM) Tool for Sustainable Development. In Achievements and Challenges of Integrated River Basin Management; IntechOpen: London, UK, 2018. [Google Scholar]
  16. Scanlon, B.R.; Duncan, I.; Reedy, R.C. Drought and the water-energy nexus in Texas. Environ. Res. Letters 2013, 8, 045033. [Google Scholar] [CrossRef]
  17. Scanlon, B.R.; Reedy, R.C.; Nicot, J.P. Will water scarcity in semiarid regions limit hydraulic fracturing of shale plays? Environmental Research Letters 2014, 9, 124011. [Google Scholar] [CrossRef]
  18. Vidic, R.D.; Brantley, S.L.; Vandenbossche, J.M.; Yoxtheimer, D.; Abad, J.D. Impact of Shale Gas Development on Regional Water Quality. Science 2013, 340, 1235009. [Google Scholar] [CrossRef] [PubMed]
  19. Warner, N.R.; Christie, C.A.; Jackson, R.B.; Vengosh, A. Impacts of Shale Gas Wastewater Disposal on Water Quality in Western Pennsylvania. Environ. Sci. Technol. 2013, 47, 11849–11857. [Google Scholar] [CrossRef] [PubMed]
  20. Vengosh, A.; Mitch, W.A.; McKenzie, L.M. Environmental and Human Impacts of Unconventional Energy Development. Environ. Sci. Technol. 2017, 51, 10271–10273. [Google Scholar] [CrossRef] [PubMed]
  21. Hoekstra, A.Y. The Global Dimension of Water Governance: Why the River Basin Approach Is No Longer Sufficient and Why Cooperative Action at Global Level Is Needed. Water 2011, 3, 21–46. [Google Scholar] [CrossRef]
  22. McAuliff, K.; Sadiq, R.; Hewage, K. Water use in unconventional oil and gas development: an assessment on water use metric evaluation and selection. Clean Technol. Environ. Policy 2017, 19, 2417–2429. [Google Scholar] [CrossRef]
  23. Ikonnikova, S.A.; Male, F.; Scanlon, B.R.; Reedy, R.C.; McDaid, G. Projecting the Water Footprint Associated with Shale Resource Production: Eagle Ford Shale Case Study. Environ. Sci. Technol. 2017, 51, 14453–14461. [Google Scholar] [CrossRef] [PubMed]
  24. Kondash, A.; Vengosh, A. Water Footprint of Hydraulic Fracturing. Environ. Sci. Technol. Letters 2015, 2, 276–280. [Google Scholar] [CrossRef]
  25. Scanlon, B.R.; Reedy, R.C.; Male, F.; Hove, M. Managing the Increasing Water Footprint of Hydraulic Fracturing in the Bakken Play, United States. Environ. Sci. Technol. 2016, 50, 10273–10281. [Google Scholar] [CrossRef] [PubMed]
  26. Chang, Y.; Huang, R.Z.; Masanet, E. The energy, water, and air pollution implications of tapping China’s shale gas reserves. Resour. Conserv. Recycl. 2014, 91, 100–108. [Google Scholar] [CrossRef]
  27. Yu, M.; Weinthal, E.; Patino-Echeverri, D.; Deshusses, M.A.; Zou, C.; Ni, Y.; Vengosh, A. Water Availability for Shale Gas Development in Sichuan Basin, China. Environ. Sci. Technol. 2016, 50, 2837–2845. [Google Scholar] [CrossRef] [PubMed]
  28. Guo, M.; Lu, X.; Nielsen, C.P.; McElroy, M.B.; Shi, W.; Chen, Y.; Xu, Y. Prospects for shale gas production in China: Implications for water demand. Renew. Sustain. Energ. Rev. 2016, 66, 742–750. [Google Scholar] [CrossRef]
  29. Pi, G.; Dong, X.; Dong, C.; Guo, J.; Ma, Z. The Status, Obstacles and Policy Recommendations of Shale Gas Development in China. Sustainability 2015, 7, 2353–2372. [Google Scholar] [CrossRef]
  30. Zou, C.; Dong, D.; Wang, Y.; Li, X.; Huang, J.; Wang, S.; Guan, Q.; Zhang, C.; Wang, H.; Liu, H.; Bai, W.; Liang, F.; Lin, W.; Zhao, Q.; Liu, D.; Yang, Z.; Liang, P.; Sun, S.; Qiu, Z. Shale gas in China: Characteristics, challenges and prospects (I). Pet. Explor. Develop. 2015, 42, 753–767. [Google Scholar] [CrossRef]
  31. Pietrucha-Urbanik, K.; Cecilia, B. Approaches to Failure Risk Analysis of the Water Distribution Network with Regard to the Safety of Consumers. Water 2018, 10, 1679. [Google Scholar] [CrossRef]
  32. Zou, C.; Dong, D.; Wang, Y.; Li, X.; Huang, J.; Wang, S.; Guan, Q.; Zhang, C.; Wang, H.; Liu, H.; Bai, W.; Liang, F.; Lin, W.; Zhao, Q.; Liu, D.; Yang, Z.; Liang, P.; Sun, S.; Qiu, Z. Shale gas in China: Characteristics, challenges and prospects (II). Pet. Explor. Develop. 2016, 43, 182–196. [Google Scholar] [CrossRef]
  33. Zou, C.; Yang, Z.; Zhu, R.; Zhang, G.; Hou, L.; Wu, S.; Tao, S.; Yuan, X.; Dong, D.; Wang, Y.; Wang, L.; Huang, J.; Wang, S. Progress in China’s Unconventional Oil & Gas Exploration and Development and Theoretical Technologies. Acta Geol. Sinica-Eng. Edit. 2015, 89, 938–971. [Google Scholar]
  34. Hoekstra, A.Y.; Chapagain, A.K.; Aldaya, M.M.; Mekonnen, M.M. The Water Footprint Assessment Manual: Setting the Global Standard; Routledge: London, UK, 2011. [Google Scholar]
  35. Goodwin, S.; Carlson, K.; Knox, K.; Douglas, C.; Rein, L. Water Intensity Assessment of Shale Gas Resources in the Wattenberg Field in Northeastern Colorado. Environ. Sci. Technol. 2014, 48, 5991–5995. [Google Scholar] [CrossRef]
  36. Mitchell, A.L.; Small, M.; Casman, E.A. Surface Water Withdrawals for Marcellus Shale Gas Development: Performance of Alternative Regulatory Approaches in the Upper Ohio River Basin. Environ. Sci. Technol. 2013, 47, 12669–12678. [Google Scholar] [CrossRef]
  37. Rahm, B.G.; Riha, S.J. Evolving shale gas management: water resource risks, impacts, and lessons learned. Environ. Sci.-Process. Impacts 2014, 16, 1400–1412. [Google Scholar] [CrossRef]
  38. Zou, C.; Ni, Y.; Li, J.; Kondash, A.; Coyte, R.; Lauer, N.; Cui, H.; Liao, F.; Vengosh, A. The water footprint of hydraulic fracturing in Sichuan Basin, China. Sci. Total Environ. 2018, 630, 349–356. [Google Scholar] [CrossRef] [PubMed]
  39. Warner, N.R.; Darrah, T.H.; Jackson, R.B.; Millot, R.; Kloppmann, W.; Vengosh, A. New Tracers Identify Hydraulic Fracturing Fluids and Accidental Releases from Oil and Gas Operations. Environ. Sci. Technol. 2014, 48, 12552–12560. [Google Scholar] [CrossRef] [PubMed]
  40. Nicot, J.-P.; Scanlon, B.R.; Reedy, R.C.; Costley, R.A. Source and Fate of Hydraulic Fracturing Water in the Barnett Shale: A Historical Perspective. Environ. Sci. Technol. 2014, 48, 2464–2471. [Google Scholar] [CrossRef] [PubMed]
  41. Xu, J.J.; Yang, D.W.; Yi, Y.H.; Lei, Z.D.; Chen, J.; Yang, W.J. Spatial and temporal variation of runoff in the Yangtze River basin during the past 40 years. Quat. Int. 2008, 186, 32–42. [Google Scholar] [CrossRef]
  42. Zhang, Z.Z.; Chao, B.F.; Chen, J.L.; Wilson, C.R. Terrestrial water storage anomalies of Yangtze River Basin droughts observed by GRACE and connections with ENSO. Glob. Planet. Change 2015, 126, 35–45. [Google Scholar] [CrossRef]
  43. Oetjen, K.; Chan, K.E.; Gulmark, K.; Christensen, J.H.; Blotevogel, J.; Borch, T.; Spear, J.R.; Cath, T.Y.; Higgins, C.P. Temporal characterization and statistical analysis of flowback and produced waters and their potential for reuse. Sci. Total Environ. 2018, 619, 654–664. [Google Scholar] [CrossRef] [PubMed]
Figure 1. Map of the study area—the Weiyuan play with the county line (highlighted in tan). Sampled wells are displayed in purple.
Sustainability 11 00940 g001
Figure 2. Box plots for each month of shale gas production in the Weiyuan play.
Sustainability 11 00940 g002
Figure 3. Hydraulic fracturing water consumption per well: (a) relationship between the length of the fracturing horizontal section and water consumption, and (b) relationship between water use and number of stages per well.
Sustainability 11 00940 g003
Figure 4. Box plots of monthly average flowback and produced (FP) water production in the Weiyuan play.
Sustainability 11 00940 g004
Figure 5. The blue water footprint over a year compared to the blue water availability and environmental flow requirements (ERF).
Sustainability 11 00940 g005
Table 1. Basic analysis parameters for hydraulic fracturing.
YearWellsHF Water Use (m3/well, percentile)Lateral Length (m, percentile)Number of HF Segments (percentile)Proppant (t, percentile)Depth (m, percentile)
Mean5th25th50th75th95thMean5th25th50th75th95thMean5th25th50th75th95thMean5th25th50th75th95thMean5th25th50th75th95th
20154732727.1119369.3827548.1133885.1337886.0644043.481350.849191300140014411600178151920221823.301056.821489.81860.072218.982430.273621.0328803208367841114320
20163038478.7424985.3029015.9139909.2446711.0953412.901347.6384613731435145715542013182123252121.071220.251852.22178.272490.828983712.3332733451373838764345
20171837768.6021416.6033692.9039692.3644051.3049498.581374.5078812331452159519292112182224272309.59126917762374.32726.43682.023534.0628042821363840034217
Table 2. Water use for hydraulic fracturing (HF) per metric and per segment.
YearWellsHF Water Use (m3/m, percentile)HF Water Use (m3/stage, percentile)
Mean5th25th50th75th95thMean5th25th50th75th95th
20151926.5425.1225.9526.3526.9828.851887.381845.061851.651882.051919.761932.92
20162328.3926.0527.0127.9028.8535.431949.491841.891893.761911.951980.002233.90
20171227.7325.6126.5327.4628.0429.501905.501870.071890.531905.291928.231937.73
Table 3. Water footprint of shale gas production in Weiyuan play.
PeriodsScenariosWF-gray
(104 m3/year)
WF-blue
(104 m3/year)
WF-blue/WF-gray (%)Total WF
(104 m3/year)
2018–2020Scenario A9312.44301.313.249613.74
Scenario B4656.22301.316.474957.53
Scenario C1862.49301.3116.182163.80
2021–2030Scenario A6704.95216.943.246921.89
Scenario B3352.48216.946.473569.42
Scenario C1340.99216.9416.181557.93
Table 4. Environmental impacts assessment of shale gas production in Weiyuan play *.
MonthWA-blueRact2018–20202021–2030
Ws-bule (%)WPLA (%)WPLB (%)WPLC (%)Ws-bule (%)WPLA (%)WPLB (%)WPLC (%)
1439.70776.785.7199.9049.9519.984.1171.9335.9714.39
2548.65887.184.5887.4743.7417.493.3062.9831.4912.60
3416.35753.126.03103.0451.5220.614.3474.1937.1014.84
4428.03764.955.87101.4550.7220.294.2273.0436.5214.61
5797.691139.543.1568.1034.0513.622.2749.0324.529.81
6649.82989.703.8678.4139.2115.682.7856.4628.2311.29
71361.901711.281.8445.3522.679.071.3332.6516.336.53
81871.652227.821.3434.8317.426.970.9725.0812.545.02
96521.586939.750.3911.185.592.240.288.054.031.61
10894.971238.112.8162.6831.3412.542.0245.1322.569.03
11330.75666.377.59116.4658.2323.295.4783.8541.9216.77
12311.29646.668.07120.0160.0024.005.8186.4143.2017.28
* The water pollution level (WPL) is an indicator of the sustainability of WF-gray, and WPLA, WPLB, and WPLC refers to the water pollution level caused by Scenario A, B, and C.

