A Two-Sided Matching Model for Task Distribution in Ridesharing: A Sustainable Operations Perspective


1
School of Business, Sichuan Normal University, Chengdu 610101, China
2
School of Business Planning, Chongqing Technology and Business University, Chongqing 400067, China
3
College of Management and Economics, Tianjin University, Tianjin 300072, China
*
Authors to whom correspondence should be addressed.
Sustainability 2019, 11(7), 2187; https://0-doi-org.brum.beds.ac.uk/10.3390/su11072187
Submission received: 16 January 2019
/
Revised: 25 March 2019
/
Accepted: 5 April 2019
/
Published: 11 April 2019
(This article belongs to the Special Issue Sharing Economy for Sustainability)
Abstract
:With regard to task distribution in a ridesharing company, both the suitability of the tasks assigned to the drivers and the acceptability of the riders receiving the service should be simultaneously considered to improve the sustainability regarding Hitch services. Firstly, the process of the bi-directional choice between the drivers and the riders is described as a one-to-one two-sided matching problem. Next, prospect theory is used to characterize the psychological perceived behavior of both sides towards the matching scheme under the multiple criteria. Thus, the suitability function concerning the drivers and the acceptability function regarding the riders are naturally constructed. Following this, a two-sided matching decision model with two objectives is proposed. Finally, numerical experiments are presented to verify the feasibility and effectiveness of the proposed model. Besides, managerial insights associated with how to set the optimization objectives under unbalanced supply-demand in ridesharing companies are given. Increasingly, this paper aims to not only validate the proposed methodology, but also to highlight the importance and urge of incorporating sustainability into the task distribution problem in ridesharing.
1. Introduction
Ridesharing allows riders to split travel costs, which is beneficial for the development of the economy and environment [1]. Specifically, it can save travel costs, reduce travel time, mitigate traffic congestions, conserve fuel, and reduce air pollution. Ridesharing is gradually becoming a popular way to travel. DiDi Chuxing (“DiDi”) is the world’s leading mobile transportation platform. The company offers a full range of app-based transportation options for 550 million users, including Car Sharing, Taxi, and so on. In 2017, DiDi closed over USD 5.5 billion financing round to support global strategy and technology investments on April and completed 7.43 billion rides in December [2]. Uber, an app-based service, operates in more than 58 countries and 300 cities across the world, as of August 2015 [3]. It is obvious that ridesharing is in a period of rapid development. However, ridesharing as a new way to travel also raises new challenges in its operations and management in the context of sharing economy. For example, four months after DiDi discontinued its Hitch business due to operational problems, Hello chuxing launched its Hitch business, which has developed rapidly. Now, the number of registered drivers of Hello’s Hitch has exceeded 2 million, the total number of issued orders has exceeded 7 million, and it is still growing rapidly [4]. Therefore, the Hitch market still exists and the demand for that is large.
Ridesharing can be divided into two types according to the willingness of drivers. One is the drivers taking ridesharing as a job. Without a specific travel route and departure time, based on system’s dispatch requirements they will pick up riders at designated places, then complete pick-up and drop-off tasks according to the requirements of riders, which is similar to internet taxis. Some scholars have begun to focus on this issue. For instance, Pelzer et al. presented a ride-matching algorithm to increase the success rate of ridesharing service in matching drivers and riders [5]. Barann et al. developed an innovative concept for one-to-one taxi ridesharing [6]. In the process of their task distribution, some ridesharing companies quantify their profit-making in terms of matching success-rate, travel mileage, and other functions. To improve the profit-making level by optimizing the model objectives from the whole, it calculates matching scheme and adopts the task distribute mode through system dispatching.
The other type is the drivers are more willing to accept the matching scheme along the way, emphasizing more convenient task execution, and paying more attention to travel route and departure time of the tasks. This type of ridesharing service is known as the Hitch service by most ridesharing companies in China. It has also attracted some scholars’ attention. For instance, Lee et al. focus on ridesharing schemes that involve drivers who will make their planned trip regardless of whether they are matched with a rider (as supported by Flinc (Germany) and Carma (America), instead of ridesharing systems in which a driver is making a trip for the sole purpose of earning the fare (as offered by Uber, Lyft, and SideCar) [7]. These drivers operate for-nonprofit and typically provide rides incidental to their own trips [8]. This differs from for-profit taxis and jitneys in its financial motivation. When a ridesharing payment is collected, it partially covers the drivers’ cost. It is not intended to result in a financial gain. Moreover, the driver has a common origin or destination with the riders [9]. The first thing a driver may have wondered is whether the rider meets their requirements. Many ridesharing companies (such as: DiDi, Hello) have launched Hitch services for this type of driver. In Hitch service, compared with ridesharing companies taking profit-making as the purpose of system dispatching, drivers are more willing to accept the matching scheme so that drivers feel satisfied with specific concerns in in Hitch service.
To solve the aforementioned problems, some ridesharing companies (e.g., DiDi) have made new progress in operating the Hitch business to replace system dispatch. For instance, in the development of DiDi’s Hitch business, the company firstly selects a suitable task from the database based on the related information provided by drivers (e.g., departure time, location, and destination), then a list to show the rides’ travel information is formed and presented to the drivers. In this context, the drivers can choose a task according to their preferences and own concerns. This measure practically solves the aforementioned problem. Nevertheless, the asymmetric disclosure of information and ridesharing companies only grants drivers the selection, but may sacrifice the perceived acceptability of riders. Thus, there are unfair and unreasonable problems in the ridesharing task processing procedure of drivers’ one-side menu. In this sense, the ridesharing companies should replace the manual menu with an effective system dispatch, which is more responsive to perceptions of the ridesharing participants. It is necessary to design a new matching model to obtain the satisfactory matching scheme (for the worst condition is accepting the matching scheme). This will provide technical support for the ridesharing companies to realize operable system dispatching for Hitch services.
It is important to build a system dispatching model to optimize the perceptions of drivers and riders and improve the sustainability of ridesharing operations. In terms of the concept of sustainability, different scholars hold different opinions. So there is no unified definition. However, as a common cognition, the mainstream idea in nature of sustainability is to reduce, reuse, recover, and recycle. Additionally, its measurement dimensions include society, economy, and ecology [10]. Many agencies internationally now refer to the need for urban transport to become more sustainable, but definitions of sustainability differ. Ridesharing is an important component of sustainable urban transportation as it increases vehicle utilization while reducing road utilization [11]. Carter et al. clearly elaborated that sustainability was able to be characterized by the triple bottom line model regarding social, economic, and ecological dimensions [10]. The United Nations World Commission on Environment and Development (1987) highlighted that sustainable development was suggested to meet the needs of the present without compromising the ability of future generations to meet their own needs. Seuring and Müller considered sustainable supply chain management as the management of material, information, and capital flows, as well as cooperation among companies along the supply chain while taking goals from all three dimensions of sustainable development, i.e. economic, environmental, and social, into account, which are derived from customer and stakeholder requirements [12]. In this context, we leverage and extend the insights of the existing literature to present a comprehensive definition of sustainability considered in the ridesharing problem. The term ‘sustainability’ refers to the ability to motivate the coordinated development of the overall state of a system towards a better direction which is helpful for all stakeholders with respect to social, environmental, and economic objectives.
The contributions of this paper include two points. Firstly, sustainable operations differing from the previous ones are the focus of this paper. Most of them concentrate on operational efficiency, but fail to examine the operation process in a sustainable manner from the points of view of direct stakeholders’ (drivers and riders) rights. This paper attempts to examine the operation process of the ridesharing companies from the perspective of the rights and interests of direct stakeholders and achieve the sustainability of companies’ operations. Secondly, a bi-objective one-to-one two-sided matching model to maximize the perceived suitability of drivers and the perceived acceptability of riders is proposed. The characteristics of bi-directional choice between drivers and riders are captured by two-sided matching theory. The value function of prospect theory is used to formulate the psychological perception of different agents in the matching scheme. Thus, the behavior including “reference dependence”, “loss aversion”, and “diminishing sensitivity” can be quantified. Additionally, the integer programming function ‘intlinprog’ of Matlab (R2017b) is used to solve this model.
The rest of this paper is organized as follows: the next section presents a literature review, and Section 3 presents a definition of the problem in detail, analyzes the characteristics of the ridesharing task distribution problem, and determines the types of two-sided matching, as well as the benchmark of the matching scheme. This problem is formulated as a two-sided matching decision model for task distribution in a ridesharing company in Section 4. Section 5 uses numerical experiments to validate this bi-objective programming model. Finally, the implication of the findings and future directions are provided in Section 6.
2. Literature Review
In recent years, the task distribution problem of ridesharing has garnered increasing attention. Some scholars have concentrated on ridesharing problems under specific scenarios (commute, intercity, etc.) to achieve the goals of optimizing pricing, improving mileage, and increasing the menu. For instance, Hong et al. illustrated a ride matching method for commuting trips based on clustering trajectories to reduce the traffic demand and encourage more environment-friendly behaviors [13]. Agatz et al. presented a systematic overview of the relevant optimization models of the dynamic ridesharing problem [14]. Furuhata et al. focused on service pricing and driver-rider matching problems in ridesharing to foster the development of effective formal ridesharing [1]. Nourinejad et al. applied an agent-based model to formulate the ridesharing service in matching drivers and riders [15]. Barann et al. developed a one-to-one TRS approach to match rides with similar start and end points [6]. Pelzer et al. designed a method, which aims to best utilize ridesharing potential while keeping detours below a specific bound [5]. Wang et al. highlighted the impacts of appropriate cost-sharing strategies on the success of ridesharing programs [16]. Rayle et al. identified the objects, reason, and traffic impact of ridesourcing based on the investigation of San Francisco’s ridesourcing data [8]. Ma et al. took into account the traffic flow patterns in a single bottleneck corridor problem regarding a dynamic ridesharing mode and dynamic parking charges [17]. Lee et al. delineated that dedicated drivers had potential benefits for the ridesharing problem [7]. Liu et al. examined the dynamic user equilibrium of the morning commute problem in the presence of a ridesharing program [18]. Mallus et al. focused on the dynamic carpooling services in urban areas to address the needs of mobility in real-time by proposing a two-fold contribution [19]. As mentioned above, the existing studies concentrate on operational efficiency (e.g., increasing the success rate of matching and maximizing travel mileage), but fail to examine the operation process in a sustainable manner from the perspective of direct stakeholders’ (both the drivers and riders) rights. Yousaf et al. argued that ridesharing systems should combine environmental protection (through a reduction of fossil fuel usage), socialization, and security [20]. Therefore, the main objectives of the corresponding model are: (1) economic (e.g., minimization of cost), (2) social (e.g., equity or similarity), and (3) environmental (e.g., emissions or congestion). In summary, Table 1 summarizes the literature related to ridesharing problems from various objectives.
Fortunately, some researchers have started to investigate the aforementioned gaps to develop a sustainable scheme with the goal of optimizing stakeholders’ interests. For instance, Lee & Tang explored new operations management problems from the point of view of stakeholders [21]. Jaehn proposed the concept of sustainable operations [22], and Cao et al. studied the emergency resource allocation problem based on the beneficiary perspective on sustainability [23,24]. The aforementioned research provides support for this paper. However, to model the task distribution problem regarding ridesharing, how does one reflect the bi-directional choice between drivers and riders in the matching model? Furthermore, how does one reflect the subjectivity and incomplete rationality of the participants? These problems need to be highlighted. In this context, a two-sided matching model can be used to formulate the bi-directional problems. Prospect theory can be employed to characterize the subjective characteristics of both sides to judge the matching scheme.
Specifically, on the one hand, two-sided matching refers to the process in which decision makers search for the optimal matching object based on the demand information provided by both sides, and aims to optimize the indicators related to satisfaction, fairness, and stability. Gale et al. were the earliest scholars to apply two-sided matching decisions to college admissions and the stability of marriage problem [25]. Korkmaz et al. constructed a two-sided matching decision-making model for military personnel and work tasks [26]. Nowadays, two-sided matching theory is widely used in many fields, such as finance and management. Cheng et al. used a supply–demand matching hypernetwork (Matching-Net) approach to model the supply–demand matching problems in service-oriented manufacturing systems [27]. Uetake et al. applied a two-sided matching model to formulate banks’ entry and merger decisions with externality [28]. Liang et al. developed a quantitative matching decision model to balance evaluative criteria in the Two-Sided Matching (TSM) decision [29]. Many researchers have studied two-sided matching problems from different perspectives, including matching type, the benchmarks of the matching scheme, and the processing of the preference ordinal information of both sides. Vecchio et al. discussed the role that information has in shaping individual mobility choices, and how it may interact with individual preferences and needs [30]. Yousaf et al. considered the personal preferences of the riders and the drivers so that they can have the best possible match along the dimensions of compatibility that will make the ride more pleasant [20]. Fan et al. clarified that the psychological behavior of agents on both sides should be considered in the existing two-sided matching methods [31]. Chen et al. opined that the expectation levels of attributes given by demanders and suppliers should be considered in suitable knowledge service matching problems [32]. Echenique et al. investigated the testable implications of the theory of stable matchings [33]. Zhong et al. studied a one-to-many two-sided matching problem and converted it into a one-to-one two-sided matching problem [34]. Nevertheless, the topics associated with task distribution based on two-sided matching decision theory can only be found in the bounded literature.
On the other hand, Kahneman et al. presented a critique of expected utility theory as a descriptive model of decision making under risk, and developed an alternative model, called prospect theory, in which the value function can be used to describe the characteristics of the subject’s behavior, such as “reference dependence”, “loss aversion”, and “diminishing sensitivity” [35]. At present, the prospect theory has been widely applied in the field of economy and management to characterize the subject’s incomplete rationality behavior. Fulga et al. focused on the incorporation of investor’s preferences into the Mean-Risk framework to better capture the practical behavior of the loss-averse investor [36]. Based on prospect theory and psychological behavior (e.g., judgmental distortion, reference dependence, and loss aversion) of the decision maker, Tan et al. designed a method to solve a discrete stochastic multiple-criteria decision making (MCDM) problem with aspiration levels [37]. Wang et al. elaborated that novel group emergency decision making was related to experts’ psychological behavior in the group emergency decision making process [38]. Guan et al. took into consideration both the loss aversion and sensitivity analysis for the risk management in a defined contribution (DC) pension plan [39]. With respect to the risk decision making problem, Liu et al. devised a multi-attribute decision making method based on prospect theory, which considers the influence on different parameters of value function [40]. The aforementioned literature indicates that the application of prospect theory is scenario-dependent. That is, different problems should be combined with specific scenarios. There are different effects for different decision-making reference points and decision making for different parameters of value function on the feasibility of the method. In this sense, the parameters involved in the models are related to the specific issues.
3. Problem Description
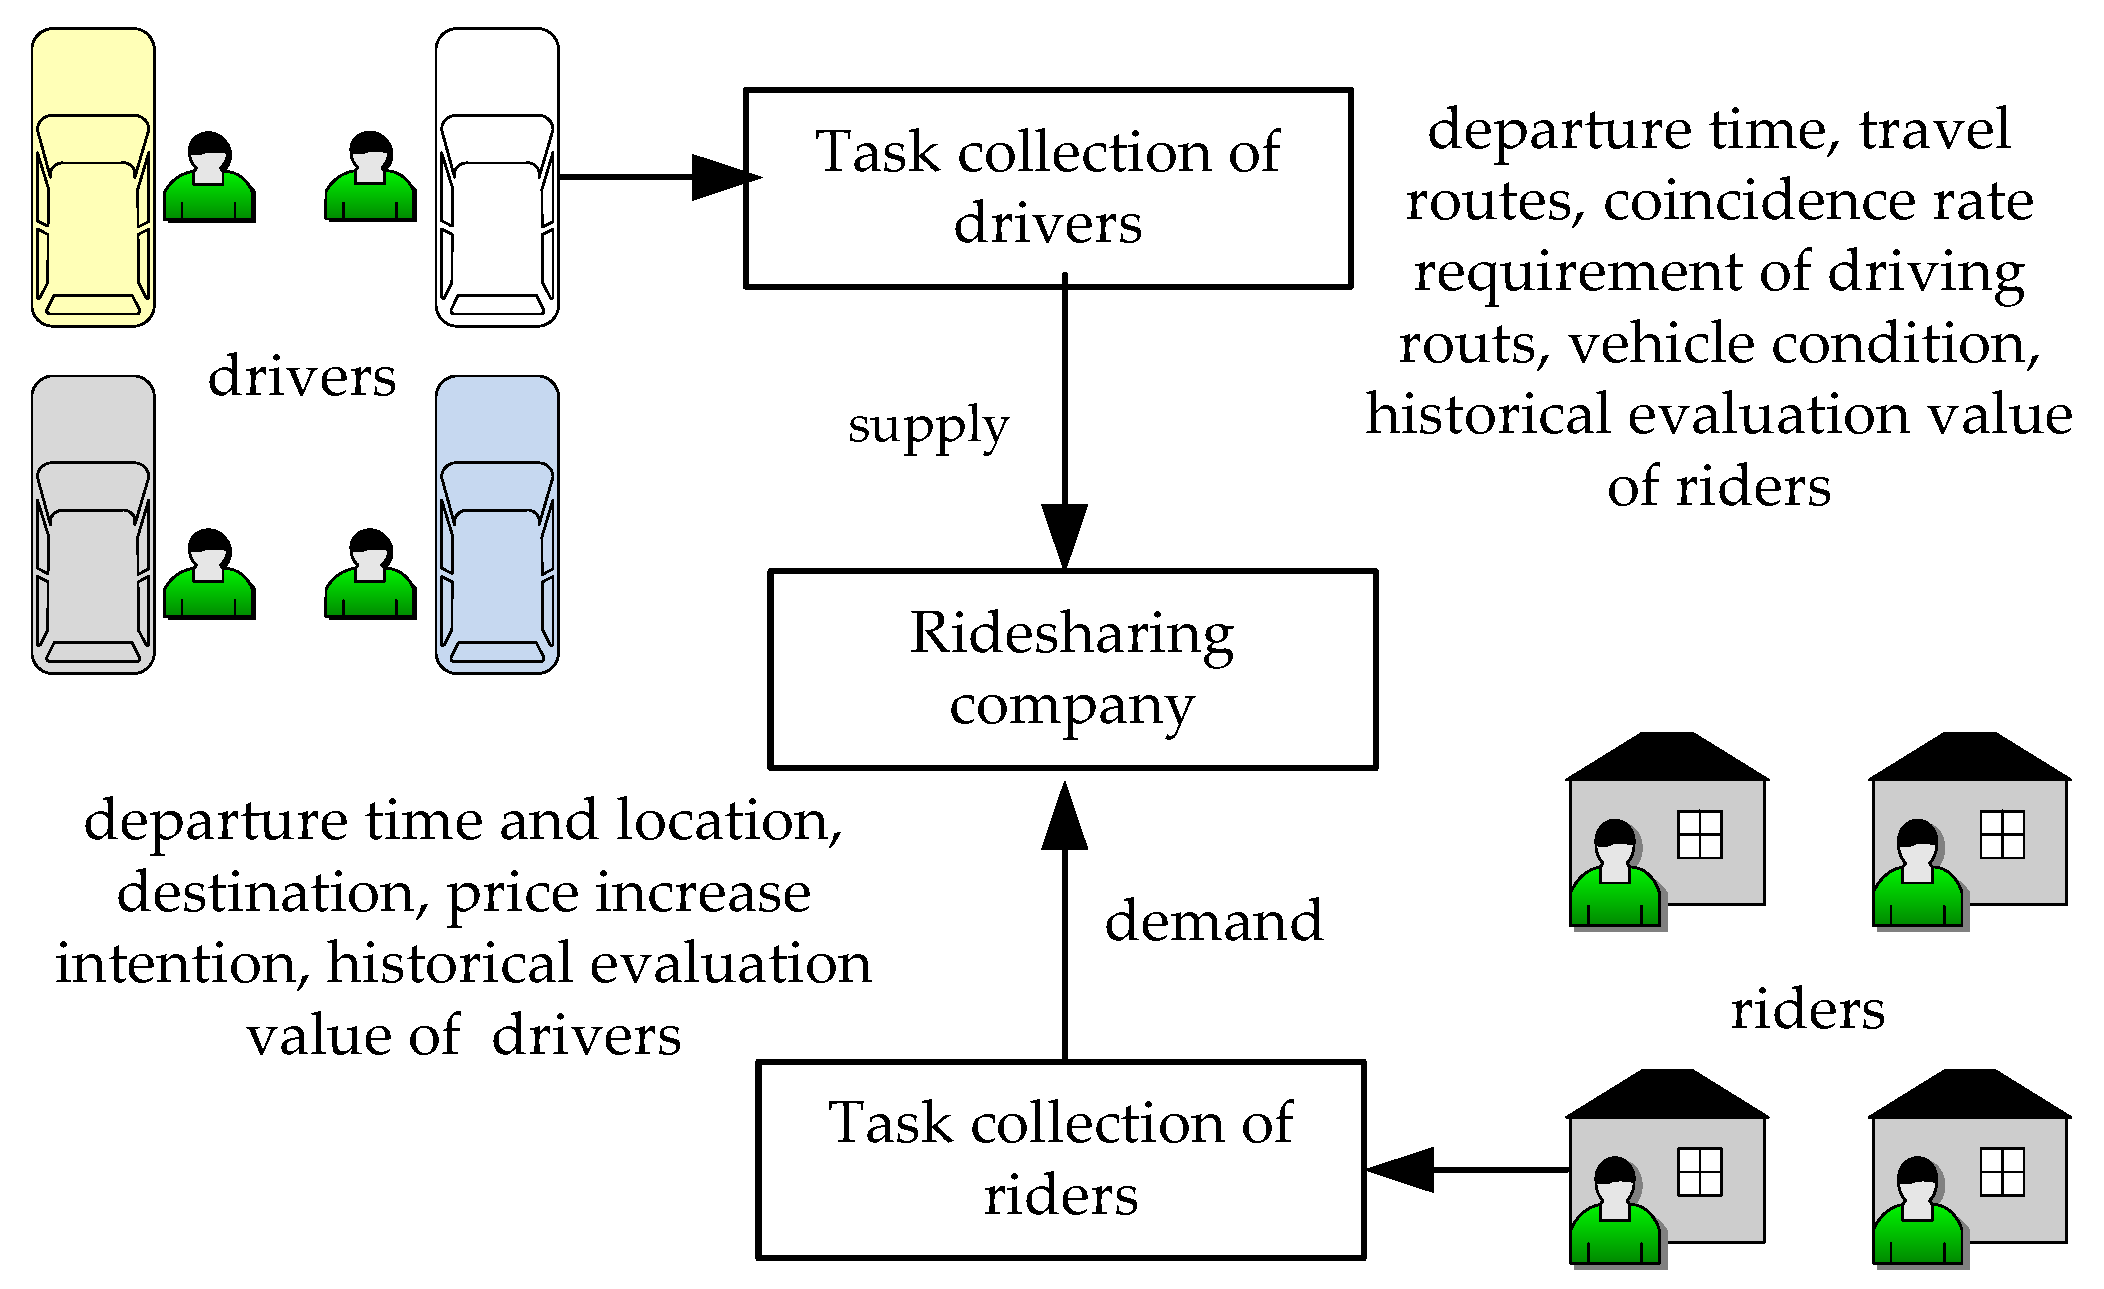
Hitch was a group ridesharing service along preset routes. Hitch was for casual drivers who wanted to recoup some gas money and toll fees on their daily commute—by inputting their start and end points into the app, Hitch connected them with nearby passengers heading in the same direction, allowing them to share the ride. This was different from the traditional taxi-type service as drivers had control over where the ride ended, and they did not make a profit off the service—passengers only paid for the cost of gas and tolls [41]. In order to achieve the system dispatch of Hitch services, the information pertaining to drivers and riders needs to be collected within a bounded time by ridesharing companies. Besides, a matching relationship is constructed with the premise of meeting the basic requirements, such as the departure time, destination, and coincidence rate of driving routes. Constructing a set of potential matching objects, calculating the comprehensive evaluation value regarding matching parties to potential matching objects based on the participants’ preferences and concerns, and then, aiming at optimizing the perception of the participants to the matching scheme, a matching relationship between supply and demand for the task can be presented, as shown in Figure 1.
3.1. Description of the Notations
This subsection presents the necessary notations depicted in Table 2.
3.2. One-to-One Two-Sided Matching
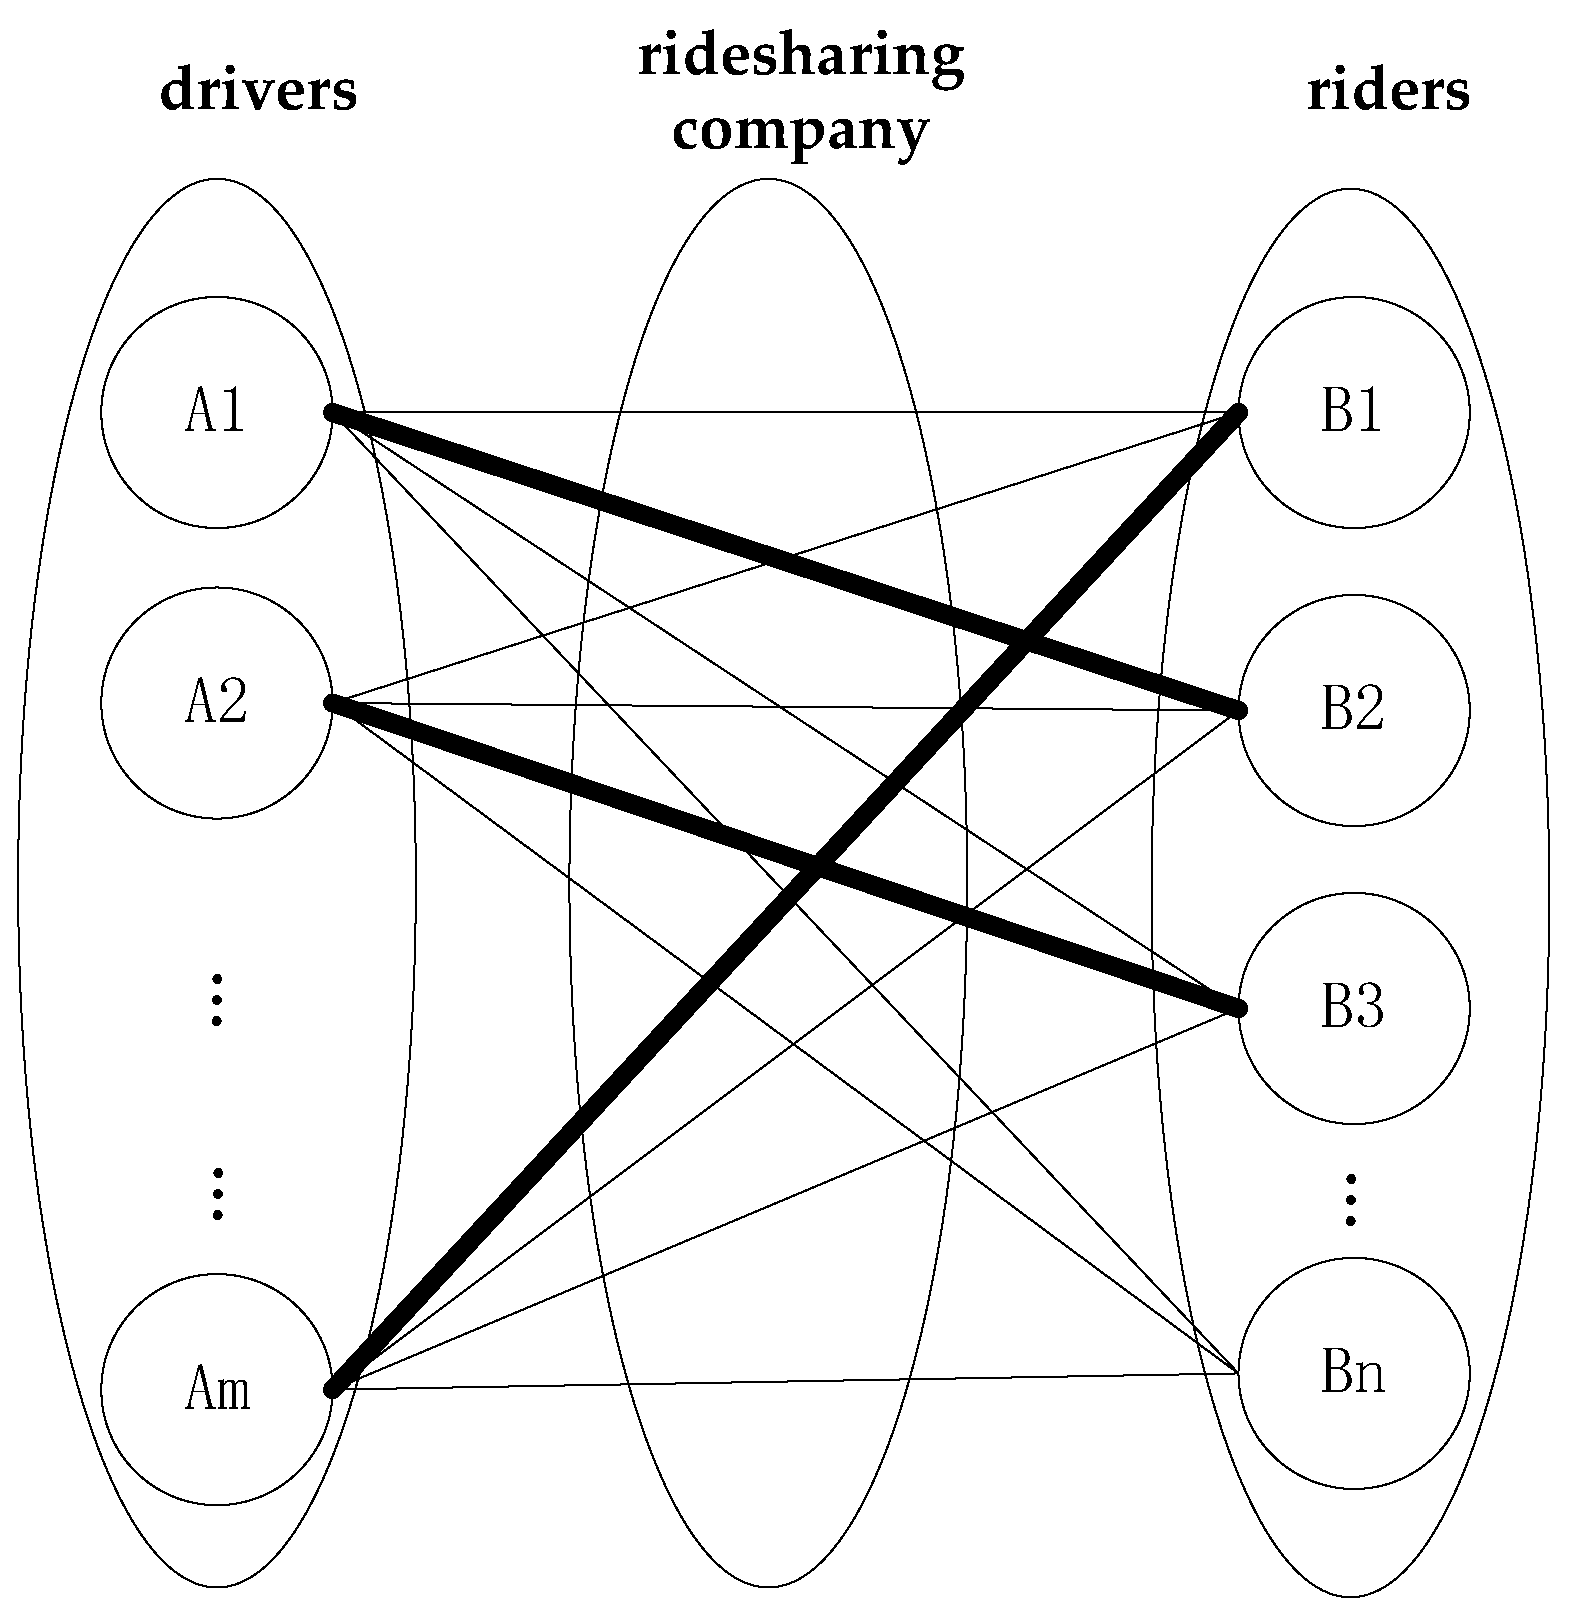
The Hitch tasks can be divided into two types: intercity and commuting. This paper studies the task matching problem during a commute. During commuting, the drivers are more willing to pick up one rider in order to avoid wasting time caused by a detour to pick up more riders. Therefore, we assume that a one-to-one two-sided matching relationship is formed between drivers and riders during commuting. As shown in Figure 2, the possible matching schemes are marked with the thin lines, and each of them corresponds to a set of bi-directional comprehensive evaluation information that meets the basic requirements. The bold lines represent the matching pairs of final matching schemes. Furthermore, for general ridesharing service problems, a one-to-many two-sided matching model or stages of a many-to-many two-sided matching model can be adopted. The general ridesharing service problems and their models will also be our focus in the future.
3.3. The Benchmark of the Two-Sided Matching Scheme
This paper is dedicated to answering how to model and optimize the bi-directional choice between drivers and riders. Optimization objectives of a two-sided matching decision-making model are related to satisfaction, stability, and fairness [42]. Specifically, satisfaction refers to both parties obtaining acceptable matching objects, thus making it easier to accept the matching scheme. Stability ensures a stable matching relationship between subjects in the matching scheme. Fairness can be achieved by equalizing the ranking values of both parties. In the process of ridesharing task distribution, the matching relationship of both sides is short-term. The matching objects focus on whether an acceptable scheme can be obtained in time, but do not compare in detail whether the ranking of both sides in the queue of the matching scheme is balanced and whether a stable matching relationship can be established. In the context of this, the objective function regarding comprehensive evaluation of the matching scheme is used to optimize satisfaction, which is to optimize the perceived suitability of drivers and the perceived acceptability of riders.
4. Two-Sided Matching Decision Model Formulation
4.1. Characterization of Two-Sided Matching Relationships
4.1.1. The Comprehensive Evaluation Vector and Matrix Regarding Matching Scheme
A ridesharing company comprehensively evaluates each potential matching object according to the participants’ concerns, and obtains the comprehensive evaluation value of the matching object. The comprehensive evaluation vector is obtained, collecting the comprehensive evaluation values of all drivers, and the comprehensive evaluation matrix is constructed. Similarly, the comprehensive evaluation vector regarding the perceived acceptability of and the comprehensive evaluation matrix of all riders can be obtained.
4.1.2. The Comprehensive Evaluation Mean Vector for Historical Matching Scheme
The companies comprehensively consider the characteristic values of potential tasks (such as the fit degree of the task time window, the coincidence rate of driving routes, and the matching degree of supply and demand vehicles) and the behavior characteristics of potential task executors (such as the punctuality of travel, driving habits, attitudes, and so on) of potential matching objects, to evaluate each potential matching scheme, and obtain the evaluation indicators towards a potential matching scheme. After the participants complete the matching scheme, the comprehensive evaluation value of the task is obtained, and the historical evaluation value of the individual can be calculated accordingly. The historical evaluation value regards the perceived suitability of to historical matching scheme . Collecting the comprehensive evaluation mean values of all drivers, the historical evaluation mean vector is obtained. Similarly, the historical evaluation value regarding the perceived acceptability of to historical matching scheme , and vector of all riders can be obtained.
4.2. Establishment of Perception Function of Both Sides Based on Prospect Theory
Kahneman et al. proposed the value function of the prospect theory with ‘’, ‘’, and ‘’, which can better characterize subjective behavior characteristics of “reference dependence”, “loss aversion”, and “diminishing sensitivity” [35]. Therefore, the perception function of drivers and riders to the matching scheme is established in this section.
4.2.1. Determination of Reference point
The drivers and the riders will compare the comprehensive conditions of the matching objects with their historical scheme and then judge the “loss” and “gain”. Thus, the historical evaluation mean or is set as the reference point.
4.2.2. The Perception Function of the Drivers
Based on the value function of the prospect theory, by analyzing the task distribution problem of the drivers, the perception function curve of drivers to the matching scheme is obtained. It is presented in Figure 3.
- ①
- The origin (the reference point) measures the comprehensive evaluation value regarding the perceived suitability of the drivers equal to their historical evaluation mean, in which .
- ②
- In the first quadrant curve (yield curve), it measures the comprehensive evaluation value regarding the perceived suitability of drivers to the matching scheme. As the comprehensive evaluation value of the matching objects (riders) increases, the perceived suitability of the drivers to the matching scheme increases. Due to the “marginal diminishing effect”, the growth rate of perceived suitability gradually declines, and the perceived suitability of drivers gets the upper limit .
- ③
- The third quadrant curve (loss curve) measures whether drivers think the matching scheme is unreasonable, which is in the state of “loss”. Combined with “loss-averse”, as the comprehensive evaluation value of the matching object decreases, the suitability of drivers to the matching scheme decreases obviously, and the loss aversion coefficient is set. The perceived suitability of drivers would get the lower limit .where and are power parameters related to gains and losses, respectively, and 0 ≤ , 1 ≤ , and is the risk-aversion parameter, which has the characteristic of being steeper for losses than for gains, where > 1 [38].
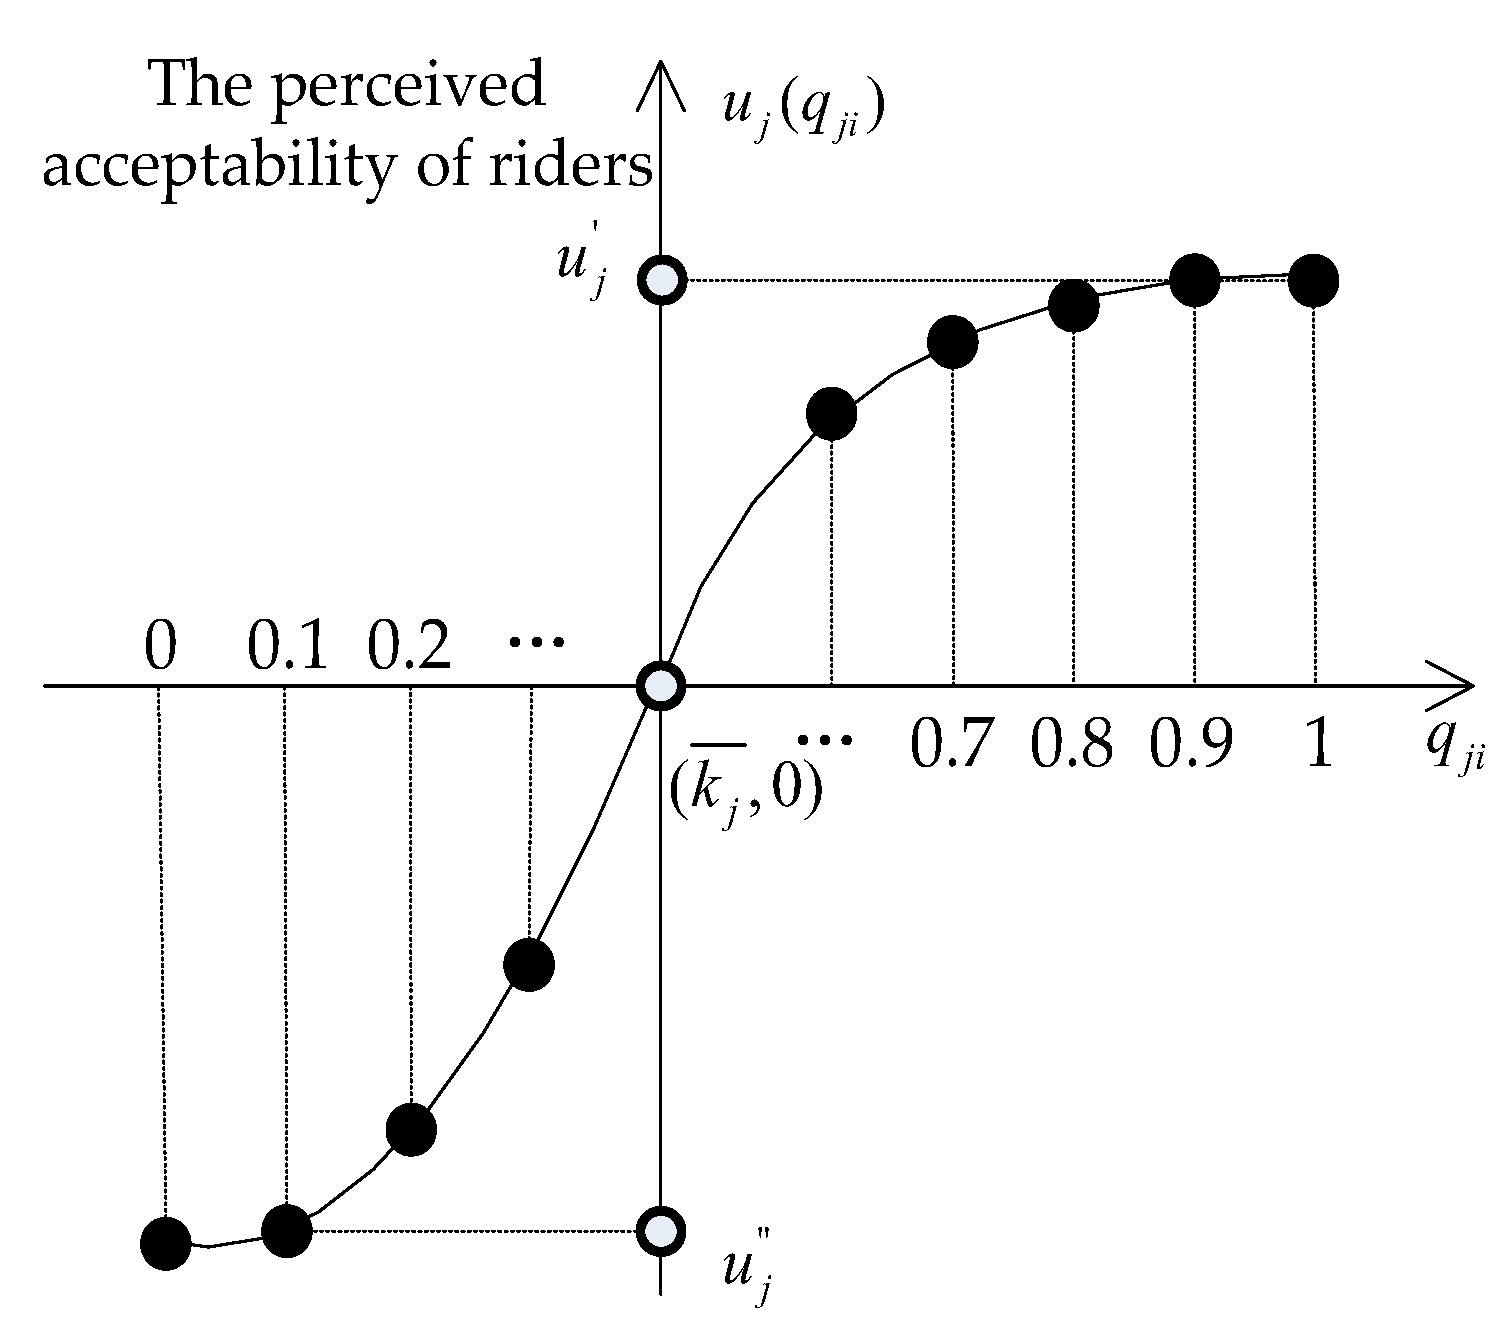
4.2.3. The Perception Function of Riders
Similarly, the perception function curve of the rider to the matching scheme is shown in Figure 4.
4.3. A Two-Sided Matching Decision Model Considering Psychological Perceived Behavior.
With the objectives of maximizing the perceived suitability of drivers and the perceived acceptability of riders, combined with the constraints, a two-sided matching decision model considering psychological perceived behavior is constructed as follows:
Herein, Equations (3) and (4) present objective functions in a two-sided matching model. Equation (3) is used to maximize the perceived suitability of drivers to the matching scheme. Equation (4) is employed to maximize the perceived acceptability of riders to the matching scheme. The expressions are shown in Equations (1) and (2). Formulas (5) and (6) represent all constraints. Constraint (5) limits the driver so that they can only match with one rider in a trip, constraint (6) represents the total number of matching pairs equal to the minimum number of drivers and riders, and expression (7) represents the range of decision variables.
5. The Numerical Example
5.1. Description of the Test Data
The practical investigation results on finding the number of drivers and riders is affected by multiple factors (e.g., regional population scale, the generalization of ridesharing services, weather conditions, day, date, and so on). We made an actual investigation of Hello’s Hitch service of the Alibaba group. We know that the number of drivers and riders ranges from 20 to 50. In the ridematching problem with time windows experimental design [43], the number of drivers is 250, and the number of riders is 448, and the experimentation data comes from “a travel and activity survey for northeastern Illino”. The market of northeastern Illino is relatively mature, however. Hello chuxing is a new ridesharing business in a relatively small but fast growing market. Considering that the Hitch business in the Chinese market is in the ascendant stage, this paper use the data scales of (50,50)–(300,300) to verify the feasibility of the model and algorithm. In addition, both the case data and the actual investigation show that the supply and demand are unbalanced, so it is necessary to study the matching problem of the ridesharing task under unbalanced supply-demand. Thus, the medium data size (100,150) is designed in the experiment under unbalanced supply-demand.
It is a complex process to effectively quantify the and , and involves a multi-factor comprehensive evaluation of the time window, itinerary, and matching objects. Overall, the evaluation indicators towards a potential matching scheme can be divided into two types: one evaluates potential tasks’ attributes by evaluating whether the characteristics of ridesharing tasks match (such as the fit degree of task time window, the coincidence rate of driving routes, and the matching degree of supply and demand vehicles), the other one evaluates potential task executors by evaluating whether the behavior characteristics of potential task executors match (e.g., the punctuality of travel, driving habits, attitudes, and so on).
The evaluation value of the first type can be obtained by calculating the characteristic values of potential tasks (such as task time windows and displacement space). The evaluation value of the second type can be obtained from the historical evaluation of potential task executors.
At present, in the ridesharing business operation, the matching of the first type of indicator is realized through system dispatching and a manual menu in the process of task execution. Therefore, ex-post evaluations of ridesharing participants only include an evaluation regarding the behavior of ridesharing task executors, not including the time and itinerary matching of the ridesharing scheme. The ex-post evaluations cannot be used as the evaluation value toward the matching scheme (the and ). For further research, we will focus on quantization of and in the future. The research in this paper focuses on constructing a model to optimize the perception of the ridesharing participants in the acquisition of and . Therefore, this paper has tried to simulate the and . When the number of both survey samples and reference points is large, the data generally shows a normal distribution [44]. The comprehensive evaluation value of drivers and riders is normalized (standardized) and distributed at interval (0, 1). Therefore, the computer randomly generates the and at interval (0, 1) according to the normal distribution.
The historical evaluation mean values and are established based on the comprehensive evaluation values of the matching scheme experienced by the ridesharing participants. Therefore, the range of and is affected by the range of and . At the same time, the historical evaluation mean value is random due to the numbers participated in Hitch services and the comprehensive evaluation value of each matching scheme of drivers and riders is uncertain. Therefore, and are randomly generated by a computer at interval (0, 1).
Simulated data of different scales is generated according to the above numerical range and data distribution. Tversky and Kahneman experimentally estimated the parameters of the typical individual as , [45]. The integer programming function ‘intlinprog’ of Matlab (R2017b) is used to solve the Hitch matching problem of different scales. The results are shown in Table 3. The numerical size (,) column denotes the number of drivers and riders, denotes the weight of drivers, at the same time riders’ weight is (), and the operation time (s) column denotes the time required to find a matching scheme under a single .
The results in Table 3 show that the integer programming function ‘intlinprog’ of Matlab (R2017b) can be used to solve the problem concerning the Hitch matching of realistic data scales within a limited time. All the experiments are conducted on the server machine with Intel core i5 7th gen CPU 2.7 GHZ made in Intel Products (Chengdu) Co. Ltd in China, and an installed memory (RAM) of 8 GB.
5.2. Analysis of the Weights Assigned to Different Objectives
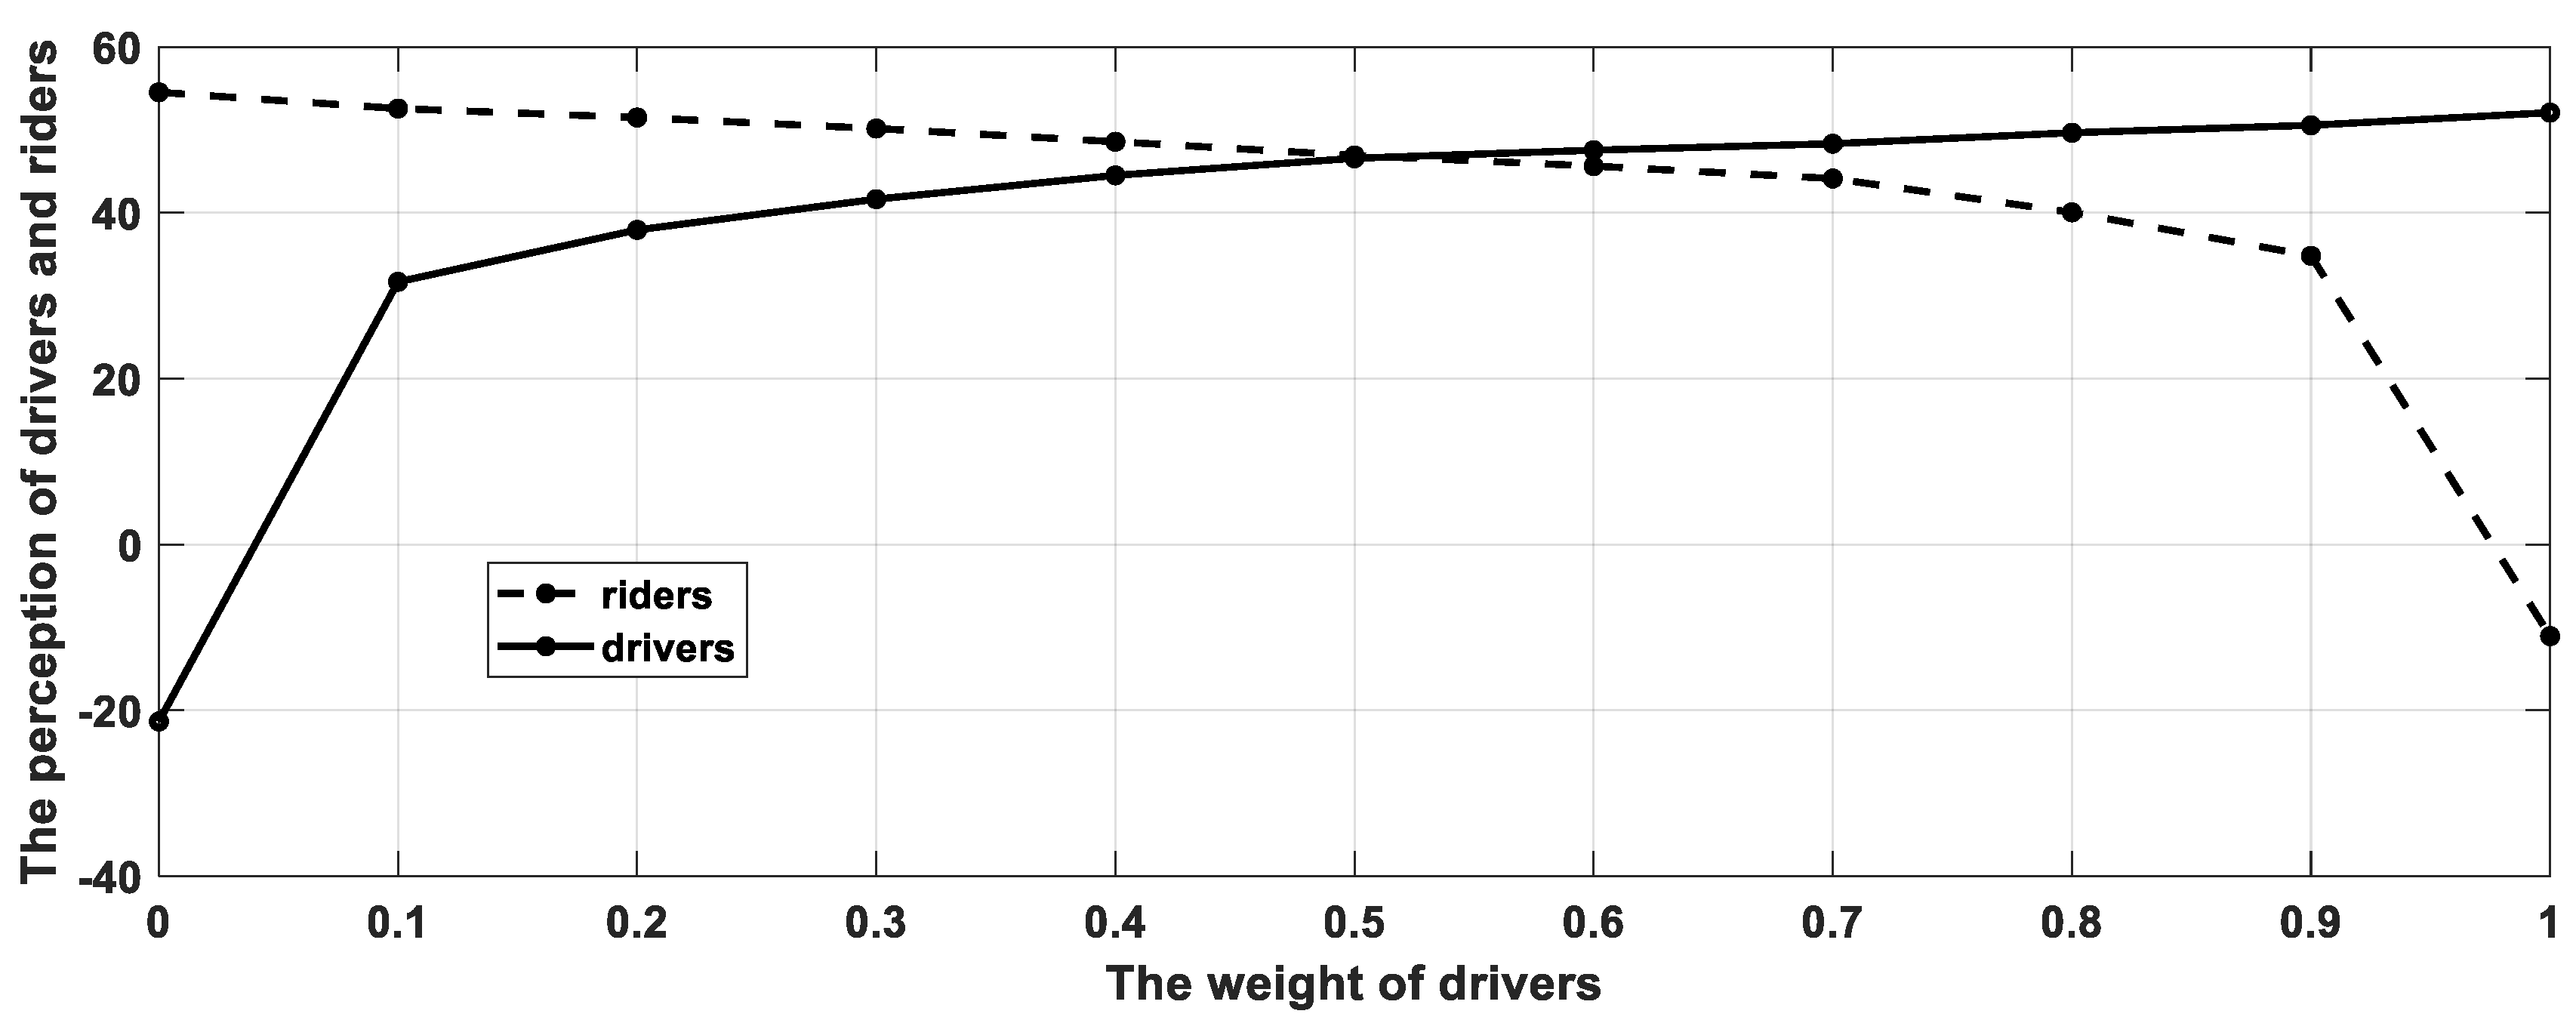
There will be differences in the matching scheme under different objectives. Therefore, this section analyzes the impact of different objective weights on the matching scheme, discusses how to combine characteristics of the supply and the demand to select the appropriate objective weights, and generates a matching scheme. As shown in Figure 5, the number of drivers and riders that is simulated is 100, that is, the numerical size (m,n) = (100,100). The abscissa represents objective weights of the ridesharing participants (the sum of the driver’s objective weight and the rider’s objective weight is 1), the ordinate represents the perception of the matching scheme regarding the ridesharing participants, the solid line in Figure 5 represents the sum of perceived suitability of all drivers, and the dotted line represents the sum of the perceived acceptability of all riders.
The following conclusions can be obtained based on Figure 5.
- ①
- Both drivers and riders can get a better comprehensive perception when their perception of matching scheme is taken into consideration;
- ②
- With the improvement of the weight of the perception regarding one side, the weight of the perception regarding the other side can be correspondingly decreased. Causing the integral perception of the weight increase side in the matching scheme is improved, and the integral perception of the weight reduction side is decreased;
- ③
- The perception of the matching scheme regarding the other objects decreases rapidly based on only optimizing the perception of one object. For example, DiDi’s Hitch business was used to encourage drivers to provide sharing services by adopting the task distribute mode of priority dispatching for drivers. The results of this approach have proved to be a failure.
5.3. Analysis of Multi-Objective Weight Setting and Managerial Insights Under Unbalanced Supply-Demand
The randomness of the supply and demand in Hitch services causes unbalanced supply-demand, that is, (the number of drivers is not equal to the number of riders). At present, the travel time and itinerary of the Hitch business meet the basic requirements of riders, and the costs paid by riders is lower than that of taxis, meaning that the supply and demand relationship is usually in short supply. Therefore, this section studies the multi-objective weight setting under unbalance supply-demand by taking the ridesharing task matching problem under unbalance supply-demand as an example.
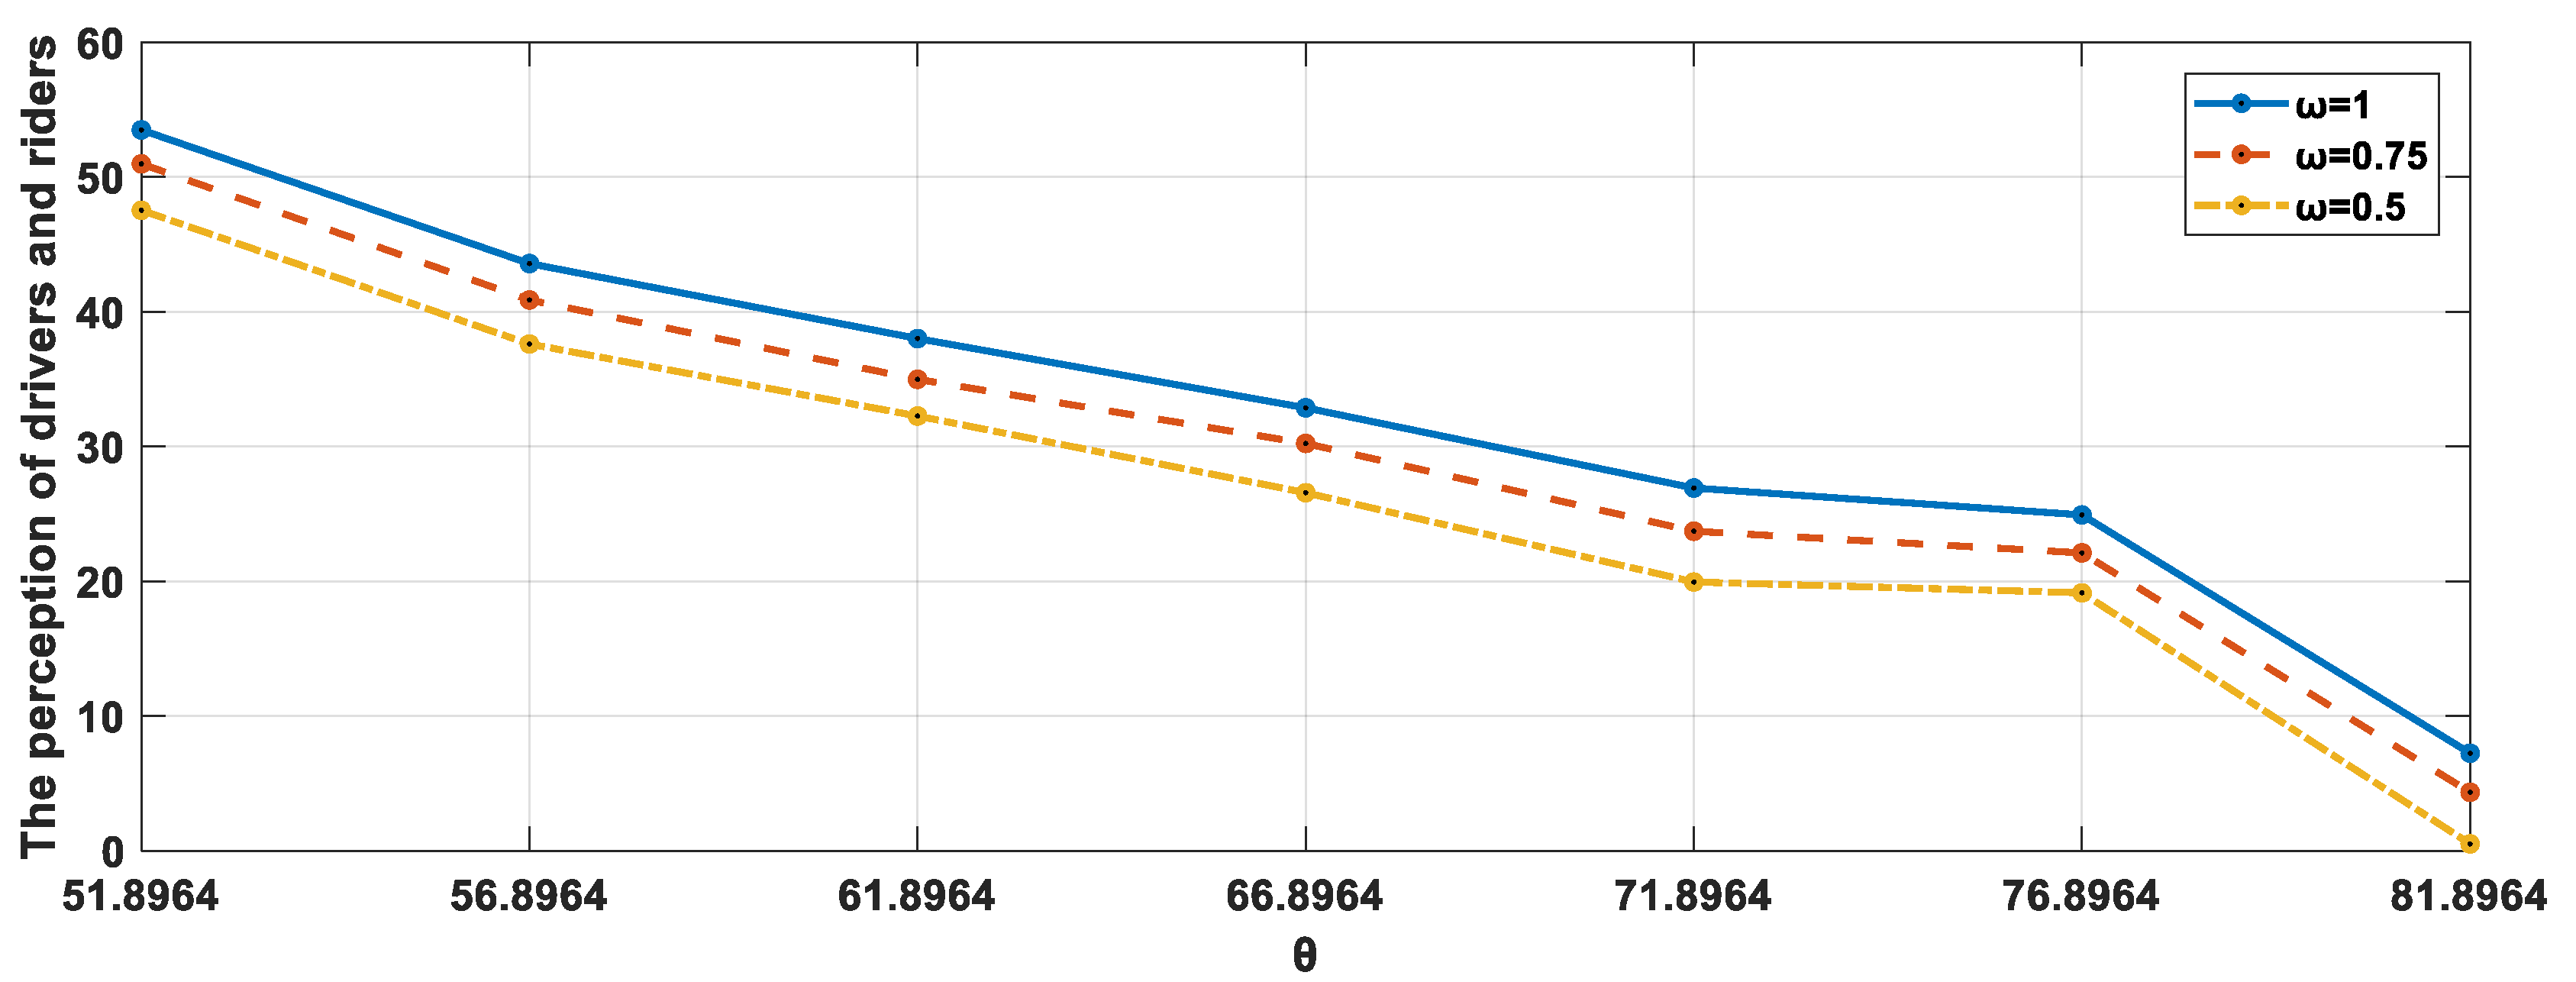
When matching tasks, ridesharing companies will pay attention to the perceived suitability of drivers, and attract drivers to continuously provide Hitch services by optimizing their perception of the matching scheme under unbalanced supply-demand. However, the optimization of drivers‘ perception will inevitably lead to an integral increase in their historical evaluation mean value, and the change of drivers’ historical evaluation mean value will affect their perception of the matching scheme in the subsequent task matching.
As shown in Figure 6, the numerical size (,) = (100,150). The abscissa () represents the sum of the historical evaluation mean value of drivers, the ordinate represents the perceived suitability of drivers, and the lines in Figure 6 represent the sum of the perceived suitability of drivers under different perceived objective weights.
The following can be seen from Figure 6. Firstly, under the premise that the historical evaluation mean value of driver’s is constant, with the improvement of the weight of the driver’s perception, the integral perceived suitability of drivers increases. Secondly, with the improvement of the lower limit of the historical evaluation mean value, the integral perception suitability of drivers decreases.
Managerial insights are proposed, and taking measures to stimulate participants in the short term can improve the side of deficit’s perception. However, such measures will increase the historical evaluation mean value of the side of deficit, resulting in it becoming more and more difficult to meet their requirement in the long term. Therefore, in the case of short-term shortage of one party or alternating shortage of both parties, more attention can be paid to the insufficient party and give the insufficient party higher weight in the matching task. However, if one party is in an insufficient state for a long time, it is not suitable to optimize its perception by simply increasing the weight in the matching task. Attracting more external personnel to make up for the deficiency is becoming more importantly.
6. Conclusions and Future Works
This paper proposes a multi-objective one-to-one two-sided matching model for the Hitch task distribution problem regarding sustainability. Participants’ (drivers and riders) perspective on sustainability manifests access and equity, and needs fulfilment. The model design reflects the bi-directional choice of matching agents. In terms of objective functions, the perception functions of drivers and riders are considered. In addition, they are designed based on the value function of prospect theory, in order to reflect the characteristics of the subjective behaviors, such as “reference dependency”, “loss avoidance”, and “decreasing sensitivity”, in which the historical comprehensive evaluation mean value of drivers and riders is regarded as a reference point. Furthermore, in the section “The numerical example”, the integer programming function ‘intlinprog’ of Matlab (R2017b) is used to solved the Hitch matching problem of different scales, the feasibility of the model and the solution are verified, and an analysis of the multi-objective weights’ setting and the proposal of managerial insights are then presented.
The results demonstrate that the proposed model has potential advantages for distributing Hitch tasks. That is, an optimized one-to-one matching scheme concerning Hitch task distribution can be obtained. The sustainable operations of ridesharing companies can be realized by constructing a fair and satisfactory matching scheme. Increasingly, this paper aims to not only evaluate the proposed model, but call for the incorporation of sustainability in the two-sided matching problem regarding task distribution in ridesharing companies.
However, in the model, the comprehensive evaluation value and the historical evaluation mean value of the matching objects (the experimental data) are obtained by a computer simulation based on the investigation. The mutual evaluation between riders and drivers is a complex process. It involves multi-dimensional evaluation indicators, and comprehensive evaluation regarding the Hitch drivers to obtain information is uncertain and fuzzy. We will work on data acquisition of the ex-post evaluations provided by drivers and riders to the matching objects, analyzing the concerns and preferences of different participants in the matching scheme in different scenarios, and design the comprehensive evaluation functions of the Hitch participants to the matching objects based on the fuzzy multi-attribute decision making theory.
Author Contributions
All of the authors have contributed to the idea of this paper. Q.Y. developed the mathematical model, wrote the whole manuscript, and designed the experiments. C.C. has significantly contributed to the design of the system. The other authors have contributed equally to the supervision of all the activities of this work.
Funding
This research was funded by the Thirteenth Five-Year Planning Project of Philosophy and Social Science in Sichuan Province grant number SC18B093, Planning Project of Philosophy and Social Science in Chengdu grant number 2018R23, Team project funding of scientific research innovation for colleges and universities in Sichuan Province grant number 15TD0004, and National undergraduate innovation and entrepreneurship training program of China grant number 201810636116.
Conflicts of Interest
The authors declare no conflict of interest.
References
- Furuhata, M.; Dessouky, M.; Ordónez, F.; Brunet, M.E.; Wang, X.; Koenig, S. Ridesharing: The state-of-the-art and future directions. Transp. Res. Part B Methodol. 2013, 57, 28–46. [Google Scholar] [CrossRef]
- DiDi Hitch. Available online: https://www.didiglobal.com/about-special/milestone (accessed on 14 January 2019).
- Greenwood, B.N.; Wattal, S. Show Me the Way to Go Home: An Empirical Investigation of Ride-Sharing and Alcohol Related Motor Vehicle Fatalities. MIS Q. 2017, 41, 163–187. [Google Scholar] [CrossRef]
- Hello Hitch. Available online: http://www.hellobike.com/newsDetail.html?guid=23d15d7acb124fa1997e14d8b5796272 (accessed on 22 February 2019).
- Pelzer, D.; Xiao, J.J.; Zehe, D.; Lees, M.H.; Knoll, A.C.; Aydt, H. A partition-based match making algorithm for dynamic Ridesahring. IEEE Trans. Intell. Transp. Syst. 2015, 16, 2587–2598. [Google Scholar] [CrossRef]
- Barann, B.; Beverungen, D.; Müllerc, O. An open-data approach for quantifying the potential of taxi ridesahring. Decis. Support Syst. 2017, 99, 86–95. [Google Scholar] [CrossRef]
- Lee, A.; Savelsbergh, M. Dynamic Ridesharing: Is there a role for dedicated drivers? Transp. Res. Part B 2015, 81, 483–497. [Google Scholar] [CrossRef]
- Rayle, L.; Dai, D.; Chan, N.; Cervero, R.; Shaheen, S. Just a better taxi? A survey-based comparison of taxis, transit, and ridesourcing services in San Francisco. Transp. Policy 2016, 45, 168–178. [Google Scholar] [CrossRef]
- Chan, N.D.; Shaheen, S.A. Ridesharing in North America: Past, Present, and Future. Transp. Rev. 2012, 32, 93–112. [Google Scholar] [CrossRef] [Green Version]
- Carter, C.R.; Rogers, D.S. A framework of sustainable supply chain management: Moving toward new theory. Int. J. Phys. Distrib. Logist. Manag. 2008, 38, 360–387. [Google Scholar] [CrossRef]
- Schreieck, M.; Safetli, H.; Siddiqui, S.A.; Pflügler, C.; Wiesche, M.; Krcmar, H. A matching algorithm for dynamic ridesharing. Ridesharing Transp. Res. Procedia 2016, 19, 272–285. [Google Scholar] [CrossRef]
- Seuring, S. Integrated chain management and supply chain management comparative analysis and illustrative cases. J. Clean. Prod. 2004, 12, 1059–1071. [Google Scholar] [CrossRef]
- Hong, Z.; Chen, Y.; Mahmassani, H.S.; Xu, S. Commuter ride-sharing using topology-based vehicle trajectory clustering: Methodology, application and impact evaluation. Transp. Res. C Emerg. Technol. 2017, 85, 573–590. [Google Scholar] [CrossRef]
- Agatz, N.; Erera, A.; Savelsbergh, M.; Wang, X. Optimization for dynamic ride-sharing: A review. Eur. J. Oper. Res. 2012, 223, 295–303. [Google Scholar] [CrossRef]
- Nourinejad, M.; Roorda, M.J. Agent based model for dynamic ridesharing. Transp. Res. Part C 2016, 64, 117–132\. [Google Scholar] [CrossRef]
- Wang, X.L.; Yang, H.; Zhu, D.L. Driver-rider cost-sharing strategies and equilibria in a ridesharing program. Transp. Sci. 2018, 52, 868–881. [Google Scholar] [CrossRef]
- Ma, R.; Zhang, H.M. The morning commute problem with ridesharing and dynamic parking charges. Transp. Res. Part B Methodol. 2017, 106, 345–374. [Google Scholar] [CrossRef]
- Liu, Y.; Li, Y.Y. Pricing scheme design of ridesharing program in morning commute problem. Transp. Res. Part C Emerg. Technol. 2017, 79, 156–177. [Google Scholar] [CrossRef]
- Mallus, M.; Colistra, G.; Atzori, L.; Murroni, M.; Pilloni, V. Dynamic Carpooling in Urban Areas: Design and Experimentation with a Multi-Objective Route Matching Algorithm. Sustainability 2017, 9, 254. [Google Scholar] [CrossRef]
- Yousaf, J.; Li, J.Z.; Chen, L.; Tang, J.; Dai, X.W. Generalized multipath planning model for ride-sharing systems. Front. Comput. Sci. 2014, 8, 100–118. [Google Scholar] [CrossRef]
- Lee, H.L.; Tang, C.S. Socially and Environmentally Responsible Value Chain Innovations: New Operations Management Research Opportunities. Manag. Sci. 2017, 64, 983–996. [Google Scholar] [CrossRef]
- Jaehn, F. Sustainable Operations. Eur. J. Oper. Res. 2016, 253, 243–264. [Google Scholar] [CrossRef]
- Cao, C.; Li, C.; Yang, Q.; Zhang, F. Multi-Objective Optimization Model of Emergency Organization Allocation for Sustainable Disaster Supply Chain. Sustainability 2017, 9, 2103. [Google Scholar] [CrossRef]
- Cao, C.; Li, C.; Yang, Q.; Liu, Y.; Qu, T. A novel multi-objective programming model of relief distribution for sustainable disaster supply chain in large-scale natural disasters. J. Clean. Prod. 2018, 174, 1422–1435. [Google Scholar] [CrossRef]
- Gale, D.; Shapley, L.S. College Admissions and the Stability of Marriage. Am. Math. Mon. 1962, 69, 9. [Google Scholar] [CrossRef]
- Korkmaz, I.; Gokcen, H.; Çetinyokuş, T. An analytic hierarchy process and two-sided matching based decision support system for military personnel assignment. Inf. Sci. 2008, 178, 2915–2927. [Google Scholar] [CrossRef]
- Cheng, Y.; Tao, F.; Zhao, D.; Zhang, L. Modeling of manufacturing service supply–demand matching hypernetwork in service-oriented manufacturing systems. Robot. Comput. Manuf. 2017, 45, 59–72. [Google Scholar] [CrossRef]
- Uetake, K.; Watanabe, Y. Entry by Merger: Estimates from a Two-Sided Matching Model with Externalities. SSRN Electron. J. 2012. [Google Scholar] [CrossRef]
- Liang, R.; Wu, C.; Sheng, Z.; Wang, X. Multi-Criterion Two-Sided Matching of Public–Private Partnership Infrastructure Projects: Criteria and Methods. Sustainability 2018, 10, 1178. [Google Scholar] [CrossRef]
- Vecchioa, G.; Tricarico, L. “May the Force move you”: Roles and actors of information sharing devices in urban mobility. Cities 2018. [Google Scholar] [CrossRef]
- Fan, Z.P.; Li, M.Y.; Zhang, X. Satisfied Two-Sided Matching: A Method Considering Elation and Disappointment of Agent. Soft Computing 2018, 22, 7227. [Google Scholar] [CrossRef]
- Chen, X.; Li, Z.; Fan, Z.-P.; Zhou, X.; Zhang, X. Matching demanders and suppliers in knowledge service: A method based on fuzzy axiomatic design. Inf. Sci. 2016, 346, 130–145. [Google Scholar] [CrossRef]
- Echenique, F.; Lee, S.; Shum, M.; Yenmez, M.B. The Revealed Preference Theory of Stable and Extremal Stable Matchings. Econometrica 2013, 81, 153–171. [Google Scholar] [CrossRef]
- Zhong, L.W.; Bai, Y.Q. Equivalence of two-sided stable matching. J. Comb. Optim. 2018, 36, 1380–1387. [Google Scholar] [CrossRef]
- Kahneman, D.; Tversky, A. Prospect theory: An analysis of decision under risk. Estudios De Psicología Stud. Psychol. 1987, 8, 95–124. [Google Scholar] [CrossRef]
- Fulga, C. Portfolio optimization under loss aversion. Eur. J. Oper. Res. 2016, 251, 310–322. [Google Scholar] [CrossRef]
- Tan, C.Q.; Lp, W.H.; Chen, X.H. Stochastic multiple criteria decision making with aspiration level based on prospect stochastic dominance. Knowl.-Based Syst. 2014, 70, 231–241. [Google Scholar] [CrossRef]
- Wang, L.; Wang, Y.-M.; Martínez, L. A group decision method based on prospect theory for emergency situations. Inf. Sci. 2017, 418, 119–135. [Google Scholar] [CrossRef]
- Guan, G.H.; Liang, Z.X. Optimal management of DC pension plan under loss aversion and Value-at-Risk constraints. Insur. Math. Econ. 2016, 69, 224–237. [Google Scholar] [CrossRef]
- Liu, P.; Jin, F.; Zhang, X.; Su, Y.; Wang, M. Research on the multi-attribute decision-making under risk with interval probability based on prospect theory and the uncertain linguistic variables. Knowl.-Based Syst. 2011, 24, 554–561. [Google Scholar] [CrossRef]
- Lovelock, C.; Wirtz, J.; Tang, C. Uber: Competing as Market Leader in the US versus Being a Distant Second in China; World Scientific Pub Co. Pte Lt.: Singapore, 2016; pp. 626–632. [Google Scholar]
- Kong, D.C.; Jiang, Y.P.; Liang, H.M. Stable Matching with Fairness for Two-sided Agents. J. Syst. Manag. 2015, 24, 397–404. [Google Scholar]
- Herbawi, W.; Weber, M. The ridematching problem with time windows in dynamic ridesharing: A model and a genetic algorithm. In Proceedings of the 2012 IEEE Congress on Evolutionary Computation (CEC), Brisbane, QLD, Australia, 10–15 June 2012; pp. 1–8. [Google Scholar]
- D’Agostino, R.B. Tests for the Normal Distribution. Goodness-of-Fit-Techniques; Routledge: Abingdon-on-Thames, UK, 2017; pp. 367–420. [Google Scholar]
- Tversky, A.; Kahneman, D. Advances in prospect theory: Cumulative representation of uncertainty. J. Risk Uncertain. 1992, 5, 297–323. [Google Scholar] [CrossRef] [Green Version]
Figure 1.
Task distribution for ridesharing.

Figure 2.
One-to-one two-sided matching framework between drivers and riders.

Figure 3.
The perception curve of drivers to different matching objects (riders).

Figure 4.
The perception curves of riders for different matching objects (the drivers).

Figure 5.
The perception of drivers and riders with different objective weights.

Figure 6.
The change trends of the sum of the perception of all drivers.


Table 1.
Summary of the literature pertaining to the ridesharing problem.
| Reference | Year | Main Objectives | ||
|---|---|---|---|---|
| Economic | Social Cost | Environment | ||
| Hong et al. | 2017 | √ | √ | |
| Nourinejad et al. | 2016 | √ | ||
| Barann et al. | 2017 | √ | √ | |
| Pelzer et al. | 2015 | √ | ||
| Wang et al. | 2018 | √ | ||
| Ma et al. | 2017 | √ | ||
| Lee et al. | 2015 | √ | ||
| Liu et al. | 2017 | √ | ||
| Mallus et al. | 2017 | √ | √ | |
| Yousaf et al. | 2014 | √ | √ | |
Table 2.
Table of notations.
| Notation | Description |
|---|---|
| The number of drivers | |
| The number of riders | |
| Set of drivers, where , denotes driver , and , where | |
| Set of riders, where , denotes rider , and ,where | |
| The comprehensive evaluation vector regarding the perceived suitability of to potential matching schemes provided by riders, where , denotes the comprehensive evaluation value regarding the perceived suitability of to potential matching scheme provided by | |
| The comprehensive evaluation matrix regarding the perceived suitability of potential drivers to potential matching schemes provided by riders, where | |
| The comprehensive evaluation vector regarding the perceived acceptability of to potential matching schemes provided by drivers, where , denotes the comprehensive evaluation value regarding the perceived acceptability of to potential matching scheme provided by | |
| The comprehensive evaluation matrix regarding the perceived acceptability of potential riders to potential matching schemes provided by drivers, where | |
| The historical evaluation mean regarding the perceived suitability of to historical matching scheme | |
| The comprehensive evaluation value regarding the perceived suitability of to historical matching scheme , , where , denotes the numbers of success matching scheme | |
| The historical evaluation mean vector regarding the perceived suitability of drivers to historical matching scheme, where | |
| The historical evaluation mean regarding the perceived acceptability of to historical matching scheme | |
| The comprehensive evaluation value regarding the perceived acceptability of , to historical matching scheme , , where , denotes the numbers of matching scheme | |
| The historical evaluation mean vector regarding the perceived acceptability of riders to historical matching scheme, where | |
| The perception function of to matching scheme | |
| The perception function of to matching scheme |
Table 3.
Results in the context of a balanced number of drivers and riders.
| Operation Time (s) | |||||
|---|---|---|---|---|---|
| (50,50) | 28.7921 | −20.4788 | −18.1376 | 31.4482 | 0.1596 |
| (100,100) | 45.2423 | −25.4568 | −21.3699 | 44.1580 | 0.2456 |
| (150,150) | 79.3023 | −33.0059 | −31.4955 | 76.4522 | 0.5130 |
| (200,200) | 105.3567 | −44.2357 | −52.2579 | 109.2479 | 1.3174 |
| (250,250) | 123.2316 | −46.8948 | −61.9862 | 129.0581 | 2.3250 |
| (300,300) | 153.0194 | −74.3257 | −89.2357 | 159.3575 | 2.9516 |
© 2019 by the authors. Licensee MDPI, Basel, Switzerland. This article is an open access article distributed under the terms and conditions of the Creative Commons Attribution (CC BY) license (http://creativecommons.org/licenses/by/4.0/).
Share and Cite
MDPI and ACS Style
Yang, Q.; Liu, J.; Liu, X.; Cao, C.; Zhang, W. A Two-Sided Matching Model for Task Distribution in Ridesharing: A Sustainable Operations Perspective. Sustainability 2019, 11, 2187. https://0-doi-org.brum.beds.ac.uk/10.3390/su11072187
AMA Style
Yang Q, Liu J, Liu X, Cao C, Zhang W. A Two-Sided Matching Model for Task Distribution in Ridesharing: A Sustainable Operations Perspective. Sustainability. 2019; 11(7):2187. https://0-doi-org.brum.beds.ac.uk/10.3390/su11072187
Chicago/Turabian StyleYang, Qin, Jinfeng Liu, Xing Liu, Cejun Cao, and Wei Zhang. 2019. "A Two-Sided Matching Model for Task Distribution in Ridesharing: A Sustainable Operations Perspective" Sustainability 11, no. 7: 2187. https://0-doi-org.brum.beds.ac.uk/10.3390/su11072187
Note that from the first issue of 2016, this journal uses article numbers instead of page numbers. See further details here.