Article

Residents’ Perception of Destination Quality: Key Factors for Sustainable Rural Development

1
Department of Economic Sciences, University of Agricultural Sciences and Veterinary Medicine Cluj-Napoca, 3-5 Manastur Street, 400372 Cluj-Napoca, Romania
2
Department of Agribusiness and Rural Development, College of Agricultural Sciences Engineering, University of Sulaimani, Kurdistan Regional Government-Iraq, Sulaimani-Bakrajo; Sulaimani-IRAQ 334, Iraq
3
Department of Land Measurements and Science, University of Agricultural Sciences and Veterinary Medicine Cluj-Napoca, 3-5 Manastur Street, 400372 Cluj-Napoca, Romania
*
Author to whom correspondence should be addressed.
Sustainability 2019, 11(9), 2594; https://0-doi-org.brum.beds.ac.uk/10.3390/su11092594
Submission received: 8 April 2019 / Revised: 29 April 2019 / Accepted: 29 April 2019 / Published: 6 May 2019

Abstract

:
Tourism represents a viable alternative for economic activities in rural areas, and improves the living standards of the communities. The aim of the paper is to assess residents’ perceptions towards tourism destination quality in the North-West Development Region of Romania using the following items: natural attractions: cultural and social attractions; accommodation; food; availability of transportation to destination area; quality of information and communication; hospitality of host community; feeling of security and safety. A survey was conducted to collect the data and a total of 433 questionnaires were validated and analyzed. Descriptive and inferential statistics (Principal component analysis, ANOVA, Scheffe multiple range test) were used to analyze the data. Results show that there are statistically significant differences in residents’ perceptions between counties. Two of the components of destination quality (general infrastructure and tourism potential) are affected by the gender of residents, while the level of education has no significant effect. A weak and indirect correlation was found between the age of residents and their perception towards a quality destination. This study makes two contributions to the existing literature. First, a questionnaire was developed based on the QUALITEST tool adapted to the realities of the research area. Second, we analyzed the perception of residents towards a quality destination in relation to their socio-demographic characteristics and county of residence. Understanding the implications of tourism development from the residents’ point of view helps to increase knowledge about the factors affecting the long-term, sustainable success of tourism destinations.

1. Introduction

Tourism is one of the largest and fastest growing industries with positive effects on the development of the destination’s economic diversity [1]. Recently, local communities have become a key factor for building sustainable tourism strategies due to the strength to positively or negatively influence tourism development through residents’ attitudes [2,3,4,5]. Community support is valuable in obtaining a successful tourism product [6,7,8], its positive attitudes being strongly related to the perceived advantages offered by the tourism industry [9,10]. Tourism development can be perceived by the rural communities as a positive support for new job opportunities, improvement of welfare and living standards, enhancement of rural infrastructure, and providing new entertainment possibilities [11,12,13,14,15]. At the same time, the development of tourism activity and tourism destination can have negative effects on the host community because of the socio-cultural and environmental costs [16,17]. The involvement of the host community, based on its beliefs and opinions, remains indispensable in any effort towards the sustainable development of the tourism destination [18]. Regarding this process, researchers have also recognized the importance of the participation of different segments of community members, grouped by age, income, or other socio-demographic characteristics [19], as well as the importance of being aware of the effects of socio-demographic characteristics of residents on the level of participation in tourism development [20]. The support of the local community has a direct impact on the development, quality, and sustainability of a tourism destination [21,22,23]. The community factor has impact on visitors’ experience, on their intention to return, and word-of-mouth recommendations [24], tourists being more attracted by destinations where the host is more hospitable [25]. Rural areas can be considered an important factor for tourism development due to the ability to preserve the traditional culture and the ethno-cultural heritage [26]. Neumeier and Pollermann [27] observed that small scale rural tourism has a great potential to be used as a vehicle for rural development even if the economic impact of rural tourism is not significant.
Published studies investigating the tourism activity in the North-West Development Region of Romania are not numerous. The focus is on analyzing secondary data such as statistical indicators regarding the tourism flow and the accommodation capacities from the region, without investigating residents or tourists’ perception about the tourism development [28,29,30,31,32]. Nemirschi and Craciun [31] stated that among the eight regions of development from Romania, the North-West Development Region takes second place in terms of rural tourism potential after the Centre Region. Matei [30] analyzed the rural tourism indicators for the North-West Development Region and concluded that rural tourism had substantial signs of expansion during the period 2006-2013. Researchers analyzed with predilection a specific area from the North-West Development Region, Maramures County, which has a strong potential of becoming a successful destination for rural tourism [28,32]. Rural residents’ support represents an important factor in developing sustainable rural tourism strategies, having on long-term positive impact on the quality of life of residents. To our knowledge, no research was conducted aiming to assess the perception of the rural residents from the North-West Development Region of Romania towards tourism potential and quality of the destination, nor to assess the effects of socio-demographic characteristics on residents’ perception. To achieve the aim of the paper, the following subobjectives were set up: (a): comparative analysis of residents’ perception towards quality destination among the counties of the region; (b): assessment of the influence of the socio-demographic characteristics (gender, education level, age) on the perceived quality of the tourism destination. The paper is structured in five main sections. After the introduction, a section related to the literature review of the tourist area destination is presented. The third part presents the methodology used to achieve the objectives of the research. Furthermore, the fourth section is dedicated to the results and discussion. The paper ends with the conclusions section.

2. Literature review

2.1. Support of Local Community for Destination Development

Competitiveness and attractiveness are the main components of a dual approach for assessing a tourist destination; while the second element refers to the tourist perceptions, the first element is attached to the destination itself [33]. The need for a model that evaluates destinations’ competitiveness represents a major concern for many scholars. Enright and Newton [34] pointed out the need of using a proper methodology when investigating the competitiveness of a tourist destination and concluded that the business factors (political stability, retail sector, staff costs, etc.) should be analyzed besides the classical attractors that define a destination (architecture, night life, festivals, museums etc.). Dwyer and Kim [35] proposed a model of destination competitiveness for identifying the key factors for success and a set of indicators to measure it (general infrastructure, quality services, accessibility, hospitality, and market ties). Ritchie and Crouch [36] identified the following factors of competitiveness of destination: capabilities to increase tourism incomes, capabilities of constant attraction of tourists, providing pleasure and experience, profitability, ensuring life quality for locals, and natural environment protection. Ensuring life quality for locals has a direct impact on their perception about the quality of the destination and support for the future development strategies of the community. Among the key supporting factors and indicators for tourism destination quality and competitiveness, general infrastructure [35,37,38,39,40] is the most frequently mentioned because of its primary role within tourism. Tourism destination quality has a high influence on tourists’ intention to return to the destination, being at the same time an important factor for developing tourism marketing strategies [37,41,42].
Within the same region, residents’ attitudes towards tourism from different towns, neighborhoods, can vary substantially, being influenced by their proximity to tourism centers, meaning that a shorter distance is more likely to influence their perception in a negative way [43,44]. Because the support for tourism development is related to the economic benefits, scholars observed negative perceptions among residents living in tourism centers without economically depending on tourism [45,46]. Ko and Stewart [47] found out that the attitudes of residents from Cheju Islands of Korea towards tourism are directly related to the stage of development of the host community. In Uganda, the local community has a positive attitude towards tourism because it generates income, increases agricultural production, and “good fortune” [48]. Natural environment, climate, cultural, sport, or historically related events have direct influence on the seasonal fluctuation of tourists, ultimately affecting the lives of residents [49]. However, residents’ support for tourism development and their perceived quality of life can vary depending on their evaluation of the cost–benefit ratio [50].
Thus, two important actions can help to foster destination competitiveness: obtaining support from the local community and increasing the life cycle of the tourism destination by using specific marketing strategies.
The above-mentioned studies suggest that residents support towards tourism development varies among regions. Based on this, the following hypothesis is proposed:
Hypothesis 1 (H1):
Tourism destination quality is perceived significantly differently by residents from different counties
The socio-demographic characteristics influence the perception of rural residents towards tourism development and their support [23,51,52]. Previous studies suggested that the influence of socio-demographic characteristics may differ among communities due to the particularities of the regions (customs, beliefs, stage of tourism development etc.). Wang and Pfister [53] underlined that females tend to positively perceive the cultural benefits of tourism development. The development of tourism destination is supported more by females as this sector represents a source of employment and entrepreneurial opportunities for women [23,54]. Even so, females from rural New Zealand are less supportive for tourism development due to the negative perceived impact (traffic increase, noise, and crime) [55]. In other rural communities, males and older residents are more motivated than females and younger people to start a business in tourism, as underlined by Harun et al. [56] in the study conducted in Kurdistan Regional Government.
Education also seems to have an impact on the residents’ support for tourism development. Previous studies revealed that the more educated a person is, the more positively they perceive the impact of tourism development [57,58,59]. A more positive attitude to the tourism and greater support for tourism development can be found in residents with a higher educational or cultural level [57,60,61]. However, according to Liu and Li [62], education level has no influence on residents’ support for tourism development, but it is the most significant variable that influences residents’ perception of tourism impact. The results of Ahmed [63] suggested that educated residents from Sir Lanka are less supportive of tourism development.
With respect to the relationship between age and tourism support, Tichaawa and Makoni [64] observed a lack of consensus. On one hand, there are scholars supporting the idea that as people get older, their perceptions on tourism development become negative [65], on the other hand, there are many researches supporting the contrary, that older people are more supportive for tourism development [44,64,66,67,68]. Wang and Pfister [53] concluded that younger people appreciate more the improvements in social life and recreation facilities. Liu and Li found out that in India, older residents are more supportive for tourism development [62]. The same conclusion was reached before by McGehee and Andereck [1] in their study from Arizona, and by Tomljenovic and Faulkner [67] in their research on Australia’s Gold Coast.
The previous discussion suggests that residents support towards tourism development is affected by the socio-demographic characteristics of the host community. Therefore, the following research hypotheses were developed:
Hypothesis 2a (H2a):
Tourism destination quality is perceived significantly differently by male and female residents
Hypothesis 2b (H2b):
Tourism destination quality is perceived significantly differently across residents’ education groups
Hypothesis 2c (H2c):
Tourism destination quality is perceived significantly differently across residents’ age
The study framework developed based on the literature review and the particularities of the research area is represented in Figure 1.

2.2. Estimation of Quality Tourism Destination

The tourist destination is a complex concept, comprising products, services, and experiences with many stakeholders involved [69]. In order to be competitive and maintain their attractiveness, the local authorities need to respond to the needs of the different market segments and to adapt their promotion strategies accordingly. Therefore, it is important to analyze and to identify each gap that might appear in the tourist product delivery. Residents’ and tourists’ perception towards tourism destination quality offer valuable information to create efficient marketing strategies. Thus, different instruments have been developed to estimate the quality of the products, services, and experiences that can be accessed in a tourist destination.
Parasumaran et al. developed SERVQUAL to evaluate the services’ quality using five dimensions: tangibles; reliability; responsiveness; empathy; and assurance; each dimension being measured using two criteria: the expectations of customers concerning a service, and the perceived levels of service provided [70,71]. Since then, even though the model has been extensively applied, criticisms have appeared regarding some technical issues of the model [72]. Thus, over time, the model of Parasumaran has become a basic skeleton being adapted to different needs [73]. Kim et al. [74] developed the DINESERV scale in order to help restaurant managers to estimate consumers’ quality perception, based on seven dimensions food quality, atmosphere, service quality, comfort, and price. Khan [75] developed the ECOSERV scale to measure the service quality of ecotourism areas and international settings [76]. Lynch [77] constructed a 17-item scale called ATTRACTQUAL with two dimensions, ”interactions” and ”outcomes”, that comprise attraction visitors’ perceptions of service quality [78].
Tribe and Snaith [79] adapted the SERVQUAL instrument to HOLSAT, a research instrument which estimates the satisfaction level of tourists in a destination using the expectations/performance analysis. Later, in 2003, the European Commission developed a system of evaluating the quality of a tourist destination, QUALITEST, based on the principle that the sustainability of the tourism sector is directly linked to the quality of the tourism experience at the destination [80]. The main methods developed over time to evaluate the perceived quality of services and tourism destinations are presented in Table 1.

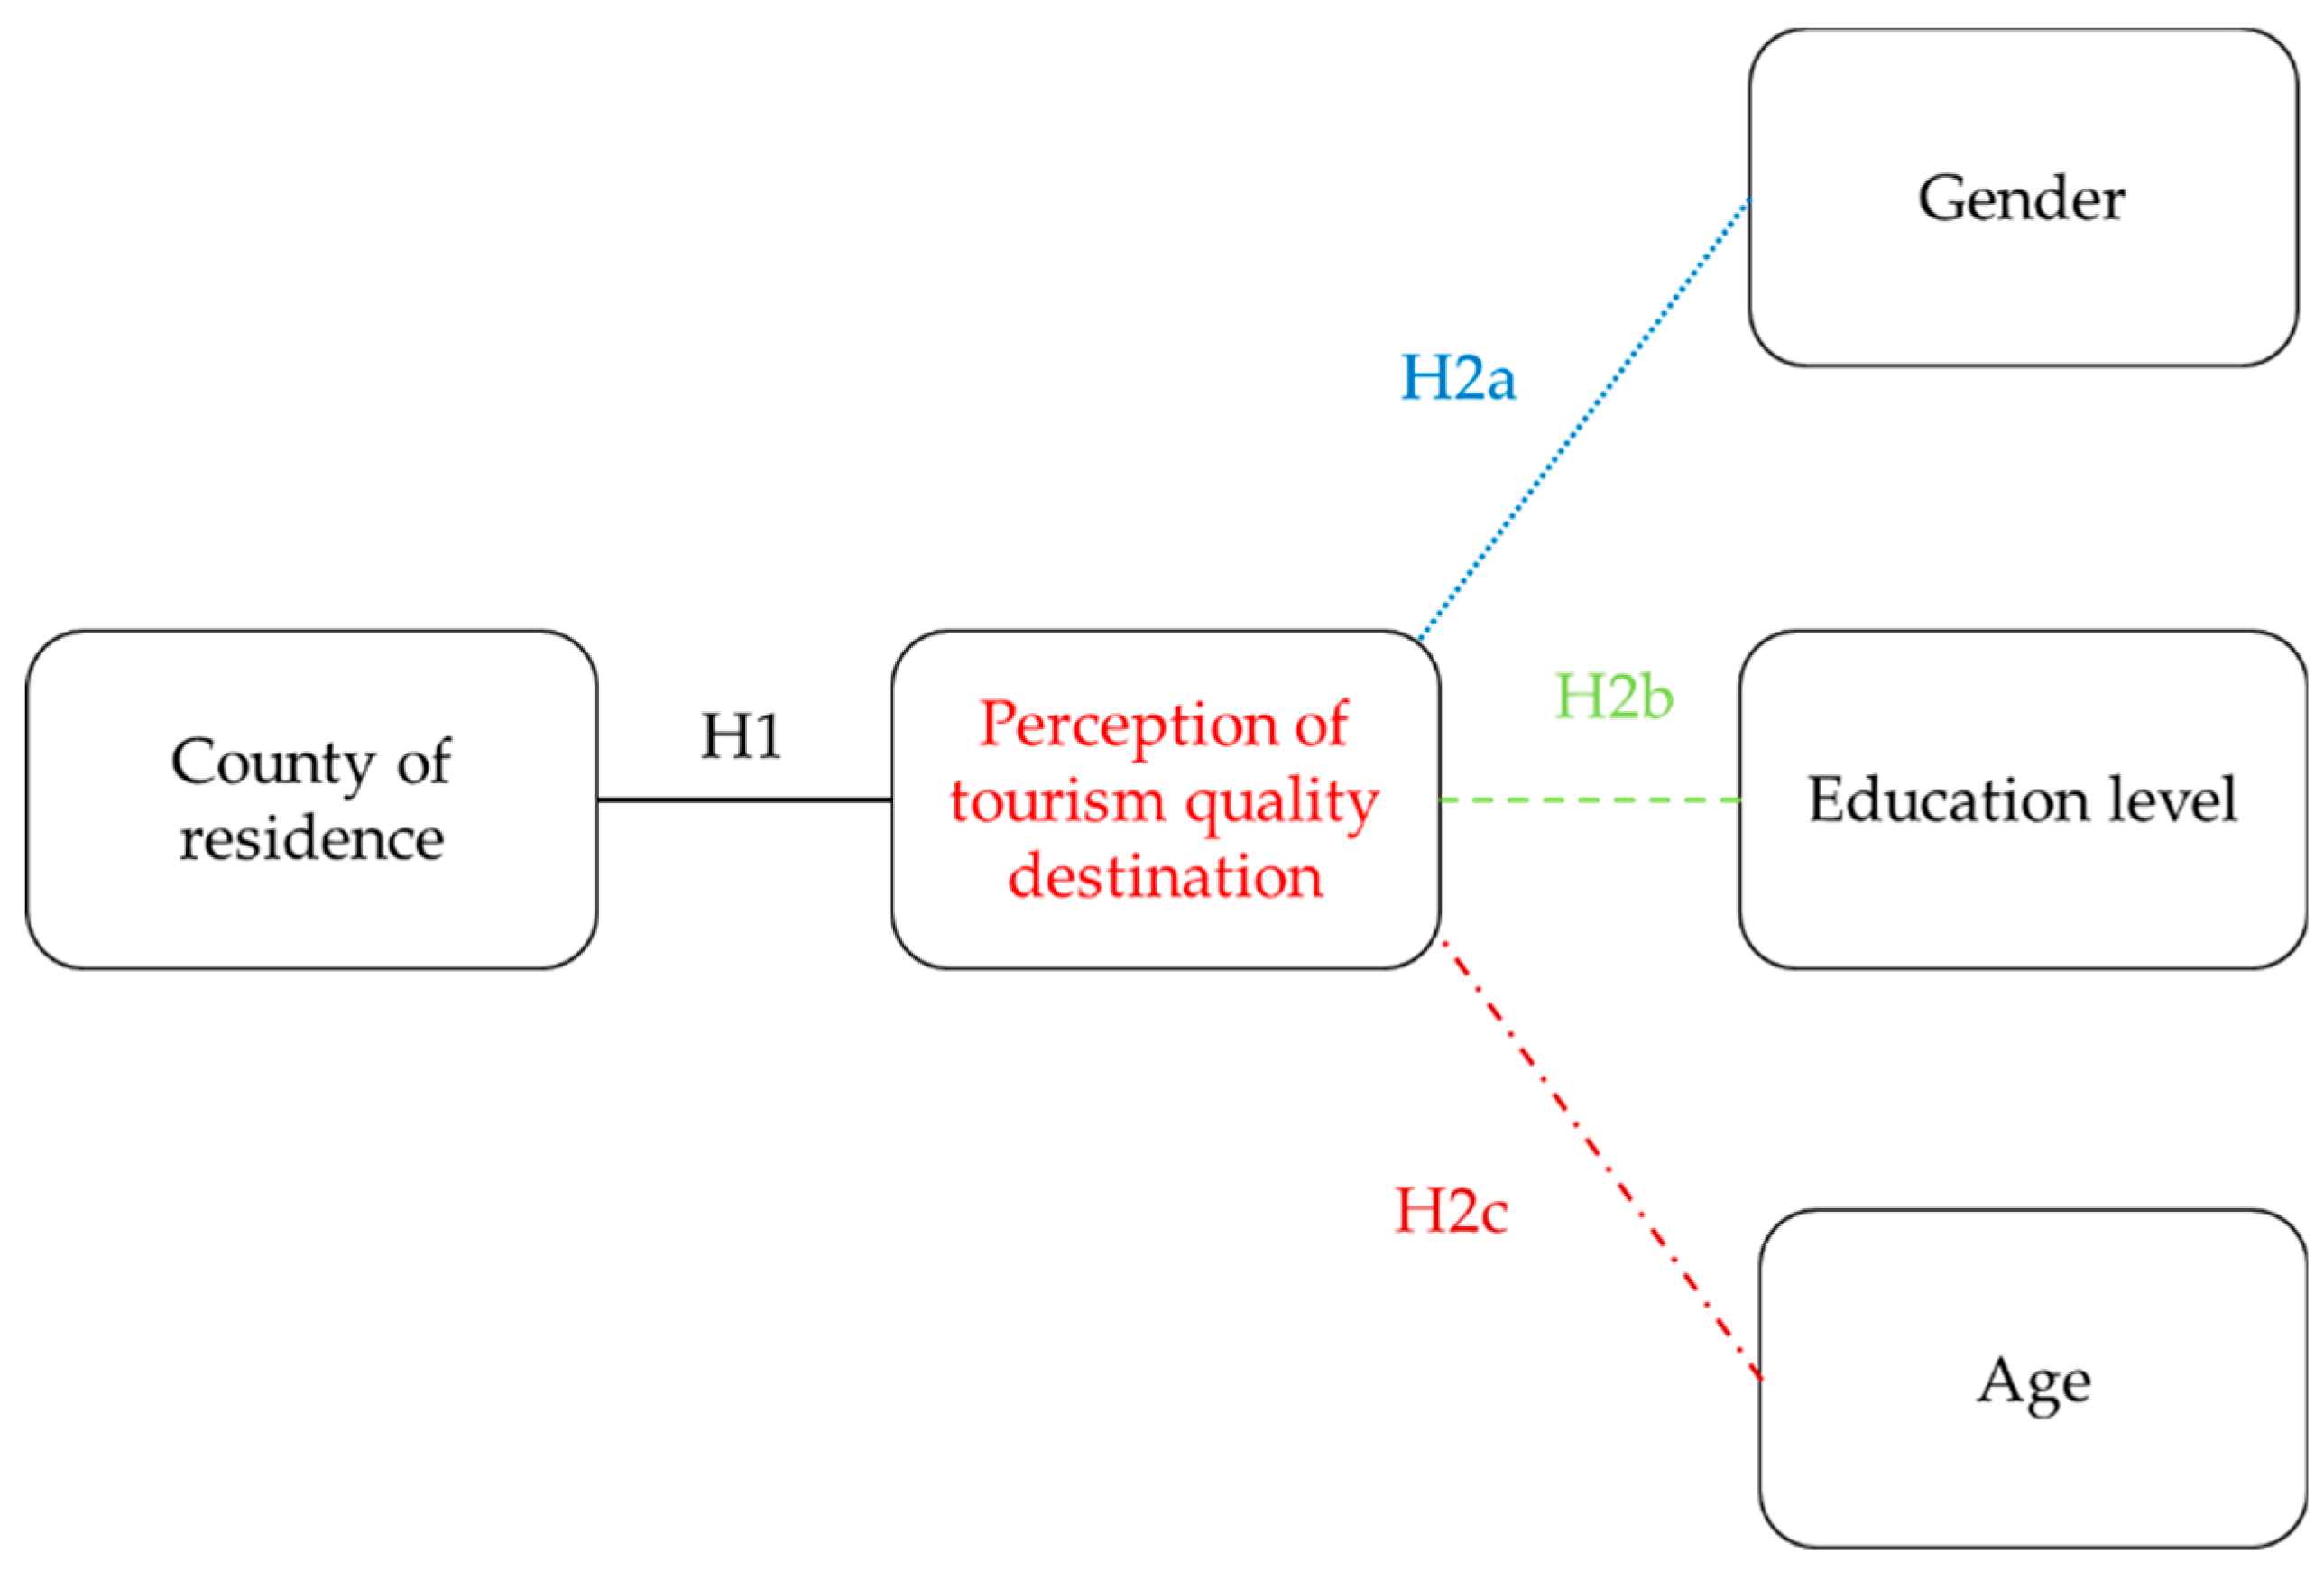
3. Materials and Methods

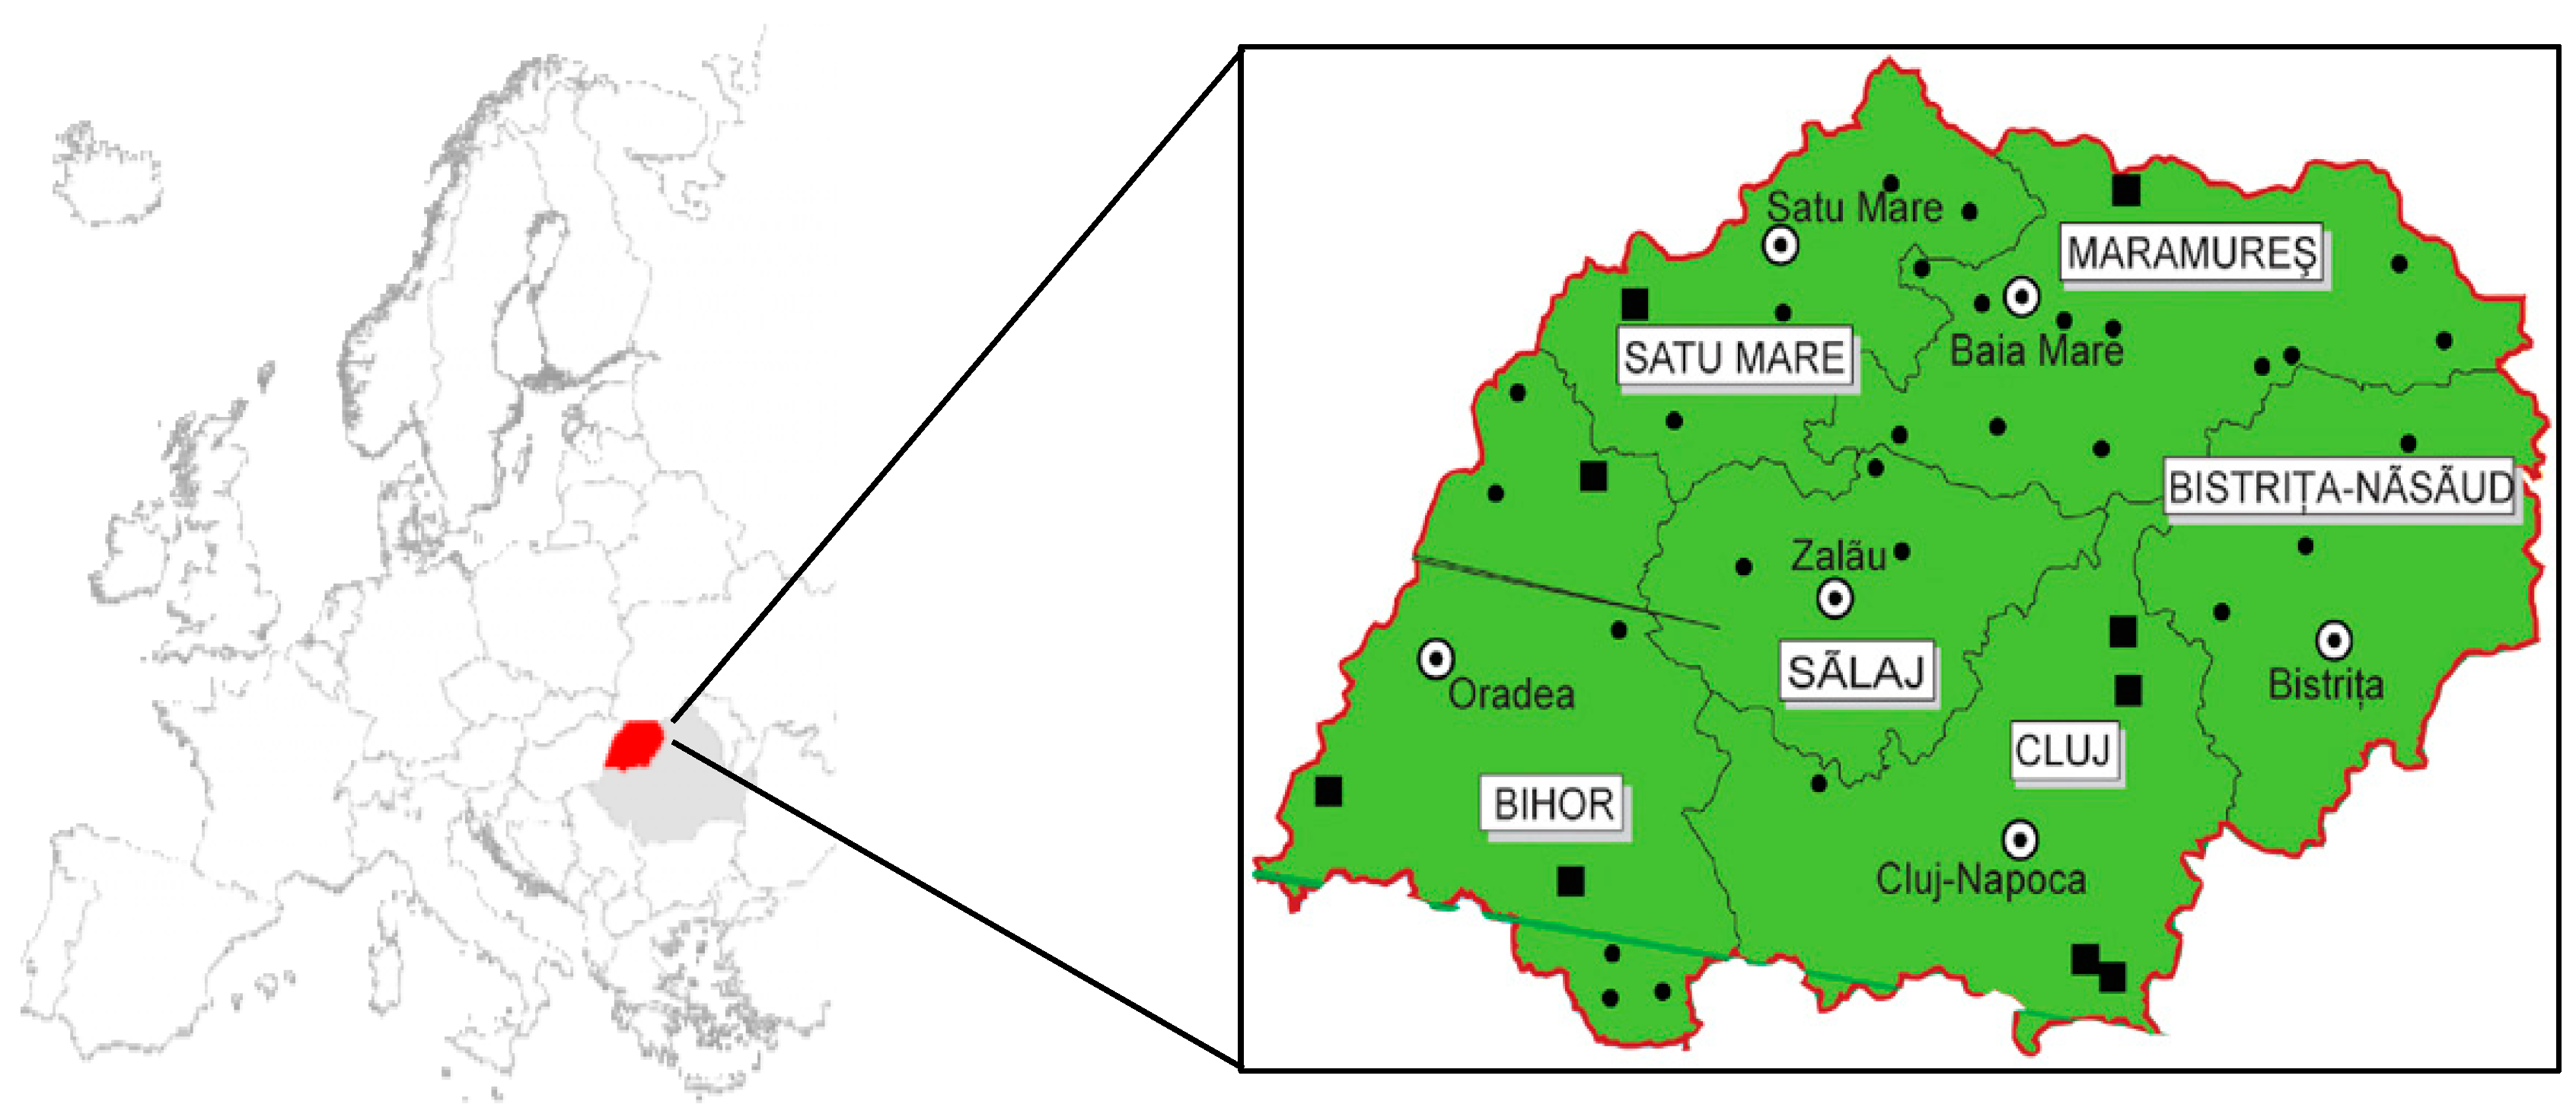
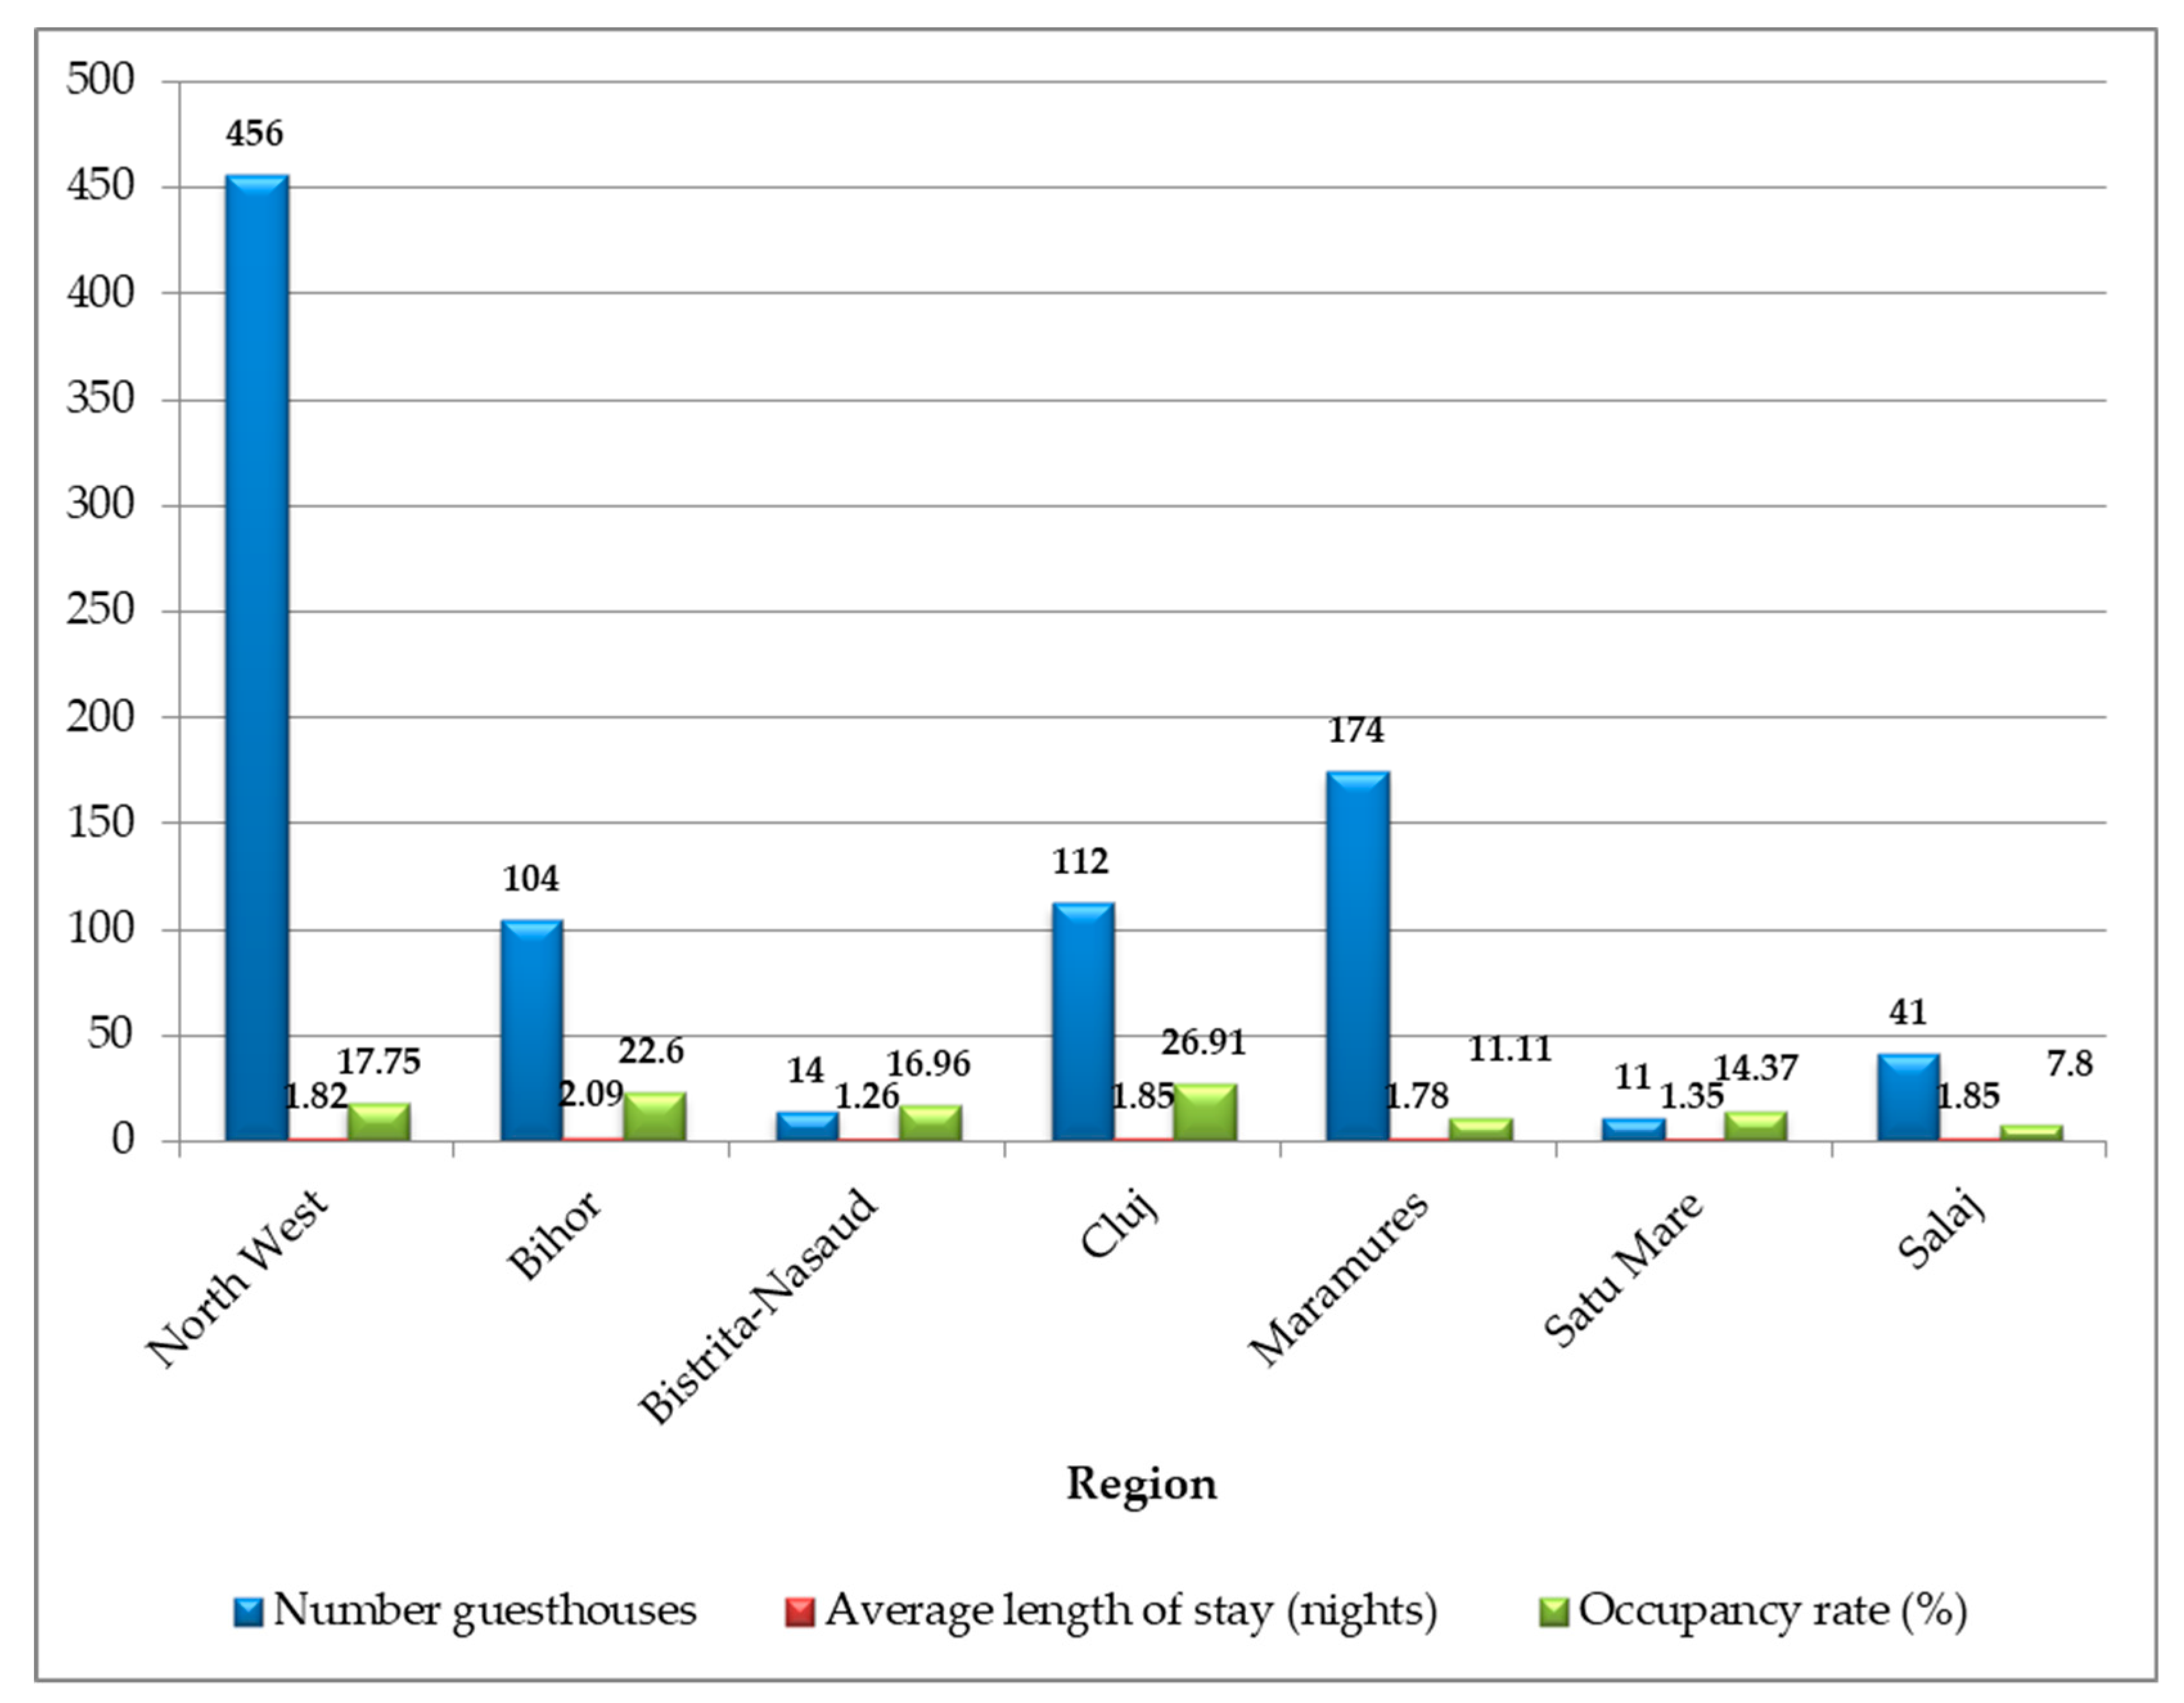
3.1. Research Area: the North-West Region of Romania

The current research was developed in the rural area of North-West Development Region of Romania to identify the tourism potential and the quality tourism destination as perceived by the residents (Figure 2). The research area has a surface of 34,156 km2, of which 61.25% is agricultural area and comprises six counties: Bihor (BH), Bistrita-Nasaud (BN), Cluj (CJ), Maramures (MM), Satu-Mare (SM), Salaj (SJ), with a total population on 1st of January 2018 of 2,560,110 persons of which 47.60% (1,218,558 inhabitants) live in rural areas [99]. The North-West Development Region of Romania has a high potential for tourism development due to natural and anthropic attractions. It comprises 170 protected areas of national importance [100].
Over the period 2012–2016, the rural tourism activity in the North-West Development Region of Romania has experienced several changes according to the data from the National Institute of Statistics [99]. In 2016, the total number of guesthouses, which is the main accommodation type in the rural area in Romania, increased to 456 in the North-West Region (Figure 3), representing 12.82% of the total number of guesthouses officially registered at the national level.
As can be observed in Figure 3, the highest number of guesthouses is registered in Maramures County (38.16% of the total number from the region), while the lowest number is in Satu Mare County (2.41%). The average length of stay and the occupancy rate of the guesthouses from the research area are similar to the values registered at the national level. Analyzing the data at a county level, it was noticed that the highest occupancy rate was in Bihor County (one out of five beds was occupied during the analyzed period), while in Maramures County this value was the lowest. The average length of stay in rural area is around two nights, which indicates that, in general, tourists prefer this type of destination mainly for weekend trips.

3.2. Research Methodology
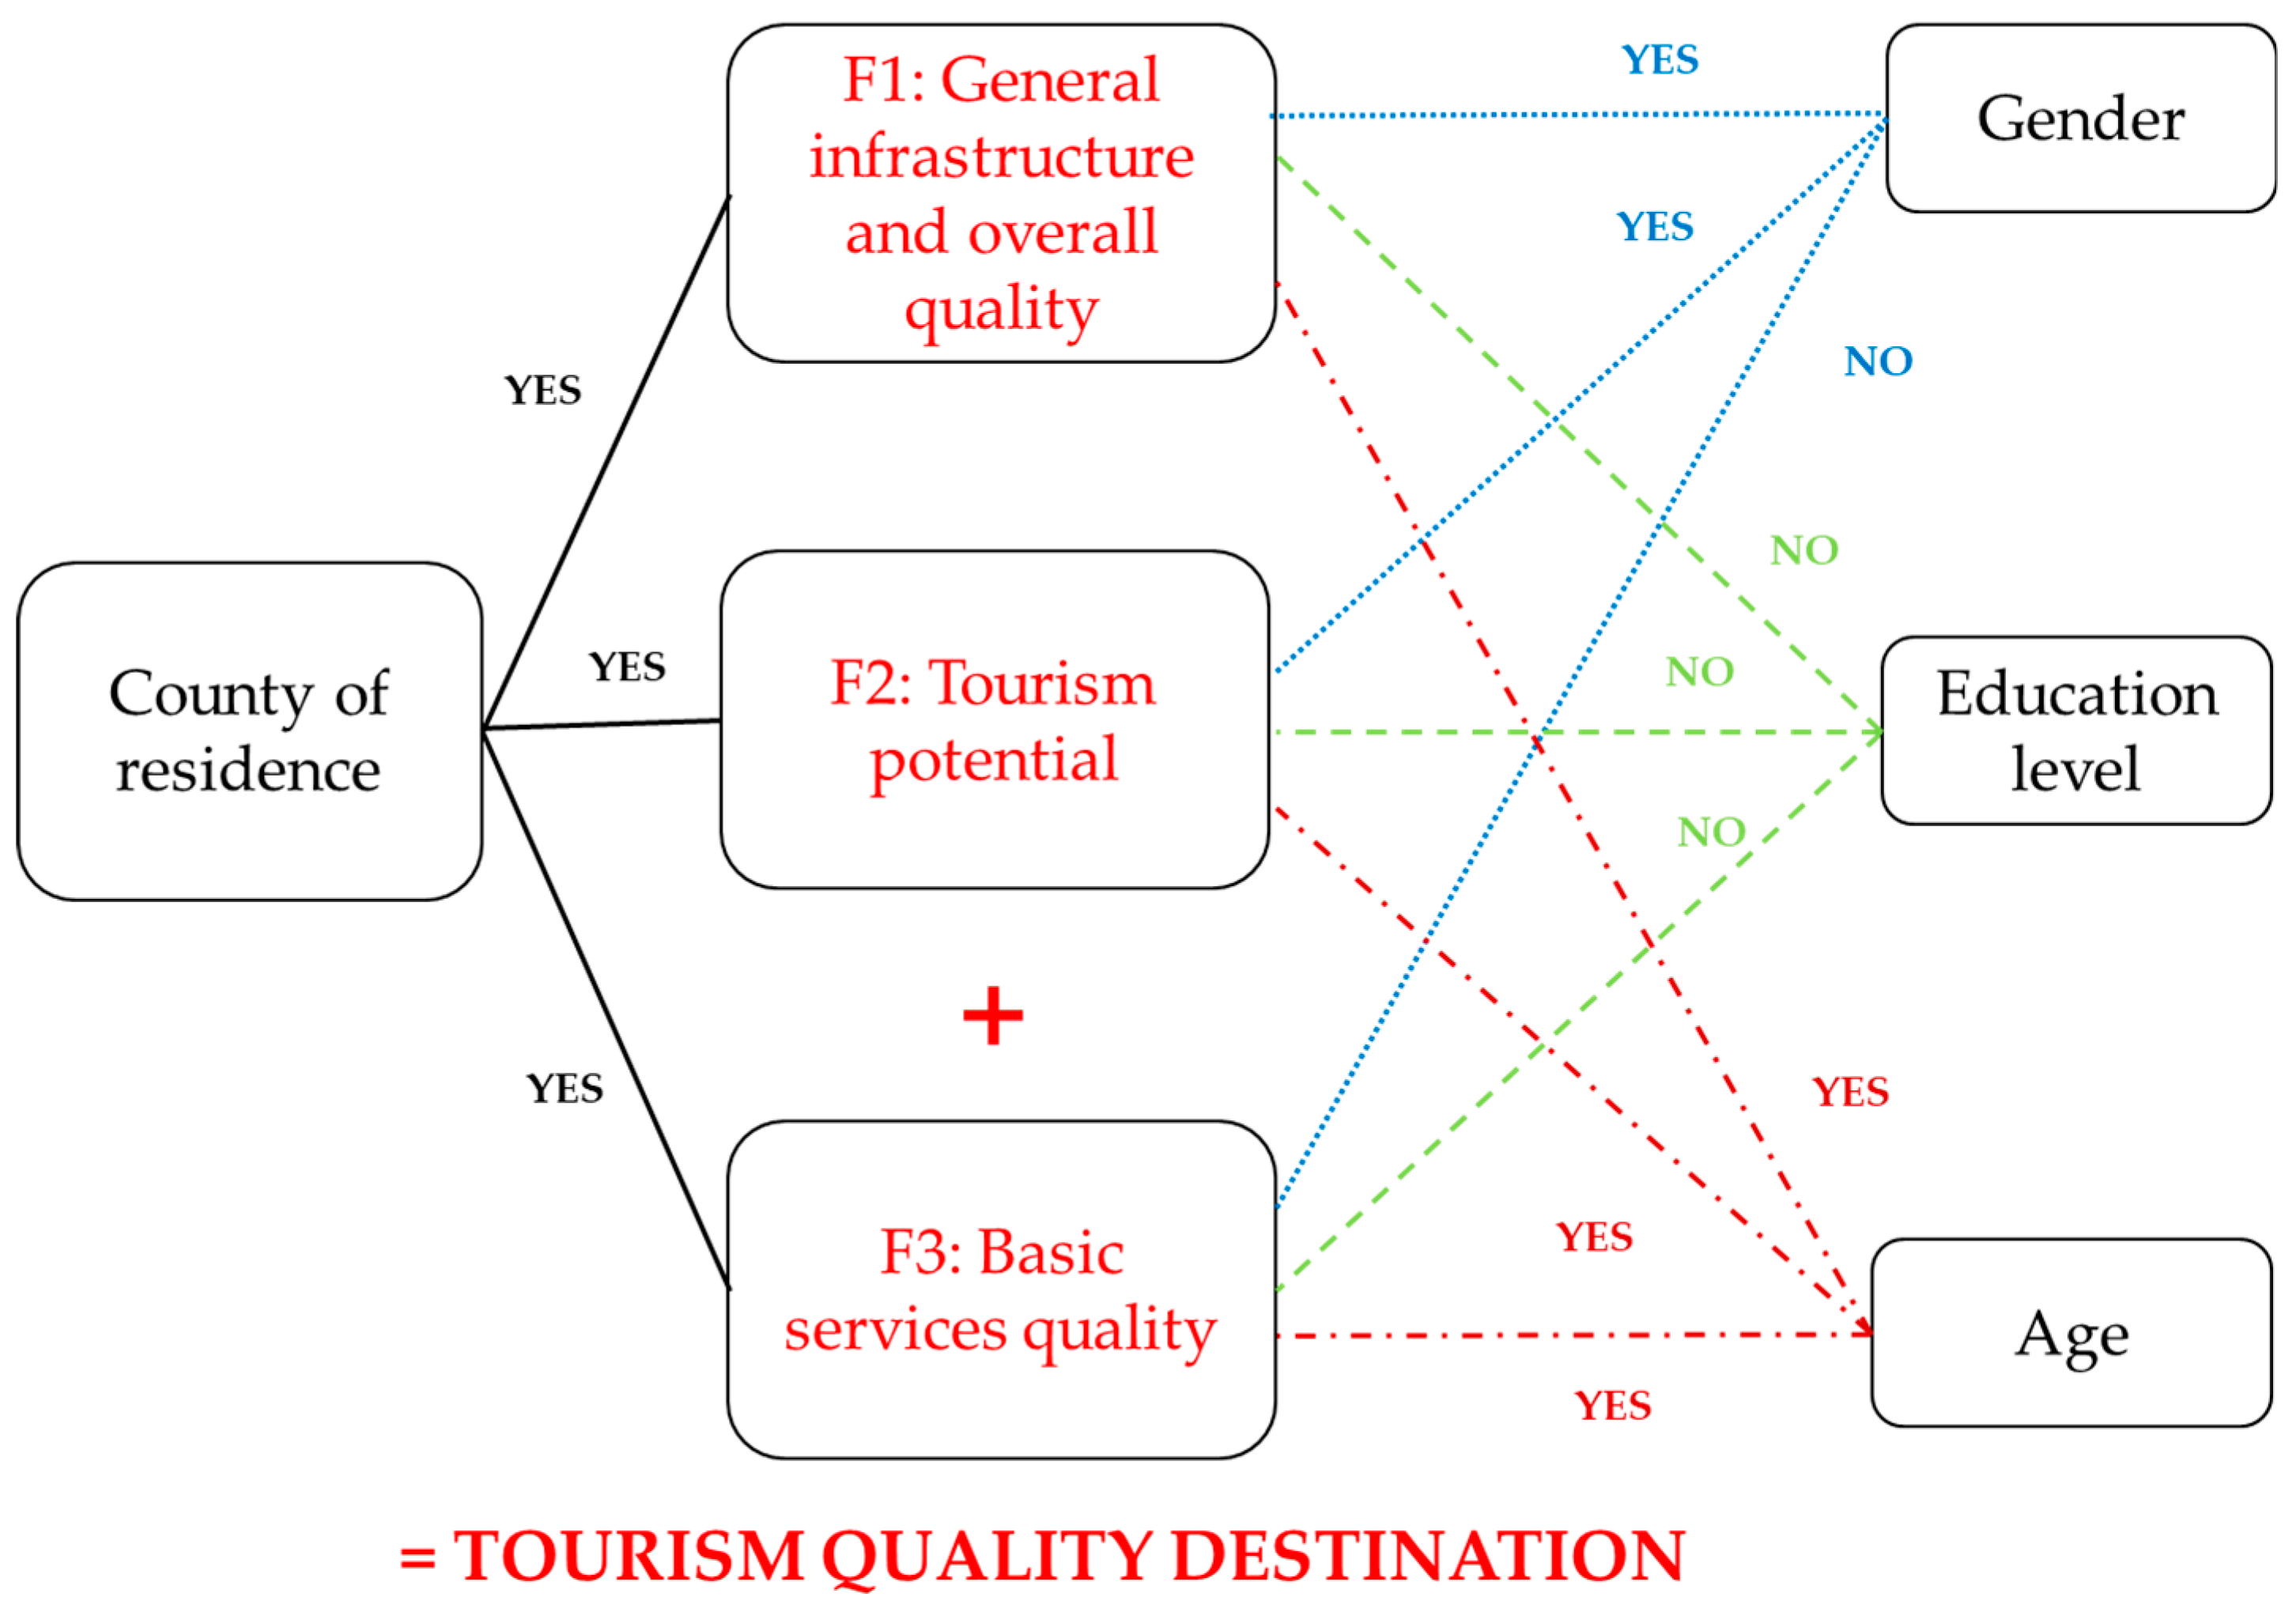
Two steps were taken to achieve the aim of the paper. Firstly, secondary data such as reports and statistical data were analyzed to obtain a first image of the tourism destination quality, the importance of the local community support for tourism development, the current situation of the tourism activity, and the development strategies of the research area. Secondly, primary data collected through a questionnaire were analyzed to determine the socio-demographic profile of the rural residents, the perceived tourism potential, and the quality of the destination. The survey was applied between November 2014 and April 2015, the residents being directly approached by two of the researchers during visits in the field.
The target population of this research was the rural residents from the North-West Development Region of Romania. Respondents were selected based on their age, gender, and county of residence, matching the distribution of the original population by using the convenience sampling until the required sample size has been reached [103], with an error of ± 10%, due to the difficulty of data collection. The sample size met the recommendation of minimum subject-to-item ratio of at least 5:1 in exploratory factor analysis, but no less than 100 respondents [104,105].
A total of 550 self-administrated questionnaires were distributed among the rural residents. The response rate was 91% (502 questionnaires returned), and in the end, 433 questionnaires were validated, meeting the recommendations of Comrey and Lee [106] for determining a good to very good adequacy of sample size.
From the total number of respondents, 41.6% were females and 58.4% were males. In respect to age, the largest group was represented by the category 40–49 years (28.8%), while the smallest category was 18–19 years (1.3%). Almost 2/3 of the respondents (71.3%) have graduated high school (Table 2).
The data collected through the survey can be divided into two main categories: (1) socio-demographic characteristics (gender 0 = female, 1 = male; age 1 = 18–19 years, 2 = 20–29 years, 3 = 30–39 years, 4 = 40–49 years, 5 = 50–59 years, 6 = more than 60 years; education level 1 = illiterate, 2 = less than high school, 3 = high school, 4 = university degree, further recorded into two groups: 1 = less than high school, 2 = more than high school; monthly household income 1 = less than 225 euro, 2 = 225–445 euro, 3 = more than 455); (2): information about the perceived quality destination (based on 17 items developed from QUALITEST method).
The method QUALITEST is based on a set of 16 indicators grouped based on four major aims: tourists’ high level of satisfaction; the local tourism industry’s high level of satisfaction; local people’s higher quality of life; high environmental quality [95,96]. According to Vajčnerova [97], the most difficult stage is to obtain the necessary data for calculating the above-mentioned categories of indicators. Moreover, Rudančić-Lugarić [98] considered that using an integrated quality management for a destination is an essential element in obtaining a competitive advantage. In this study, the tourism destination quality was estimated with the help of 17 items developed from the QUALITEST instrument [80], retaining ten of the original items of the model and the rest being adapted to the realities of the research area. Each of the 17 items provided on the questionnaire was evaluated on a five-point Likert-type scale, where 1 = very bad, 2 = bad, 3 = neutral, 4 = good, 5 = very good. The following factors of quality destination were researched: natural attractions; cultural and social attractions; accommodation; food; availability of transportation to the destination area; quality of information and communication; hospitality of the host community; feeling of security and safety.
Descriptive statistical analysis was used to describe the profile of the respondents, to identify the tourism potential, and as preliminary analysis for the estimation of the tourism destination quality. The descriptive analysis of the socio-demographic characteristics was done for each of the six counties. Furthermore, the 17 variables were factor-analyzed using Principal Component Analysis with the Varimax rotation method to reduce the variables into smaller sets of newly correlated components. Factors with eigenvalue higher than 1 and factor loading equal or higher than 0.4 were considered significant and included in the analysis. Next, the reliability coefficient (Cronbach’s alpha coefficient) was calculated to test the internal consistency of the items; the internal consistency reliability being higher as the value of Cronbach’s alpha coefficient is closer to 1 [107].
Subsequently, several statistical tests were performed considering a level of significance of less than 5%. One-way ANOVA was employed to compare the means of perception of the quality destination among residents from different counties, followed by Scheffe’s multiple range tests to investigate any significant differences between counties with respect to each factor. The t-test was carried out to determine if there are any significant differences regarding the perceptions of tourism destination quality in respect to gender and the education level of respondents. A simple correlation analysis was used to calculate the correlation between the age of the respondents and the perceived quality destination.

4. Results

4.1. Socio-Demographic Characteristics of the Respondents at County Level

The majority of the respondents are male (58.40%), with the highest share in Satu Mare County (71.40%) and the lowest in Cluj County (52.80%). In the entire North-West Development Region, around 50% of the respondents are between 40 and 59 years old, with only 8% being older than 60 (Table 3).
In Bihor, Bistrita-Nasaud, and Salaj counties, the share of residents older than 40 years is higher than the average of the region, while it is lower in Maramures and Satu Mare counties. The distribution of Cluj County residents by age shows similar values as the distribution for the entire region. Concerning the education level, most of the respondents from the research area are high-school graduates (45.40%) and more than 25% have a university degree. In Bistrita County, the respondents are less educated compared with the other counties (50% with less than high-school), while a higher level of education was reported in Maramures County (53.50% high-school degree, 26.70% university degree). Besides the fact that, in general, rural residents are elderly people with medium education level, they also have low monthly household income (more than 72% reported less than 445 Euro/month/household). The worst situation was registered in Bistrita-Nasaud (58.70% reported less than 225 Euro/month/household) and Salaj Counties (50% reported less than 225 Euro/month/household). In contrast, a relatively better situation was found in Maramures County, where only 15.8% respondents have a monthly household income lower than 225 euro. Therefore, it can be stated that poorest people are the less educated and elderly respondents, with preponderance in Bistrita-Nasaud and Salaj counties (Table 3).

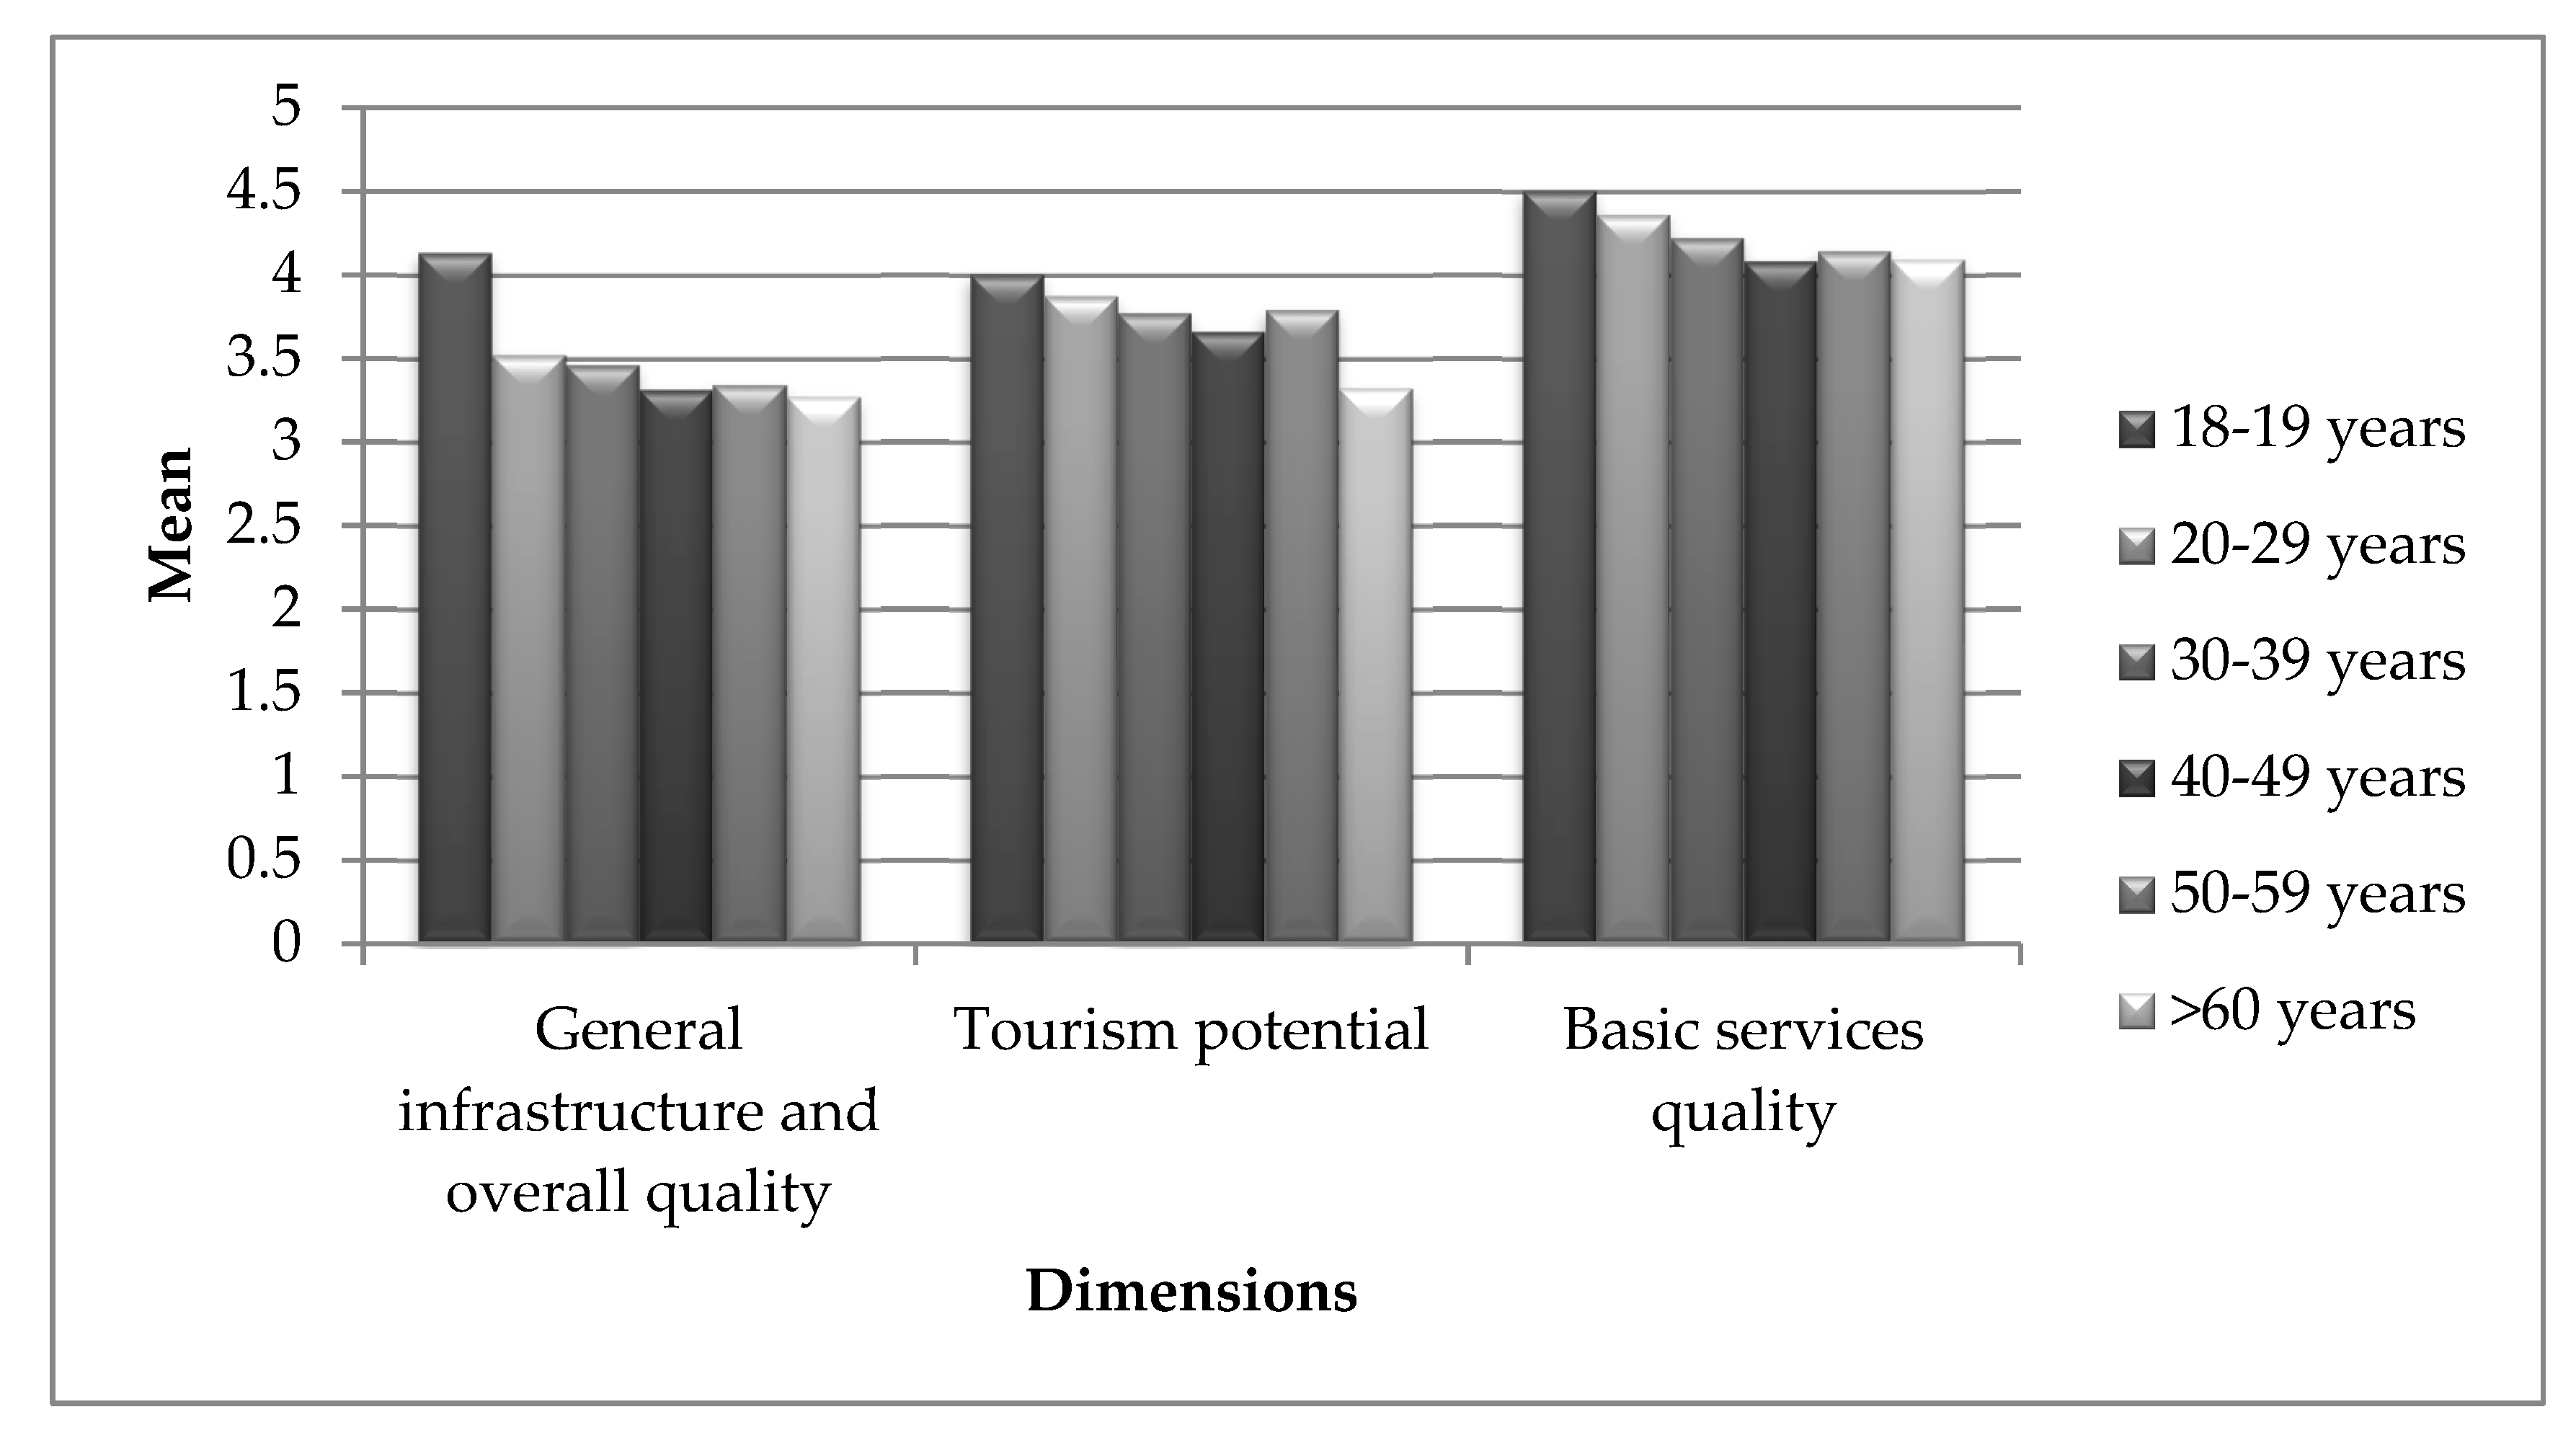
4.2. Rural Residents’ Perception of Tourism Destination Quality

Subsequently, principal component analysis was employed to assess the dimensionality of the 17 items used to evaluate the quality of the tourism destination. The Kaiser–Meyer–Olkin (KMO) overall measure of sampling is 0.92, above the critical value of 0.6, indicating that data are suitable for the principal component analysis [108,109]. The Barlett test of sphericity is also significant (Chi-square = 2589.385, p < 0.000). From the principal component analysis, three factors emerged as dimensions of tourism destination quality. The 17 attributes explained 57.06% of the total variance (Table 4) and had an overall reliability coefficient of 0.9. Only factors with eigenvalue equal or greater than one were considered significant and furthermore analyzed. The three dimensions were named as follows: “general infrastructure and overall quality”, “tourism potential”, and “basic services quality”. The reliability test was conducted for each of the emerged factors indicating reliability coefficients from 0.72 to 0.81. The values exceed the recommended significant level of 0.6 and suggest a good internal consistency among attributes within each quality dimension [107]. Harman’s single-factor test was employed to verify the presence of common method bias [110]. The first single factor in the unrotated factor matrix explained the 42.2% of the variance, below the suggested 50% threshold. The composite reliability (CR) of the constructs was above 0.7, with an average variance extract (AVE) higher than 0.5 [111].
The dimension “general infrastructure and overall quality” comprised eight attributes related to the quality of the transport in the area, accessibility, entertainment options, existence and quality of hiking trails, and pre-arrival communication. These attributes, which seem to be the most valuable ones for the rural residents (explain 40.47% of the total variance, reliability coefficient 0.81 and mean 3.39), are important features that influence the expectations of tourists regarding the tourism destination. The rural residents considered that tourists can easily access the destination area (mean = 3.73 ± 1.112) with various entertainment possibilities (mean = 3.82 ± 1.099) (Table 4). Tourists’ willingness to experience diverse entertainment activities is emphasized by Beeton [112] and Chaminuka et al. [113]. The quality of tourism services offered by the locals depends also on the common facilities and environment offered by the destination such as infrastructure, entertainment opportunities, landscape, and so on. Although transport infrastructure (roads, railway, airports) exists and assures the access of tourists in the area, the local community is not very satisfied with the quality and the standards of the transport services in the destination (mean = 3.15 ± 1.295), which could negatively affect tourists’ decision to visit the destination.
The degree of infrastructure endorsement is one of the main factors that affects the level of development of a community [23,112,114]. The North-West Development Region of Romania is well known for its natural tourism potential due to the diverse and unique landscapes. One important component of the natural tourism potential is represented by the mountains located in natural and national parks, visitors having several recreation opportunities such as hiking, cycling, climbing, camping, nature observation, and many others. Even if it is above the satisfactory level, the existence and the quality of hiking trails is assessed by the local residents as one of the most critical aspects of the general tourism infrastructure (mean = 3.17 ± 1.255) (Table 4). In the case of rural communities that are located near national and natural parks, as it is the case of many settlements in the North-West Development Region of Romania, insufficient or damaged marks on hiking trails may affect the quality of tourism [115].
The second dimension, named “tourism potential”, is comprised of five variables related to cultural tourism, ecotourism, gastronomic tourism, traditions, and customs and quality of environment. This dimension accounted for 9.50% of the total variance, with a reliability coefficient 0.80 and mean 3.73 (Table 4). Higher scores and positive responses on this factor indicated a general agreement on the tourism potential of the region. Residents considered the traditions and the customs (mean = 4.09 ± 1.089) important aspects for future development of cultural tourism (mean = 3.49 ± 1.251) and gastronomic tourism (mean = 3.79 ± 1.164). The cleanliness and quality of the local environment (mean = 3.70 ± 1.125) can be considered as competitive advantages to develop ecotourism products (mean = 3.70 ± 1.213). The natural resources of the area and the kindness of the locals are perceived as two key elements in the destination development [98]. The perceived high potential for tourism development can be explained by the large variety of tourism attractions and entertainment opportunities in the area. The third dimension of quality tourism destination, named “basic services quality”, is comprised of four variables related to quality of food and beverages, friendliness of local community, quality of accommodation, and security and safety. This dimension accounted 7.09% of the total variance, with a reliability coefficient 0.72 and mean 4.18 ± 0.738) (Table 4).
Rural residents believe that good quality basic services are offered to tourists (mean = 4.18, SD = 0.738), seeing themselves as being friendly and hospitable (mean = 4.49, SD = 0.866). This indicates that the rural residents sustain and encourage the development of tourism in the area. The support of local residents for tourism development is essential in order to ensure the success of the business and the sustainability of the hospitality industry [21,22]. At the same time, previous research revealed that tourists are more attracted to destinations where the local community is friendlier, honest, and hospitable [25]. Assurance of security and safety in the tourism destination represents an important aspect that can affect the image and the quality of the destination, among the reported negative effects of tourism development being the increase in number of crimes and vandalism [1,23,116]. The quality of the accommodation and restaurant services also influences the quality of the tourism destination due to the home-feeling environment provided by the hotels during holidays, assuring the basic needs of Maslow’s pyramid.

4.3. Comparative Analysis of the Rural Residents’ Perception towards Destination Quality among Counties

The perception of rural residents regarding the quality of tourism destinations differs among the six counties (p < 0.001, Table 5). Thus, Scheffe’s multiple-range tests were further used to explore any differences between counties for each of the three quality dimensions (Table 6).
Rural residents from Maramures County are the most satisfied with the quality of the destination, as indicated by the mean values in Table 5. The perception of the quality for the dimension “general infrastructure and overall quality” is statistically significant different for the residents from Maramures County than for the residents from Salaj and Satu Mare Counties (p < 0.05, Table 6). This difference is most probably a consequence of the different tourism level of development in the analyzed counties, with Maramures County being well-known as more popular for its tourism activity than the other two counties.
The second dimension of “tourism potential” was best evaluated by the residents from Maramures County (mean = 4.09) and worst by the residents from Satu Mare (mean = 3.00). Statistically significant differences regarding the perception of the tourism potential (Table 5) were found between Bihor and Maramures (p < 0.001), Bistrita Nasaud and Satu Mare (p < 0.05), Cluj and Satu Mare (p < 0.05), and between Maramures and Satu Mare Counties (p < 0.001). The differences can be explained by the tourism specificity of Bihor and Satu Mare which are better known for SPA resorts than for other tourism attractions (culture, tradition, gastronomy, mountains). The third dimension “basic services” was best evaluated by residents from Maramures County (mean = 4.44) and worst by residents from Satu Mare County (mean = 3.84). The fact that rural residents from Maramures County perceived the quality of basic services as being good to very good is not surprising since the rural tourism in this area is well developed. The highest number of accommodation units and overnight stays from the entire region is registered in Maramures County [26,30]. Differences in the perception of the basic services’ quality were found between Bihor and Cluj (p < 0.05), Bihor and Maramures (p < 0.01), and Maramures and Satu Mare Counties (p < 0.01) (Table 6).
The analysis continued by analyzing the perception of the three identified quality dimensions across the socio-demographic characteristics of the respondents (Table 7).
Statistically significant differences were found between female and male respondents and their perceptions about general infrastructure and tourism potential, with female respondents being more positive (Table 7). Perhaps this is because, in general, female residents are more attracted by the tourism sector than male residents, with tourism representing an alternative source of income to agriculture in rural areas [51,52]. However, no differences were found when analyzing the difference related to the level of education (p > 0.05).
The results of the correlation coefficient indicate that there is a weak and indirect link between the age of respondents and their perception about the quality of general infrastructure and basic tourist services’ quality of the North-West Development Region (Table 7). Older people perceived a lower quality of destination compared with the younger people, due to the greater concern about the negative impact of tourism development [117]. The age of the host community has an important role in the residents’ attitude towards tourism development [118].
Figure 4 reveals that respondents under 30 years perceive the quality tourism destination more positively based on the three factors, while the group over 60 years old is less satisfied with the current situation of the destination. These findings do not support the results reported by Zhang [119] who stated that older people are more “convinced that tourism has improved the general quality of life and has benefited most of the peer residents living in the community”.
The results indicated that there are differences among the residents from the six counties in terms of perceived quality destination, as was expected. At the same time, it was proved that gender affects two of the components of the quality destination (general infrastructure and tourism potential) (Figure 5). The education level has no effect on the perceived quality destination, which is contrary to previous studies [57,58,59,60,61].

5. Conclusions

Research focused on understanding residents’ perceptions about tourism development actions in their community and not assuming that it is already known plays an important role in planning tourism for a community [109,120]. Thus, the purpose of the current research was to explore and analyze the perception of rural residents regarding the tourism destination quality with the intention to offer some insight on which key drivers should be more carefully exploited to assure long-term sustainable tourism in rural areas.

5.1. Theoretical Implications

The analysis of the secondary data offered by the National Institute for Statistics revealed that the tourism activity in the research area increased during 2012–2016. The number of units that assure basic services (accommodation) increased by 17%, suggesting that this activity represents an important part of economic development in the rural area. At the same time, the local residents are aware of the ecotourism and cultural tourism potential of the area, two important elements for sustainable development of a tourism destination [121,122].
The results indicated that the rural communities from the North-West Development Region of Romania evaluate the destination quality positively. The most appreciated dimension of quality was the basic tourism services, due to the variety and range of accommodation services and restaurants, but also due to the security and friendless of the host community. The destination manager should consider the goodwill of the local community for tourism development since its support is essential for the success of the implementation of tourism strategies and for the sustainability of the industry [21,22].
Hypothesis 1 (H1):Tourism destination quality is perceived significantly differently by residents from different counties was supported by the results. The statistically significant differences regarding the perception of the tourism destination quality among the six counties of the region indicate that understanding the particularities of tourism destination is vital for successful tourism destination management. The worst situation was observed in two counties (Satu Mare and Bihor) where the promotion of tourism activity focuses on the SPA resorts and less on ecotourism and cultural or gastronomic tourism which are more representative for the rural areas. The disparities between the counties can be reduced through proper tourism destination strategies that also integrate this type of tourism (health tourism).
Hypothesis 2a (H2a):Tourism destination quality is perceived significantly differently by male and female residents and Hypothesis 2c (H2c): Tourism destination quality is perceived significantly differently across residents’ age were supported by the results. The statistically significant differences regarding the perception of tourism destination quality between males and females and among different age categories of the rural residents underline the support of local community for tourism development.
Hypothesis 2b (H2b):Tourism destination quality is perceived significantly differently across residents’ education groups was not supported by the results. The community perception and culture are two key dimensions of the socio-cultural pillar of sustainable tourism destination development, while safety and security, infrastructure, services, and transportation are key dimensions of the transversal pillar of sustainable tourism destination development [123]. In this context, the research offers valuable information for managers and decision-makers for future development strategies of tourism in the area.
This study also contributes to the use of survey questions and to the development of a research model for analyzing the rural tourism destination quality. The adaption of the QUALITEST tool offers researchers the possibility to exploit the characteristics of the area and to deeply analyze the perception of the local community about the quality of the tourist destination. The empirical results of the conducted study case prove that the QUALITEST tool needs to be adapted to the realities of the research area, reinforcing the results of Vajcnerova [97].

5.2. Managerial Implications

The results confirm previous studies on the perceptions of rural tourism quality, underlining the noneconomic dimensions of tourism [124]. The friendliness of the local population seems to be more important than the quality of information about tourism opportunities in the destination, because of the importance of the human dimension for the success of the tourism sector in any region with high cultural identity, a general characteristic for majority of rural destinations. Moreover, the quality of food is more important than the quality of the accommodation, another key element that characterizes the rural area. Consequently, the tourism services’ providers should consider all these aspects when designing and implementing touristic products in rural areas to assure long-term sustainable development in the sector.
Although this study is case-based and referring to rural communities in Romania, the findings have practical implications for destination management through the understanding of local residents’ perception and expectations related to rural tourism development and the quality of services provided. Practice proved that long-term sustainability cannot be achieved without the implication of the community [112]. However, assuring balance between community capacity and willingness to support tourism development and tourism demand remains a constant challenge for successful destination management. The current study can be reproduced by using settings adapted to the characteristics of the studied area offering reliable information to decision makers in developing and/or improving strategies that respond to the principles of sustainable rural development.

5.3. Limitations and Future Research Directions

Future research should be carried out at the level of other stakeholders from the tourism value chain to provide a better image of tourism development in the area, since tourism services providers and potential investors have an important role for sustainable tourism development along with the local communities. Furthermore, a focus on the particular characteristics of each of the counties from the research area could provide complementary information for specific actions for sustainable tourism products development. Finally, this case study has some limitations. The variance of the PCA is nearly at the limit of 60%, which might be considered satisfactory at this stage of the research, but for future investigation, new items should be considered for estimation of quality destination and representiveness of the model [125]. Due to time and resources constraints, the present study relied on convenience sampling, but was applied with caution to keep an error of up to ±10% with regard to the structure the original population. Further research should use other sampling techniques that allow generalization of the results to the entire population. Therefore, it is important to emphasize that the study was designed only to analyze the perception of the local rural residents without considering the perception of tourism providers and tourists from the area, a subject that can be addressed in further research.

Author Contributions

Conceptualization, I.C.M. and G.O.C.; Data curation, I.C.M., C.F.O., M.I., D.I.C. and I.D.G.; Formal analysis, I.C.M. and G.O.C.; Methodology, I.C.M., F.H.A. and V.C.M.; Supervision, I.C.M. and G.O.C.; Validation, I.C.M., D.E.D. and G.O.C.; Visualization, I.C.M., R.H. and F.H.A.; Writing–original draft, I.C.M., R.H. and G.O.C.; Writing–review & editing, I.C.M., D.E.D. and G.O.C.

Funding

This research received no external funding

Conflicts of Interest

The authors declare no conflict of interest.

References

  1. McGehee, N.G.; Andereck, K.L. Factors Predicting Rural Residents’ Support of Tourism. J. Travel Res. 2004, 43, 131–140. [Google Scholar] [CrossRef]
  2. Williams, J.; Lawson, R. Community Issues and Resident Opinions of Tourism. Ann. Tour. Res. 2001, 28, 269–290. [Google Scholar] [CrossRef]
  3. Jurowski, C.; Gursoy, D. Distance Effects on Residents’ Attitudes toward Tourism. Ann. Tour. Res. 2004, 31, 296–312. [Google Scholar] [CrossRef]
  4. Bestard, A.B.; Nadal, R.J. Attitudes toward Tourism and Tourism Congestion. Reg. Et Dev. 2007, 25, 193–207. [Google Scholar]
  5. Huh, C.; Vogt, C.A. Changes in Residents’ Attitudes toward Tourism over Time: A Cohort Analytical Approach. J. Travel Res. 2008, 46, 446–455. [Google Scholar] [CrossRef]
  6. Andereck, K.L.; Vogt, C.A. The Relationship between Residents’ Attitudes toward Tourism and Tourism Development Options. Travel Res. 2000, 39, 27–36. [Google Scholar] [CrossRef]
  7. Lee, T.H. Influence analysis of community resident support for sustainable tourism development. Tour. Manag. 2013, 34, 37–46. [Google Scholar] [CrossRef]
  8. Kim, S.; Park, E.; Phandanouvong, T. Barriers to Local Residents’ Participation in Community—Based Tourism: Lessons from HouayKaeng Village in Laos. In SHS Web of Conferences; EDP Sciences: Les Ulis, France, 2014; Volume 12. [Google Scholar]
  9. Nunkoo, R.; Ramkissoon, H. Developing a Community Support Model for Tourism. Ann. Tour. Res. 2011, 38, 964–988. [Google Scholar] [CrossRef]
  10. Homsud, N.; Promsaard, S. The Effects of Residents’ Image and Perceived Tourism Impact to Residence Satisfaction and Support: A Case Study of Hua-HinPrachubkirikhan. In Proceedings of the 2015 WEI International Academic Conference, Vienna, Austria, 12–15 April 2015. [Google Scholar]
  11. Mitchell, R.E.; Reid, D.G. Community integration: Island tourism in Peru. Ann. Tour. Res. 2001, 28, 113–139. [Google Scholar] [CrossRef]
  12. Andriotis, K. Local authorities in Crete and the development of tourism. J. Tour. Stud. 2002, 13, 53–62. [Google Scholar]
  13. Brida, J.G.; Osti, L.; Faccioli, M. Residents’ perception and attitudes towards tourism impacts, a case study of the small rural community of Folgaria (Trentino–Italy). Benchmarking Int. J. 2011, 18, 359–385. [Google Scholar] [CrossRef]
  14. Hanafiah, M.H.; Jamaluddin, M.R.; Zulkifly, M.I. Local Community Attitude and Support towards Tourism Development in Tioman Island, Malaysia. Proc. Soc. Behav. Sci. 2013, 105, 792–800. [Google Scholar] [CrossRef] [Green Version]
  15. Jafari, M.; Pour, S.A. Effects of economic, social and environmental factors of tourism on improvement of Perceptions of local population about tourism: Kashan touristic city, Iran. Int. J. Ayer. 2014, 4, 72–84. [Google Scholar]
  16. Lo, M.C.; Ramayah, T.; Hui, H.L.H. Rural Communities Perceptions and Attitudes towards Environment Tourism Development. J. Sustain. Dev. 2014, 7, 84–94. [Google Scholar] [CrossRef]
  17. Naidoo, P.; Sharpley, R. Local perceptions of the relative contributions of enclave tourism and agritourism to community wellbeing: The case of Mauritius. J. Destin. Mark. Manag. 2015, 5, 16–25. [Google Scholar] [CrossRef]
  18. Abdollahzadeh, G.; Sharifzadeh, A. Rural Residents’ Perceptions toward Tourism Development: A Study from Iran. Int. J. Tour. Res. 2014, 16, 126–136. [Google Scholar] [CrossRef]
  19. Schafft, K.A.; Greenwood, D.J. Promises and dilemmas of participation: Action research, search conference methodology, and community development. J. Community Dev. Soc. 2003, 34, 18–35. [Google Scholar] [CrossRef]
  20. Mensah, I. Effects of Socio-Demographic Characteristics and Perceived Benefits of Tourism on Community Participation in Tourism in the Mesomagor Area of the Kakum National Park, Ghana. Athens J. Tour. 2016, 211–230. [Google Scholar] [CrossRef]
  21. Aguiló, E.; Roselló, J. Host Community perceptions. A cluster analysis. Ann. Tour. Res. 2005, 32, 925–941. [Google Scholar] [CrossRef]
  22. Vargas-Sánchez, A.; Porras-Bueno, N.; de los Ángeles Plaza-Mejía, M. Explaining residents’ attitudes to tourism. Is a universal model possible? Ann. Tour. Res. 2011, 38, 460–480. [Google Scholar] [CrossRef]
  23. Muresan, I.C.; Oroian, C.F.; Harun, R.; Arion, F.H.; Porutiu, A.; Chiciudean, G.O.; Todea, A.; Lile, R. Local residents’ attitude toward sustainable rural tourism development. Sustainbility 2016, 8, 100. [Google Scholar] [CrossRef]
  24. Jennings, G.; Polovitz Nickerson, N. Quality Tourism Experiences; Elsevier Butterworth–Heinemann: Oxford, UK, 2006. [Google Scholar]
  25. Fallon, P.; Schofiel, P. The dynamics of destination attribute importance. J. Bus. Res. 2006, 59, 709–713. [Google Scholar] [CrossRef]
  26. Stetic, S. Specific features of rural tourism destinations management. J. Settl. Spat. Plan. Spec. Issue 2012, 1, 131–137. [Google Scholar]
  27. Neumeier, S.; Pollermann, K. Rural Tourism as Promoter of Rural Development—Prospects and Limitations: Case Study Findings From A Pilot Projectpromoting Village Tourism. Eur. Countrys. 2014, 6, 270–296. [Google Scholar] [CrossRef]
  28. Negrusa, A.L.; Cosma, S.A.; Bota, M. Romanian rural tourism development a case study: Rural tourism in Maramures. Int. J. Bus. Res. Publ. 2007, 7. Available online: http://www.freepatentsonline.com/article/International-Journal-Business-Research/178900250.html (accessed on 15 November 2018).
  29. Coroş, M.M.; Negruşa, A.L. Analysis of Romania’s and Transylvania’s Tourist Supply Development and Performance. Amfiteatru Econ. 2014, 16, 1312–1326. Available online: http://www.amfiteatrueconomic.ro/temp/Article_1358.pdf (accessed on 1st March 2019).
  30. Matei (Titilină), F.D. Rural Tourism Development Strategy in North West of Romania. Compet. Agro-Food Environ. Econ. 2014, 274–281. Available online: http://mpra.ub.uni-muenchen.de/46369/ (accessed on 5 February 2019).
  31. Nemirschi, N.; Craciun, A. Entrepreneurship and Tourism Development in Rural Areas: Case of Romania. Rom. Econ. Bus. Rev. 2014, 5, 138–143. Available online: Ftp://ftp.repec.org/opt/ReDIF/RePEc/rau/journl/SP10/REBE-SP10-A11.pdf (accessed on 20 January 2019).
  32. Marin, A.; Godja, D.I. Rural Tourism in the North Western Region of Romania. Sci. Pap. Ser. Manag. Econ. Eng. Agric. Rural Dev. 2017, 17, 235–238. [Google Scholar]
  33. Vengesayi, S. A Conceptual Model of Tourism Destination Competitiveness and Attractiveness. In Proceedings of the ANZMAC Conference, Adelaide, Australia, 1–3 December 2003; pp. 637–647. [Google Scholar]
  34. Enright, M.J.; Newton, J. Universality Determinants of Tourism Destination Competitiveness in Asia Pacific: Comprehensiveness and Universality. J. Travel Res. 2005, 43, 339–350. [Google Scholar] [CrossRef]
  35. Dwyer, L.; Kim, C. Destination Competitiveness: Determinants and Indicators. Curr. Tour. 2003, 6, 369–414. [Google Scholar] [CrossRef]
  36. Ritchie, J.R.B.; Crouch, G.I. The Competitive Destination: A Sustainable Tourism Perspective; CABI Publishing: Wallingford, UK, 2003. [Google Scholar]
  37. Murphy, P.; Pritchard, M.P.; Smith, B. The destination product and its impact on traveller perceptions. Tour. Manag. 2000, 21, 43–52. [Google Scholar] [CrossRef]
  38. Khadaroo, J.; Seetanah, B. The role of transport infrastructure in international tourism development: A gravity model approach. Ann. Tour. Res. 2007, 34, 1021–1032. [Google Scholar] [CrossRef]
  39. Khadarooa, J.; Seetanah, B. Transport infrastructure and tourism development. Tour. Manag. 2008, 29, 831–840. [Google Scholar] [CrossRef]
  40. Navickas, V.; Malakauskaite, A. The Economic Conditions of Enterprise Functioning. The Possibilities for the Identification and Evaluation of Tourism Sector Competitiveness Factors. Eng. Econ. 2009, 1, 37–44. Available online: http://citeseerx.ist.psu.edu/viewdoc/download?doi=10.1.1.554.2171&rep=rep1&type=pdf (accessed on 2nd November 2018).
  41. Um, S.; Chon, K.; Ro, Y.H. Antecedents of revisit intention. Ann. Tour. Res. 2006, 33, 1141–1158. [Google Scholar] [CrossRef]
  42. Žabkar1, V.; Brenčič, M.M.; Dmitrović, T. Modelling perceived quality, visitor satisfaction and behavioural intentions at the destination level. Tour. Manag. 2010, 31, 537–546. [Google Scholar] [CrossRef]
  43. Devine, J.; Gabe, T.; Bell, K.P. Community Scale and Resident Attitudes towards Tourism. J. Reg. Anal. Policy 2009, 39, 11–22. [Google Scholar]
  44. Harrill, R. Residents’ attitudes toward tourism development: A literature review with implications for tourism planning. J. Plan. Lit. 2004, 18, 1–16. [Google Scholar] [CrossRef]
  45. Gursoy, D.; Jurkowski, C. Resident Attitudes in Relation to Distance from Tourist Attractions. Travel Tour. Res. Assoc. Res. Arch. 2002. [Google Scholar]
  46. Harrill, R.; Potts, T.D. Tourism Planning in Historic Districts: Attitudes toward Tourism Development in Charleston. J. Am. Plan. Assoc. 2003, 69, 233–244. [Google Scholar] [CrossRef]
  47. Ko, D.W.; Stewart, W.P. A structural equation model of residents’ attitudes for tourism development. Tour. Manag. 2002, 23, 521–530. [Google Scholar] [CrossRef]
  48. Lepp, A. Residents’ attitudes towards tourism in Bigodi village, Uganda Case study. Tour. Manag. 2007, 28, 876–885. [Google Scholar] [CrossRef]
  49. Ray, F.I.; Cismaru, L.; Foris, D. Raising Competitiveness for Tourist Destinations through Information Technologies within the Newest Tourism Action Framework Proposed by the European Commission. Sustainability 2015, 7, 12891–12909. [Google Scholar] [CrossRef] [Green Version]
  50. Jeon, M.M.; Kang, M.M.; Desmarais, E. Residents’ Perceived Quality of Life in a Cultural-Heritage Tourism Destination. Appl. Res. Qual. Life 2016, 11, 105–123. [Google Scholar] [CrossRef]
  51. Afthanorhan, A.; Awang, Z.; Fazella, S. Perception of Tourism Impact and Support Tourism Development in Terengganu, Malaysia. Soc. Sci. 2017, 6, 106. [Google Scholar] [CrossRef]
  52. Nunkoo, R.; Gursoy, D. Residents’ support for tourism: An identity perspective. Ann. Tour. Res. 2012, 39, 243–268. [Google Scholar] [CrossRef]
  53. Wang, Y.; Pfister, R.E. Residents’ Attitudes toward Tourism and Perceived Personal Benefits in a Rural Community. J. Travel Res. 2008, 47, 84–93. [Google Scholar] [CrossRef]
  54. Figueroa-Domecq, C.; Pritchard, A.; Segovia-Perez, M.; Morgan, N.; Villace-Molinero, T. Tourism gender research: A critical accounting. Ann. Tour. Res. 2015, 52, 87–103. [Google Scholar] [CrossRef] [Green Version]
  55. Mason, P.; Cheyne, J. Residents attitudes to proposed tourism development. Ann. Tour. Res. 2000, 27, 391–411. [Google Scholar] [CrossRef]
  56. Harun, R.; Chiciudean, G.O.; Sirwan, K.; Arion, F.H.; Muresan, I.C. Attitudes and Perceptions of the Local Community towards Sustainable Tourism Development in Kurdistan Regional Government, Iraq. Sustainability 2018, 10, 2991. [Google Scholar] [CrossRef]
  57. Haralambopoulos, N.; Pizam, A. Perceived impacts of tourism: The case of Samos. Ann. Tour. Res. 1996, 23, 503–526. [Google Scholar] [CrossRef]
  58. Korça, P. Resident perceptions of tourism in a resort town. Leis. Sci. 1998, 20, 193–212. [Google Scholar] [CrossRef]
  59. Smith, M.D.; Krannich, R.S. Tourism dependence and resident attitudes. Ann. Tour. Res. 1998, 25, 783–802. [Google Scholar] [CrossRef]
  60. Hernández, S.; Cohen, J.; García, H. Residents’ attitudes towards an instant resort enclave. Ann. Tour. Res. 1996, 23, 755–779. [Google Scholar] [CrossRef]
  61. Teye, V.; Sönmez, S.F.; Sirakaya, E. Residents’ attitudes toward tourism development. Ann. Tour. Res. 2002, 29, 668–688. [Google Scholar] [CrossRef]
  62. Liu, X.R.; Li, J.J. Host Perceptions of Tourism Impact and Stage of Destination Development in a Developing Country. Sustainability 2018, 10, 2300. [Google Scholar] [CrossRef]
  63. Ahmed, S.A. Perceptions of the socio-economic and cultural impact of tourism in Sri Lanka. Can. J. Dev. Stud. 1986, 7, 239–255. [Google Scholar] [CrossRef]
  64. Tichaawa, T.M.; Makoni, L. Sociodemographic Influences on Residents’ Perceptions of Tourism Development in Zimbabwe ’. GeoJ. Tour. Geosites 2018, 22, 432–446. [Google Scholar] [CrossRef]
  65. Cavus, S.; Tanrisevdi, A. Residents’ attitudes towards tourism development: A case study in Kusadasi, Turkey. Tour. Anal. 2002, 7, 259–269. [Google Scholar] [CrossRef]
  66. Deng, J.; Arbogast, D.; Selin, S. Community-based tourism planning: An application of the APPA approach to Anstead, West Virginia. Tour. Anal. 2011, 16, 601–615. [Google Scholar] [CrossRef]
  67. Tomljenovic, R.; Faulkner, B. Tourism and older residents in a Sunbelt Resort. Ann. Tour. Res. 2000, 27, 93–114. [Google Scholar] [CrossRef]
  68. Sinclair-Maragh, G. Demographic analysis of residents’ support for tourism development in Jamaica. J. Destin. Mark. Manag. 2017, 6, 5–12. [Google Scholar] [CrossRef]
  69. Woo, E.; Kim, H.; Uysal, M. Life satisfaction and support for tourism development. Ann. Tour. Res. 2015, 50, 84–97. [Google Scholar] [CrossRef]
  70. Parasuraman, A.; Zeithaml, V.A.; Berry, L.L. A Conceptual Model of Service Quality and Its Implications for Future Research. J. Mark. 1985, 49, 41–50. [Google Scholar] [CrossRef]
  71. Parasuraman, A.; Zeithaml, V.A.; Berry, L.L. SERVQUAL: A multi-item Scale for Measuring Consumer Perceptions of Service Quality. J. Retail. 1988, 64, 12–40. [Google Scholar]
  72. Ladhari, R. Alternative Measures of Service Quality: A Review. Manag. Serv. Qual. Int. J. 2008, 18. [Google Scholar] [CrossRef]
  73. Said, A.; Shuib, A.; Ayob, N.; Yaakub, F. An Evaluation of Service Quality from Visitors’ Perspectives: The Case of Niah National Park in Sarawak. Int. J. Bus. Soc. 2013, 14, 61–78. [Google Scholar]
  74. Kim, W.G.; NeeNg, C.Y.; Kim, Y. Influence of institutional DINESERV on customer satisfaction, return intention, and word-of-mouth. Int. J. Hosp. Manag. 2009, 28, 10–17. [Google Scholar] [CrossRef]
  75. Khan, M.M. ECOSERV: Service quality expectations. Ann. Tour. Res. 2003, 30, 109–124. [Google Scholar] [CrossRef]
  76. Khan, M.M.; Su, K.D. Service Quality Expectations of Travellers Visiting Cheju Island in Korea. J. Ecotour. 2003, 2, 114–125. [Google Scholar] [CrossRef]
  77. Lynch, D. Measuring Perceptions of Service Quality within the Visitor Attractions Sector, Centre for Regional Innovation and Competitiveness (CRIC), University of Ballarat. 2007. Available online: http://www.anzmac.org/conference_archive/2007/papers/Lynch_1.pdf (accessed on 12 November 2018).
  78. Paulraj, K.; Hameed, M.S.; Saravanan, R. Service Quality in Rural Market. In Proceedings of the International Conference on Contemporary Management (INCOCOM’ 12), Natham, India, 19 October 2012; p. 39. Available online: http://www.conference.bonfring.org/papers/npr_incocom2012/incocom10.pdf (accessed on 17 January 2018).
  79. Tribe, J.; Snaith, T. From SERVQUAL to HOLSAT: Holiday satisfaction in Varadero, Cuba. Tour. Manag. 1998, 19, 25–34. [Google Scholar] [CrossRef]
  80. European Commission. Qualitest—A Manual for Evaluating the Quality Performance of Tourist Destinations and Services; European Commission: Brussels, Belgium, 2003. [Google Scholar]
  81. Grzinic, J. Concepts of Service Quality Measurement in Hotel Industry. Ekon. Misao Praksa DBK 2007, 16, 81–98. [Google Scholar]
  82. Akbaba, A. Measuring service quality in the hotel industry: A study in a business hotel in Turkey. Int. J. Hosp. Manag. 2006, 25, 170–192. [Google Scholar] [CrossRef]
  83. Mahdavinia, S.H. Customer Satisfaction in Four Star Isfahan Hotels. Master’s Thesis, Lulea University of Technology, Lulea, Sweden, 2008. Available online: http://www.diva-portal.org/smash/get/diva2:1031547/FULLTEXT01.pdf (accessed on 29 January 2019).
  84. State, O.; Istudor, N. Studiul calității serviciilor-aplicație la nivelul unui hotel utilizând modelul SERVQUAL. Rev. Amfiteatru Econ. 2009, 26, 419–428. [Google Scholar]
  85. Kouthouris, C.; Konstantinos, A. Can service quality predict customer satisfaction and behavioral intentions in the sport tourism industry? An application of the SERVQUAL model in an outdoors setting. J. Sport Tour. 2005, 10, 101–111. [Google Scholar] [CrossRef]
  86. Albacete-Sáez, C.A.; Fuentes-Fuentes, M.M.; Lloréns-Montes, F.J. Service quality measurement in rural accommodation. Ann. Tour. Res. 2007, 34, 45–65. [Google Scholar] [CrossRef]
  87. Prabaharan, B.; Arulraj, A.; Rajagopal, V. Service Quality on Tourism: Application of Structural Equation Modeling. In Proceedings of the Conference on Tourism in India—Challenges Ahead, Kozhikode, India, 15–17 May 2008. [Google Scholar]
  88. Patrício, V.; Leal, R.P.; Pereira, Z.L. Applicability of SERVQUAL in Restaurants: An Exploratory Study in a Portuguese Resort; Enterprise and Work Innovation Studies; IET: Monte de Caparica, Portugal, 2006; p. 2. Available online: https://run.unl.pt/bitstream/10362/1726/1/Patricio_etal_EWIS2_2006.pdf (accessed on 29 January 2019).
  89. Keith, N.K.; Simmers, C.S. Measuring Service Quality Perceptions of Restaurant Experiences: The Disparity between Comment Cards and DINESERV. J. Foodserv. Bus. Res. 2011, 14, 20–32. [Google Scholar] [CrossRef]
  90. Rood, A.S.; Dziadkowiec, J. Applying the Dineserv and IPA Methods to a Cross Cultural Comparison of Quality Service Gaps. Available online: https://scholarworks.gvsu.edu/cgi/viewcontent.cgi?article=1010&context=glhtec (accessed on 20 January 2019).
  91. Anggakusumah, M.N.; Harsono, A.; Novirani, D. Usulan Perbaikan Kualitas Pelayanan Restoran “X” Dengan Menggunakan Metode Dineserv Dan Servqual Mochamad. Jur. Tek. Ind. Itenas 2016, 1, 334–344. Available online: https://ejurnal.itenas.ac.id/index.php/rekaintegra/article/view/1077/1302 (accessed on 22 January 2019).
  92. Marković, S.; Raspor, S.; Šegarić, K. Does Restaurant Performance Meet Customers’ Expectations? An Assessment of Restaurant Service Quality Using a Modified Dineserv Approach. Tour. Hosp. Manag. 2010, 16, 181–195. [Google Scholar]
  93. Aziz, M.N.A.; Aziz, A.; Isa, S.S.; Ismail, H. Ecoserv Model For Assessing Perceived Service Quality In Private Outdoor Recreation Programs. Adventure and Ecotourism In Malaysia 1–9. Available online: https://www.researchgate.net/profile/Siti_Isa/publication/303939476_ADVENTURE_AND_ECOTOURISM_IN_MALAYSIA_ECOSERV_MODEL_FOR_ASSESSING_PERCEIVED_SERVICE_QUALITY_IN_PRIVATE_OUTDOOR_RECREATION_PROGRAMS/links/575f4eef08ae9a9c955fb9ec.pdf (accessed on 25 November 2018).
  94. Truong, T.-H.; Foster, D. Using HOLSAT to evaluate tourist satisfaction at destinations: The case of Australian holidaymakers in Vietnam. Tour. Manag. 2006, 27, 842–855. [Google Scholar] [CrossRef]
  95. Nagy, O. Improving Competitiveness of Tourist Destinations by Implementing the Qualitest Model. Stud. Univ. “Vasilegoldiş” 2010, 5, 51–56. [Google Scholar]
  96. Cismaru, L. European Tools for Managing and Monitoring the Sustainable Development of Tourist Destinations. Rev. Gen. Manag. 2015, 21, 101–111. [Google Scholar]
  97. Vajčnerova, I. IQM of a Tourism Destination as a Tool of Competitiveness. Acta Univ. Agric. Et Silvic. Mendel. Brun. 2011, 54, 407–412. [Google Scholar] [CrossRef]
  98. Rudancic-Lugaric, A. Integrated Quality Management of A Tourist Destination—The Key Factor In Achieving a Competitive Advantage. Interdiscip. Manag. Res. 2014, 10, 312–331. [Google Scholar]
  99. Romanian National Institute of Statistics. Available online: http://statistici.insse.ro/shop/ (accessed on 15 October 2018).
  100. The Convention on Biological Diversity. Regiunea Nord-Vest (Cluj-Napoca). Available online: http://biodiversitate.mmediu.ro/romanian-biodiversity/despre-arii-protejate/arpm/regiunea-nord-vest-cluj-napoca/ (accessed on 1 November 2015). (In Romanian).
  101. Agentia de Dezvoltare Regionala Nord-Vest. Planul de Dezvoltare regională Transilvania Nord 2014–2020. Available online: http://www.nord-vest.ro/wp-content/uploads/2016/09/7r238_PDR_2014_2020.pdf (accessed on 10 December 2018). (In Romanian).
  102. CNIPT Dej. Available online: http://turism-dej.ro/harti/harta-regiunii-nord-vest (accessed on 10 December 2018).
  103. Saunders, M.; Lewis, P.; Thornhill, A. Research Method for Business Students, 5th ed.; Pearson Education Limited: London, UK, 2009. [Google Scholar]
  104. Gorusch, R.L. Factor Analysis, 2nd ed.; Lawrence Erlbaum Associates: Hillsdale, NJ, USA, 1983. [Google Scholar]
  105. Hatcher, L. A Step-by-Step Approach to Using the SAS® System for Factor Analysis and Structural Equation Modeling; SAS Institutte, Inc.: Cary, NC, USA, 1994. [Google Scholar]
  106. Comfrey, A.L.; Lee, H.B. A First Course in Factor Analysis; Lawrence Erlbaum Associates: Hillsdale, NJ, USA, 1992. [Google Scholar]
  107. Hair, J.F.; Anderson, R.E.; Tatham, R.L.; Black, W.C. Multivariate Data Analysis, 5th ed.; Prentice Hall: Upper Saddle River, NJ, USA, 1998. [Google Scholar]
  108. Kaiser, H.F. Index of factorial simplicity. Psychometrika 1974, 39, 31–36. [Google Scholar] [CrossRef]
  109. Ding, C.; He, X. K-means clustering via principal component analysis. In Proceedings of the 21st International Conference on Machine Learning, Banff, AB, Canada, 4–8 July 2004; pp. 29–37. [Google Scholar]
  110. Fornell, C.; Larcker, D.F. Evaluating structural equation models with unobservable variables and measurement error. J. Mark. Res. 1981, 18, 39–50. [Google Scholar] [CrossRef]
  111. Hair, J.; Black, W.; Babin, B.; Anderson, R.; Tatham, R. Multivariate Data Analysis, 6th ed.; Pearson Prentice Hall: Uppersaddle River, NJ, USA, 2006. [Google Scholar]
  112. Beeton, S. Community Development through Tourism; Landlink Press: Collingwood, Australia, 2006. [Google Scholar]
  113. Chaminuka, P.; Groeneveld, R.A.; Selomane, A.O.; van Ierland, E.C. Tourist preferences for ecotourism in rural communities adjacent to Kruger National Park: A choice experiment approach. Tour. Manag. 2012, 33, 168–176. [Google Scholar] [CrossRef]
  114. Dumitras, D.E.; Muresan, I.C.; Ilea, M.; Jitea, I.M. Agritourism—A potential linkage between local communities and parks to maintain sustainability. Bull. UASVM Hortic 2013, 70, 300–309. [Google Scholar]
  115. Dumitras, D.E.; Muresan, I.C.; Jitea, I.M.; Mihai, V.C.; Balazs, S.E.; Iancu, T. Assessing Tourists’ Preferences for Recreational Trips in National and Natural Parks as a Premise for Long-Term Sustainable Management Plans. Sustainability 2017, 9, 1596. [Google Scholar] [CrossRef]
  116. Andereck, K.L.; Valentine, K.M.; Knopf, R.C.; Vogt, C.A. Residents’ perceptions of community tourism impacts. Ann. Tour. Res. 2005, 32, 1056–1076. [Google Scholar] [CrossRef]
  117. Muresan, I.C.; Chiciudean, G.O.; Harun, R.; Oroian, C.F.; Jitea, I.M.; Arion, F.H.; Poruțiu, A. Factors affecting tourism entrepreneurship among rural residents. Rev. Manag. Econ. Eng. 2016, 15, 746–759. [Google Scholar]
  118. Weaver, D.B.; Lawton, L.J. Resident perceptions in the urban-rural fringe. Ann. Tour. Res. 2001, 28, 439–458. [Google Scholar] [CrossRef]
  119. Zhang, J. Understanding Host Community Attitudes towards Tourism and Resident-Tourist Interaction: A Socio-Behavioural Study of Melbourne’s Urban-Rural Fringe. Doctorate Thesis, School of Management Business Portfolio, RMIT University Melbourne, Victoria, Australia, February 2008. [Google Scholar]
  120. Eshliki, S.A.; Kaboudi, M. Perception of Community in Tourism Impacts and their Participation in Tourism Planning: Ramsar, Iran. J. Asian Behav. Stud. 2017, 4, 59–69. [Google Scholar] [CrossRef]
  121. Rinzin, C.; Vermeulen, W.J.V.; Glasbergen, P. Ecotourism as a mechanism for sustainable development: The case of Bhutan. Environ. Sci. 2008, 4, 109–125. [Google Scholar] [CrossRef]
  122. Barkauskiene, K.; Snieska, V. Ecotourism as an integral part of Sustainable Tourism Development. Econ. Manag. 2013, 18, 449–456. Available online: http://www.ecoman.ktu.lt/index.php/Ekv/article/viewFile/4272/3025 (accessed on 22 January 2019). [CrossRef]
  123. Asia Pacific Economic Cooperation (APC). Sustainable Development of Tourism Destination. Available online: https://www.apec.org/Publications/2014/03/Sustainable-Development-of-Tourism-Destinations (accessed on 2nd March 2019).
  124. Chin, C.H.; Lo, M.-C. Rural tourism quality of services: Fundamental contributive factors from tourists’ perceptions. Asia Pac. J. Tour. Res. 2017, 22, 465–479. [Google Scholar] [CrossRef]
  125. Hair, J.F., Jr.; Black, W.C.; Babin, B.J.; Anderson, R.E. Multivariate Data Analysis, 7th ed.; Pearson Education Limited: Harlow, UK, 2014. [Google Scholar]
Figure 1. Study framework.
Sustainability 11 02594 g001
Figure 2. Map of the North-West Development Region of Romania. Source: authors’ contribution [101,102].
Sustainability 11 02594 g002
Figure 3. Tourism indicators in 2016. Source: authors’ contribution [99].
Sustainability 11 02594 g003
Figure 4. Perceived tourism destination quality based on the age of the respondents.
Sustainability 11 02594 g004
Figure 5. Perceived tourism destination quality across socio-demographic characteristics.
Sustainability 11 02594 g005
Table 1. Summary of methods used to estimate services’ and destinations’ quality.
ApplicabilityMethodApplicability
Tourist services qualitySERVQUAL [70,71]Hotel industry: Griznic [81]; Akbaba [82]; Mahdavinia [83]; State and Istudor [84]
Sport tourism: Kouthouris and Konstantinos [85]
Rural accommodation services: Albacete-Saez et al. [86]
Destination services quality: Prabaharan et al. [87]
Restaurant services: Patricio et al. [88]
DINESERV [74]Restaurants services: Keith and Simmers [89]; Rood and Dziadkowiec [90]; Anggakusumah et al. [91]; Marković et al [92]
ECOSERV [75]Services’ quality in ecotourism: Aziz et al. [93]
ATTRACTQUAL [77]Service quality
Destination qualityHOLSAT [79]Tourists’ satisfaction for a destination: Troung and Foster [94]
QUALITEST [80]Quality of destination: Nagy [95]; Cismaru [96]; Vajčnerova [97]; Rudančić-Lugarić [98]
Table 2. Socio-demographic characteristics of the sample (%).
VariablesNorth-West Development RegionVariablesNorth-West Development Region
GenderEducation
Female41.6Less than high school28.3
Male58.4More than high school71.7
Age (mean = 41.42 ± 12.089)Monthly household income
18–19 years1.3< 225 euro36.4
20–29 years18.2225–445 euro35.9
30–39 years24.1> 445 euro27.7
40–49 years28.8
50–59 years19.6
> 60 years8
Table 3. Socio-demographic characteristics of the respondents by counties (%).
VariablesCounty
Bihor (BH) Bistrita-Nasaud (BN)Cluj (CJ)Maramures (MM)Salaj (SJ)Satu Mare (SM)
Gender
Female32.944.747.246.542.328.6
Male67.155.352.853.557.771.4
Age
18–19 years001.4300
20–29 years19.16.219.425.77.713.9
30–39 years14.727.120.832.723.127.8
40–49 years39.733.323.622.85025
50–59 years19.118.825.115.87.719.4
>60 years7.414.69.7011.513.9
Education
Less than high school2052.132.419.822.225.7
More than high school8047.967.680.277.874.3
Monthly household income
<225 euro37.558.739.115.85043.3
225–445 euro28.121.732.654.530.832.4
>445 euro34.419.628.329.719.224.3
Table 4. Principal component analysis on tourism destination quality.
ComponentItemFactor LoadingComm.MeanSD
General infrastructure and overall quality α = 0.81
(EV = 6.88, VA = 40.47%, M = 3.39 ± 0.877)
Quality of hiking trails0.7350.5613.171.255
Quality of information on things to do in the destination0.7270.5823.361.226
Standard of transport services in the destination0.6850.5863.151.295
Pre-arrival communication0.6520.5163.191.252
Accessibility of tourists0.6390.5223.731.112
Accessibility to tourist services0.6280.6233.591.138
Quality of tourism services0.5600.5663.171.255
Entertainment possibilities0.4440.4643.821.099
Tourism potential α = 0.80
(EV = 1.62, VA = 9.50%, M = 3.73 ± 0.880)
High potential for cultural tourism0.7870.7073.491.251
High potential for ecotourism0.7490.6213.701.213
High potential for gastronomic tourism0.7150.5703.791.164
Traditions and customs0.6340.5264.091.089
Cleanliness and quality of the local environment0.4480.4043.701.125
Basic services quality α = 0.72
(EV = 1.21, VA = 7.09%, M = 4.18 ± 0.737)
Range and quality of food and beverages0.8000.7004.460.848
Friendliness of the local population0.6660.6744.490.866
Range and quality of accommodation0.6160.6453.951.021
Feeling of security and safety0.5170.4343.961.120
Total variance % 57.06; KMO = 0.92; Chi-square = 2589.385, p < 0.000
Note: EV-eigenvalue, VA–variance, M–mean, SD–Standard deviation.
Table 5. ANOVA analysis of differences between counties.
County mean (SD)
FactorsBHBNCJMMSJSMF value
General infrastructure and overall quality3.26 (0.875)3.21
(0.726)
3.49
(0.946)
3.68
(0.761)
2.93
(0.623)
3.00
(0.903)
6.756 ***
Tourism potential3.44
(0.906)
3.64
(0.788)
3.86
(0.827)
4.09
(0.679)
3.56
(0.883)
3.00
(1.021)
12.497 ***
Basic services quality3.89
(0.803)
4.07
(0.532)
4.27
(0.761)
4.44
(0.583)
4.13
(0.582)
3.84
(0.916)
7.377 ***
* p < 0.05, ** p < 0.01, *** p < 0.001.
Table 6. Scheffe multiple range tests on differences between counties for each quality dimension.
Scheffe Multiple Range TestsQuality Dimensions
General Infrastructure and Overall QualityTourism PotentialBasic Services Quality
BH-BNn/sn/sn/s
BH-CJn/sn/s*
BH-MMn/s*****
BH-SJn/sn/sn/s
BH-SMn/sn/sn/s
BN-CJn/sn/sn/s
BN-MMn/sn/sn/s
BN-SJn/sn/sn/s
BN-SMn/s*n/s
CJ-MMn/sn/sn/s
CJ-SJn/sn/sn/s
CJ-SMn/s*n/s
MM-SJ*n/sn/s
MM-SM******
SJ-SMn/sn/sn/s
* p < 0.05, ** p < 0.01, *** p < 0.001; n/s indicates “not significant”.
Table 7. Results of t-test and correlation coefficient.
Respondents’ CharacteristicsQuality Dimension
General Infrastructure and Overall QualityTourism PotentialBasic Services Qality
GenderFemale3.52 (0.821)3.84 (0.819)4.24 (0.714)
Male3.30 (0.899)3.66 (0.921)4.15 (0.746)
t-value2.528 *2.201 *1.303
Education levelLess than high school 3.42 (0.839)3.73 (0.839)4.15 (0.714)
More than high school3.37 (0.831)3.73 (0.898)4.19 (0.757)
t-value0.5330.406−0.533
Age
r−0.107 *−0.106 *−0.118 *
* p < 0.05; ()-Standard deviation.

