Article

Water-Saving Potential of Subsurface Drip Irrigation For Winter Wheat

1
CAS Key Laboratory of Agricultural Water Resources and Hebei Key Laboratory of Water-Saving Agriculture, Center for Agricultural Resources Research, Institute of Genetics and Developmental Biology, Chinese Academy of Sciences, Shijiazhuang 050021, China
2
International College, University of Chinese Academy of Sciences, Beijing 100049, China
3
Institute of Sustainable Halophyte Utilization, University of Karachi, Karachi 75270, Pakistan
4
Climate Change Research Center, Institute of Atmospheric Physics, Chinese Academy of Sciences, Beijing 100029, China
5
Innovation Academy for Seed Design, Chinese Academy of Sciences, Beijing 100101, China
*
Authors to whom correspondence should be addressed.
Sustainability 2019, 11(10), 2978; https://0-doi-org.brum.beds.ac.uk/10.3390/su11102978
Submission received: 11 February 2019 / Revised: 28 April 2019 / Accepted: 21 May 2019 / Published: 24 May 2019
(This article belongs to the Section Sustainable Agriculture)

Abstract

:
Groundwater plays a major role in agro-hydrological processes in the North China Plain (NCP). The NCP is facing a water deficit, due to a rapid decline in the water table because of the double cropping system. A two crop (maize and wheat) rotation is required to balance the food supply and demand, which leads to an imbalance between evapotranspiration (ET) and precipitation. Thus, there has been a decline of about 1.35 m yr−1 of groundwater (Luancheng Agroecosystem Experimental Station (LAES), NCP) during the last 10 years. Lysimeter experiments were conducted under different irrigation treatments (flood, surface drip, and subsurface drip) to account for ET in the selection of a suitable irrigation method. Subsurface drip irrigation reduced ET by 26% compared to flood irrigation, and 15% compared to surface drip irrigation, with significant grain yield and biomass formation due to decreased evaporation losses. Grain yield, yield components, and above ground biomass were similar in subsurface drip and flood irrigation. However, these biomass parameters were lower with surface drip irrigation. Furthermore, subsurface drip irrigation increased the crop water productivity (24.95%) and irrigation water productivity (19.59%) compared to flood irrigation. The subsurface irrigated plants showed an increase in net photosynthesis (~10%), higher intrinsic water use efficiency (~36%), lower transpiration rate (~22%), and saved 80 mm of water compared to flood irrigation. Our findings indicate that subsurface drip irrigation can be adopted in the NCP to increase water use efficiency, optimize grain yield, and minimize water loss in order to address scarcity.

1. Introduction

The rising world population is increasing pressure on the food system. It is expected that food demand will increase by about 70% by 2050 [1], making effective water planning and management critical. About 70% of the world’s fresh water is being used for agriculture, while the disturbance in the ratio of ground water use to recharge has resulted in groundwater overutilization [2,3]. The North China Plain (NCP) is a major grain production zone that plays a critical role in ensuring China’s food supply. The NCP is recognized as the bread basket of China and it accounts for two-thirds of the share of China’s total wheat production [4]. Groundwater is the main source of irrigation throughout the Hebei plain, which covers ~75% of China’s total irrigated crop land [5,6]. The double cropping system is also one of the many hydrological threats to the water table across the globe, and especially in the Hebei Plain, NCP. The water table is fast approaching threshold levels, especially in arid/semiarid regions with a high mean annual water shortage, due to a high water deficit (precipitation (P) − evapotranspiration (ET)). The mean water deficit (P − ET) for the wheat crop period varies from 160 to 410 mm at the Luancheng Agroecosystem Experimental Station, Chinese Academy of Science (LAES-CAS) in the NCP [7]. Higher water deficits (P − ET) have been counterbalanced by excessive pumping of groundwater, and so consequently the water table has declined (~1.35 m yr−1 during the last ten years at the LAES-CAS), as shown in Figure 1. The past 28-year winter wheat (WW) experiment in the LAES-CAS showed that seasonal rainfall is decreasing, but atmospheric evaporation is increasing [8].
Water consumption in agriculture is normally depicted as ET throughout the crop growth season. Estimating crop water productivity (CWP), biomass formation, and water use efficiency (WUE) from the cropland, as well as precise estimation or monitoring of ET, are essential [9,10,11]. Many methods are used to monitor ET, including eddy covariance systems [12,13,14], a weighing lysimeter [15,16], and water balance modelling [5,17]. To decrease the water shortage in the NCP by ET reduction, specific methods need to be adopted (i.e., alternative cropping systems, mulching, and drip irrigation).
Alternative cropping systems (three harvests in two years, four harvests in three years and one harvest per year) resulted in decreased grain yield (<15%), while water saving exceeded 50% of the amount of overdraft groundwater on the Hebei Plain [18]. Recently, Hebei authorities in the NCP have put forward ordinances and policies regarding groundwater overexploitation that recommend a fallow land policy against farmer compensation [19]. The farmers were unwilling to consider ecological compensation as opposed to land fallow. Xie et al. [20] found that ecological compensation was lower compared to winter wheat planting income, and hence, would adversely affect the farmer’s livelihood. Fallow land policy and alternative cropping systems reduce grain yield and can cause grain demand and supply to be unbalanced. Straw mulching reduces the ET, but also reduces the final grain yield due to delayed WW growth stages [21,22,23]. Mulching on large farms is not possible because it is a time- and labor-consuming process, and it increases soil temperature.
According to recent literature from the LAES-CAS, Umair, et al. [24] employed the CropSyst Model and simulated ET during the whole growth period of WW. The model suggested adopting a drip irrigation system to reduce ET by avoiding evaporation (E) losses. On-farm crop water productivity and irrigation use efficiency can be improved by using an efficient irrigation system (i.e., drip and sprinkler irrigation can reduce non-effective water loss) [25]. Qin, et al. [26] found a 10% total ET reduction in drip irrigation compared to border irrigation. A drip irrigation system increased wheat yield [27] under limited water availability by enhancing soil moisture compared to basin irrigation. Subsurface drip irrigation restored water under a lower soil surface, which saved 18% of water and 20% of working time compared to surface drip irrigation [28]. Evaporation may have been reduced in subsurface drip irrigation [29,30] due to the dry soil surface status, while greater irrigation water use efficiency and increased yield [31] was obtained under the limited irrigation treatments [32]. Evett [33] reported a water saving amount of 10% under subsurface drip (30 cm) compared to surface drip. Limited irrigation can conserve groundwater for agriculture practices [34]. As a further example, Salvador, et al. [35] compared several irrigation treatments (surface, sprinkler, and drip irrigation) and found that though drip irrigation has a greater efficiency compared to surface irrigation, farmers are unwilling to adopt it due to a lack of knowledge. Thus, water preserving technologies for cutting down the soil ET are significant management issues for conditions of severe water shortfall. Farmers in the NCP will need to increase crop production by adopting precise irrigation techniques to grow more with less water to meet the world food demand.
In this study, a lysimeter experiment was designed to compare the ET under different irrigation methods. We monitored the whole growth period of the wheat crop under different irrigation methods, including subsurface drip irrigation (SSDI), surface drip irrigation (SDI), and flood irrigation (FI), and quantified the ET losses on a daily basis. Furthermore, we compared the yield, biomass, water balance, photosynthesis, chlorophyll content, intrinsic water use efficiency (WUEi), transpiration rate, intercellular CO2 (Ci), crop water productivity (CWP), and irrigation water productivity (IWP) under different irrigation methods. The main goal of this study was to determine the water saving capacity of SSDI as compared to SDI and FI, in order to increase the CWP and IWP of wheat.

2. Materials and Methods

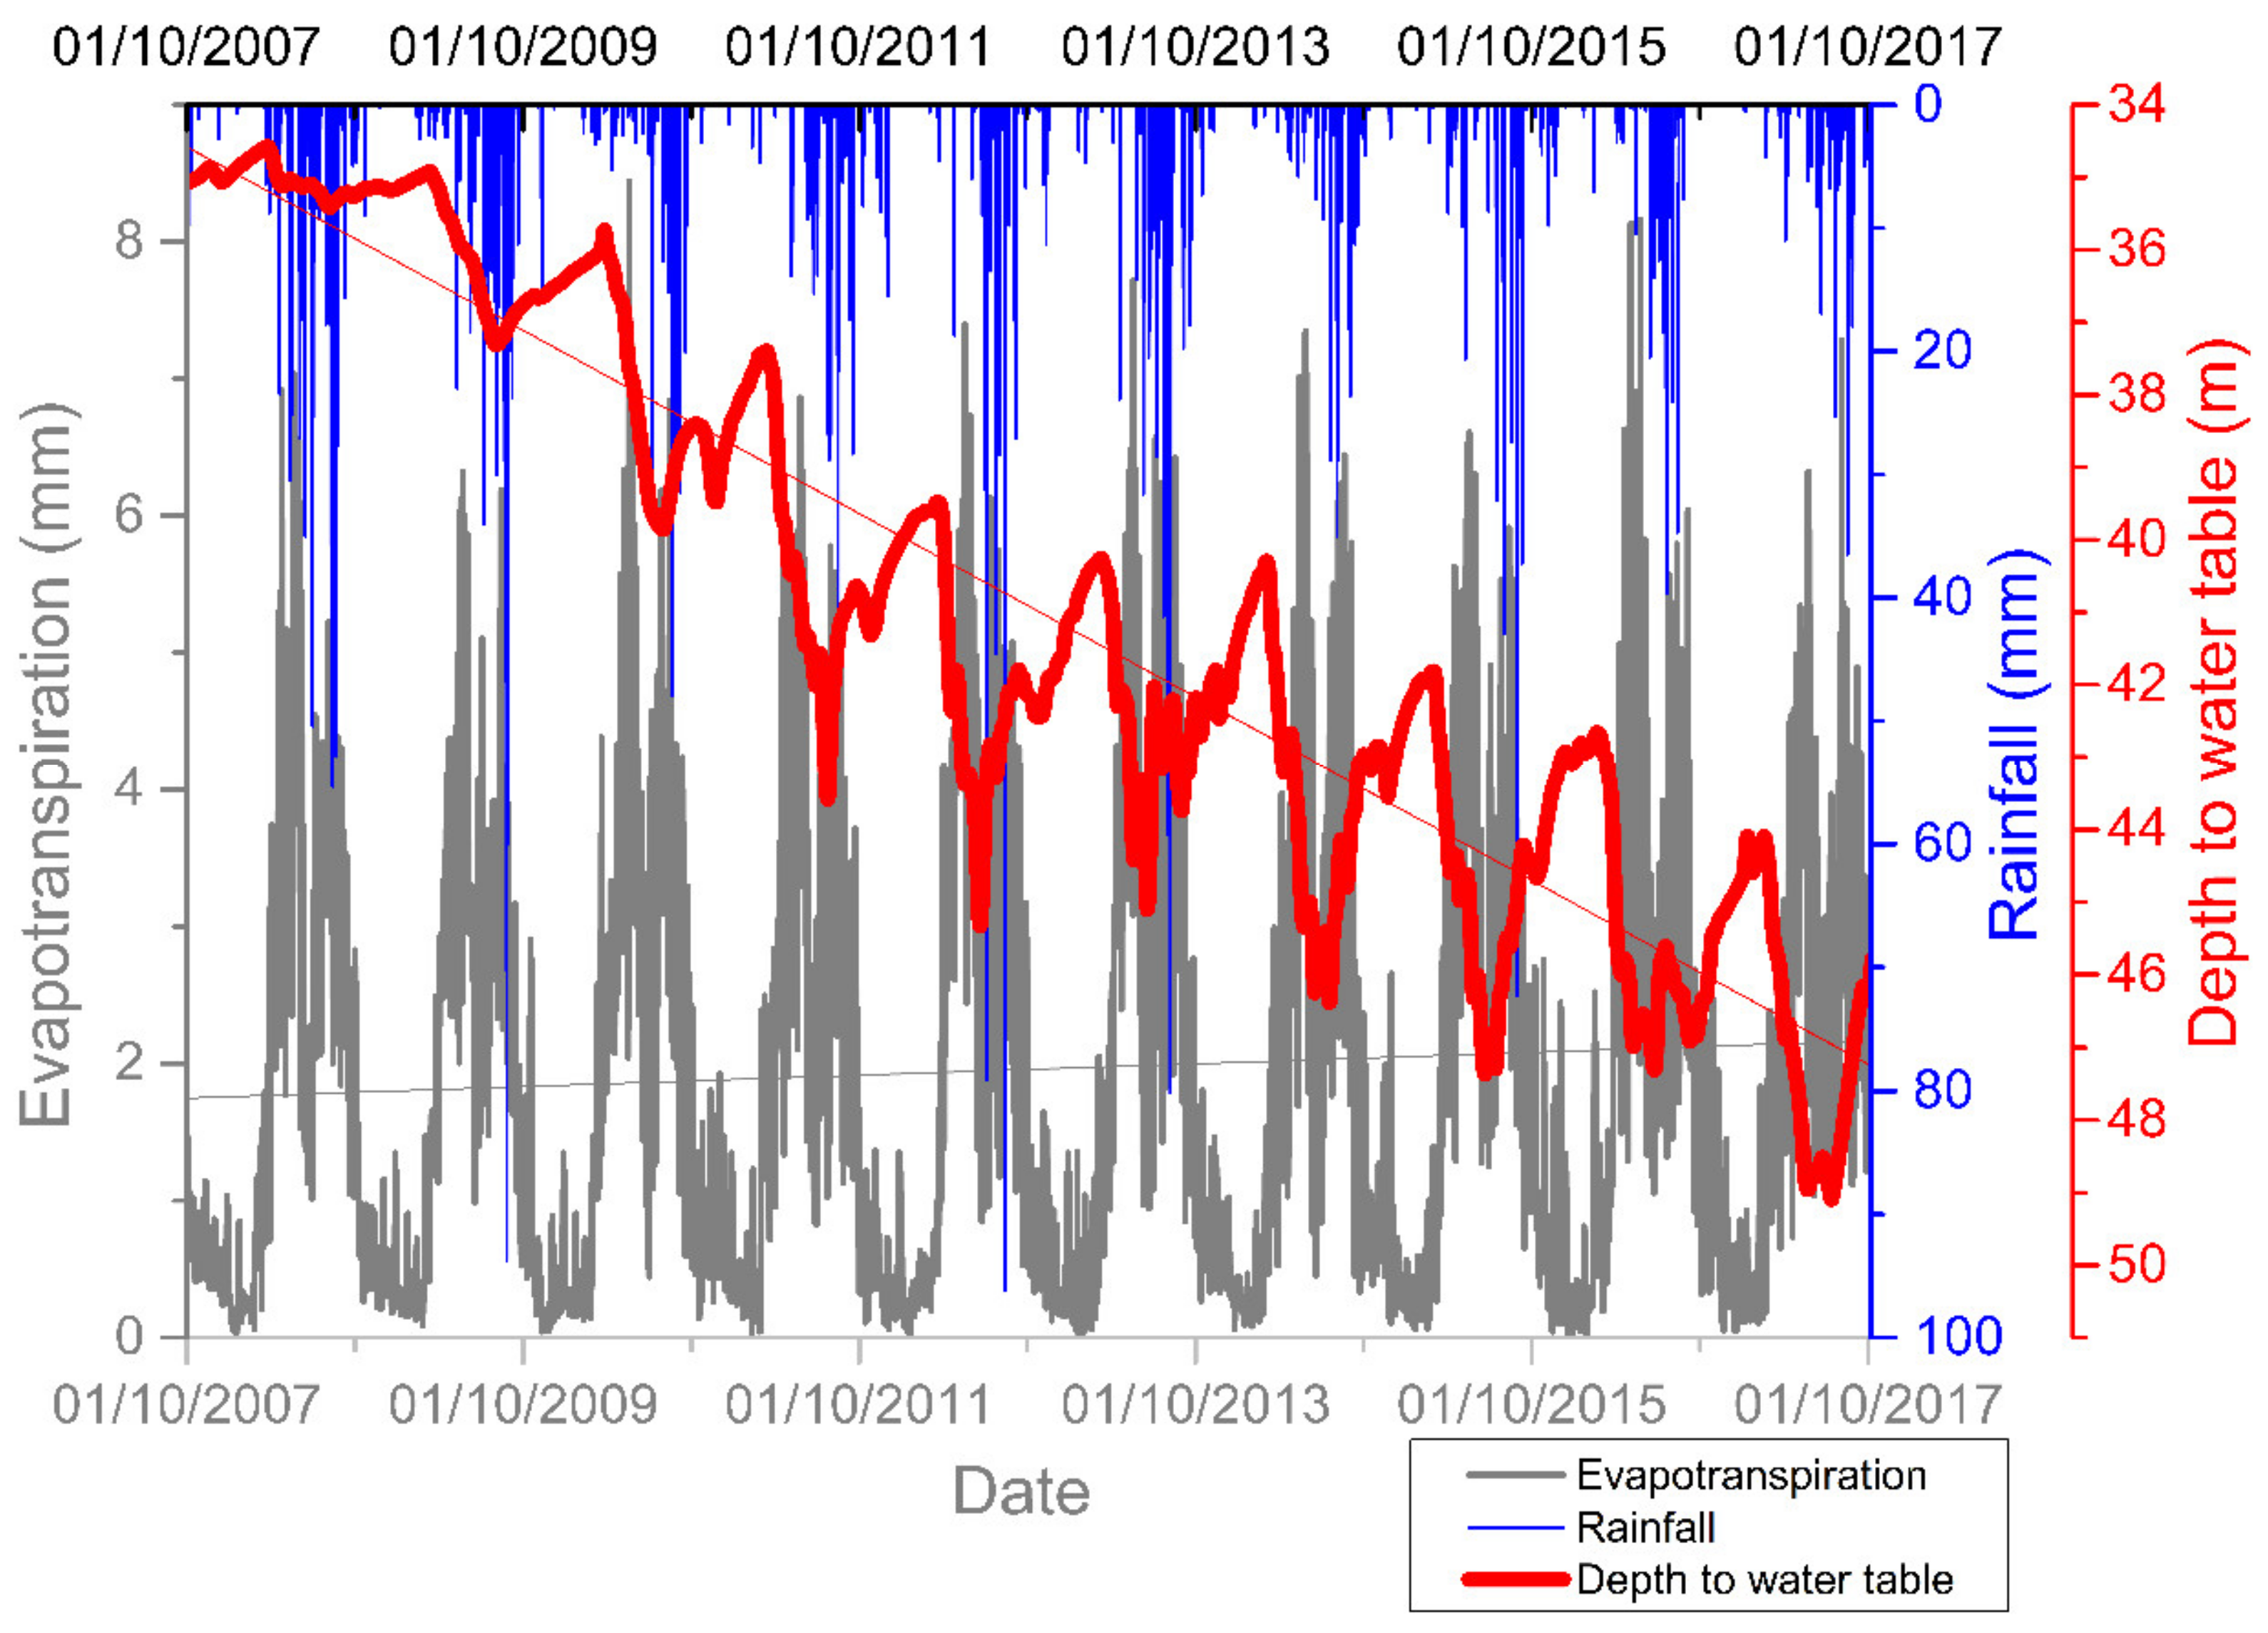
2.1. Study Site and Soil

Experiments were conducted in nine lysimeters with three replicates using a FI, SDI, and SSDI system on a typical WW crop at the LAES-CAS, Shijiazhuang, Hebei Province, China, to monitor daily ET losses. The soil was collected from a 20–80 cm depth of a field after the summer maize had been harvested and air dried. Particle size analysis yielded an average value of 36.59% sand, 47.82% silt, and 15.59% clay.

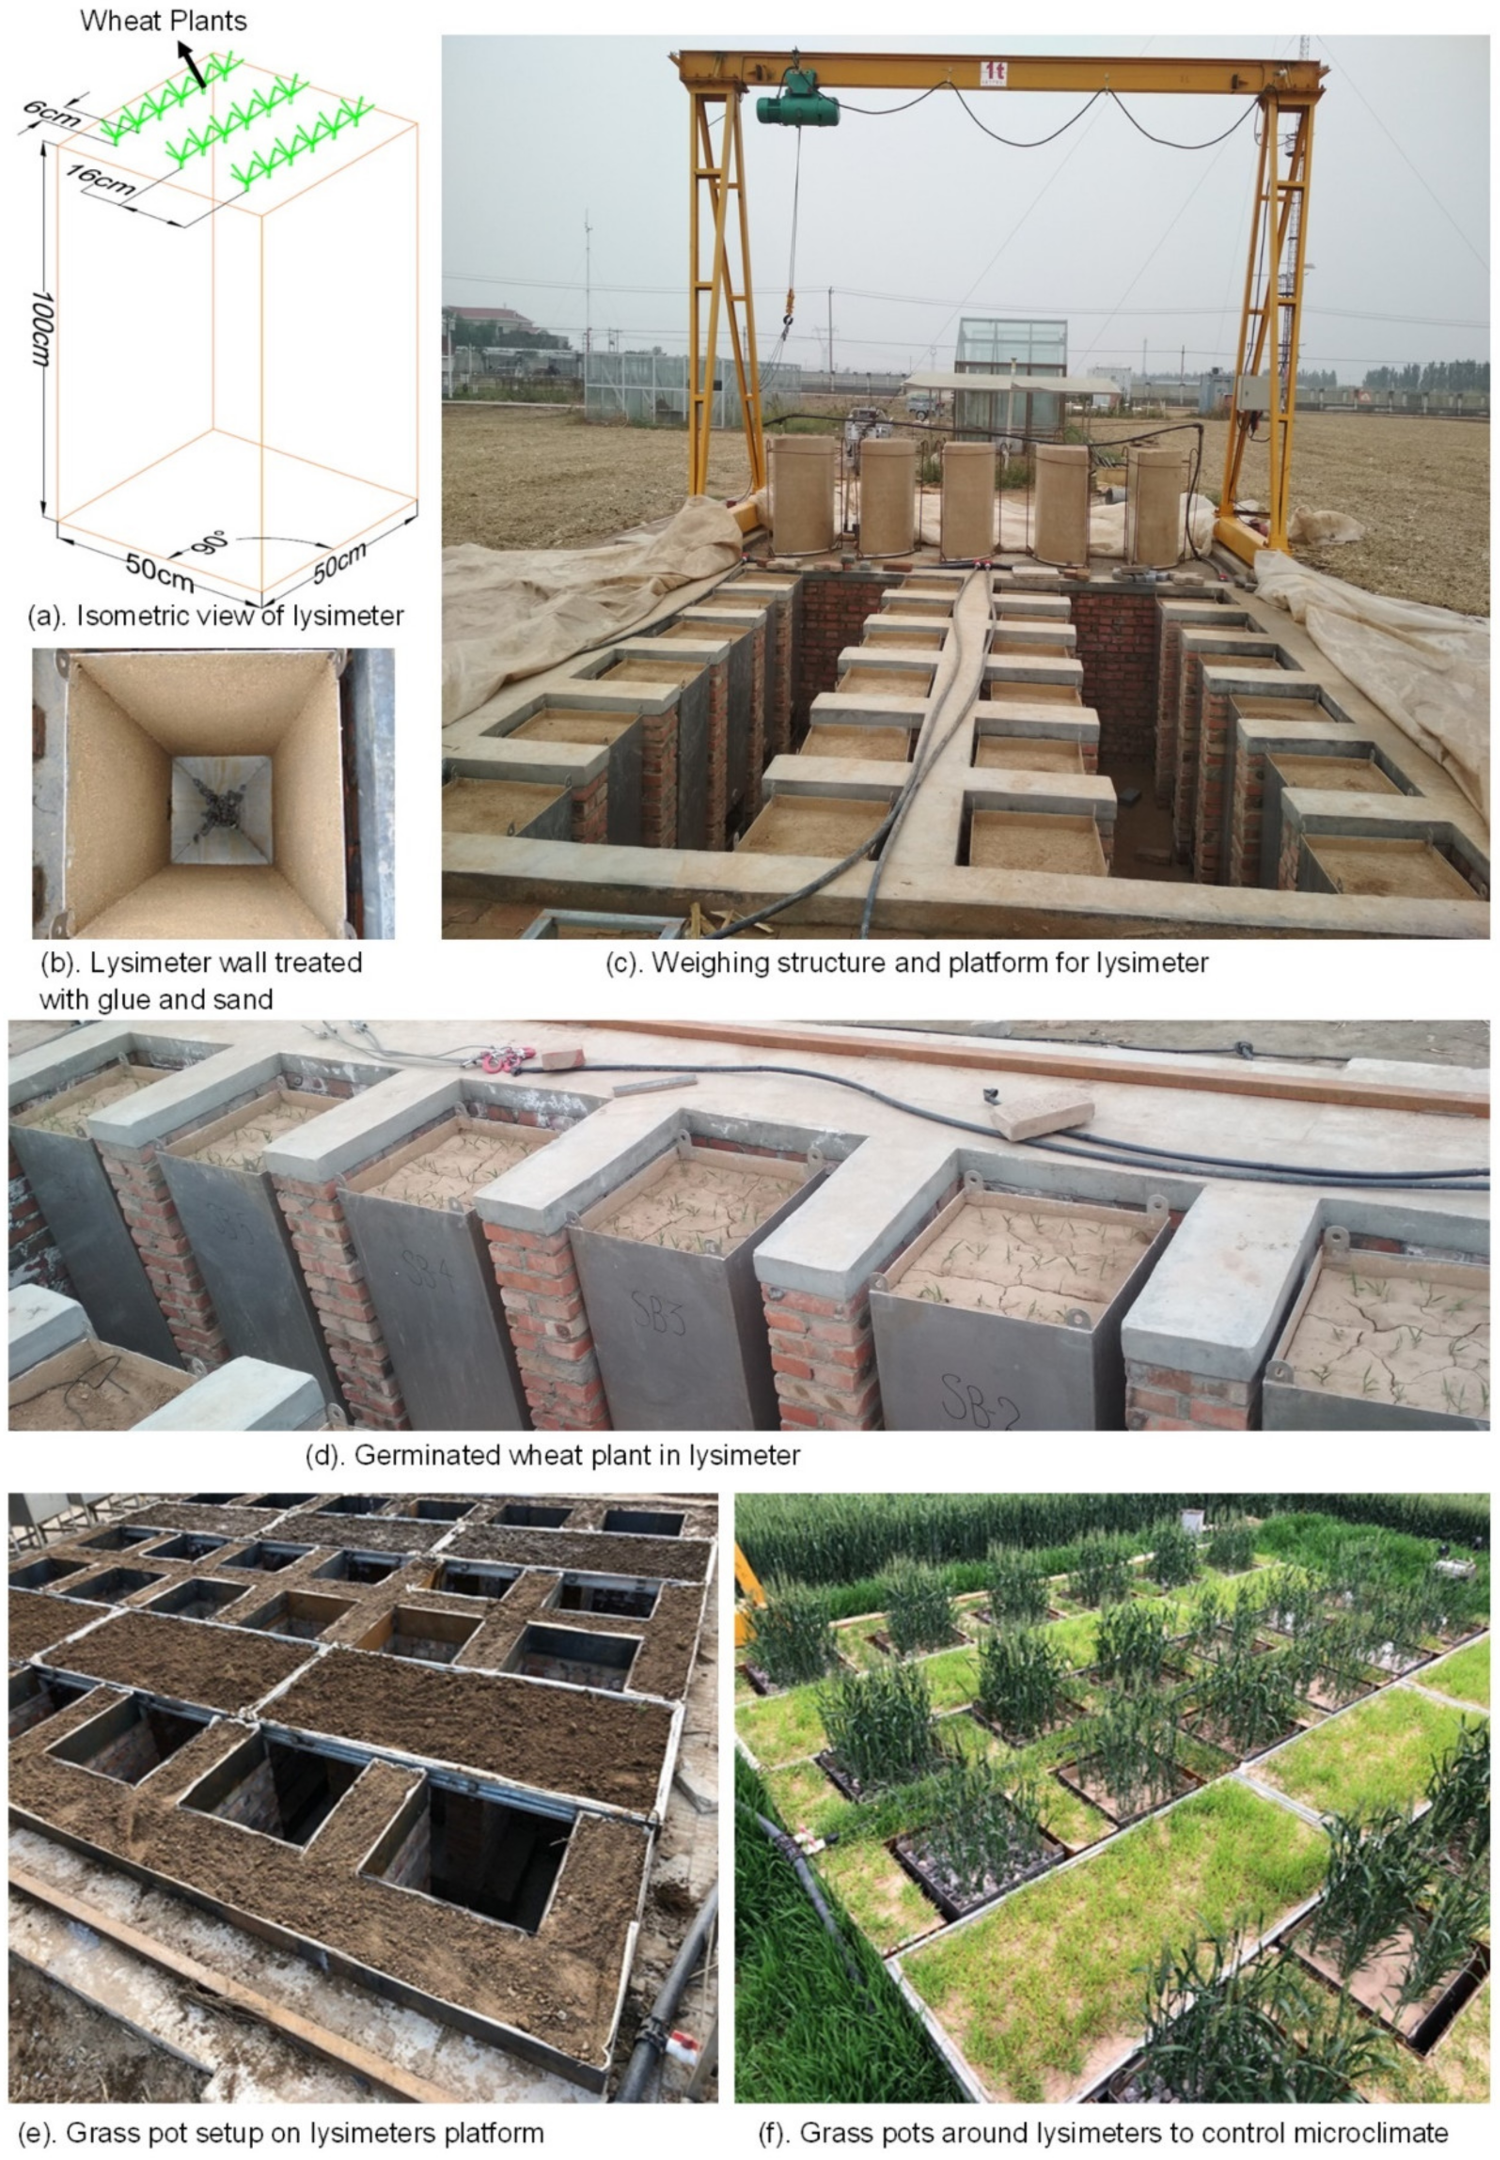
2.2. Lysimeter Setup

The experiment was conducted using a stainless steel container (50 cm length, 50 cm width, and 100 cm depth) (Figure 2a), which was filled with soil (36.59% sand, 47.82% silt, and 15.59% clay) with a bulk density of 1.5 (g/cm3), field capacity of 0.259 (m3/m3), and permanent wilting point of 0.109 (m3/m3). Prior to filling the soil, in order to inhibit preferential flow along the walls, it was sprayed with glue and treated with sand (Figure 2b) to make a coarse surface [36]. The lysimeters had three treatments with three replicates of FI, SDI, and SSDI (20 cm depth) irrigation. For drip treatments, an online dripper (2 L/h) was placed on the soil surface and connected to a 5-mm-diameter sphere on a thin pipe and installed at a 20 cm depth below the soil surface before soil filling-in SSDI treatments. For SDI treatments, a thin pipe (with a 5-mm-diameter sphere) was connected to a dripper placed on the soil surface in the lysimeters. The planting pattern of wheat in the lysimeter was the same as the field conditions, with a row-to-row dimension of 16 cm and plant-to-plant of 6 cm. Water from a reservoir located at a pressure of 0.2 MPa was delivered to the dripper using a 16 mm drip line. The area around the lysimeters was covered by soil (Figure 2e) before the start of the experiment and allowed to grow grasses during wheat sowing to control the microclimate (Figure 2f).

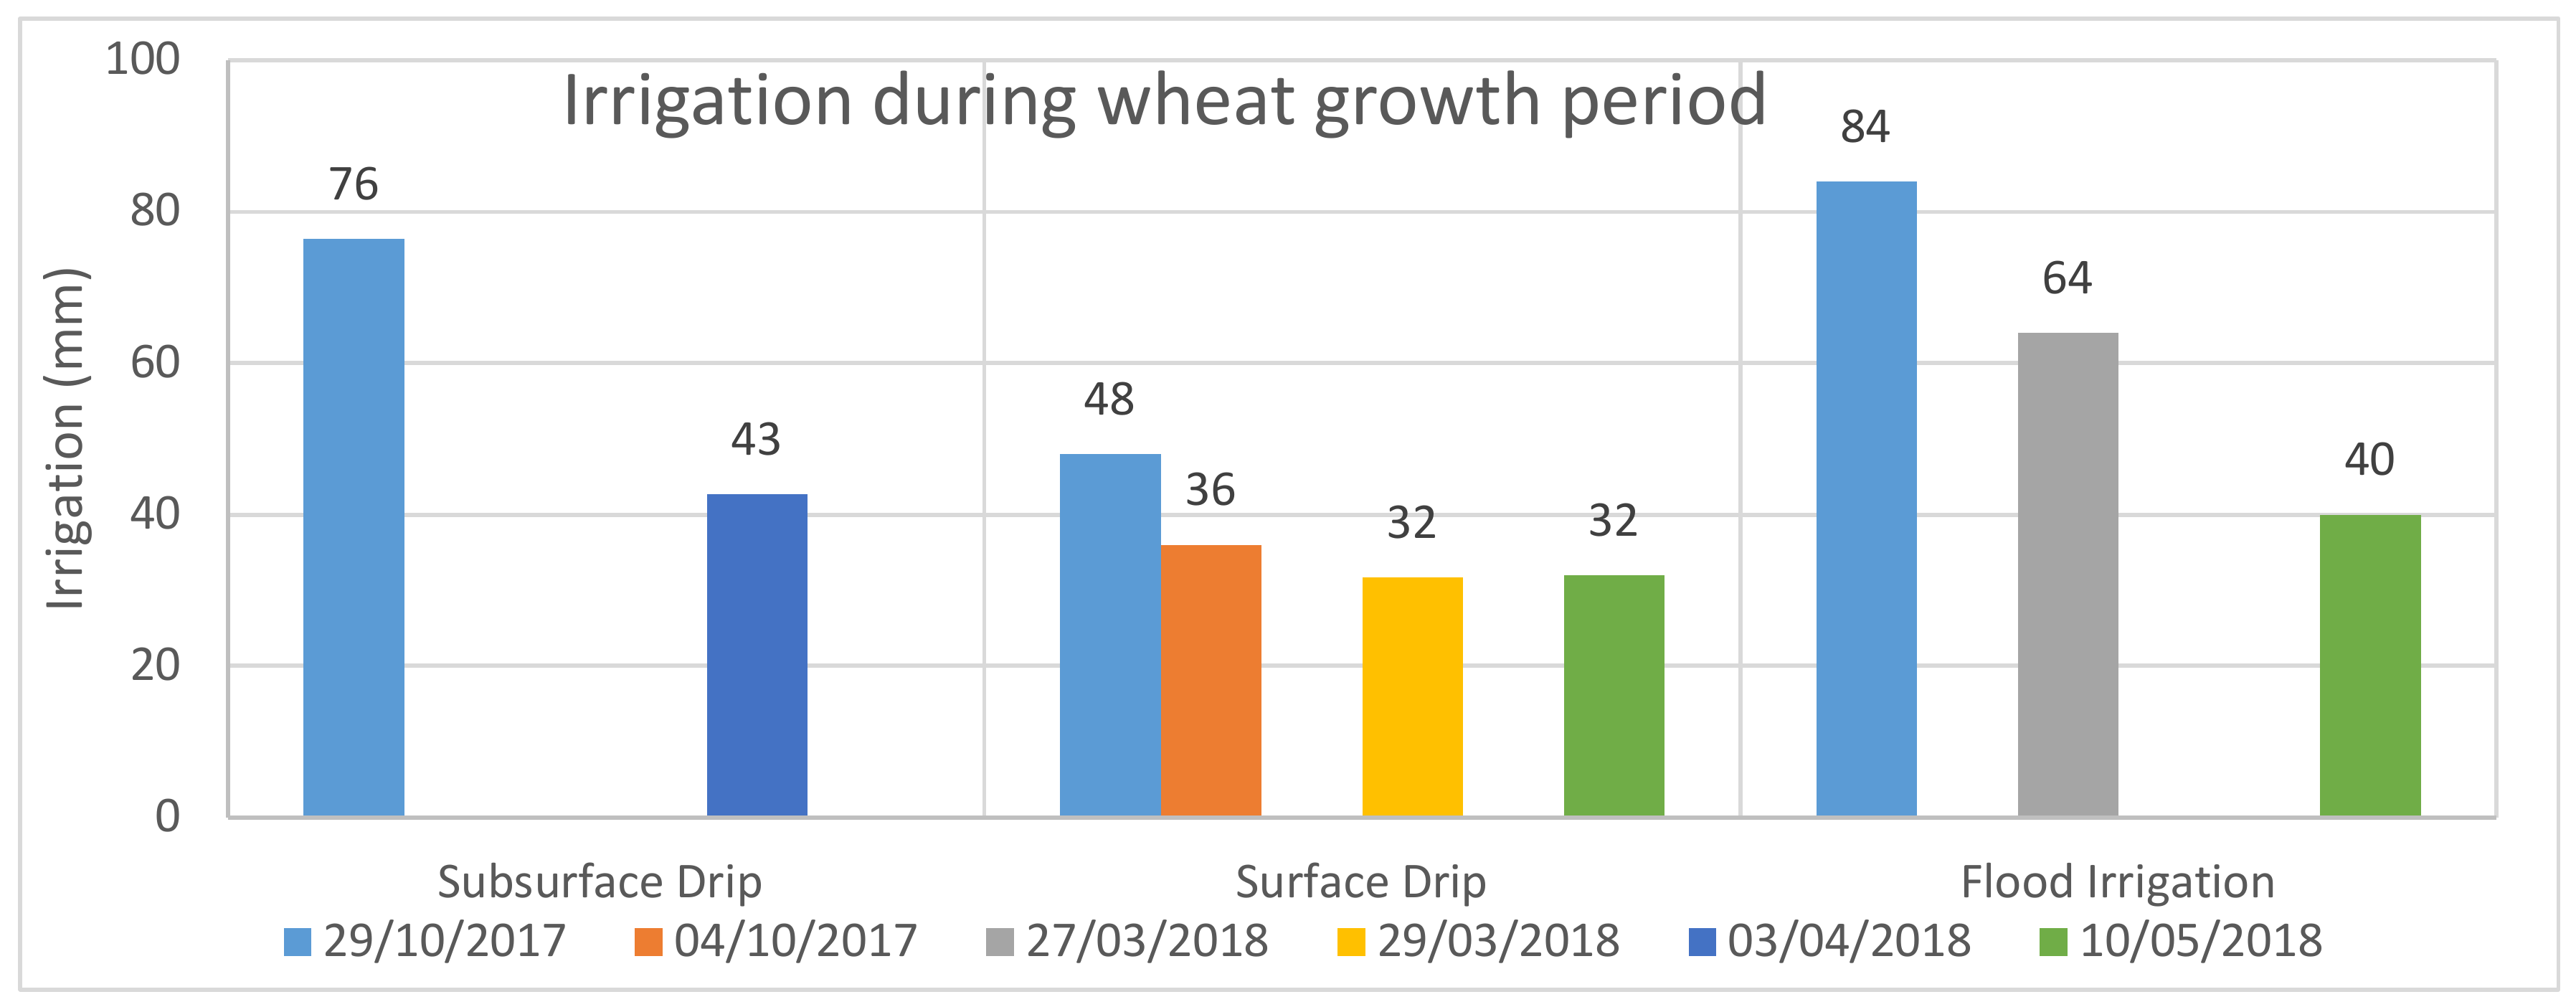
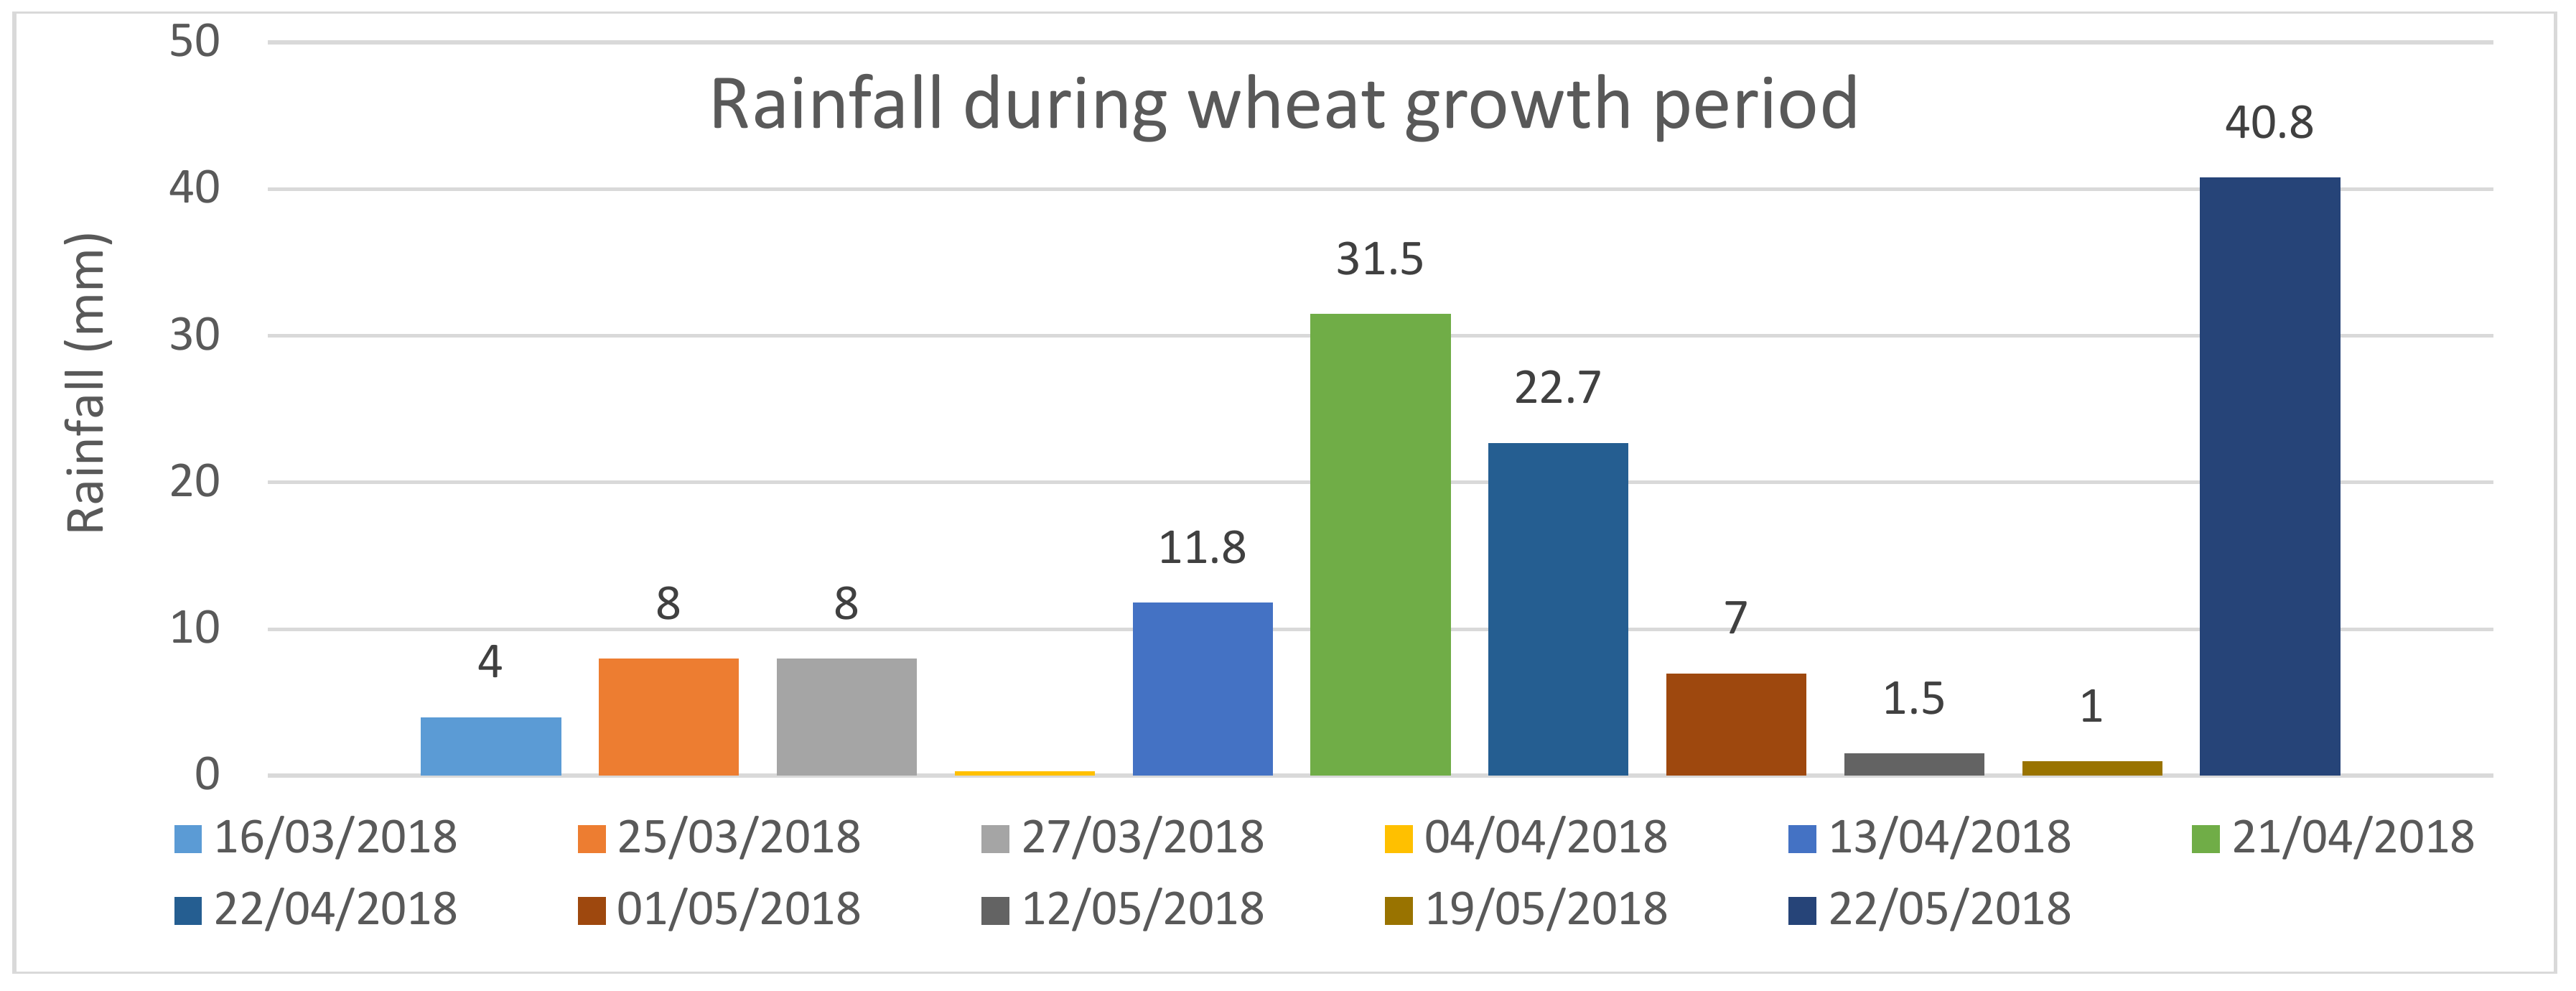
2.3. Crop Management

The WW variety Kenong.199 (Triticum aestivum L.) was sown in this experiment on 27 October 2017. A compound fertilizer (NPK = 18:22:5) and organic fertilizer, ~1500 kg/ha and ~1000 kg/ha, respectively, were applied during soil preparation, before seeds were sown. A plastic pipe (16 mm) connected to a water source tank, with a measure gauge, was used for irrigation for the FI treatment. Three applications of irrigation (84 mm, 64 mm, and 40 mm) were given during the FI treatment (Figure 3) in the WW season, depending on the rainfall. For drip irrigation treatments, pressurized water (0.2 MPa) was delivered to the dripper using a 16 mm drip line and then divided into SDI and SSDI. Irrigation scheduling was monitored by maintaining the moisture level of the top 10 cm of soil at more than 16%. Irrigation amounts, timing, and rainfall intensity on all irrigation treatments are shown in Figure 3 and Figure 4. Wheat plants were harvested on 5 June 2018.

3. Data Collection and Analysis

3.1. Photosynthesis Measurements

Leaf gas exchange was measured by the portable infrared CO2/H2O gas exchange analyzer LI-COR 6400XT (LI-COR, Lincoln, NE, USA), with 380 µmol m−2 s−1 CO2, 400 µmol m−2 s−1 flow rate and ambient photosynthetic photon flux density (PPFD, i.e., 900–1200 µmol photon m−2 s−1). Net photosynthetic rate (Pn (µmol.m−2.s−1)), stomatal conductance (Gs (mol.m−2.s−1)), intercellular carbon dioxide concentration (Ci (µmol.m−2.s−1)), and transpiration (E (mol.m−2.s−1)) were measured on the fully emerged leaf blades (2–3 leaves from the top). Intrinsic water use efficiency was calculated by using the formula: WUEi = PN/Gs. Relative chlorophyll content was estimated by the SPAD 502 (Konica Minolta, Japan).

3.2. Evapotranspiration, Aboveground Biomass and Grain Yield Measurements

Weighing lysimeters were used for the purpose of determining the evapotranspiration, especially the water balance components. From all known methods, the lysimeter is considered the most accurate, but in order to obtain reliable data, their calibration must be performed in situ. The UTILCELL Hanging S-type-620 load cell (Figure 2c), with an accuracy standard of O.I.M.L R60 Class C 3000, was employed for accountability of weight change (evapotranspiration) throughout the wheat growth period (from seed germination (Figure 2d) to harvest). Before the start of the experiment, the load cell was calibrated by use of 500 kg standard test weights. At maturity, entire plants were harvested at the ground surface and placed in a mesh bag. All of the bags were dried in an electric oven (75 °C) until a constant weight was achieved. Yield components, such as average plant height (APH), total number of panicle (TNP), average ear length (AEL), sterile spikelet number (SSN), total spikelet numbers (TSN), total spike weight (TSW), straw weight (SW), total grain weight (TGW), total number of grains (TNG), grain weight (GW), yield (Y), and biomass (B) of each pot were then counted, as shown in Table 1.

3.3. Water Balance, Crop and Irrigation Water Productivity

The soil water balance equation [37] was employed with a combination of evapotranspiration, irrigation, and precipitation to determine the water storage in soil. This equation can be expressed as
E T = I + P S D
where ET (mm) is evapotranspiration, I (mm) is irrigation, P (mm) is precipitation, S (mm) is change in water storage in soil, and D (mm) is drainage (zero).
Crop water productivity is a significant value for determining food–water relationships and for judging the sustainability of the system. Crop water productivity at the lysimeter scale is defined as the output of crop (kg ha−1) per unit of water consumed (mm) [38,39].
C W P ı = Y E T
Irrigation water productivity at the lysimeter scale is the ratio of crop yield (kg ha−1) to the actual applied irrigation amount (mm) [34,40].
I W P ı = Y I W A
where CWPl (kg ha−1mm−1) is the crop water productivity, IWPl (kg ha−1mm−1) is the irrigation water productivity, Y (kg ha−1) is the grain yield at maturity, IWA (mm) is the amount of irrigation water applied during the growing season of winter wheat, and ET (mm) is the total crop evapotranspiration over the growing season of winter wheat.

3.4. Statistical Analysis

All samples were analyzed in triplicate. The values represent means, one-way ANOVA was perform using SPPS at p < 0.05% and a post hoc (LSD Test) test was also carried out to determine the difference between the treatments at a least significance level of 95%.

4. Results

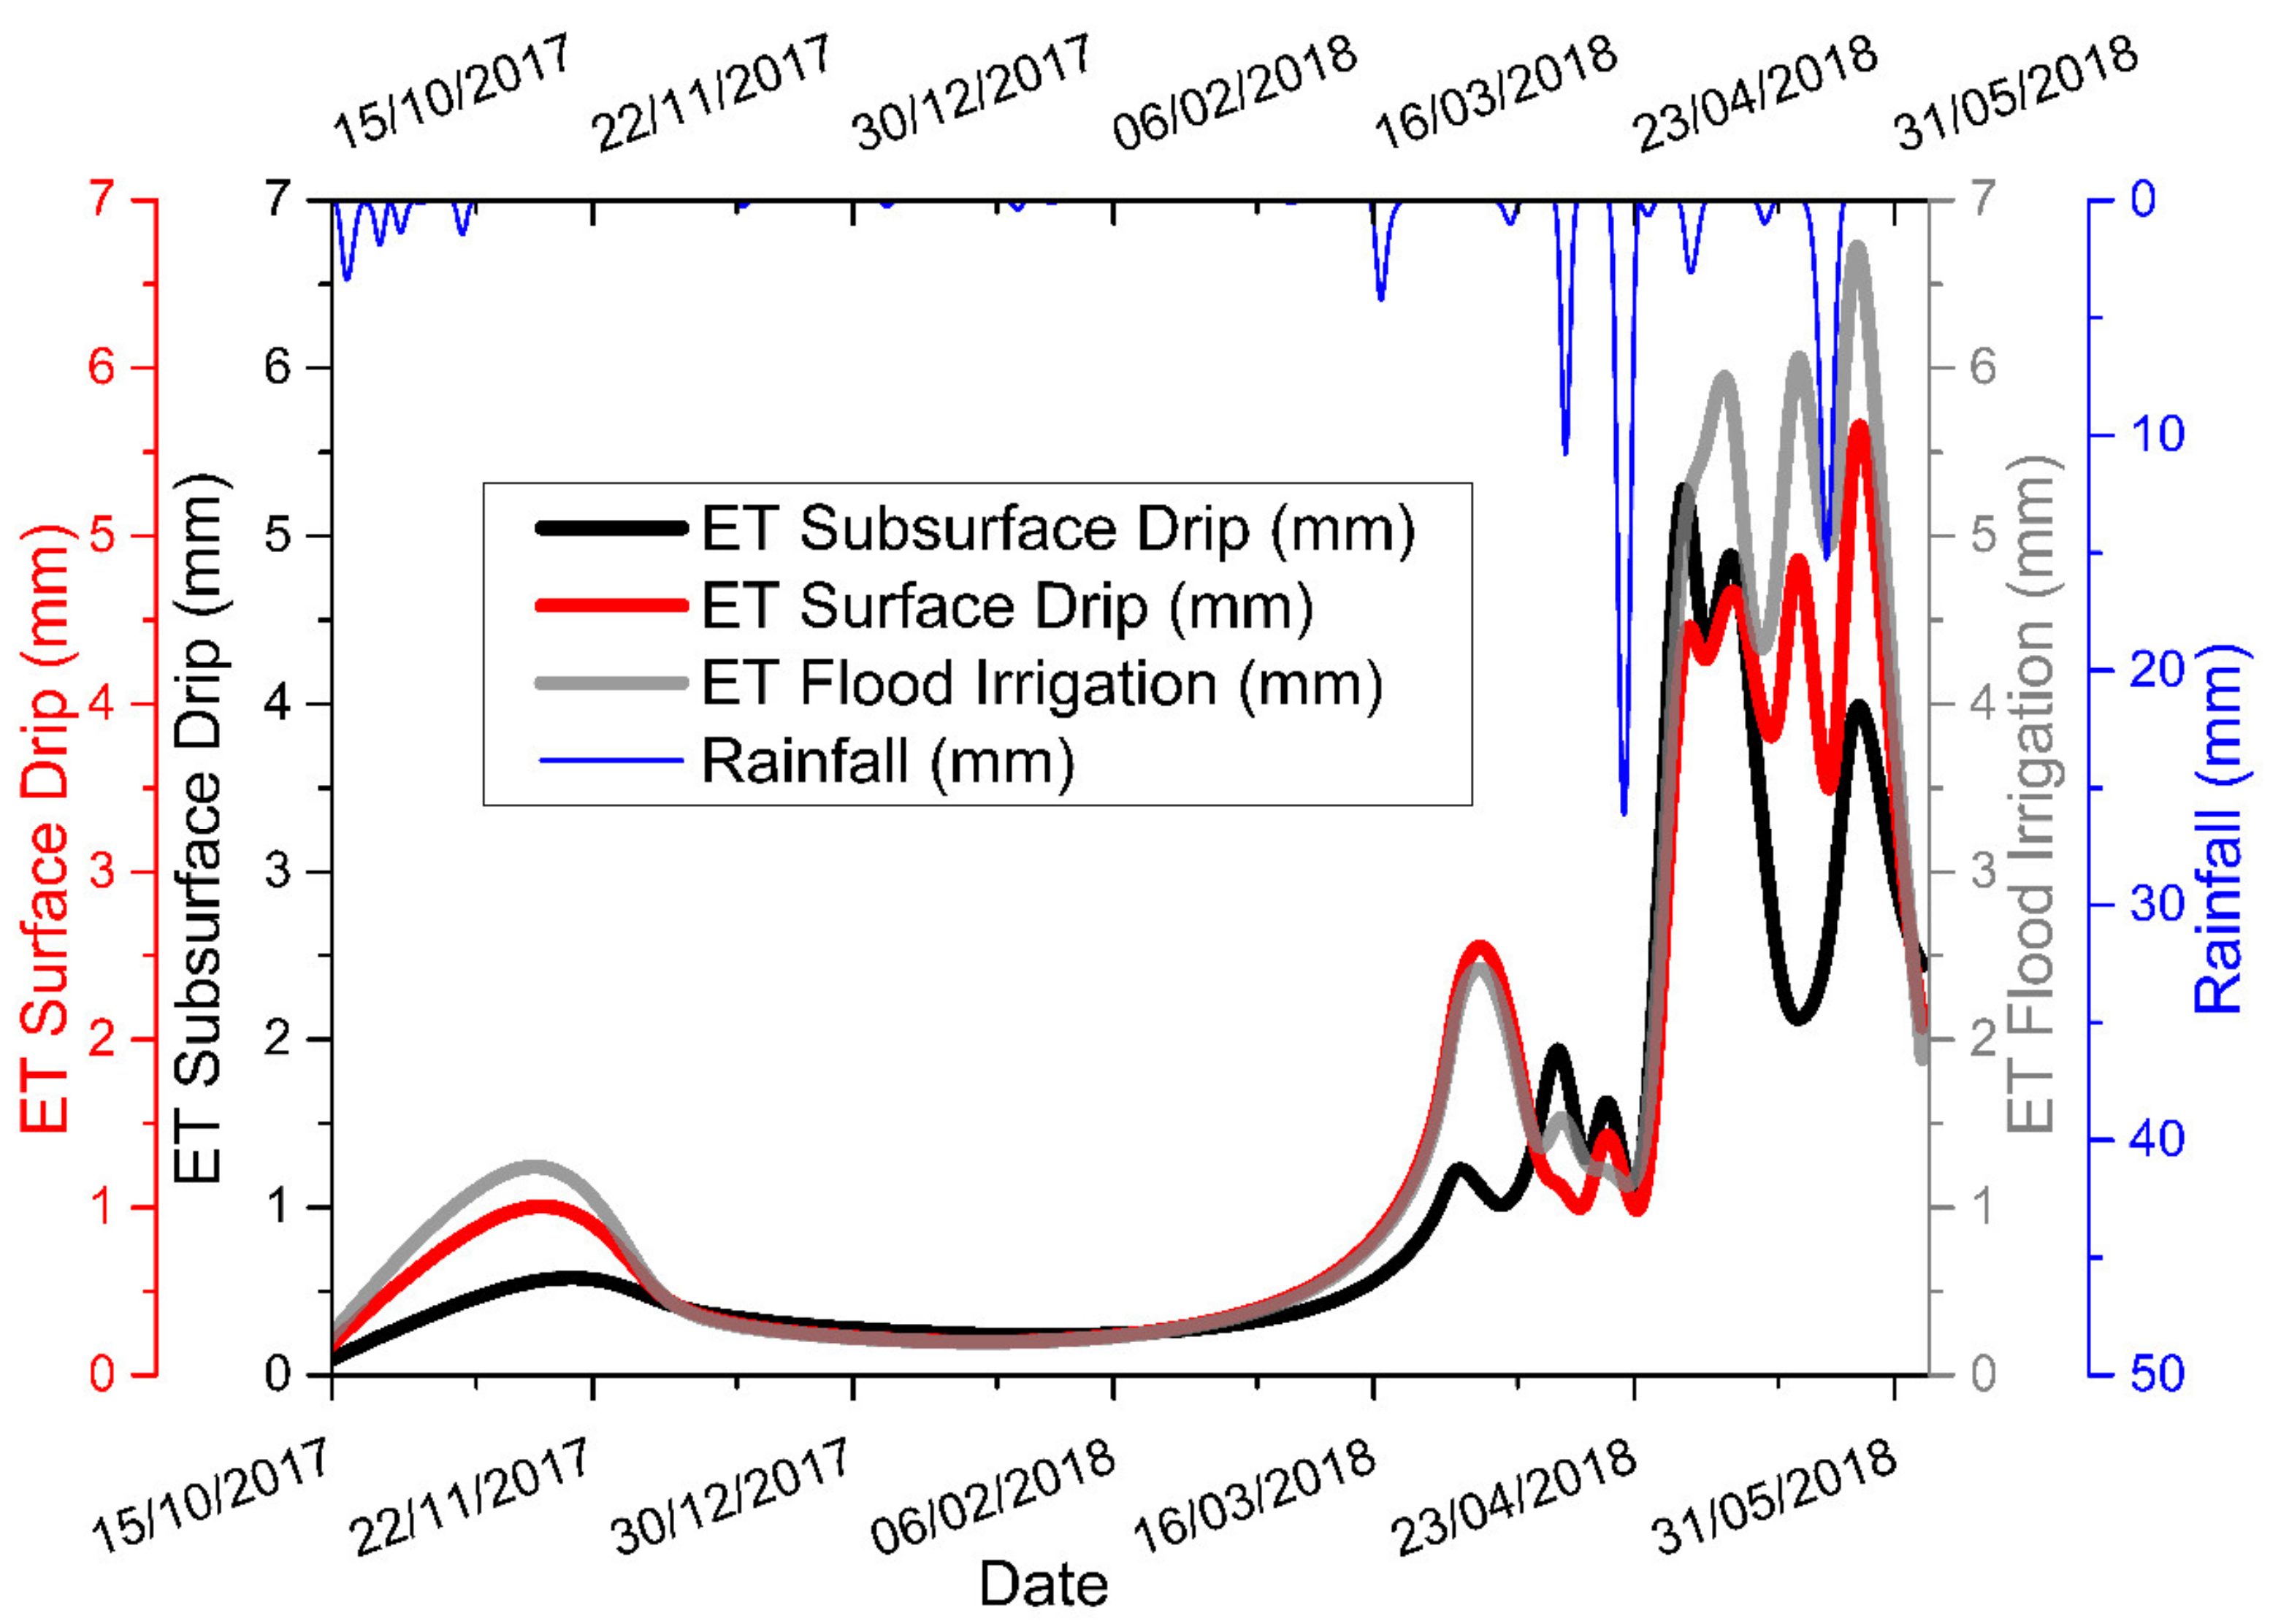
4.1. Evapotranspiration

The temporal trends in ET of different irrigation methods (i.e., FI, SDI, and SSDI) throughout the growth season for WW from planting (seeding) to harvesting are shown in Figure 5 and it is clearly illustrated that the most eminent total ET was found in FI and the lowest in SSDI. The total ET of SSDI treatments saved ~80 mm of water compared to FI, and SDI saved ~40 mm of water compared to FI. The ratio of ET (mm) per day was higher in the FI treatment group during the whole crop growth period, but was reduced by about ~2 mm/day in the SSDI group in the late growing period.

4.2. Grain Yield, Yield Components, and Aboveground Biomass

Grain yield was increased by 5.68% in FI and 3.41% in SSDI relative to the yield in SDI. Biomass was increased by 3.2% in SSDI compared to FI, but decreased by 9.5% in SDI compared to SSDI. Average plant height (APH), total number of panicles (TNP), sterile spikelet numbers (SSN), total spikelet numbers (TSN), straw weight (SW) and grain weight per 1000 g (1000 GW) was the highest in SSDI, the lowest in SDI, and intermediate in FI, but other remaining components, such as total spike weight (TSW) and total numbers of grain (TGN), were higher in FI than SSDI. Average ear length (AEL) for all irrigation treatments were almost the same.

4.3. Water Balance

During the crop growth season from seedling to reaping, the water balance of different irrigation treatments were obtained by applying the water balance equation (1) to each lysimeter, as shown in Table 2. The FI group had the highest amount of water input (~190 mm), as compared to SDI (~150 mm) and SSDI (~120 mm), needed to maintain soil moisture during the WW growth period. Rainfall (~136 mm) was constant in all irrigation treatments, but soil water storage (S), ranging from ~25 mm to ~35 mm, was the highest in SSDI.

4.4. Crop and Irrigation Water Productivity

Water applied is the sum of irrigation and rainfall during the wheat season. The highest amount of water applied was in FI, with the highest ET, and the lowest amount of irrigation was in SSDI, with the lowest ET (Table 3), but both had little difference in grain yield. CWPl and IWPl were directly related to yield, but CWPl was inversely proportional to ET and IWPl, respectively, relative to the applied water.
The highest value of CWPl (20.75 kg ha−1mm−1) and an eminent measure of IWPl (17.91 kg ha−1mm−1) were obtained in SSDI. The lowest CWPl (15.63 kg ha−1mm−1) and IWPl (14.40) were in FI and an intermediate CWPl (17.06 kg ha−1mm−1) and IWPl (15.48) were in SDI, as shown in Table 3.

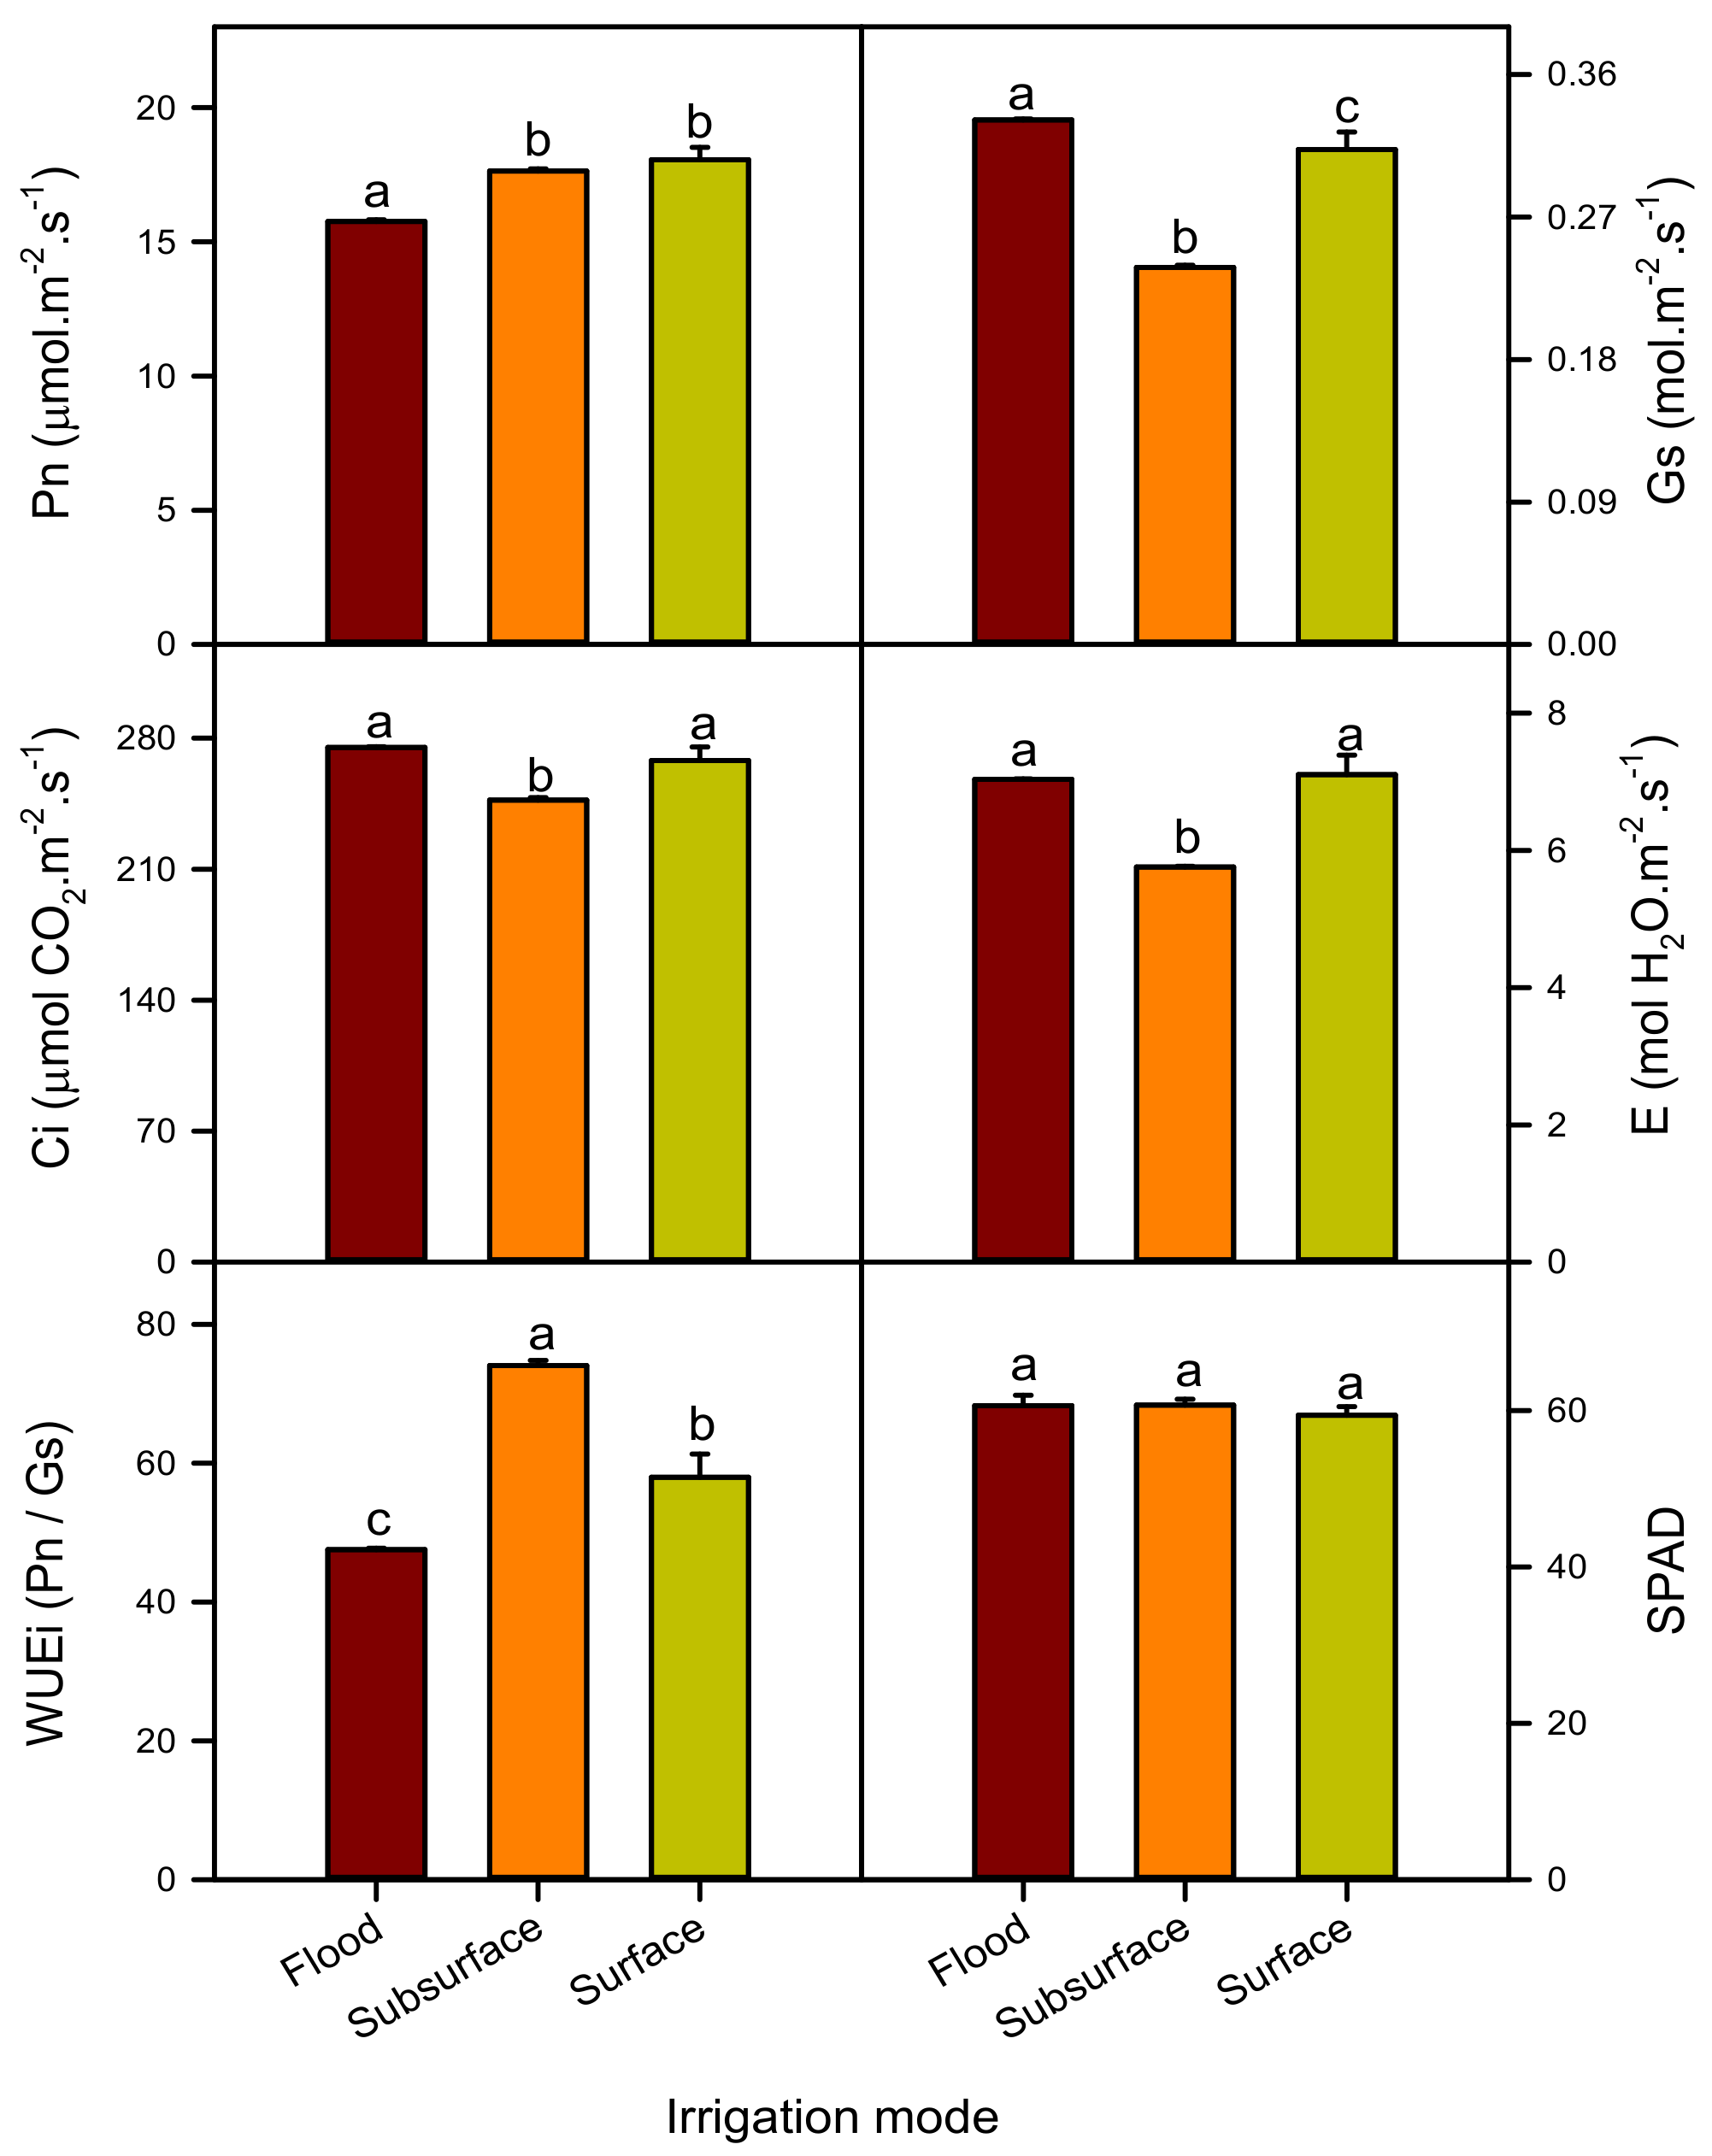
4.5. CO2/H2O Gas Exchange and Chlorophyll Estimation

The net photosynthesis rate (Pn) was higher (about 15%) in SDI and SSDI in comparison to FI treatments, however, stomatal conductance (Gs) values were the highest in the FI treatment. Similarly, intercellular CO2 (Ci) and the rate of transpiration (E) were lower in the SSDI treatment than the FI and SDI irrigated plants. However, intrinsic water use efficiency (WUEi) was observed to be about 22% and 55% higher than SDI and SSDI, respectively. Chlorophyll content (SPAD values) was not different between the treatment groups, as shown in Figure 6.

5. Discussion

The lysimeter experiment was designed to achieve the objective of more crop per drop under SSDI, SDI, and FI treatments in the field of agriculture. SSDI reduced ET, increased crop water productivity and irrigation water productivity with significant grain yield and biomass compared to SDI and FI. Moreover, the measured leaf gas exchange of SSDI showed higher net photosynthesis and WUEi but lower intercellular CO2 (Ci), rate of transpiration, and stomatal conductance confirmed the effective water utilization. SSDI proved a highly efficient irrigation method to save water by avoiding evaporation losses without affecting the yield.

5.1. Evapotranspiration, Grain Yield, Yield Components and Biomass

The lower ET in SSDI during the crop growth period indicated that the soil surface remained dry and the plants took up water from the subsurface of the soil, due to the water store in micropores at a lower depth [41] that would be available for the plants. Soil evaporation under SSDI irrigation was lower compare to SDI and FI, because SSDI limits soil surface wetting and reduces ET [33]. Total seasonal ET of SSDI during the whole wheat growth period was 15% lower than that of SDI, and ET of FI was 26% higher than that of SSDI and was comparable to the reduction in ET under drip irrigation by Qin, Li, Kang, Du, Tong and Ding [26], Sakellariou-Makrantonaki and Papanikolaou [28], and Evett [33]. Similarly, the application of the drip irrigation system (i.e., SDI or SSDI) has been popular for improving irrigation water use efficiency by minimizing soil evaporation, as reported by [29,30,42]. The changing trend of ET values (Figure 5) under different irrigation is coherent with earlier described distinctive ET trends [16,43,44,45]. A significant decrease in ET in SSDI throughout the late growing season was coherent with an earlier report by Allen [43].
A higher panicle number per lysimeter, more filled kernels, and a heavier kernel weight provided a high yield in SSDI and FI, and were evidence of the uniform availability of soil moisture to plants during the growth period. A higher aboveground biomass in SSDI than in FI was mainly dependent on the larger share of panicles and higher straw weight from the subsurface soil remaining wet in SSDI throughout the vegetative growth period. The highest spike weight and spike number in FI and SSDI contributed towards the high grain yield, as compared to SDI. A number of spikes were higher in SSDI compared to FI, but spike weight was heavier in FI compared to SSDI, which was the same scenario reported by El-Rahman [46] during a wheat yield study conducted under different amounts of drip irrigation. A higher grain yield due to heavier spike weight and their significant correlation was also reported by [47,48]. Grain yield was highly correlated with the irrigation amount in the soil. Uniform accessibility of moisture in the soil during FI and SSDI resulted in a high grain yield [49]. Soil moisture in SDI was depleted quickly because of soil evaporation, restricting water uptake by roots, and enforcing extremely bad physiological limitations [50], as well as harm to the photosynthetic system [51], contraction of the development period, assimilated translocation, reduced carbon fixation, and reduced grain set. Based on these consequences, frequent use of SSDI reduces soil evaporation losses and increases the yield.

5.2. Water Balance, Crop and Irrigation Water Productivity

The computation of water balance elements is significant for the prevention of unnecessary water losses. Application of different irrigation amounts according to soil moisture requirements under different treatments was the reason for fluctuation in ET and S during the season. The computation of water balance showed a demand for more irrigation in FI to counterbalance the ET deficit. Previously, various studies have reported these variations in water balance components [52,53]. The CWPl and IWPl increased in SSDI, because of a higher reduction in crop ET (due to less evaporation as explained in the previous section), with less applied water and an acceptable amount of yield. On the other side, CWPl and IWPl decreased in FI due to high water losses, which consequently increased the water application amount and ET. Our findings are also in agreement with other reports [25,32,34]. This may be due to the increased water supply, resulting in ineffective translocation of imbibes to the wheat grain. CWPl and IWPl decreased with increasing number of irrigations, due to ineffective utilization of water [54]. SSDI applies water directly into the root zone and therefore resulted in less evaporation with high water use efficiency, which is one of the prominent advantages of this method [29].

5.3. Photosynthesis

About 90% of the biomass of a plant is derived from photosynthetic products [55]. The CO2/H2O exchange attributes in the different irrigation systems (i.e., FI, SDI, and SSDI) demonstrated an efficient use of water during the growing period of wheat (Figure 6). It is the well-known dilemma of the plant leaf that it needs to open its stomata for carbon uptake, but loses water at the same time [56,57]. How to save water in the plant during photosynthesis has been a long debate and a number of efforts to do so have been made in last few decades [58,59,60,61]. In this study, we implemented an irrigation system that conserves water from the start of irrigation. Interestingly, the SSDI- and SDI-irrigated plants showed an increase in net photosynthesis, as well as higher WUEi. In addition, a lower transpiration rate (E) in the SSDI treatment also supported our assumption of water saving and contributed to lower ET vales overall. Further, distinguishing the components of water loss by soil and leaf (transpiration) will demonstrate a bottle neck of water loss. A higher stomatal conductance (Gs) in the FI treatment is in agreement with a higher intercellular CO2, but those plants probably could not assimilate carbon efficiently compared to the SDI and SSDI treatments. Therefore, we suggest that sufficient water must be provided during irrigation in order to not harm the photosynthetic machinery (e.g., chlorophyll (see the SPAD data)), but water use efficiency should be enhanced.

5.4. Water Saving Capacity of SSDI in Hebei Plain, NCP

The above findings proved that SSDI is the only way to reduce water pumping in the double cropping system by avoiding unnecessary water losses without any effect on grain yield. An irrigation reduction of 26% (ET step down by using SSDI, due to less evaporation losses) in around 1.7 Mha of a cultivation area in Hebei Plain, NCP, would save approximately 4,420 million m3 year−1 of water. CWPl and IWPl increased in SSDI due to less evaporation, but the in-flood irrigation value of CWPl and IWPl decreased with increasing number of irrigations due to ineffective utilization of water [54]. Research in SSDI consistently demonstrates that improvement in quality and yield of produce is more beneficial than the initial investment. The life expectancy of an efficient SSDI system is considered to be 15 years [62], and some well-maintained SSDI systems have been working for 29 years [63]. SSDI systems remain buried under the crop for many years and have saved a lot of input costs (i.e., water, fertilizer), resulted in high outputs (increased yield and quality), and are overall economically feasible. Recent studies in Luancheng on soil water dynamics under drip irrigation, suggested using a SSDI depth for proper seed germination and tillage methods for the NCP. Chinese authorities need to educate and train farmers for SSDI adaptation in the NCP. The consequences of this analysis clearly suggest that the SSDI needs to be adopted on an emergency basis to save groundwater. It can also assist as a practical tool for appraising national water and food security in the farming sector in water deficit regions.

6. Conclusions

Our study demonstrates the implication of using different irrigation methods for wheat growth. We recommended the subsurface drip irrigation technique, due its low evapotranspiration as compared to the conventionally-used flood irrigation method, and it is even better than surface drip irrigation without affecting the crop. A further long-term implication of the suggested method is that it will also save water (about 26% compared to flood irrigation), improve crop water productivity, and reduce annual water deficit in the NCP, with potential applications in various parts of the world.

Author Contributions

M.U. design the study, perform the experiment, synthesized results and constructed tables, figures for the paper, created the first and final draft, T.H. measured photosynthesis, data analysis and contributed to the final version of the manuscript, A.A. constructed tables, figures, review the results and contributed to the final version of the manuscript, H.J. and Y.J. measured photosynthesis, Y.Q. contributed to install weight balance platform, Y.Z. contributed to install drip irrigation system, L.M. contributed in soil analysis and lysimeter filling and Y.S. design the study, monitor the experiment, review the results and created the final version of the manuscript.

Funding

This work was supported by the National Key Project of Research and Development Plan (grant no. 2016YFC0401403), the Belt and Road Project (grant no. 331 153E13KYSB20170010), CAS-TWAS President’s Fellowship Program (2015A8015607327) for international PhD students by Chinese Academy of Science and the World Academy Sciences.

Conflicts of Interest

The authors declare no conflict of interest.

References

  1. Alexandratos, N.; Bruinsma, J. World Agriculture towards 2030/2050 the 2012 Revision ESA Working Paper no. 12-03; Agricultural Development Economics Division; Food and Agriculture Organization of the United Nations (FAO): Rome, Italy, 2012. [Google Scholar]
  2. Siebert, S.; Burke, J.; Faures, J.M.; Frenken, K.; Hoogeveen, J.; Döll, P.; Portmann, F.T. Groundwater use for irrigation—A global inventory. Hydrol. Earth Syst. Sci. 2010, 14, 1863–1880. [Google Scholar] [CrossRef]
  3. Wada, Y.; Beek, L.P.H.; Bierkens, M.F.P. Nonsustainable groundwater sustaining irrigation: A global assessment. Water Resour. Res. 2012, 48. [Google Scholar] [CrossRef]
  4. Lu, C.; Fan, L. Winter wheat yield potentials and yield gaps in the north china plain. Field Crops Res. 2013, 143, 98–105. [Google Scholar] [CrossRef]
  5. Sun, H.; Shen, Y.; Yu, Q.; Flerchinger, G.N.; Zhang, Y.; Liu, C.; Zhang, X. Effect of precipitation change on water balance and WUE of the winter wheat–summer maize rotation in the north china plain. Agric. Water Manag. 2010, 97, 1139–1145. [Google Scholar] [CrossRef]
  6. Liu, L.; Luo, Y.; He, C.; Lai, J.; Li, X. Roles of the combined irrigation, drainage, and storage of the canal network in improving water reuse in the irrigation districts along the lower Yellow River, China. J. Hydrol. 2010, 391, 157–174. [Google Scholar] [CrossRef]
  7. Shen, Y.; Zhang, Y.; Scanlon, R.B.; Lei, H.; Yang, D.; Yang, F. Energy/water budgets and productivity of the typical croplands irrigated with groundwater and surface water in the North China plain. Agric. For. Meteorol. 2013, 181, 133–142. [Google Scholar] [CrossRef]
  8. Zhang, X.; Qin, W.; Chen, S.; Shao, L.; Sun, H. Responses of yield and wue of winter wheat to water stress during the past three decades—A case study in the North China plain. Agric. Water Manag. 2017, 179, 47–54. [Google Scholar] [CrossRef]
  9. Shen, Y.; Zhang, Y.; Kondoh, A.; Tang, C.; Chen, J.; Xiao, J.; Sakura, Y.; Liu, C.; Sun, H. Seasonal variation of energy partitioning in irrigated lands. Hydrol. Process. 2004, 18, 2223–2234. [Google Scholar] [CrossRef]
  10. Todd, R.W.; Evett, S.R.; Howell, T.A. The bowen ratio-energy balance method for estimating latent heat flux of irrigated Alfalfa evaluated in a semi-arid, advective environment. Agric. For. Meteorol. 2000, 103, 335–348. [Google Scholar] [CrossRef]
  11. Shao, L.; Zhang, X.; Hideki, A.; Tsuji, W.; Chen, S. Effects of defoliation on grain yield and water use of winter wheat. J. Agric. Sci. 2010, 148, 191–204. [Google Scholar] [CrossRef]
  12. Scott, R.L. Using watershed water balance to evaluate the accuracy of eddy covariance evaporation measurements for three semiarid ecosystems. Agric. For. Meteorol. 2010, 150, 219–225. [Google Scholar] [CrossRef]
  13. Zhou, L.; Zhou, G. Measurement and modelling of evapotranspiration over a reed (Phragmites australis) marsh in Northeast China. J. Hydrol. 2009, 372, 41–47. [Google Scholar] [CrossRef]
  14. Zhang, Y.; Shen, Y.; Sun, H.; Gates, J.B. Evapotranspiration and its partitioning in an irrigated winter wheat field: A combined isotopic and Micrometeorologic approach. J. Hydrol. 2011, 408, 203–211. [Google Scholar] [CrossRef]
  15. Castellví, F.; Snyder, R.L. A comparison between latent heat fluxes over grass using a weighing lysimeter and surface renewal analysis. J. Hydrol. 2010, 381, 213–220. [Google Scholar] [CrossRef]
  16. Liu, C.; Zhang, X.; Zhang, Y. Determination of daily evaporation and evapotranspiration of winter wheat and maize by large-scale weighing lysimeter and micro-lysimeter. Agric. For. Meteorol. 2002, 111, 109–120. [Google Scholar] [CrossRef]
  17. Wilson, K.B.; Hanson, P.J.; Mulholland, P.J.; Baldocchi, D.D.; Wullschleger, S.D. A comparison of methods for determining forest evapotranspiration and its components: Sap-flow, soil water budget, eddy covariance and catchment water balance. Agric. For. Meteorol. 2001, 106, 153–168. [Google Scholar] [CrossRef]
  18. Luo, J.; Shen, Y.; Qi, Y.; Zhang, Y.; Xiao, D. Evaluating water conservation effects due to cropping system optimization on the Beijing-Tianjin-Hebei plain, China. Agric. Syst. 2018, 159, 32–41. [Google Scholar] [CrossRef]
  19. Wang, X.; Li, X.; Xin, L.; Tan, M.; Li, S.; Wang, R. Ecological compensation for winter wheat abandonment in groundwater over-exploited areas in the north china plain. J. Geogr. Sci. 2016, 26, 1463–1476. [Google Scholar] [CrossRef]
  20. Xie, H.; Cheng, L.; Lv, T. Factors influencing farmer willingness to fallow winter wheat and ecological compensation standards in a groundwater funnel area in Hengshui, Hebei Province, China. Sustainability 2017, 9, 839. [Google Scholar] [CrossRef]
  21. Chen, S.Y.; Zhang, X.Y.; Pei, D.; Sun, H.Y.; Chen, S.L. Effects of straw mulching on soil temperature, evaporation and yield of winter wheat: Field experiments on the north china plain. Ann. Appl. Biol. 2007, 150, 261–268. [Google Scholar] [CrossRef]
  22. Unger, P.W. Wheat residue management effects on soil water storage and corn production. Soil Sci. Soc. Am. J. 1986, 50, 764–770. [Google Scholar] [CrossRef]
  23. Wicks, G.A.; Crutchfield, D.A.; Burnside, O.C. Influence of wheat (Triticum aestivum) straw mulch and metolachlor on corn (Zea mays) growth and yield. Weed Sci. 1994, 42, 141–147. [Google Scholar] [CrossRef]
  24. Umair, M.; Shen, Y.; Qi, Y.; Zhang, Y.; Ahmad, A.; Pei, H.; Liu, M. Evaluation of the cropsyst model during wheat-maize rotations on the north china plain for identifying soil evaporation losses. Front. Plant Sci. 2017, 8, 1667. [Google Scholar] [CrossRef]
  25. Ali, M.H.; Talukder, M.S.U. Increasing water productivity in crop production—A synthesis. Agric. Water Manag. 2008, 95, 1201–1213. [Google Scholar] [CrossRef]
  26. Qin, S.; Li, S.; Kang, S.; Du, T.; Tong, L.; Ding, R. Can the drip irrigation under film mulch reduce crop evapotranspiration and save water under the sufficient irrigation condition? Agric. Water Manag. 2016, 177, 128–137. [Google Scholar] [CrossRef]
  27. Fang, Q.; Zhang, X.; Shao, L.; Chen, S.; Sun, H. Assessing the performance of different irrigation systems on winter wheat under limited water supply. Agric. Water Manag. 2018, 196, 133–143. [Google Scholar] [CrossRef]
  28. Sakellariou-Makrantonaki, M.; Papanikolaou, C. Water Saving by Using Modern Irrigation Methods. In Proceedings of the International Conference on Agricultural Engineering, Hersonissos, Greece, 23–25 June 2008. [Google Scholar]
  29. Camp, C.R. Subsurface drip irrigation: A review. Trans. ASAE 1998, 41, 1353–1367. [Google Scholar] [CrossRef]
  30. Ayars, J.E.; Fulton, A.; Taylor, B. Subsurface drip irrigation in california—Here to stay? Agric. Water Manag. 2015, 157, 39–47. [Google Scholar] [CrossRef]
  31. Colaizzi, P.D.; Lamm, F.R.; Howell, T.A.; Evett, S.R. Crop production comparison under various irrigation systems. In Proceedings of the Central Plains Irrigation Conference, Colby, KS, USA, 21–22 February 2006; Thompson, N., Ed.; pp. 189–207. [Google Scholar]
  32. Irmak, S.; Djaman, K.; Rudnick, D.R. Effect of full and limited irrigation amount and frequency on subsurface drip-irrigated maize evapotranspiration, yield, water use efficiency and yield response factors. Irrig. Sci. 2016, 34, 271–286. [Google Scholar] [CrossRef]
  33. Evett, S.R.; Colaizzi, P.D.; Howell, T.A. Drip and evaporation. In Proceedings of the Central Plains Irrigation Conference, Sterling, CO, USA, 16–17 February 2005; pp. 33–39. [Google Scholar]
  34. Gao, X.; Huo, Z.; Xu, X.; Qu, Z.; Huang, G.; Tang, P.; Bai, Y. Shallow groundwater plays an important role in enhancing irrigation water productivity in an arid area: The perspective from a regional agricultural hydrology simulation. Agric. Water Manag. 2018, 208, 43–58. [Google Scholar] [CrossRef]
  35. Salvador, R.; Martínez-Cob, A.; Cavero, J.; Playán, E. Seasonal on-farm irrigation performance in the EBRO basin (Spain): Crops and irrigation systems. Agric. Water Manag. 2011, 98, 577–587. [Google Scholar] [CrossRef]
  36. Kandelous, M.M.; Šimůnek, J. Comparison of numerical, analytical, and empirical models to estimate wetting patterns for surface and subsurface drip irrigation. Irrig. Sci. 2010, 28, 435–444. [Google Scholar] [CrossRef] [Green Version]
  37. Hagenau, J.; Meissner, R.; Borg, H. Effect of exposure on the water balance of two identical lysimeters. J. Hydrol. 2015, 520, 69–74. [Google Scholar] [CrossRef]
  38. Sun, S.; Zhang, C.; Li, X.; Zhou, T.; Wang, Y.; Wu, P.; Cai, H. Sensitivity of crop water productivity to the variation of agricultural and climatic factors: A study of Hetao irrigation district, china. J. Clean. Prod. 2017, 142, 2562–2569. [Google Scholar] [CrossRef]
  39. Abolpour, B. Realistic evaluation of crop water productivity for sustainable farming of wheat in Kamin Region, Fars province, Iran. Agric. Water Manag. 2018, 195, 94–103. [Google Scholar] [CrossRef]
  40. Monaco, F.; Sali, G. How water amounts and management options drive irrigation water productivity of rice. A multivariate analysis based on field experiment data. Agric. Water Manag. 2018, 195, 47–57. [Google Scholar] [CrossRef]
  41. Meshkat, M.; Warner, C.R.; Workman, R.S. Evaporation reduction potential in an undisturbed soil irrigated with surface drip and sand tube irrigation. Trans. ASAE 2000, 43, 79–86. [Google Scholar] [CrossRef]
  42. Lamm, F.R.; Manges, H.L.; Stone, L.R.; Khan, A.H.; Rogers, D.H. Water requirement of subsurface drip-irrigated corn in Northwest Kansas. Trans. ASAE 1995, 38, 441–448. [Google Scholar] [CrossRef]
  43. Allen, R.G. Using the fao-56 dual crop coefficient method over an irrigated region as part of an evapotranspiration intercomparison study. J. Hydrol. 2000, 229, 27–41. [Google Scholar] [CrossRef]
  44. Kang, S.; Gu, B.; Du, T.; Zhang, J. Crop coefficient and ratio of transpiration to evapotranspiration of winter wheat and maize in a semi-humid region. Agric. Water Manag. 2003, 59, 239–254. [Google Scholar] [CrossRef]
  45. Shukla, S.; Shrestha, N.K.; Jaber, F.H.; Srivastava, S.; Obreza, T.A.; Boman, B.J. Evapotranspiration and crop coefficient for watermelon grown under plastic mulched conditions in sub-tropical Florida. Agric. Water Manag. 2014, 132, 1–9. [Google Scholar] [CrossRef]
  46. El-Rahman, G.A. Water use efficiency of wheat under drip irrigation systems at Al-Maghara Area, North Sinai, Egypt. Am.-Eurasian J. Agric. Environ. Sci. 2009, 5, 664–670. [Google Scholar]
  47. Dagustu, N. Genetic analysis of grain yield per spike and some agronomic traits in Diallel crosses of bread wheat (Triticum aestivum L.). Turk. J. Agric. For. 2008, 32, 249–258. [Google Scholar]
  48. Gulmezoglu, N.; Alpu, O.; Ozer, E. Comparative performance of triticale and wheat grains by using path analysis. Bulg. J. Agric. Sci. 2010, 16, 443–453. [Google Scholar]
  49. Sinha, I.; Buttar, G.S.; Brar, A.S. Drip irrigation and fertigation improve economics, water and energy productivity of spring sunflower (Helianthus annuus L.) in Indian Punjab. Agric. Water Manag. 2017, 185, 58–64. [Google Scholar] [CrossRef]
  50. Yang, J.C.; Zhang, J.H.; Wang, Z.Q.; Zhu, Q.S.; Liu, L.J. Involvement of abscisic acid and cytokinins in the senescence and remobilization of carbon reserves in wheat subjected to water stress during grain filling. Plant Cell Environ. 2003, 26, 1621–1631. [Google Scholar] [CrossRef]
  51. Farooq, M.; Wahid, A.; Kobayashi, N.; Fujita, D.; Basra, S.M.A. Plant drought stress: Effects, mechanisms and management. Agron. Sustain. Dev. 2009, 29, 185–212. [Google Scholar] [CrossRef]
  52. Tyagi, N.K.; Sharma, D.K.; Luthra, S.K. Evapotranspiration and crop coefficients of wheat and sorghum. J. Irrig. Drain. Eng. 2000, 126, 215–222. [Google Scholar] [CrossRef]
  53. Bandyopadhyay, P.K.; Mallick, S. Actual evapotranspiration and crop coefficients of wheat (Triticum aestivum) under varying moisture levels of humid tropical canal command area. Agric. Water Manag. 2003, 59, 33–47. [Google Scholar] [CrossRef]
  54. Abdelkhalek, A.A.; Darwesh, R.K.; El-Mansoury, M.A.M. Response of some wheat varieties to irrigation and nitrogen fertilization using ammonia gas in north Nile delta region. Ann. Agric. Sci. 2015, 60, 245–256. [Google Scholar] [CrossRef]
  55. Makino, A. Photosynthesis, grain yield, and nitrogen utilization in rice and wheat. Plant Physiol. 2011, 155, 125–129. [Google Scholar] [CrossRef] [PubMed]
  56. Koyro, H.; Hussain, T.; Huchzermeyer, B.; Khan, M.A. Photosynthetic and growth responses of a perennial halophytic grass panicum Turgidum to increasing NACL concentrations. Environ. Exp. Bot. 2013, 91, 22–29. [Google Scholar] [CrossRef]
  57. Asrar, H.; Hussain, T.; Hadi, S.M.S.; Gul, B.; Nielsen, B.L.; Khan, M.A. Salinity induced changes in light harvesting and carbon assimilating complexes of Desmostachya bipinnata (L.) staph. Environ. Exp. Bot. 2017, 135, 86–95. [Google Scholar] [CrossRef]
  58. Flexas, J.; Carriquí, M.; Nadal, M. Gas exchange and hydraulics during drought in crops: Who drives whom? J. Exp. Bot. 2018, 69, 3791–3795. [Google Scholar] [CrossRef]
  59. Wungrampha, S.; Joshi, R.; Singla-Pareek, S.L.; Pareek, A. Photosynthesis and salinity: Are these mutually exclusive? Photosynthetica 2018, 56, 366–381. [Google Scholar] [CrossRef]
  60. Nadal, M.; Flexas, J. Chapter 17—mesophyll conductance to co2diffusion:Effects of drought and opportunities for improvement. In Water Scarcity and Sustainable Agriculture in Semiarid Environment; García Tejero, I.F., Durán Zuazo, V.H., Eds.; Academic Press: New York, NY, USA, 2018; pp. 403–438. [Google Scholar]
  61. Ellsworth, P.Z.; Cousins, A.B. Carbon isotopes and water use efficiency in C4 plants. Curr. Opin. Plant Biol. 2016, 31, 155–161. [Google Scholar] [CrossRef] [PubMed] [Green Version]
  62. Reich, D.; Godin, R.; Chávez, J.L.; Broner, I. Subsurface Drip Irrigation (SDI); Colorado State University Extension: Fort Collins, CO, USA, 2014. [Google Scholar]
  63. Lamm, F.R. In Ksu results from twenty nine years of irrigation and fertigation studies using SDI. In Proceedings of the 30th Annual Central Plains Irrigation Conference, Colby, KS, USA, 20–21 February 2018. [Google Scholar]
Figure 1. Variation of groundwater table depth, evapotranspiration, and rainfall at the Luancheng Agroecosystem Experimental Station (LAES-CAS) in the North China Plain (2007–2017).
Sustainability 11 02978 g001
Figure 2. Schematic descriptions of the experimental device. (a) Isometric view of lysimeters (plant seed location); (b) Lysimeter wall treated with glue and sand; (c) Weighing structure and platform for lysimeters; (d) Germinated wheat plant in lysimeters; (e) Grass pot set up on lysimeters platform; (f) Grass pots around lysimeters to control microclimate.
Sustainability 11 02978 g002
Figure 3. Irrigation amount and timing under different irrigation treatments.
Sustainability 11 02978 g003
Figure 4. Rainfall during the wheat growth period.
Sustainability 11 02978 g004
Figure 5. Temporal trends in evapotranspiration (ET) during the wheat growth period under different irrigation methods along rainfall events.
Sustainability 11 02978 g005
Figure 6. CO2/H2O gas exchange and chlorophyll estimation under flood, surface, and subsurface drip irrigation during (20 May 2018). Pn (net photosynthetic rate), Gs (stomatal conductance), Ci (intercellular carbon dioxide concentration), E (transpiration), WUEi (intrinsic water use efficiency), and SPAD (relative chlorophyll content).
Sustainability 11 02978 g006
Table 1. Yield components, grain yield, and aboveground biomass.
TreatmentsAPH (cm)TNPAEL
(cm)
SSNTSNTSW (g)SW (g)TGW (g)TNG1000 GW
(g)
Y
(Kg/ha)
B
(kg/ha)
Flood55.05 a110 a5.96 NS106 a1524 NS155.9 NS84.4 a118.0 a3806.0 a32.4 a4694.8 a9610.8 NS
Surface53.60 b107 b5.95 NS101 a1510 NS146.0 NS78.8 a110.7 b3449.8 b31.8 a4428.0 b8988.8 NS
Sub-surface55.41 c117 c5.98 NS124 b1583 NS150.8 NS97.5 b114.8 c3572.0 c34.2 b4584.8 c9930.8 NS
APH (average plant height), TNP (total number of panicle), AEL (avg. ear length), SSN (sterile spikelet number), TSN (total spikelet numbers), TSW (total spike weight), SW (straw weight), TGW (total grain weight), TNG (total number of grains), GW (grain weight), Y (yield), B (biomass), NS (non-significant at the 0.05 probability level). Different letters indicate statistical significance at the 0.05 probability level within the same column.
Table 2. Water balance under different irrigation treatments.
TreatmentET (mm)I (mm)R (mm)S (mm)
Flood Irrigation (FI)300.30 a190 13625.70 a
Surface Drip Irrigation (SDI) 259.60 b15013626.40 a
Subsurface Drip Irrigation (SSDI)220.96 c12013635.04 b
Evapotranspiration (ET), irrigation (I), rainfall (R), and soil water storage (S).
Table 3. Crop and irrigation water productivity under different irrigation treatments.
TreatmentsET (mm)Water Applied
(mm)
Yield (Kg ha−1)IWPl
(kg ha−1mm−1)
CWPl
(kg ha−1mm−1)
Flood Irrigation (FI)300.303264694.8014.4015.63
Surface Drip Irrigation (SDI) 259.602864428.0015.4817.06
Subsurface Drip Irrigation (SSDI)220.962564584.8017.9120.75
Evapotranspiration (ET), irrigation water productivity (IWPl), and crop water productivity (CWPl).

