Assessment of Photovoltaic Potential of Mining Sites in Uzbekistan


Department of Energy Resources Engineering, Pukyong National University, Busan 48513, Korea
*
Author to whom correspondence should be addressed.
Sustainability 2019, 11(10), 2988; https://0-doi-org.brum.beds.ac.uk/10.3390/su11102988
Submission received: 26 April 2019
/
Revised: 22 May 2019
/
Accepted: 22 May 2019
/
Published: 26 May 2019
(This article belongs to the Section Energy Sustainability)
Abstract
:The present study analyzed the potential of eight operational mining sites in Uzbekistan for the installation of photovoltaic (PV) systems: Sarmich, Ingichka, Kuytosh, Yakhton, Chauli, Sherobod, Chorkesar, and Tebinbuloq. A PV system with 1 MW capacity, which required a total of 4926 m2 of project land, was considered. The renewable energy analysis software RETScreen, developed by Natural Resources Canada (NRC), was used to calculate energy production, greenhouse gas reduction, and financial factors of the PV systems in the selected study areas. The iron mine Tebinbuloq in Karakalpak showed the highest potential, with annual electricity production of approximately 1685 MWh, equating to a potential reduction of approximately 930 tons of greenhouse gases. The economic benefit of the PV system in this mine was $2.217 million USD net present value with a project payback period of approximately 13 years. The results of precision checks of satellite- and ground-based solar measurements showed high correlations; hence, satellite-based data can be applied for solar project assessments where solar monitoring meteorological stations are not available.
1. Introduction
Global energy consumption is predicted to more than double in the next three decades [1]. Depleting deposits of fossil fuels and environmental concerns have led governments to investigate new energy sources and support research into renewable energy to sustain economic and industrial development [2,3]. Among renewable energy sources (e.g., wind, geothermal, solar, etc.), solar power, and particularly photovoltaic (PV) systems, are considered the most environmentally friendly (in terms of sustainability) for residential, commercial, and industrial applications [4,5,6,7,8].
The mining industry is an essential industrial branch with a high energy demand; for example, copper mining is expected to consume 41.1 terawatt-hours (TWh) of energy in the near future [9]. Furthermore, mining operations have environmental consequences such as causing soil pollution, generating greenhouse gas (GHG) emissions, and polluting clean water systems; these problems require the mining sector to implement development strategies that are integrated with sustainability concerns [10,11]. Research in Australia shows that, as a result of the combination of numerous mineral processing operations (e.g., crushing, concentrating, blasting, loading, and hauling), 628.2 kg CO2 is emitted to process one metric ton of ore from copper concentrate [12].
Recently, global mining companies and international environmental protection organizations have identified solar energy implementation as a solution to address both the demand for mining sites to reduce environmental footprints and for the reshaping of post-mining sites into green energy regions [13,14]. Consequently, PV systems are installed in operational and abandoned mining sites globally. One of the top copper producing countries, Chile, designed the grid-connected 1 MW Calama Solar 3 PV power plant project near the world’s biggest open pit copper mine, Chuquicamata copper mine, to meet the electricity demands of the mine. Consequently, Chile achieved an annual reduction in GHG emissions of 1600 metric tons [15]. A 10.6 MW PV system was installed in a Western Australian copper–gold mine, Degrussa mine. At this site, mining operations were previously dependent on fossil fuel, and installation of the PV system reduced total emissions of Australia by 12,000 metric tons per year [16]. Shanta Gold, the East African gold mining company in Tanzania, deployed a 63 kWp solar power plant around New Luika gold mine in 2014. After the success of the initial step, an additional seven projects were installed in the following three years, equating to an annual CO2 reduction of 660 tons [17].
The largest solar project in Canada (SunMine) is in Kimberley, British Columbia, and is a commercial solar construction. It is built on the reclaimed site of the Sullivan Mine and consists of 4032 solar cell modules with tracking facilities [18]. Solarpark Meuro is located on an abandoned lignite mining site in Germany, and it is another example of a PV power station used in a mining operation. This system uses 636,000 solar cells to produce 166 MW of electricity [19]. Designed in partnership with First Solar and the US and Australian solar company Ingenero, a 1.7 MW solar power plant generated electricity for a bauxite mine in Weipa, which was expected to decrease annual CO2 emissions by 1600 tons [20]. In South Korea, several small-scale PV systems were designed at different post-mining points at the Ssangyong open pit limestone mine [21] and at an abandoned mine tailings dam in the Sangdong mine [22]. Furthermore, the potential for installation of PV systems at several abandoned mining districts and several operational mining sites has been analyzed for suitability and economic feasibility of solar applications [23,24,25].
Uzbekistan is a leading power-generating country in Central Asia, generating almost 59 TWh of electricity annually. However, as a consequence of fossil fuel dependency (89% of total electricity production, of which 76% is from natural gas, 7% fuel oil, and 6% coal), the country is the second largest polluter among Central Asian countries after Kazakhstan (230 million metric tons CO2 annually), producing 85.3 million tons of CO2 annually [26]. Furthermore, the energy demand of Uzbekistan is expected to increase by up to 25.5% by 2030 [27]. In order to manage increasing electricity demands, Uzbekistan has joined the International Renewable Energy Agency (IRENA) to boost renewable energy policies [28], and it has developed the strategy of energy production from renewable energy sources and reduction of the dependence on fossil fuels [29]. Recently, the findings of different studies employing various approaches showed the prospects of renewable energies in Uzbekistan: 70% of the land surface in the country (total 44.7 million ha) is suitable for installation of solar energy power plants [30]. The launch of the 100 MW grid-connected solar power plant in the Samarkand region [31] was one of the initial steps towards solar energy integration, which was followed by projection of large-scale PV power plants in Kashkadarya, Namangan, and Surkhandarya provinces [32].
Uzbekistan is rich in natural resources with more than 1800 deposits of mineral resources identified. It is a leading producer globally of copper, gold, and uranium, and many mineral deposits remain in reserves [33]. In 2017, the sector accounted for 12.7% of the total production revenue of the country, equating to 18.3 trillion soms. Recent local and international studies have investigated the potential of renewable energy generation such as using PV and concentrating solar power (CSP) systems [34,35] as well as wind power [36]. Studies of solar resource observations in the country conducted by the Asian Development Bank concluded that some provinces were more suitable for CSP, while PV system installation was preferred for others [37]. These studies provided some necessary information for primary design, financing, and operation of solar energy systems. However, to the best of our knowledge, studies analyzing renewable energy sources with a focus on the mining industry, and that can estimate the probability of energy production where mineral processing and mines are primarily located, have not yet been conducted.
The present study analyzes the feasibility of PV system installation in eight mining districts throughout Uzbekistan for the purposes of improved energy efficiency and sustainability. Geographic information system (GIS) was used to assess solar site measurements of mining sites in the study area. Annual power production, GHG emission reduction, net present value (NPV) of the plant, investment payback period, and the internal rate of return (IRR) were investigated using RETScreen software, developed by Natural Resources Canada (NRC), to facilitate estimations of the economic and energy aspects of the 1 MW capacity PV system installation.
2. Materials and Methods
2.1. Study Area
Uzbekistan covers an area of 447,400 km2 of mixed relief and geographical terrain, and it consists of 12 provinces and the Karakalpak Republic. Days of sunshine are estimated at >300 d annually, and the average temperature in July is 32 °C. The mineral resources of the country include metallic ores such as copper, zinc, lead, tungsten, and molybdenum; precious metals such as uranium, gold and silver; and large fossil fuel reserves [38]. Electricity generation is approximately 52.7 TWh annually from a total of 38 power plants (10 thermal and 28 hydropower plants). The energy sector is primarily dependent on fossil fuels—85% of power stations use natural gas, 11% fuel oil, 4% coal, and renewable energy generates <1% of total energy production. The solar energy source by global horizontal irradiation (GHI) is estimated at an average of 1700–2000 W/m2/year, which makes Uzbekistan one of the top potential countries for solar power generation in Central Asia [37]. However, because of the scarcity of data and regional limitations of large-scale exploitation of solar energy in some regions [32,34,37], a map showing an overall assessment of solar energy potentials in mining districts has not yet been considered by the scientific community. This study developed a map of mining districts in Uzbekistan, highlighting the most promising locations for potential PV system investments regarding metallic and valuable mineral mines.
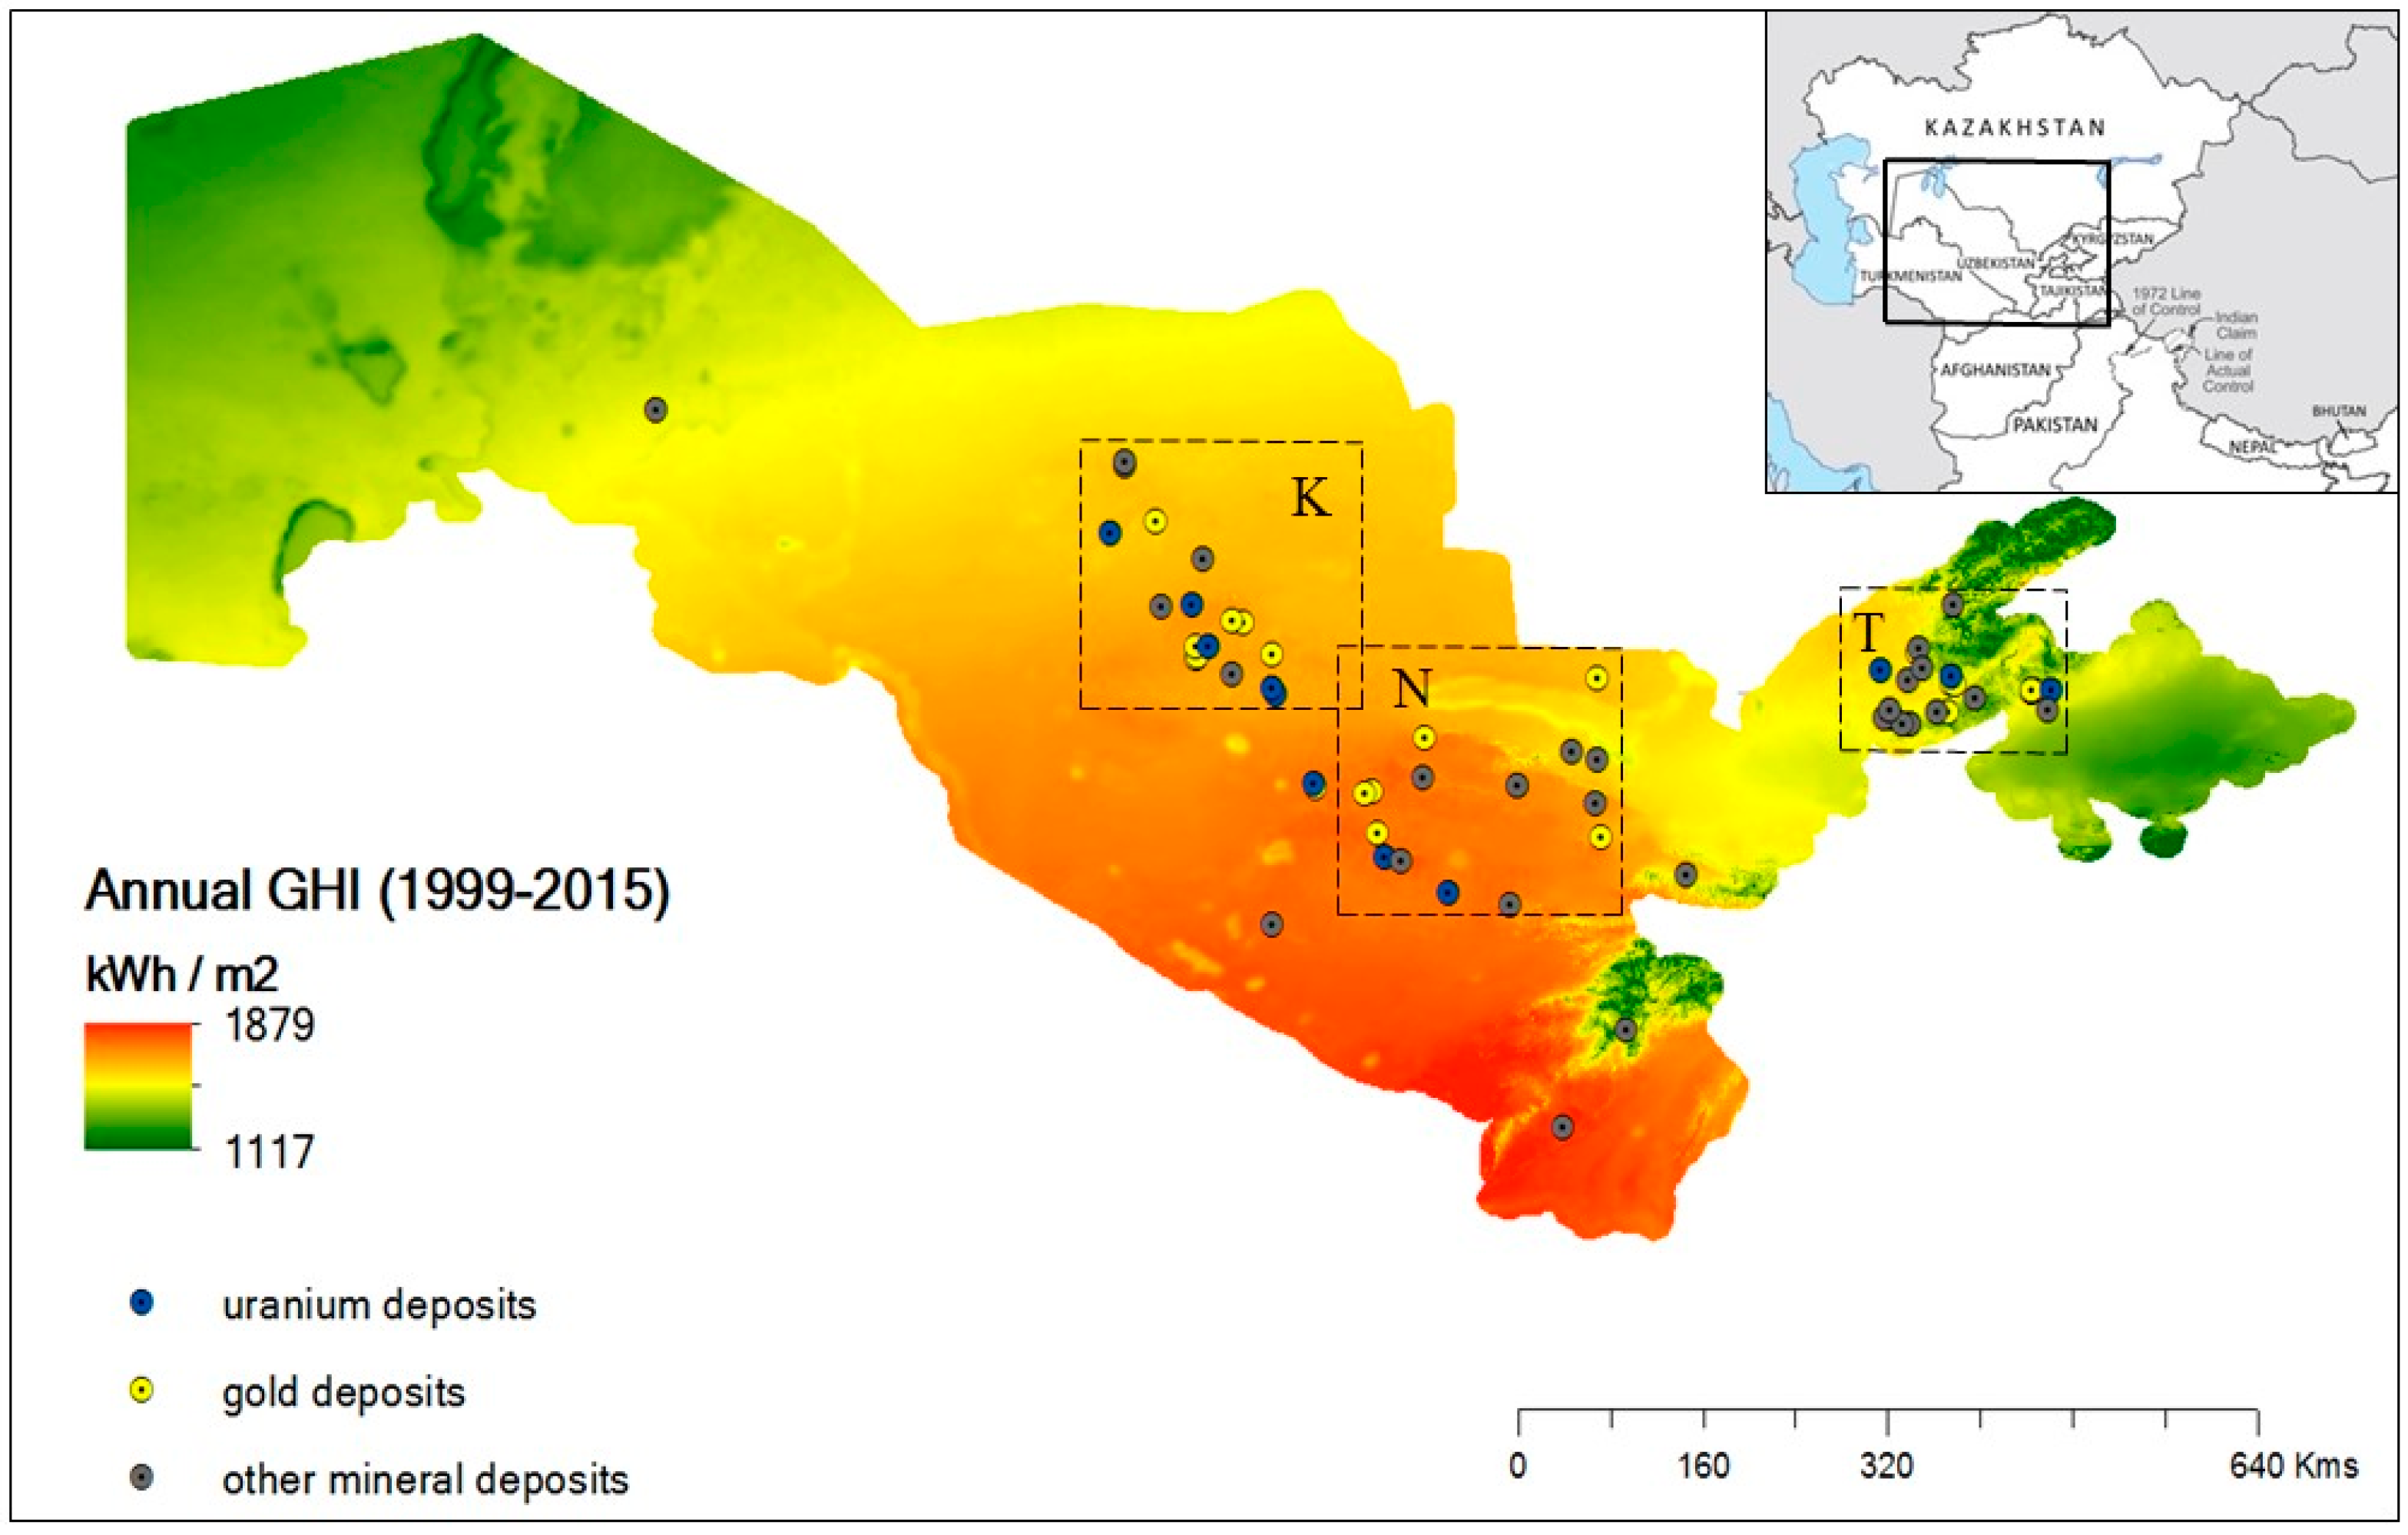
Regions of existing mining operations were divided into three major provinces: Kizilkum district, Nurota district, and near Tashkent deposits (Figure 1). The mineral processing industry is managed by two government-owned mining companies: Navoi Mining Metallurgical State Company (Navoi GMK) [39] (in Kizilkum and partly eastern Nurota district) and Almalyk Mining Metallurgical Combine Joint Stock Company (Almalyk GMK) [40] (mainly near Tashkent deposits and partly western Nurota district). Almalyk GMK is the only copper producer in the country; mineral deposits near Tashkent contain more than 170 types of minerals. In addition to copper, lead/zinc/barite ores are also mined and processed in this region. Gold and uranium are extracted mainly by Navoi GMK (share of 80%) with total control of 13 gold deposits [33].
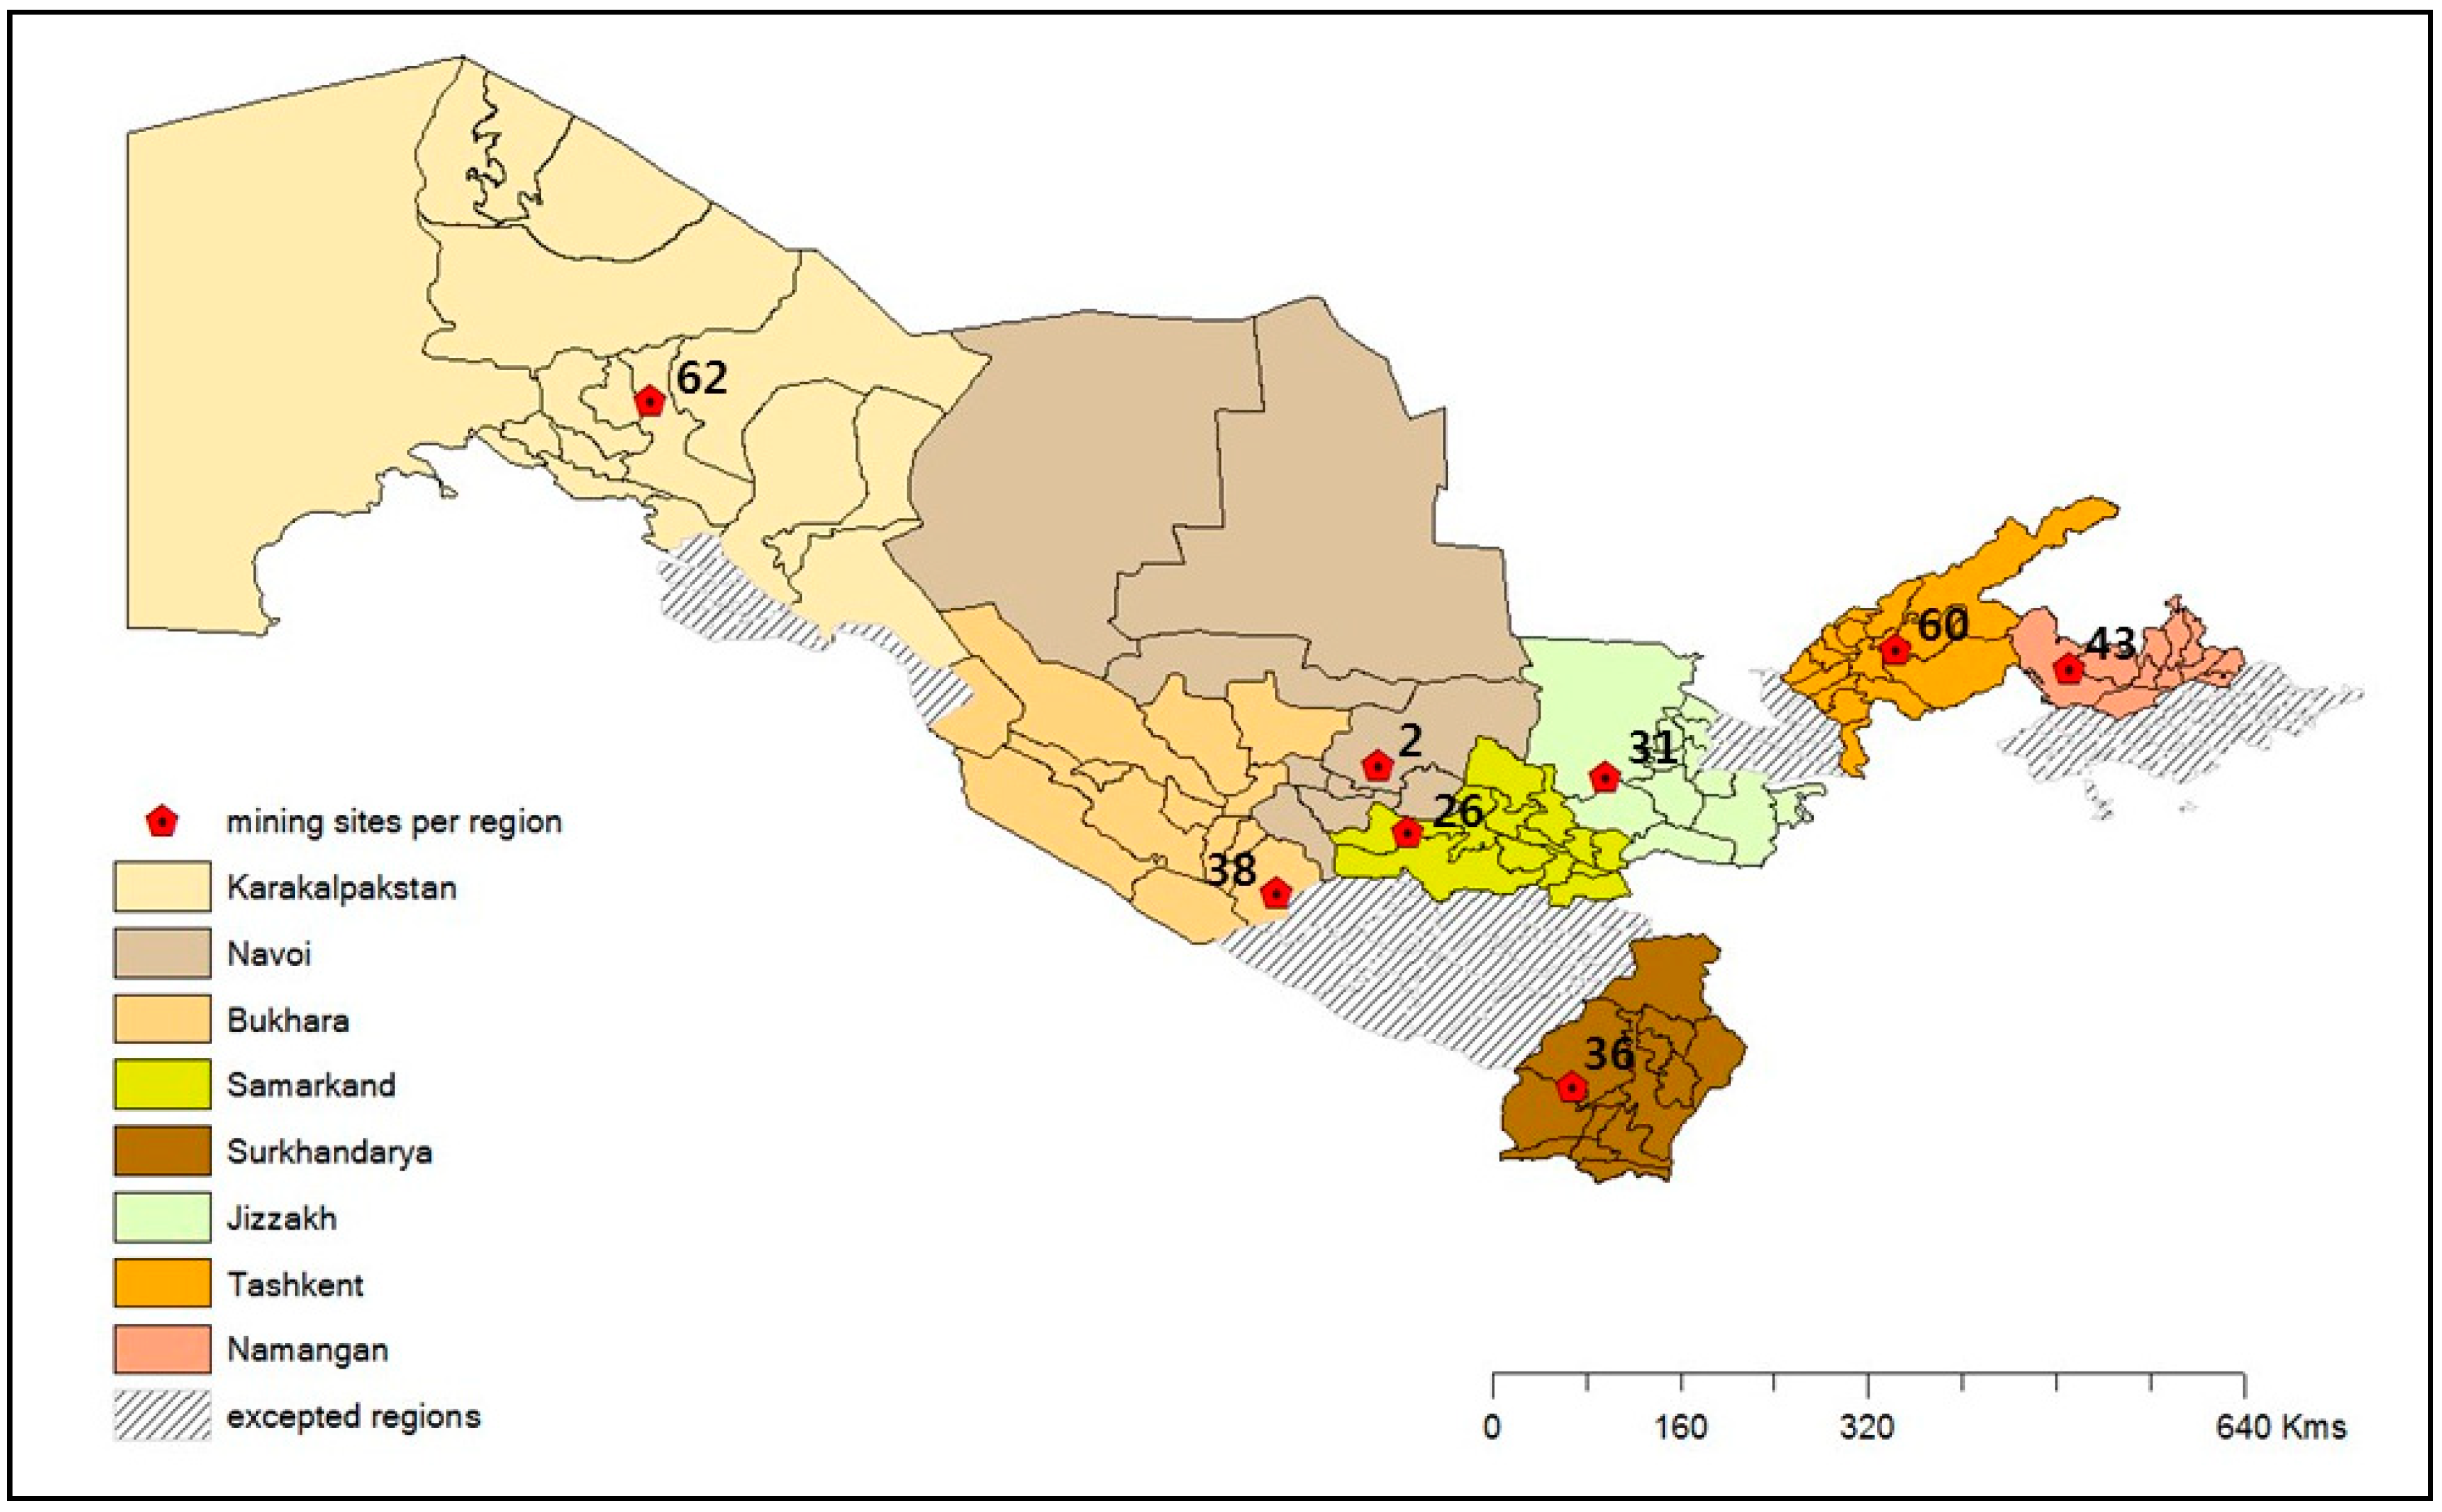
A total of 63 metal and precious mineral mining sites were considered in this study, including 23 gold, 11 uranium, 4 copper, and 20 other mineral deposits. To identify approximate meteorological conditions for each mining site, Figure 1 shows a solar resource map with a spatial resolution of 30.0 arc-seconds created by SOLARGIS [41]. Since the mining industry spread throughout the country hierarchically, eight provinces were identified for this study: Tashkent, Namangan, Jizzakh, Navoi, Samarkand, Bukhara, Surkhandarya, and Karakalpak. The majority of these sites were in remote areas (i.e., distant from grid connections and urban centers).
The highest potential mining site per province was identified according to satellite-based solar radiation values (Table 1). Since the mining site Tebinbuloq is the only area in Karakalpakstan where mining of precious minerals is available, it was considered as the study site for subsequent analysis. Selected study sites per region are shown in Figure 2.
2.2. Data Collection
Solar potential assessments were conducted by analyses of meteorological data collected at eight mining sites in Uzbekistan. Meteorological data consisting of total long-term annual averages of GHI (kWh/m2) between 1999 and 2015 were analyzed. The amount of solar radiation data received at the surface, horizontal to the ground and with a resolution of 30.0 arc-seconds, was obtained from the Global Solar Atlas for the solar resource assessment and mapping contract between the World Bank Group [41]. Temperature observation data derived from satellite databases were also utilized during analyses (Table 1).
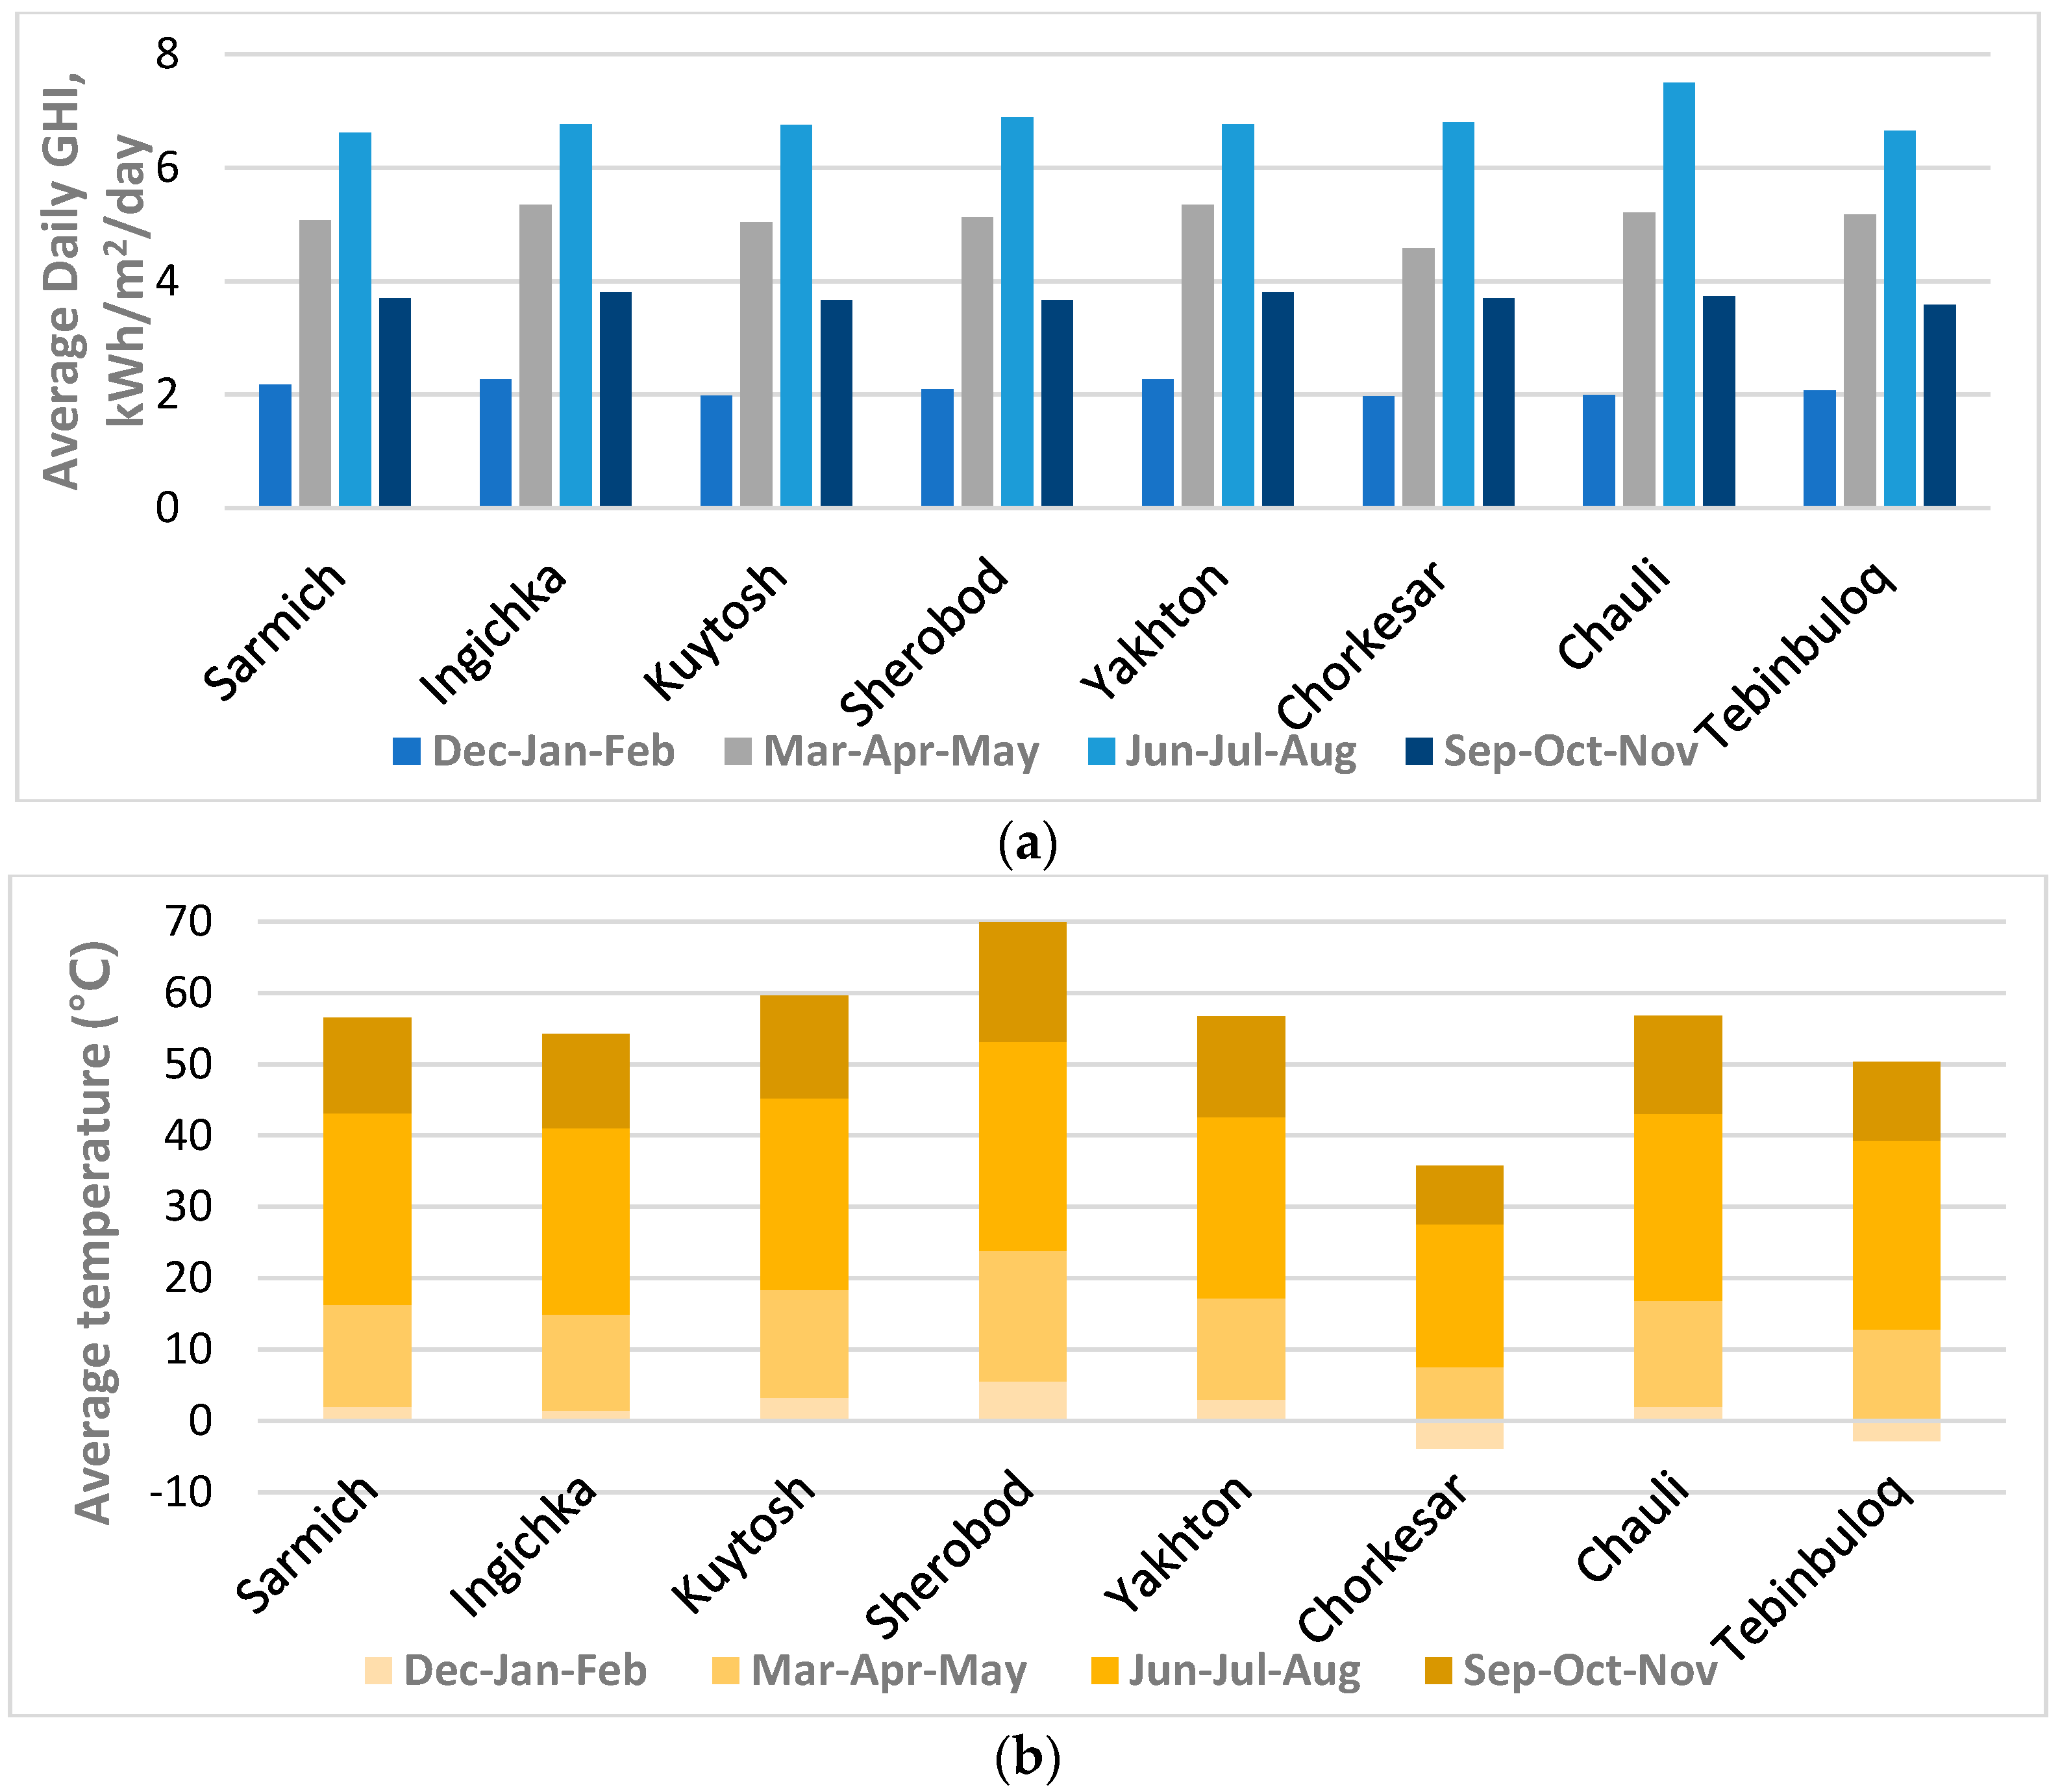
The average daily horizontal solar radiation ranged from 4.33 to 4.55 kWh/m2/day; the Ingichka deposit in Samarkand and the Yakhton mine in Bukhara province showed the highest solar radiation, while the lowest was identified in the northeast of the country at the Chorkesar mine. The annual mean temperature was the highest in the Surkhandarya region and the lowest in the Namangan area.
Figure 3 shows that daily irradiance was the highest in summer and spring months, ranging from approximately 5 to 7.5 kWh/m2 day, and the temperature was the highest during June to September in the selected study sites. GHI was highest in the area of the Chauli mine, which was located in the northwest part of the country; however, solar energy measurements were performed at a central meteorological station using the most accurate technologies.
2.3. System Design
Installation of PV systems (1 MW capacity) was considered at each site. As the renewable energy certificates (REC) policy is not yet applied in Uzbekistan, certification weights were not included in estimations. To analyze system parameters, up-to-date cost of natural gas (1000 sum/m3) and electricity (370 sum/kWh) reported by Uzbekenergo Joint Stock Company of Uzbekistan were applied [42], and they were used in calculations of annual power production and GHG emissions, which were exchanged into USD by the conversion ratio provided by the National Bank of Uzbekistan [43].
A fixed facility system was installed with a 40° slope, and the azimuth was set to the south. A 4926 m2 area was required to install the proposed PV system. The parameters of the PV system and inverter are given in Table 2.
RETScreen software tool, developed by Natural Resources Canada (NRC), was used to conduct power production, emissions, and economic analyses of the PV system installation. Previous studies used RETScreen to evaluate power production analyses in potential mining districts of South Korea [24]. The PV system was designed as an off-grid system to support the energy needs of a mining site.
2.4. Assessments
The formulas used for the system analysis in RETScreen tool are explained for a better understanding of the assessment concept and process flow of analysis. The algorithm of electricity generation estimation is expressed in the following equation:
Here, stands for the total power generated by the system, is the amount of all-sky solar radiation received by solar unit per hour (kWh/m2/h), is the surface area of the solar panel (in this case 1.157 m2), is the efficiency of solar module conversion (which is between 0–1), is the efficiency of the inverter module, means the temperature coefficient of the PV module, means the average temperature of the solar cell (°C), and and represent loss coefficients due to dirt, rain, or snow for the solar module and inverter, respectively [44]. The information shown in Table 1 and Table 2 was used in estimations by applying Equation (1).
RETScreen software follows emissions against Kyoto Protocol regulations. Analysis of GHG emission was conducted to compare the emission outputs before and after the PV system was applied. The amount of reduced GHG emission per year was estimated with a comparison equation of the baseline and proposed case system conditions as follows:
In Equation (2), is the reduction of greenhouse gas per year (tons CO2/year), is the GHG emission factor of each country, and is the electricity lost in transmission and distribution (T&D) for the proposed system. A GHG emission factor, in the case of an electricity production system that used conventional technologies for all types of fuel for solar and wind projects in Uzbekistan, was proposed at an estimated 0.551 metric tons CO2/MWh by the Asian Development Bank [45], and this value was used in this study. In addition, the average transmission and distribution loss rate of Uzbekistan was reported as 8.83% and was used for analysis in this study [46].
The capacity factor of the solar projects was measured as a percentage according to the total produced energy by the plant compared to its energy generation at full capacity (the typical capacity factor for PV systems ranges from 5% to 20%).
The NPV (USD) of the project was calculated as the mean financial factor by applying the following formula:
where N is the system operating period (y), is the yearly revenue from the electricity sales (USD), is the operating cost of the system per year, is the social discount rate, and refers to the initial installation costs of the PV system. Plant lifetime was determined at 30 y according to the National Renewable Energy Laboratory (NREL) proposal [47]. For the economic assessments of the PV system installation, the installation cost of fixed-tilt PV systems ($1.85/kW) and annual operation and management costs for PV systems ($9.92/kW/year) proposed by the International Energy Agency were applied [48]. The inflation rate of Uzbekistan in 2018 of approximately 14% [49] and the average social discount rate of developing countries of 10% [50] were also applied. From previous renewable projects, the government share was 30%, and 70% of project funds were covered by debts [37].
The IRR is the cash flow discount rate that causes the NPV of the project to equal zero, which was calculated from Equation 1 as zero. The payback period is the number of years taken for the revenue cash flow to equal the total investment, and it can be identified by calculating in Equation (3).
3. Results
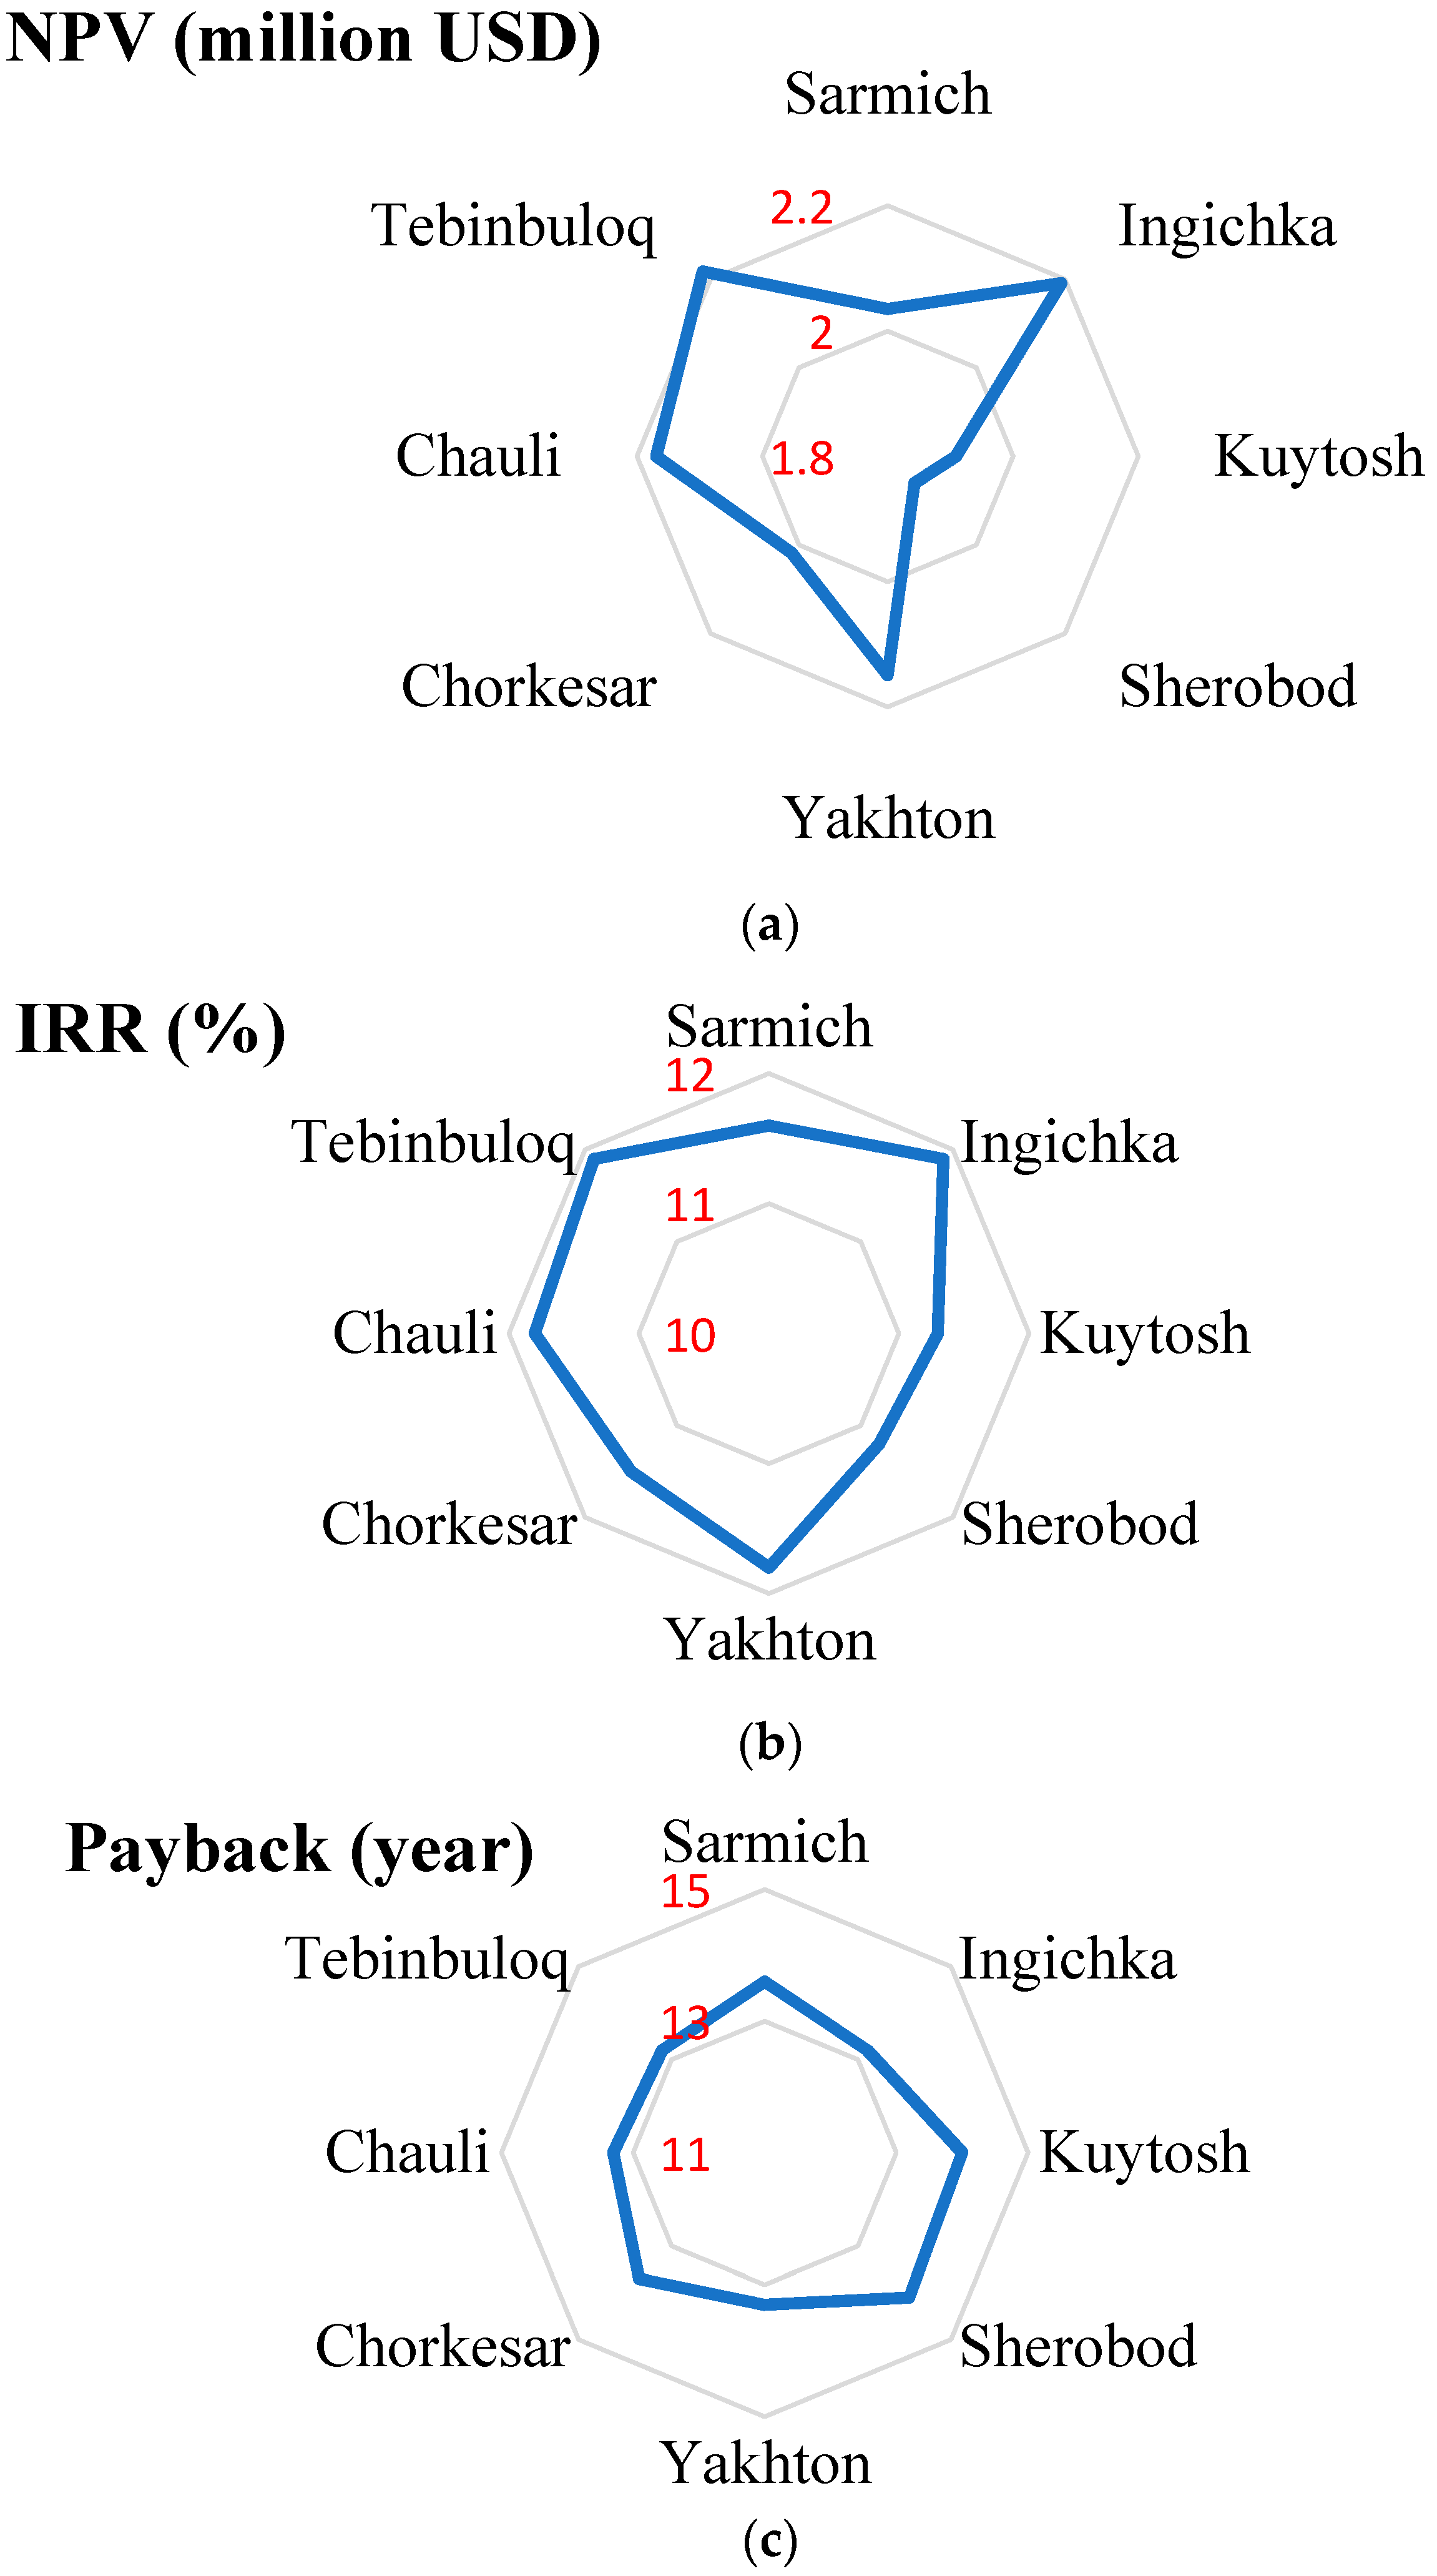
The financial feasibility indicators of the 1 MW PV system installations in the eight selected mining sites in different provinces are shown in Figure 4, and energy generation and GHG emission reduction results of the RETScreen assessments are presented in Table 3.
The capacity factor of the solar plant in the Tebinbuloq mining site was the highest in this study, and this site also had the highest annual electricity generation among the eight studied areas. The 1 MW PV system installation at the site of the Tebinbuloq steel deposit in Karakalpak was capable of producing 1685 MWh of electricity annually, which would consequently reduce CO2 emissions by 928.5 metric tons and was equivalent to saving 398,955 L of gasoline. The second highest production was identified in the Samarkand province at the Ingichka volframus mine, which had annual reductions of approximately 1676 MWh energy and 923.3 metric tons CO2 emissions. Moreover, both mining sites showed identical IRR (11.9%) and project payback periods (13.2 years), while the NPV values were similar at 2.217 million USD for the Tebinbuloq mining site and 2.191 million USD for the Ingichka volframus mine.
Although relatively high annual average temperatures and daily irradiances were recorded in the Sherobod deposit of the Surkhandarya province, the results showed that production and other assessment elements of project feasibility were the lowest.
Tebinbuloq is the largest iron ore deposit in Uzbekistan, with an annual capability of steel production estimated at 1.5 million tons, which satisfies the annual steel consumption of Uzbekistan [51]. The project of “Construction of a mining and metallurgical complex based on the Tebinbuloq deposit” is currently in the project investment phase, and launch of the complex operation is expected to commence in 2024 [52].
The average revenue of electricity export from the PV system installed in the Tebinbuloq site was calculated at more than 84,000 USD. In addition, the infrastructure of this mineral deposit was highly suitable for a PV system because it had the shortest distance (2 km) to the transmission line among the eight studied sites, a water reservoir was available for water supply, and it was close to the highway (within 5 km).
Overall, the results showed between 13.2 and 14.1 y project payback period for the 1 MW PV system with capacity factors between 18.4% and 19.2% as well as IRR values between 11.2% and 11.9%.
4. Discussion
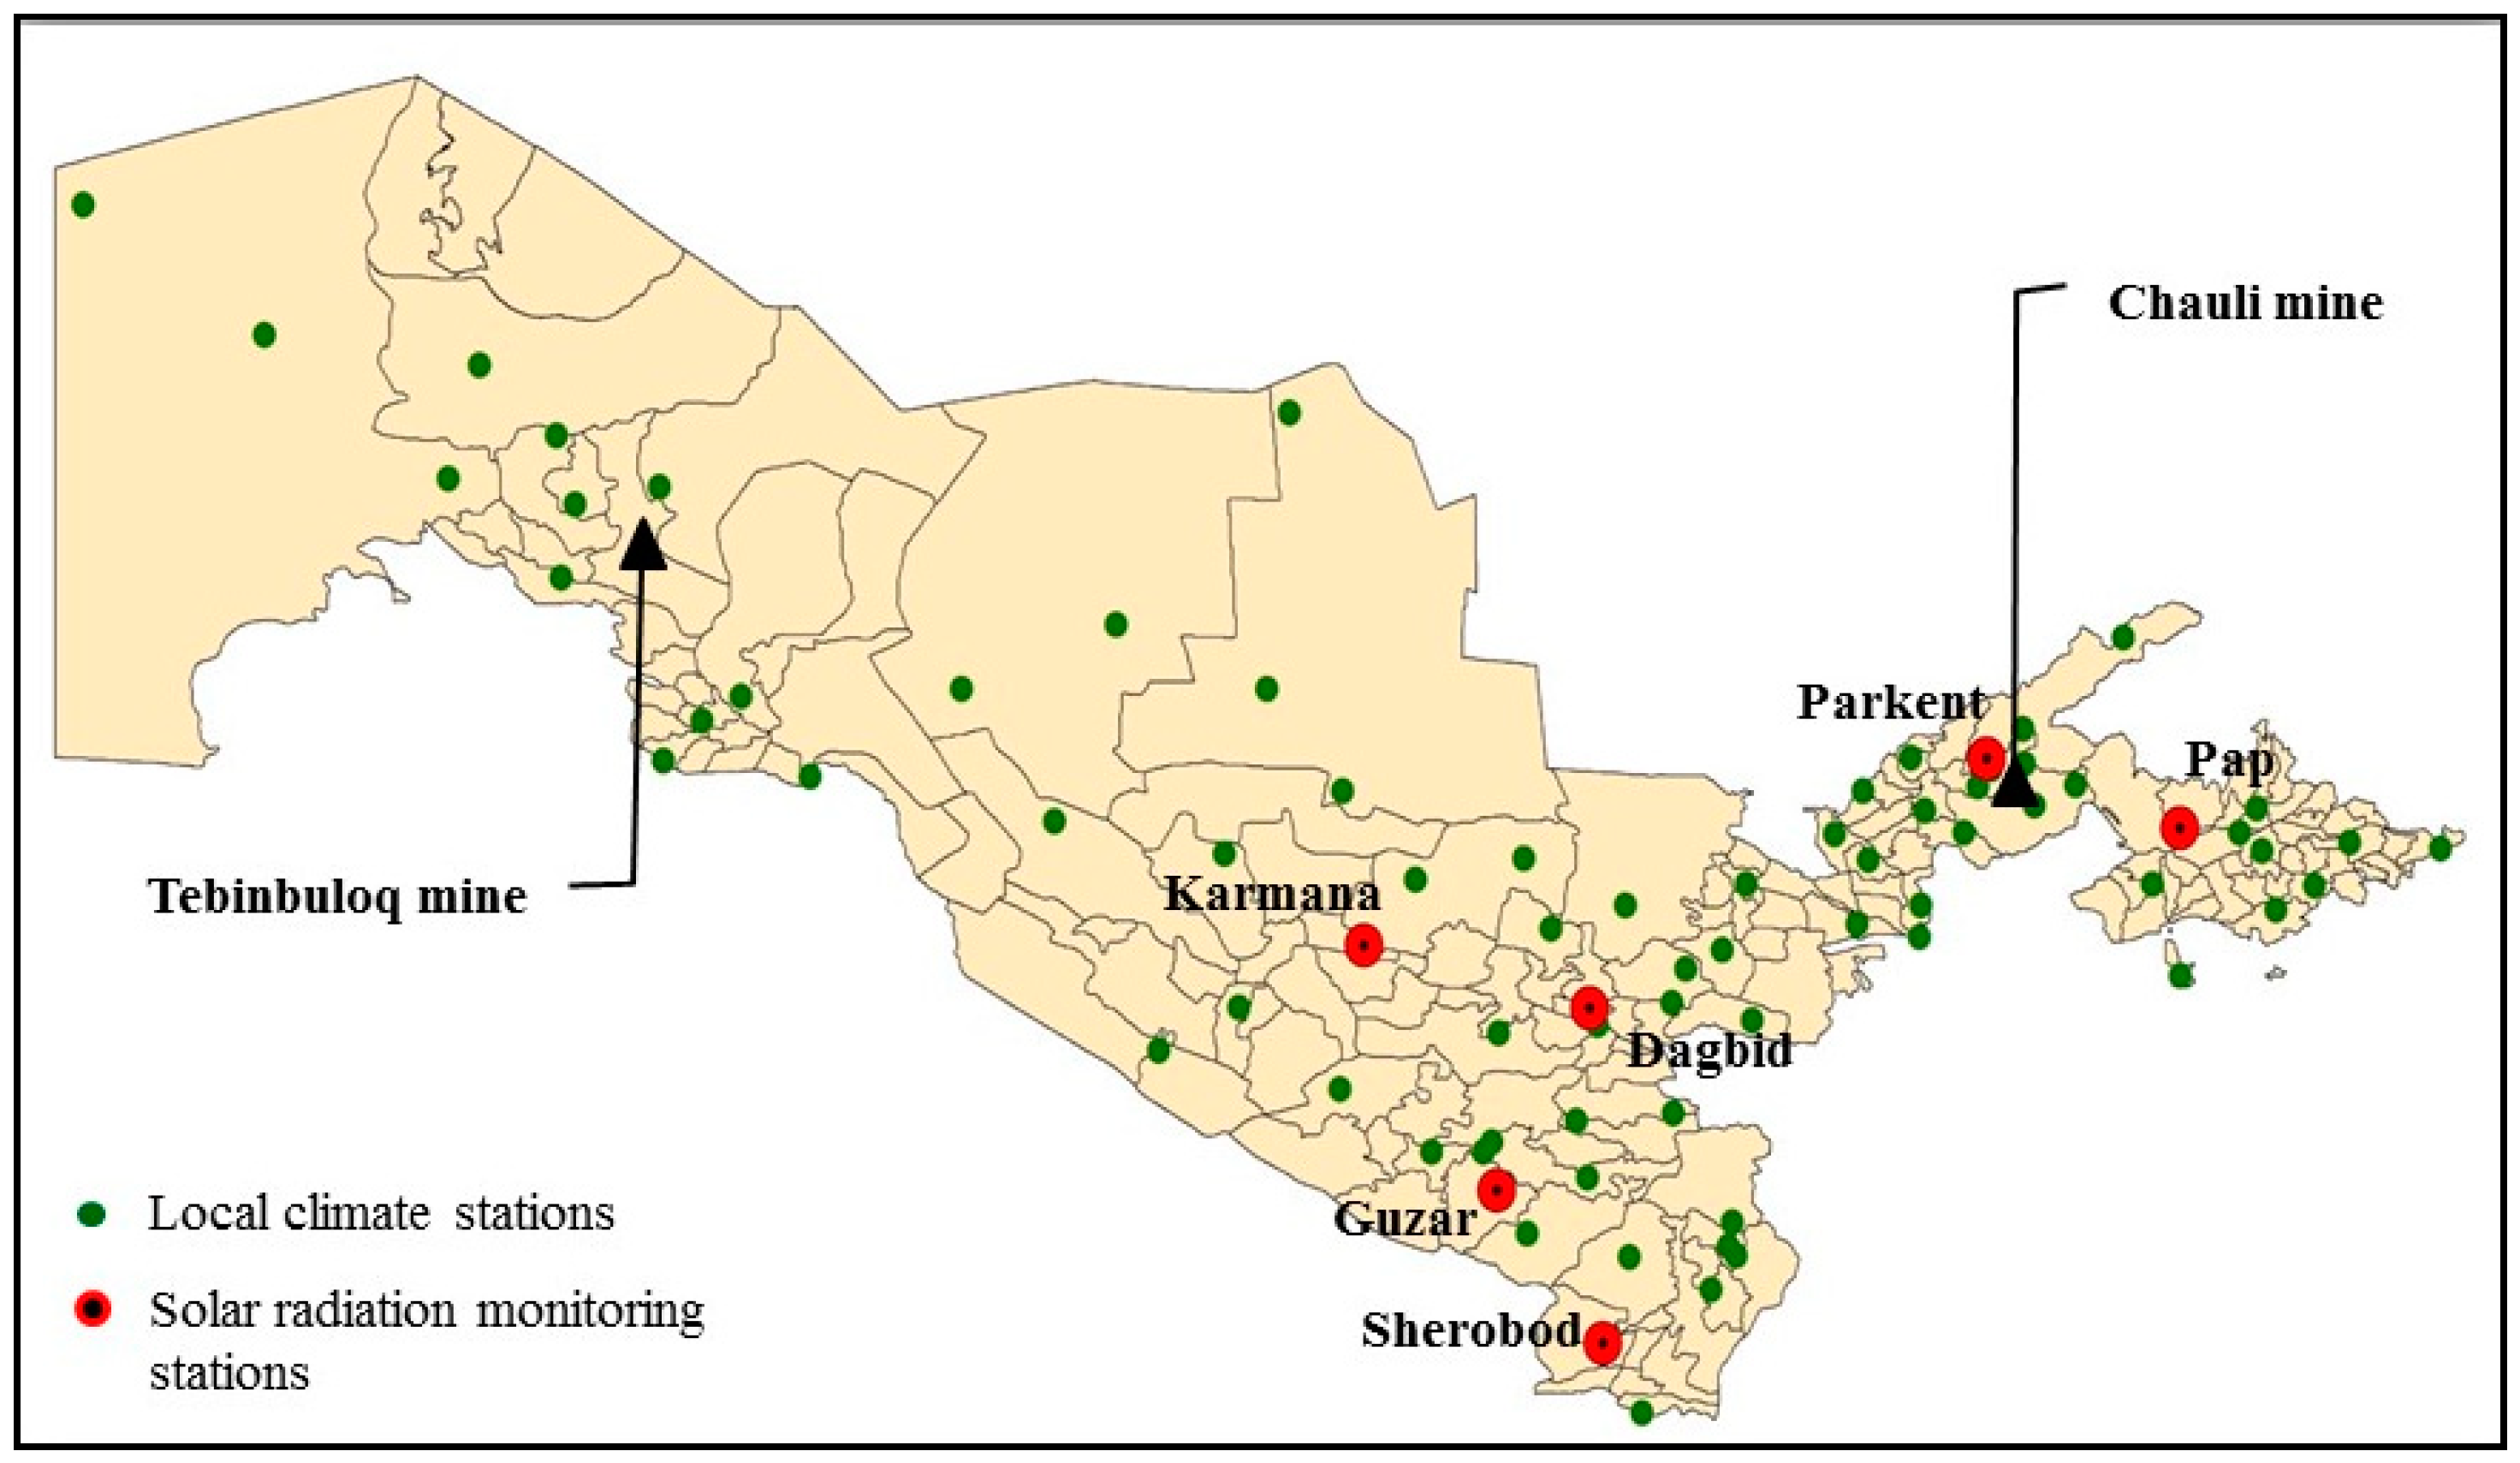
Currently, only six sites have solar measurements available from meteorological stations in Uzbekistan: Solar Village Tashkent, Karmana, Dagbit, Pap, Sherobod, and Guzar [37] (Figure 5). Among the eight mining districts considered for PV system feasibility analysis in this study, no solar measurement data currently exists for Bukhara, Jizzakh, and Karakalpak provinces. The types of sensors deployed for solar irradiance measurements in solar assessments from existing weather stations and their characteristics are listed in Table 4. The duration of solar irradiance in these solar measurement stations is measured daily and collected in monthly and yearly meteorological books for statistical use [53].
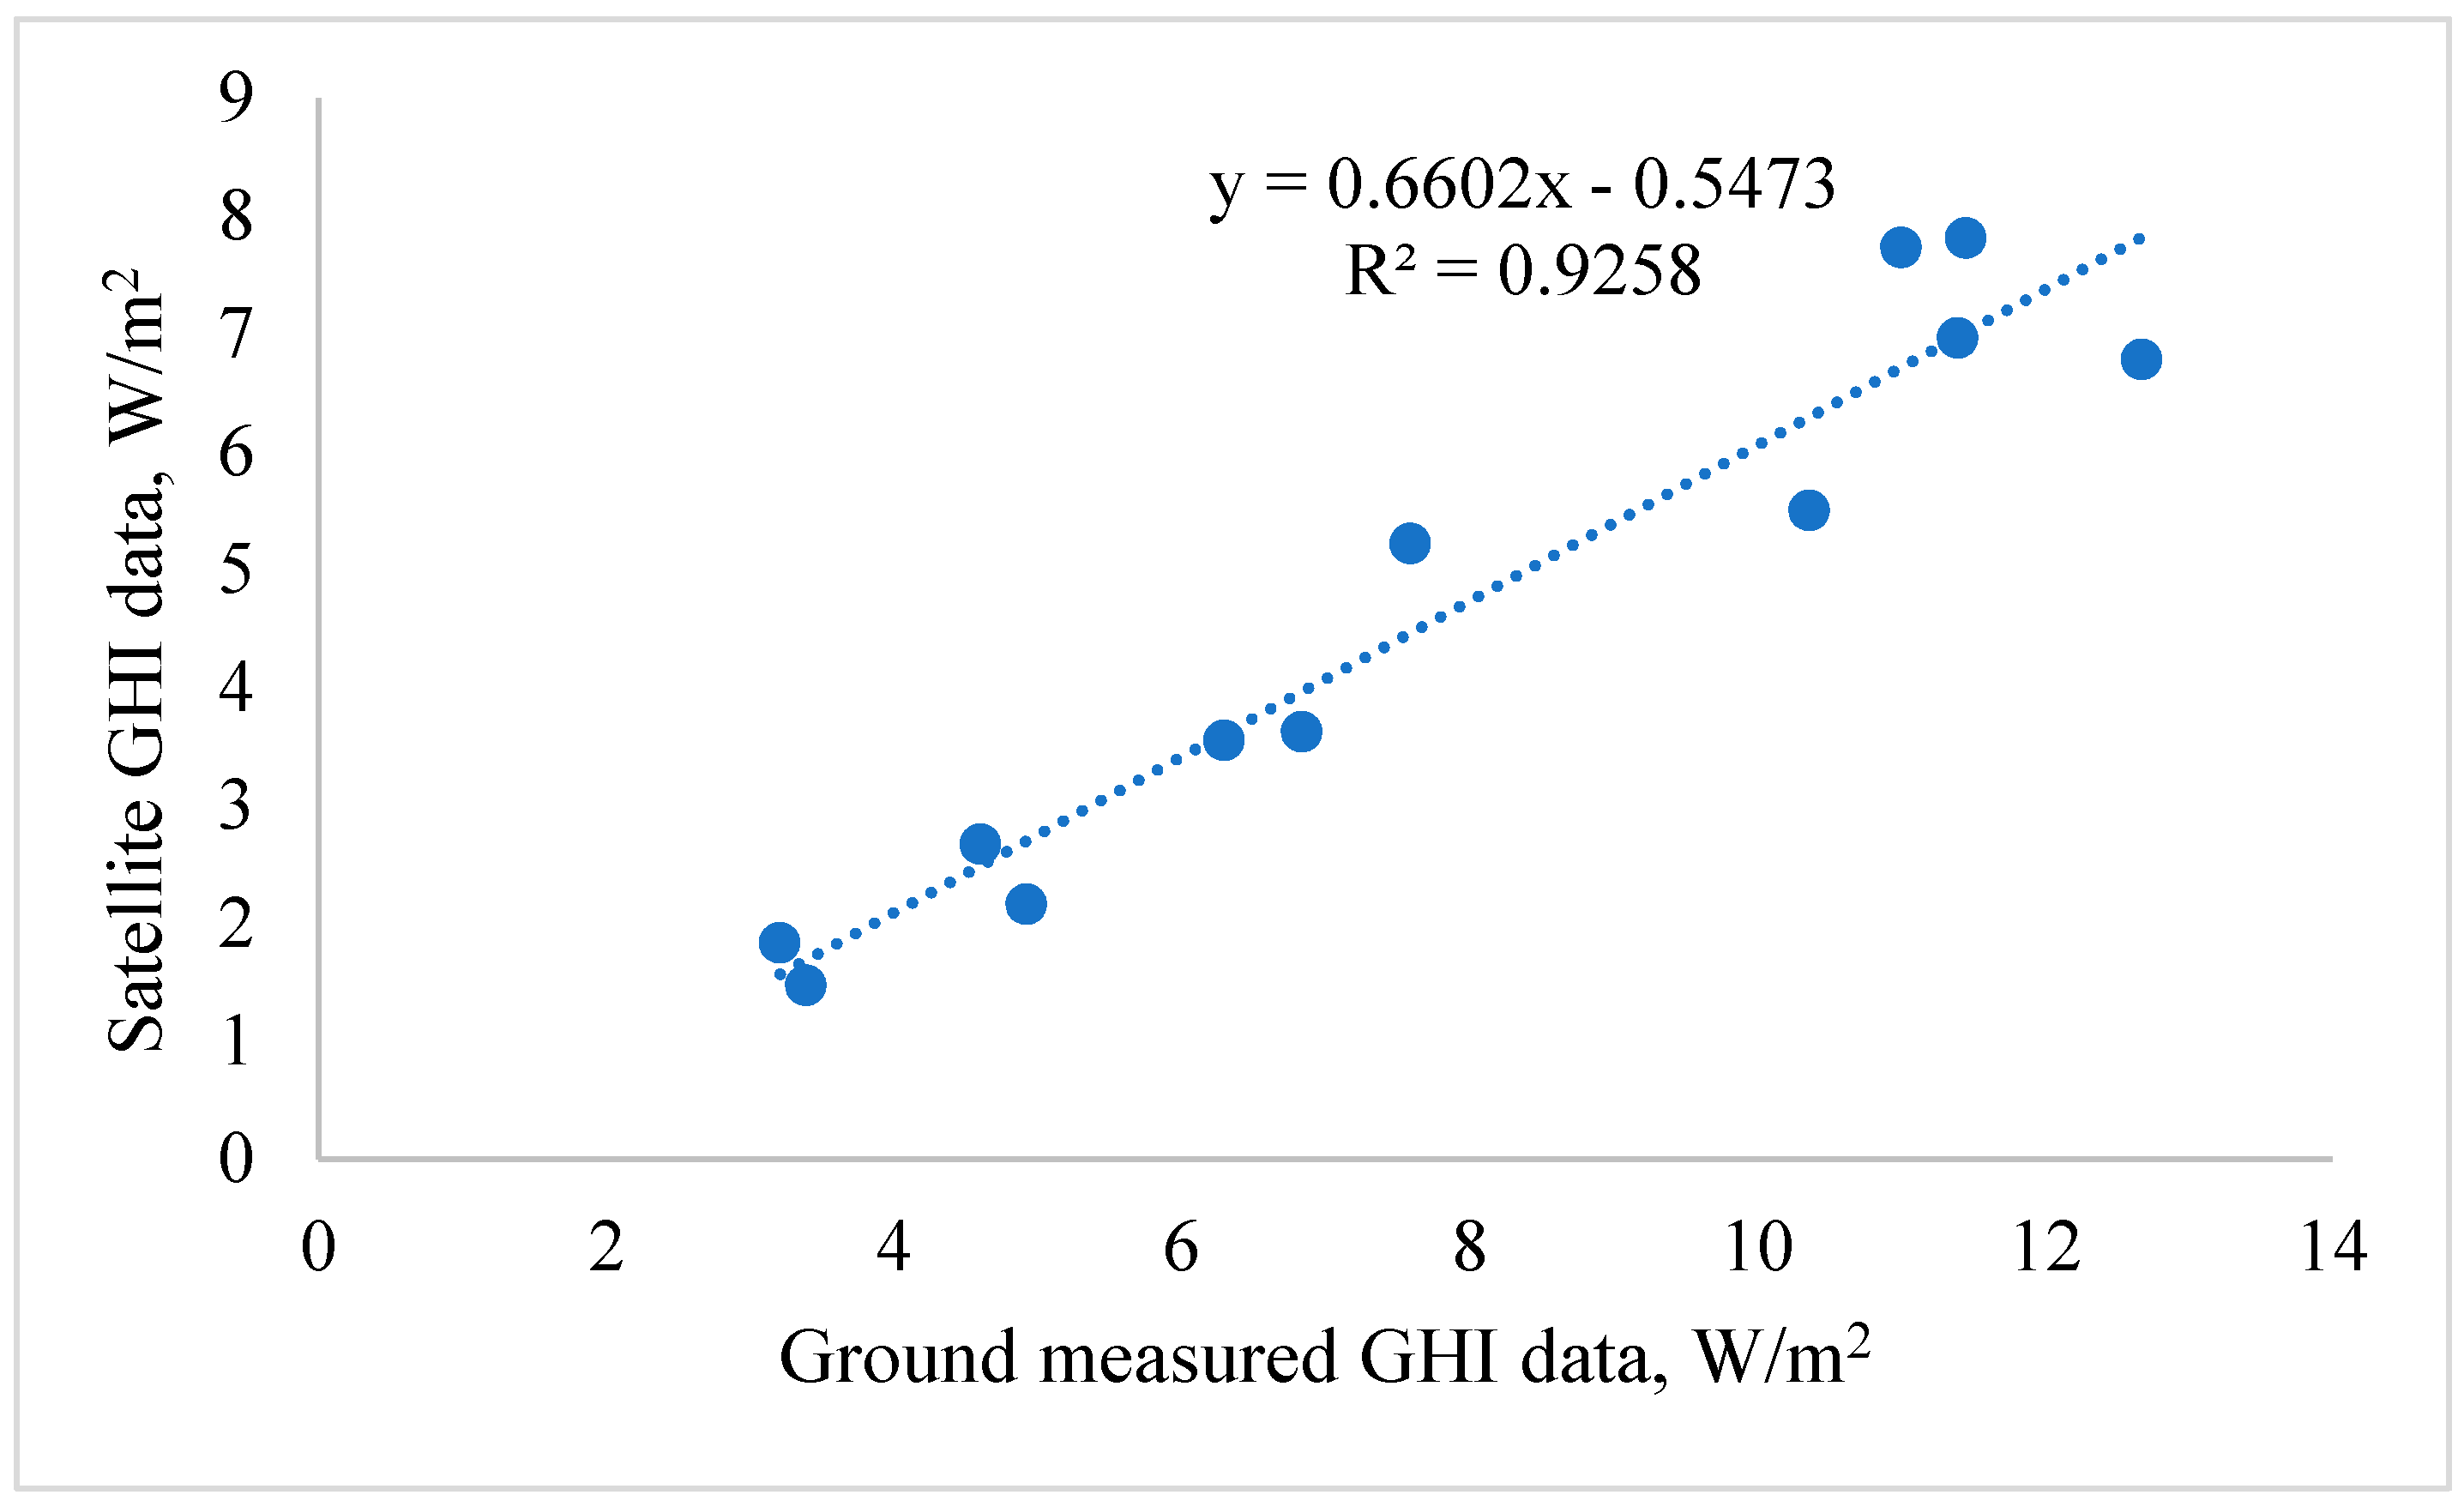
Analysis showed that the GHI at the Chauli mine site in the Tashkent region was higher than other study areas, despite the fact that the site was located in a region with relatively low solar irradiance. Taking into account that Tebinbuloq mine was located in an area where ground measurements for solar radiance were not conducted, the Chauli mine, which was located close to the solar measurements, was selected. Therefore, ground-based measurement data from the Tashkent-Yuzni meteorological station in Tashkent, and satellite-based solar data used in previous analytical processes for the same site, were compared to assess precision and accuracy (Figure 6).
From the current situation in Uzbekistan, solar energy feasibility assessments based on ground measurements are valid only at some sites, which limits further solar project feasibility analyses in other areas. Figure 6 shows that correlation between the two sets of solar measurement data (ground-based and satellite-based records of GHI) is highly accurate; hence, satellite-based measurements can be considered in solar project analysis studies where ground measurements are not applicable or cannot be obtained.
5. Conclusions
This study focused on the installation of fixed-tilt PV systems (1 MW) at eight mining sites in Uzbekistan and estimating annual power production, GHG emission reductions, and financial aspects. Power production ranged from 1555 to 1685 MW/m2 per year, with the highest recorded at the Tebinbuloq mining site and the lowest production at the Sherobod mine. The IRR and payback period at Tebinbuloq and Ingichka were identical (11.9% and 13.2 y, respectively), while the Tebinbuloq mining site, which is the largest iron ore deposit in the country and is located in Karakalpak autonomous Republic of Uzbekistan, was the most promising site for PV system installations.
Despite the highly suitable geographical location of countries in Central Asia for solar energy harvesting, there are a few limitations in solar project feasibility analyses because climate data collection is scarce. Data are available only at six meteorological stations throughout Uzbekistan. Most areas can be assessed for solar project potential only by using remotely measured data as a typical approach, which was investigated in this study. Since this study covers only the initial calculation of the PV system projects, i.e., without considering land suitability and green energy revenues from the renewable energy certificates (REC), a more accurate analysis is required prior to final decisions being made. However, the accuracy of satellite-based measurements is highly suitable for further deployment in solar projects where ground-based measurements are unreliable.
Author Contributions
Y.C. conceived and designed the experiments; M.M. collected data and performed the experiments; M.M. and Y.C. analyzed the data; Y.C. contributed reagents/materials/analysis tools; M.M. and Y.C. wrote the paper.
Funding
This work was supported by Basic Science Research Program through the National Research Foundation of Korea (NRF) funded by the Ministry of Education (2018R1D1A1A09083947).
Conflicts of Interest
The authors declare no conflict of interest.
References
- Alamdari, P.; Nematollahi, O.; Alemrajabi, A.A. Solar energy potentials in Iran: A review. Renew. Sustain. Energy Rev. 2013, 21, 778–788. [Google Scholar] [CrossRef]
- Nematollahi, O.; Kim, K.C. A feasibility study of solar energy in South Korea. Renew. Sustain. Energy Rev. 2017, 77, 566–579. [Google Scholar] [CrossRef]
- Bonanno, F.; Capizzi, G.; Sciuto, G.L.; Napoli, C.; Pappalardo, G.; Tramontana, E. A novel cloud-distributed toolbox for optimal energy dispatch management from renewables in IGSs by using WRNN predictors and GPU parallel solutions. In Proceedings of the 2014 International Symposium on Power Electronics, Electrical Drives, Automation and Motion, Ischia, Italy, 18–20 June 2014; pp. 1077–1084. [Google Scholar]
- Bakhiyi, B.; Labrèche, F.; Zayed, J. The photovoltaic industry on the path to a sustainable future - Environmental and occupational health issues. Environ. Intern. 2014, 73, 224–234. [Google Scholar] [CrossRef] [PubMed]
- Merrouni, A.A.; Mezrhab, A.; Mezrhab, A. PV sites suitability analysis in the Eastern region of Morocco. Sustain. Energy Technol. Assess. 2016, 18, 6–15. [Google Scholar] [CrossRef]
- Borgogno Mondino, E.; Fabrizio, E.; Chiabrando, R. Site selection of large ground-mounted photovoltaic plants: A GIS decision support system and an application to Italy. Int. J. Green Energy 2015, 12, 515–525. [Google Scholar] [CrossRef]
- Bonanno, F.; Capizzi, G.; Sciuto, G. Lo A neuro wavelet-based approach for short-term load forecasting in integrated generation systems. In Proceedings of the 2013 International Conference on Clean Electrical Power (ICCEP), Alghero, Italy, 11–13 June 2013; pp. 772–776. [Google Scholar]
- Lo Sciuto, G. Air pollution effects on the intensity of received signal in 3G/4G mobile terminal. Int. J. Energy Environ. Eng. 2019, 10, 1–9. [Google Scholar] [CrossRef]
- Jeswiet, J.; Szekeres, A. Energy Consumption in Mining Comminution. Procedia. CIRP 2016, 48, 140–145. [Google Scholar] [CrossRef] [Green Version]
- Peralta, S.; Sasmito, A.P.; Kumral, M. Reliability effect on energy consumption and greenhouse gas emissions of mining hauling fleet towards sustainable mining. J. Sustain. Min. 2016, 15, 85–94. [Google Scholar] [CrossRef] [Green Version]
- Norgate, T.; Haque, N. The greenhouse gas impact of IPCC and ore-sorting technologies. Miner. Eng. 2013, 42, 13–21. [Google Scholar] [CrossRef]
- Norgate, T.; Haque, N. Energy and greenhouse gas impacts of mining and mineral processing operations. J. Clean. Prod. 2010, 18, 266–274. [Google Scholar] [CrossRef]
- Wirth, P.; Mali, B.Č.; Fischer, W. Post-Mining Regions in Central Europe; Digital Print Group: Nurnberg, Germany, 2012; ISBN 9783865812940. [Google Scholar]
- Choi, Y.; Song, J. Sustainable development of abandoned mine areas using renewable energy systems: A case study of the photovoltaic potential assessment at the tailings dam of abandoned Sangdong mine, Korea. Sustainability 2016, 8, 1320. [Google Scholar] [CrossRef]
- Chile’s First Solar-Powered Industrial Plant Opens in the Atacama. This Is Chile. Available online: https://www.thisischile.cl/chiles-first-solar-powered-industrial-plant-opens-in-the-atacama/?lang=en (accessed on 25 April 2019).
- Solar Power Project-Degrussa. Available online: http://www.sandfire.com.au/operations/degrussa/solar-power-project.html (accessed on 20 April 2019).
- Shanta Gold: An Innovative Mining Company Ready to Make Bigger Impact. Available online: https://www.redaviasolar.com (accessed on 25 April 2019).
- SunMine. City of Kimberley, BC. Available online: http://www.sunmine.ca/about.html (accessed on 25 April 2019).
- Choi, Y. Utilization of Renewable Energy Technology in the Mining Industry. Korea Res. Eng. Soc. 2013, 50, 422–429. [Google Scholar] [CrossRef]
- First Solar, Ingenero Develop Diesel-PV Hybrid Project for Rio Tinto in Australia–pv Magazine International. Available online: https://www.pv-magazine.com/2014/05/22/first-solar-ingenero-develop-diesel-pv-hybrid-project-for-rio-tinto-in-australia_100015157/#axzz3AxLU3CPD (accessed on 25 April 2019).
- Choi, Y.; Song, J. Review of photovoltaic and wind power systems utilized in the mining industry. Renew. Sustain. Energy Rev. 2017, 75, 1386–1391. [Google Scholar] [CrossRef]
- Song, J.; Choi, Y. Analysis of the potential for use of floating photovoltaic systems on mine pit lakes: Case study at the Ssangyong open-pit limestone mine in Korea. Energies 2016, 9, 102. [Google Scholar] [CrossRef]
- Song, J.; Choi, Y.; Jang, M.; Yoon, S. A Comparison of Wind Power and Photovoltaic Potentials at Yeongok, Mulno and Booyoung Abandoned Mines in Kangwon Province, Korea. J. Korean Soc. Miner. Energy Resour. Eng. 2014, 51, 525–536. [Google Scholar] [CrossRef]
- Song, J.; Choi, Y.; Yoon, S.H. Analysis of photovoltaic potential at abandoned mine promotion districts in Korea. Geosyst. Eng. 2015, 18, 168–172. [Google Scholar] [CrossRef]
- Choi, Y.; Song, J. Assessment of Photovoltaic Potentials at Abandoned Mine Reclamation Sites in Korea using Renewable Energy Resource Maps. N. Renew. Energy 2016, 12, 44. [Google Scholar] [CrossRef]
- International Energy Agency. World Energy Statistics 2018; OECD Publishing: Paris, France, 2018. [Google Scholar] [CrossRef]
- NBU Energy Demand of Uzbekistan Boosts 25,5 Percent in 2030. Available online: https://nbu.uz/news/ozbekistonda-2030-yilgacha-energiya-resurslariga-talab-25-5-foizga-osadi/ (accessed on 25 April 2019).
- Kuwait, Sri Lanka, Sudan, and Uzbekistan Join IRENA. Available online: https://www.irena.org/newsroom/articles/2009/Jun/Kuwait-Sri-Lanka-Sudan-and-Uzbekistan-join-IRENA (accessed on 25 April 2019).
- Rakhimov, E.Y.; Sadullaeva, S.E.; Kolomiets, Y.G.; Tashmatov, K.K.; Usmonov, N.O. Analysis of the solar energy potential of the Republic of Uzbekistan. Appl. Sol. Energy 2018, 53, 344–346. [Google Scholar] [CrossRef]
- Sharipov, O. The Main Directions of Developing Renewable Energy Sources in Uzbekistan. Available online: http://www.inogate.org/documents/6 Otabek Sharipov ENGLISH.pdf (accessed on 23 January 2019).
- Uzbekistan: Samarkand Solar Power Project Asian Development Bank. Available online: https://www.adb.org/projects/45120-003/main (accessed on 25 April 2019).
- Tiangco, C. Update on Solar Development in Uzbekistan. In Proceedings of the 2015 8th Meeting of the Asia Solar Energy Forum, Mandaluyong, Philippines, 15 June 2015. [Google Scholar]
- The Mineral Industry of Uzbekistan. Available online: https://www.usgs.gov/centers/nmic/europe-and-central-eurasia#uz (accessed on 20 April 2019).
- Abdullaev, D.A.; Isaev, R.I. Resources of solar radiation and wind energies in Uzbekistan and system of their combined utilization. ISESCO Sci. Technol. Vis. 2005, 1, 76–82. [Google Scholar]
- State Committee of the Republic of Uzbekistan: Alternative Energy Sources of Uzbekistan. Available online: https://www.stat.uz/ru/ofitsialnaya-statistika/investitsii-i-stroitelstvo/statisticheskie-tablitsy/439-byulleteni-ru/2819-ispolzovanie-alternativnykh-istochnikov-energii-v-uzbekistane (accessed on 25 April 2019).
- Servert, J.; Tiangco, C.; López, A.; De Loizaga, I.; Castella, D.; Pérez, R. Roadmap for solar energy development in Uzbekistan. Energy Procedia 2013, 49, 1906–1915. [Google Scholar] [CrossRef]
- Bank, A.D. Solar Energy Development Roadmap; ASIAN DEVELOPMENT BANK UZB TA 8008 Republic of Uzbekistan: Manila, Philippines, 2014. [Google Scholar]
- Uzbekistan Geography History Britannica.com. Available online: https://www.britannica.com/place/Uzbekistan (accessed on 25 April 2019).
- Navoi Mining & Metallurgical Combinat. Available online: https://www.ngmk.uz/en/about/about (accessed on 25 April 2019).
- JSC Almalyk MMC. Available online: http://agmk.uz/index.php/en/ (accessed on 25 April 2019).
- Global Solar Atlas-Downloads. Available online: https://globalsolaratlas.info/downloads/uzbekistan (accessed on 25 April 2019).
- UZBEKENERGO: Tariffs Electric Power. Available online: https://www.uzbekenergo.uz/uz/activities/tariffs-electric-power/ (accessed on 23 April 2019).
- NBU | National Bank of Uzbekistan. Available online: https://nbu.uz/ (accessed on 25 April 2019).
- RETScreen. Clean Energy Project Analysis: RETScreen Engineering and Cases Textbook; Natural Resources Canada: Ottawa, ON, Canada, 2015; ISBN 0662391918.
- Asian Development Bank. Guidelines for Estimating Greenhouse Gas Emissions of Asian Development Bank Projects Additional Guidance for Clean Energy Projects; Asian Development Bank: Mandaluyong, Philippines, 2017. [Google Scholar] [CrossRef]
- Uzbekistan Transmission and Distribution Losses Percent. Available online: https://tradingeconomics.com/uzbekistan/transmission-and-distribution-losses-percent-wb-data.html (accessed on 12 April 2019).
- Fu, R.; Feldman, D.; Margolis, R.; Woodhouse, M.; Ardani, K.U.S. Solar Photovoltaic System Cost Benchmark: Q1 2017; National Renewable Energy Laboratory: Colorado, CO, USA, 2009.
- Tidball, R.; Bluestein, J.; Rodriguez, N.; Knoke, S. Cost and Performance Assumptions for Modeling Electricity Generation Technologies; National Renewable Energy Laboratory: Colorado, CO, USA, 2010.
- Uzbekistan Inflation Rate 2019 Data Chart Calendar Forecast News. Available online: https://tradingeconomics.com/uzbekistan/inflation-cpi (accessed on 25 April 2019).
- Zhuang, J.; Liang, Z.; Lin, T.; De Guzman, F. Theory and Practice in the Choice of Social Discount Rate for Cost-Benefit Analysis: A Survey; Asian Development Bank: Mandaluyong, Philippines, 2007; ISSN 16555252. [Google Scholar]
- Dmitriev, A.N.; Mukhitdinov, Y.S.; Rakhimov, V.R.; Sitdikov, F.G. Pyrometallurgical Technology for Processing Titanomagnetites from the Tebinbulak Deposit. Metallurgist 2005, 49, 41–43. [Google Scholar] [CrossRef]
- President Approves Measures for Building Mining and Metallurgical Complex Based on the Tebinbulak Deposit. Available online: https://www.uzdaily.uz/en/post/42346 (accessed on 25 April 2019).
- Merkushkin, A. Observational hydrometeorological network in Uzbekistan: Status, data acquisition and control. JMA/WMO Workshop Qual. Manag. Surf Clim. Up. Air Obs. RA II 2010, 7, 175–184. [Google Scholar]
Figure 1.
The annual solar map of Uzbekistan and three mineral deposit provinces with mining sites by mineral types; K—Kizilkum district, N—Nurota district, and T—near Tashkent deposits.
Figure 1.
The annual solar map of Uzbekistan and three mineral deposit provinces with mining sites by mineral types; K—Kizilkum district, N—Nurota district, and T—near Tashkent deposits.

Figure 2.
Provinces in Uzbekistan. Numbers show the selected mining sites per region.

Figure 3.
(a) Average daily irradiance; and (b) average temperatures of selected mining sites in Uzbekistan.
Figure 3.
(a) Average daily irradiance; and (b) average temperatures of selected mining sites in Uzbekistan.

Figure 4.
Financial feasibility factors of the photovoltaic (PV) systems analyzed at the study areas: (a) net present value (NPV), (b) internal rate of return (IRR), and (c) the project payback period.
Figure 4.
Financial feasibility factors of the photovoltaic (PV) systems analyzed at the study areas: (a) net present value (NPV), (b) internal rate of return (IRR), and (c) the project payback period.

Figure 5.
Ground stations for measuring solar irradiance in Uzbekistan.

Figure 6.
Correlation of satellite- and ground-based solar measurement data from the Tashkent-Yuzni meteorological station, Uzbekistan.
Figure 6.
Correlation of satellite- and ground-based solar measurement data from the Tashkent-Yuzni meteorological station, Uzbekistan.


Table 1.
Eight mining sites selected for photovoltaic potential analysis.
| ID | Region | Mining Site | Company | Mineral | Status | Global Horizontal Irradiation (GHI) (kWh/m2/day) | Annual Mean Temperature (°C) |
|---|---|---|---|---|---|---|---|
| 2 | Navoi | Sarmich | Navoi MMC 1 | gold/silver | operating | 4.41 | 14.20 |
| 26 | Samarkand | Ingichka | Navoi MMC 1 | tungsten | operating | 4.55 | 13.60 |
| 31 | Jizzakh | Kuytosh | unavailable | tungsten | projected | 4.36 | 15.20 |
| 36 | Surkhandarya | Sherobod | unavailable | strontium | projected | 4.46 | 17.50 |
| 38 | Bukhoro | Yakhtan | Navoi MMC 1 | tungsten | abandoned | 4.55 | 14.20 |
| 43 | Namangan | Chorkesar | Almalyk MMC 1 | uranium | abandoned | 4.27 | 8.10 |
| 60 | Tashkent | Chauli | Almalyk MMC 1 | uranium | abandoned | 4.62 | 14.30 |
| 62 | Karakalpakstan | Tebinbuloq | unavailable | iron | projected | 4.38 | 12.10 |
1 Mining Metallurgical State Company.
Table 2.
The characteristics of the photovoltaic (PV) system (1 MW) considered in the study.
| Item | Parameter | Value |
|---|---|---|
| Photovoltaic | Material | mono-Si |
| Model | Sunpower, mono-Si-SPR-X20-250-BLK | |
| Total units | 4000 | |
| Capacity per unit (kW/unit) | 250 | |
| Total capacity (kW) | 1000 | |
| Efficiency (%) | 20.3 | |
| Frame area (m2) | 1.157 | |
| Nominal operating cell temperature (°C) | 45 | |
| Miscellaneous losses (%) | 1 | |
| Inverter | Model | Sunpower, SPR-12000f |
| Efficiency (%) | 95.5 | |
| Total units | 80 | |
| Capacity per unit (kW/unit) | 12.5 | |
| Miscellaneous losses (%) | 0 |
Table 3.
Energy- and emission-related results from photovoltaic system potential analyses.
| Site | Capacity Factor (%) | Annual Electricity Generation (MWh/year) | Annual Greenhouse Gas (GHG) Reduction (tCO2) | Gasoline (L) |
|---|---|---|---|---|
| Sarmich | 18.5 | 1619 | 891.8 | 383,198 |
| Ingichka | 19.1 | 1676 | 923.3 | 396,701 |
| Kuytosh | 17.9 | 1572 | 866.4 | 372,250 |
| Sherobod | 17.7 | 1555 | 856.6 | 368,060 |
| Yakhton | 19 | 1660 | 914.8 | 393,044 |
| Chorkesar | 18.4 | 1612 | 888.2 | 381,630 |
| Chauli | 19 | 1668 | 918.8 | 394,783 |
| Tebinbuloq | 19.2 | 1685 | 928.5 | 398,955 |
Table 4.
Technical parameters of solar measurement sensors used in ground meteorological stations of Uzbekistan.
Table 4.
Technical parameters of solar measurement sensors used in ground meteorological stations of Uzbekistan.
| Parameter | Sensor | |
|---|---|---|
| Kipp & Zonen CM3 | LiCOR LI200X | |
| Manufacturer | Kipp & Zonen | LI-COR, Inc. |
| Operating range (W/m2) | 0–2000 | 0–3000 |
| Accuracy (%) | ±10 | ±5 |
| Type | Thermopile pyranometer | Silicon photocell pyranometer |
© 2019 by the authors. Licensee MDPI, Basel, Switzerland. This article is an open access article distributed under the terms and conditions of the Creative Commons Attribution (CC BY) license (http://creativecommons.org/licenses/by/4.0/).
Share and Cite
MDPI and ACS Style
Mardonova, M.; Choi, Y. Assessment of Photovoltaic Potential of Mining Sites in Uzbekistan. Sustainability 2019, 11, 2988. https://0-doi-org.brum.beds.ac.uk/10.3390/su11102988
AMA Style
Mardonova M, Choi Y. Assessment of Photovoltaic Potential of Mining Sites in Uzbekistan. Sustainability. 2019; 11(10):2988. https://0-doi-org.brum.beds.ac.uk/10.3390/su11102988
Chicago/Turabian StyleMardonova, Mokhinabonu, and Yosoon Choi. 2019. "Assessment of Photovoltaic Potential of Mining Sites in Uzbekistan" Sustainability 11, no. 10: 2988. https://0-doi-org.brum.beds.ac.uk/10.3390/su11102988
Note that from the first issue of 2016, this journal uses article numbers instead of page numbers. See further details here.