Dynamic Evaluation and Regionalization of Maize Drought Vulnerability in the Midwest of Jilin Province


1
School of Environment, Northeast Normal University, Changchun 130024, China
2
Key Laboratory for Vegetation Ecology, Ministry of Education, Changchun 130024, China
3
State Environmental Protection Key Laboratory of Wetland Ecology and Vegetation Restoration, Northeast Normal University, Changchun 130024, China
*
Author to whom correspondence should be addressed.
Sustainability 2019, 11(15), 4234; https://0-doi-org.brum.beds.ac.uk/10.3390/su11154234
Submission received: 17 June 2019
/
Revised: 31 July 2019
/
Accepted: 1 August 2019
/
Published: 5 August 2019
Abstract
:Drought vulnerability analysis of crops can build a bridge between hazard factors and disasters and become the main tool to mitigate the impact of drought. However, the resulting disagreement about the appropriate definition of vulnerability is a frequent cause for misunderstanding and a challenge for attempts to develop formal models of vulnerability. This paper presents a generally applicable conceptual framework of vulnerability that combines a nomenclature of vulnerable situations and a terminology of vulnerability based on the definition in the intergovernmental panel on climate change (IPCC) report. By selecting 10 indicators, the drought disaster vulnerability assessment model is established from four aspects. In order to verify our model, we present a case study of maize drought vulnerability in the Midwest of the Jilin Province. Our analysis reveals the relationship between each single factor evaluation indicator and drought vulnerability, as well as each indicator to every other indicator. The results show that the drought disturbing degree in different growth periods increases from the central part of the Jilin Province to the western part of the Jilin Province. The sensitivity degree showed an increasing trend from the southeast to the northwest. The places with the strongest self-recovery ability are mainly concentrated in Changchun, Siping, Baicheng, and the other area. The ability to adjust to drought in each growth period is weak and crop yield reduction caused by drought is easy to create. Environmental adaptability is closely related to the social and economic situation every year, so it changes greatly and is flexible. Areas with strong drought vulnerability are mainly concentrated in Baicheng, Tongyu, and Qianguo. The research results can provide a certain basis for risk assessment, early warning, and disaster prevention and mitigation of agricultural drought disaster in the research area.
1. Introduction
Drought is one of the most frequent and expensive disasters. Its impact covers a wide range and will cause a series of consequences such as rising commodity prices, immigration, poverty, declining quality of life, destruction of plant diversity, and increased pollution [1]. Drought severely impairs food security and economic prosperity in many countries today [2]. Dai studied the trends of various forms of Palmer Drought Severity Index (PDSI) from 1900 to 2008. The results show that, from 1950 to 2008, the percentage of dry areas in the world increased by about 1.74% every 10 years [3]. Wang Xiao-jun et al. analyzed the records of China’s historical drought and its impact from 1950 to 2009. It is observed that the drought-affected area has increased from 2398 × 103 hectares to 29,258 × 103 hectares in the past 60 years, nearly 12 times, and the drought-damaged area has increased by about 22 times [4]. According to the IPCC report in 2019, the global temperature is expected to rise by 1.5° in the future [5]. Such climate change is likely to greatly aggravate the impact of drought disasters on agricultural production, which exposes vegetation to unusual drought and causes declines in productivity and increased mortality.
The agriculture plays a leading role in supporting rural livelihoods and economic growth, while the agricultural system is vulnerable to the external climate, whether it is caused by natural factors or human activities [6]. Existing research shows that risk is the product of danger and vulnerability, and crisis management is the basis for mitigating drought disasters [7]. Existing research shows that crisis management is the basis for mitigating drought disasters. Drought disasters can be managed to a large extent through effective risk management. The quantitative assessment of regional crop vulnerability is of great significance to the quantitative assessment of agricultural drought risk. It can reflect the region’s resistance to disasters and the level of disaster risk [8], in order to reduce the loss of grain yield caused by disasters.
In IPCC’s third assessment report, vulnerability is defined as the degree to which an environmental or social system is vulnerable or the adverse effects of climate change (including climate change and extreme situations) cannot be dealt with [9]. IPCC’s fifth assessment report emphasized the social aspects of drought vulnerability [10]. The vulnerability of disaster-bearing bodies depends on physical, social, and existing coping capacity attributes. In addition, the key feature of vulnerability is its dynamics, which may be due to changes in the biophysical and socio-economic characteristics of the region [11]. Therefore, to evaluate vulnerability, we must grasp these characteristics.
There are two methods to assess the vulnerability of agricultural systems: one is to use models to assess the vulnerability of crops. Another assessment method is to define a set of proxy indicators and establish a vulnerability assessment model to assess vulnerability. Bahareh et al. used the Environmental Policy Integrated Climate (EPIC) model to simulate corn yield and construct the crop physical failure index, and used the residual of simulated yield and the output recorded by the Food and Agriculture Organization of the United Nations (FAO) to construct the crop social failure index. Guo Enliang et al. established a dynamic risk assessment model for waterlogging disaster of maize based on the natural disaster risk theory by using the CERES-Maize model. Using the EPIC model, Hao Guo et al. constructed a database suitable for large-scale risk assessment, fitted the loss rate-drought index-environmental index (L-D-E) vulnerability surface with irrigation scenarios, and quantitatively evaluated the global corn drought risk based on the optimal vulnerability surface of corn [12,13,14]. Based on the definition of vulnerability by the Intergovernmental Panel on Climate Change (IPCC), Yan Li et al. used the entropy method to evaluate the drought vulnerability of maize in Northwest Liaoning. Philip et al. used rainfall and yield data as well as proxy indicators of adaptability to combine various aspects of crop drought vulnerability with socio-economic indicators to evaluate the exposure, adaptability, sensitivity, and vulnerability of 10 regions in Ghana. Hahn et al. applied the livelihood assessment method to the vulnerability assessment of climate change in Mozambique, Eastern Africa, and calculated the vulnerability index defined by the intergovernmental panel on climate change (IPCC) [11,15,16]. Khaled Hazaymeh et al. developed a remote sensing-based agricultural drought indicator (ADI) at a 30-meter spatial resolution and 8-day temporal resolution, and evaluated its performance in Jordan’s semi-arid region [17]. Eskinder Gidey has chosen six important drought indexes, which help us to better understand drought events and analyze the internal relations among the indexes [18]. The results of the model can be used to make appropriate management decisions. However, crop models have certain limitations as vulnerability assessment tools. Most of the adaptability of crop models is assumed and cannot quantify the dynamic impact of socio-economic factors on vulnerability. These crop models are often used for climate risk assessment and yield prediction. At present, there are few articles that use proxy indicators to calculate the vulnerability index, but, the selection of indicators lacks comprehensiveness, as well as less comprehensive consideration of natural factors and human activities. There are deficiencies in comprehensive consideration of meteorological drought and agricultural drought. Second, most researchers seldom consider the relationship between the single factor evaluation index and social and economic factors, and only focus on the comparison of vulnerability. The application of the agricultural drought index based on remote sensing cannot consider terrain, soil, agricultural management practices, and other aspects, and requires extremely high precision of data. Lastly, it is of great significance to subdivide the indicators into growth periods, evaluate the dynamic vulnerability of corn, and explore the different effects of single factor evaluation indicators in different growth periods to explore the formation mechanism of vulnerability of disaster-bearing bodies under drought disasters.
The Midwest of the Jilin Province is located in the core of China’s golden corn belt, which is an important commercial grain base in China. Historically, this region has been a drought-prone region, and agricultural production is highly sensitive to drought events. Rainfall and rainfall patterns play a key role in determining agricultural productivity. Therefore, it is of great significance to study the drought vulnerability of maize in this region, identify drought-prone regions, and provide decision-makers with the appropriate information on vulnerability, which are of great significance for guiding regions to adapt to future climate change and ensure food production.
Based on the definition of vulnerability in the IPCC vulnerability framework, this paper establishes a multi-index method to evaluate drought vulnerability of maize in different growth periods in Central and Western Jilin Province. Starting from the causes of vulnerability, the evaluation factors of individual indicators are linked with socio-economic indicators, and the interaction of social and physical aspects on the hazard causal process is comprehensively considered to determine which areas in the Central and Western Jilin Province are most prone to drought. Based on the existing meteorological data, the yield of corn in the counties and cities where the meteorological stations are located and the proxy indexes of adaptability, the drought disturbance degree, sensitivity, self-recovery ability, and environmental adaptability of the central and western Jilin Province are evaluated. By simplifying and selecting indicators, this vulnerability assessment model is applied to regions lacking more detailed data.
The remainder of this paper is organized as follows. Section 2 presents the conceptual framework of vulnerability, the associated terminology, and the selection of indicators. Section 3 applies this framework to discuss the impact of single factor indicators on vulnerability and the distribution of vulnerability levels in the central and western regions of the Jilin Province in typical drought years. Furthermore, the applicability of the model is verified. Section 4 is the discussion of this article. Section 5 concludes this paper.
2. Materials and Methods
2.1. Study Areas and Data Sources
The research area is located in the Midwest of Jilin Province, with an area estimate of 798 × 104 hm2, which accounts for 44.23% of the total area of the Jilin Province [14,16]. The research area is located at the southwest end of the Songnen Plain in the Jilin Province and the east of the Horqin Grassland. It includes 19 counties and cities, including Songyuan City, Baicheng City, Siping City, and the Changchun City [19]. The Central and Western part of the Jilin Province is the main commodity grain producing area in the Jilin Province, and is located in the core of China’s golden corn belt. The region belongs to a semi-arid and a semi-humid continental monsoon climate with distinct seasons and the same period of rain and heat. The annual average of precipitation in the whole region is 399.7~576.7 mm [19], with large grade variation of precipitation and uneven distribution during the year, which is very unfavorable for the growth of corn. Moreover, the frequent occurrence and long duration of drought in the study area have greatly affected the grain yield.
Nine agricultural meteorological observation stations in the Central and Western Jilin province were selected as research stations (Figure 1). In this paper, the growth period of maize is divided into five periods: seeding (00–19 BBCH code), jointing (19–39 BBCH code), tasseling (51–69 BBCH code), milk-ripe (71–79 BBCH code), and maturity (83–89 BBCH code). The research data include meteorological data, water resources data, soil characteristics data, corn physiological characteristics data, agricultural statistics data, and spatial data of the central and western regions of the Jilin Province. Meteorological data comes from the China Meteorological Data Sharing Network, including daily meteorological elements from 1985 to 2015 (http://data.cma.cn/). The data of the development period comes from the Jilin Academy of Agricultural Sciences, including the dates of seeding, jointing, tasseling, milk-ripe, and maturity of corn in the research area from 1985 to 2015 (http://www.cgris.net/). The data of irrigation facilities and economic data of various cities and counties come from the Jilin Statistical Almanac. The global vegetation index data set GIMMS NDVI3g version1 (1981–2015), which was newly launched by NASA at the end of 2016, was adopted, with a spatial resolution of about 8 km × 8 km and a time resolution of 15 days. After image preprocessing such as maximum value synthesis, projection conversion, and cropping, normalized difference vegetation index (NDVI) data sets in Central and Western Jilin are obtained [20,21,22,23].
2.2. The Selection of Indicators
On the basis of the original data, drought vulnerability assessment indicators for different growth periods of maize were selected. The selection of indicators comprehensively considered the agricultural production, natural factors, and economic and social factors in the central and western regions of the Jilin Province, and adhered to the principles of accessibility, simplicity, operability, and expressiveness. On the basis of considering the characteristics of crops in each growth period and a large number of references [24,25,26], 10 representative indexes were selected (Table 1).
The weight of each index is calculated by the entropy combination weight method. The calculation method of each index is simply summarized below.
2.2.1. Drought Intensity Index
The Drought Intensity Index (D1) of maize at different growth stages was defined below.
DI is the drought disaster intensity index of maize in a certain growth period. Zi is the stress value affected by water stress on day i. n is the number of days affected by water stress during the growth period. The max Zi and min Zi are the maximum value and minimum value of the corresponding growth period in all years, respectively. P is the daily precipitation. ETC is the potential evapotranspiration. KC is the crop coefficient of maize in a certain period. ET0 is the daily reference crop evapotranspiration, mm·d1 (using Penman-Monteith formula [26,27,28]). Rn is the net radiation from the surface. G is the soil flux, T is the daily average temperature, u2 is the 2-m high wind speed, es is the saturated vapor pressure, ea is the actual water vapor pressure, ∆ is the slope of saturated vapor pressure curve, and γ is a psychrometric constant.
2.2.2. Meteorological Sensitiveness Index
The meteorological sensitiveness index (S1) of maize at different growth stages is defined below.
In the formula, Km is the meteorological sensitiveness index, Yw is the actual productivity (kg·hm2) of the year, Yv is the climatic productivity (kg·hm2), and the Thornthwaite Memorial model is used to calculate the climatic productivity of crops (Formula 14). In addition, 30,000 is the empirical coefficient, e = 2.718, V is the annual average evaporation (mm), R is the annual precipitation (mm), L is the annual average maximum evaporation (mm), and t is the annual average temperature (air temperature).
2.2.3. Environmental Suitability Index
The environmental suitability index (RS1) is defined below.
Kr is the environmental suitability index. T0 is the regional average growth period length for many years, and T is the actual growth period length for that year.
2.2.4. Drought Resistance
Drought resistance (RS2): Drought resistance of maize at different growth stages includes two aspects. These are maize’s ability of shielding drought and ability of shielding tolerance. In this paper, the drought resistance of maize is divided according to different varieties of maize sown in different years in the Central and Western Jilin Province [29]. Different varieties of maize are divided into drought-resistant and non-drought-resistant varieties, with values of 2 and 1, respectively. Drought resistance of various maize varieties was obtained by querying China’s germplasm network.
2.2.5. Soil Index
Soil index (RA5): The topographic map (DEM) slope data is combined with the soil types analyzed by ArcGIS to quantify the quantitative values that refer to the research by Wang Cuiling et al. [30,31,32,33]. The calculation formula is shown below.
SQI is the soil index, Ci is the membership degree of each index, and Wi is the weight of the first evaluation index (0.5 is taken in this article).
Based on the above indicators, this paper treated corn according to different growth periods and calculated the weight of the indicators. After treatment, the following results were obtained (Table 2).
2.3. Establishment of the Vulnerability Model
The central idea of the model simulation is to establish a vulnerability evaluation model based on the causes of vulnerability, and to divide vulnerability grades by mathematical methods. The intergovernmental panel on climate change (IPCC) defines ecosystem vulnerability in the context of climate change as the degree to which the system is vulnerable or unable to cope with the adverse effects of climate change, including climate variability and extreme climate events. Ecosystem vulnerability is a function of climate variability characteristics, magnitude, and rate of change, as well as its sensitivity and adaptability [34]. At the same time, when studying the vulnerability of a single crop, one must consider its own physical structural characteristics [35]. Therefore, this study shows that maize drought vulnerability is affected by drought stress of different intensity and changes of social and economic system, which is reflected in the strength of sensitivity and crop self-recovery ability. On the other hand, corn drought vulnerability is also affected by natural and man-made factors such as local social economy, production, and ecology, which are manifested in environmental adaptability and degree of drought disturbance. The final effect of these four aspects is the decline of corn yield. Based on IPCC’s definition of vulnerability, this paper comprehensively considers the definition of vulnerability under regional climate change, and takes sensitivity, adaptability, crop self-recovery ability, and the drought disturbance degree into consideration. Lastly, vulnerability is defined as:
In the formula, DVI indicates the drought vulnerability index of maize, which is used to indicate the drought vulnerability degree of maize in each growth period in the region. The greater the value, the greater the drought vulnerability of regional corn in each growth period, the greater the interference from drought disasters, and the greater the potential losses caused. HI indicates the degree of drought disturbance, which reflects the degree of drought impact on corn exposed to the external environment. S indicates the sensitivity of crops and reflects the sensitivity of corn to environmental changes, Rs indicates self-recovery capability, and Ra indicates adaptability of social, economic, and other factors, which both comprehensively reflect the disaster prevention and mitigation capability of regional corn. These are interrelated and influence each other. The calculation formula of the above index value is shown below.
In the formula, XSi, XRsi, XHIi, and XRai, respectively, represent sensitivity, degree of drought disturbance, self-recovery capability, and environmental adaptability. WSi, WRsi, WHIi, and WRai, respectively, represent the weight of the corresponding index i.
2.4. Methodology
2.4.1. Standardized Treatment of Evaluation Indexes
Due to the different dimensions of each evaluation index, the evaluation index must be standardized in weight calculation to eliminate the influence of different units and different measures among the indexes. In this paper, the range method is chosen [36], for positive impact indicators.
for negative impact indicators:
In the formula, Rij is the normalized index value, Xij is the measured value of the i-th evaluation factor in year j, maxj (Xij) represents the maximum value of the i-th index in year j, and minj (Xij) represents the minimum value of the i-th index in year j.
2.4.2. Entropy Combination Weight Method
Entropy refers to the degree of chaos in the system [37], which is a measure of the uncertainty of the system state and is widely used in the fields of biological science, astrophysics, probability theory, etc. [38]. In the evaluation system, if the entropy of an index is smaller, it means that the more information the index carries and the greater its role in the evaluation, the greater its weight will be. On the contrary, the greater the entropy of a certain index, the less information it carries, and the smaller its role in evaluation, the smaller its weight becomes [39,40]. This method of using the entropy value to calculate the index weight is called the entropy weight method [41]. The evaluation results have a strong mathematical theoretical basis, but it cannot flexibly reflect the importance of decision makers to each index. The Analytic Hierarchy Process is another commonly used subjective evaluation method for determining the index weight [42]. The mode of thinking has the characteristics of multiple criteria and multiple attributes, but the evaluation results are greatly influenced by human factors and cannot overcome the subjective preference of decision-makers. In order to make up for the deficiency of the subjective and objective evaluation method and make the index weight have both a subjective intention and objective characteristics, this paper uses an analytic hierarchy process and an entropy weight method to obtain the weight proportion wja and wjb of the index, and then uses a multiplication normalization method to obtain the combined weight wj of the index. The calculation formula is as follows.
Among them, wj is the combined weight coefficient of the j index, wja is the weight coefficient of analytic hierarchy process for the j-th index, and wjb is the entropy weight coefficient of index j.
2.4.3. Mann-Kendall Method
The Mann-Kendall method was originally developed by Mann in 1945, and was only used to detect a change trend of sequences at that time [43]. In 1963, Snyers R further perfected this method, which enabled him to determine the starting positions of various trends in general [44]. In 1975, Goossens applied it to the reverse sequence, which developed a new method to detect climate mutation [45]. Now the Mann-Kendall method has become a non-parametric test method widely used and recommended by the World Meteorological Organization. The Mann-Kendall method does not require samples to follow a certain distribution and is not interfered by a few abnormal values. It has the advantages of simple and easy operation, wide test range, high quantification degree, etc. [44,46].
3. Results
3.1. Temporal and Spatial Changes of DI in the Maize Growing Season in the Midwestern Jilin Province in the Last 30 Years
In order to analyze the variation law of the DI index of maize in different growth periods in the Central and Western Jilin Province, this study is based on the Mann-Kendall test method and uses the average value of selected stations as the representative value of the whole region to analyze the interannual variation of the DI index of maize in five different growth periods. The results are shown in Figure 2. In the sowing-seeding stage (Figure 2a), the DI index of the system showed a fluctuation state of first falling, then rising, and then falling. The overall trend showed a downward state. From 1985 to 1990, the DI index changed from strong to weak. In 1987, there was a sudden change. From 1990 to 1999, the DI index fell steadily. From 1999 to 2003, the DI index returned to a reliability line of −1.98, but it was still in a declining state. From 2004 to 2010, the DI index showed a short increase trend, then decreased again, and mutated again in 2014. It can be seen that the degree of drought in the sowing-emergence stage is relatively weak. In the seeding-jointing stage (Figure 2b), the DI index showed a steady and increasing trend. From 1985 to 1987, there was a short decline, but the trend was not clear and lasted for only a short time. After 1987, the overall trend was clearly increasing. In the jointing-tasseling stage (Figure 2c), the DI index increased all the way after a short fluctuation. After a sudden change between 1993 and 1994, the DI index increased all the way, and exceeded the reliability line of +1.98 in 1999, and showed a significant enhancement trend until 2015. The DI index of maize was stable in the tasseling to milk-ripe stage (Figure 2d), and the effect of drought on the maize growth period showed a significant increasing trend from 1985 to 1997. From 1998 to 2005, the DI index decreased, and, in 2006, it changed again, and the DI index began to fluctuate and rise. In the milk-maturity stage (Figure 2e), the DI index changed relatively little from 1985 to 1994, and changed abruptly in 1991. Since then, the DI index has risen sharply all the way, exceeding the reliability line of +1.98 in 1999. This indicates that the increase trend is clear, exceeding the significance level, and shows an upward trend until 2015. After analysis, it was found that the mutation points of the DI index increase in different growth periods mostly occurred in 1991 and 2004, which is consistent with the records in the Jilin Disaster Ceremony. Looking at the DI index M-K test curve for the whole growth period, the degree of drought has increased to a certain extent. Therefore, the study area is in a state of vulnerability to drought interference and has a great impact on agriculture. Relevant departments should attach great importance to it and take corresponding political and economic measures.
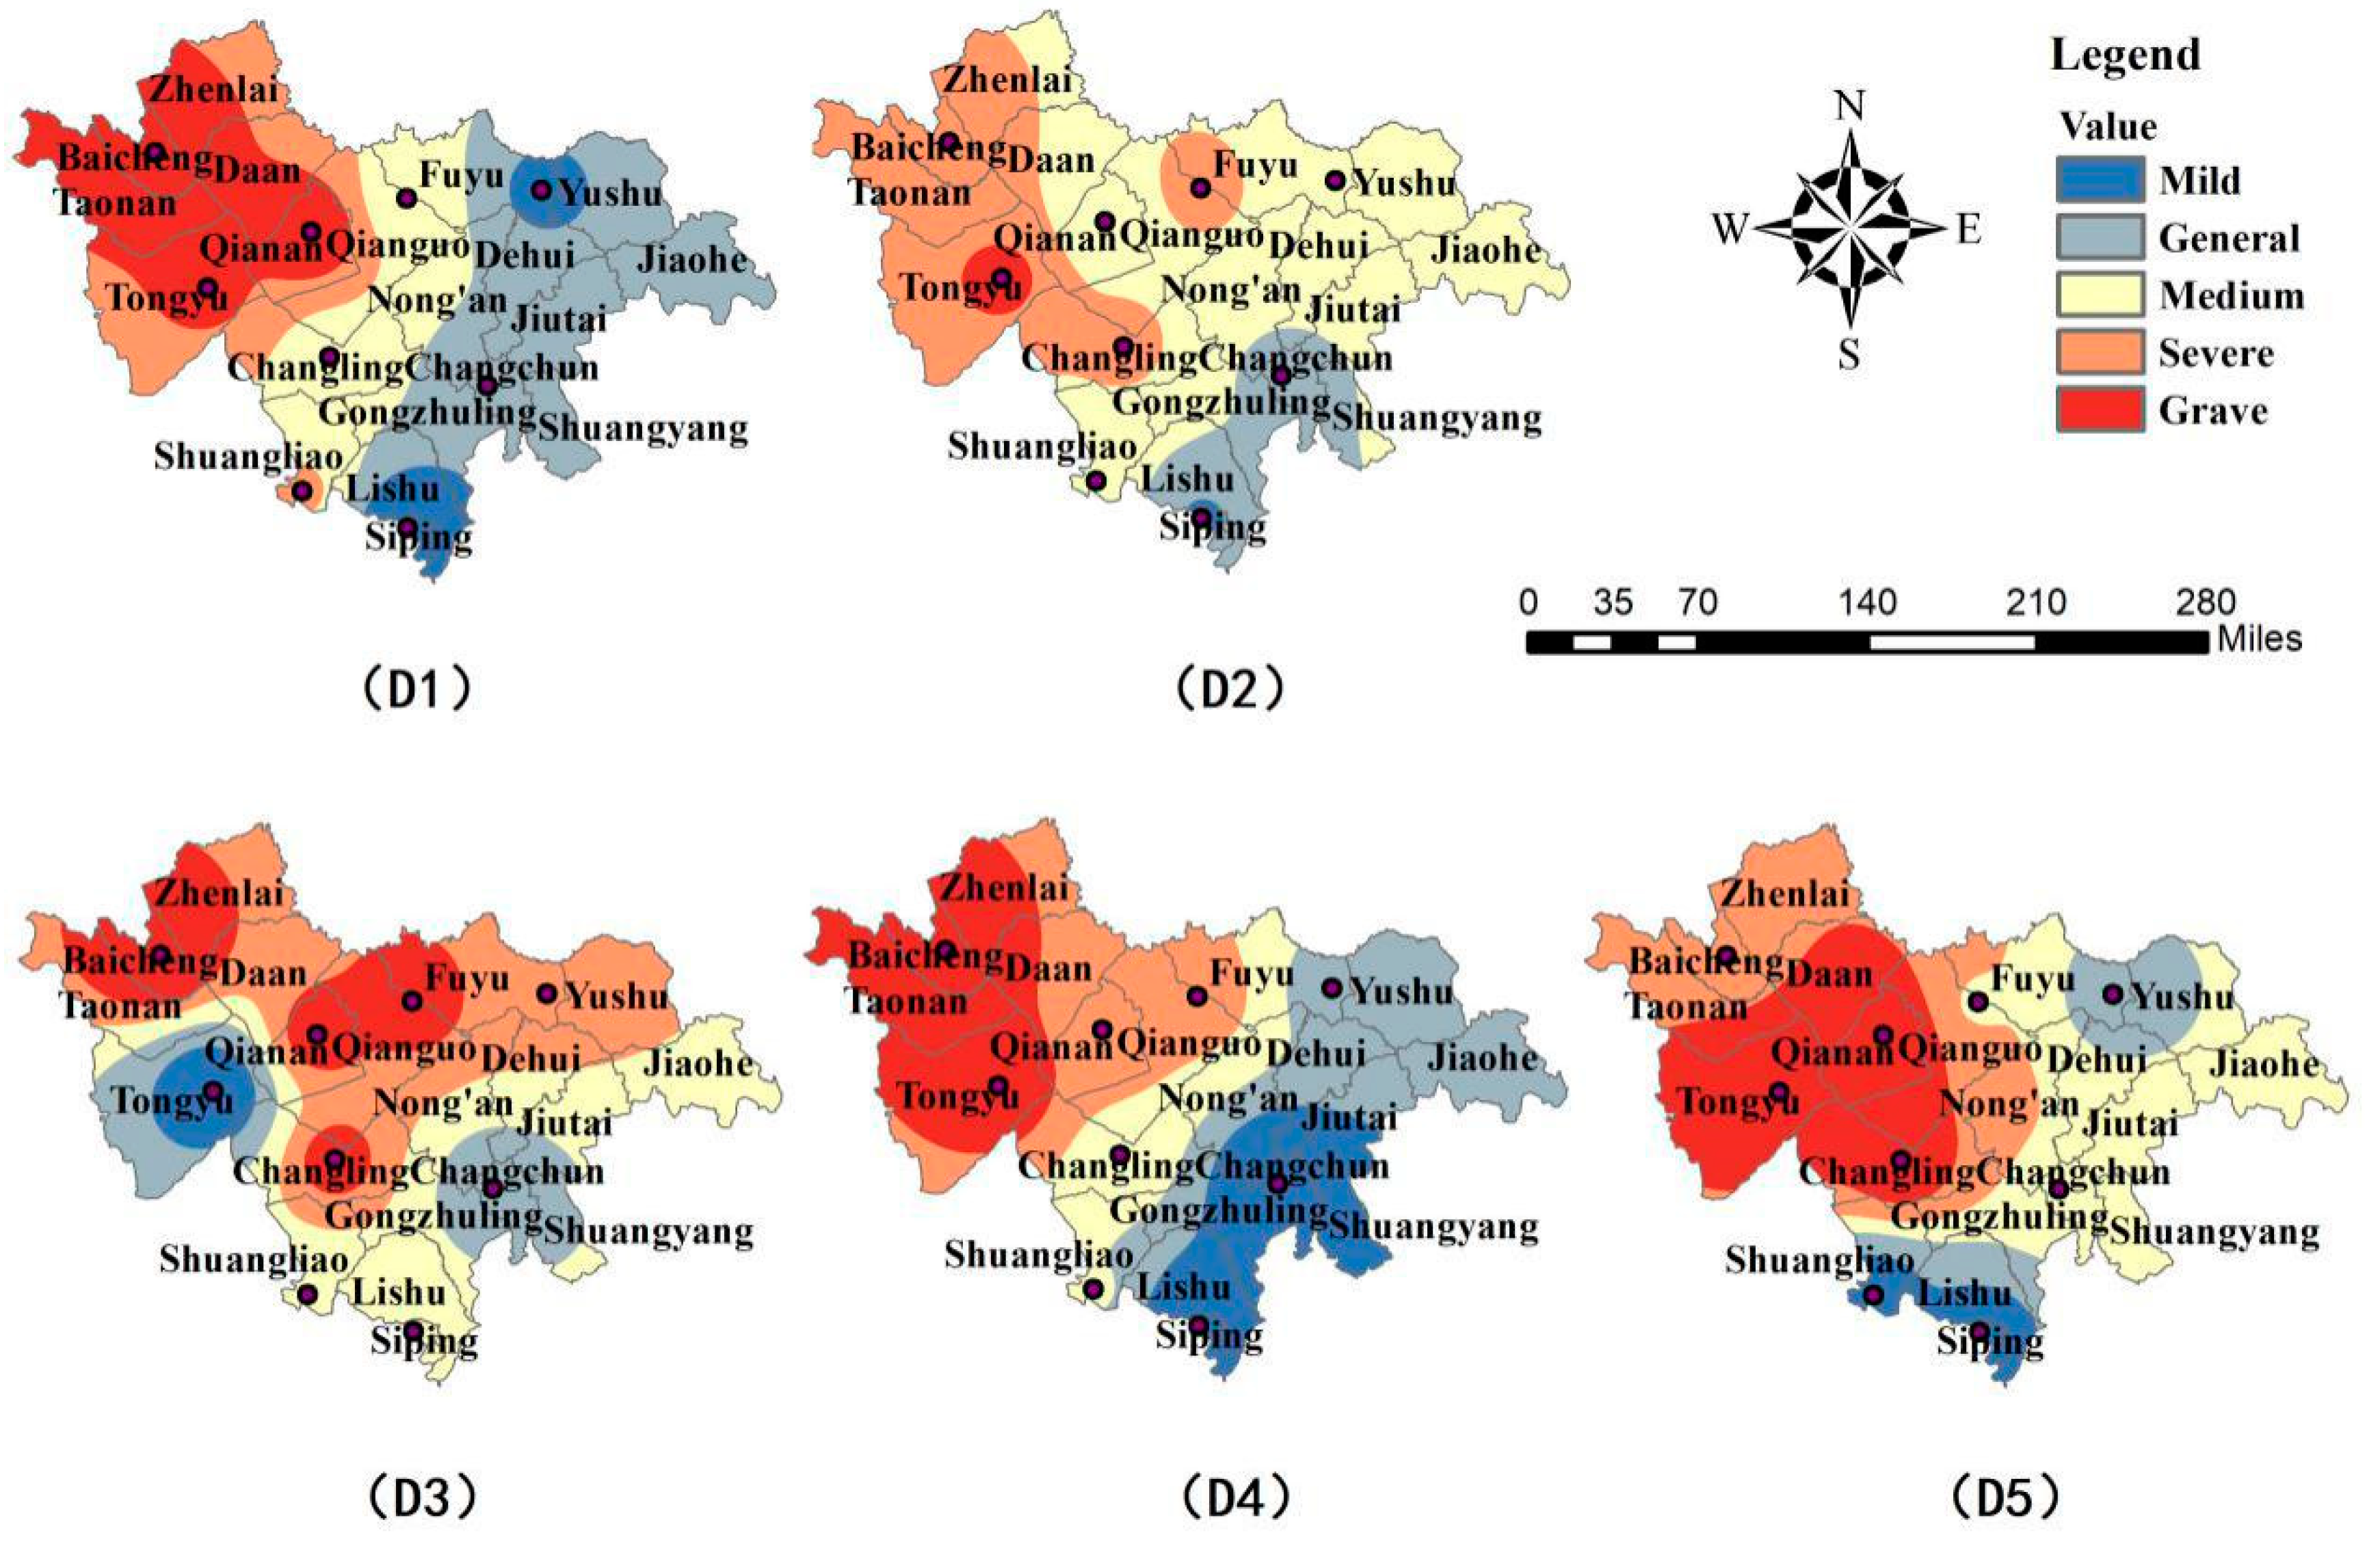
In this study, DI indexes of various stations in the Central and Western Jilin Province were divided into five categories (D1, D2, D3, D4, and D5), according to different growth periods of sowing-seeding, seeding-jointing, jointing-tasseling, tasseling-milk, milking-maturity, and the average value of 30 years was calculated. Using the inverse distance weighting (IDW) method provided by ArcGIS to carry out spatial interpolation, the spatial distribution map of the DI index in different growth periods was obtained (Figure 3). Using a natural fracture method provided by ArcGIS, each element was divided into five grades: mild, general, medium, severe, and grave. Then the distribution of the DI index in the Central and Western Jilin Province was analyzed. The results show that the DI index of each growth stage is similar, and the DI index of each station is clearly different. Overall, the drought degree increases from the central part of the Jilin Province to the western part of the Jilin Province. Baicheng, Tongyu, and Qianguo regions have the worst drought degree, while Siping and Changchun regions are relatively low.
The sowing-seeding stage showed that the drought degree in elm, Changchun, and Siping was weaker, and the closer to the west of Jilin, the stronger the drought degree was (Figure 3D1). During the seeding-jointing stage (Figure 3D2), the DI index of each station was significantly different. The drought degree of Tongyu was grave, and that of Siping was the lightest. The DI index gradually increases from the northeast to the southwest, which means that the drought phenomenon is more serious in the west of Jilin than in the central region. From jointing to tasseling (Figure 3D3), the areas affected by severe drought began to increase and extend to the southeast. Except Changchun and Tongyu, the DI index of other areas was above a medium grade. In the tasseling-milk stage (Figure 3D4), the DI index has a clear boundary zone. Baicheng, Qianguo, Tongyu, and Fuyu are in grave drought, Changling and Shuangliao are in medium drought, and Siping, Changchun, and Yushu are in a light drought. The jointing-tasseling period and tasseling-milking period are the key periods for plants to demand water. Effective rainfall has caused a significant difference in the DI index to a large extent, which indicates that drought is more serious in Northwest China. The milk-maturity period (Figure 3D5), the drought range expands, the grave drought range moves to the southeast and south, and the DI index in Changchun, Changling, and Qianguo regions increases. At this stage, corn is close to maturity, and the effect of water on corn growth is far less important than that of the jointing-milk period. At this time, light, nutrition, and other factors will also affect the degree of drought disturbance of corn, so the DI index of the whole region has been improved.
3.2. Single Factor Evaluation Results of Maize Drought Vulnerability in Central and Western Jilin Province
In this study, the drought disturbing degree, crop sensitivity, self-recover ability, and adaptive capacity of three typical drought years of 2004, 2007, and 2014 are calculated, respectively, based on the observation data of 30 years at 10 stations and the statistical yearbook data of the Jilin Province. The IDW inverse distance weighting method is used for interpolation analysis, and the spatial distribution map of four single-factor indexes of corn in the central and western regions of the Jilin Province in three typical drought years is obtained.
3.2.1. Sensitivity
Drought sensitivity analysis mainly considers the climate sensitivity index and NDVI. According to the index system and the weight of each index, sensitivity indexes of three typical drought years 2004, 2007, and 2014 in the central and western regions of the Jilin Province are calculated. According to the sensitivity index and the division boundary value, corn drought sensitivity in typical drought years in Central and Western Jilin Province was evaluated and divided. The results are shown in Figure 4. In 2004 (Figure 4a), the sensitivity showed strength in the northwest and a weakness in the south and northeast, among which Tongyu was the most sensitive, and Qianguo, Changling, Changchun, Shuangliao, and Baicheng were the areas with strong sensitivity. The sensitivity of Fuyu, Yushu, and Siping areas is relatively low. From the overall analysis, the sensitivity degree shows an increasing trend from the southeast to the northwest, and the whole region belongs to a more sensitive region. In 2007 (Figure 4b), the overall sensitivity distribution was similar in 2004, which all showed a state of high overall sensitivity and increasing sensitivity from the southeast to the northwest, which indicates that drought played a significant role in restricting the growth of maize in the whole growth period in the whole region. In 2014 (Figure 4c), the overall difference in sensitivity distribution was small, and most areas except Yushu, Siping, and Shuangliao were in a state of high sensitivity. As a whole, the sensitivity is low in the northeast and high in the west, and its value decreases from the middle to the south and northeast. Compared with 2004 and 2007, the sensitivity degree is further improved, and the range of high sensitivity areas is increased. Judging from the sensitivity zoning map of three typical drought years, the distribution area of medium and severe sensitivity grades is the largest. Drought sensitivity is not only related to precipitation and evapotranspiration, but also to the leaf area index, corn planting area, regional ecological environment, and other factors.
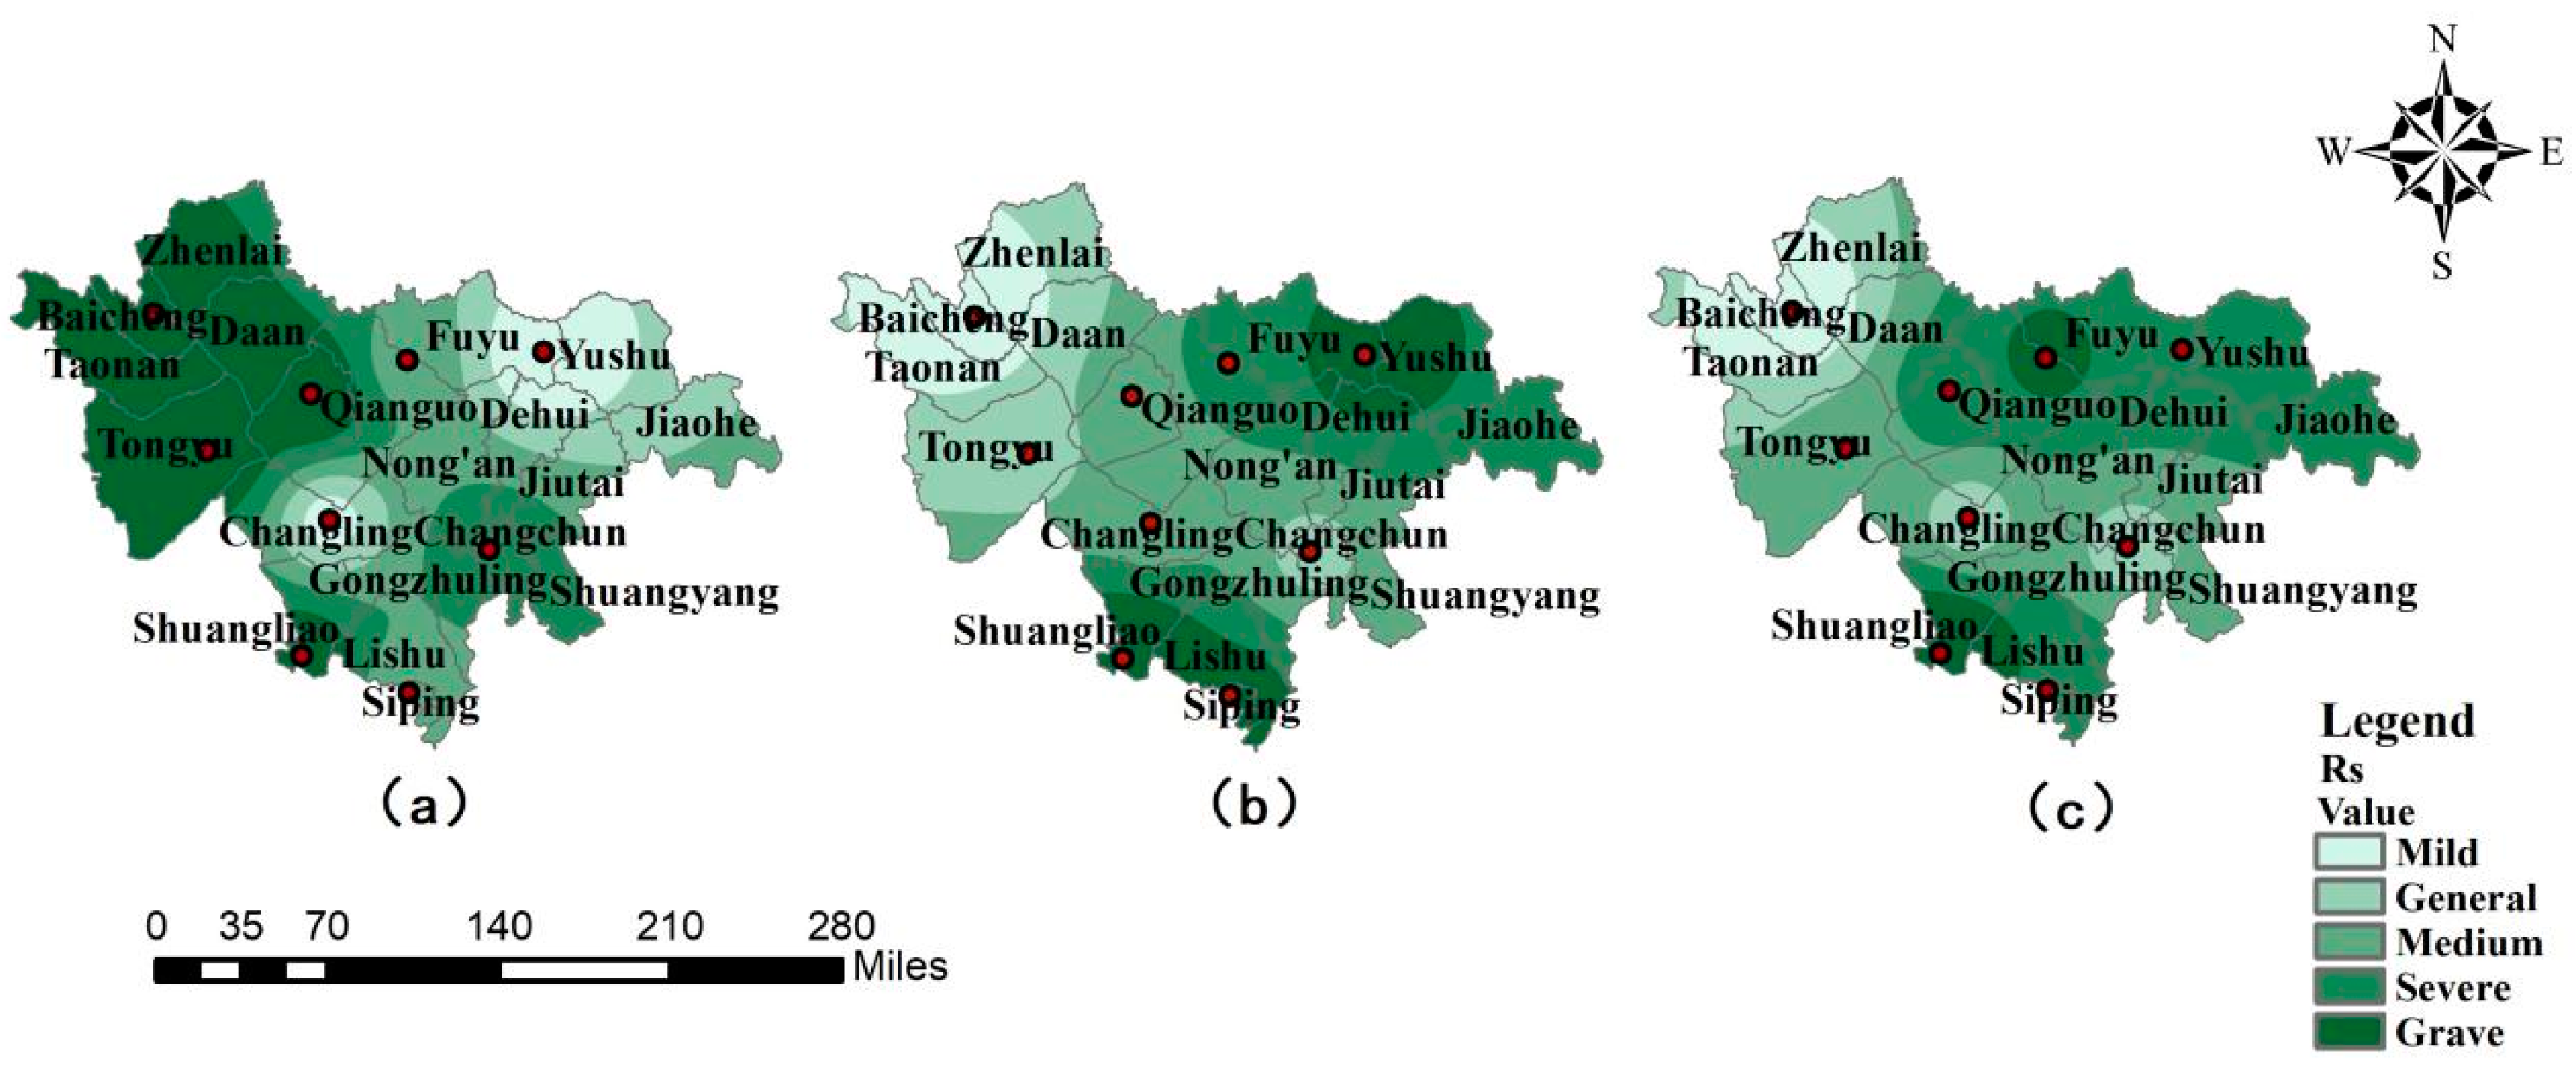
3.2.2. Self-Recover Ability
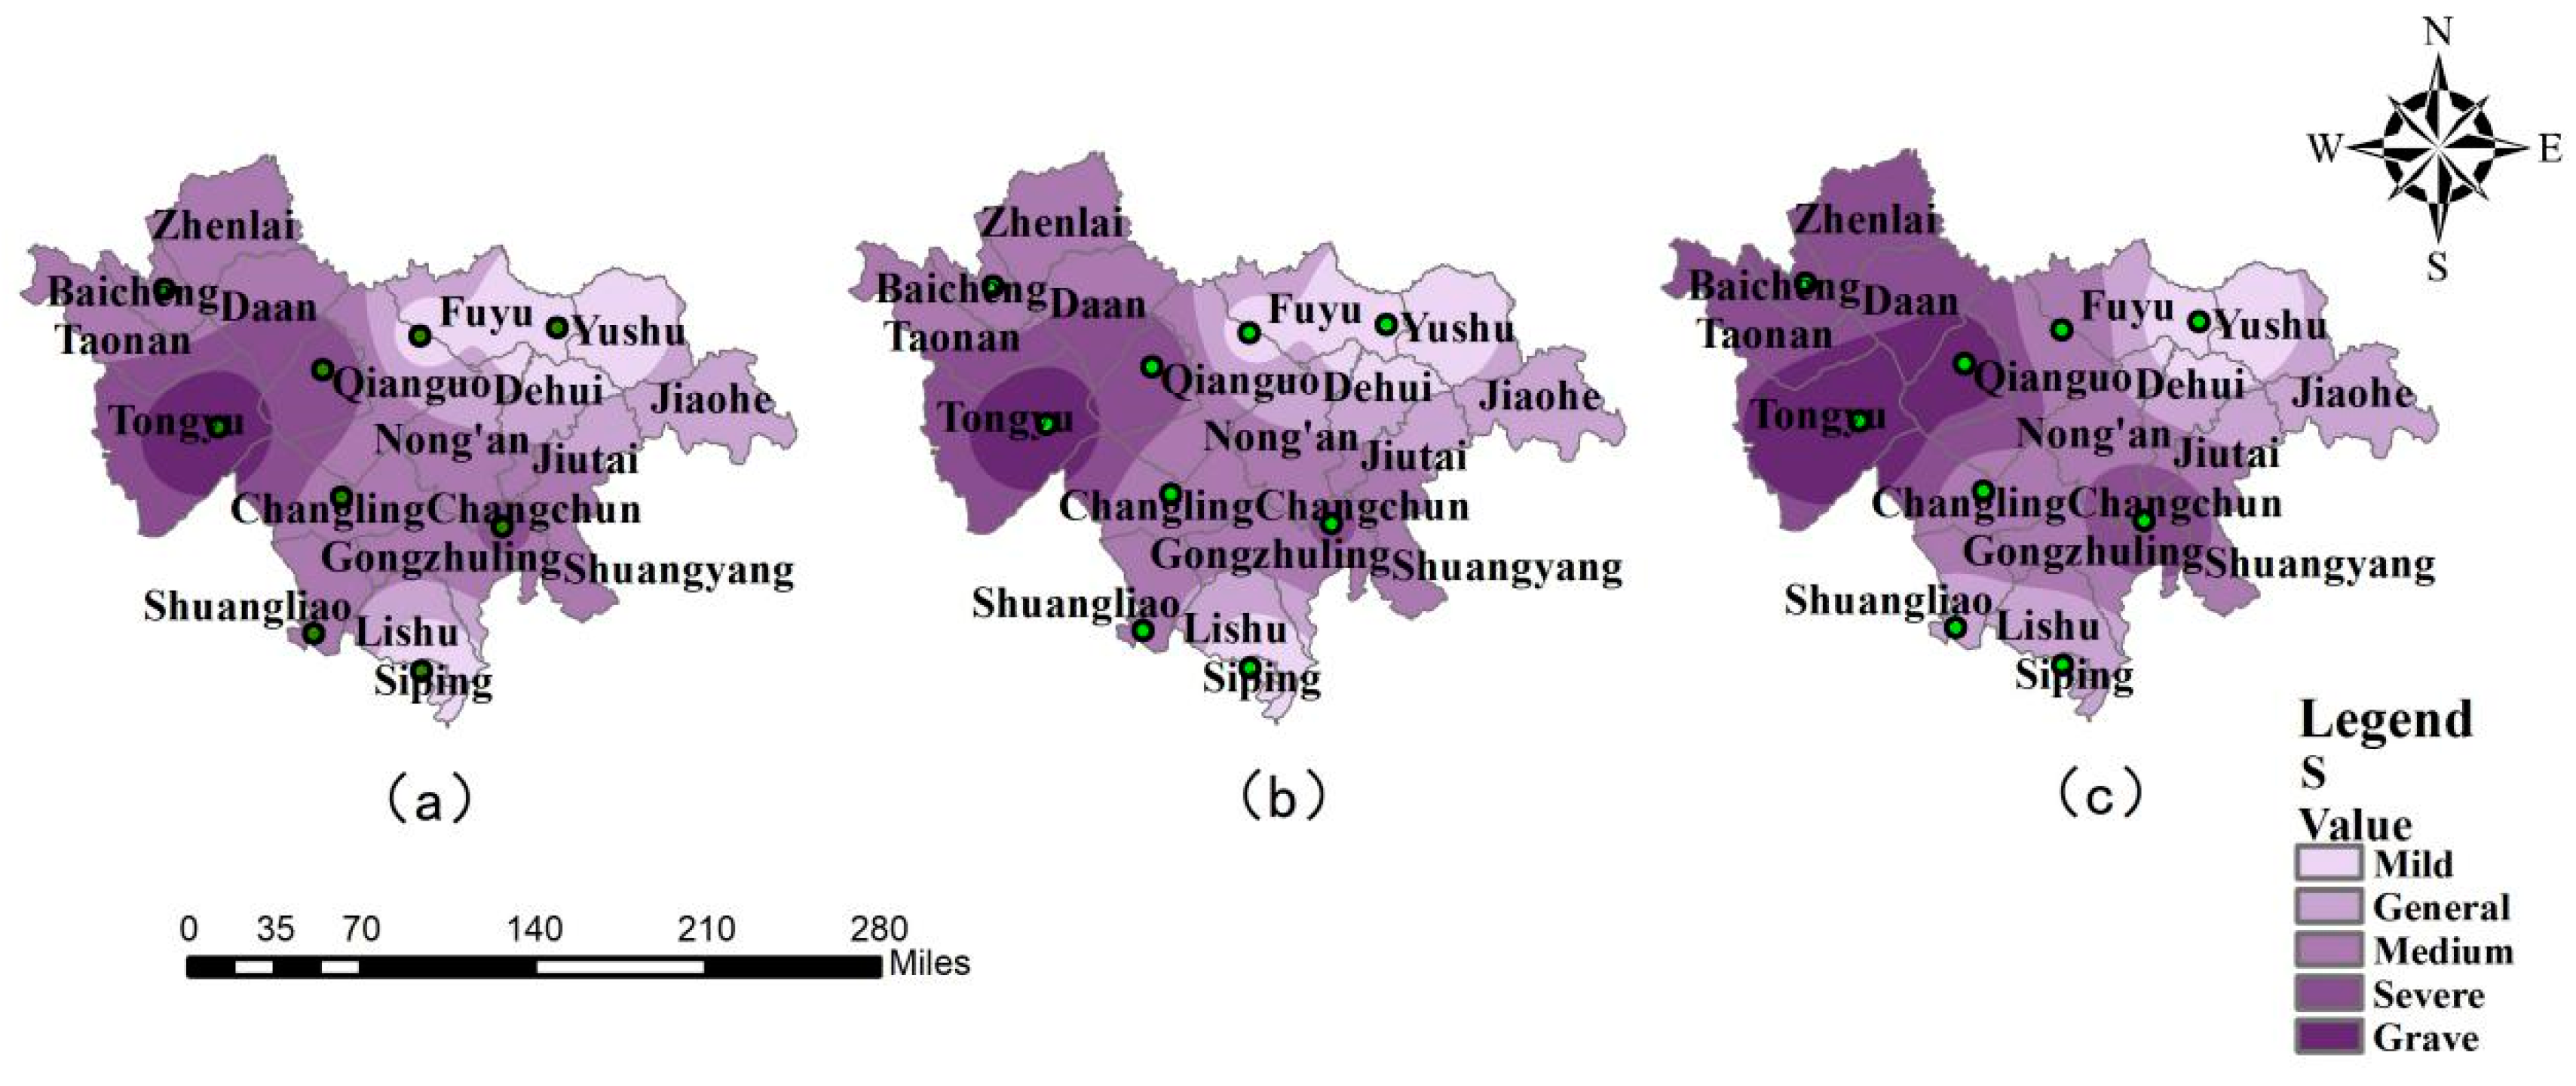
The self-recover ability reflects maize’s ability to adapt, adjust, and recover to drought, and is one of the important factors affecting maize’s drought vulnerability in the region. In this paper, the environmental adaptability index and drought resistance index are selected to calculate and analyze the self-recovery ability (Figure 5). By calculating the index value and index weight, the self-recovery ability indexes of the central and western regions of the Jilin province in 2004 (Figure 5a), 2007 (Figure 5b), and 2014 (Figure 5c) are obtained, and the self-recovery ability of corn in the central and western regions of the Jilin Province in typical drought years is evaluated and divided. The results are shown in Figure 5. On the whole, among the three typical drought years, the places in the Western Jilin Province with the strongest self-recovery ability are mainly concentrated in Changchun, Siping, Baicheng, and other areas, with strong adjustment ability to drought in each growth period. On the other hand, the regions in the study area with weak self-recovery ability of corn are mainly located in Tongyu and Fuyu, which have weak adjustment ability to drought in each growth period and are prone to crop yield reduction caused by drought. In general, the self-recovery ability of maize in the central part of the Jilin Province is higher than that in the western part of the Jilin Province, which is mainly related to the length of the maize growth period and maize variety selection, and is also influenced by certain climatic conditions such as topography, soil type, etc.
3.2.3. Drought Disturbing Degree
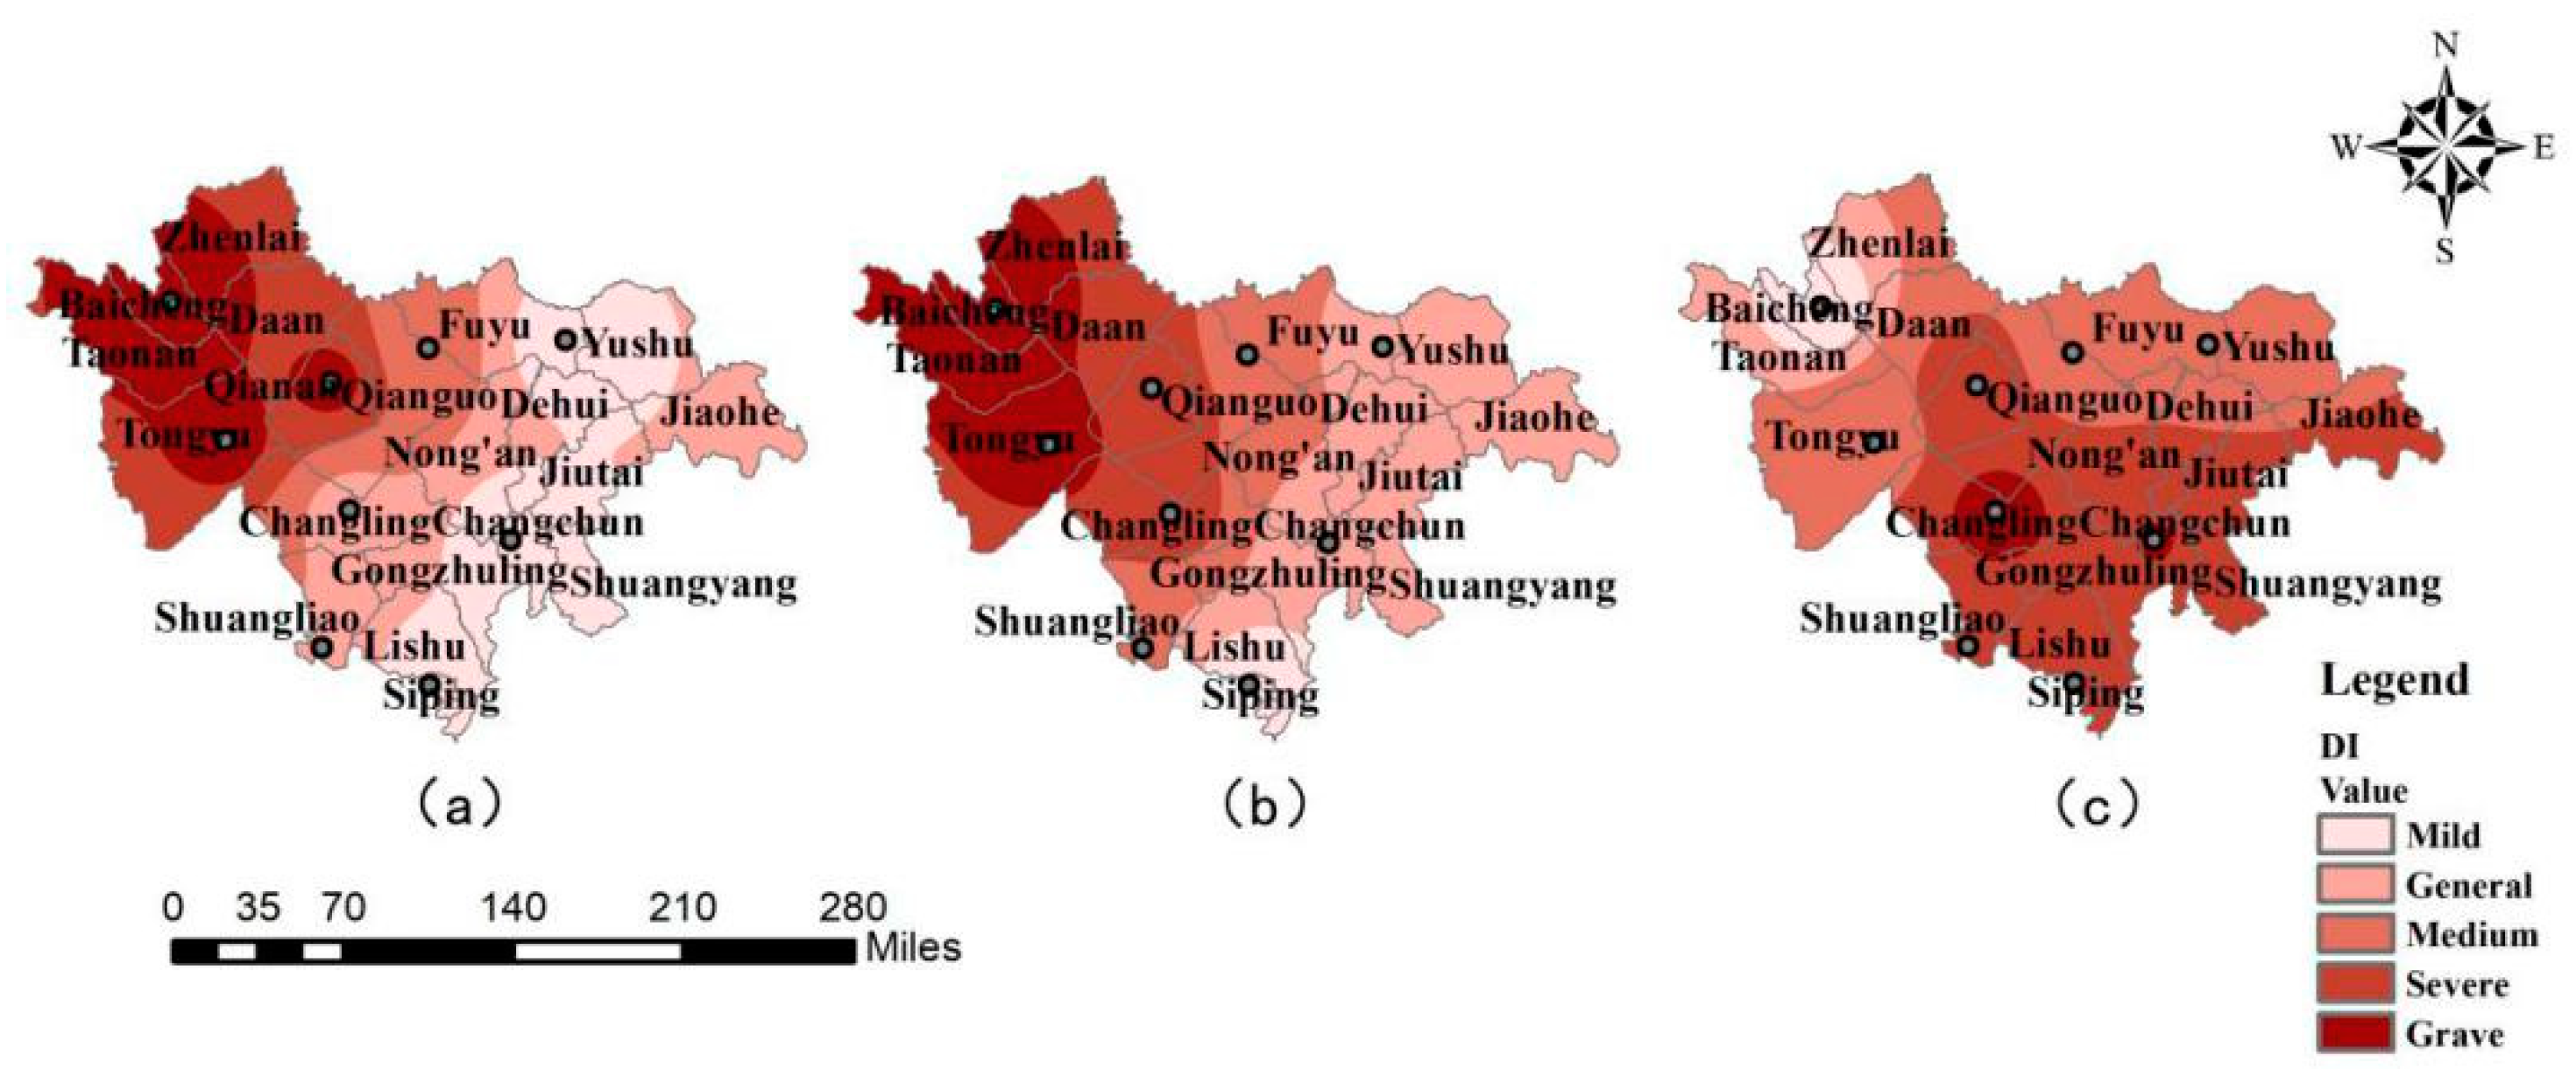
The drought disturbance degree reflects the external environmental disturbance factors resulting from the formation of regional vulnerability, which includes meteorological environmental factors, soil factors, disturbance time, and other factors. In this paper, the drought index is constructed, and the drought disturbance degree zoning maps of three typical drought years of 2004 (Figure 6a), 2007 (Figure 6b), and 2014 (Figure 6c) in the central and western regions of the Jilin Province are calculated and analyzed. The results are shown in Figure 6. In 2004 (Figure 6a), the areas with serious drought disturbance are mainly concentrated in Baicheng, Tongyu, Qianguo, and other places. The whole western region of the Jilin Province has received a serious drought impact. Comparatively speaking, the central region of the Jilin Province has received less drought disturbance, but the whole central and western regions have experienced drought with varying degrees, which has had a great impact on the corn yield in that year. In 2007 (Figure 6b), the distribution of drought disturbance degree in 2007 is similar to that in 2004, which increases from the southeast to the northwest. However, it is not difficult to see from the figure that the influence range of a serious and seed degree disturbance degree becomes larger, and the area receiving drought disturbance expands and deepens, which seriously affects the growth and development of corn and leads to crop yield reduction. In 2014 (Figure 6c), the degree of drought disturbance this year has changed greatly. In 2014, the regions with a serious drought disturbance are Changling and Changchun regions, and the whole central region of the Jilin Province is shrouded in a high degree of drought disturbance. The severity of the western region of the Jilin Province is lower than that of the central region, and decreases from the southeast to the northwest on the whole, but the difference in severity is not large. The overall drought disturbance is still serious and is significantly affected by climate factors such as precipitation.
3.2.4. Adaptive Capacity
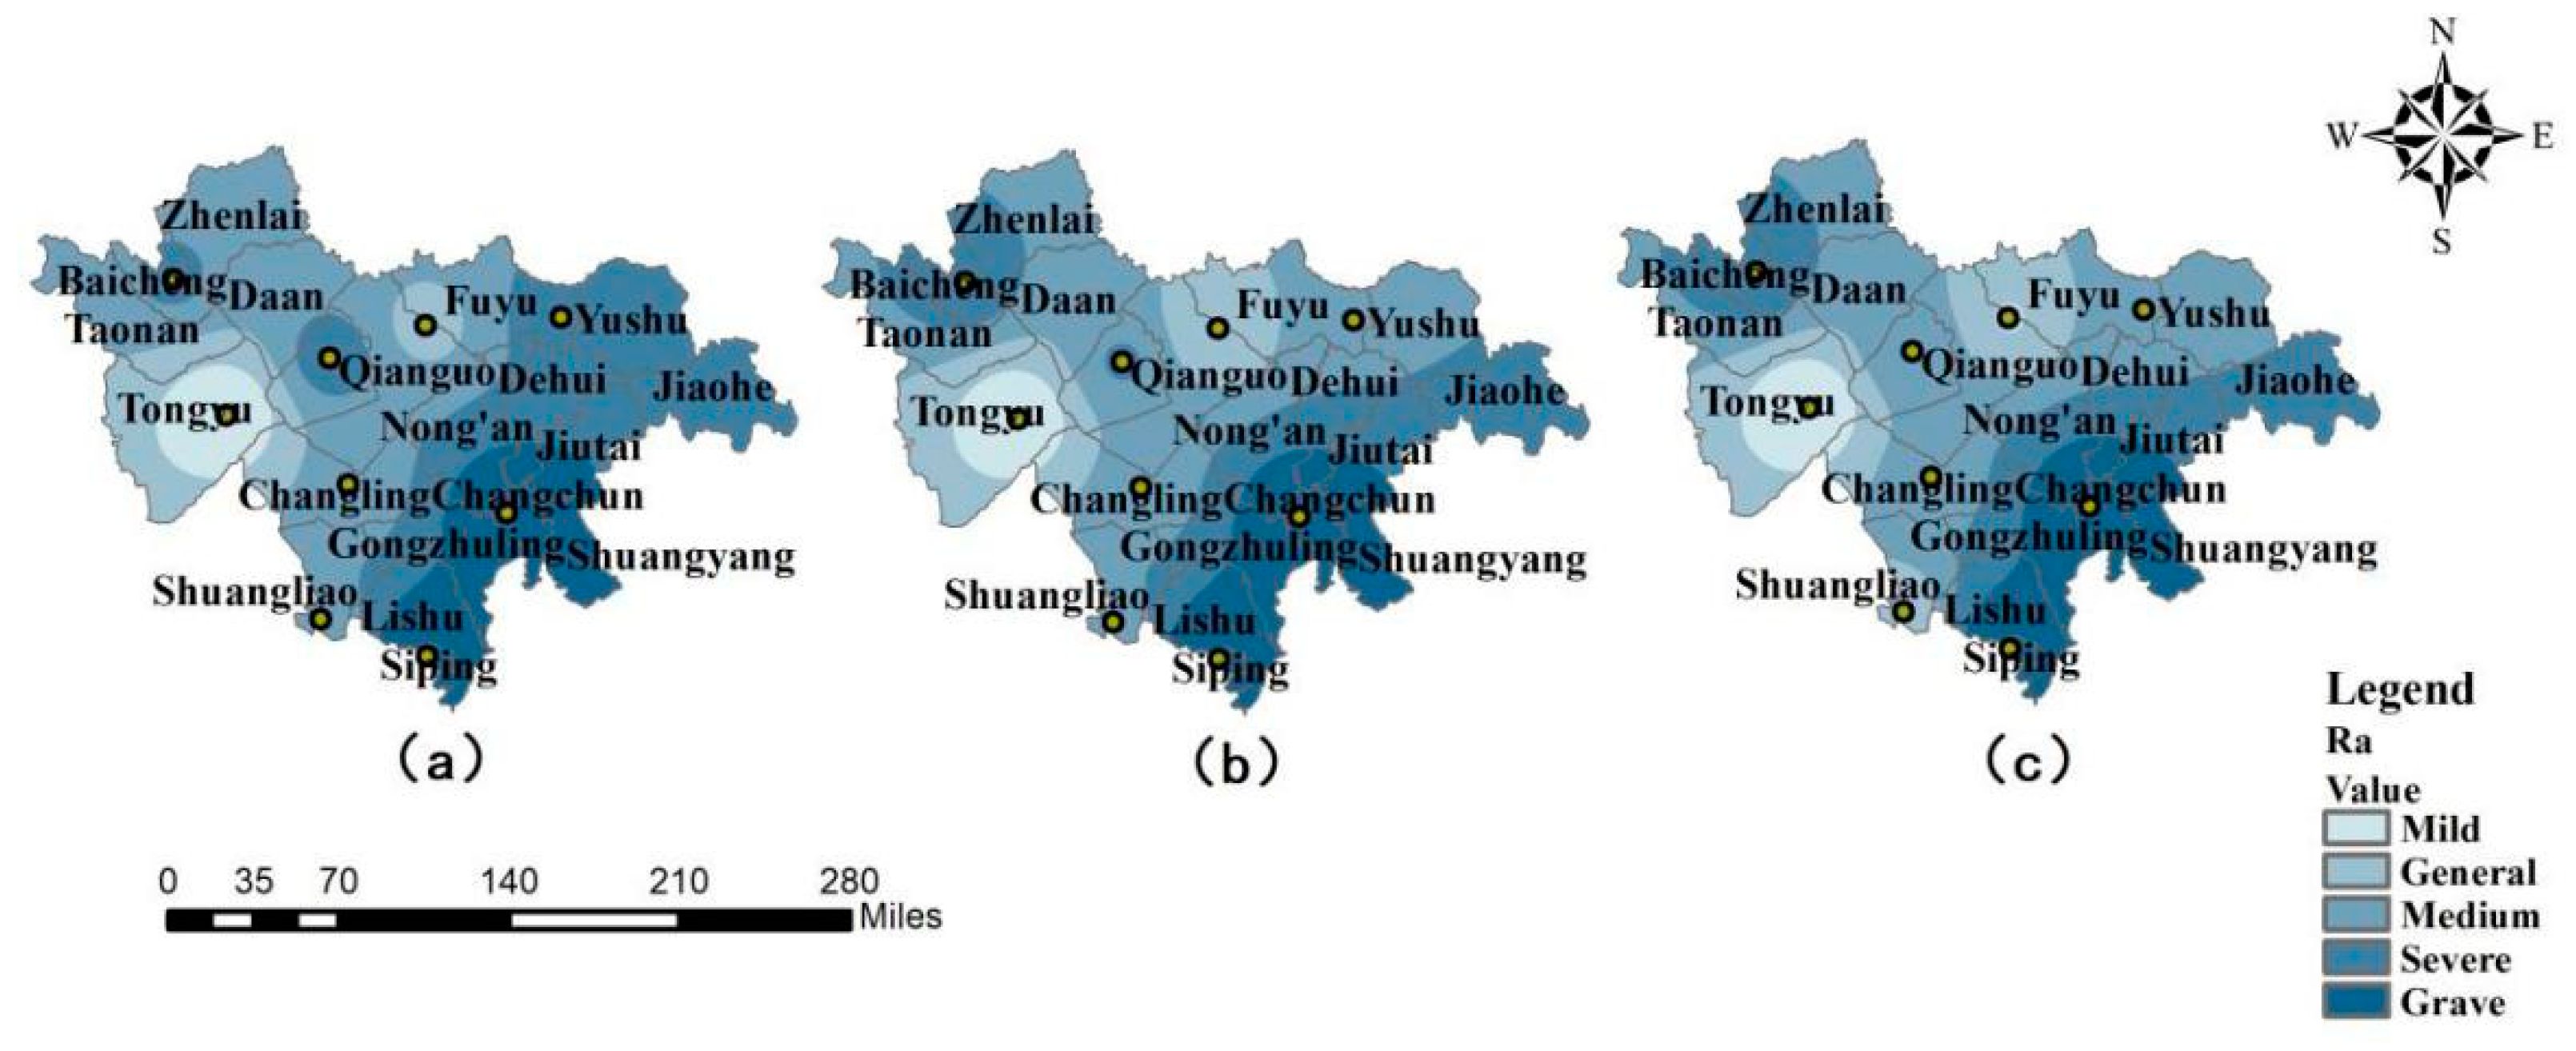
The results of vulnerability are directly related to the local research background and specific hazards, so this study investigated various socio-economic factors that reflect environmental adaptability, quantified the impact of socio-economic factors on natural disasters, and evaluated and zoned the environmental adaptability of the central and western regions of the Jilin Province. Results as shown in Figure 7. On the whole, the regional differences of environmental adaptability in the central and western regions of the Jilin Province are clear, the degree of adaptability is clear, there is no fixed change trend, and the situation is different every year. In 2004 (Figure 7a), the overall difference was large, and the environmental adaptability of the whole western region of the Jilin Province, Changchun, and Shuangliao were stronger. Fuyu, Yushu, and Changling have relatively weak environmental adaptability, which show the phenomenon of strong northwest and southeast parts and weak middle parts. In 2007 (Figure 7b), the overall trend changed, which was greatly different from 2004. YuShu, Siping, and Shuangliao have the best environmental adaptability, while Baicheng and Tongyu have a sharp drop in adaptability. In 2014 (Figure 7c), the overall trend was the same as in 2007, with low environmental adaptability in the northwest and high in the northeast and southwest. Environmental adaptability is closely related to the social and economic situation every year, so it changes greatly and is more flexible. The environmental adaptability of the whole Central and Western Jilin Province is not inferior on the whole, and can be improved through economic development and government support.
3.3. Regionalization of Maize Drought Vulnerability in the Midwest Jilin Province
According to the evaluation model of maize drought vulnerability in Central and Western Jilin Province, 10 indexes are selected from four aspects, the maize drought vulnerability index is calculated, and the maize drought vulnerability evaluation model is obtained. Because external interference factors such as water stress during sowing-seeding stage have relatively little influence on maize, and seedling emergence can be guaranteed under normal circumstances, this study only conducts vulnerability analysis and zoning after the seedling stage.
In order to evaluate the degree of drought vulnerability of maize, according to the actual situation of maize drought disaster in the study area and previous literatures, the maximum and minimum values of maize drought vulnerability index are comprehensively considered, and the drought vulnerability of maize in each growth period is divided into 5 grades of mild, general, medium, severe, and grave by using the optimal segmentation theory. The results are shown in Table 3. Based on the maize drought vulnerability index in the study area and the classification criteria of maize drought vulnerability grade in the Central and Western Jilin Province in Table 3, the spatial distribution map of the maize drought vulnerability grade in the Central and Western Jilin Province in three typical drought years and different growth periods was obtained.
On the whole, the regions with strong corn vulnerability in the three typical drought years are mainly concentrated in Baicheng, Tongyu, Qianguo, and other regions, which have a high probability of severe drought and severe vulnerability in each growth period of corn (Figure 8). In contrast, cities such as Changling, Shuangliao, Siping, and Changchun were weak in vulnerability in 2004. The vulnerability of Fuyu, Tongyu, and other places was weak in 2007. The vulnerability of Fuyu and Tongyu in 2017 is relatively weak, which is closely related to the sufficient degree of regional disaster emergency investment in a specific year, as well as insufficient and uneven precipitation. From the point of view of the growth period, with the growth of corn, the area where severe and above fragility occurs is gradually expanding and extending from the West Jilin Province to the central part of the Jilin Province. The most vulnerable period generally occurs in the period of the tasseling-milk-ripe stage. From seeding to the jointing stage, the area of moderate or lower vulnerability area was the largest, which reached 61.7% in 2004. In 2007, the proportion of severe vulnerability was the largest, which reached 69.7%. In 2014, 61.9% of them were severely vulnerable. Since 2004, the degree of vulnerability from seeding to jointing has been increasing, and the scope of severe vulnerability has gradually expanded from the western part of the Jilin Province to the central part of the Jilin Province. From the jointing stage to the tasseling stage, severe vulnerability accounted for the largest area in 2007 and 2014, which accounted for 53.52% and 90%, respectively. In 2004, the proportion of severe vulnerability was the largest, at 52.6%. On the whole, the degree of vulnerability showed a downward trend from the jointing to the tasseling stage, and the region with the highest vulnerability gradually shifted from the Western part of the Jilin Province to some cities in the central part of the Jilin Province. Slightly vulnerable areas shifted from the south to the north. During the period of the tasseling stage and the milk-ripe stage, the proportion of severe vulnerability was the largest in 2004, which accounted for 41%. The proportion of severe vulnerability was the highest in 2007 and 2014, with 74% and 90.3%. Judging from the overall trend, the degree of vulnerability from jointing to tasseling is increasing, from 41% in 2004 to 90.3% in 2014. There is little difference in vulnerability in the whole region, which is shrouded in a high degree of vulnerability and is extremely vulnerable to the impact of drought disasters, which results in crop yield reduction. From the milk-ripe stage to the maturity stage, the proportion of severe vulnerability reached 45.4% in 2007 and 90.4% in 2014. From the analysis of the whole growth period, the proportion of severe vulnerability is the largest, which accounts for 60.7%. The jointing-tasseling stage, the tasseling-milking stage, and the milking-maturity stage are all periods of high vulnerability and are susceptible to external interference, which results in drought. The above results are in good agreement with the historical disaster situation and the water shortage situation of maize in different growth periods in typical drought years in the research area.
3.4. Model Testing
The greater the vulnerability of regional maize to drought, the greater the risk of disaster and the greater the potential losses caused by drought. Based on historical disaster data, this paper selects three typical drought years in 2004, 2007, and 2014, and uses the vulnerability assessment model to calculate the maize drought vulnerability index in typical drought years in different regions of the Central and Western Jilin Province. Due to the negative correlation between vulnerability and corn yield, the percentage deviation of crop yield in three typical drought years (relative meteorological yield of crops) is selected to represent the relative fluctuation of yield in the study area, which reflects the yield impact under the influence of drought.
The spatial distribution of the yield reduction rate is approximately the same as that of the maize drought vulnerability grade, with some differences in some places but little difference, which is basically in line with the facts [42]. Based on the data of maize yield reduction caused by drought disasters in the corresponding drought years in the central and western parts of the Jilin Province, a regression analysis was conducted on the maize drought vulnerability evaluation model in the central and western parts of the Jilin Province. The results showed that there was a linear correlation between the two equations and the results passed the F test with α = 0.05 (seeding-jointing stage: r = 0.78, P < 0.05, jointing-tasseling stage: r = 0.77, P < 0.05, tasseling-milk-ripe stage: r = 0.69, P < 0.05, milk-ripe-maturity stage: r = 0.72, P < 0.05.). Each growth period has reached a significant level, which proves that the evaluation and zoning of maize drought vulnerability by the model in this paper is reasonable and can be used to evaluate and estimate maize drought vulnerability and maize yield loss caused by drought.
4. Discussion
Agricultural drought is a complicated problem with many influencing factors. Schewe et al. pointed out that climate change is likely to significantly exacerbate regional and global water shortages. The reduction of rainfall will directly affect regional and even global agricultural production [46]. Grillakis mentioned, in his article, that the 2003 European summer heatwave in combination with the antecedent prolonged drought period, caused a wide crop shortfall in parts of Southern Europe of a compound cost of almost EUR 15 billion. Even if strong mitigation measures are taken, the risk of agricultural drought in Europe is expected to be higher than the current experience [47]. Like the world drought trend, drought has become one of the most serious natural disasters facing China at present. Zhai et al. studied the drying changes in China’s 10 major watersheds and concluded that the Haihe River Basin in Northeast China is expected to show a more arid trend in the next half century [48]. At the same time, domestic scholars have also revealed the situation that China will face a prolonged drought duration and intensified drought intensity in the future by calculating the temporal and spatial distribution characteristics of the PDSI drought index in the future climate change situation [49]. Therefore, under the background of global climate change, it is unrealistic to invest only a large amount of manpower and material resources in order to alleviate the reduction of grain production and food safety caused by drought. The focus of drought research should be on disaster prediction in advance and sustainable management. Therefore, this study believes that it is particularly important to carry out a drought disaster risk assessment for typical agricultural planting areas, to provide reasonable and reliable theoretical support for relevant departments, and to solve or alleviate the crisis of crop damage and yield reduction. Therefore, it is particularly important to carry out a drought disaster risk assessment on typical agricultural planting areas in order to provide reasonable and reliable theoretical support for relevant departments and to solve or alleviate the crisis of crop damage and yield reduction.
In this study, the vulnerability zoning map of typical drought years and the single factor zoning map are compared, and it is found that regions with a high degree of drought disturbance are generally more vulnerable, and regions with a low degree of drought disturbance are also relatively weak, with exceptions. Generally speaking, such exceptions are caused by differences in crops’ own recovery ability or socio-economic capital. [50]. Therefore, there is a strong pattern of spatial and socio-economic vulnerability in the Central and Western regions of the Jilin Province. Northwest China has the highest vulnerability, but its economic adaptability and environmental adaptability are relatively poor. Lower socio-economic development and more unstable rainfall patterns will lead to severe drought and a crop yield decline, which is consistent with the research results of Antwi-Agyei et al. in Ghana [11]. At the same time, we also found that the spatial distribution of drought vulnerability is largely varied with year, especially for the joining to the tasseling stage. This may be related to social and economic factors. The funds invested in agricultural drought resistance in different years are different, and it is also related to the selection of seeds in that year and the state of land in the previous year. This study is inspired by Eakin et al.’s research and improves Wang Chunyi et al.’s research on vulnerability [51,52]. The drought vulnerability evaluation model is redefined from four aspects of the drought disturbance degree, sensitivity, self-recovery ability, and environmental adaptability. Our research attempts to evaluate the drought disaster situation in the Central and Western regions of the Jilin Province under different growth periods. Some impacts cannot be seen when analyzing the whole growth period of corn, especially in areas where the difference in social and economic development increases.
Through the research results in the third part of this paper, it can be found that the three regions with strong corn vulnerability in typical drought years are mainly concentrated in Baicheng, Tongyu, Qianguo, and other regions, and the probability of severe drought in each growth period of corn is relatively high. This is consistent with the research results of Peng Zeyuan and others. Through the model, the research also made a dynamic evaluation of drought vulnerability of maize in the Western Jilin Province. It was found that the probability of severe and grave vulnerability of maize in each growth period was high, which reveals that insufficient or uneven precipitation was an important driving factor leading to increased vulnerability [53]. In defining vulnerability, this paper uses the degree of drought disturbance to interpret vulnerability, and the results obtained are consistent with the frequency distribution of drought disasters obtained by Cassie Wang et al. [19]. In the aspect of an index selection, Nasrollahi used a variety of ecological and socio-economic indicators to calculate the regional vulnerability index in their research [54]. Our research also carried out the selection of socio-economic indicators and streamlined them, deleting the indicators with greater coincidence of the represented contents, which makes the collection of indicators more convenient and representative. We have studied the spatial and temporal distribution of the DI index in different growth periods and the vulnerability distribution in typical drought years. The results of the study have been verified and confirmed that the distribution of the drought vulnerability grade in different growth periods in typical years is basically consistent with the distribution of the maize yield reduction rate in the Jilin Province [45].
According to the specific conditions of the study area, this study combines meteorological drought with agricultural drought, meteorological environmental factors with socio-economic factors, and comprehensively considers sensitivity index, drought disturbance degree, the self-recovery ability index, and the environmental adaptability index. Considering both objective entropy weight and subjective entropy weight, the result of the vulnerability index is more reasonable. The degree of drought disturbance is used to reflect the external environmental disturbance factors resulting from the formation of regional vulnerability. The meteorological environmental factors, soil factors, disturbance time, and other factors are comprehensively considered in the calculation of the degree index of drought disturbance. This paper also has some deficiencies in the selection of the maize drought vulnerability index and the establishment of the model. The vulnerability assessment, as a dynamic assessment process, does not fully reflect changes in time. In addition, due to limited data, the model is not accurate enough. The model is only applicable to countries or regions where corresponding data are easily available. In this study, the driving factors of socio-economic scale vulnerability and the correlation between various single-factor evaluation indicators need to be further explored. In future research, the questionnaire survey will be added to screen social and economic indicators, which makes the results more applicable and comparative.
5. Conclusions
On the basis of the IPCC vulnerability definition, this paper selects 10 representative evaluation indexes from four aspects of drought disturbance degree, sensitivity, self-recovery ability, and environmental adaptability, and establishes a maize drought vulnerability evaluation model. The results are as follows.
- (1)
- Among the three drought years, the seeding-jointing stage, the tasseling-milk-ripe stage, and the milk-ripe-maturity stage in 2004 are most vulnerable to drought, and the full growth stage in 2014 is the most affected. The vast majority of highly vulnerable regions have weak economic capacity, a lack of population, and serious aging. Most regions mainly grow grain, are accustomed to traditional production methods, and lack educational resources. The drought vulnerability of maize is strongest in the period of tasseling-milk-ripe and seeding-jointing, followed by milk-ripe-maturity. This is related to the water demand of maize in different growth periods, maize varieties, and soil types.
- (2)
- The four components of vulnerability represent different patterns. Areas with high climate sensitivity are mainly concentrated in Fuyu and Qianguo. The places with the strongest self-recovery ability are mainly concentrated in Changchun, Siping, Baicheng, and other areas, with strong drought adjustment ability in all growth periods. Areas with serious drought disturbance are mainly concentrated in Baicheng, Tongyu, and Qianguo. There are clear regional differences in environmental adaptability, obvious differences in adaptation degree, no fixed change trend, and different situations every year. This is related to many factors. Social and economic development should be strengthened and social and demographic structure should be improved.
- (3)
- After verification, the research results prove that the distribution of drought vulnerability grade of maize in different growth periods in typical years is basically consistent with the distribution of maize yield reduction rate, and the two are linearly correlated. Each growth period passes the significance F test of α = 0.05. The model can be used to evaluate and predict maize drought vulnerability, drought disaster risk, and maize yield loss caused by drought.
The drought vulnerability in this region is closely related to the social and economic development in this region, and there are spatial differences. The study can fully reflect the spatial characteristics of drought vulnerability in typical drought years and reflect the correlation between drought vulnerability and each single evaluation factor. The combination of multiple indicators to evaluate vulnerability can play a better early warning role. For regions with high vulnerability, we can start with developing agriculture through science and education, fundamentally change farming habits, and artificially improve crops’ self-recovery ability and environmental adaptability.
Author Contributions
Data curation, R.W. Formal analysis, Z.T. Investigation, Y.G. Methodology, X.L. Resources, R.W. Software, Z.T. Supervision, J.Z. Writing—original draft, Y.G. Writing—review & editing, J.Z. All authors read and revised the final manuscript.
Funding
The National Science Foundation of China (41571491 and 41371495), The Science and Technology Development Planning of Jilin Province (20190303018SF), The Science and Technology Planning of Changchun (19SS007), The China Special Fund for Meteorological Research in the Public Interest (No. GYHY201506001-6), The Fundamental Research Funds for the Central Universities of China (2412016KJ046), and the Innovative Youth Foundation of Marine Telemetry Engineering Technology Research Centre, Qingdao (201422) supported this research.
Acknowledgments
We would like to thank the Jilin Institute of Meteorological Science for collecting the Maize production dataset.
Conflicts of Interest
The authors declare no conflict of interest.
References
- Zarafshani, K.; Sharafi, L. Vulnerability Assessment Models to Drought: Toward a Conceptual Framework. Sustainability 2016, 8, 588. [Google Scholar] [CrossRef]
- Wu, J.; Lin, X. Assessing Agricultural Drought Vulnerability by a VSD Model: A Case Study in Yunnan Province, China. Sustainability 2017, 9, 918. [Google Scholar] [CrossRef]
- Dai, A. Characteristics and trends in various forms of the Palmer Drought Severity Index during 1900–2008. J. Geophys. Res. 2011, 116. [Google Scholar] [CrossRef]
- Wang, X.J.; Zhang, J.Y. Water resources management strategy for adaptation to droughts in China. Mitig. Adapt. Strateg. Glob. Chang. 2012, 17, 923–937. [Google Scholar] [Green Version]
- Masson-Delmotte, V.; Zhai, P. IPCC, 2018: Summary for Policymakers. In Global Warming of 1.5 °C. An IPCC Special Report on the Impacts of Global Warming of 1.5 °C above Pre-Industrial Levels and Related Global Greenhouse Gas Emission Pathways, in the Context of Strengthening the Global Response to the Threat of Climate Change, Sustainable Development, and Efforts to Eradicate Poverty; World Meteorological Organization: Geneva, Switzerland, 2018; p. 32. [Google Scholar]
- Shi, W.; Tao, F. Vulnerability of African maize yield to climate change and variability during 1961–2010. Food Secur. 2014, 6, 471–481. [Google Scholar] [CrossRef]
- Dewan, A.M. Hazards, Risk, and Vulnerability. In Floods in a Megacity; Springer Geography; Springer: Berlin/Heidelberg, Germany, 2013. [Google Scholar]
- Luo, P. Risk Assessment and Division of Drought Hazard Based on GIS in Chongqing City. Chin. J. Agrometeorol. 2007, 28, 100–104. [Google Scholar]
- IPCC. AR4 Climate Change 2007: Impacts, Adaptation, and Vulnerability; Cambridge University Press: Cambridge, UK; New York, NY, USA, 2007. [Google Scholar]
- IPCC. AR5 Climate Change 2013: The Physical Science Basis; Cambridge University Press: Cambridge, UK; New York, NY, USA, 2013. [Google Scholar]
- Antwi-Agyei, P.; Fraser, E.D.G. Mapping the vulnerability of crop production to drought in Ghana using rainfall, yield and socioeconomic data. Appl. Geogr. 2012, 32, 324–334. [Google Scholar] [CrossRef]
- Kamali, B.; Abbaspour, K.C. Drought vulnerability assessment of maize in Sub-Saharan Africa: Insights from physical and social perspectives. Glob. Planet. Chang. 2018, 162, 266–274. [Google Scholar] [CrossRef] [Green Version]
- Guo, H.; Zhang, X. Drought Risk Assessment Based on Vulnerability Surfaces: A Case Study of Maize. Sustainability 2016, 8, 813. [Google Scholar] [CrossRef]
- Guo, E.; Zhang, J. Dynamic risk assessment of waterlogging disaster for maize based on CERES-Maize model in Midwest of Jilin Province, China. Nat. Hazards 2016, 83, 1747–1761. [Google Scholar] [CrossRef]
- Hahn, M.B.; Riederer, A.M. The Livelihood Vulnerability Index: A pragmatic approach to assessing risks from climate variability and change—A case study in Mozambique. Glob. Environ. Chang. 2009, 19, 74–88. [Google Scholar] [CrossRef]
- Yan, L.; Zhang, J.Q. Vulnerability evaluation and regionalization of drought disaster risk of maize in Northwestern Liaoning Province. Chin. J. Eco Agric. 2012, 20, 788–794. [Google Scholar] [CrossRef]
- Hazaymeh, K.; Hassan, Q.K. A remote sensing-based agricultural drought indicator and its implementation over a semi-arid region, Jordan. J. Arid Land 2017, 9, 319–330. [Google Scholar] [CrossRef]
- Gidey, E.; Dikinya, O. Using Drought Indices to Model the Statistical Relationships between Meteorological and Agricultural Drought in Raya and Its Environs, Northern Ethiopia. Earth Syst. Environ. 2018, 2, 265–279. [Google Scholar] [CrossRef]
- Wang, R.; Zhang, J.Q. Spatiotemporal characteristics of drought and waterlogging during maize growing season in midwestern Jilin province for recent 55 years. J. Nat. Disasters 2018, 27, 186–197. [Google Scholar]
- Ji, L. Jilin Statistial Yearbook; Statistics Press: Beijing, China, 1985.
- Ji, L. Jilin Social and Economic Statistics Yearbook; Statistics Press: Beijing, China, 1985.
- Wen, K.G. The Documents of Chinese Meteorological Disaster: Volume of Jiling; Meteorological Publishers: Beijing, China, 2008. [Google Scholar]
- Zhang, D.X. Water Resources in Jilin Province; Changchun Jilin Science and Technology Press: Changchun, China, 2008. [Google Scholar]
- Simelton, E.; Fraser, E.D.G. Typologies of crop-drought vulnerability: An empirical analysis of the socio-economic factors that influence the sensitivity and resilience to drought of three major food crops in China (1961–2001). Environ. Sci Policy 2009, 12, 438–452. [Google Scholar] [CrossRef]
- Mohmmed, A.; Li, J. Assessing drought vulnerability and adaptation among farmers in Gadaref region, Eastern Sudan. Land Use Policy 2018, 70, 402–413. [Google Scholar] [CrossRef] [Green Version]
- Hara, Y.; Umemura, K. The development of flood vulnerability index applied to 114 major river basins around the world. J. Jpn. Soc. Hydrol. Water Resour. 2009, 22, 10–23. [Google Scholar] [CrossRef]
- Jabloun, M.; Sahli, A. Evaluation of FAO-56 methodology for estimating reference evapotranspiration using limited climatic data Application to Tunisia. Agric. Water Manag. 2008, 95, 707–715. [Google Scholar] [CrossRef]
- Zhang, X.L.; Xiong, L. Application of Five Potential Evapotranspiration Formulas in Hanjiang River Basin. Arid Land Geogr. 2012, 35, 229–237. [Google Scholar]
- Liang, X.H.; Wang, X. Drought Resistance Comparison of Main Maize Varieties in West Semiarid Areas of Jilin Province. Mol. Plant Breed. 2018, 16, 4466–4472. [Google Scholar]
- Shi, S.Q.; Chen, Y.Q. Assessing the Impact of Cultivated Land Change on Grain Productive Capacity: A Case Study in the Central and Western Regions of Jilin Province. Resour. Sci. 2007, 29, 143–149. [Google Scholar]
- Wang, X.; Guo, Y.F. Research of the Slope Gradient, Slope Length and Soil Erosion Relation. Chin. Agric. Sci. Bull. 2007, 23, 611–614. [Google Scholar]
- Wang, C.L.; Ning, F.G. Determination of Drought Disaster Risk Threshold Value of Various Growth Stages of Maize in Northwestern Liaoning Province. J. Catastrophol. 2011, 26, 43–47. [Google Scholar]
- Zhu, P.; Peng, C. Soil Environmental Background and Green Maize Production in Main Maize Producing Areas in Jilin Province. J. Maize Sci. 2004, 12, 96–99. [Google Scholar]
- IPCC. Climate Change 2001: Impacts, Adaptation and Vulnerability; Cambridge University Press: Cambridge, UK, 2001; pp. 3–26. [Google Scholar]
- Zarafshani, K.; Sharafi, L. Drought vulnerability assessment: The case of wheat farmers in Western Iran. Glob. Planet. Chang. 2012, 98, 122–130. [Google Scholar] [CrossRef]
- Liu, J.Y.; Zhang, K. Comparative Study on Data Standardization Methods in Comprehensive Evaluation. Digit. Technol. Appl. 2018, 36, 84–85. [Google Scholar]
- Li, L.H.; Liu, F. Evaluation of airport aviation security based on combined weight. J. Civ. Aviat. Univ. China 2014, 32, 55–58. [Google Scholar]
- Huang, W.Z. AHP Method on the Weight of Entropy and It’s Application in Ship investment Decision Making. J. Shanghai Marit. Univ. 2000, 21, 97–101. [Google Scholar]
- Li, Y.; Wang, P.X. Evaluation of drought monitoring effects in the main growing stages of winter wheat by using the vegetation temperature condition index—II-Improved analytic hierarchy process and variation coefficient method. Agric. Res. Arid Areas 2014, 32, 236–239. [Google Scholar]
- Li, Y.; Wang, P.X. Evaluation of drought monitoring effects in the main growing stages of winter wheat by using the vegetation temperature condition index—III-Evaluation of Drought Impact on Winter Wheat Yield. Agric. Res. Arid Areas 2014, 32, 218–222. [Google Scholar]
- Qiu, Y. Management Decision and Applied Entropy; Machine Press: Beijing, China, 2002. [Google Scholar]
- Liang, X. Research on Aircraft Maintenance Risk Assessment Based on Fuzzy Analytic Hierarchy Process. Master’s Thesis, Civil Aviation Flight University of China, Guanghan City, China, 2012. [Google Scholar]
- Fu, C.B.; Wang, Q. The Definition and Detection of the Abrupt Climatic Change. Sci. Atmos. Sin. 1992, 16, 482–493. [Google Scholar]
- CH, G.; Berger, A. Annual and Seasonal Climatic Variations over the Northern Hemisphere and Europe during the Last Century. Ann. Geophys. 1986, 4, 385. [Google Scholar]
- Wang, X.F.; You, F. Production Risk Evaluation of Main Crops in Jilin. Chin. Agric. Sci. Bull. 2017, 33, 158–164. [Google Scholar]
- Schewe, J.; Heinke, J. Multimodel assessment of water scarcity under climate change. Proc. Natl. Acad. Sci. USA 2014, 111, 3245–3250. [Google Scholar] [CrossRef] [PubMed]
- Grillakis, M.G. Increase in severe and extreme soil moisture droughts for Europe under climate change. Sci. Total Environ. 2019, 660, 1245–1255. [Google Scholar] [CrossRef] [PubMed]
- Zhai, J.Q.; Liu, B. Dryness/wetness variations in ten large river basins of China during the first 50 years of the 21st century. Quat. Int. 2010, 226, 101–111. [Google Scholar] [CrossRef]
- Mo, X.G.; Hu, S. Drought Trends over the Terrestrial China in the 21st Century in Climate Change Scenarios with Ensemble GCM Projections. J. Nat. Resour. 2018, 33, 1244–1256. [Google Scholar]
- Füssel, H. Vulnerability: A generally applicable conceptual framework for climate change research. Glob. Environ. Chang. 2007, 17, 155–167. [Google Scholar] [CrossRef]
- Wang, C.Y.; Cai, J.J. Risk assessment of drought and chilling injury of maize in Northeast China. Trans. Chin. Soc. Agric. Eng. 2015, 31, 238–245. [Google Scholar]
- Eakin, H.; Bojórquez-Tapia, L.A. Insights into the composition of household vulnerability from multicriteria decision analysis. Glob. Environ. Chang. 2008, 18, 112–127. [Google Scholar] [CrossRef]
- Peng, Z.Y.; Dong, S.N. Evaluation and regionalization of maize vulnerability to drought disaster in Western Jilin Province based on CERES-Maize model. Chin. J. Eco Agric. 2014, 22, 705–712. [Google Scholar]
- Nasrollahi, M.; Khosravi, H. Assessment of drought risk index using drought hazard and vulnerability indices. Arab. J. Geosci. 2018, 11, 606. [Google Scholar] [CrossRef]
Figure 1.
Location of the study areas.

Figure 2.
Variations of the Mann–Kendall test of the drought intensity index during growth stages for maize in the Midwest Jilin Province.
Figure 2.
Variations of the Mann–Kendall test of the drought intensity index during growth stages for maize in the Midwest Jilin Province.

Figure 3.
Spatial distribution of the drought intensity index in five growth stages for maize in the Midwest Jilin Province.
Figure 3.
Spatial distribution of the drought intensity index in five growth stages for maize in the Midwest Jilin Province.

Figure 4.
The zonal map of maize sensitivity in typical drought years in the Midwest Jilin Province.
Figure 4.
The zonal map of maize sensitivity in typical drought years in the Midwest Jilin Province.

Figure 5.
The zonal map of maize self-recover ability in typical drought years in the Midwest Jilin Province.
Figure 5.
The zonal map of maize self-recover ability in typical drought years in the Midwest Jilin Province.

Figure 6.
The zonal map of the drought disturbing degree in typical drought years in the Midwest Jilin Province.
Figure 6.
The zonal map of the drought disturbing degree in typical drought years in the Midwest Jilin Province.

Figure 7.
The zonal map of adaptive capacity in typical drought years in the Midwest Jilin Province.
Figure 7.
The zonal map of adaptive capacity in typical drought years in the Midwest Jilin Province.

Figure 8.
Spatial distribution maps of maize drought vulnerability at different growth stages in 2004, 2007, and 2014.
Figure 8.
Spatial distribution maps of maize drought vulnerability at different growth stages in 2004, 2007, and 2014.


Table 1.
Indexes of evaluation on maize drought vulnerability in the Midwest of the Jilin Province.
| Target Level | Factor Level | Indicator Level | |
|---|---|---|---|
| Code | Name | ||
| Drought vulnerability of the maize ecological system | Drought disturbing degree(D) | D1 | Drought intensity index |
| Crop sensitiveness (S) | S1 | Meteorological sensitiveness index | |
| S2 | NDVI | ||
| Self-recover ability (RS) | RS1 | Environmental suitability index | |
| RS2 | Drought resistance | ||
| Adaptive capacity (RAa) | RA1 | Effective irrigated area | |
| RA2 | Peasant per capita income (Yuan) | ||
| RA3 | Agriculture water pump | ||
| RA4 | Educational expenditure (Yuan) | ||
| RA5 | Soil index | ||
Table 2.
Indexes and weights of evaluation on maize drought vulnerability in each growing period in the midwest of the Jilin Province.
Table 2.
Indexes and weights of evaluation on maize drought vulnerability in each growing period in the midwest of the Jilin Province.
| Indicator | Weight Coefficient of Each Growing Period | ||||
|---|---|---|---|---|---|
| Sowing to Seeding Stage | Seeding to Jointing Stage | Jointing to Tasseling Stage | Tasseling to the Milk-Ripe Stage | Milk-Ripe to Maturity Stage | |
| Drought intensity index | 0.1563 | 0.1845 | 0.1923 | 0.1773 | 0.1664 |
| Meteorological sensitiveness index | 0.1240 | 0.1384 | 0.1012 | 0.1013 | 0.0943 |
| Normalized Difference Vegetation Index (NDVI) | 0.1455 | 0.1421 | 0.1515 | 0.1697 | 0.1690 |
| Environmental suitability index | 0.1483 | 0.1342 | 0.1343 | 0.1413 | 0.1479 |
| Drought resistance | 0.1905 | 0.1826 | 0.1886 | 0.1906 | 0.1944 |
| Effective irrigated area | 0.0540 | 0.0571 | 0.0564 | 0.0474 | 0.0560 |
| Peasants’ income per capita (Yuan) | 0.0436 | 0.0463 | 0.0408 | 0.0477 | 0.0569 |
| Agriculture water pump | 0.0495 | 0.0455 | 0.0499 | 0.0586 | 0.0598 |
| Educational expenditure (Yuan) | 0.0387 | 0.0238 | 0.0311 | 0.0242 | 0.0118 |
| Soil index | 0.0495 | 0.0455 | 0.0539 | 0.0420 | 0.0435 |
Table 3.
Levels of vulnerability of maize drought disaster in the Midwest Jilin Province.
| Growth Stage | Level of Vulnerability | ||||
|---|---|---|---|---|---|
| Mild | General | Medium | Severe | Grave | |
| Seeding to jointing stage | ≤1.12 | 1.12~1.24 | 1.24~1.37 | 1.37~1.48 | ≥1.48 |
| Jointing to tasseling stage | ≤1.15 | 1.15~1.25 | 1.25~1.35 | 1.35~1.45 | ≥1.45 |
| Tasseling to milk-ripe stage | ≤1.37 | 1.37~1.44 | 1.44~1.51 | 1.51~1.58 | ≥1.58 |
| Milk-ripe to maturity stage | ≤1.39 | 1.39~1.46 | 1.46~1.53 | 1.53~1.60 | ≥1.60 |
© 2019 by the authors. Licensee MDPI, Basel, Switzerland. This article is an open access article distributed under the terms and conditions of the Creative Commons Attribution (CC BY) license (http://creativecommons.org/licenses/by/4.0/).
Share and Cite
MDPI and ACS Style
Guo, Y.; Wang, R.; Tong, Z.; Liu, X.; Zhang, J. Dynamic Evaluation and Regionalization of Maize Drought Vulnerability in the Midwest of Jilin Province. Sustainability 2019, 11, 4234. https://0-doi-org.brum.beds.ac.uk/10.3390/su11154234
AMA Style
Guo Y, Wang R, Tong Z, Liu X, Zhang J. Dynamic Evaluation and Regionalization of Maize Drought Vulnerability in the Midwest of Jilin Province. Sustainability. 2019; 11(15):4234. https://0-doi-org.brum.beds.ac.uk/10.3390/su11154234
Chicago/Turabian StyleGuo, Ying, Rui Wang, Zhijun Tong, Xingpeng Liu, and Jiquan Zhang. 2019. "Dynamic Evaluation and Regionalization of Maize Drought Vulnerability in the Midwest of Jilin Province" Sustainability 11, no. 15: 4234. https://0-doi-org.brum.beds.ac.uk/10.3390/su11154234
Note that from the first issue of 2016, this journal uses article numbers instead of page numbers. See further details here.