Article

Finance, Sustainability and Negative Externalities. An Overview of the European Context

1
Faculty of Economics and Management, University of Szczecin–Poland, 71 101 Szczecin, Poland
2
Faculty of Economics, West Pomeranian University of Technology Szczecin, 71-270 Szczecin, Poland
3
Faculty of Economics, “Constantin Brâncusi” University of Târgu-Jiu, 210185 Targu-Jiu, Romania
4
Economic Development and Social Sustainability Research Group (EDaSS), Department of Economics—Universidade da Coruña—Spain, Campus de Elviña, s/n, 15071 A Coruña, Spain
*
Author to whom correspondence should be addressed.
Sustainability 2019, 11(15), 4249; https://0-doi-org.brum.beds.ac.uk/10.3390/su11154249
Submission received: 8 July 2019 / Revised: 27 July 2019 / Accepted: 30 July 2019 / Published: 6 August 2019

Abstract

:
The goal of the paper is to examine the relation between finance and sustainability, with a special emphasis on the impact of negative externalities. Sustainable development as a concept aims to mitigate negative externalities. Conventional finance offers no room for the environment and society. Therefore, three-dimensional sustainable finance has appeared. This paper is the first original attempt to examine the relationship between: financial, economic, environmental and social development indicators from the sustainability perspective, with a special focus on externalities. To study the disparities between the European Union (EU) countries belonging to the OECD in the field of sustainable development and sustainable finance, the multi-criteria taxonomy was used. The basis of the analyses was the indicators transformed according to the relative taxonomy method. The database, based on Eurostat, contains indicators describing pillars of sustainable development such as: economic (12 indicators), social (28), environmental (7) and sustainable finance (16). The study analyses the sample of 23 countries in 2007, 2013 and 2016. The results confirm a positive relationship among the analysed indicators. On the basis of 62 statistical features selected according to the statistical methods, 7 groups of countries were obtained in 2007 and 2013 and 8 groups in 2016. In the case of Scandinavian countries, one can observe a permanent separation of economic growth from its negative impact on the natural environment. Such dependencies are no longer so obvious in the case of other EU countries belonging to the Organization for Economic Cooperation and Development (OECD). Therefore, attention should be paid to the most economically developed countries in Western Europe, i.e., Belgium, Germany, Luxembourg, the Netherlands and the United Kingdom, whose high rankings in the case of economic, social and very often also financial results correspond to much worse results in the case of environmental development.

1. Introduction

Sustainability is not a new concept. In 1713, the monograph Sylvicultura oeconomica was published [1]. In his monograph, Hanns Carl von Carlowitz considered how to make sustainable use of wood “steady and sustained use of timber” [2]. In 2015, the General Assembly of the United Nations (UN) accepted a new set of 17 Sustainable Development Goals and 169 targets for people, the planet and prosperity. The document came into effect on 1 January 2016 and will be the strategic map for the decisions makers in the public and private sector until 2030 [3]. Nowadays, sustainability is a crucial theoretical framework in the scope of environmental economics [4]. Social and financial exclusion, increasing income disparities, an inefficient redistribution system, and negative economic externalities (such as: noise, pollution, smog) are typical challenges faced by national and local governments. At this point, the special role of sustainable development in dealing with a wider and socially harmful phenomenon, namely negative externalities, needs to be emphasized.
When assessing the role of the financial sector in the economy, it can be stated that this sector plays a key role in the implementation of the sustainable development goals [5]. Effectively operating financial markets ensure efficient capital transfer in economy, reducing financial risk and ensuring stable financing of the real economy [6]. The traditional paradigm on which the financial sector is based relies on multiplying profits. This context is well reflected in the assumptions of the efficient market hypothesis, which does not take into account the aspects of sustainable development. The financial sphere evolving towards sustainable finance allows for the inclusion of social and environmental aspects into the general theory of finance, correlating with the pillars of sustainable development [7]. Sustainable finance needs to provide an alternative to the conventional finance paradigm and should be redirected towards ensuring wellbeing and welfare in the global economy. In a nutshell, the paradigm of conventional finance turns out to be inadequate and incoherent with the changes taking place in the economy, in particular related to the growing threat of social and environmental risk [8,9]. Sustainable development is a very specific economic category, which requires an effective funding mechanism that should take into account a three-dimensional (economic, social, environmental) sustainability perspective [5,7].
The literature reveals that the relation between finance and sustainable development is a relatively novel area. Earlier theoretical models were based on selected aspects of sustainable finance. The models failed to search for the relation between finance and negative externalities from the perspective of sustainable development. This study provides an original approach to sustainable finance and negative externalities, especially as it presents a systematic review of definitions in the scope of sustainable finance, explains the link between sustainable finance and three pillars of sustainable development and describes negative externalities in this context.
The paper aims to verify the hypothesis assuming that there is a strong interaction between sustainable finance and negative externalities which need to be managed. The study aims to draw attention to the significant gap in the current research related to the issues of financing sustainable development. The concept of sustainable development, viewed as an economic category, requires considerable attention, with questions remaining unanswered. While most empirical studies have focused on the effects of economic growth and economic and financial development on negative externalities, especially in the context of environmental quality [10,11], this study extends the research and refers to the impact of financial development, not only on the environmental but also social effects of economic growth and development. The study contributes to existing research, covers the gap in existing literature, and provides a complex theoretical framework for defining and understanding the problem of sustainable finance and its role in the contemporary economy from the perspective of achieving sustainable development goals (Agenda 2030) and mitigating negative externalities. In particular, the paper assumes that sustainable finance significantly undermines negative externalities and that it is possible to assign particular types of sustainable finance to the negative externalities that they affect. In this approach, environmental finance mitigates environmental degradation, in particular green finance affects green gas emission, carbon finance supports decarbonisation processes, microfinance reduces the effects of social exclusion and, finally, development and responsible finance affect both environmental and social performance. Green finance is a part of sustainable finance referring exclusively to the environmental pillar of sustainable development; while sustainable finance is a three-dimensional perspective and is coherent with all three pillars of sustainable development: economic, social and environmental. The authors assume that the more instruments of sustainable finance are included in the financial system; the system is more sustainable and responsive to negative externalities and as result supports the achievement of sustainable development goals. In the public financial system, one can distinguish such instruments as: environmental taxes, sustainable public debt and deficit (sustainable fiscal policy) or public expenditures that support the financing of sustainable development. In the market (commercial) financial system, there are such instruments as sustainable financial products, and among this group: green financial products influencing environmental quality and microfinance supporting social inclusion.
In the selected countries, financial systems differ and are more or less sustainable with regard to the number of sustainable financial instruments incorporated in the public and private financial systems. Usually, developed countries have a developed financial market and sustainable financial systems; by contrast, developing economies base on conventional (one-dimensional) financial systems and are modernizing their financial systems towards the three-dimensional, sustainable financial systems. Thus, in developing countries sustainable finance usually is more important. However, the opposite effect is observed for developed financial markets (for example Luxemburg, the United Kingdom) because of financialisation, which is the reason for the distressed relation between sustainable finance and negative externalities. The main goal of the study is to explain the link between sustainable finance and three pillars of sustainable development and to describe negative externalities in this context.
The article, contributes to the existing research by analyzing the sustainability of financial systems of European Union (EU) countries belonging to the Organization for Economic Cooperation and Development (OECD) and their impact on economic, environmental and social development. The authors argue that developed countries are more financially sustainable and as a result they represent a higher level of sustainable development indicated by sustainable developments goals indicators included in Agenda 2030. The paper aims to contribute to the body of knowledge of finance theory, especially providing a new general theory of sustainable finance. The study contributes to finance in the following ways:
  • providing original, systematic knowledge about the sustainable finance paradigm and sustainable finance typology;
  • explaining the link between sustainable finance and other pillars of sustainable development: economic, social and environmental, in view of negative externalities,
  • diagnosing and explaining differences among EU countries in the scope of traditional pillars of sustainable development: economic, social and environmental development and the new proposal of the authors, which implies taking into account among them also the sustainable finance pillar;
  • emphasizing the role of sustainable finance in mitigating negative externalities.
The results seem to indicate that there is a strong link between sustainable finance and negative externalities which affects economic, social and environmental development. The relationship between financial development and economic, social and environmental development depends on the country group (developed or developing ones). The extensive analysis shows that:
  • in the case of Scandinavian countries economic growth does not affect the natural environment negatively; such dependencies are no longer so obvious in the case of other EU countries belonging to the OECD;
  • well developed countries in Western Europe, i.e., Belgium, Germany, Luxembourg, the Netherlands and the United Kingdom, achieved high ranking positions in the economic, social and very often also financial development but much worse results in the case of environmental development;
  • the countries located in Southern and Eastern Europe, including, Greece, Hungary, Portugal, and Poland most often reported worse results in terms of economic and social development than in the environmental scope;
  • similar results are observed, for the country groups with similar geographical location. The geographical proximity of these countries has a significant impact on the positions they achieve in the rankings;
  • the countries with the highest level of financial development (Sweden, Denmark) are also the country group with the highest level of economic, social and environmental development;
  • the countries with the lowest level of environmental development are the countries with the highest level of the greenhouse gas emissions (Germany, the United Kingdom, France, Italy, the Netherlands, Poland, Spain);
  • the countries with the highest ranking positions in financial development are the countries with: a well-developed sustainable financial system with strong elements such as: the system of environmental taxes (Denmark, the Netherlands, Latvia); a high level of gross domestic expenditure on research and development (R&D), percentage of GDP (Denmark, Sweden and the Netherlands), a sustainable public debt (Denmark, Sweden) or an efficient redistribution system (Finland, Sweden, Denmark);
  • it is possible to observe a positive relationship between the countries with the highest green growth indicators and the countries with highest financial development.
The paper is organized as follows: an introduction has been presented in Section 1. Section 2 discusses the literature review. Section 3 presents the data, the variable description and methodological framework. Section 4 provides the empirical results and Section 5. offers conclusion.

2. Literature Review

2.1. Sustainability Issues Towards Externalities

In view of the fact that sustainability generally involves several separate issues such as the protection of ecological systems, intergenerational equity and the efficiency of resource use [12], the valuation of environmental assets and the recognition of constraints implied by the dynamics of environmental systems [13,14] then it also implies the need to look at externalities. The basis for determining the types of externalities is to consider axioms defining sustainability.
Heal (1998) [12] suggests that the essence of sustainability is defined by the following three axioms:
  • The treatment of the present and the future that places a positive value on the very long run.
  • The recognition of all the ways in which environmental assets contribute to economic well-being.
  • The recognition of the constraints implied by the dynamics of environmental assets.
Externalities arise when certain actions of producers, consumers or governments have unintended external (indirect) effects on other market participants (producers, consumers, society or other countries). The decisions of producers, consumers or governments aimed at changing the present and future from the point of view of satisfying the needs of the society, improving well-being, using environmental resources to contribute to economic well-being, or recognizing constraints resulting from the dynamics of environmental assets lead to the continuous appearance of externalities.
Externalities may be positive (benefits) or negative (cost). We can also consider them in the form of production and consumption effects and may appear as positive and negative private or public effects. Although the discussion on externalities has been around for a long time, the concept is still controversial. From the point of view of sustainable development, the external effects will be associated with three basic pillars: the environmental pillar, the social pillar and the economic pillar [15,16,17,18]. Recent research shows a separation of an important factor from the economic pillar, namely the financial links between the public and the market financial system [19]. There are numerous studies which questioned the three pillars framework [20]. In the report “Our Common Future” four Domains of Sustainability: economy, ecology, politics, culture [21] are indicated. It should be remembered that sustainable development is a guarantee of a good quality of life and is a kind of a way of organizing the social and economic life of a human being [21]. But decisions made by public authorities in the area of striving for sustainable development are driven by externalities. Table 1 presents the link between the positive and negative externalities and the pillars of sustainable development.
The existence of externalities has been widely accepted. In the literature of the subject numerous scholars, in addition to discussing the mechanisms, classifications, have also discussed the external phenomena of externalities and their appearances [29,35,36]. Externalities have been studied in the banking sector [37,38], insurance [39], coal mining [33], renewable energy [34] and other specific industries. Buchanan and Stubblebine (1962) gave a mathematical representation of externalities: The so-called externality is an independent variable of the welfare function of an economic entity, producing a function which shows that if an economic welfare task is affected by other factors not controlled by itself, there is an externality [40]. Similar definitions include Xu [41].
Other important studies from the point of view of sustainable development are studies by Marshall, Pigou, Coase and the study conducted at different levels in terms of extension. Marshall’s externality refers to the impact of activities of other economies, with the typical example the tragedy of the commons [32]. Pigou’s externalities refer to the influence of actors on society and the natural environment, such as global warming, intergenerational equity in sustainable development theory, etc. Pigou recommends state intervention through appropriately selected instruments [42]. Coase’s externality advocates the influence of actors on direct participants, such as the impact of factory sewage on fish farms [43]. His research has shown that negative externalities can be eliminated not only through instruments (as argued by A. Pigou, e.g., taxes), but also through institutional solutions.
Buchanan and Tullock (1965) are noted for discoveries that show when individualistic market logic is applied unrelentingly to political decision-making. Paradoxically, the lessons of public choice tell us that when a government is called on to resolve externality problems, the action taken can result in a Pareto optimal outcome. Saying this, however, is not the same thing as saying that the politically obtained outcome will be superior to a resolution of the externality problem by means of private bargaining [44]. In view of the development of the Baumol external effects concept, Oates has shown that they arise when an individual (a person, company, government) influences the function of production or the utility of another entity. The former does not take into account the impact of its conduct on the well-being of the other unit. Decision-makers whose activities affect the level of utility or production function, do not receive compensation equal to the value of benefits generated or in the case of costs-do not pay any compensation [45]. Karl-Goran Maler presented the public good as the quality of the environment, which is important for the development of sustainable development [46].
The development of the Pareto understanding is an intertemporal optimal Pareto. The release of static assumptions shows that no one will enrich their prosperity in any of the studied periods without depleting the welfare of other people in other periods. Discounting the usefulness of future periods according to the discount rate expressing social preferences for the well-being of present and future generations are necessary for the correct allocation of well-being [47]. This approach indicates that the achievement of well-being by specific units is associated with the negative effects of the use of the environment, the disturbance of the balance, which results in specific external effects for other units of society functioning in space. Negative external effects affecting the space through irrational management of its resources are of significant importance only to the direct victim [48].
The analysis of the spatial spillovers phenomenon led to the conclusion that the policy of public authorities is willing to generate appropriate incentives for its diffusion. In the event of negative externalities, where the social rate of return on investment exceeds the private rate of return, the intervention policy of the authorities becomes necessary [49,50]. Research has also shown that the dependencies (discrepancies) between private and social optimum are also important, sometimes causing purely intervention actions [51,52]. Therefore, any indirect effect caused by the consumption or economic activity of one economic participant, affects the consumption, usefulness or effectiveness of the economic activity of another economic participant [53].
The research on behavioral finances indicates that public authorities use public policy tools based on public interventions [54,55]. The aim of the intervention is to shape specific behaviors that in the assumption of intervention creators will lead to desirable effects beneficial to social welfare and order [56,57,58]. Past experience indicates that the effectiveness of intervention depends on understanding the mechanisms of people’s behavior and how they make decisions [57]. It can be pointed out that actions undertaken by public authorities will bring better results the better the form and logic of intervention will be adapted to the methods of decision making by citizens. Research has shown that the use of the framing effect is significant [13,58]. The use of framing allows for different interpretations of the same phenomena or social problems depending on the political goals set. But it is necessary to act in such a way that the interpretations of current social problems are explained in such a way that no other explanation of them is taken into account by individuals or society.
There are numerous studies related to the link between economic, social factors and sustainability development. Therefore, it is important to determine which of the negative externalities associated with the economy and society have a significant impact on sustainability.
In the environmental economics literature, the relationship between environmental degradation and economic growth is well known as the environmental Kuznets curve (EKC) [59]. The survey EKC suggests that environmental degradation initially rises with per capita income. However, with economic growth comes an increased demand for environmental quality, leading to a decreasing environmental deterioration [31]. If there is an inverted U-shaped EKC, environmental improvements would eventually occur as economies grow. Consequently, the society without significant deviations, goes back to business as usual and still achieves environmental sustainability [60].
Subsequent studies have shown that the relationship might be N-shaped [61]; Álvarez-Herranz and Balsalobre [62], which suggests that environmental degradation will start to rise again beyond a certain income level. The survey of Allard, Takman, Uddin and Ahmed (2017) [30] suggest that further research is needed to fully understand the pollution-income relationship. Their survey find evidence for an N-shaped relationship between income per capita and CO2 emissions for lower-middle-income countries, high-income countries, and the total sample. Empirical results are heterogeneous and no strong conclusions can be drawn regarding the shape of the EKC. It is important to investigate further the relationship between income, different important economic factors and environmental degradation in order to combat climate change and to reach a sustainable economic development.
However, it should be remembered that externalities occur as an impulse, because:
  • market failures are triggered [44,53,54];
  • it is also necessary to counteract and restore the (relative) balance and, as a result, to stimulate economic growth [49,50,60];
  • development and reasonably targeted economic growth should be expected to push the market towards internalizing externalities (sustainable private finance) [30,59].
The key to achieving sustainable and environmental development lies in overcoming barriers to the efficient functioning of markets for environmental resources. Environmental entrepreneurs create and improve markets for such resources through entrepreneurial action. An important role is also played by public policy for sustainable development and instruments used by governments. The results of common action (public and private) are the development of property rights and economic institutions, the reduction of transaction costs, the dissemination of information, and the further motivation of government action towards creating a sustainable financial market.
A review of approaches in terms of the impact of external effects has shown that the policy of public authorities, or individuals, is likely to be assessed as effective when the ecologically negative effects of the activity are attributed to their perpetrators. It is necessary to take into account both positive and negative effects, and public policies to be effective should also analyze the potential impact of external effects.

2.2. Theoretical Frame of Finance and Sustainability towards Negative Externalities

The interest in researching the relationship between finance and sustainability has increased recently [63]. Pursuant to the literature review there are many different relationships and possibilities while analysing the involvement between finance and sustainability. Among them, the institutional links in capital markets can be highlighted [64], the care for environmental, social and corporate governance (ESG) factors [65], the impact of investment [66] (Hebb 2013), the concern with climate change and human rights [67], sustainable development [68] and socially responsible investment (SRI) [63,69,70].
Goldstein (2001) [71] on the basis of the empirical analysis of large banks, diagnosed the relationship between the financial market, financial institutions and their impact on stimulating sustainable development. He argues in the example of Costa Rica that these relations are negative. He noticed, especially in the case of large banks, the impeding influence of institutions and financial markets on sustainable development [70,71]. Busch et al. (2015) have conducted similar research by raising questions: to what extent do financial markets foster and facilitate more sustainable business practices? The authors summarize: whatever form sustainable development takes, banks and investors can be seen as key drivers—or obstacles to it [72]. Muñoz-Torres et al. (2018) diagnosed the positive impact of financial institutions (sustainable rating agencies) on sustainable value creation in companies’ business models [73].
There is a huge number of researches on issues related to the link between sustainability performance and financial performance. Walley & Whitehead (1994) report negative link between corporate social/environmental performance and financial performance [74]. Dowell, Hart, and Yeung (2000) diagnose positive link between corporate social/environmental performance and financial performance [75]. Some studies reported no significant, neutral link between corporate performance and financial performance.
Many studies focused on researching the link (positive negative, neutral) between ESG criteria and financial performance [75,76]; and sustainability versus capital markets inter alia Waygood (2011) argues that capital markets may influence firms in their sustainability efforts in two principal ways: via financial influence and investor advocacy influence [77].
Sustainability refers to the relationships with all types of finances. Schoenmaker (2017) explains that sustainable finance considers financial, social and environmental returns in combination [78]. A similar approach presents Soppe (2009) according to whom sustainable finance deals with institutional policies, or systems of analysis, where all financial decisions aim at a long-term integrated approach to optimise a firm’s social, environmental and financial mission statement [79]. Soppe (2004) also pays attention to the fact that the sustainable finance concept embraces the behavioral developments, but expands the economic agent to a moral human being, as advocated in the business ethics literature [4].
Sustainable finance is frequently defined as addressing environmental, social, and governance (ESG) impacts of financial services [80]. Wilson (2010) in his study assumes that “finance”, corporate or of other kind, should be used in a sustainable manner in order to generate economic activity not diminishing the future capacity of economic activity and production [81]. From Strandberg’s point of view, there are similarities between corporate social responsibility (CSR) and sustainable finance. The author assumes that the CSR concept can be understood as equal to sustainable finance. He proposes and formulates one definition for both categories and states CSR or sustainable finance can be defined as the provision of financial capital and risk management products and services in ways that promote or do not harm economic prosperity, the ecology and community well-being [82]. Table 2 presents the typology of sustainable finance.
The relationship between negative externalities and sustainable finance is not visible at the general level of definitions, but the subcategories of sustainable finance are strictly related to pollution, smog, noise, social exclusion which are found in definitions of: environmental finance, green finance, carbon finance, development finance and responsible finance.
The studies highlighting the multi-sectoral range of impact pay special attention [96,97,98,99]. The relationships between sustainable financing, pollution, smog, noise and social exclusion are also in line with the issues referring to environmental activities with green finance and green investments. In particular, based on research carried out in the scope of negative externalities and sustainable finance the conclusion has been drawn:
  • It is important to understand the role of innovation and to gain knowledge about the heterogeneity of non financial actors. This discussion was related to the renewable energy sector (RE), and the considerations concerned the aggregate categories “public” and “private” finance, which are typical distinctions in both theoretical and applied about RE innovation [96];
  • The opportunities and challenges surrounding green finance (GF) are significant for different sectors of the economy. This position has been confirmed in the research for the biomass producers sector [97];
  • It is necessary to identify actors pushing the financial sector to become increasingly greener. The research reveal a high/unbalanced narrative pressure coming from global actors by means of both institutional and informal channels, and from national actors mainly by means of informal channels [98];
  • Successful financing of innovation in renewable energy (RE) requires a better understanding of the relationship between different types of finance and their willingness to invest in RE. It becomes necessary to determine the ‘direction’ of innovation that financial actors create [96];
  • Green finance is a new financial pattern to integrate environmental protection with economic profits. The financial systems are influenced by the disclosure of the internal contradictions between green finance and environmental protection [99].
The cooperation period between banks and companies affects the firm’s probability of investing in environmentally friendly equipment. A longer relationship and cooperation period with the main bank is a factors that fosters firms’ involvement in green investment strategies in order to reduce their environmental impact. Conversely, the presence of a multiple credit relationship could concretely hinder a firm’s investments towards environmental innovations. These studies were conducted for pollution control [100].
Table 3 presents the link between the negative externalities observed in every pillar of sustainable development and the different types of sustainable finance categories.
On the basis of the issues presented in Table 2 and Table 3 conclusions can be drawn that sustainable finance refers mainly to environmental externalities; however, it is worth mentioning that after crisis in 2007 the role of systemic risk as a negative externality increases [101]. Financial intermediation that increases the risk of financial distress, and finally the threat of instability and crisis may on the other side bring financial benefits. But, of course, in such an increased system the risk is potentially costly for other companies, consumers and economy and financial markets in general. In this context, systemic risk can be considered as a negative externality [101]. Not only the type of sustainable finance is important for the efficiency of overcoming the externalities but also the type of the financial institutions that provide financial capital.
De Haas and Popov (2018) studied the relationship between financial development and industrial pollution and found a strong, positive impact of credit markets and a strong, negative impact of stock markets on aggregated CO2 emissions per capita [24]. The authors emphasized that in view of literature review the financial structure affects the degree of environmental degradation (banks hesitate to finance green technologies in comparison with the stock market more suited to finance innovative industries) [102].
Tamazian et al. (2009) found for the BRIC (Brazil, Russia, India, China) countries that a higher degree of economic and financial development decreases the environmental degradation. Some authors assume that financial development may play a deterministic role in the environmental performance. They claim that a greater financial sector development can facilitate more financing at lower costs, including the investment in environmental projects. In particular, capital market rewards firms with superior environmental performance (a higher valuation of shares). In conclusion, the authors find that capital market and banking sector development along with higher levels of foreign direct investment (FDI) help to achieve lower CO2 per capita emission [24,103].
Apart from financial market instruments, there is a wide literature related to public finance roles in mitigating of environmental externalities. There is a broad consensus in the literature that government interventions, such as Pigouvian taxes, subsidies, direct regulation and public abatement policies have been proposed to remedy negative pollution externalities [104]. Chowdhury et al. (2013) argue banks must ensure the protection of environment while financing a new project or providing working capital to the existing enterprises and that every government of the world should make attempts to the establishment of an independent Green Investment Bank. As green banks not only improve their own standards but also affect socially responsible behavior of other business in terms of sustainable banking practices [105].
Considering the general relationship among financial pillar and economic, social and environmental dimension of sustainable development in the context of negative externalities, the external and internal interactions may be defined as follows:
  • the external impact of the environmental pillar on the financial one is observed in the scope of increasing environmental risk (climate change, disasters etc.) and as a result environmental finance is developing;
  • the external impact of the social pillar on the financial one is observed in the scope of increasing social risk (spread of diseases, food crisis, income disparities, social exclusion) and as a result developed finance, responsible finance, microfinance are developing;
  • the external impact of the economic pillar on the financial one is observed in the scope of economic risk (bubbles, shocks, fiscal crises etc.) and as a result developed finance is developing;
  • the internal impact of the environmental pillar on the financial one environmental is expressed by policy and governmental regulations that determine the framework for “greening” process of financial markets; for example, the decarbonisation process is regulated by the European Union faster the development of carbon financing;
  • the internal impact of the social pillar on the financial one is expressed by social or socio-economic policy and governmental regulations in line with this scope that determine the framework for development finance, microfinance, responsible finance, socially responsible investing etc.;
  • the internal impact of the economic pillar on the financial one is determined by state policy and regulations referring to financial markets, for example the Banking Union concept developed by the European Union after the crisis of 2007;
  • the external impact of the financial pillar on the environmental, social and economic pillars of sustainable development is expressed mainly by incorporating environmental, social, governance factors into risk assessment and the decision making process of financial institutions and financial markets;
  • the internal impact of the financial pillar on the environmental, social and economic pillars of sustainable development is expressed mainly by fiscal and monetary policy, especially environmental taxes and public spending policy.
The presented list of possible interactions among: economic, social, environmental and financial dimension is not a close one as there are many others factors that may be included like: green consumerism, globalization, financialisation or companies strategies and procedures etc. Anyway the list includes the crucial determinants and relationships. It is also worth mentioning based on the concept proposed by Pye et al. (2008) the connections between social and environmental policy are identified as follows: environmental quality impacts on social conditions; environmental policy impact on social conditions; social drivers impacting on environmental quality; environmental policy interface social policy and vice versa [106]. The authors present also the integration of economic, social and environmental dimensions within the EU Sustainable Development Indicators: the number of indicators of levels I and II. Pye et al. (2008) point out that the European Commission observes that out of the 57 preliminary EU sustainable development indicators, 19 integrate all three dimensions of sustainable development (economic, social and environmental) [106]. While 15 indicators are situated at the interface of economic and environmental aspects, no indicator was found to represent the interaction between the social and environmental dimension, but 6 indicators have been proposed to cover this gap [106]. Also Yiridoe et al. (2013) identified sustainable development dimensions and inter-relationships among social performance, environmental performance and economic performance and identify common scopes among dimensions like: socio-economic; socio-environmental; eco-efficiency and integrated sustainability [107].
Referring to causality, the most common and popular research approach presented in the literature is focused on the impacts of environmental, social, and governance factors (ESG) on firm performance. G. Friede, T.Busch and A. Bassen (2015) showed, on the basis of 2000+ academic research, mainly positive ESG to CFP relations [72]. Orlitzky et al. (2003) based on a meta-analysis showed a positive two-way correlation between social/environmental performance of enterprises (CSP) and their financial performance (CFP). There was the interaction between both factors (CSP and CFP) [108]. The other scope of research argues that ESG issues can affect performance of investment portfolios. According to the results of a meta-analysis of the relationship between environmental governance and financial performance based on 60 studies: 72% of the studies declared a positive relation, 17% reported a negative correlation and 11% confirmed a neutral relationship [109].
With the development of sustainable finance we can observe the increasing role of sustainable financial systems and discuss how to design them to achieve better results in financing sustainable development. The principles of the Responsible Investment Initiative (PRI) define a sustainable financial system as a resilient system that contributes to the needs of society by supporting sustainable and equitable economies, while protecting the natural environment [110]. We can observe nowadays that the governments in many countries have taken substantial steps to develop and promote green finance concept as a crucial part of environmental finance. Therefore, the World Bank emphasizes that the Asia-Pacific region is one of the most active in innovations towards a sustainable financial system [111]. In their conclusion, Fatemi and Fooladi (2013) argue that in a very near future good environmental, social and governance performance will be a new, common standard. The growing number of studies indicates expectations regarding the improvement of social and environmental results over time in the valuation of the company on their markets. This evidence, and the fact that we observe a systematic increase in the costs of social and environmental damage as a result of negative externalities, indicates the need for a strong custody to create sustainable value. From this point of view there is a lot of space for sustainable finance as a new, three-dimensional (economic, environmental, social) finance paradigm [112]. The specific objectives of the study are:
(1)
to identify and compare the disparities between the European Union countries belonging to the OECD in the scope of sustainable development and sustainable finance;
(2)
to explore the relationship between the financial development indicators representing sustainable finance and indicators representing economic, environmental and social pillar of sustainable development;
(3)
to diagnose and compare influence of financial development indicators representing sustainable finance on sustainable development pillars’ in the European Union countries belonging to the OECD.

3. Methodology and Indicators

3.1. Statistical Materials

The analyses presented in the study comprise a part of a wider research related to the assessment of financing sustainable development in OECD countries. For this purpose the value of the indicators used to monitor the implementation of the objectives of the Agenda for Sustainable Development 2030 (Agenda 2030) were primarily applied. Due to the limited availability of data, mainly in the field of sustainable finance in the countries of the world, it was decided that the EU countries belonging to the OECD will be analyzed first, as the statistical data availability in the Eurostat database is much larger. The following periods were analyzed: 2007, at the beginning of the economic and financial crisis; 2013, last year of EU financial perspective; in this year the majority of EU countries stabilized their economic and financial condition and improved the main economic indicators and finally 2016, mainly due to the full availability of all analyzed indicators.
To monitor progress towards the Agenda 2030 goals, the European Commission uses 100 different indicators, some of which are not available to all EU countries. This applies, among other o the indicators describing EU countries with the access to the sea in the case of countries that do not have such access. In total, 35 indicators of this type were excluded from the original database. On the other hand, the indicators dedicated to the assessment of sustainable finance in the EU countries were also added to the list of indicators monitoring the progress in the implementation of Agenda 2030.
The method of the inverted correlation coefficient matrix [113] was used for the selection of final set of diagnostic features. This matrix was calculated for every analyzed year: 2007, 2013 and 2016. The final decision about the set of diagnostic features taken into account in the next stages of the analyses was made on the basis of the frequency of occurrence for every indicator in final set of diagnostic features separately for each year. This means that the final set of indicators was made by the features which repeated in every analyzed year. At the same time, in line with the strong principle of sustainability [114], it was assumed that each of the analyzed areas is equally important, and replacing losses of one resource can only take place within a given area. According to the authors, this means that combining indicators describing different dimensions of sustainable development into one set is not proper [115]. A comparative analysis of the results achieved by individual countries should be conducted separately for each single pillar. It also means the need to look for statistical methods that will allow a comprehensive comparison of the results achieved in each area [116]. It should be emphasized that previous analyses of this type, by averaging indicators describing various pillars of sustainable development, could lead to a situation in which the results of a more economically and socially developed country, but exerting more pressure on the natural environment could be considered quite good. In the case of authors’ proposals, this situation will not be possible, and the results of EU countries by comparing the partial results in each area will be more objective. Finally, to monitor changes in sustainable development after selection using the reverse matrix method of correlation coefficients, it is proposed to leave 13 primary indicators describing the economic pillar, 28 for the social pillar, 8 for the environmental pillar, and 15 for the financial pillar (Table 4).
The indicators, which are grouped in three typical pillars (Table 4): economic, environmental and social ones, are fundamental to monitor progress towards the Agenda 2030 goals and sustainable development at national levels. Aspinall at al. (2018) [70] discussed the terminological problem regarding sustainability and the financial system. The study discussed factors affecting the sustainable financial system and factors such as: GDP and the types of growth (factors contributing to growth) were distinguished. They also pointed to the importance of financial institutions, in particular loans. Goldstein (2001) [71] pointed out the link between GDP and bank credit to the private sector. Alińska, Filipiak and Kosztowniak (2018) [18] analyzed the impact of alliances of the private and public sectors in the context of a sustainable financial system. In addition, they indicated the premises resulting from the public earnings and expenditure literature in the analysis of the financial system’s stability. Morris (2010) [117], Čihák at all. (2012) [118], Kondratov (2014) [119], Karanovic and Karanovic (2015) [120], have made an attempt to elaborate indicators that are applied to the financial system. These indicators do not take into account all elements of the public and market system i.e., AFSI indicators. Moreover, in the case of OECD countries, comparable data for analyzed indicators are not available in the literature on the subject. Authors, having analyzed the indicated literature, proposed the indicators for the financial scope. It takes into account the availability of data for the purpose of calculating the proposed indicators. In addition, the elements of sustainable finance taxonomy decided on the choice of indicators (Table 2 and Table 3). Financial indicators such as: X4.1; X4.2; X4.10; X4.15 refer to environmental finance scope (Table 2) and soften environmental degradation (externalities listed in Table 1; Environmental pillar). One of the leading causes of environmental degradation is the emission of greenhouse gases. CO2 is the greenhouse gas that is emitted the most as a result of activity of industry and agriculture. There is evidence in literature that pollution taxes play a crucial role in a revenue system and reduce the level of pollution activities [121,122,123] There is also evidence for a positive relationship between gross domestic expenditure on R&D and greenhouse gas emissions [124,125] The arguments support the selection of the indicators X4.1, X4.2 and X4.10. The group of financial indicators like: X4.3; X4.4; X4.5; X4.6; X4.7 refer to development finance and microfinance scope (Table 2) and overwhelm the social exclusion problems and secure welfare (externalities listed in Table 1; Social pillar). There is evidence that government social expenditure is most effective at reducing inequality [126]. Based on Burchardt and Vizard (2007) approach to social exclusion measurement we selected indicators referring to main domains like: education, health, social life and legal security; taking into account their coherence with Sustainable Education Goals referring to social concerns [127]. In this context inequality is represented by X4.3; education by X4.4; health by X4.5; social protection by X4.6; legal security X4.7. The last group of financial indicators refers to economic pillar (externalities Table 1) and is referring to development finance and include indicators: X4.8; X4.9; X4.11; X4.12; X4.13; X4.14, X4.15. The indicators X4.8; X4.11 and X4.12 are related to systematic checks on financial providers; and restrains consumer indebtedness. They are in line especially with financial stability [118]. The indicators X4.8; X4.13; X4.14, X4.15 correspond with economic development and welfare.

3.2. Description of Statistical Methods

To study the disparities between the European Union countries belonging to the OECD in the field of sustainable development and sustainable finance the multi-criteria taxonomy was used. The basis of the analyses was the indicators transformed according to the relative taxonomy method. In the relative taxonomy, it is assumed that all indicators should have a positive interpretation when assessing the position of a given country against the background of others [112,113]. This means that all destimulants have to be transformed into stimulants. The work assumes that if the Xk is a destimulant, then the Xk will be a stimulant after the transformation: Xik = 1/Xik. The data analysis based on this method consists of several stages. In the first one the relativization of the values of diagnostic features is made according to the formula:
d(l/i)jt = xljt/xijt
where: d—relativized values of the indicators, i, l = 1, …, k—objects’ numbers, i ≠ l, j = 1, …, m—numbers of sub-indicators, t = 1, …, n–numbers of years.
It means that the structure for each array for every j-indicator may be presented in the following form:
D j t = [ 1 d ( 2 / 1 ) j t d ( k / 1 ) j t d ( 1 / 2 ) j t 1 d ( k / 2 ) j t d ( 1 / k ) j t d ( 2 / k ) j t 1     1 ]
Matrices Djt make the basis for the construction of taxonomically relative measures of development of the synthetic feature. In the next step, on the basis of the array of Djt matrices, objects are classified according to the whole set of diagnostic indicators X used for the analysis. This means defining the following matrices [108,109]:
A = [ 0 1 ( k 1 ) 1 ( ( k 1 ) 0 ] ,
and products Dj* =A · Dj. Elements on the main diagonal matrix D* form a three-dimensional matrix W defined for all j indicators [108,109]:
W = [ w 11 t w 12 t w 1 m t w 21 t w 22 t w 2 m t w k 1 t w k 2 t w k m t ]
The relative taxonomic measure of development is estimated as follows:
µit = [∑1/wijt]/m
The description of every stage of this method and their application in the economic analyses were presented in the following papers: [116,128]. It should be noted that this measure is close to 1 and can be interpreted as the relative position of the object in relation to all other analyzed objects (in this case: countries). For objects with a similar level of development, the values generally hover around unity. The lower the value of the measure, the better is the situation of the object (country) against the background. Objects can also be divided into typological classes with similar levels of development. The first class contains the best countries, while the fourth the worst ones. To the second class the countries with the value of taxonomic measure of development above mean value for all groups were assigned. To the third class were assigned those with the values of this measure below the mean value.
To analyze the relation between the position taken by countries in each rankings (social, economic, environmental and financial classifications) the Kendall τ correlation coefficients was calculated according the following formula [129]:
τ = P Q P + Q + T ) · ( P + Q + U )
where: p—the number of correctly-ordered pairs, Q—the number of incorrectly ordered pairs, T—the number of ties in 1st ranking, U—the number of ties in 2nd ranking.
The basis of its calculation is the difference between the probability that two variables are arranged in the same order (for observed data) and the probability that their order differs, which was proposed by Kendall (1938) [130] and requires variable values to be ordered (variables must be measured at least on the ordinal scale). This coefficient takes values from the range <−1, 1>. The value 1 means full agreement; value 0 does not match the orderings, while the value-1 means the total contradiction. The Kendall factor indicates, therefore, not only the strength, but also the direction of dependence. It is a great tool to describe the similarity of the ordering of a data set [131,132,133].
The results of the relative transformation of indicators were used in the next stage to compare the EU countries according their socio-and economic development. For this purpose the multi-criteria taxonomy was applied. In this method, the following procedure is required [134,135,136]:
  • In the first step DK distance matrices (based on Euclidean distance) are defined for each of the distinguished classification criteria of K l ( l = 1 , , r ) .
  • A threshold value is defined for distance d * . The value is usually defined in accordance with the following formula:
    d * = min i max j { d i j }
  • For each classification criterion, CK affinity matrix of (n x n) dimension is defined, whose elements c i j K ( i , j = 1 , , n ) are equal to:
    c i j K = 1   for   d i j d *
    c i j K = 0   for   d i j > d *
    If inequality d i j d * is satisfied, the objects designated as i and j are deemed similar in terms of the examined criterion, if, however, an opposite condition is satisfied, the relevant objects are treated as dissimilar, thus the affinity measure of c i j will equal zero.
  • The final C (n × n) affinity matrix is determined among the analysed units. Cij elements of C matrix are equal to the product of relevant elements of CK matrix for all the analysed criteria, i.e.:
    c i j = K = 1 r c i j K
It means that c i j = 1   ( i , j = 1 , , n ) , if each of c i j K elements corresponding to it in CK matrices is equal to one, and c i j = 0 , if at least one of the c i j K elements corresponding to it is equal to zero. According to the above, two objects are considered to be similar to one another simultaneously in terms of all the criteria, if they are similar to one another separately in term of those individual criteria. The adoption of a given algorithm may lead to determining a large number of small sized groups (one-and two-elements groups) [136].
Groups of similar elements (in the paper; countries) can be classified on the basis of vector elimination method [134,137]. A starting point for the method is a change of final C(n×n) affinity matrix into a C*(n×n) dissimilarity matrix. The course of the aforementioned method is as follows:
(a)
on the basis of C* matrix, a c0 column vector is created with n components, each of which is a sum of the previous row of that matrix;
(b)
the row is eliminated from C* matrix along with a corresponding column for which c0 vector component has a maximum value; if c0 vector contains several components whose value reaches maximum, such a row and column are eliminated, for instance, the one of the lowest or the highest number;
(c)
the activities presented in sub-points (a) and (b) are repeated until such time when c0 vector components are equal to zero;
(d)
the objects corresponding to the rows and columns that have not been crossed out and still remain in C* matrix form the first sub-group;
(e)
C*(1) matrix and c0 (1) vector are created for the remaining (eliminated) objects, then using the procedure described in sub-points (a) through (d) we arrive at subsequent groups of objects similar in terms of their structure, and the procedure ends once all the elements from a basic set have been grouped.

4. Research Results and Discussion

Table 5, Table 6, Table 7 and Table 8 present the results of classification separately for each analyzed scope: economic, social, environmental and financial ones in 2007, 2013 and 2016.
In accordance with the adopted assumptions, the countries achieving lower ratings of the relative taxonomic measure of development occupy higher positions in the created rankings. In all rankings, the following countries were in top positions:
(a)
in the area of economic development: Denmark, Sweden, and the Netherlands or Germany;
(b)
in the area of social development most frequently: Sweden, Finland and the Netherlands (in 2007) or Denmark (in: 2013 and 2016);
(c)
in the area of environmental development: Denmark, Sweden Austria (in 2007) and Latvia (in: 2013 and 2016);
(d)
in the area of financial development: Denmark, Sweden and the Netherlands.
It is clear that in the case of Scandinavian countries one can speak of permanent separation of economic growth from its negative impact on the natural environment. Such dependencies are no longer so obvious in the case of other EU countries belonging to the OECD. Therefore, attention need to be paid to the most economically developed countries in Western Europe, i.e., Belgium, Germany, Luxembourg, the Netherlands and the United Kingdom, whose high rankings in the case of economic, social and very often also financial results correspond to much worse results in the case of environmental development. Such relations have already been observed in the earlier works of the authors [116,128,138]. They clearly show that simultaneous development in all areas at the same level is difficult to achieve in practice. This is also confirmed most often by worse results in terms of economic and social development and much better in the case of the environmental area in the case of countries located in Southern and Eastern Europe, including: Greece, Hungary, Portugal, and Poland. These are economically less developed countries, at the same time causing less pressure on the natural environment.
This also draws attention to the lack of changes in the classification results in the last rankings positions in case of the financial scope. In all rankings, the last three places were occupied by: Poland, Belgium and Luxembourg. Particularly surprising is the appearance of a country like Luxembourg in this group, which is indicated as one of the financial centers in Europe.
The similarity of the results achieved is also visible, depending on the geographical location of the EU countries belonging to the OECD included in analysis. The similar results of Scandinavian countries or countries located in Eastern and Southern Europe are confirmed. The geographical proximity of these countries has a significant impact on the positions they achieve in the rankings.
The results of the classification of EU countries belonging to the OECD in the analyzed period are basically similar to each other, which is also confirmed by the Kendall τ correlation coefficients assigned to the rank of countries in subsequent years (Table 5, Table 6, Table 7, Table 8, Table 9 and Table 10).
In 2007, only in the case of economic and social areas, the average dependence between the classification results was identified. The result of this kind should not come as a surprise. They also repeat in the case of rankings from subsequent years. As a rule, economic development causes similar changes in social development. The obtained results confirm the previously observed lack of dependence between ranking positions in the economic and environmental areas. The relationship between these areas basically does not occur.
The previous considerations present the results of classification of EU countries belonging to the OECD separately due to economic, social, environmental and financial aspects. In order to assess the situation of the analyzed country group, from the economic, environmental, social and financial point of view, a multi-criteria taxonomy was applied. This method allows to analyse the obtained results as the one data set. On the basis of 64 features describing development in the economic (13 features), social (28 features), environmental (8 features) and financial (15 features) areas, 7 typological groups were obtained in 2007 and 2013 and 8 groups in 2016 (Table 11).
The largest group is the first one, in which, depending on the analyzed year, consist of 11–13 EU countries, while the eight of them did not change their positions in the subsequent years. Noteworthy is Belgium, which in 2013 created a one-piece cluster, and in the remaining years was included in the first group. A similar situation applies to the United Kingdom-in 2002 it created one-element cluster, and in the remaining years belonged to the first group. Finland and Italy also moved between the first and the second group. Out of the 23 surveyed countries, only eight in all the examined years were included in the same, first typological group. They were the four countries of Western and Northern Europe (Austria, Denmark, the Netherlands, Sweden), three located in the east of Europe (the Czech Republic, Hungary, and Slovakia), and one from the south of Europe (Slovenia).
It is worth taking a closer look at which features had the greatest impact on the allocation of the analyzed countries to the designated typological groups. In the subject literature [107] it is pointed out that very often the division of objects into groups is affected by a limited number of indicators whose level clearly differentiates the examined objects. In order to determine which indicators had the greatest impact on the classification results, a measure (11) was calculated according to the following formula:
ω j = V j j = 1 m V j · 100 %
where: Vj—the coefficient of variation calculated for the j-th diagnostic feature;
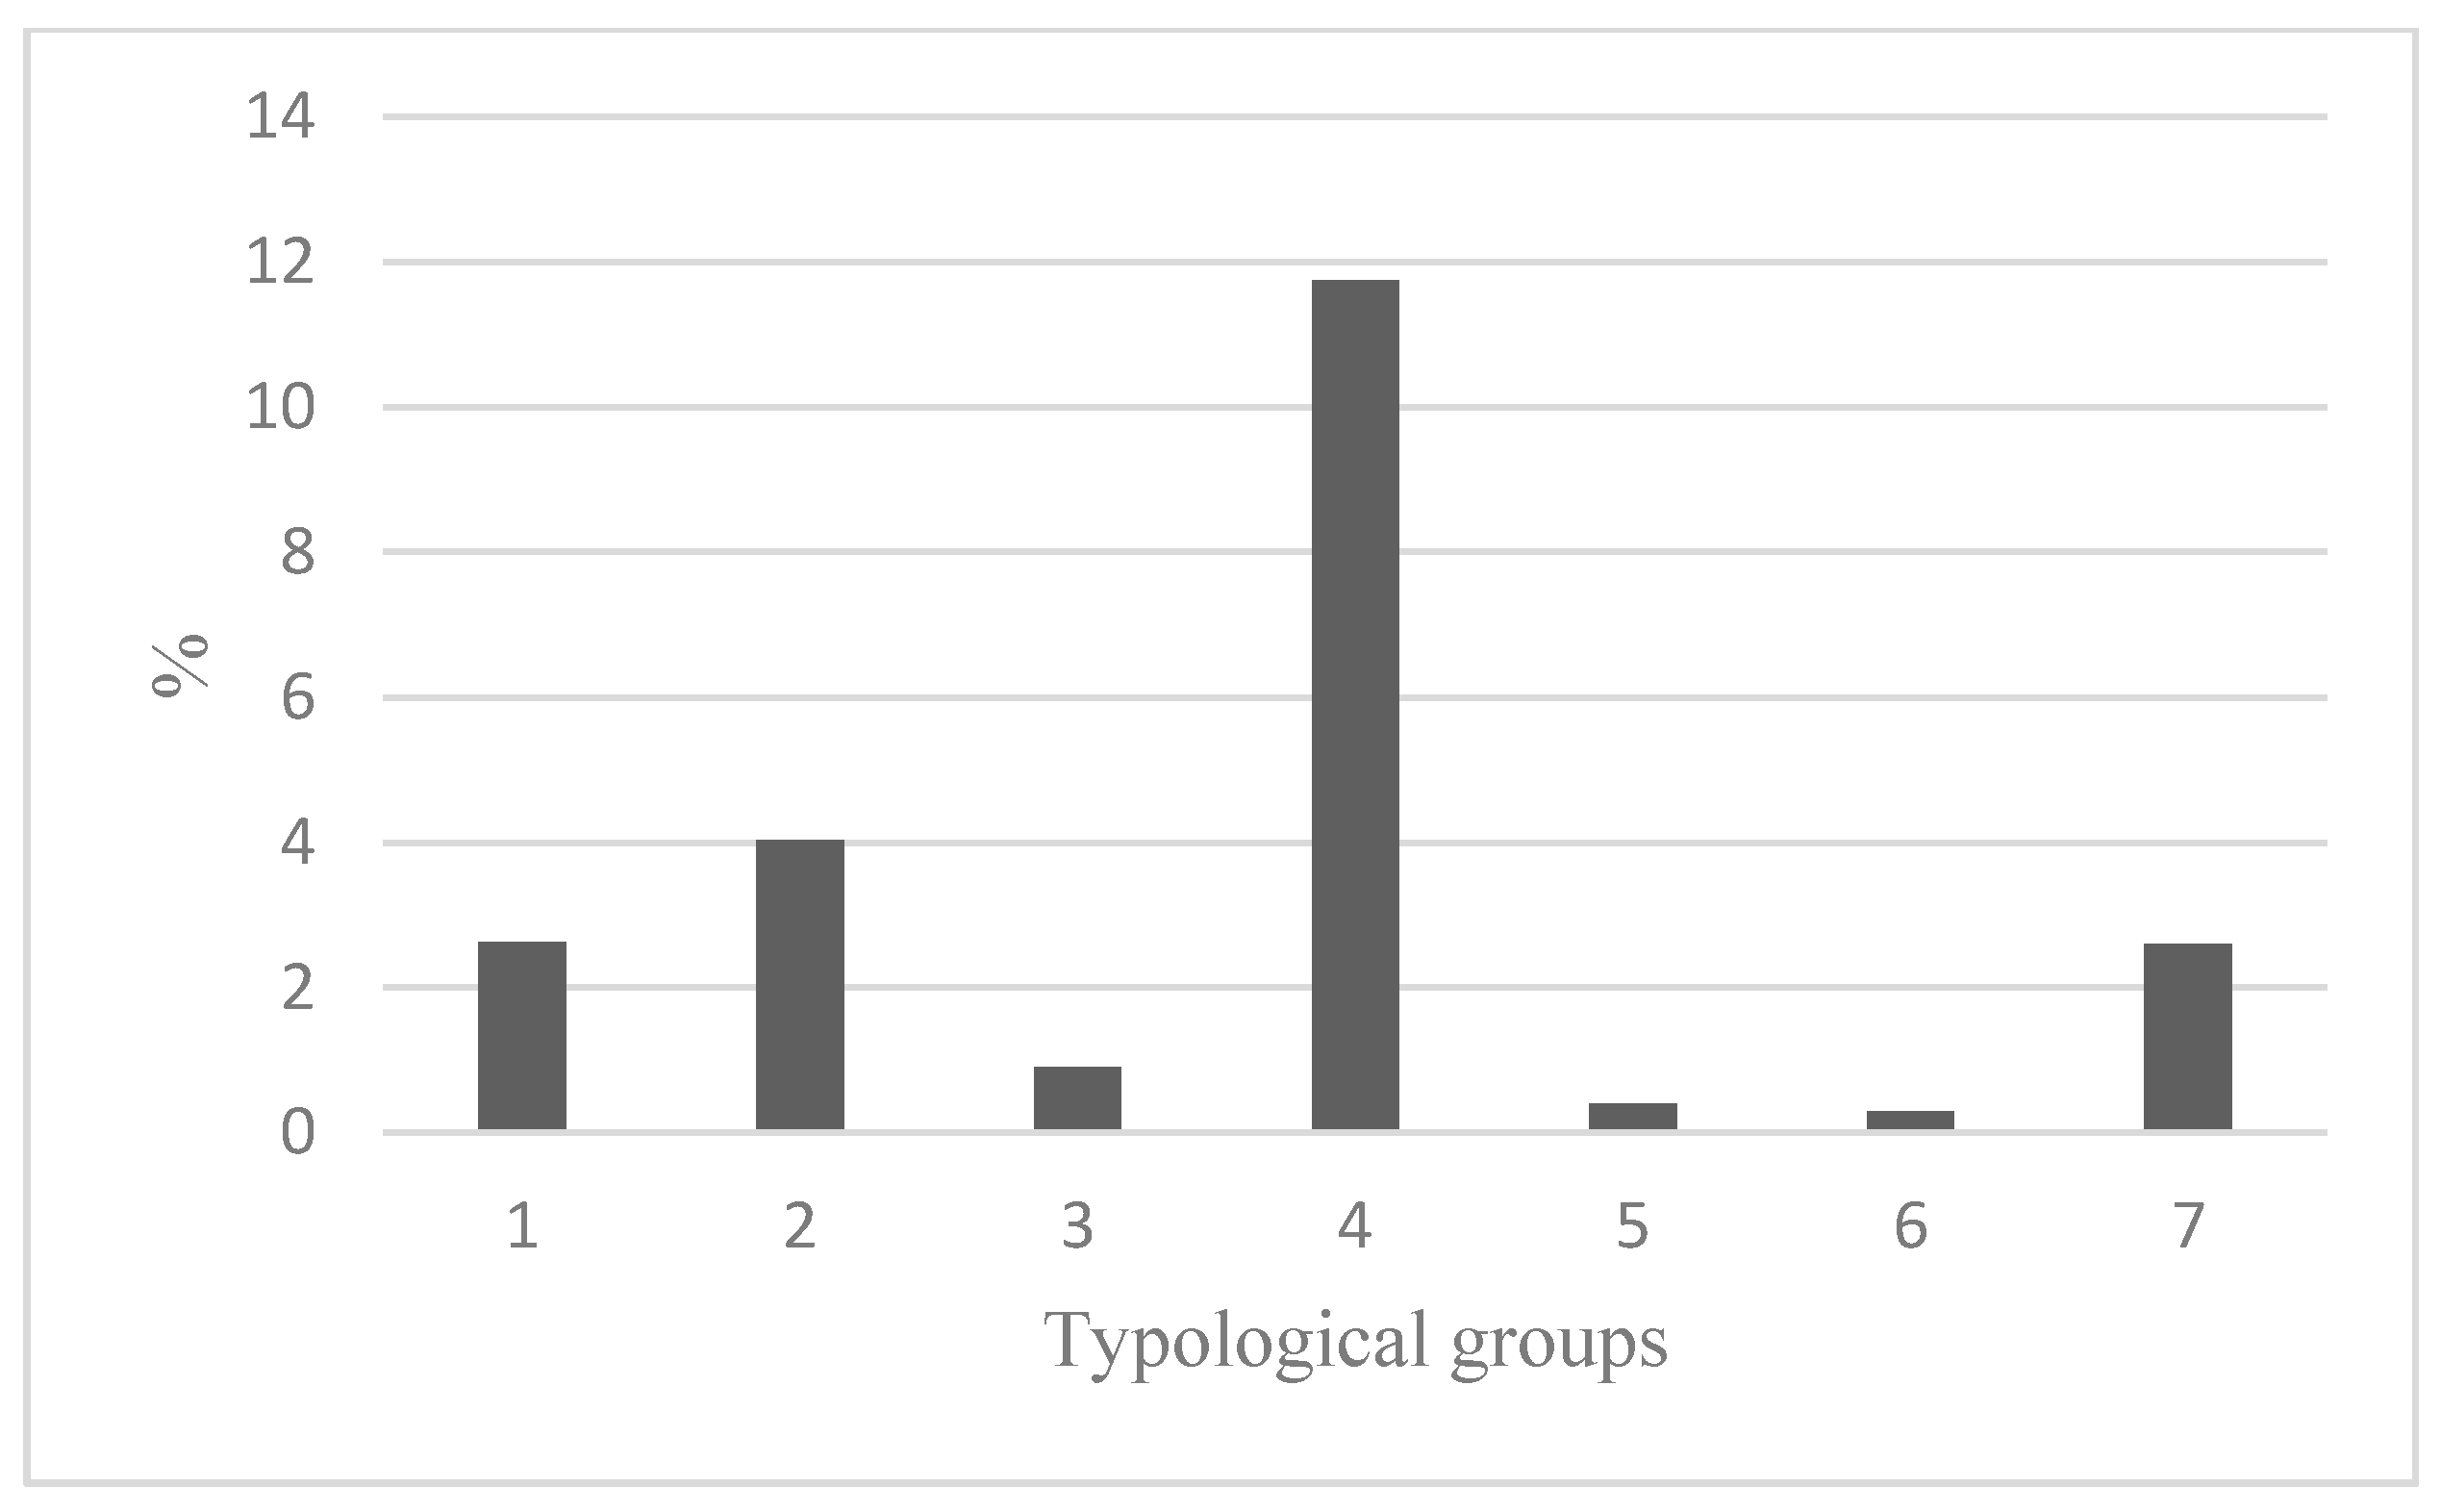
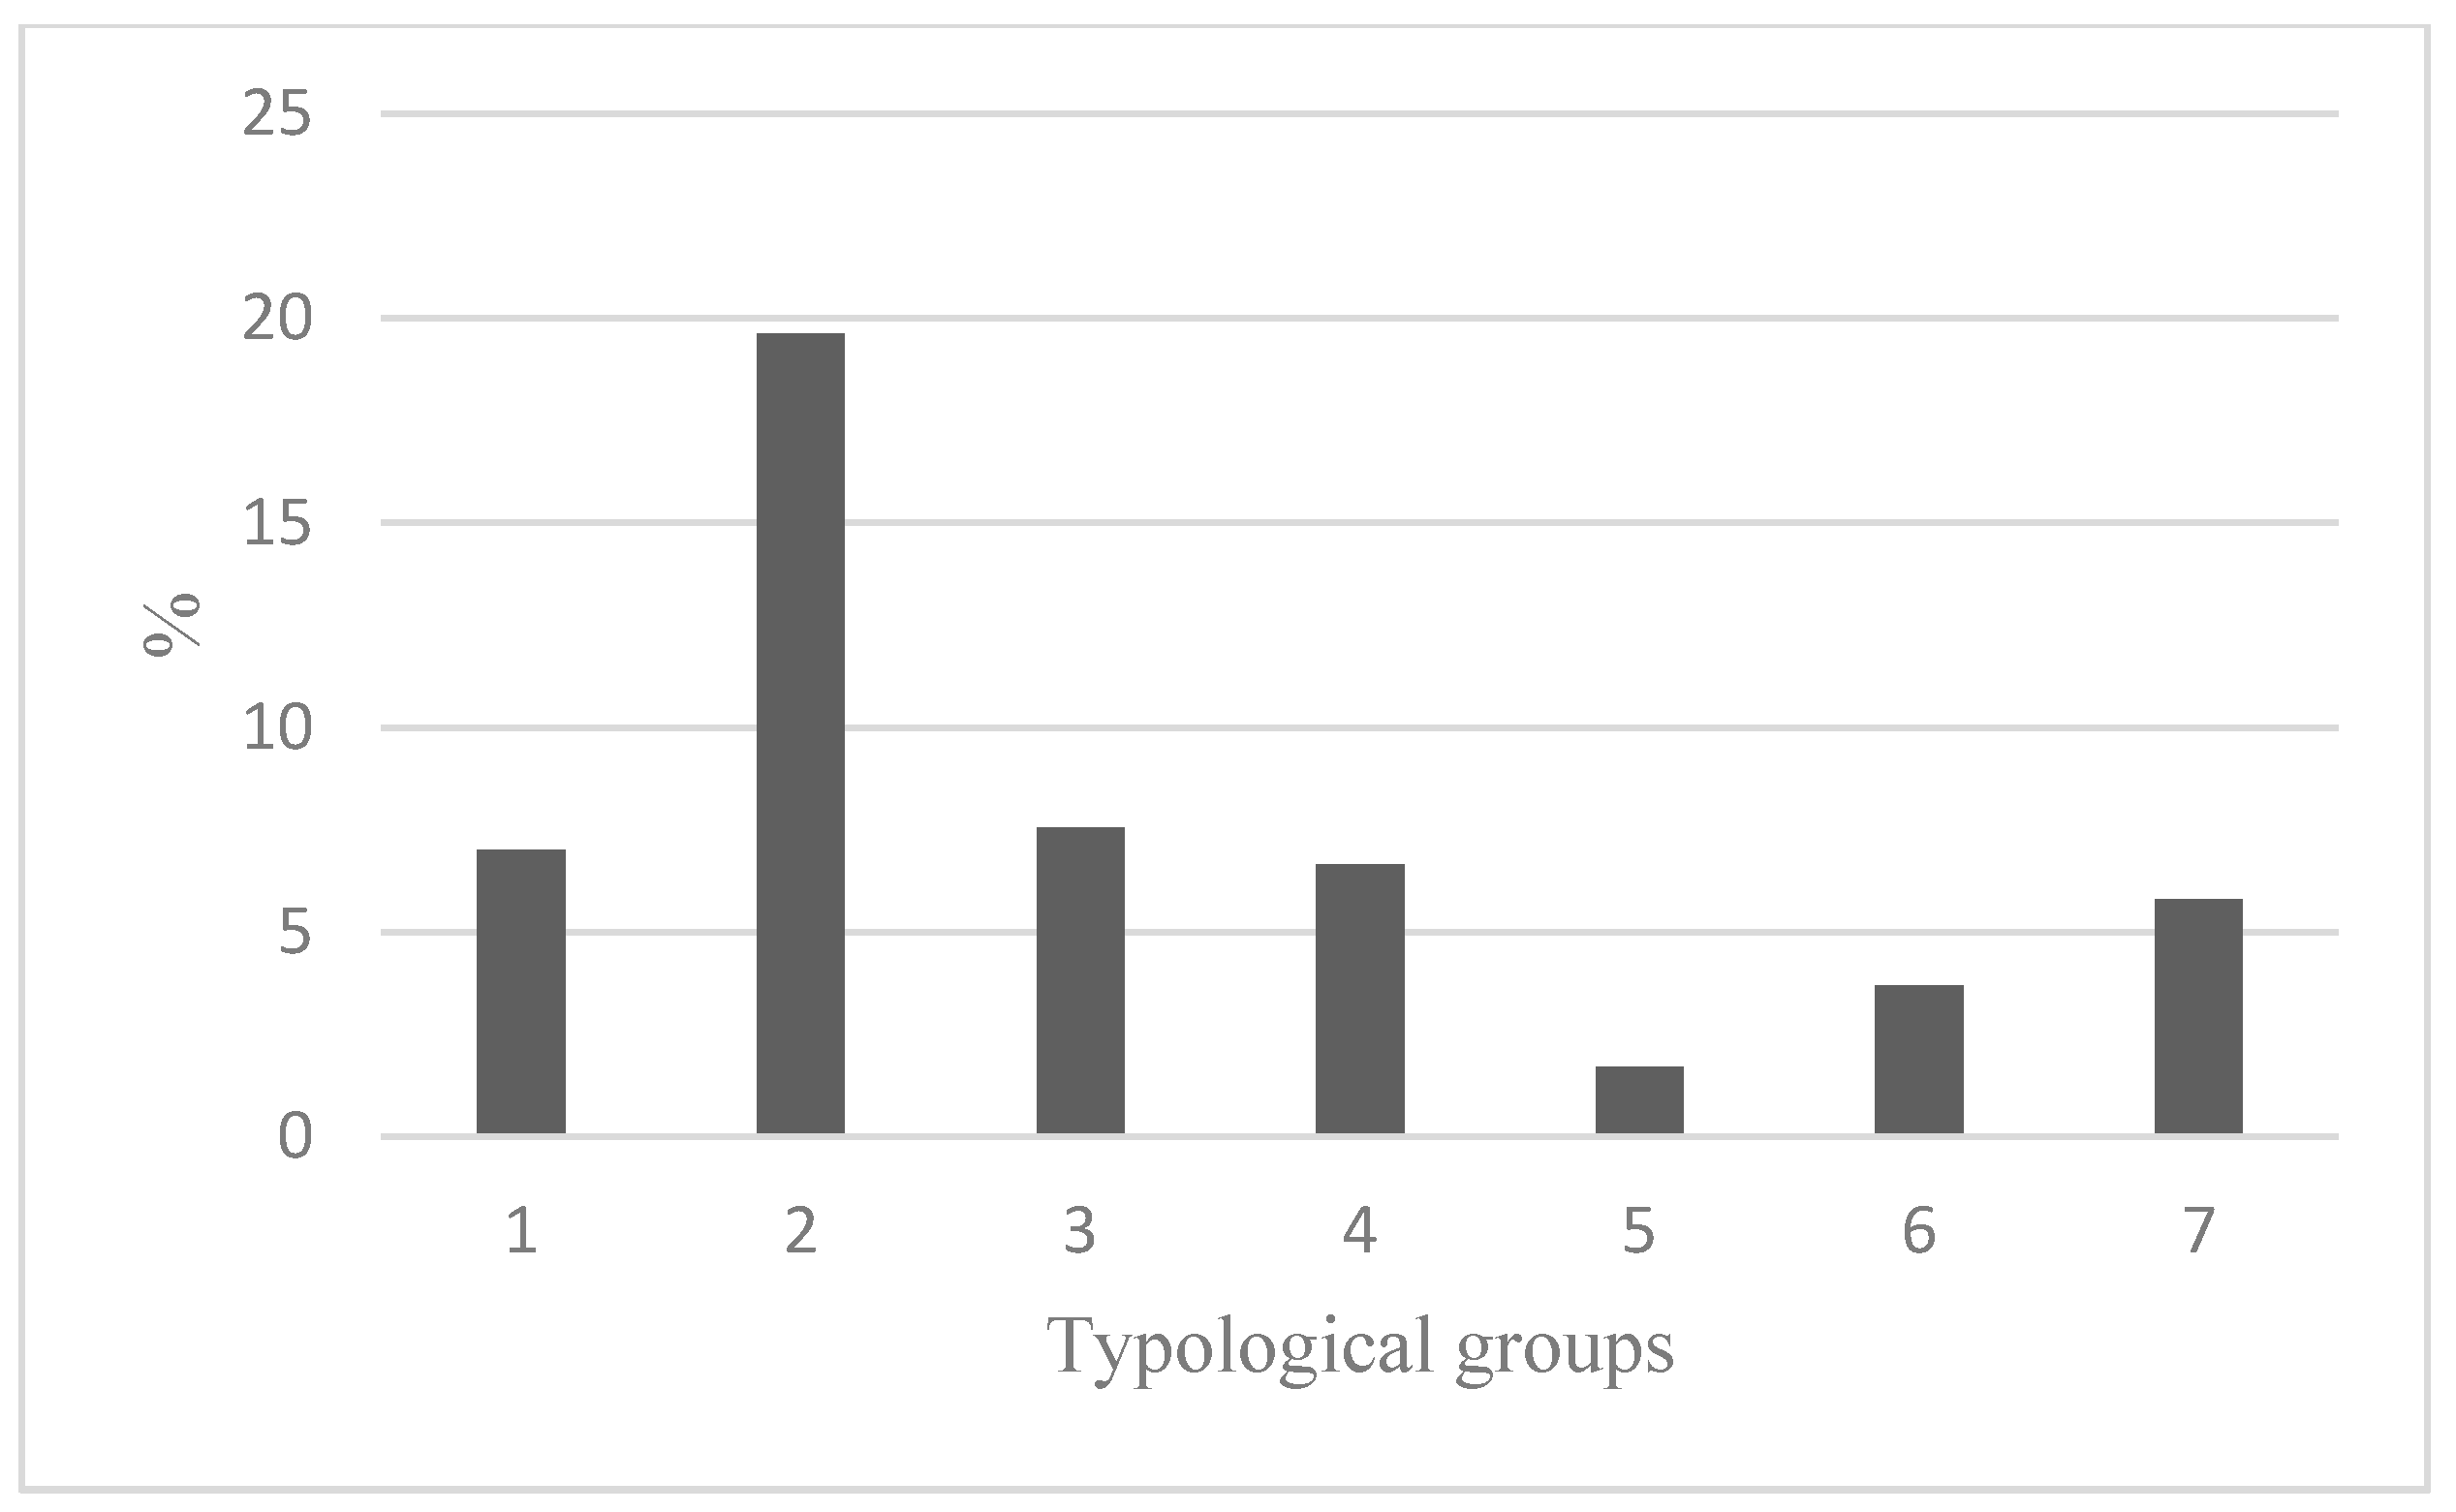
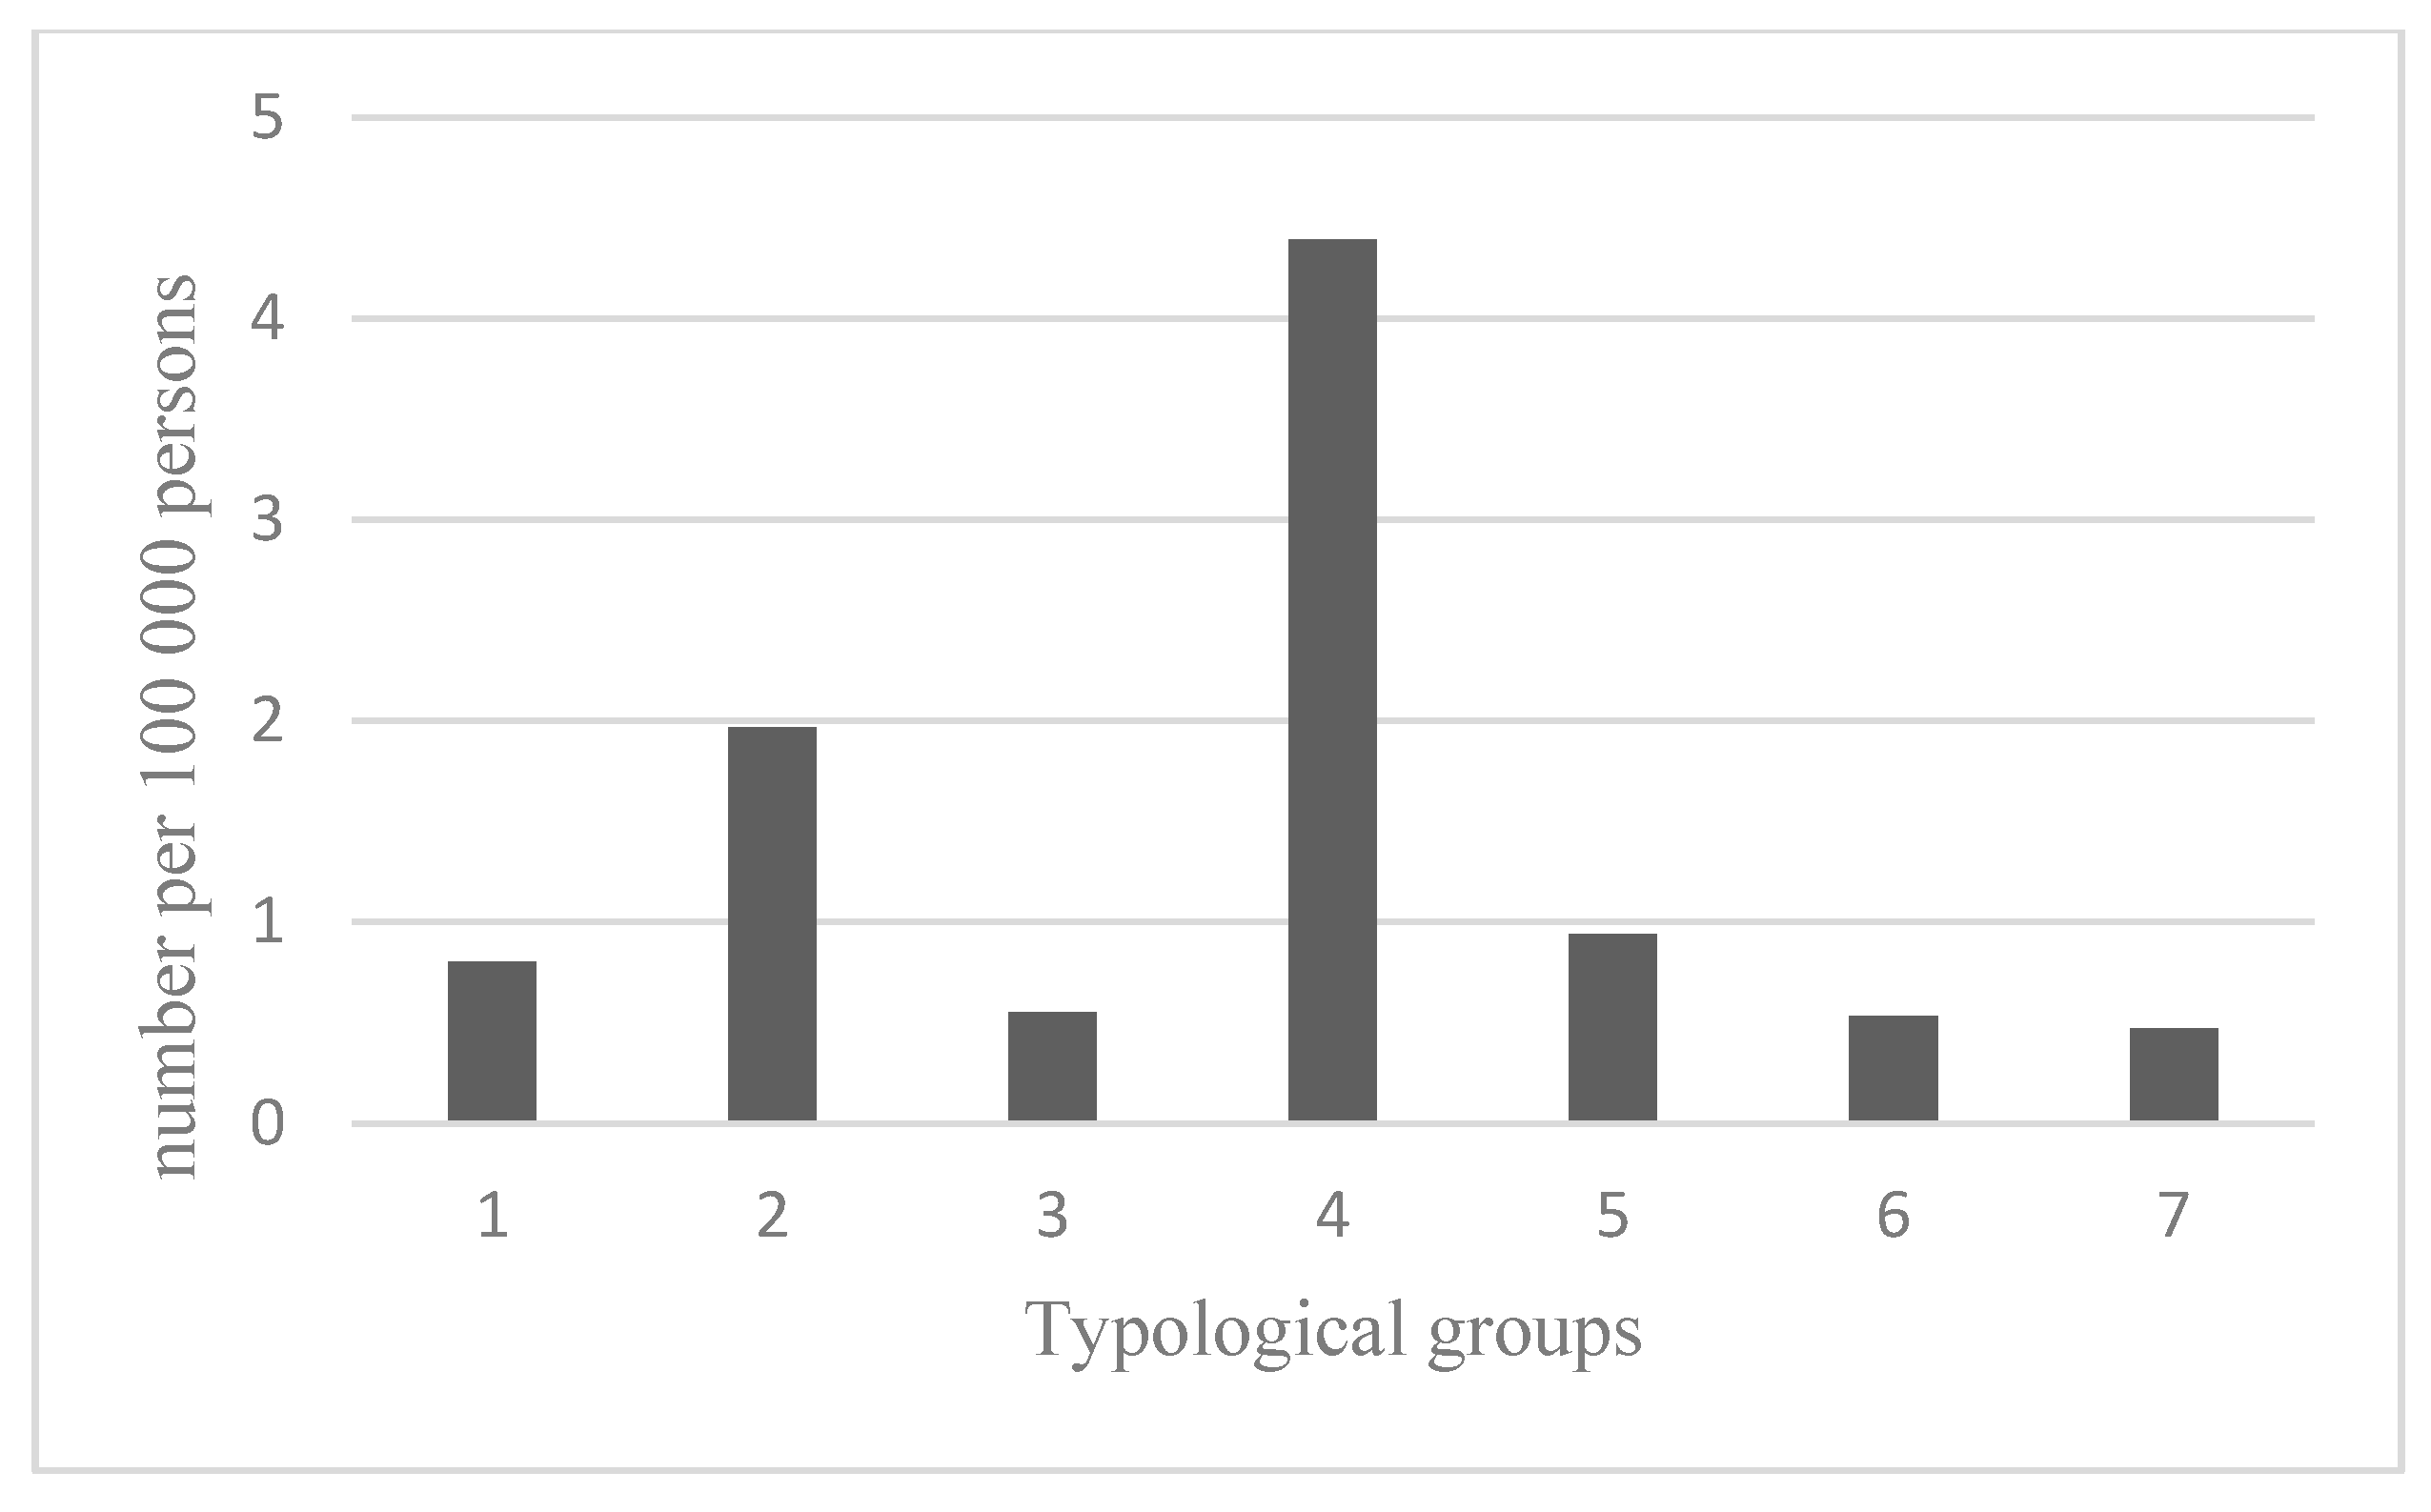
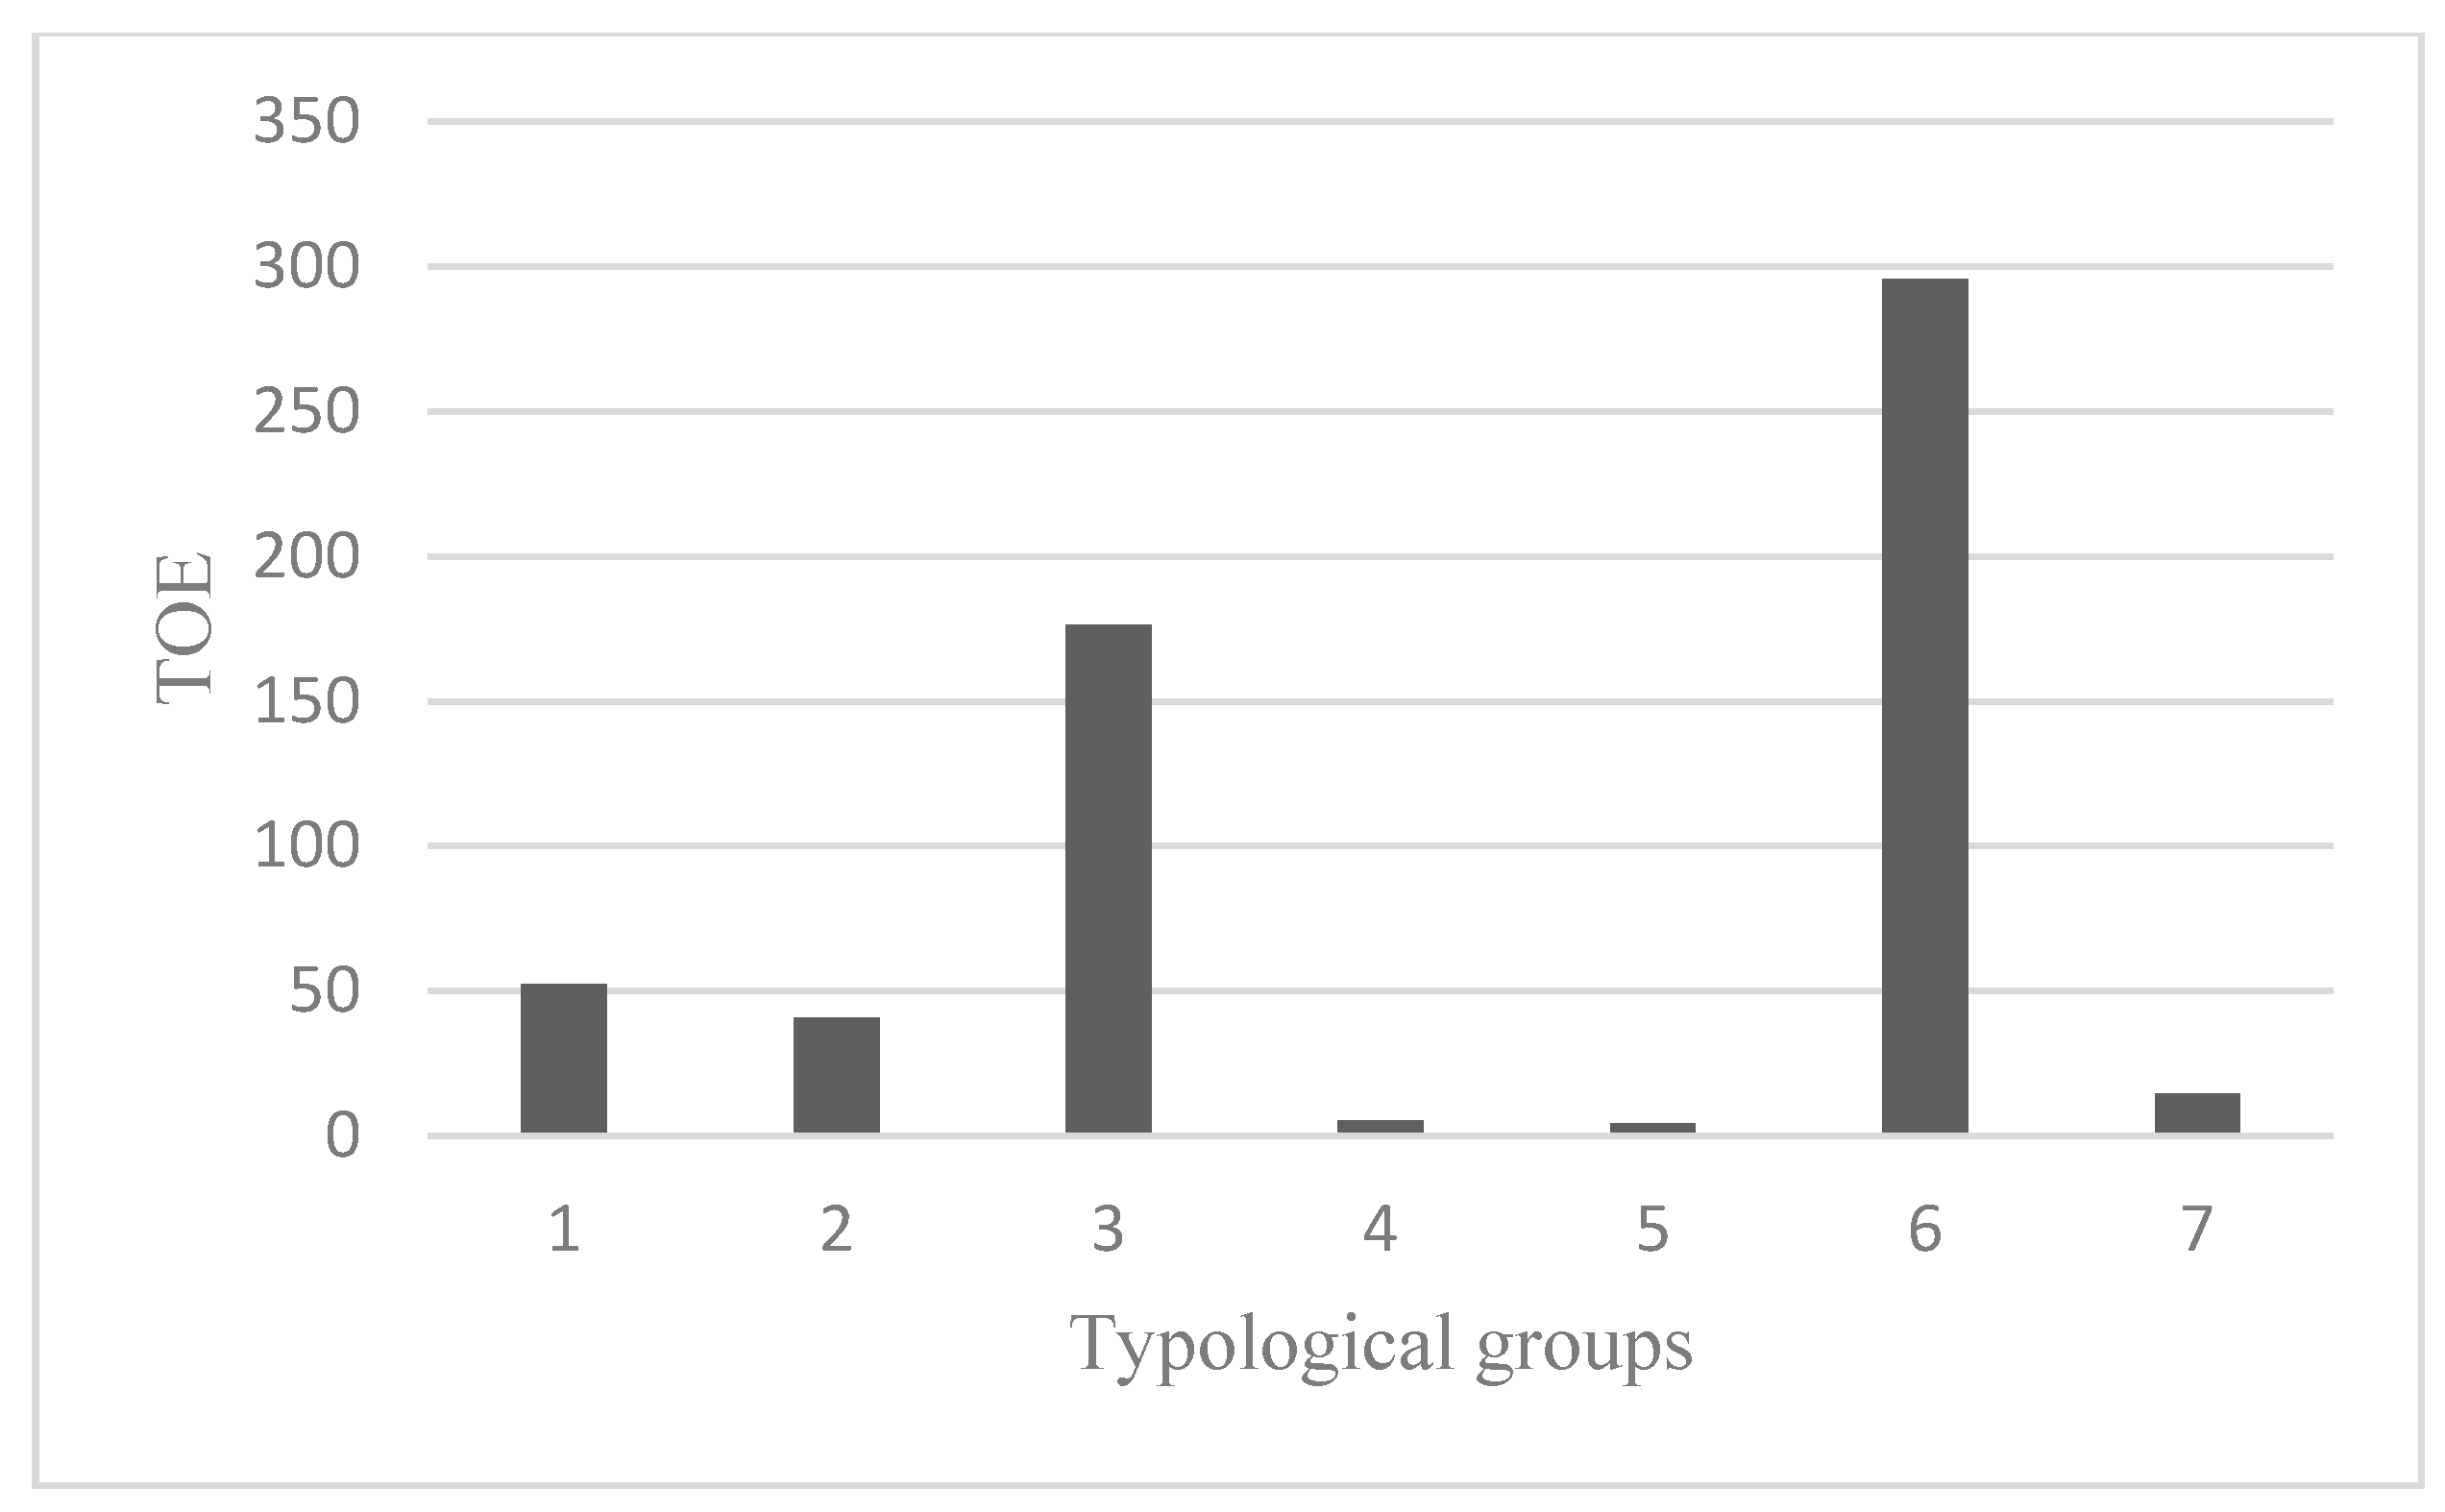
This measure could be interpreted as weights defining the relative importance of individual indicators. It turned out that in the study of the level of sustainable development of OECD countries in Europe, the following four indicators are the most important in all examined years: X3.10-self-reported unmet need of medical care by a detailed reason, % of population aged 16 and over, too expensive or too far to travel or waiting list, X3.15 - population unable to keep home adequately warm, % of population, X3.22 - death rate due to homicide, number per 100,000 persons, X2.2 - primary energy consumption equivalent (TOE). The share of each of them in the overall volatility of all ratios exceeded 3%, while the share of almost 70% of the ratios did not exceed 2%. In order to show the differences in the level of the aforementioned features, average values in groups were calculated in particular groups and are presented in Figure 1, Figure 2, Figure 3 and Figure 4.
According to Figure 1, Figure 2, Figure 3 and Figure 4, the results for the individual, analyzed groups are significantly different. A detailed analysis of the average level of diagnostic features in individual groups may be the basis for explaining why, for example, in the first group there were countries that would seem to have a different socio-economic situation, e.g., Austria and Greece. Their presence in the same group was caused mainly by the low level of such features as: death rate due to homicide, number par 100,000 persons, primary energy consumption, Million tonnes of oil equivalent (TOE), Income from natural resources, percent of GDP, Agricultural factor income per annual work unit (AWU), chain linked volumes, and the low level of features: GDP, general government expenditure on social protection, % of GDP.
In the second group in 2016, there were three countries characterized by a very high (except Poland) level of the population unable to keep home adequately warm by population status, % of population, total and severely materially deprived people,%, and the lowest in comparison with other groups, the average levels of such traits as: self-perceived health, very good or good, % of population, final energy consumption in households per capita, kg of oil equivalent. France and Spain have created a two-element cluster due to the similar values of the majority of diagnostic characteristics accepted for the study, although significant differences are noted in some of the features. This applies to the following indicators: total involuntary temporary employment by sex, % of employees aged 20 to 73, housing cost overburden rate by poverty status, % of population (twice the rate for Spain), adult participation in learning by sex, % of population aged 25 to 70 (twice the rate for France), population unable to keep home adequately warm by poverty status, % of population, Total (twice the rate for Spain).
Another two-element group is Estonia and Latvia, countries for which the average levels of indicators adopted for the study significantly diverge from other groups. This applies to 18 features with the highest average values and thirteen with the lowest values.
The separation of Luxembourg was related to the fact that the majority of diagnostic features, which had the greatest discriminatory significance, were significantly different from the average level for the countries studied. In the case of some of the characteristics for Luxembourg, the lowest values were recorded among OECD countries, for example, such features as: population unable to keep home adequately warm by poverty status, % of population, primary energy consumption, Million tonnes of oil equivalent (TOE), Government support to agricultural research and development, euro per inhabitant. Other indicators for this country were the highest, such as real GDP per capita, chain linked volumes (2010), euro per capita, people killed in accidents at work, number per 100,000 employees, ammonia emissions from agriculture (source: EEA), kilograms per hectare, % of gross national income (GNI). According research carried out by Guijarro and Poyatos (2018) Luxemburg is one of the best performing countries regarding the sustainable development [139].
In a similar way the other one-element clusters may be analyzed. Germany ranked in the sixth group in the case of 13 diagnostic features differed in plus from the other groups, and in the case of six features in minus. In the case of Ireland, such discrepancies concerned 16 indicators with the lowest values and five with the highest values.
When summarizing the research results, the attention is drawn to the dominant position of Scandinavian countries as leading countries in the field of sustainability. This finding is also reported by Bluszcz et al. (2016), Bujanowicz-Haraś et al. Filip et al. (2014) [140,141,142]. These countries are an example of countries implementing postulates of sustainable development, which is reflected in every pillar of sustainable development: economic, social and environmental. Interestingly, these are not the countries with a large financial market (inter alia capitalization, financial assets to GDP) in comparison with the biggest European financial centers (London, Luxemburg, Frankfurt, Amsterdam, Paris, Brussels, Dublin, Geneva). This fits in with the conclusions of Goldsmith’s research [143] which indicated that economic policy should focus less on the dilemma if within a given country a market-oriented or a bank-oriented system dominates, and focus more on the legal system and relevant legal regulations as well as on specifying reform directions in the result of which actions will be initiated to stimulate the development and effective functioning of capital markets as well as banks. The financial system in Scandinavian countries is characterized by a high level of sustainability due to the adopted solutions and instruments effectively financing the goals of sustainable development. Scandinavian countries are countries characterized by the low level of income inequality, low level of deficit and public debt, they are part of balanced debt management, a developed system of green taxes and support for companies and households in access to preferential financing of modern environmentally friendly solutions. Our finding is in line with research results presented by Lin and Li (2011) [123], Scrimgeour et al. (2005) [144], and Fisher (2008) [145] that assume that sustainable public finance (especially environmental taxation) mitigate the impact of negative externalities (air pollution). At the same time, Scandinavian countries allocate significant public funds to finance pro-environmental solutions. Due to the fact that the financial (market and public) system is based on instruments supporting social and environmental development, it is a highly sustainable and effective financing system for sustainable development goals. Apergis et al. (2013) and Lee and Min (2015) declare research results that are coherent with our study [124,125]. On the other hand, leading financial centers (London, Frankfurt etc.) are located in countries with the highest greenhouse gas emissions, which results in a reverse relationship between financial development and environmental development in these countries. In addition, the great financial centers of Europe focus their activity on investment banking or financial engineering, which are more profitable and burdened with lower risk than financing the real sphere. Therefore, it can be concluded that the level of sustainability of the financial system is determined by the state policy which is responsible for legal regulations and the framework of the financial system [24,146,147].
Referring to external effects, the financial system should aim at sustainability, here as: (i) it is constantly exposed to market failures (which is associated with the first group externalities: externalities induced by market failures); (ii) state intervention includes to be aimed to fix on sustainable public policy (with sustainable public instruments as green taxes, CO2 limitation, low level of deficit and public debt, the legal system, et al.) and sustainable public finance (financial instruments, fiscal policy, management financial risk, et al.); (iii) development should be expected to push market toward internalizing externalities (sustainable private finance, as: effective functioning of capital markets as well as banks, et al.).

5. Conclusions

The research explains the link between sustainable finance and the three pillars of sustainable development and describes negative externalities from this point of view. The hypothesis assuming that there is an interaction between sustainable finance and negative externalities has been verified positively. In order to diagnose and explain the differences between EU countries in the traditional pillars of sustainable development: economic, social and environmental development and the authors’ new proposal, which implies including a sustainable financial pillar among them, the multi-criteria taxonomy was used. This method was applied to create typological groups within which the average values of the accepted diagnostic features were determined. On the basis of 62 statistical features characterizing development in the economic (12), social (28), environmental (7) and financial (15) scope, 7 groups of countries were obtained in 2007 and 2013 and 8 groups in 2016. A detailed analysis of the average level of diagnostic features in individual groups has become the basis for clarifying which indicators implicate the division of countries into specific groups. When analyzing Figure 1, Figure 2 and Figure 3, it should be noted that they include mainly indicators that can be classified as negative externalities.
The originality of the research consists in including in the analysis of the financial sphere variables representing sustainable finance and extending the classical approach based on economic variables in the assessment of financial development with variables representing the environmental and social aspect in finance. At the same time, the variables for researching the financial sphere were selected in such a way as to correspond with the public and commercial financial system. Such an approach is justified due to the relationships that occur between finances and negative externalities, which we tried to prove in the analyses. The authors would like to emphasize that in the literature there are not yet described any concepts for studying the links between the social, economic, environmental and financial development of the world’s countries. The grounds of this kind of research are established. Therefore, there are not enough comprehensive databases in this area. It is the main problem in the analyses related to these areas but this direction of the research seems to be inevitable. Research of this kind is a natural consequence of the development of knowledge and needs of countries in the world in the field of sustainable development.
The results of the study presented in the paper can be divided into two parts. The first one is devoted to the construction of the ranking of EU countries belonging to the OECD in each analysed area: social, economic, environmental and financial. In the second one, the results of correlations between considered areas and explanations of the main reasons influenced on the ranks of these countries are presented. The authors made efforts to explain which indicators had the most influence on the countries positions and its division into typological groups. Out of the 23 analyzed countries, only eight in all the examined years were included in the same, first typological group. The group included four countries of Western and Northern Europe (Austria, Denmark, the Netherlands, and Sweden), three located in the East of Europe (the Czech Republic, Hungary, Slovakia) and only one from the south of Europe (Slovenia). Countries ranked first in the rankings: Denmark, Sweden, and the Netherlands were characterized by sustainable development in all four researched areas.
As a result of the conducted analyses, it was shown that geographical location weighs on results. Similar results were obtained by Scandinavian countries or countries located in Eastern and Southern Europe. Most often, worse results in terms of economic and social development were observed, and much better in the case of the environmental area in the case of countries located in Southern and Eastern Europe, including Greece, Hungary, Portugal, and Poland. Countries that are less developed economically exert less pressure on the natural environment. An interesting observation resulted in the financial sphere where the effect of financialization on the countries’ places in the rankings was observed. The development of financial markets due to advanced financial engineering did not harmonize with economic and social development (e.g., Luxembourg). Nevertheless, in the analyzed period, research has shown that in most of the countries surveyed, the pressure is increasing and the natural environment also in the financial sector. It should be noted that the obtained results are the effect of the indicators used to show the current level of development of EU countries belonging to OECD in the areas of social, economic, environmental and financial development. The ordering of countries is not constant and this classification may be different if the final set of diagnostic indicators change.
Generally, research shows a preliminary tendency to include the financial area into the analysis of the impact of sustainable development on the public and market financial system. In the future, this trend, which has been demonstrated in the countries of Denmark, Sweden, and the Netherlands, can have a strong occurrence in other countries. Externalities affect resource allocation because the market fails to fully price the external effects generated by some economic activities. The existence of externalities will thus lead to a sub-optimal allocation. Too many resources are used in processes conferring uncompensated social costs, suboptimal allocation of financial resources within the financial system, may cause financial crises, undermine the economy. The important role of finance in eliminating the effects of negative externalities is noticeable, especially in the social and environmental dimension. As a result of the research, a strong positive relationship was found between economic development and social development, economic development and environmental development as well as the sphere of sustainable finances and economic, social and environmental development.
Although our research has shown that there are financial systems (Scandinavian countries) characterized by a high level of sustainable development thanks to the adopted solutions and instruments that effectively finance the goals of sustainable development, the other countries in the global perspective should strive to implement adequate instruments for financing the objectives sustainable development. Globally, after the financial crisis countries should strive to create policies that favor sustainability, and in particular to achieve a low level of income disparities, low deficit and public debt as part of sustainable debt management, a developed green tax system, green investment and business support and households in access to preferential financing for a modern, environmentally friendly solution. In global terms, a common policy is needed that will help smoothly eliminate the effects of negative externalities. There is a significant and important role of the finance and financial systems. Thanks to financial instruments, the possibility of elimination or mitigation the effects of negative externalities is noticeable, especially in the social and environmental dimension. In global terms, the period of economic development favors the impact of environmental development through the financial system (a series of innovative instruments) as well as social and environmental development.
It is worth addressing actual policy recommendations and challenges referring to sustainability and finance. Our paper fills the significant gap in the current research related to the issues of financing sustainable development and negative externalities. The challenges include: balancing sustainable development dimensions which are typically focused on the long term with the typically short-term profit focus of conventional finance. The difference is crucial for efficiency of financing for sustainable development as there is a need to identify and evaluate negative externalities [9]. A few suggestions can be made to include the sustainable development perspective into finance: (1) internalization of externalities in the calculation of an investment (i.e., in a company’s present value); (2) assigning a long-term horizon to investments, also as a necessity for maintaining the prospect of safeguarding financial capital for the future; (3) progressive substitution of financial ratios with sustainability ratios; (4) a changing perspective on the connotation of financial profits [9]. On the other hand, there are many limitations that prevent effective use of finances to provide sustainability, referring especially to designing sustainable financial systems [111]. There are three scopes that need to be improved discussing in the literature review: (a) measurement (better indicators and tools for assessing the sustainable development goals (SDGs); (b) policy reforms to create benefits for financing and investing in sustainable development; and (c) improving communications among stakeholders in order to better match supply and demand for the sustainable financing of SDGs [148].
The authors see the need for further in-depth studies of the analyzed phenomenon, especially in the context of the impact of individual financial sector instruments on sustainability. The next step of these analyses could be devoted to the more explanatory analyses which could describe the causality of the obtained rankings and division into typological groups. This kind of analysis can be found in these papers: Li et al. (2019), Ferrero-Ferrero et al. (2016) and Crifo et al. (2015) [149,150,151]. In order to assess the situation in the future of the analyzed country group, from the economic, environmental, social and financial point of view, it is necessary to develop a uniform approach and uniform data in order to be able to assess the sustainability of the financial system. The authors encountered a number of difficulties in the selection of data characterizing the country group, from the economic, social and financial point of view. While the data is available for economic, environmental, and social aspects, the data for the financial pillar is still being discussed in many countries and by many researchers. For EU countries belonging to OECD, there are no uniform data and indicators in the long-term (e.g., 10 years). They change in the long-term and, for example, the EU recommends new indicators every few years, just as the authorities of individual countries do. Other researchers also show data problems and the need to verify them in the future [149,152]. This situation has forced us (despite the fact that different research discuss different indicators) to choose the most universal indicators and data. Our proposal is universal for the countries indicated, as comparisons can be made on that basis, and the data in the analyzed period did not change. Therefore, a future interesting research would be to consider a wider time window in order to observe and identify the indicators and effects of negative externalities [153]. We accept our measurement proposal for the financial scope as a benchmark for testing other studies. This will provide the basis for determining whether there will be any positive changes in the elimination of negative externalities in the future. Our concept should be verified in the next empirical review based on data in the future. It will allow you to conclude about factors affecting the stability of the financial system and the relationship between the economic and financial point of view. The economy and the sustainability financial system needs the actually data about effects of negative externalities. In our future study we also would like to extend research carried out by Zorlu (2018), especially the problem of incorporating ESG risks to global monitoring of financial stability and stress tests [154]. Incorporating ESG factors by financial institutions’ decision making process is not a new concept. The United Nations Environmental Programme Financial Initiative has required its implementation since 1992 [155], and in many documents it is still there as a recommendation and as a challenge for financial markets [156].

Author Contributions

These authors contributed equally to this work.

Funding

This research received no external funding.

Acknowledgments

Research results presented in this paper are an element of research project implemented by the National Science Center Poland under the grant OPUS13 no UMO-2017/25/B/HS4/02172.

Conflicts of Interest

The authors declare no conflict of interest.

References

  1. Von Carlowitz, H. Sylvicultura Oeconomica oder Hauswirthliches Nachricht und Naturmässige Anweisung zur Wilden Baum—Zucht; Verlag Kessel: Remagen, Germany, 1732. [Google Scholar]
  2. Grober, U. Deep Roots: A Conceptual History of “Sustainable Development“ (Nachhaltigkeit); WZB: Berlin, Germany, 2007. [Google Scholar]
  3. UN General Assembly. Transforming Our World: The 2030 Agenda for Sustainable Development. 2–15. Available online: https://sustainabledevelopment.un.org/post2015/transformingourworld (accessed on 9 February 2019).
  4. Soppe, A. Sustainable corporate finance. J. Bus. Ethics 2004, 53, 213–224. [Google Scholar] [CrossRef]
  5. Jeucken, M. Sustainable Finance and Banking: The Financial Sector and the Future of the Planet; Earthscan Publications Ltd.: London, UK, 2001. [Google Scholar]
  6. Arestis, P. Financial liberalization and the relationship between finance and growth. In A Handbook of Alternative Monetary Economics; Arestis, P., Sawyer, M., Eds.; Edward Elgar Publishing: Cheltenham, UK; Northampton, MA, USA, 2006; pp. 346–364. [Google Scholar]
  7. Fullwiler, S.T. Sustainable Finance: Building a More General Theory of Finance. 2015. Available online: http://www.binzagr-institute.org/wp-content/uploads/2015/04/WP-106.pdf (accessed on 25 April 2019).
  8. Rebai, S.; Azaiez, N.; Saidane, D. Towards Sustainable Finance Conceptualization. In Corporate Social Responsibility, Ethics and Sustainable Prosperity; Boubaker, S., Nguyen, D.K., Eds.; World Scientific: Singapore, 2019; pp. 363–386. [Google Scholar]
  9. Pisano, U.; Martinuzzi, A.; Bruckner, B. The Financial Sector and Sustainable Development: Logics, Principles and Actors; ESDN Quarterly Report No 27; European Sustainable Development Network: Vienna, Austria, December 2012. [Google Scholar]
  10. Tamazian, A.; Rao, B.B. Do economic, financial and institutional developments matter for environmental degradation? Evidence from transitional economies. Energy Econ. 2010, 32, 137–145. [Google Scholar] [CrossRef] [Green Version]
  11. Shahbaz, M.; Solarin, S.A.; Mahmood, H.; Arouri, M. Does financial development reduce CO2 emissions in Malaysian economy? A time series analysis. Econ. Model. 2013, 35, 145–152. [Google Scholar] [CrossRef] [Green Version]
  12. Heal, G. Valuing the Future: Economic Theory and Sustainability; Columbia University Press: New York, NY, USA, 1998. [Google Scholar]
  13. Matthes, J. Framing-Effekte. Zum Einfluss der Politikberichterstattung auf die Einstellungen der Rezipienten; Verlag Reinhard Fischer: München, Germany, 2007. [Google Scholar]
  14. Jones, R.; Dowling, P. Sustainability, Externalities and Economics: The Case of Temperate Perennial Grazing Systems in NSW. Economic Research Report; NSW Department of Primary Industries: Orange, Australia, 2004. Available online: http://www.agric.nsw.gov.au/reader/10550 (accessed on 25 April 2019).
  15. Kates, R.W.; Parris, T.M.; Leiserowitz, A.A. What is sustainable development? Goals, indicators, values, and practice. Environ. Sci. Policy Sustain. Dev. 2005, 47, 8–21. [Google Scholar]
  16. European Commission. Impact Assessment Guidelines. 2005. Available online: https://ec.europa.eu/transparency/regdoc/rep/2/2005/EN/SEC-2005-791-2-EN-MAIN-PART-1.PDF (accessed on 25 April 2019).
  17. Strange, T.; Bayley, A. Sustainable Development. Linking Economy, Society, Environment; Organisation for Economic Cooperation and Development (OECD): Paris, France, 2008; Available online: http://www.greengrowthknowledge.org/resource/oecd-insights-sustainable-development-linking-economy-society-environment (accessed on 26 April 2019).
  18. Kuhlman, T.; Farrington, J. What is Sustainability? Sustainability 2010, 2, 3436–3448. Available online: https://0-www-mdpi-com.brum.beds.ac.uk/2071-1050/2/11/3436/pdf (accessed on 26 April 2019). [CrossRef] [Green Version]
  19. Alińska, A.; Filipiak, B.Z.; Kosztowniak, A. The Importance of the Public Sector in Sustainable Development in Poland. Sustainability 2018, 10, 3278. [Google Scholar] [CrossRef]
  20. Paul, J.; Liam, M. Domains of Sustainability. In Global Encyclopedia of Public Administration, Public Policy, and Governance; Farazmand, A., Ed.; Springer: Cham, Switzerland, 2016; pp. 18–68. [Google Scholar]
  21. Report of the World Commission on Environment and Development: Our Common Future. 1987. Available online: https://sustainabledevelopment.un.org/milestones/wced (accessed on 26 April 2019).
  22. Balestra, C.; Dottori, D. Ageing society, health and the environment. J. Popul. Econ. 2012, 25, 1045–1076. [Google Scholar] [CrossRef]
  23. Streimikiene, D. Natural and built environments and quality of life in EU member states. J. Int. Stud. 2014, 7, 9–19. [Google Scholar] [CrossRef] [PubMed]
  24. Tamazian, A.; Chousa, J.P.; Vadlamannati, K.C. Does higher economic and financial development lead to environmental degradation: Evidence from BRIC countries. Energy Policy 2009, 37, 246–253. [Google Scholar] [CrossRef]
  25. Formánková, S.; Hrdličková, A.; Grabec, T. Corporate Social Responsibility of Public Administration Through Eyes of Enterprises. Acta Universitatis Agriculturaeet Silviculturae Mendelianae Brunensis 2017, 65, 1901–1909. [Google Scholar] [CrossRef]
  26. Krajnc, D.; Glavic, P. Indicators of sustainable production. Clean Technol. Environ. Policy 2003, 5, 279–288. [Google Scholar] [CrossRef]
  27. Bennett, N.J.; Roth, R.; Klain, S.C.; Chan, K.; Christie, P.; Clark, D.A.; Cullman, G.; Curran, D.; Durbin, T.J.; Epstein, G.; et al. Conservation social science: Understanding and integrating human dimensions to improve conservation. Biol. Conserv. 2017, 205, 93–108. [Google Scholar] [CrossRef] [Green Version]
  28. Basiago, A. Economic, social, and environmental sustainability indevelopment theory and urban planning practice. Environmentalist 1999, 19, 145–161. [Google Scholar] [CrossRef]
  29. Scitovsky, T. Two Concepts of External Economies. J. Polit. Econ. 1954, 62, 143–151. [Google Scholar] [CrossRef]
  30. Allard, A.; Takman, J.; Uddin, G.S.; Ahmed, A. The N-shaped environmental Kuznets curve: An empirical evaluation using a panel quantile regression approach. Environ. Sci. Pollut. Res. 2018, 25, 5848–5861. [Google Scholar] [CrossRef] [PubMed]
  31. Hussen, A. Principles of Environmental Economics; Routledge: New York, NY, USA, 2005. [Google Scholar]
  32. Marshall, A. Principles of Economics; Macmillan and Co.: London, UK, 1922. [Google Scholar]
  33. Liu, Y. Research on the Negative Externalities and Compensation Mechanism of Coal Exploitation; Institute of Technology: Beijing, China, 2014. [Google Scholar]
  34. Sundaram, A.M. Measurement of Externalities for Renewable Energy Investment; Instituto Superior Técnico, Universidade de Lisboa: Lisboa, Portugal, 2016. [Google Scholar]
  35. Bator, F.M. The Anatomy of Market Failure. Quart. J. Econ. 1958, 72, 351–379. [Google Scholar] [CrossRef]
  36. Jing, W.; Sun, B. Study on the Source of Negative Externality in the Sharing Economy. In Proceedings of the ICCSE’18, 3rd International Conference on Crowd Science and Engineering, Singapore, 28–31 July 2018. [Google Scholar]
  37. Zhang, X. Research of China Systemically Important Banks Regulation of Negative Externalities; Shanxi University of Finance & Economics: Beijing, China, 2016. [Google Scholar]
  38. Smolyansky, M. Policy Externalities and Banking Integration; Finance and Economics Discussion Series 2016-008; Board of Governors of the Federal Reserve System: Washington, DC, USA, 2016. [Google Scholar] [CrossRef]
  39. Zhou, C. Empirical Study on the Economic Externality of Chinese Insurance Industry; Central South University: Changsha, China, 2014. [Google Scholar]
  40. Buchanan, J.M.; Stubblebine, C.W. Externality. Economica 1962, 29, 371–384. [Google Scholar] [CrossRef]
  41. Xu, Y. Public Choice Theory; Peking University Press: Beijing, China, 2006. [Google Scholar]
  42. Pigou, A.C. Economics of Welfare, 1st ed.; Macmillan Publishing: London, UK, 1920. [Google Scholar]
  43. Coase, R. The Problem of Social Cost. J. Law Econ. 1960, 3, 1–44. [Google Scholar] [CrossRef]
  44. Buchanan, J.; Tullock, G. The Calculus of Consent; University of Michigan Press: Ann Arbor, MI, USA, 1965. [Google Scholar]
  45. Baumol, W.J.; Wallace, E.O. The Theory of Environmental Policy; Prentice Hall: Englewood Clifts, NJ, USA, 1975. [Google Scholar]
  46. Maler, K.G. Welfare Economics and the Environment. In Handbook of Natural Resource and Energy Economics; Kneese, A.V., Sweeney, L.J., Eds.; Elsevier: Amsterdam, The Netherlands, 1985; Volume 1, pp. 3–60. [Google Scholar]
  47. Sandler, T.; Smith, V.K. Intergenerational and Intertemporal Pareto Efficiency. A Reconsideration of Recent Extencions. J. Environ. Econ. Manag. 1982, 4, 357–369. [Google Scholar]
  48. Coase, R. Law and Economics at Chicago. J. Law Econ. 1993, 36, 239–254. [Google Scholar] [CrossRef]
  49. Karlsson, C.; Manducchi, A. Knowledge Sipplovers in a Spatial Context—A Critical Review. In Knowledge, Colpexity and Innovation Systems; Fischer, M.M., Fröhlich, J., Eds.; Springer: Berlin, Germany, 2001. [Google Scholar]
  50. Holod, D.; Reed, R.R. Regional Spillovers, Economic Growth and the Effects of Economic Integration. Econ. Lett. 2004, 85, 35–42. [Google Scholar] [CrossRef]
  51. Capello, R. Spatial Spillovers and Regional Growth: A Cognitive Approach. Eur. Plan. Stud. 2009, 17, 639–658. [Google Scholar] [CrossRef]
  52. Treacy, J. Smart methods for environmental externalities: Urban planning, environmental health and hygiene in the Netherlands. Irish Geogr. 2014, 46, 261–263. [Google Scholar] [CrossRef]
  53. Laffont, J.J. Externalities. In The New Palgrave Dictionary of Economics; Palgrave Macmillan: London, UK, 2008. [Google Scholar]
  54. Tucker, J. Intervention. In Encyclopedia of Evaluation; Mathison, S., Ed.; SAGE: Thousand Oaks, CA, USA; London, UK, 2005. [Google Scholar]
  55. Howlett, M. Designing Public Policies. Principles and Instruments; Routledge: London, UK; New York, NY, USA, 2011. [Google Scholar]
  56. Datta, S.; Mullainathan, S. Behavioral Design. A New Approach to Development Policy; Center for Global Development, Policy Paper: Washington, DC, USA, November 2012; pp. 1–33. [Google Scholar]
  57. Shafir, E. Introduction. In The Behavioral Foundations of Public Policy, Shafir, E., Ed.; Princeton University Press: Princeton, NJ, USA, 2013. [Google Scholar]
  58. Filipiak, B.Z.; Dylewski, M. Participatory Budgeting as Example of Behavioural Impact of Public Policies. In Problems, Methods and Tools in Experimental and Behavioral Economics; Nermend, K., Łatuszyńska, M., Eds.; Springer: Cham, Switzerland, 2018. [Google Scholar]
  59. Kuznets, S. Economic growth and income inequality. Am. Econ. Rev. 1955, 49, 1–28. [Google Scholar]
  60. Van Alstine, J.; Neumayer, E. The environmental Kuznets curve. In Handbook on Trade and the Environment; Kevin, P., Ed.; Elgar original reference; Edward Elgar: Cheltenham, UK, 2010. [Google Scholar]
  61. Bhattarai, K.; Paudel, K.P.; Poudel, B.N. Searching for an environmental Kuznets curve in carbon dioxide pollutant in Latin American countries. J. Agric. Appl. Econ. 2009, 41, 13–27. [Google Scholar]
  62. Álvarez-Herranz, A.; Balsalobre-Lorente, D. Economic growth and energy regulation in the environmental Kuznets curve. Environ. Sci. Pollut. Res. 2016, 23, 16478–16494. [Google Scholar]
  63. Carolina Rezende de Carvalho Ferreira, M.; Amorim Sobreiro, V.; Kimura, H.; Luiz de Moraes Barboza, F. A systematic review of literature about finance and sustainability. J. Sustain. Financ. Investig. 2016, 6, 112–147. [Google Scholar] [CrossRef]
  64. Gray, T.R. Mapping a Corporate Governance Exchange: A Survey of Canadian Shareholder Resolutions 2000–2009. J. Sustain. Financ. Investig. 2011, 1, 30–43. [Google Scholar] [CrossRef]
  65. Nikolakis, W.; Cohen, D.H.; Nelson, H.W. What Matters for Socially Responsible Investment (SRI) in the Natural Resources Sectors? SRI Mutual Funds and Forestry in North America. J. Sustain. Financ. Investig. 2012, 2, 136–151. [Google Scholar]
  66. Hebb, T. Impact Investing and Responsible Investing: What Does it Mean? J. Sustain. Financ. Investig. 2013, 3, 71–74. [Google Scholar] [CrossRef]
  67. Alm, K.; Sievänen, R. Institutional Investors, Climate Change and Human Rights. J. Sustain. Financ. Investig. 2013, 3, 177–183. [Google Scholar] [CrossRef]
  68. Levashova, Y. Role of Sustainable Development in Bilateral Investment Treaties: Recent Trends and Developments. J. Sustain. Financ. Investig. 2011, 1, 222–229. [Google Scholar]
  69. Vandekerckhove, W.; Leys, J. Dear Sir, We are Not an NGO. J. Sustain. Financ. Investig. 2012, 2, 152–161. [Google Scholar]
  70. Aspinall, N.G.; Jones, S.R.; McNeill, E.H.; Werner, R.A.; Zalk, T. Sustainability and the financial system. Review of literature 2015. Br. Actuar. J. 2018, 23, 1–21. [Google Scholar] [CrossRef]
  71. Goldstein, D. Financial sector reform and sustainable development: the case of Costa Rica. Ecol. Econ. 2001, 37, 199–215. [Google Scholar] [CrossRef]
  72. Busch, T.; Bauer, R.; Orlitzky, M. Sustainable Development and Financial Markets: Old Paths and New Avenues. Bus. Soc. 2016, 55, 303–329. [Google Scholar] [CrossRef]
  73. Muñoz-Torres, M.J.; Fernández-Izquierdo, M.A.; Rivera-Lirio, J.M.; Escrig-Olmedo, E. Can Environmental, Social, and Governance Rating Agencies Favor Business Models that Promote a More Sustainable Development. In Corporate Social Responsibility and Environmental Management; Wiley: Hoboken, NJ, USA, 2018. [Google Scholar]
  74. Walley, N.; Whitehead, B. It’s not easy being green. Harv. Bus. Rev. 1994, 72, 46–52. [Google Scholar]
  75. Dowel, G.; Hart, S.; Yeung, B. Do Corporate Global Environmental standards create or destroy market value? Manag. Sci. 2000, 46, 1059–1074. Available online: https://pdfs.semanticscholar.org/414b/4271f0de83550f44c68e4b9cb1c02a465157.pdf (accessed on 4 March 2019). [CrossRef]
  76. Afza, T.; Ehsan, S.; Nazir, S. Whether Companies Need to be Concerned about Corporate Social Responsibility for their Financial Performance or Not? A Perspective of Agency and Stakeholder Theories. Eur. Online J. Nat. Soc. Sci. 2015, 4, 664–682. [Google Scholar]
  77. Waygood, S. How do the Capital Markets Undermine Sustainable Development? What Can be Done to Correct This? J. Sustain. Financ. Investig. 2011, 1, 81–87. [Google Scholar] [CrossRef]
  78. Schoenmaker, D. Investing for the Common Good: A Sustainable Finance Framework; Bruegel Essay and Lecture Series; Bruegel: Brussels, Belgium, 2017. [Google Scholar]
  79. Soppe, A. Sustainable Finance as a Connection Between Corporate Social Responsibility and Social Responsible Investing. Indian Sch. Bus. WP Indian Manag. Res. J. 2009, 1, 13–23. [Google Scholar]
  80. Gerster, R. Sustainable Finance: Achievements, Challenges, Outlook; Gerster Consulting: Zürich, Switzerland, 2011. [Google Scholar]
  81. Wilson, C. Why should sustainable finance be given priority? Account. Res. J. 2010, 23, 267–280. [Google Scholar] [CrossRef] [Green Version]
  82. Strandberg, C. Best Practices in Sustainable Finance. 2015. Available online: https://www.cbd.int/financial/privatesector/several-privatebestpractices.pdf (accessed on 4 March 2019).
  83. Höhne, N.; Khosla, S.; Fekete, H.; Gilbert, A. Mapping of Green Finance Delivered by IDFC Members in 2011; Ecofys: Utrecht, The Netherlands, 2011. [Google Scholar]
  84. Zadek, S.; Flynn, K. South-Originating Green Finance: Exploring the Potential; The Geneva International Finance Dialogues, UNEP FI, SDC, and IISD: Geneva, Switzerland, 2013. [Google Scholar]
  85. Böhnke, E.; Knierim, R.; Röber, V. How to Make Green Finance Work—Empirical Evidence from Bank and Company Surveys; German Development Institute/Deutsches Institut für Entwick-lungspolitik (DIE): Bonn, Germany, 2015. [Google Scholar]
  86. Pricewaterhouse Coopers Consultants (PWC). Exploring Green Finance Incentives in China; PWC: London, UK, 2013. [Google Scholar]
  87. Wang, Y.; Zhi, O. The role of green finance in environmental protection: Two aspects of market mechanism and policies. In Proceedings of the CUE2016-Applied Energy Symposium and Forum 2016: Low Carbon Cities & Urban Energy Systems, Jinan, China, 13–15 June 2016. [Google Scholar]
  88. Volz, U. Fostering Green Finance for Sustainable Development in Asia; ADBI: Tokyo, Japan, 2018. [Google Scholar]
  89. Berensmann, K.; Lindenberg, N. Green Finance: Actors, Challenges and Policy Recommendations; Briefing Paper 23; German Development Institute/Deutsches Institut für Entwicklungspolitik (DIE): Bonn, Germany, 2016; pp. 2–16. [Google Scholar]
  90. Chesney, M.; Gheyssens, J.; Pana, A.C.; Taschini, L. Environmental Finance and Investments; Springer-Verlag Berlin Heidelberg: Heidelberg, Germany, 2016. [Google Scholar]
  91. Simon, G.L.; Bumpus, A.G.; Mann, P. Win-win scenarios at the climate–development interface: Challenges and opportunities for stove replacement programs through carbon finance. Glob. Environ. Chang. 2012, 22, 275–287. [Google Scholar] [CrossRef]
  92. Tierney, M.J.; Nielson, D.L.; Hawkins, D.G.; Roberts, J.T.; Findley, M.G.; Powers, R.M.; Parks, B.; Wilson, S.E.; Hicks, R.L. More Dollars than Sense: Refining Our Knowledge of Development Finance Using AidData. World Dev. 2011, 39, 1891–1906. [Google Scholar] [CrossRef]
  93. Asutay, M. Islamic Banking and Finance: Social Failure. New Horiz. 2008, 169, 1–3. [Google Scholar] [CrossRef]
  94. Scholtens, B.; Pontus, C.; Hassel, L. Sustainable Development and Socially Responsible Finance and Investing. Sustain. Dev. 2008, 16, 137–140. [Google Scholar] [CrossRef]
  95. Ravi, S. Microfinance in India: Challenges and Opportunities. Int. J. Commer. Manag. 2012, 3, 46. [Google Scholar]
  96. Mazzucato, M.; Semieniuk, G. Financing renewable energy: Who is financing what and why it matters. Technol. Forecast. Soc. Chang. 2018, 127, 8–22. [Google Scholar] [CrossRef]
  97. Falcone, P.M.; Sica, E. Assessing the Opportunities and Challenges of Green Finance in Italy: An Analysis of the Biomass production Sector. Sustainability 2019, 11, 517. [Google Scholar] [CrossRef]
  98. Falcone, P.M.; Morone, P.; Sica, E. Greening of the financial system and fueling a sustainability transition: A discursive approach to assess landscape pressures on the Italian financial system. Technol. Forecast. Soc. Change 2018, 127, 23–37. [Google Scholar] [CrossRef]
  99. Wang, Y.; Zhi, Q. The Role of Green Finance in Environmental Protection: Two Aspects of Market Mechanism and Policies. Energy Procedia 2016, 104, 311–316. [Google Scholar] [CrossRef]
  100. Falcone, P.M. Green investment strategies and bank-firm relationship: A firm-level analysis. Econ. Bull. 2018, 38, 2225–2239. [Google Scholar]
  101. Gorvett, R. Systemic Risk as a Negative Externality. In Systemic Risk, Financial Reform, and Moving Forward from the Financial Crisis; Society of Actuaries: Chicago, llinois, USA, 2011; p. 33. [Google Scholar]
  102. De Haas, R.; Popov, A. Financial Development and Industrial Pollution; European Banking Center Discussion Paper Series, 2018-001; SSRN: Tilburg, The Netherlands, 2018. [Google Scholar]
  103. Hall, B.H.; Lerner, J. The Financing of R&D and Innovation. In Handbook of the Economics of Innovation; Hall, B.H., Rosenberg, N., Eds.; Elsevier: Amsterdam, The Netherlands, 2010. [Google Scholar]
  104. Itaya, J. Can environmental taxation stimulate growth? The role of indeterminacy in endogenous growth models with environmental externalities. J. Econ. Dyn. Control 2008, 32, 1156–1180. [Google Scholar] [CrossRef]
  105. Chowdhury, T.; Datta, R.; Mohajan, H. Green finance is essential for economic development and sustainability. Int. J. Res. Commer. Econ. Manag. 2013, 3, 3. [Google Scholar]
  106. Pye, S.; Skinner, I.; Meyer-Ohlendorf, N.; Leipprand, A.; Lucas, K.; Salmons, R. Addressing the Social Dimensions of Environmental Policy. A study on the Linkages between Environmental and Social Sustainability in Europe; European Commission: Brussels, Belgium, 2008. [Google Scholar]
  107. Yiridoe, E.; Amon-Armah, F.; Hebb, D.; Jamieson, R. Eco-efficiency of Alternative Cropping Systems Managed in an Agricultural Watershed. In Proceedings of the Agricultural & Applied Economics Association’s 2013 AAEA & CAES Joint Annual Meeting, Washington, DC, USA, 4–6 August 2013. [Google Scholar]
  108. Orlitzky, M.; Schmidt, M.L. Rynes, S.L. Corporate Social and Financial Performance: A Meta-Analysis. Organ. Stud. 2003, 24, 403–411. [Google Scholar] [CrossRef]
  109. Innovest. Corporate Environmental Performance: Environmental Governance Has Been Defined as the State of Governance that Describes A Company’s Management of Its Environmental Impacts, Risks, Performance and Opportunities. 2004. Available online: www.kellogg.northwestern.edu (accessed on 19 June 2019).
  110. Sustainable Financial System: Nine Priority Conditions to Address, Principles for Responsible Investment. 2017. Available online: https://www.unpri.org/download?ac=5510 (accessed on 22 February 2019).
  111. World Bank Document. Towards a Sustainable Financial System in Indonesia; The Association for Sustainable and Responsible Investment in Asia (ASrIA): Washington, DC, USA, 2015. [Google Scholar]
  112. Fatemi, A.M.; Fooladi, I.J. Sustainable finance: A new paradigm. Glob. Financ. J. 2013, 24, 101–113. [Google Scholar] [CrossRef]
  113. Szopik-Depczyńska, K.; Kędzierska-Szczepaniak, A.; Szczepaniak, K.; Cheba, K.; Gajda, W.; Ioppolo, G. Innovation in sustainable development: an investigation of the EU context using 2030 agenda indicators. Land Use Policy 2018, 79, 251–262. [Google Scholar] [CrossRef]
  114. The Sustainable Development Goals Report 2018; United Nations: New York, NY, USA, 2018.
  115. Venkatesh, G. Sustainable Development as a Single Measure: Case Study of Some Developing Asian Countries. Probl. Sustain. Dev. 2015, 10, 31–42. [Google Scholar]
  116. Bąk, I.; Cheba, K. An analysis of dynamic changes in selected areas of sustainable development of the European Union countries. Folia Oeconomica Stetinensia 2018, 18, 93–107. [Google Scholar] [CrossRef]
  117. Morris, V.C. Measuring and Forecasting Financial Stability: The Composition of an Aggregate Financial Stability Index for Jamaica; Bank of Jamaica: Kingston, Jamaica, 2010. [Google Scholar]
  118. Čihák, M.; Demirgüç-Kunt, A.; Feyen, E.; Levine, R. Benchmarking Financial Systems around the World; Policy Research Working Paper 6175; World Bank: Washington, DC, USA, 2012; pp. 1–56. [Google Scholar]
  119. Kondratov, K. Modelling financial stability Index for Latvian financial system. Reg. Form. Dev. Stud. 2014, 3, 118–127. [Google Scholar]
  120. Karanovic, G.; Karanovic, B. Developing an aggregate index for measuring financial stability in the Balkans. Procedia Econ. Financ. 2015, 33, 3–17. [Google Scholar] [CrossRef]
  121. Oates, W.E. Green Taxes: Can We Protect the Environment and Improve the Tax System at the Same Time? South. Econ. J. 1995, 61, 915. [Google Scholar] [CrossRef]
  122. Parry, I.W.; Small, K.A. Does Britain or the United States Have the Right Gasoline Tax? Am. Econ. Rev. 2005, 95, 1276–1289. [Google Scholar] [CrossRef] [Green Version]
  123. Lin, B.; Li, X. The effect of carbon tax on per capita CO2 emissions. Energy Policy 2011, 39, 5137–5146. [Google Scholar] [CrossRef]
  124. Apergis, N.; Eleftheriou, S.; Payne, J.E. The relationship between international financial reporting standards, carbon emissions, and R&D expenditures: Evidence from European manufacturing firms. Ecol. Econ. 2013, 88, 57–66. [Google Scholar]
  125. Lee, K.-H.; Min, B. Green R&D for eco-innovation and its impact on carbon emissions and firm performance. J. Clean. Prod. 2015, 108, 534–542. [Google Scholar] [Green Version]
  126. Doerrenberg, P.; Peichl, A. The Impact of Redistributive Policies on Inequality in OECD Countries; Discussion Paper 6505; Institute for the Study of Labor: Bonn, Germany, 2012. [Google Scholar]
  127. Burchardt, T.; Vizard, P. Definition of Equality and Framework for Measurement: Final Recommendations of the Equalities Review Steering Group on Measurement; CASE Paper 120; LSE: London, UK, 2007. [Google Scholar]
  128. Cheba, K. The applications of dynamic relative taxonomy methods to assess the effectiveness of transnational corporations strategies. Eur. J. Int. Manag. 2019, in press. [Google Scholar] [CrossRef]
  129. Sanderson, M. Problems with Kendall’s Tau. In Proceedings of the SIGIR ’07, 30th Annual International ACM SIGIR Conference on Research and Development in Information Retrieval, Amsterdam, The Netherlands, 23–27 July 2007; pp. 839–840. [Google Scholar]
  130. Kendall, M.G. A new measure of rank correlation. Biometrika 1938, 30, 81–93. [Google Scholar] [CrossRef]
  131. Lapata, M. Probabilistic text structuring: Experiments with sentence ordering. In Proceedings of the 41st Annual Meeting of the Association for Computational Linguistics, Sapporo, Japan, 7–12 July 2003; pp. 545–552. [Google Scholar]
  132. Okazaki, N.; Yutaka, M.; Mitsuru, I. Improving chronological sentence ordering by precedence relation. In Proceedings of the 20th International Conference on Computational Linguistics, Geneva, Switzerland, 23–27 August 2004; pp. 750–756. [Google Scholar]
  133. Lapata, M. Automatic Evaluation of Information Ordering: Kendall’s Tau. Comput. Linguist. 2006, 32, 471–484. [Google Scholar] [CrossRef]
  134. Bąk, I.; Szczecińska, B. The Use of Multi-Criteria Taxonomy in the Study of Objective Quality of Life in Polish Voivodeships. Folia Oeconomica Stetinensia 2016, 16, 7–20. [Google Scholar] [CrossRef] [Green Version]
  135. Wydymus, S. Economic Development and the Level of Remuneration in the European Union Countries—Taxonomic Analysis; (translated from Folish), Zeszyty Naukowe Uniwersytetu Szczecińskiego, Finanse, Rynki Finansowe, Ubezpieczenia: Szczecin, Poland, 2013; Volume 57, pp. 631–645. [Google Scholar]
  136. Szopik-Depczyńska, K.; Cheba, K.; Bąk, I.; Kiba-Janiak, M.; Saniuk, S.; Dembińska, I.; Ioppolo, G. The application of relative taxonomy to the study of disproportion in the area of sustainable development of the European Union. Land Use Policy 2017, 68C, 481–491. [Google Scholar] [CrossRef]
  137. Malina, A. Research on structural similarities between Poland and EU countries in terms of employment structure. Argumenta Oeconomica Cracoviensia 2005, 4, 57–70. [Google Scholar]
  138. Szopik-Depczyńska, K.; Cheba, K.; Bąk, I.; Stajniak, M.; Simboli, A.; Ioppolo, G. The study of relationship in a hierarchical structure of EU sustainable development indicators. Ecol. Indic. 2018, 90, 120–131. [Google Scholar] [CrossRef]
  139. Guijarro, F.; Poyatos, J.A. Designing a Sustainable Development Goal Index through a Goal Programming Model: The Case of EU-28 Countries. Sustainability 2018, 10, 3167. [Google Scholar] [CrossRef]
  140. Bluszcz, A. Classification of the European Union member states according to the relative level of sustainable development. Qual. Quant. 2016, 50, 2591–2605. [Google Scholar] [CrossRef]
  141. Bujanowicz-Haraś, B.; Janulewicz, P.; Nowak, A.; Krukowski, A. Evaluation of Sustainable Development in the Member States of the European Union. Probl. Sustain. Dev. 2015, 10, 71–78. [Google Scholar]
  142. Filip, M.; Grzebyk, P.; Pierscieniak, M.A. Socio-Economic Development in the EU Member States—Concept and Classification. Inz. Ekon. Eng. Econ. 2014, 25, 504–512. [Google Scholar]
  143. Goldsmith, R.W. Financial Structure and Development; Yale University Press: New Haven, CT, USA, 1969. [Google Scholar]
  144. Scrimgeour, F.; Oxley, L.; Fatai, K. Reducing carbon emissions? The relative effectiveness of different types of environmental tax: The case of New Zealand. Environ. Model. Softw. 2005, 20, 1439–1448. [Google Scholar] [CrossRef]
  145. Fisher, C. Emissions pricing, spillovers, and public investment in environmentally friendly technologies. Energy Econ. 2008, 30, 487–502. [Google Scholar] [CrossRef] [Green Version]
  146. Rajan, R.G.; Zingales, L. Financial systems, industrial structure, and growth. Oxf. Rev. Econ. Policy 2001, 17, 467–482. [Google Scholar] [CrossRef]
  147. Talukdar, D.; Meisner, C.M. Does the private sector help or hurt the environment? Evidence from carbon dioxide pollution in developing countries. World Dev. 2001, 29, 827–840. [Google Scholar] [CrossRef]
  148. The Organisation for Economic Co-operation and Development. Global Outlook on Financing for Sustainable Development 2019; OECD: Paris, France, 2018. [Google Scholar]
  149. Li, Z.; Morris, T.; Young, B. Corporate Visibility and Corporate Social Performance. 2019. Available online: https://papers.ssrn.com/sol3/papers.cfm?abstract_id=3394956 (accessed on 19 June 2019).
  150. Ferrero-Ferrero, I.; Fernández-Izquierdo, M.A.; Muñoz-Torres, M.J. The Effect of Environmental, Social and Governance Consistency on Economic Results. Sustainability 2016, 8, 1005. [Google Scholar] [CrossRef]
  151. Crifo, P.; Diaye, M.-A.; Oueghlissi, R. Measuring the Effect of Government ESG Performance on Sovereign Borrowing Cost. 2015. Available online: https://hal.archives-ouvertes.fr/hal-00951304v3 (accessed on 19 June 2019).
  152. Li, Z.F.; Minor, D.; Wang, J.; Yu, C. A Learning Curve of the Market: Chasing Alpha of Socially Responsible Firms. 2019. Available online: https://ssrn.com/abstract=3224796 (accessed on 19 June 2019).
  153. García, F.; González-Bueno, J.; Javier Oliver, J.; Riley, N. Selecting Socially Responsible Portfolios: A Fuzzy Multicriteria Approach. Sustainability 2019, 11, 2496. [Google Scholar] [CrossRef]
  154. Zorlu, P. Transforming the Financial System for Delivering Sustainable Development—A High-Level Overview; Institute for Global Environmental Strategies: Kanagawa, Japan, 2018. [Google Scholar]
  155. Zhao, C.; Guo, Y.; Yuan, J.; Wu, M.; Li, D.; Zhou, Y.; Kang, J. ESG and Corporate Financial Performance: Empirical Evidence from China’s Listed Power Generation Companies. Sustainability 2018, 10, 2607. [Google Scholar] [CrossRef]
  156. Finansinspektionen how can the financial sector contribute to sustainable development (2016). Available online: https://www.fi.se/contentassets/123efb8f00f34f4cab1b0b1e17cb0bf4/finansiella_foretags_hallbarhetsarbete_eng.pdf (accessed on 19 June 2019).
Figure 1. The mean value of self-reported unmet need of medical care by a detailed reason, % of population aged 16 and over, too expensive or too far to travel, or waiting list in typological groups in 2016.
Sustainability 11 04249 g001
Figure 2. The mean value of population unable to keep home adequately warm, % of population in typological groups in 2016.
Sustainability 11 04249 g002
Figure 3. The mean value of death rate due to homicide, number per 100,000 persons in typological groups in 2016.
Sustainability 11 04249 g003
Figure 4. The mean value of primary energy consumption equivalent (TOE) in typological groups in 2016.
Sustainability 11 04249 g004
Table 1. Sustainability towards to positive and negative externalities.
Type of ExternalitiesEnvironmental PillarSocial PillarEconomic Pillar
PositiveNot polluting, but above all valorizing natural resources [22]; obtaining production (services) in a non-threatening way to the natural environment; ensuring the long-term balance of the ecosystem and preventing the degradation of the natural environment [23]; the ability to keep resources of natural environment in good condition [24]; compliance with the code of good practice in the scope of social responsibility and taking into account legal and administrative criteria when providing support from public funds [25]; effective actions (political, organizational, technological) for the reduction of noise, emissions of soil, air, water pollution and activities to reduce the greenhouse effect [22].Providing satisfactory conditions for the population living in the environment; obtaining socially acceptable production [25]; social dimension is connected with the system of institutions (formal and informal ones), defining the principles that guarantee public safety and nature protection in general [26];
helping facilitate conservation policies, actions and outcomes that are more legitimate, salient, robust and effective [27]; valorization of environmental services, the use of labor resources, the contribution to maintaining or developing the economic and social viability of residential areas and cultural values [28]; ensuring fair income while maintaining as much employment as possible; care for the health of employees and consumers [29,30].
Production in sufficient quantity, with acceptable quality and good performance; getting stable, and at the same time economically viable production [26,31]; developing income that ensures a fair standard of living for the member of society and his family, and enabling stable development; direct and indirect effects of growing demand [28,32]; effects induced by the effect of compensation with higher prices for using the environment; trade in environmentally friendly technologies, devices, fuels [29,33,34].
NegativePollution, exhaustibility of natural resources; degradation of the natural environment; obtaining production (services) in a way threatening the natural environment; the lack of or problems with the long-term balance of the ecosystem, problems with preventing the degradation of natural environment; limited observance of the code of good practice in the scope of social responsibility; limited activities (political, organizational, technological) or low effective for the reduction of noise, emissions of soil, air, water pollution, and the greenhouse effect [22,23].Low satisfactory conditions for the population living in the environment; the lack of social acceptance for certain types of production; the lack of principles that guarantee public safety and nature protection in general; the lack of ensuring a fair income while maintaining as much employment as possible; problems with care for the health of employees and consumers; health risk; social exclusion [26,27,28,29,30].Production in unsatisfactory quantity, low quality and unsatisfactory performance; direct and indirect effects in connection with pro-ecological investments in conventional energy; direct and indirect effects in the operation phase of energy, water and sewage installations; effects induced due to additional household costs (budget effects) and enterprises (cost effects); Decrease in revenues and energy consumption in production; increasing the demand for resources due to the lack of pro-ecological investments [33,34].
Both effectsIncrease in productivity, learning outcomes, multiplier effects, political effect
Source: own elaboration.
Table 2. Sustainable finance taxonomy.
Type of Sustainable FinanceAuthorDefinition
Green finance (includes climate finance)Höhne et al. (2011)Financial investments flowing into sustainable development projects and initiatives, environmental products, and policies that encourage the development of a more sustainable economy, environmental products, and policies that encourage the development of a more sustainable economy [83].
Green finance (used interchangeably with green investment)Zadek and Flynn (2013)Includes operational costs of green investments not included under the definition of green investment. Most obviously, it would include costs such as project preparation and land acquisition costs, both of which are not just significant but can pose distinct financing challenges [84].
Green finance (a key element sustainable investment and banking)Böhnke et al. (2015)Comprises all forms of investment or lending that take into account environmental impact and enhance environmental sustainability. A key element of green finance is sustainable investment and banking, where investment and lending decisions are taken on the basis of environmental screening and risk assessment to meet environmental sustainability [85].
Green financePricewaterhouse Coopers Consultants (2013)Financial products and services, under the consideration of environmental factors throughout the lending decision making, ex-post monitoring and risk management processes, provided to promote environmentally responsible investments and stimulate low-carbon technologies, projects, industries and businesses [86].
Green finance (relation between finance and business)Wang and Zhi (2016)Emphasizes more of the ecological environment benefit and pays more attention to environmental protection industry. It is a phenomenon that combines the world of finance and business with environmentally friendly behavior. It is an arena for many participants, including individual and business consumers, producers, investors, and financial lenders [87].
Green financeVolz (2018)Defined as comprising all forms of investment or lending that consider environmental effect and enhance environmental sustainability [88].
Green financeBerensmann, Lindenberg, (2016)Two main tasks of green finance are to internalize environmental externalities and to reduce risk perceptions in order to encourage investments that provide environmental benefits [89].
Environmental financeNyangon (2016)Environmental finance touches almost every aspect of market, business models, regulations, public finance, and infrastructure development. It includes energy, waste and water systems, electric grids, and urban infrastructure [90]. Environmental finance covers green finance and carbon finance.
Carbon financeGregory et al. (2012)Carbon finance mitigates both the health and climate impacts of domestic carbon-based emissions [91].
Development financeTierney et al. (2011)When green finance is focused on environmental perspective, development finance is wider and relates to financial aspects of economic development and refers to public financing. Loans or grants from governments, official government aid agencies, and inter-governmental organizations (IGOs) intended mainly to promote the economic development and welfare (broadly defined) of developing countries is defined as development finance [92]
Responsible financeAsutay (2008), Scholtens et al. (2008)Development finance and responsible finance refers to three pillars of sustainable development. In this context responsible finance, as it builds systematic checks on financial providers; and restrains consumer indebtedness; ethical investment, and corporate social responsibility (CSR) initiatives [93]. Responsible finance consist of responsible investment and socially responsible investment. By investing in firms that refrain from harming the environment or people, that have more and better systems in place to achieve environmental and social goals or that show a particular ethical conduct, investors have the opportunity to make available more funds and/or funds at a lower cost for the firms that try to operate in a more sustainable or responsible manner [94].
MicrofinanceRavi (2012)Any activity that includes the provision of financial services such as credit, savings, and insurance to low income individuals which fall just above the nationally defined poverty line, and poor individuals which fall below that poverty line, with the goal of creating social value [95].
Source: own elaboration based on related work.
Table 3. Sustainable finance towards negative externalities.
Type of Sustainable FinanceRelated Pillar of Sustainable DevelopmentRelated RISK FactorNegative Externalities to Overcome
Green financeEnvironmental pillarClimate change, global warming, industrialization, greenhouse gas emissions, emissions, wastes, resource depletionAir, water, soil, ground pollution, smog
Carbon financeEnvironmental pillarIndustrialization, carbon-based emissionsAir pollution, smog
Environmental financeEnvironmental pillarClimate change, global warming, industrialization, greenhouse gas emissions, emissions, wastes, resource depletionAir, water, soil, ground pollution, smog
Development financeEnvironmental, Social, Economic pillarExclusion, income disparities, poverty, hunger, climate change, global warming, industrialization, greenhouse gas emissions, emissions, wastes, resource depletionAir, water, soil, ground pollution, smog, social exclusion, noise
Responsible financeEnvironmental, Social, Economic pillarExclusion, income disparities, poverty, hunger, climate change, global warming, industrialization, greenhouse gas emissions, emissions, wastes, resource depletionAir, water, soil, ground pollution, smog, social exclusion, noise
MicrofinanceEconomic, Social pillarExclusion, income disparities, poverty, hungerSocial exclusion
Source: own elaboration.
Table 4. Economic, environmental, social and financial indicators reflecting sustainable development pillars’ and sustainable finance perspective.
ScopeIndicators
Economic(1) Agricultural factor income per annual work unit (AWU), chain linked volumes (X1.1 (The first number denotes pillar of sustainable development the second one is the number of indicator in particular pillar), S); (2) Area under organic farming, % of utilised agricultural area (UAA) (X1.2, S); (3) Employment rates of recent graduates, % of population aged 20 to 40 (X1.3, S); (4) Inactive population due to caring responsibilities, % of inactive population aged 20 to 70 (X1.4, S); (5) Real GDP per capita, chain linked volumes (2010), Euro per capita (X1.5, S); (6) Young people neither in employment nor in education and training, % of population aged 15 to 35 (X1.6, D); (7) Involuntary temporary employment, % of employees aged 20 to 70 (X1.7, S); (8) People killed in accidents at work, number per 100,000 employees (X1.8, D); (9) Employment in high- and medium-high technology manufacturing sectors and knowledge-intensive service sectors, % of total employment (X1.9, S); (10) R&D personnel, % of active population (X1.10, S); (11) Purchasing power adjusted GDP per capita, real expenditure per capita (in PPS_EU28) (X1.11, S); (12) Resource productivity and domestic material consumption (DMC), Euro per kilogram, chain linked volumes (2010) (X1.12, S); (13) Volume of freight transport relative to GDP, index (2005 = 100) (X1.13, S)
Environmental(1) Ammonia emissions from agriculture, kilograms per hectare (X2.1, D); (2) Primary energy consumption, million tonnes of oil equivalent (TOE) (X2.2, D); (3) Final energy consumption, million tonnes of oil equivalent (TOE) (X2.3=23, D); (4) Energy productivity, Euro per kilogram of oil equivalent (KGOE) (X2.4, S); (5) Share of renewable energy in gross final energy consumption, % (X2.5, S); (6) Energy dependence % of imports in total energy consumption, all products (X2.6, D); (7) Recycling rate of municipal waste, % of total waste generated (X2.7, S); (8) Greenhouse gas emissions-tonnes per capita (X2.8, D)
Social(1) People at risk of poverty or social exclusion, % (X3.1, D); (2) People at risk of income poverty after social transfers,% (X3.2, D); (3) Severely materially deprived people, % (X3.3, D); (4) People living in households with very low work intensity, percentage of total population aged less than 72 (X3.4, D); (5) Housing cost overburden rate, % of population (X3.5, D); (6) Population living in a dwelling with a leaking roof, damp walls, floors or foundation or rot in window frames of floor by poverty status, % of population (X3.6, D); (7) Self-perceived health, very good or good, % of population (X3.7, S); (8) Death rate due to chronic diseases, total, number per 100,000 persons aged less than 65 (X3.8, D); (9) Suicide rate, number per 100,000 persons (X3.9, D); (10) Self-reported unmet need for medical care, % of population aged 16 and over, too expensive or too far to travel or waiting list (X3.10, D); (11) Early leavers from education and training, % of population aged 18 to 30 (X3.11, D); (12) Tertiary educational attainment, % of population aged 30 to 39 (X3.12, D); (13) Adult participation in learning, % of population aged 25 to 70 (X3.13, S); (14) Final energy consumption in households per capita, kg of oil equivalent (X3.14, D); (15) Population unable to keep home adequately warm, % of population (X3.15, D); (16) Long-term unemployment rate, % of active population (X3.16, D); (17) Relative median at-risk-of-poverty gap, % distance to poverty threshold (X317, D); (18) Income share of the bottom 40% of the population, % of income (X3.18, D); (19) Overcrowding rate, % of population (X3.19, D); (20) Population living in households considering that they suffer from noise, % of population (X3.20, D); (21) People killed in road accidents, rate (X3.21, D); (22) Death rate due to homicide, number per 100,000 persons (X3.22, D); (23) Population reporting occurrence of crime, violence or vandalism in their area, % of population (X3.23, D); (24) Seats held by women in national parliaments % of seats (X3.24, S); (25) Seats held by women in national governments, % of seats (X3.25, S); (26) Positions held by women in senior management positions (source: EIGE), % of positions, board members (X3.26, S); (27) Population with confidence in EU institutions by institution, European Commission, % of population (X3.27, S); (28) Population with confidence in EU institutions by institution, European Central Bank (ECB), % of population (X3.28, S)
Financial(1) Government support to agricultural research and development, Euro per inhabitant (X4.1, S); (2) Gross domestic expenditure on research and development (R&D), % of GDP (X4.2, S); (3) Gini coefficient of equivalised disposable income, coefficient of 0 (maximal equality) to 100 (maximal inequality) (X4.3, D); (4) General government expenditure on education, % of GDP (X4.4, S); (5) General government expenditure on health % of GDP (X4.5, S); (6) General government expenditure on social protection, % of GDP (X4.6, S); (7) General government total expenditure on law courts, Euro per inhabitant (X4.7, S); (8) General government gross debt, Percentage of gross domestic product (GDP) (X4.8, D); (9) Shares of labour taxes in total tax revenues, % of total taxes (X4.9, S); (10) Environmental taxes, percentage of total revenues from taxes and social contributions (including imputed social contributions) (X4.10, S); (11) Consolidated banking leverage, domestic and foreign entities (asset-to-equity multiple) (X4.11, D); (12) Bank credit to the private sector as percent of GDP (X4.12, S); (13) Official development assistance as share of gross national income (source: OECD), % of gross national income (GNI) (X4.13, S); (14) EU imports from developing countries, million EUR, Development Assistance Committee (DAC) in millions of Euro (X4.14, S); (15) Income from natural resources, percent of GDP (X4.15X17, S)
Source: Eurostat data base. X number of variables; S—Stimulant; D—Destimulant.
Table 5. Ranking of European Union (EU) member states belonging to the Organization for Economic Cooperation and Development (OECD) in terms of the level of sustainable development and sustainable finance in 2007.
CountryArea of Sustainable Development:
EconomicSocialEnvironmentalFinance
Austria0.807170.773150.655530.78256
Belgium0.8983100.9381131.2807191.481222
Czech Republic0.9650110.9674141.0738141.009413
Denmark0.607710.741540.492110.60751
Estonia1.0375131.2279170.795361.066915
Finland0.802960.692820.730640.71294
France0.834490.853481.2091171.021114
Germany0.753840.9130111.5054220.87219
Greece1.0761161.3066190.837381.108317
Hungary1.3518211.3115200.917091.073716
Ireland1.0460140.840061.0404120.81438
Italy0.9790121.1406161.1802150.950011
Latvia1.3468201.6472231.0512131.273119
Lithuania1.2601191.3810221.0019101.164918
Luxembourg0.813280.851771.4520213.311923
Netherlands0.710230.725931.3456200.70253
Poland1.7784231.3273211.2296181.431621
Portugal1.3538221.2992180.739650.887110
Slovakia1.1487171.0995151.1854161.304920
Slovenia1.0574150.8898100.830570.79497
Spain1.2420180.869191.0207110.962112
Sweden0.678420.647710.545420.69582
United Kingdom0.761650.9302121.5501230.75185
Source: own calculation.
Table 6. Kendall’s τ correlation coefficient in the area of sustainable development and sustainable financials in 2007.
AreaArea
EconomicSocialEnvironmentalFinancial
Economic1.00000.6364−0.05930.4704
Social0.63641.00000.09880.5178
Environmental−0.05930.09881.00000.3597
Financial0.47040.51780.35971.0000
Source: own calculation.
Table 7. Ranking of EU member states belonging to the OECD in terms of the level of sustainable development and sustainable finance in 2013.
CountryArea of Sustainable Development:
EconomicSocialEnvironmentalFinance
Austria0.798560.784560.724240.81016
Belgium0.851590.8857101.2190181.528823
Czech Republic0.9649110.9540131.0055121.020513
Denmark0.662810.728630.598320.63721
Estonia1.0704131.1654171.0297140.95869
Finland0.838080.703420.785770.75644
France0.8941100.805871.3209201.075215
Germany0.702630.866691.7073230.89768
Greece1.1407161.7246230.9143101.227518
Hungary1.2316181.4264210.812181.103916
Ireland1.2825210.9521121.0174130.969510
Italy1.0149121.1674181.1646160.984212
Latvia1.4296221.5318220.694331.310721
Lithuania1.2492191.3252200.782161.281419
Luxembourg0.765750.732441.6246221.321722
Netherlands0.737840.734351.3588210.69692
Poland1.5323231.1183161.0848151.293320
Portugal1.2778201.2090190.735850.980411
Slovakia1.1042151.0715151.2025171.222617
Slovenia1.0961140.845780.861690.86107
Spain1.1629171.0324141.0000111.030614
Sweden0.669420.654810.598110.71443
United Kingdom0.819770.9207111.3042190.79645
Source: own calculation.
Table 8. Kendall’s τ correlation coefficient in the area of sustainable development and sustainable financials in 2013.
AreaArea
EconomicSocialEnvironmentalFinancial
Economic1.00000.5968−0.21740.4229
Social0.59681.0000−0.13040.4625
Environmental−0.2174−0.13041.00000.1383
Financial0.42290.46250.13831.0000
Source: own calculation.
Table 9. Ranking of EU member states belonging to the OECD in terms of the level of sustainable development and sustainable finance in 2016.
CountryArea of Sustainable Development:
EconomicSocialEnvironmentalFinance
Austria0.802660.772850.771050.81546
Belgium0.800750.8887131.2582191.290522
Czech Republic0.9581100.8791121.0006121.019212
Denmark0.690720.733630.612410.64481
Estonia1.1904181.1515180.9268100.92279
Finland0.887690.710120.781760.78654
France0.871580.818871.3113201.040614
Germany0.708830.8536101.6856230.89788
Greece1.1341161.8095221.0279141.165718
Hungary1.2315218805.1182230.903491.112116
Ireland1.1290150.819780.9931111.002810
Italy1.0202121.1659191.1646171.023913
Latvia1.3829221.3655210.728831.289221
Lithuania1.2010191.2913200.770741.203719
Luxembourg0.9695110.778161.4939222.113523
Netherlands0.764240.740241.4309210.70652
Poland1.5117231.0251151.0874151.228320
Portugal1.2199201.0743170.795571.044315
Slovakia1.0648141.0341161.0050131.158617
Slovenia1.0465130.8594110.850480.84437
Spain1.1678171.0022141.0878161.012311
Sweden0.663510.695210.614920.71503
United Kingdom0.867070.838891.1675180.79905
Source: own calculation.
Table 10. Kendall’s τ correlation coefficient in the area of sustainable development and sustainable financials in 2016.
AreaArea
EconomicSocialEnvironmentalFinancial
Economic1.00000.5889−0.17790.4625
Social0.58891.0000−0.06720.4783
Environmental−0.1779−0.06721.00000.2016
Financial0.46250.47830.20161.0000
Source: own calculation.
Table 11. Typological groups of EU countries belonging to the OECD divided according to the multi-criteria method in: 2007, 2013 and 2016.
Group200720132016
IAustria, Belgium, Czech Republic, Denmark, Estonia, Finland, Hungary, Netherlands, Slovakia, Slovenia, Spain, SwedenAustria, Czech Republic, Denmark, Hungary, Italy, Netherlands, Portugal, Slovakia, Slovenia, Sweden, United KingdomAustria, Belgium, Czech Republic, Denmark, Finland, Greece, Hungary, Italy, Netherlands, Slovakia, Slovenia, Sweden, United Kingdom
IIFrance, Greece, Portugal, ItalyFinland, France, Poland, SpainLithuania, Poland, Portugal
IIILatvia, Lithuania, PolandEstonia, Latvia, LithuaniaFrance, Spain
IVUnited KingdomGreeceEstonia, Latvia
VLuxembourgLuxembourgLuxembourg
VIGermanyGermanyGermany
VIIIrelandIrelandIreland
VIII-Belgium-
Source: own calculation.

