Article

Computational Bottom-Up Vulnerability Indicator for Low-Income Flood-Prone Urban Areas

by
Edna M. Rodríguez-Gaviria
1,2,*,
Sol Ochoa-Osorio
3,
Alejandro Builes-Jaramillo
1 and
Verónica Botero-Fernández
2
1
Faculty of Engineering and Architecture, Institución Universitaria Colegio Mayor de Antioquia, Medellín 050034, Colombia
2
Department of Geosciences and Environment, Faculty of Mines, Universidad Nacional de Colombia, Medellín 050034, Colombia
3
Disasters Risk Management Program, Faculty of Engineering and Architecture, Institución Universitaria Colegio Mayor de Antioquia, Medellín 050034, Colombia
*
Author to whom correspondence should be addressed.
Sustainability 2019, 11(16), 4341; https://0-doi-org.brum.beds.ac.uk/10.3390/su11164341
Submission received: 31 May 2019 / Revised: 5 August 2019 / Accepted: 6 August 2019 / Published: 11 August 2019

Abstract

:
This study presents the implementation of a methodology for the formulation of a vulnerability indicator for low-income urban territories in flood-prone areas, for two flood types: Sudden and slow. The methodology developed a computational assessment tool based on the Multiple Correspondence Analysis and the framework for vulnerability analysis in sustainable science. This approach uses participatory mapping and on-site data. The data collection was easily implemented with free software tools to facilitate its use in low-income urban territories. The method combines the evaluation of experts using the of the traditional approach for the qualification of the variables of vulnerability in its three components (exposure, susceptibility, and resilience), and incorporates a computational method of the correspondence analysis family to formulate the indicators of vulnerability. The results showed that the multiple correspondence analysis is useful for the identification of the most representative variables in the vulnerability assessment, used for the construction of spatial disaggregated vulnerability indicators and therefore the development of vulnerability maps that will help in the short term in disaster risk management, urban planning, and infrastructure protection. In addition, the variables of the susceptibility component are the most representative regardless of the type of flooding, followed by the variables of the exposure component, for sudden flood-prone territories, and the resilience component for slow flood-prone territories. Our findings and the computational tool can facilitate the prioritization of improvement projects and flood risk management on a household, neighborhood, and municipal level.

1. Introduction

A flood is that event that, due to the precipitation, swell, tide or failure of some hydraulic structure, causes an increase in the level of the free surface of the water of the rivers or of the sea, generating invasion or penetration of water in places where there is usually none and, generally, damage to the population, agriculture, livestock and infrastructure [1]. Floods are a global phenomenon that implies multiple impacts ranging from economic loss to the loss of human life. According to the United Nations, an average of 102 million people are affected every year by floods, surpassing those affected by cyclones, hurricanes, or typhoons (37 million), and landslides (366,000) [2], generating the greatest disasters throughout history [3]. Between 1990 and 2012, flooding affected over 36 million people and led to 44,000 fatalities [4]. Moreover, between 1973 to 2000 in Southern and Eastern Europe, the total amount of damages reported was around 27.6 billion Euros and 24.5 billion Euros, respectively [5]. In addition, according to the World Health Organization (WHO) [6], floods can potentially increase the transmission of waterborne diseases such as typhoid fever, cholera, leptospirosis, and hepatitis A; vector-borne diseases such as malaria, dengue and dengue hemorrhagic fever, yellow fever and West Nile fever, not counting the effects on mental health [7].
The Sendai Framework [8] defines factors such as rapid urban growth without planning, poverty, inequality, poor land management, deficient urban policies, climate variability and climate change as risk determinants. All those drivers might be found combined in low-income urban territories exposed to floods. For the quantification of this kind of risk, it is necessary to study both the physical conditions of floods and the vulnerability represented by the territorial occupation dynamics of the communities. According to the Intergovernmental Panel on Climate Change (IPCC), urban areas will be more exposed to extreme weather conditions, and therefore to flooding, increasing vulnerability and risk [9,10]. In a climate change context, there is an open question relating to the quantification of vulnerability in urban flood-prone areas [11] where information and resources are scarce, as is the case in most of the commonly flooded municipalities in developing countries.
Vulnerability is understood as the susceptibility to be adversely affected by natural hazards and is related to concepts that include sensitivity or susceptibility to harm and a lack of capacity to cope and adapt [10,12,13]. There are multiple approaches for quantifying vulnerability, not only for people but also for infrastructure, all depending on the quality and availability of the information [11,14,15,16,17,18,19,20]. Traditionally, vulnerability is evaluated with two frameworks—risk-hazard and pressure-and-release models [21]. However, those models are not suitable for the definition of particular coping strategies in low-income urban territories in risk areas in developing countries, as proposed by Turner et al. [22].
Although it is agreed that it is necessary to take into account the exposure, the views of the community, governance [15,23,24], the socio-cultural, economic and environmental context [25,26,27,28], these suggestions lack a scalable approach. The framework for vulnerability analysis in sustainable science, proposed by Turner et al. [22], can be adapted to the conditions of low-income urban territories exposed to floods [29] because it provides a detailed analysis by integrating more variables. Additionally, considering resilience as a component of vulnerability, it is possible to analyze which basic spatial units may recover faster after a disaster [30].
According to the framework for vulnerability analysis in sustainable science [22], there are three main elements that shape vulnerability, namely: Exposure to a hazard event, susceptibility, and resilience (Figure 1, adapted from [22]). Exposure is defined by the physical conditions of the system and its environment in order to face the threat [31]. Susceptibility offers a measure of the possible consequences that stakeholders may endure during a disaster, according to social values that may be monetary, ecological, of human life and psychological (among others) [32]. Resilience is the capacity of a system to react, resist, and recover from the impact of a disaster event [12,33]. The main goal of measuring vulnerability is to know and understand a system at risk, in order to define coping alternatives [34,35,36].
Vulnerability assessments rely on field data collection, generally through participatory techniques, in order to incorporate the local knowledge of the communities and to enhance the understanding and responsibilities of the communities and institutions in the disaster risk reduction process [37,38,39,40,41]. The participatory approach produces large amounts of qualitative data that needs to be properly analyzed with techniques for the analysis of categorical data and social surveys [42] such as multiple correspondence analysis (MCA) [43].
MCA is a powerful methodology when using categorical variables from surveys. It is an extension of the Correspondence Analysis and can be interpreted as a generalization of the Principal Component Analysis using categorical variables [44]. MCA has been used in many fields such as fire management [42], diagnosis and prevention of accidents [45], education and work insertion [46], and human exposure to heavy metals [47], among others. We have selected MCA for two reasons. The first is that data needs to be collected through surveys and the classification of variables resulting from expert evaluation renders data in qualitative scales, and the second is the great potential of the multivariate tool to perform an evaluation of each component of vulnerability or the joint analysis of the three (exposure, susceptibility, and resilience) in order to unveil its relative importance.
Colombia is a developing country [48] that classifies its municipalities by categories from 1 to 6 depending on their income, (with the sixth category being the worst condition and category 1 being the best condition) [49]; 87% of the Colombian municipalities are classified in category 6 [50] and 53% of Colombian municipalities have more than 25% of their population with unsatisfied basic needs. In addition, the country is frequently affected by floods, as until 2012 it occupied the tenth and eighth place in the world by the number of deaths and damages, respectively, generated by this type of hydro-meteorological disasters [51,52], with over 10 million people affected and more than two million fatalities between 1990 and 2012. It is worth noting that more than four million of those affected and almost 700 deaths were in the wet season of 2010–2011 [4]. These circumstances led the country to formulate policies and regulations on disaster risk management that require detailed risk assessment studies, including the assessment of vulnerability [53,54].
Most of Colombian territory presents a tropical fully humid climate, tropical monsoon, and savanna climates according to the Köppen–Geiger climate classification [55,56]. These climates can be found in other South America countries such as Ecuador, Perú, Venezuela, and Brazil; in African countries like the Democratic Republic of the Congo, Uganda, the Republic of the Congo; and in almost all the countries in Southeast Asia. Although those are the main features of climate in the country, the three selected case studies differ between them on the basin response time. In the case of Amalfi, floods are sudden or torrential due to the mountainous regime of the river, and in the cases of Caucasia and Plato municipalities floods are slow due to their location on the floodplains of the rivers. The methodology proposed in the present study may apply not only communities in the developing world with similar climate features to those in Colombia but also to different kinds of flooding.
The main goal of this research is to formulate a vulnerability indicator for low-income urban territories in flood-prone areas. For that purpose, we evaluated exposure, susceptibility, and capacity, adapting the framework proposed by [22] and we used MCA to identify and classify the most important variables regarding vulnerability in order to calculate a particular indicator for each case study. This paper is organized as follows. Section 2 outlines the case studies and the methods used in the present study. In Section 3 we present the results for each one of the case studies, and in Section 4 we present the discussion and conclusions.

2. Materials and Methods

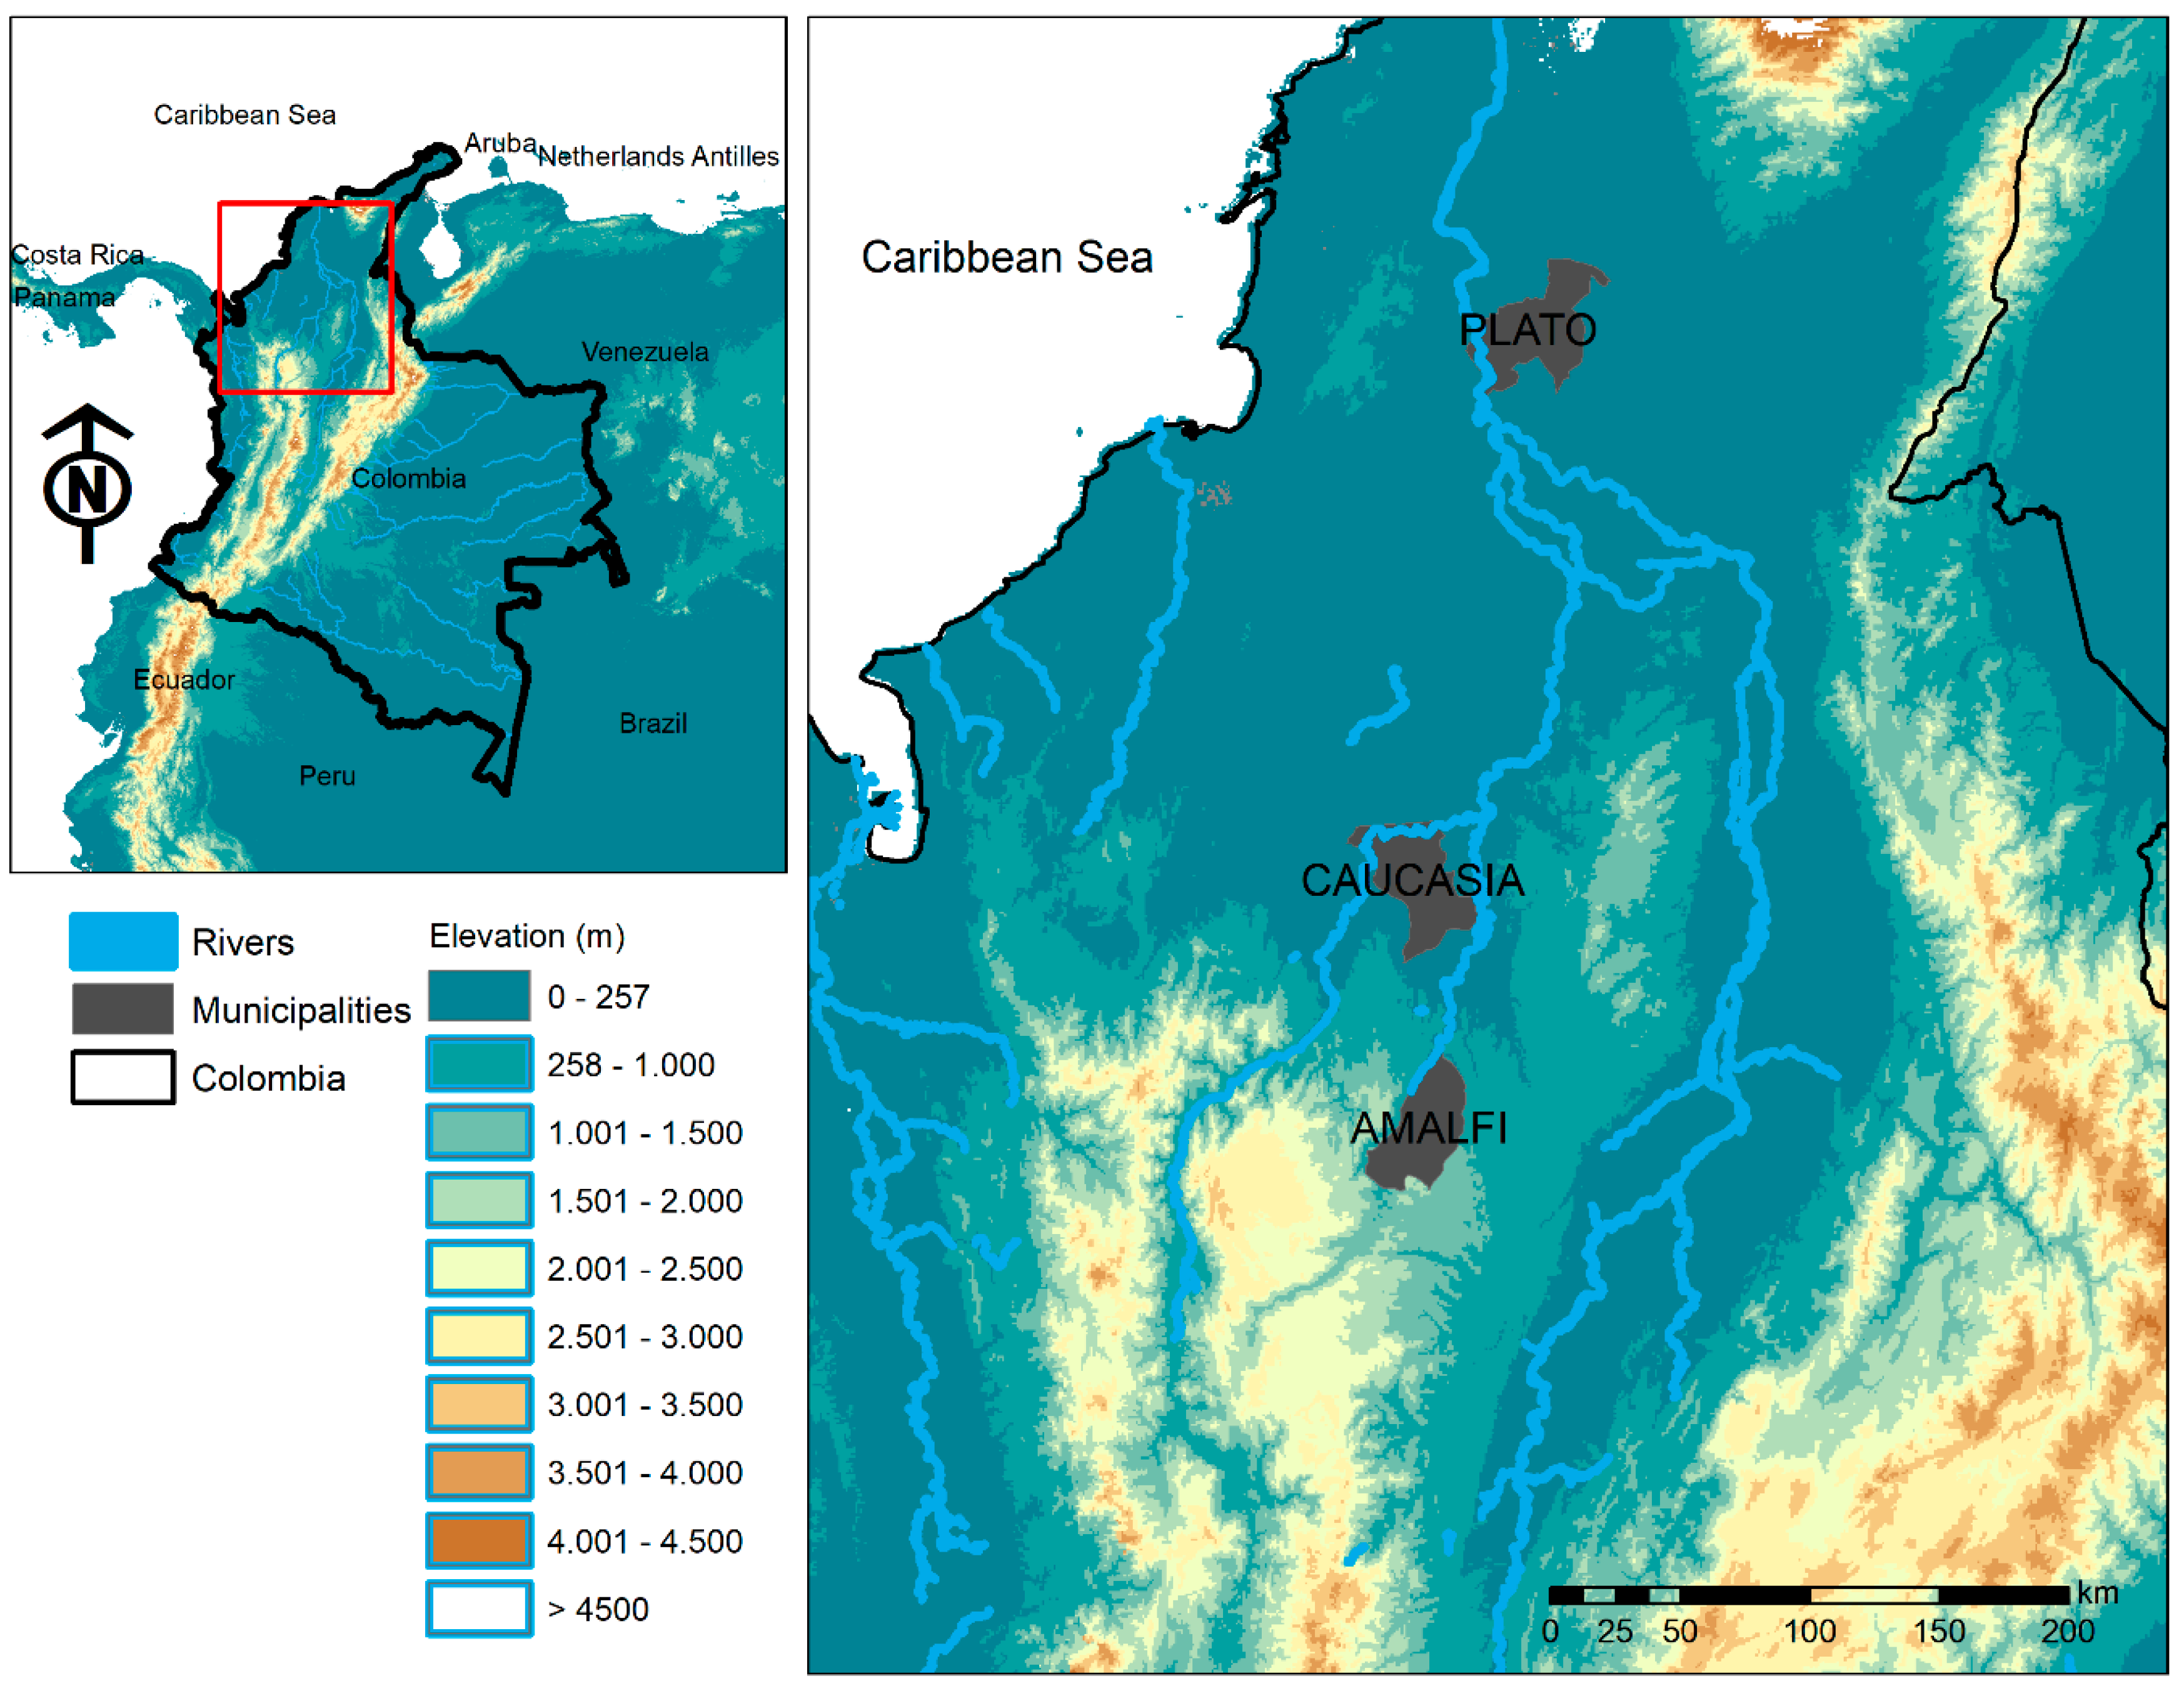
2.1. Municipalities, Case Studies

We selected case study areas within three Colombian municipalities [29,57]. These three municipalities share common features such as accessibility, security, socioeconomic, scarcity in human, financial, and technical resources to comply with the demands of national Colombian policies for disaster risk management [53,54], and are classified in the lowest budgetary category in the country (category 6) [49] (Figure 2). In terms of urbanistic features, they have in common a disorganized occupation, especially around the protected areas by the riverbanks. The case studies are (i) Amalfi with 25.6% of the population with Unsatisfied Basic Needs (UBN), (ii) Caucasia with 48.5%, and (iii) Plato with 57.2% [58]. In addition, they have in common that they are constantly affected by floods (Figure 3).
These case studies are classified according to the basin response time. There are sudden or torrential floods [59,60,61,62] that usually occur due to an accelerated rise of water along a river or a specific area, produced by sudden and intense rains. They are unexpected, of short duration, and usually cause great damage to the population due to the fact that they leave little time for reaction (e.g., in the Amalfi case study). There are also slow or alluvial floods [59,60,61,62] that occur when there is persistent and generalized rain within a basin, generating a progressive increase in river flows until the water exceeds the maximum storage capacity, resulting in overflow and the consequent flooding of the flat areas adjacent to the main channel. These floods are slow and long-lasting (Plato and Caucasia case studies).
The three case study areas were selected due to the high flooding impact reported in the urban area, especially during the rainy season of 2010–2011. Mapping was done with voluntary participation through social cartography exercises as well as community and local administration participation with the research team, in terms of sharing available information, participation in workshops, and interviews with officials related to risk management [66].

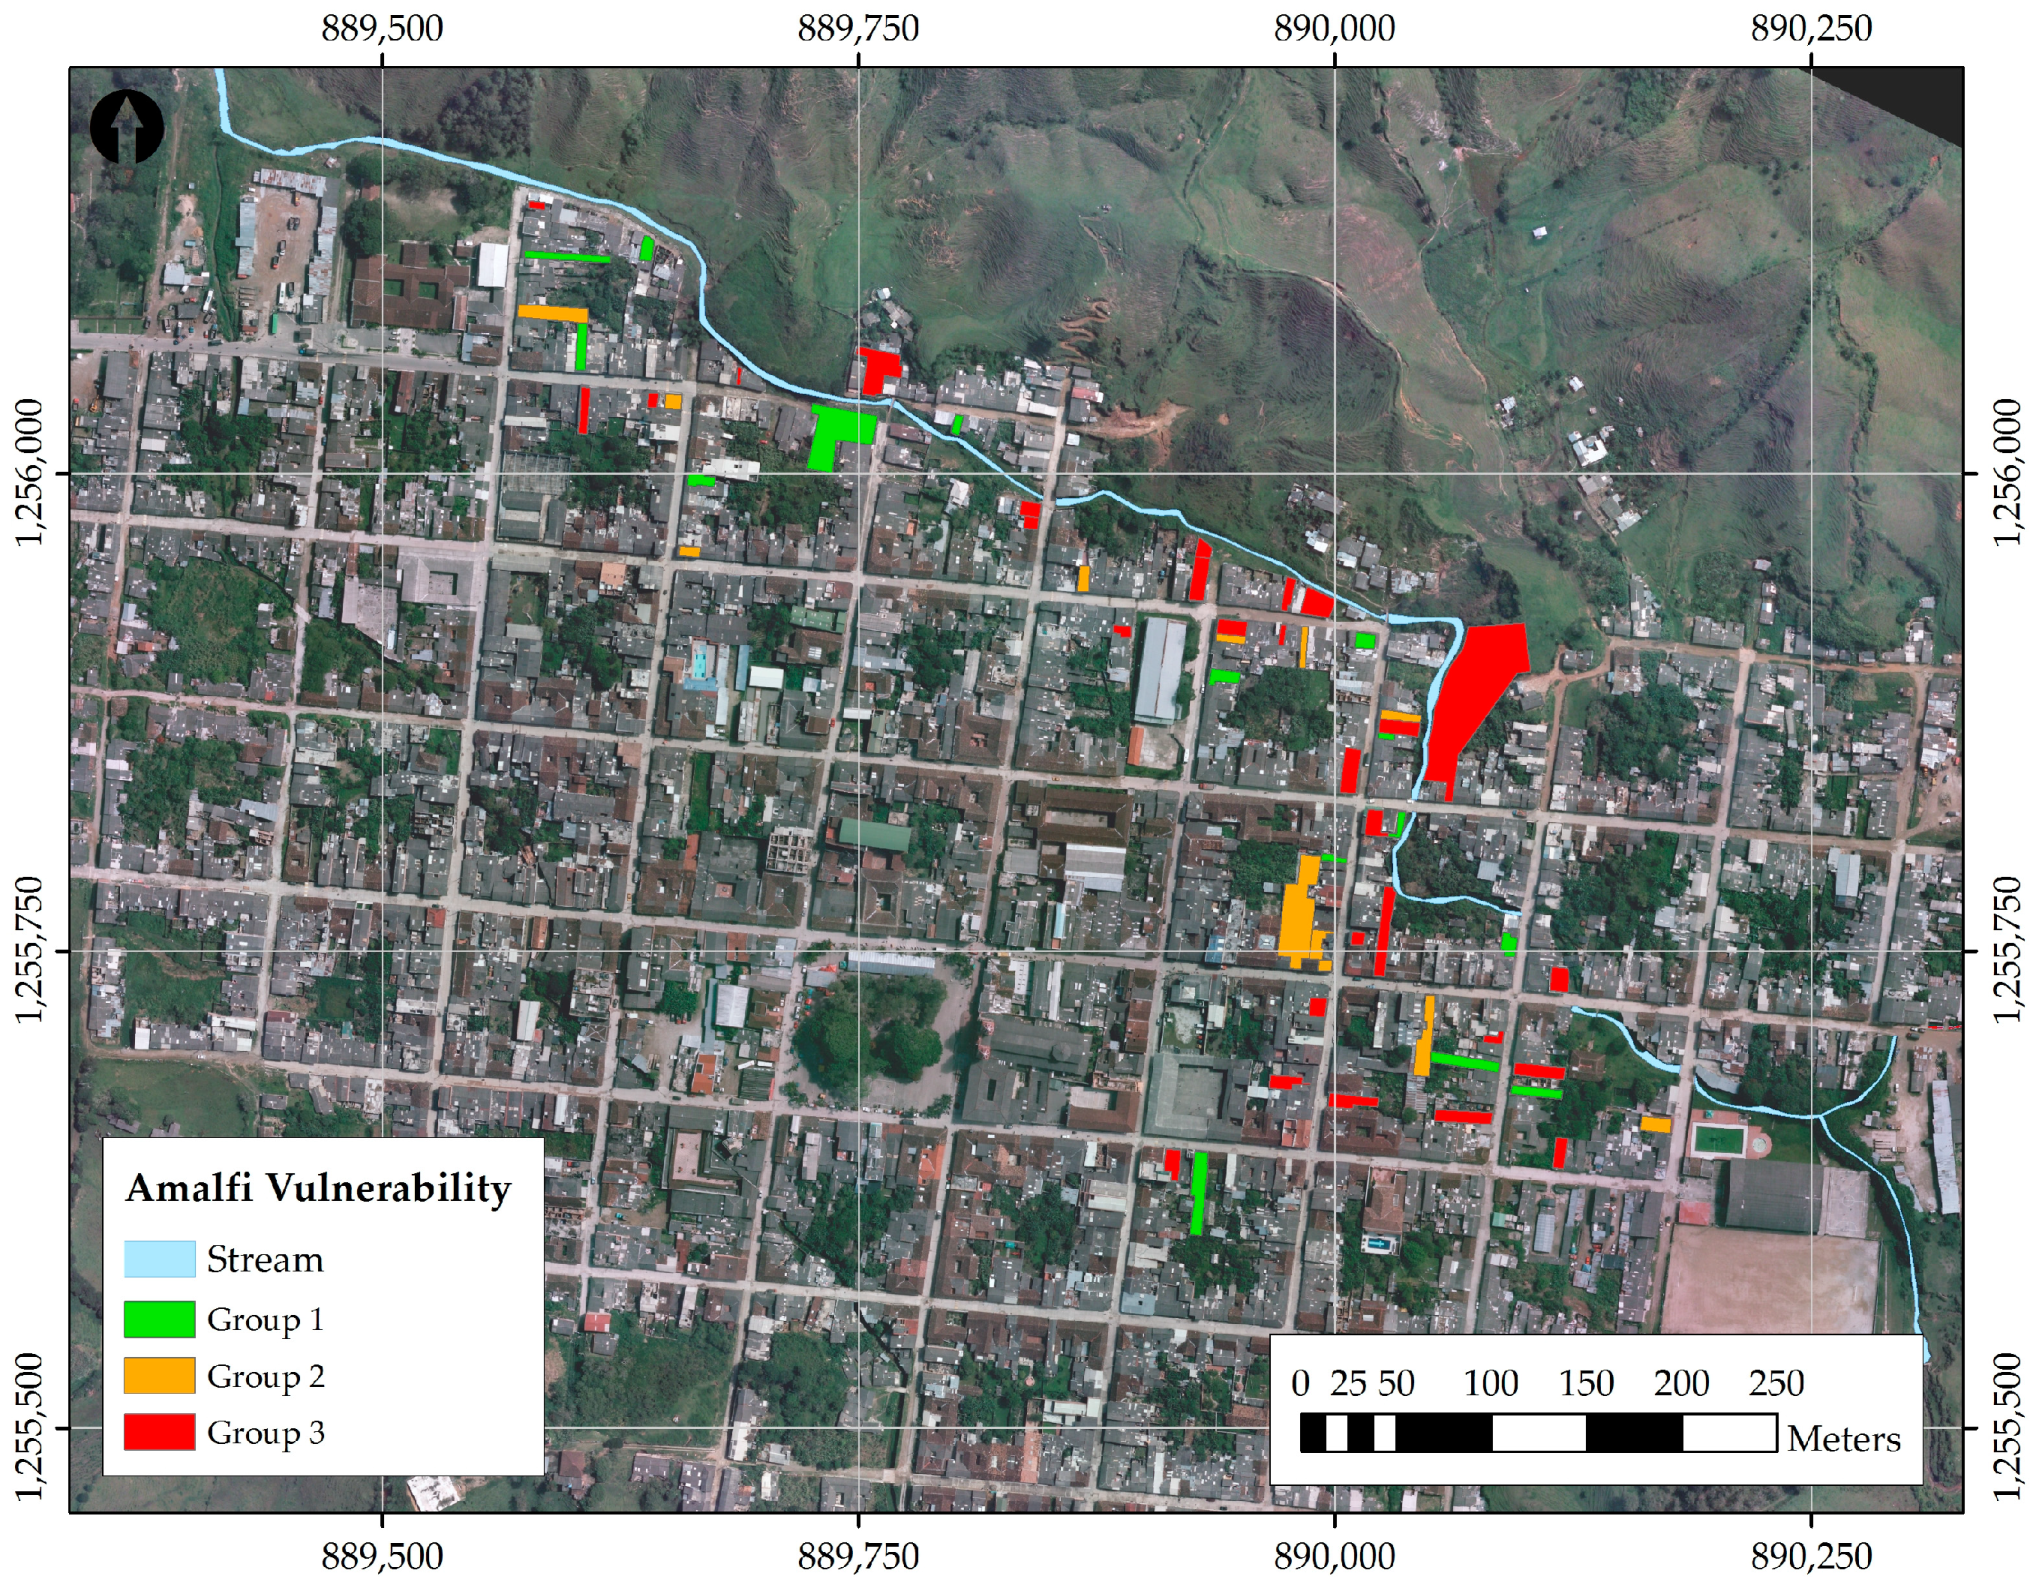
2.1.1. Amalfi, Antioquia

The Amalfi municipality is located in the northeast of the department of Antioquia, on a plateau, at an altitude of 1550 m above sea level [67]. Geographically it is located between 6° and 54′ north latitude, and 75°04′ west longitude. Its urban center is surrounded by three small rivers which have caused floods in the past and 433 floodable plots of land have been identified in the area prone (Figure 4) [57] to sudden flooding. In those events, the roads have served as waterways for the small rivers. Among the rivers inside the urban area is the Tequendamita river.

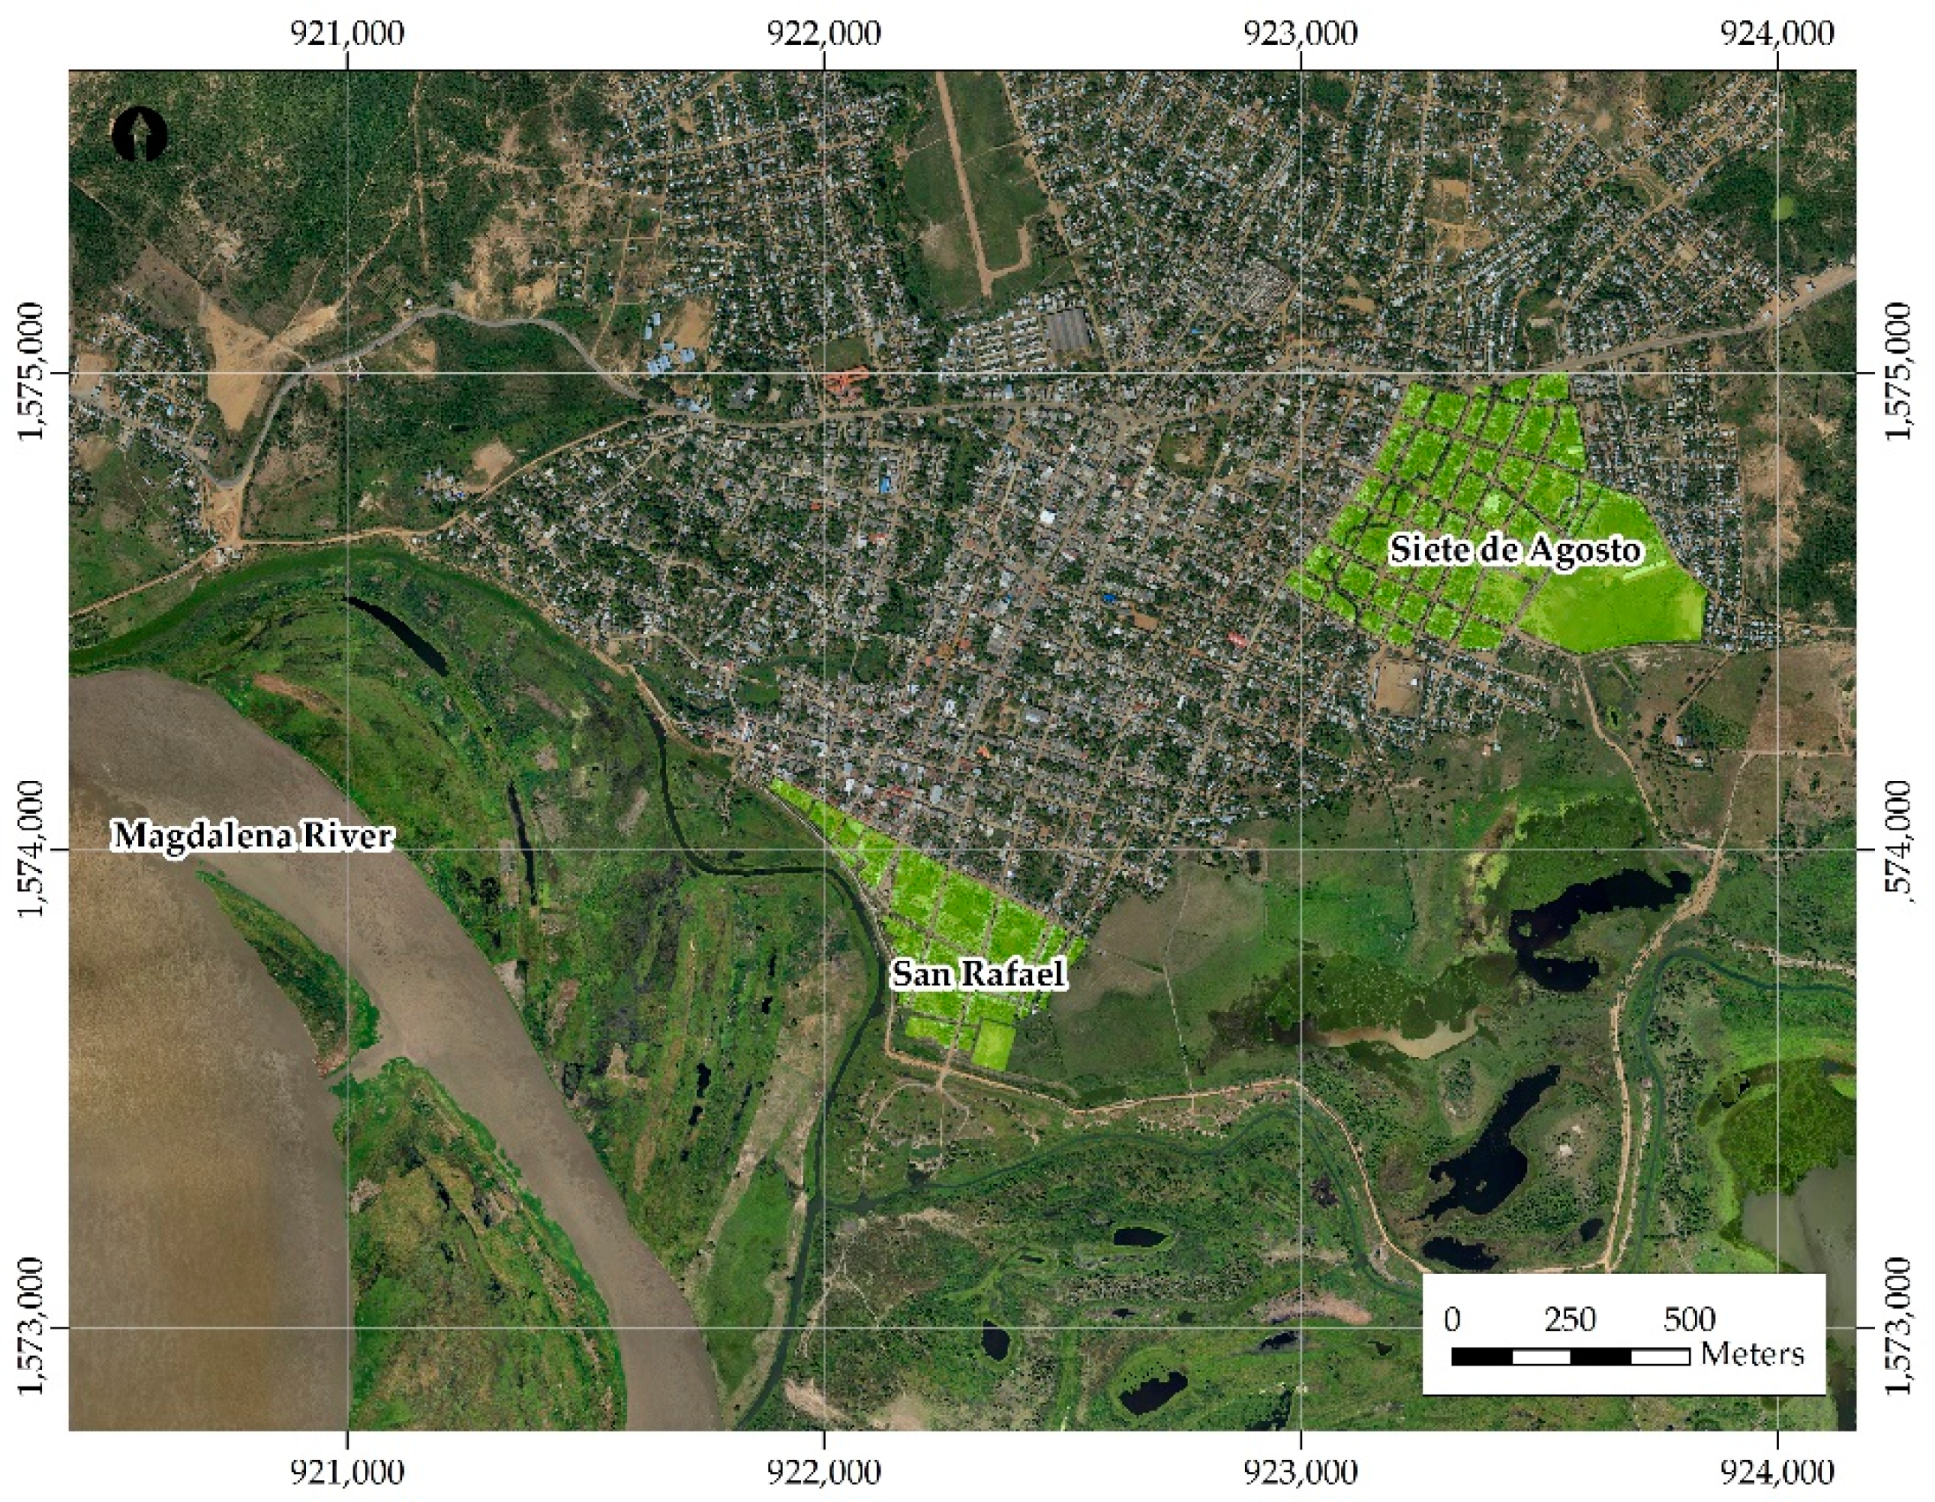
2.1.2. Plato, Magdalena

The municipality of Plato is located in the center of the Magdalena department in the sub-region of Valle de Ariguaní, on the right border of the Magdalena River. Geographically it is located between 9° and 46′ north latitude, and 74°46′ west latitude. The geomorphology developed in the Magdalena river basin is made of senile valleys, with ample flooding plains, alluvial terraces, strong erosion and deposit zones, and main and secondary channels as products of the digression of the river due to the low slope [68].
Two urban territories were evaluated: The Siete de Agosto and San Rafael neighborhoods, both surrounded by drainage channels configuring a waterway between the Magdalena River and the marshes from the wetland complex of Malibú (Figure 5). These were chosen as they are affected by slow-onset flooding caused by the invasion of the wetlands, the modification and occupation of the drainage channels connecting the river with the wetlands, and due to other factors like the burning and disposal of solid waste and the lack of alternative wastewater drainage systems.

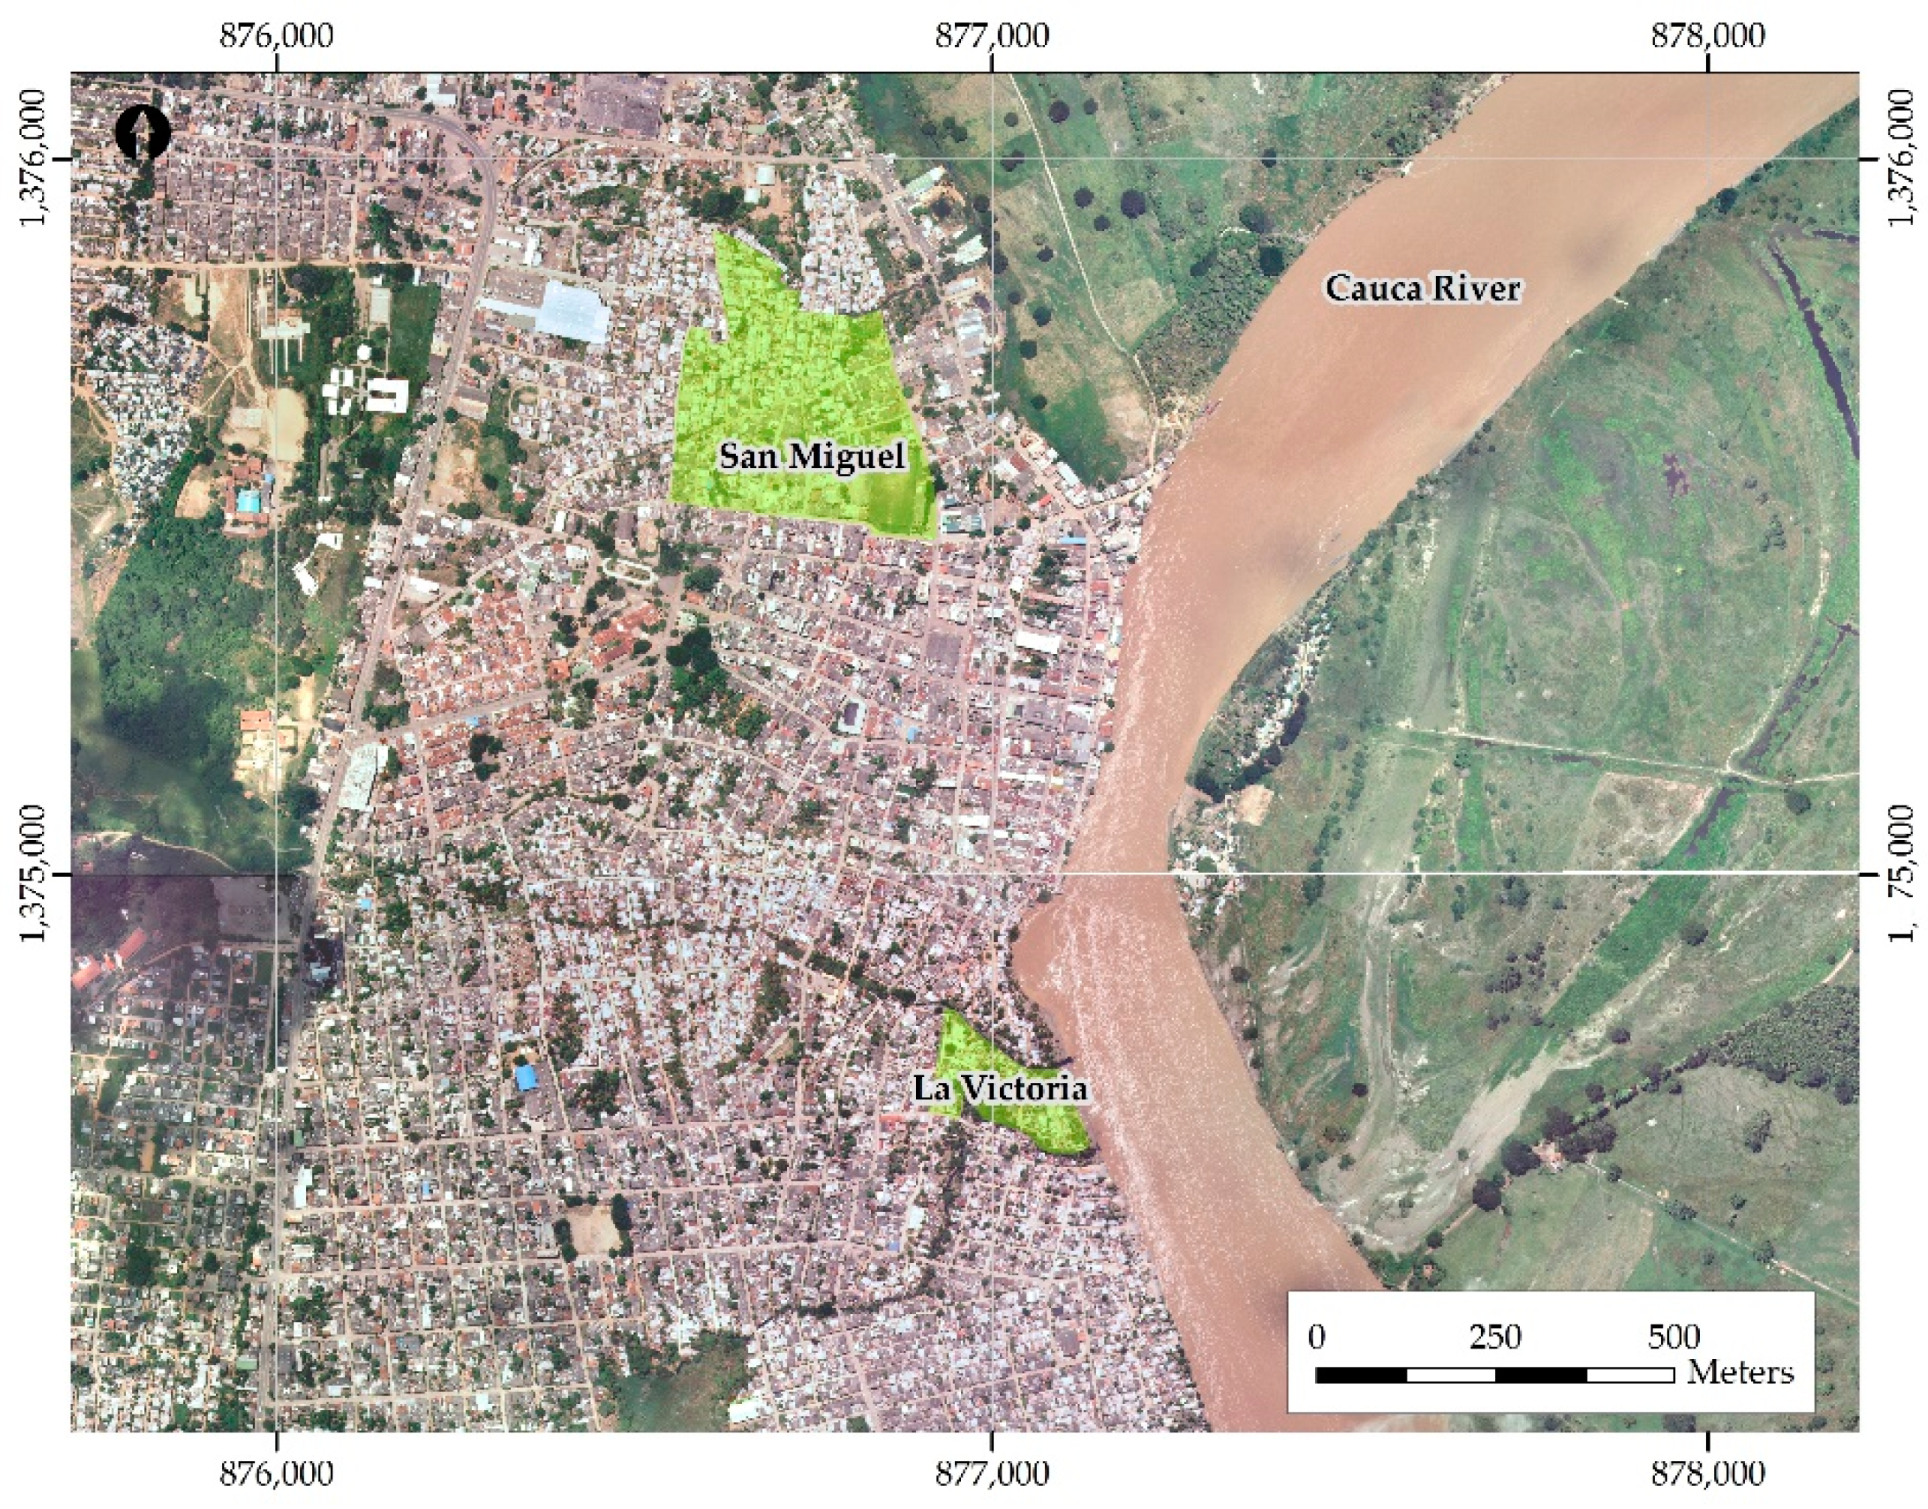
2.1.3. Caucasia, Antioquia

The municipality of Caucasia is located in the north of Antioquia, on the border with the Córdoba department. Geographically it is located between 7°58′ north and 75°11′ west latitude. Due to its geographical location, this is one of the most important municipalities in the region, close to the confluence zone of important rivers such as the Cauca and Nechí rivers. The height of the urban center is 50 m above sea level [69]. It is located among an important system of wetlands and natural channels, which have deteriorated due to human activities (cattle raising, alluvial mining, and agriculture) [29], with part of its territory located on the alluvial plain of the Cauca River.
Two urban areas were evaluated, both presenting slow-onset flooding: The La Victoria and San Miguel neighborhoods (Figure 6). The communities from these two neighborhoods are socio-economically vulnerable populations, living in households with unsatisfied basic needs (UBN), displaced by violence, and with high rates of unemployment or work in informal activities.

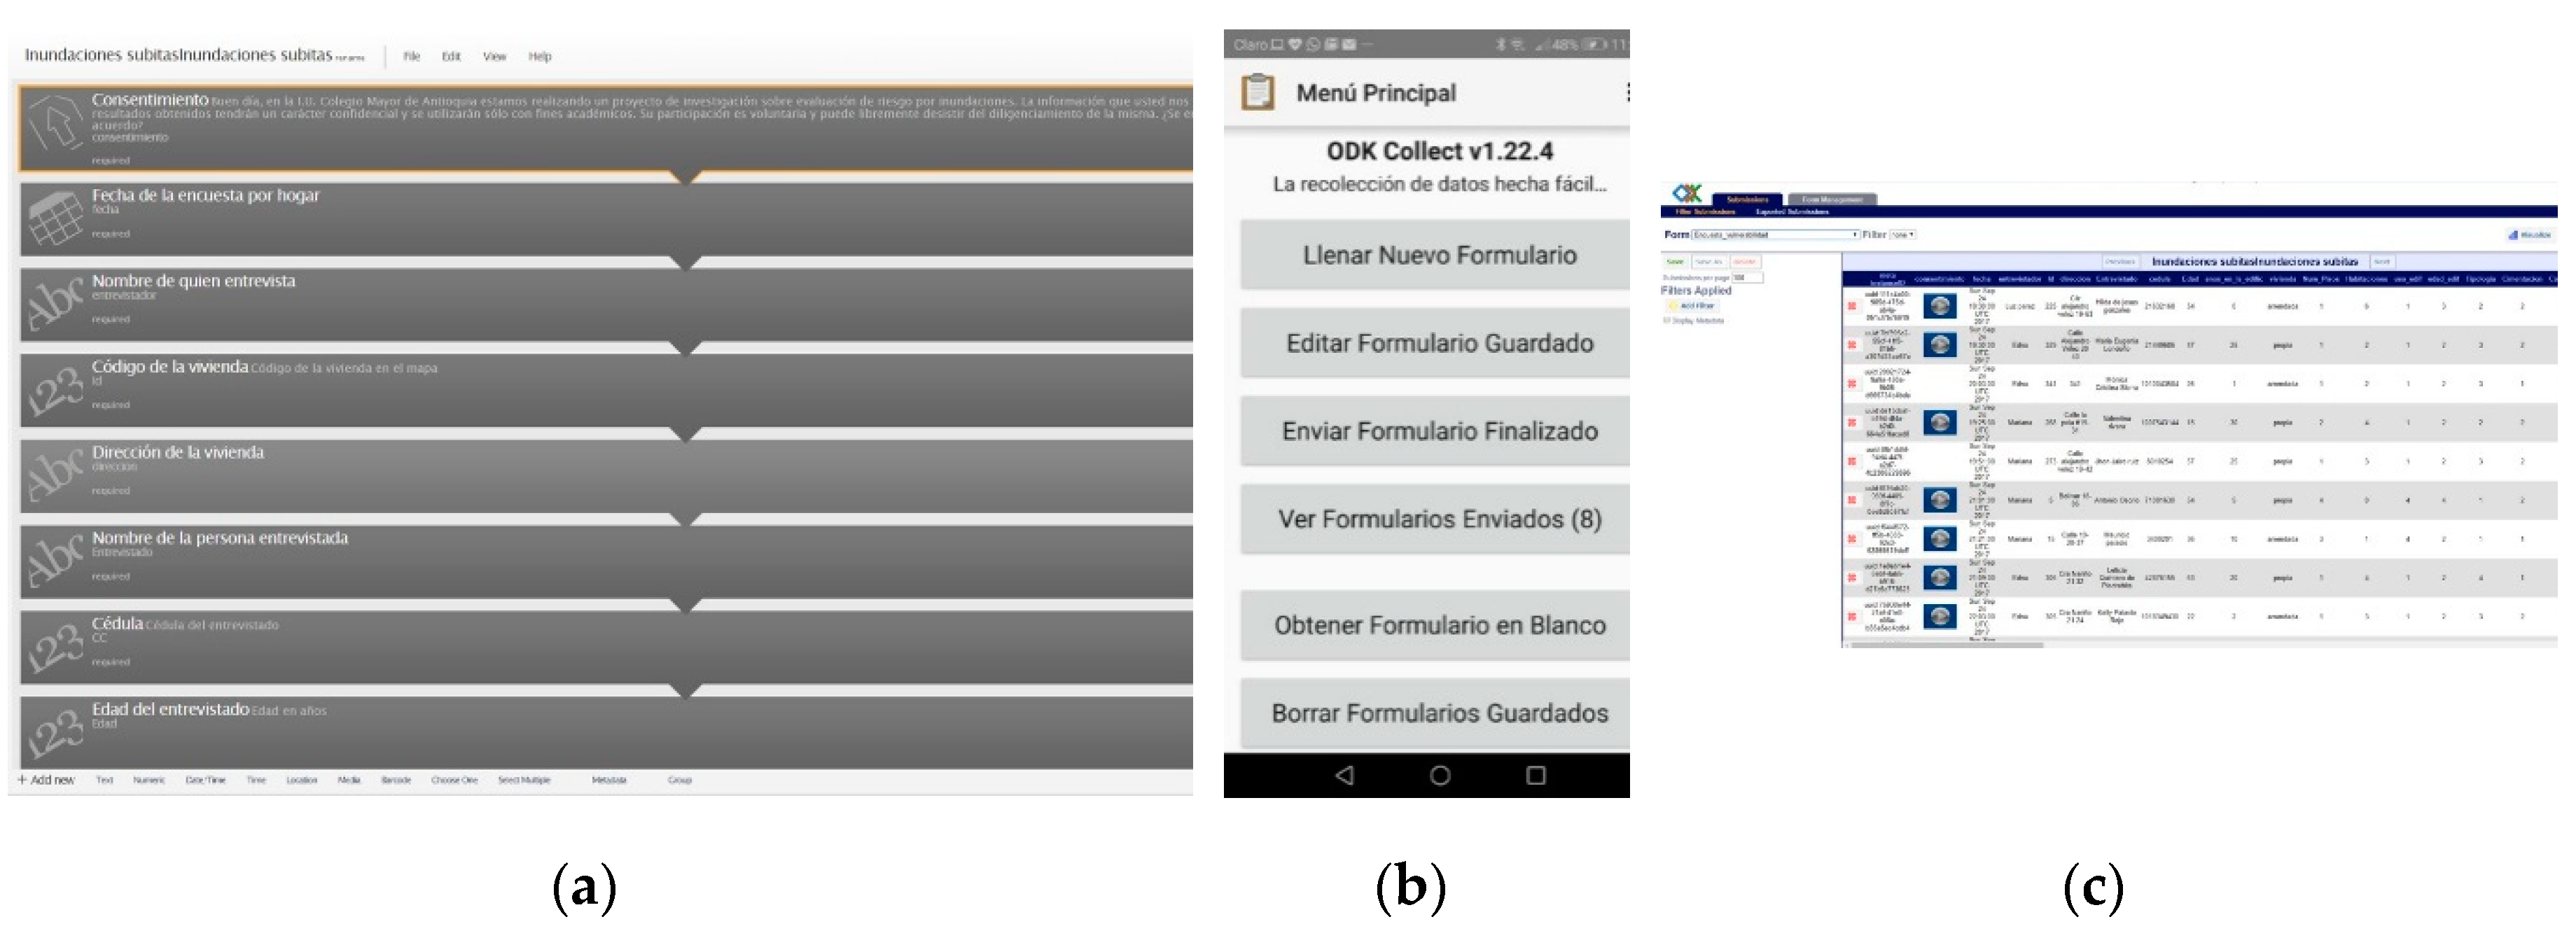
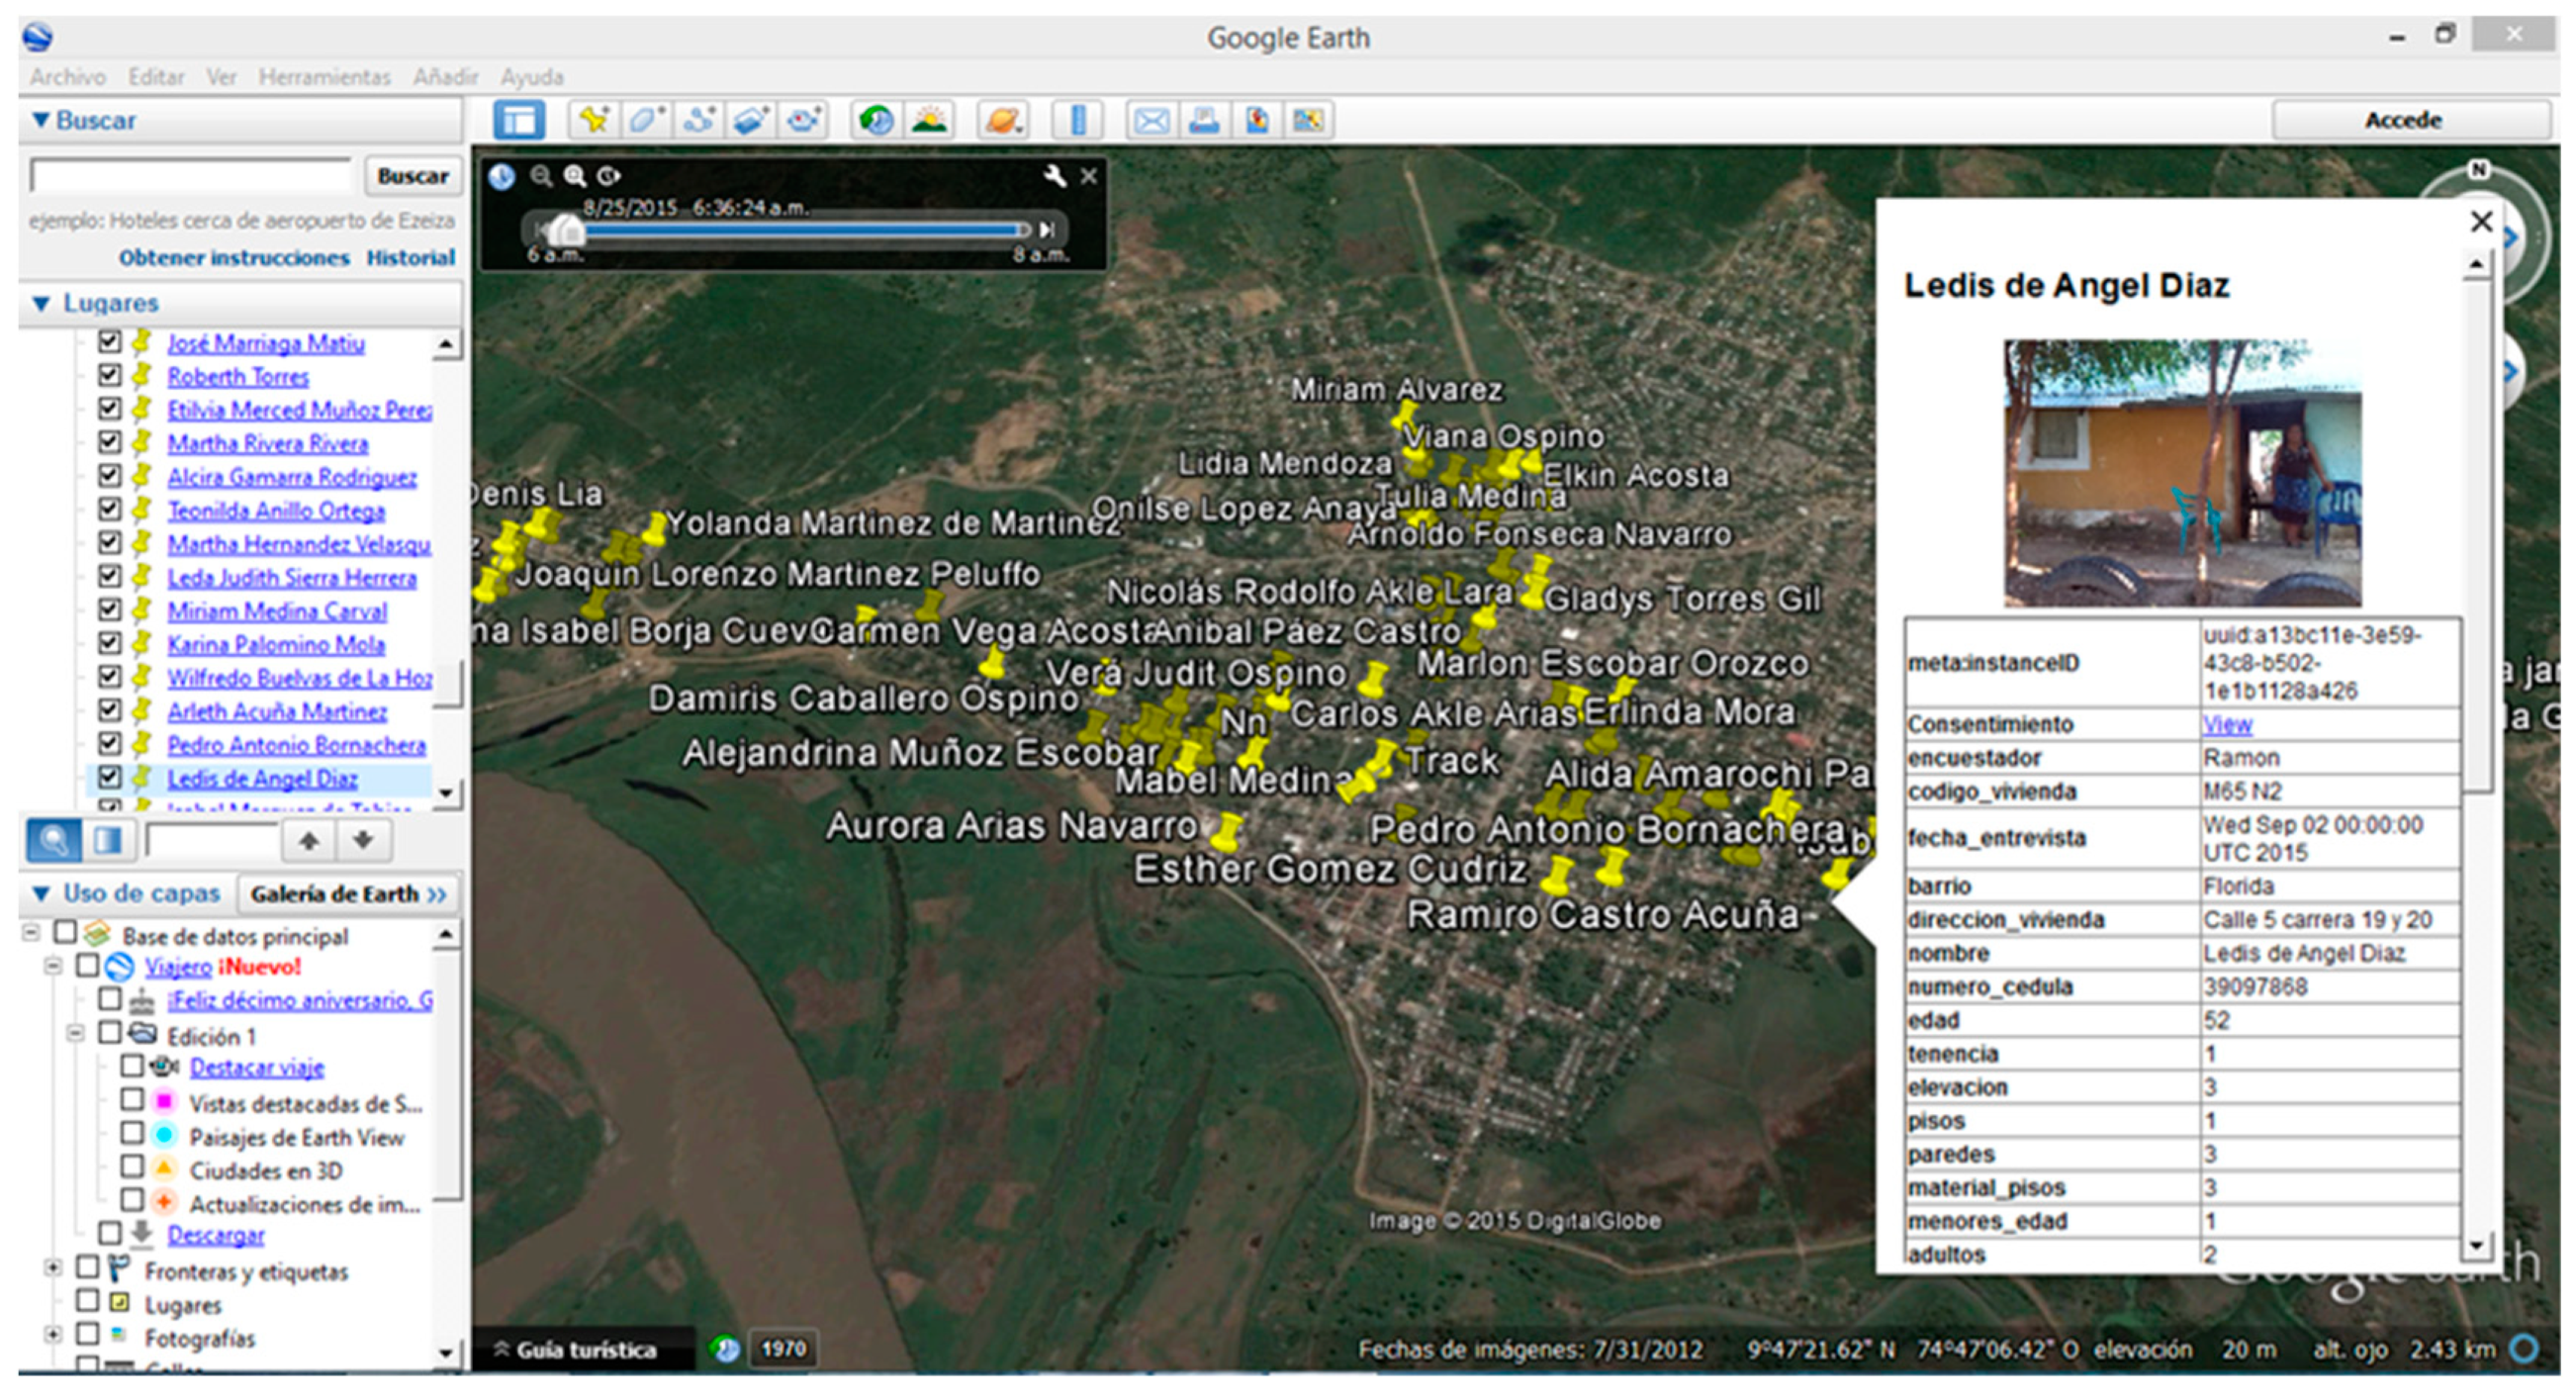
2.2. Data Collection

The variables representing the three components of vulnerability [22]—(i) exposure to a hazard event (E), (ii) susceptibility (S), and (iii) resilience (R)—were selected from the literature [14,70,71,72,73,74], refined, and qualified in workshops with 13 experts in the fields of disaster risk reduction, geology, civil engineering, environmental engineering, and social sciences. The selected variables (Table 1) were included into a survey to collect information from each household. We tried to obtain most of the variables from the public and free data sources, as recommended in [30].
Generally, the variables used to define the exposure (E) component are linked to the physical aspects of the infrastructure (location, quality of the built, and natural environments). In this research, according to suggestions by Turner et al. [22], we also sought to integrate other social aspects such as the presence of vulnerable people, the conditions of habitability in housing, and the losses and damages caused by floods. The variables of the S component are related to those characteristics that indicate a history and experience with floods and flood damage. The R component consists of a selection of variables that are useful to measure the ability of people to face the adverse consequences of floods according to the available resources and their skills [29].
The qualification of the variables given by the experts define scales of vulnerability depending on the possible outcomes of the variable in each household in Low, Medium and High, and a numerical value from 0 to 1 (0 no vulnerability—1 the highest vulnerability). Table 2 presents an example of the possible alternatives given to the surveyor for the variable Typology of the building—material of walls and floors (E), and their corresponding classification as high, medium or low [11]. Once the survey was designed, we calculated a statistically significant random sample of households to be surveyed in the case studies. The data collection was performed at household level as it is the smallest geographical unit for measuring vulnerability conditions. This spatial scale allows a bottom-up approach that can be generalized in bigger units (blocks, neighborhoods, etc.).
For the data collection, we used the Open Data Kit-ODK free and open-source software, developed by Washington University [75]. We used three applications: “ODK Build” for the design of ordered and clear surveys (Figure 7a); “ODK Collect” v.1.22.4, v.1.5.0, and v.1.7.0 to load the predesigned surveys and perform the fieldwork with mobile phones with Android operating system version 4.3 (Figure 7b); and the “ODK Aggregate” application necessary to store the information in an online server that finally allows processing and data tabulation (Figure 7c).
All datasets from the surveys were spatially referenced using Essentials GPS v.4.4.22 software previously installed in all the phones used. In this way, it was possible to produce maps for visualization and processing of data in licensed or free geographical information systems (GIS) (ArcGIS 10.3 and Google Earth v.7.1.7.2606 and v.7.3.0.3832). See Figure 8.

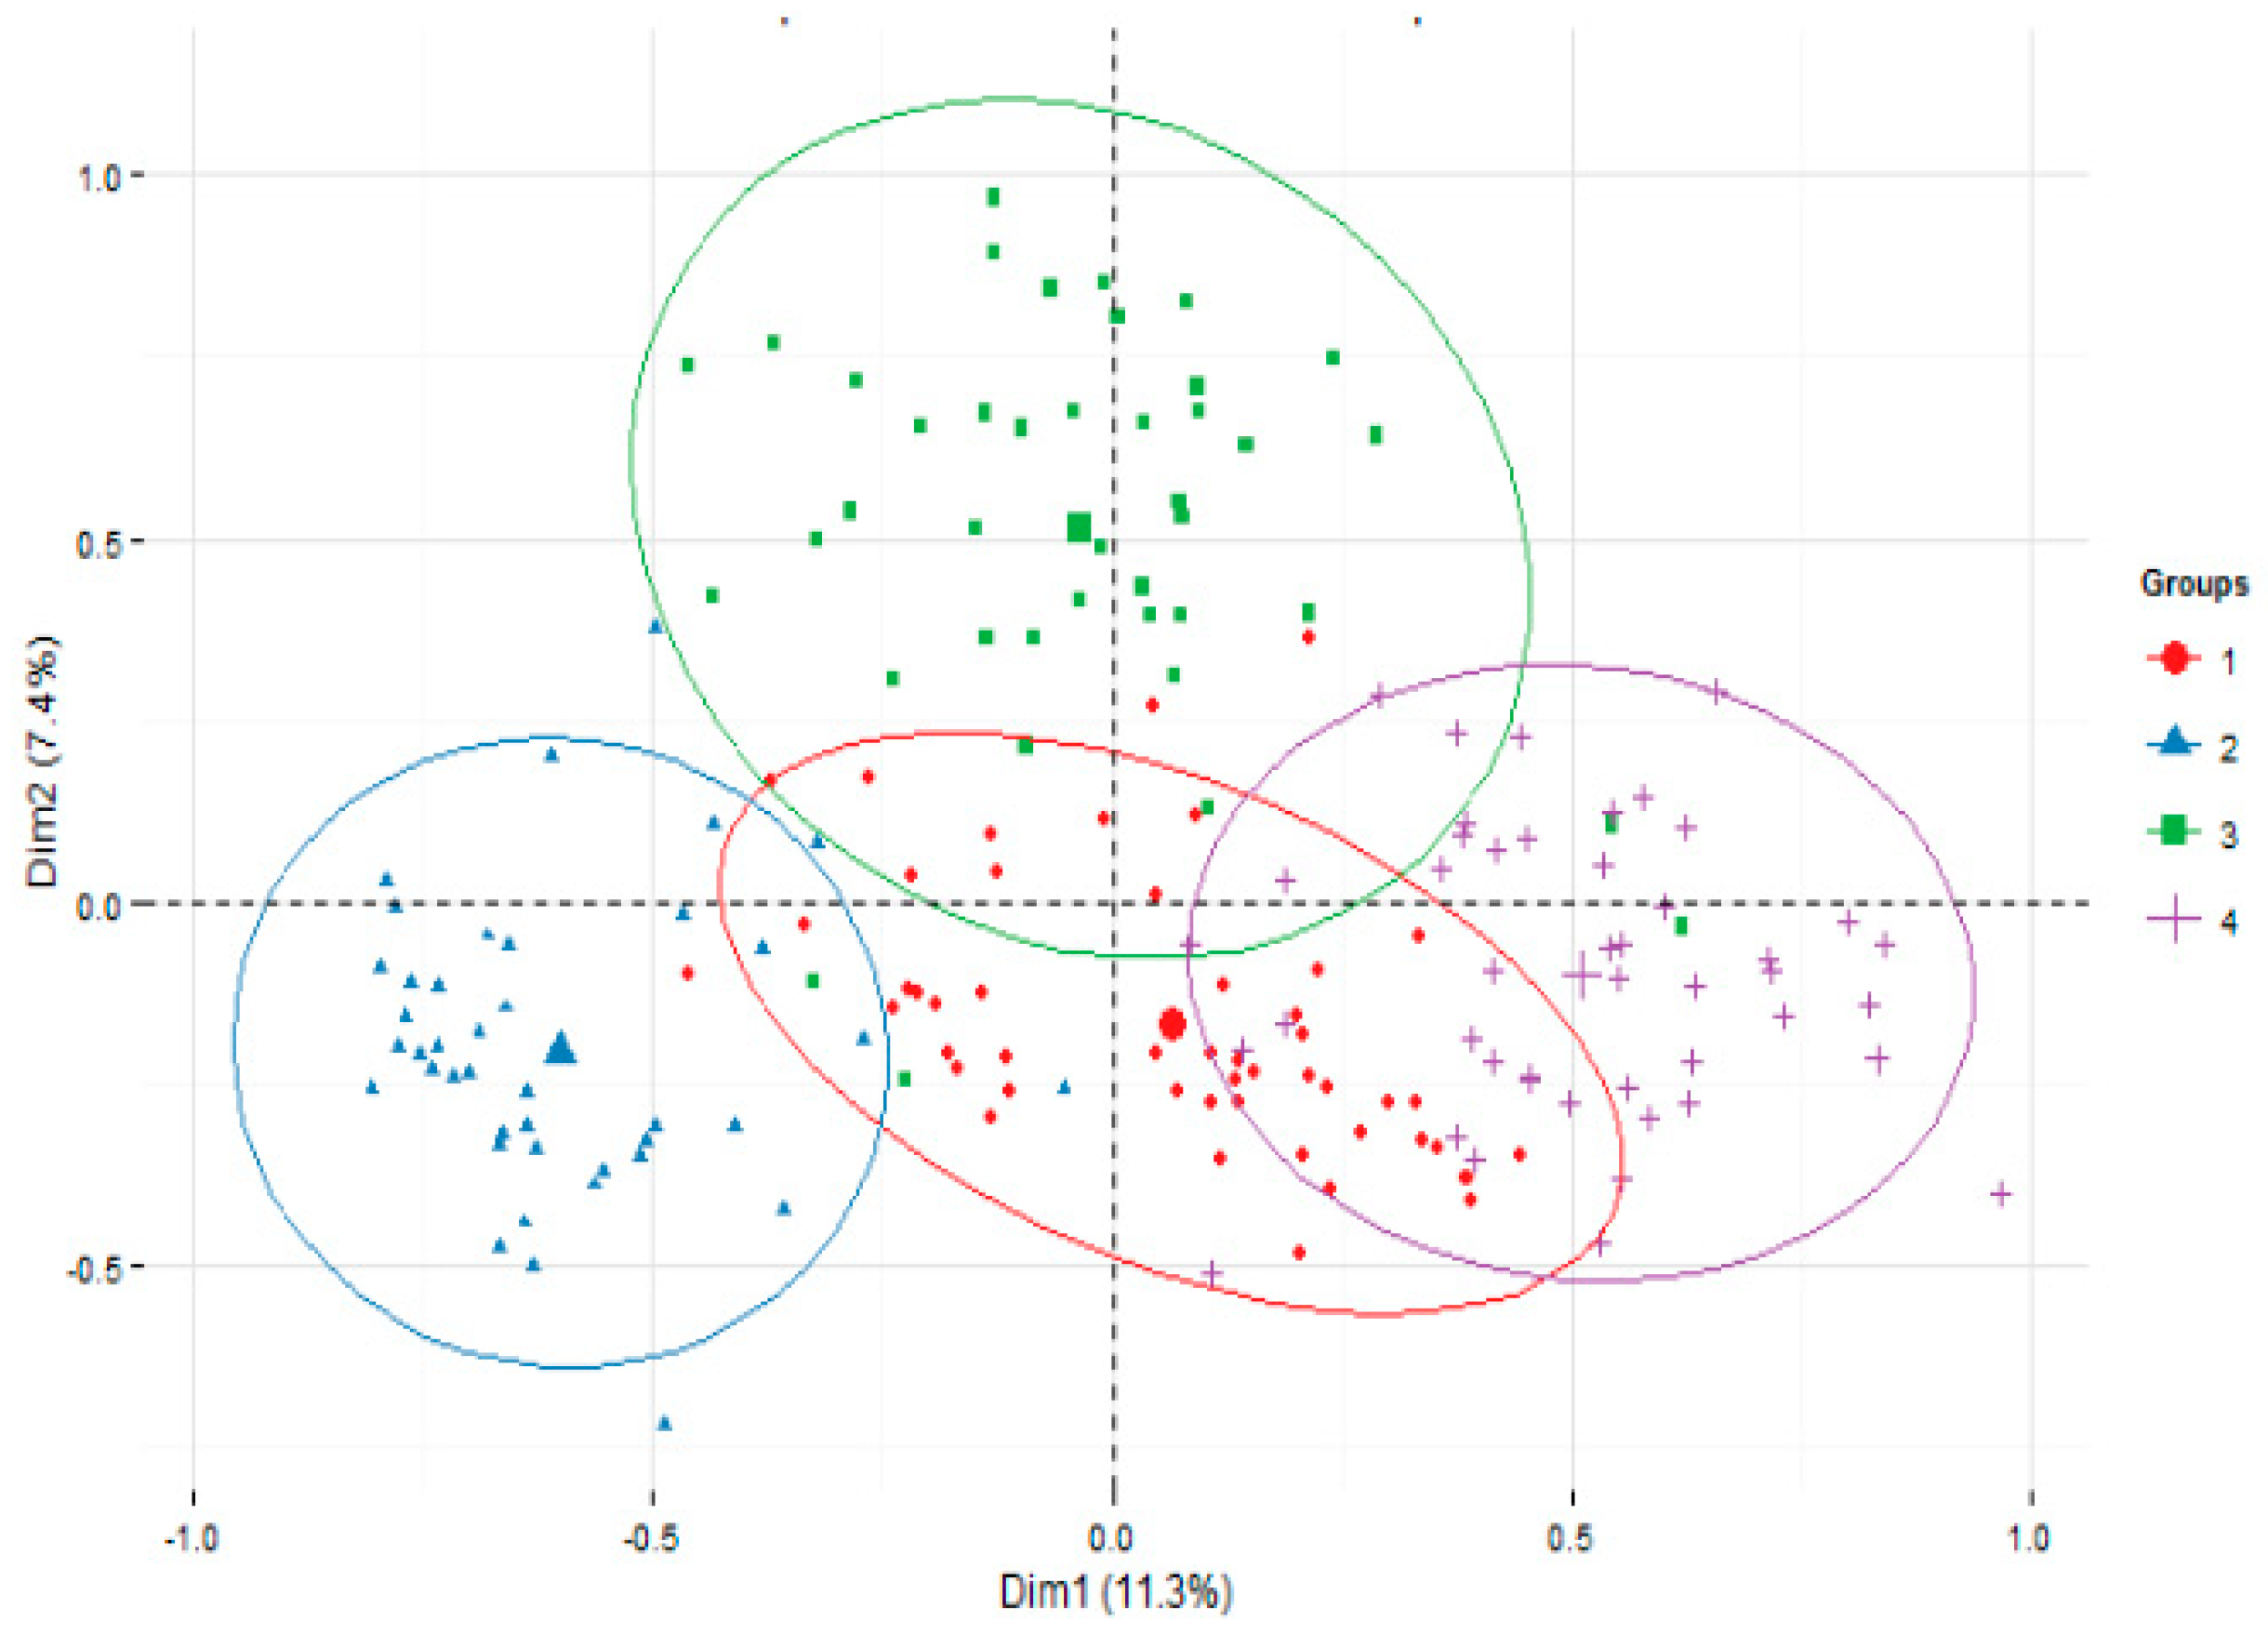
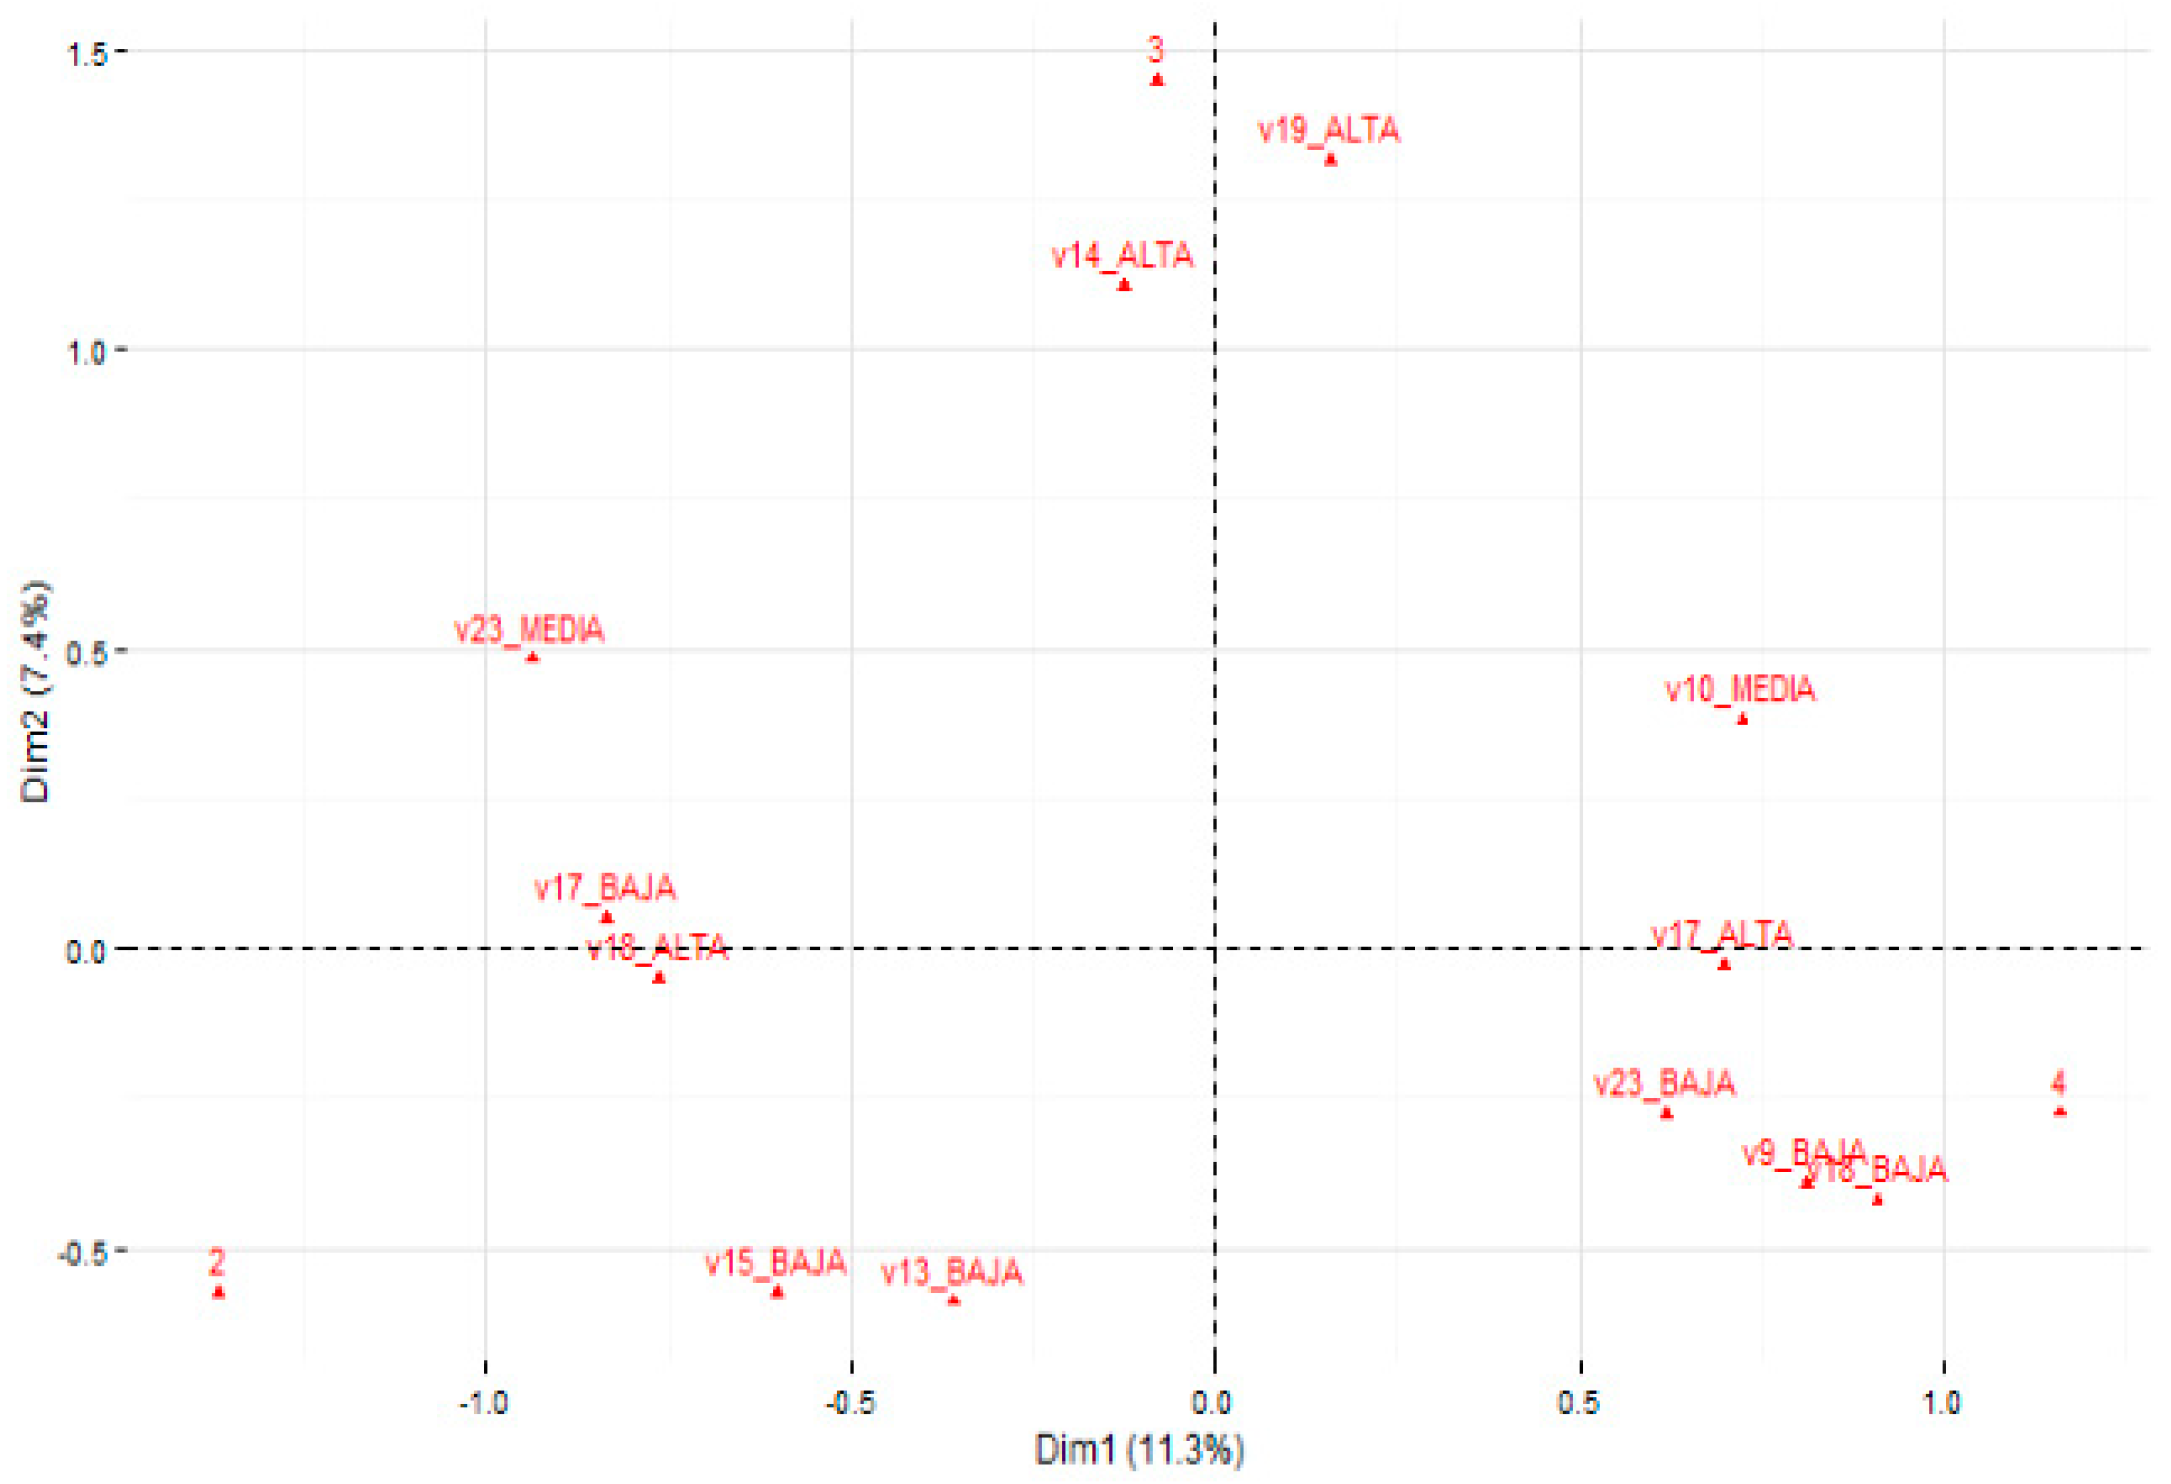
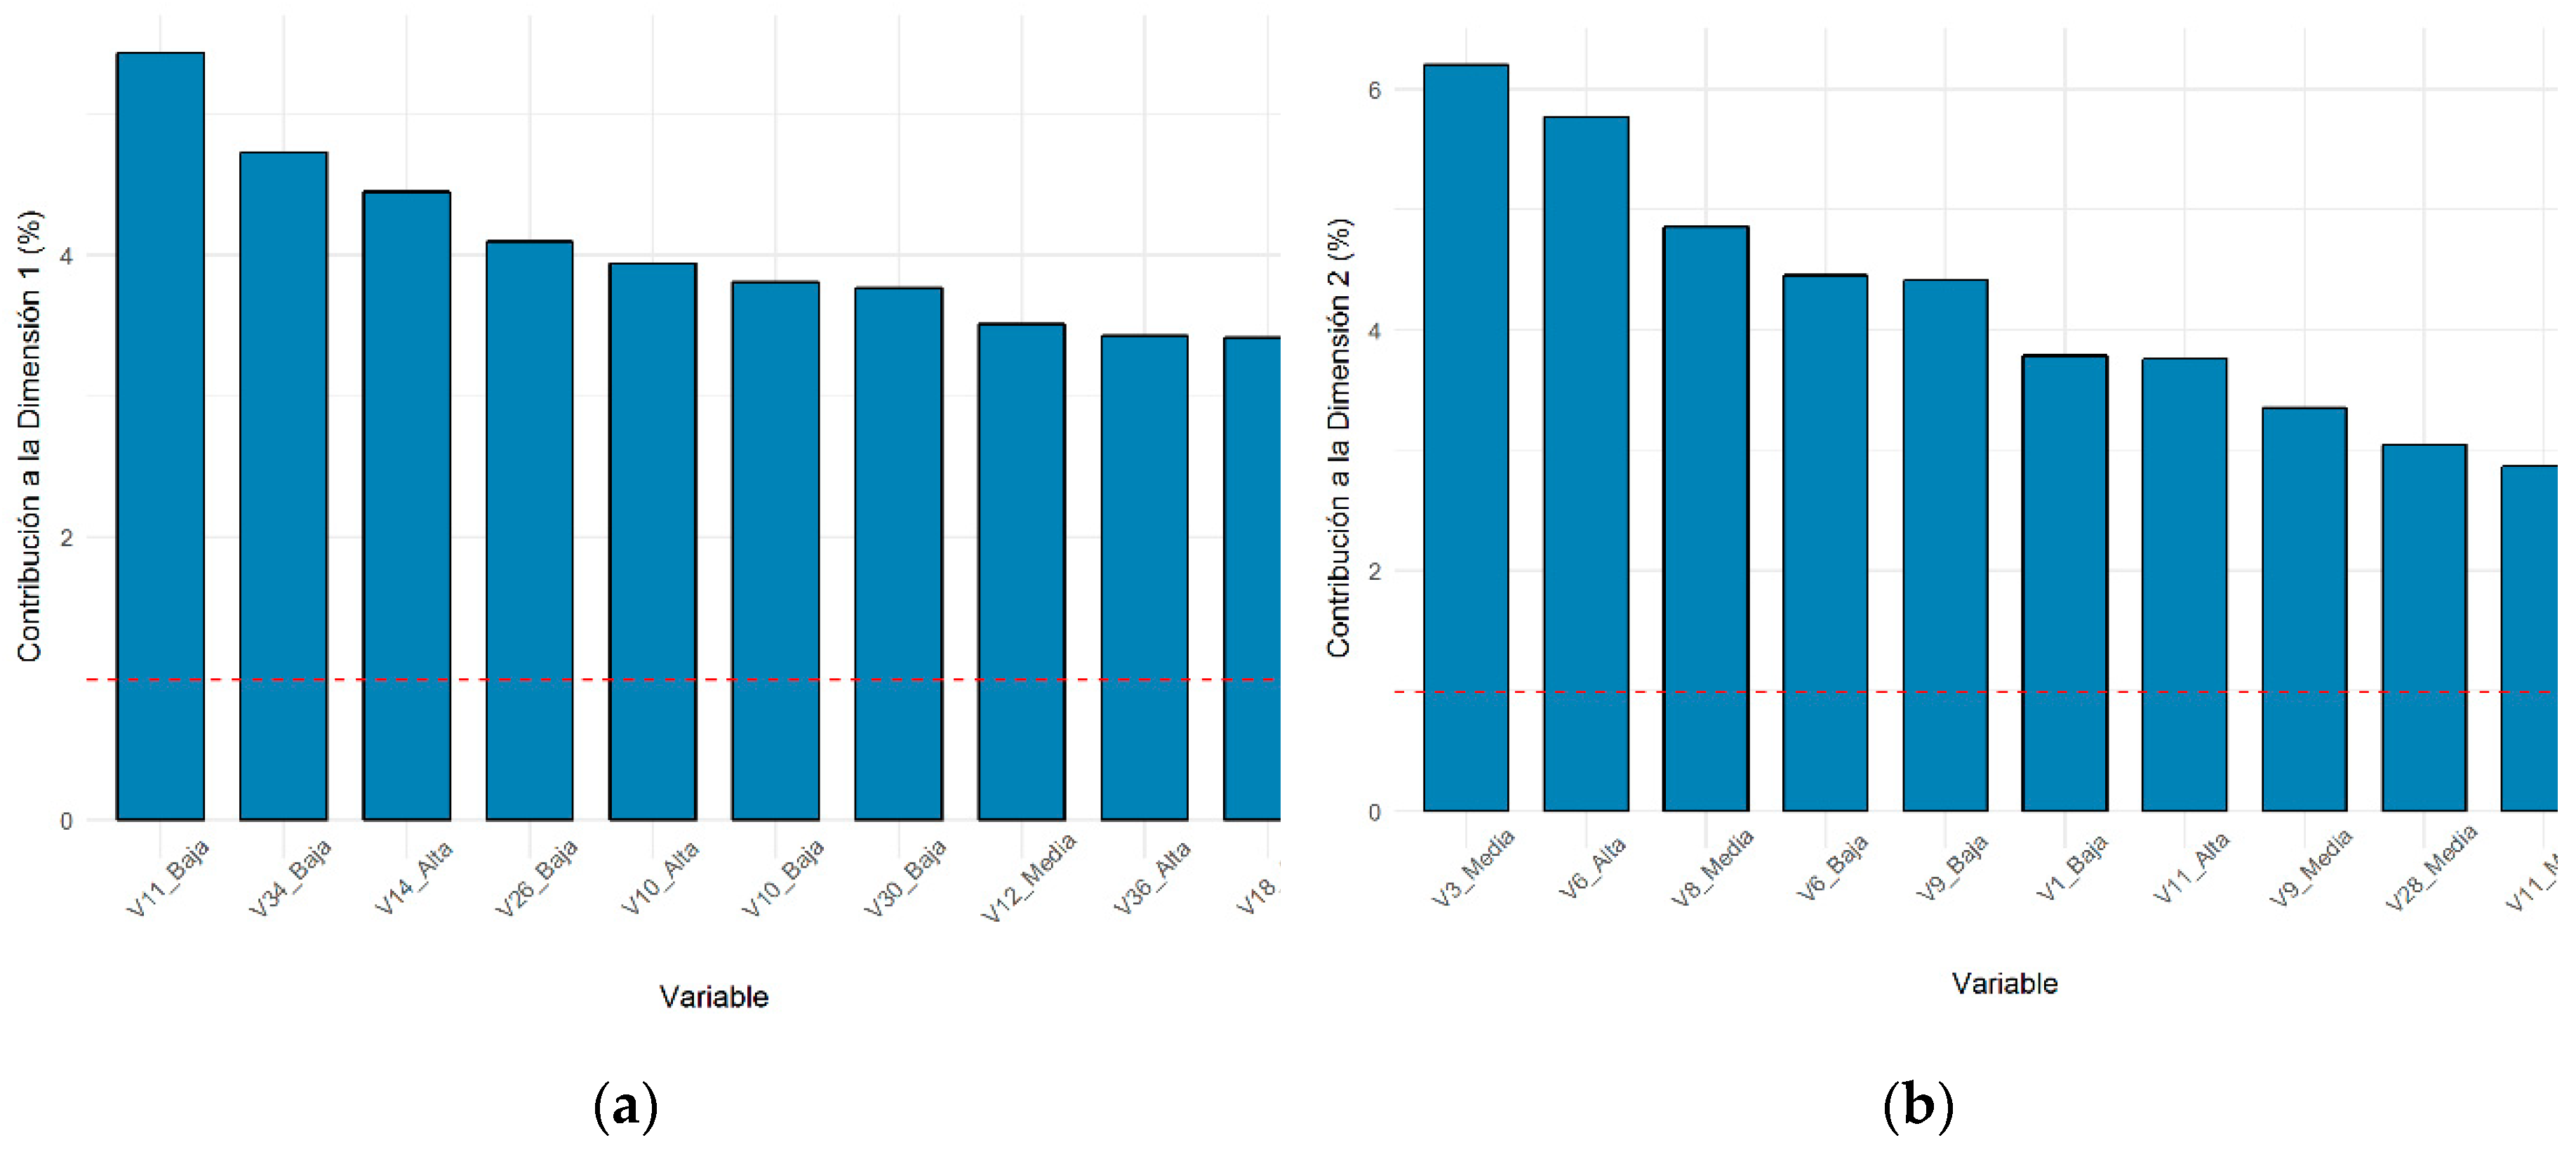
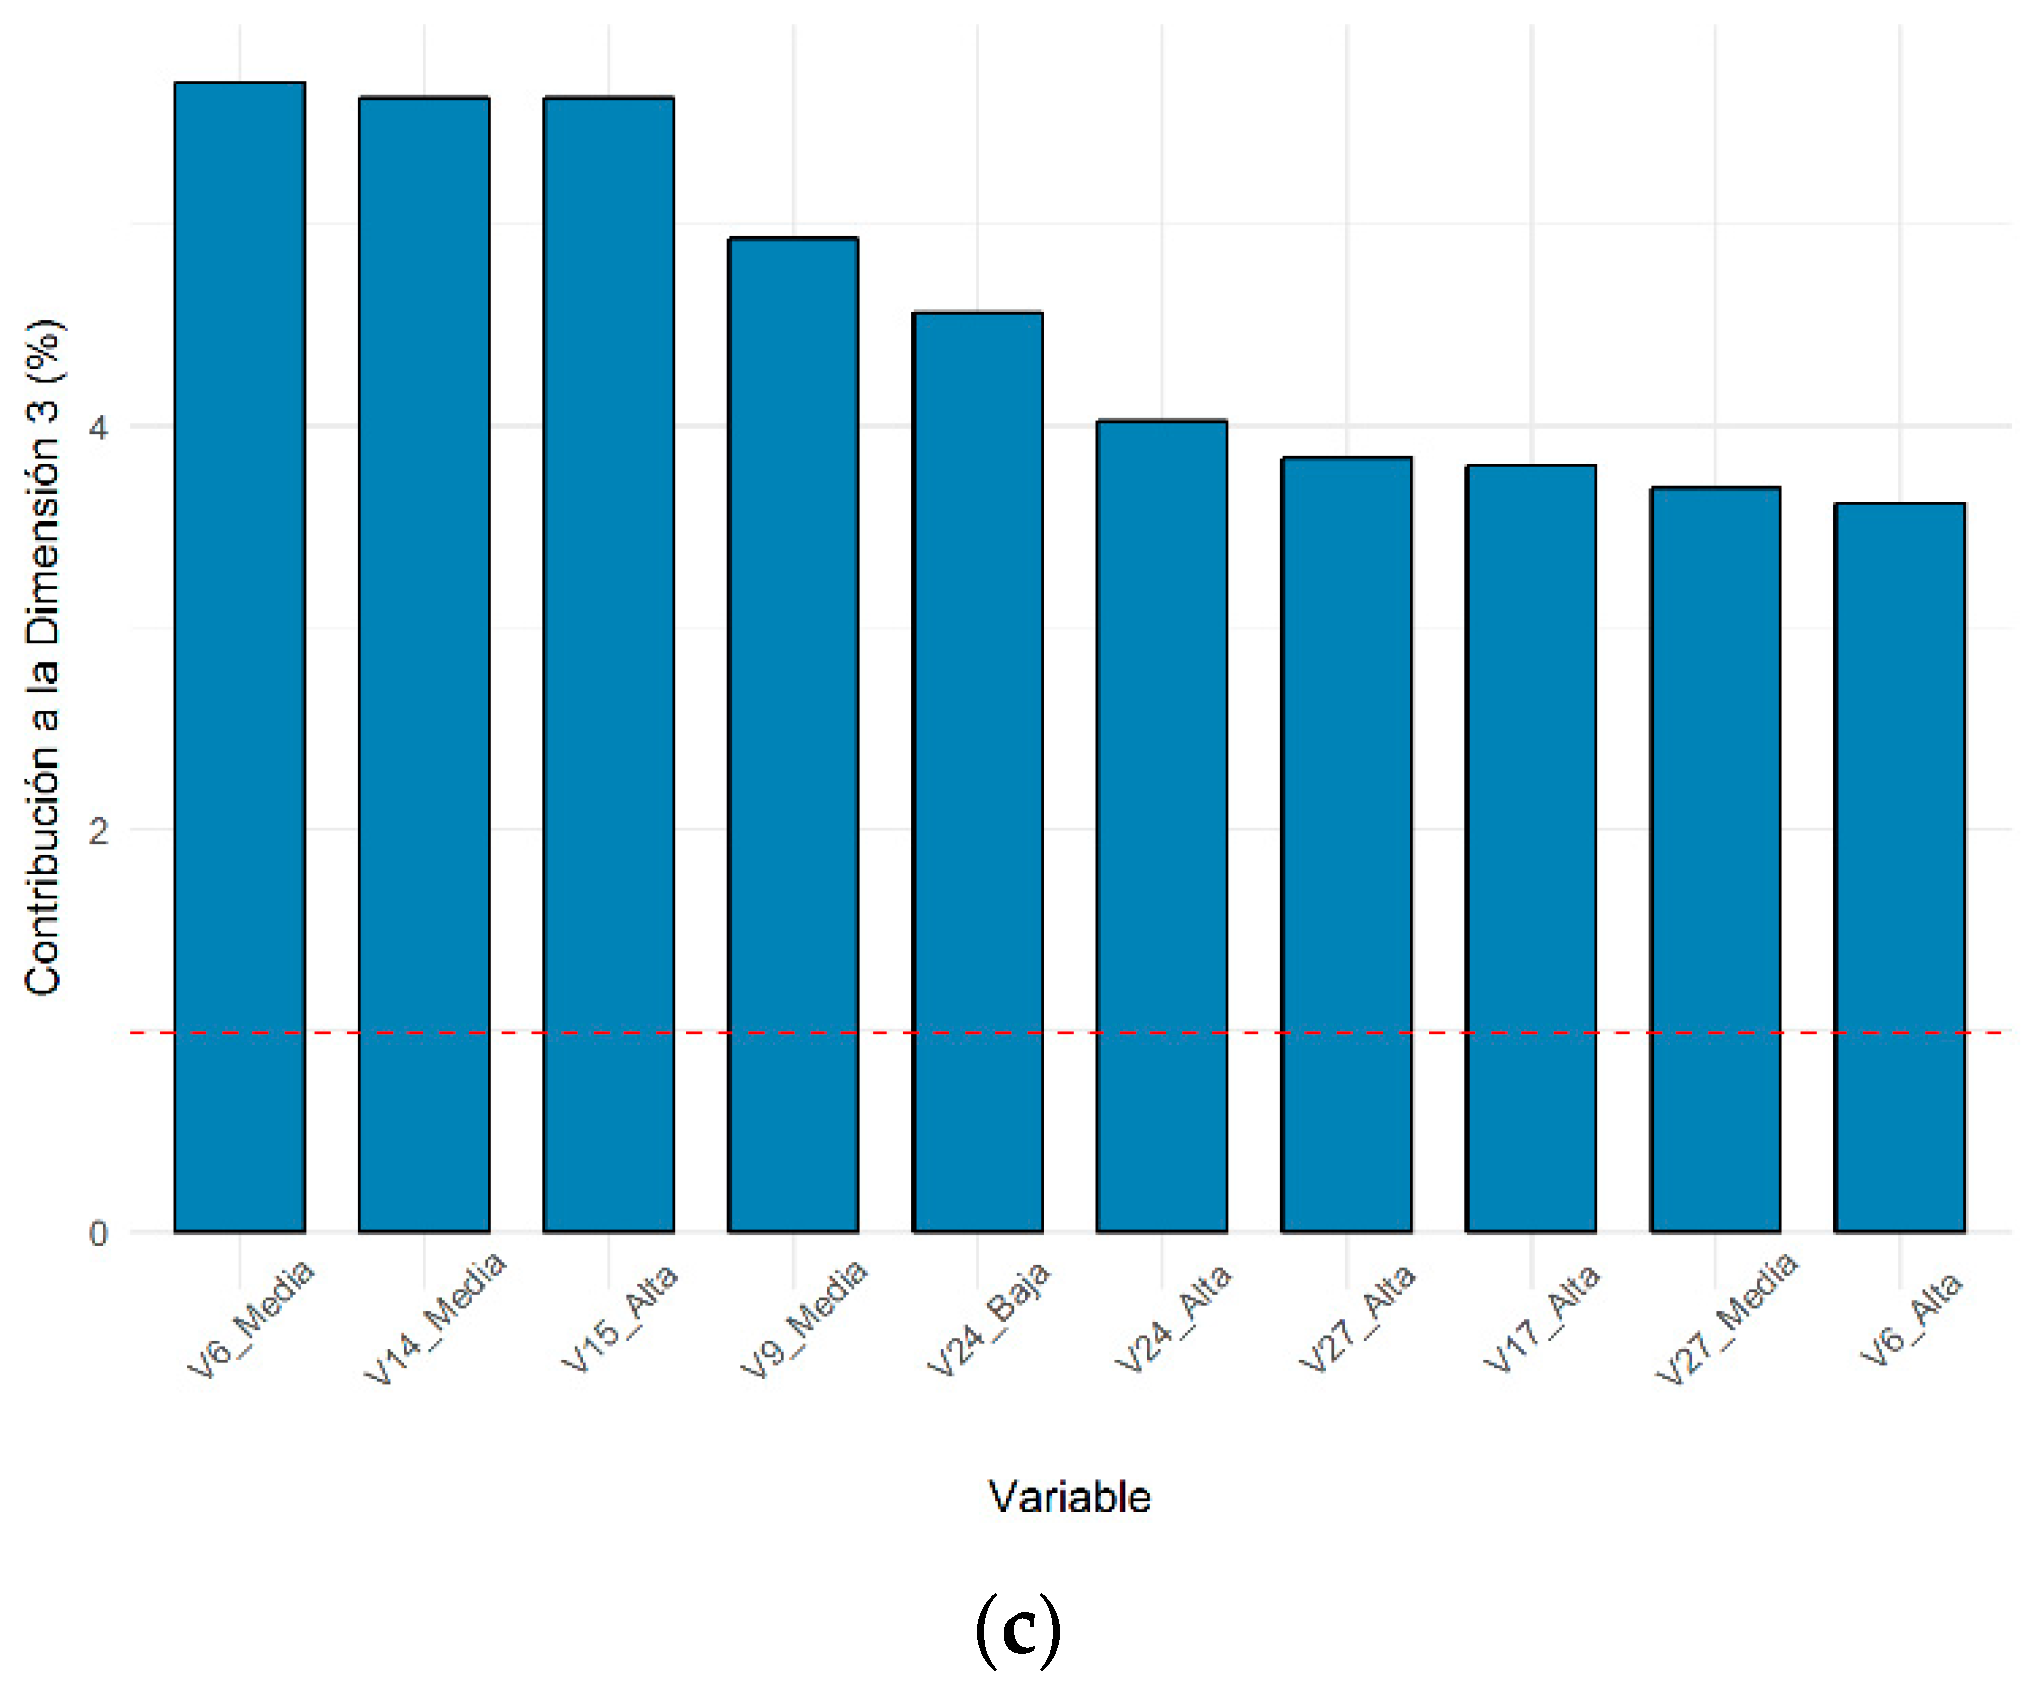
2.3. Multiple Correspondence Analysis

Once the field surveys were completed, we used MCA to categorize the components of vulnerability. With the results of the evaluation of the variables per household with MCA, it is possible to summarize the information within a contingency table containing data regarding the frequency of the qualitative variables surveyed in each household [76,77,78]. Similarity or dependency between the frequencies in each cell of the contingency table are defined by a chi-squared test, giving the results of the percentage of association or representation of variation (inertia) given by the singular value of each resulting dimension [79]. MCA also computes the contribution of each variable in each dimension, given the case one may introduce a cutoff value (for the sum of inertia of dimensions) in order to define how many dimensions will be included in the final result.
The resulting table (Table 3) from the surveys with the variable qualification consists of a number of rows defined by the number of households surveyed and a number of columns defined by the number of variables defined for each one of the variables being studied.
These tables were analyzed with the function MCA from the FactoMineR version 1.41 [80] package developed for the statistical software R version 3.1.2. [81].
It is possible to locate the categories inside a Euclidean space of n dimensions equal to the ones found previously. We can produce bi-dimensional space plots to evaluate the contribution of each variable and therefore its importance in the variance. The farther from the origin, the most relevant the variable to explain the inertia on the dimension.
In order to construct a vulnerability indicator (IV), we used the sum of the weights of the column obtained in the MCA (WMCA) per variable, the sum that represents the contribution of each variable to the inertia represented by the dimension. Then, each weight is multiplied by the quantitative qualification given previously to the variable by the experts (WE). The above is performed for each dimension that has been chosen for evaluation. The sum of the vulnerability indicator over all the dimensions defines the indicator of total Vulnerability: IV = j = 1 k I V d i m e n s i o n where IVdimension = i = 1 n ( W M C A V i ) × ( W E V i ) where i represents the number of variables under study and j the number of dimensions.
Then, a distribution by quartiles was applied to the IV to classify each household by order of prioritization, with green colors (Group 1) third quartile, orange (Group 2) the mean and median, and red (Group 3) first quartile, to finally produce vulnerability classification maps by households that, according to the homogeneity of the results, was generalized to block scale.

3. Results

The results are an outcome of the MCA approach developed from the contingency table that compared each individual (surveyed household) with the qualification of each one of the variables.

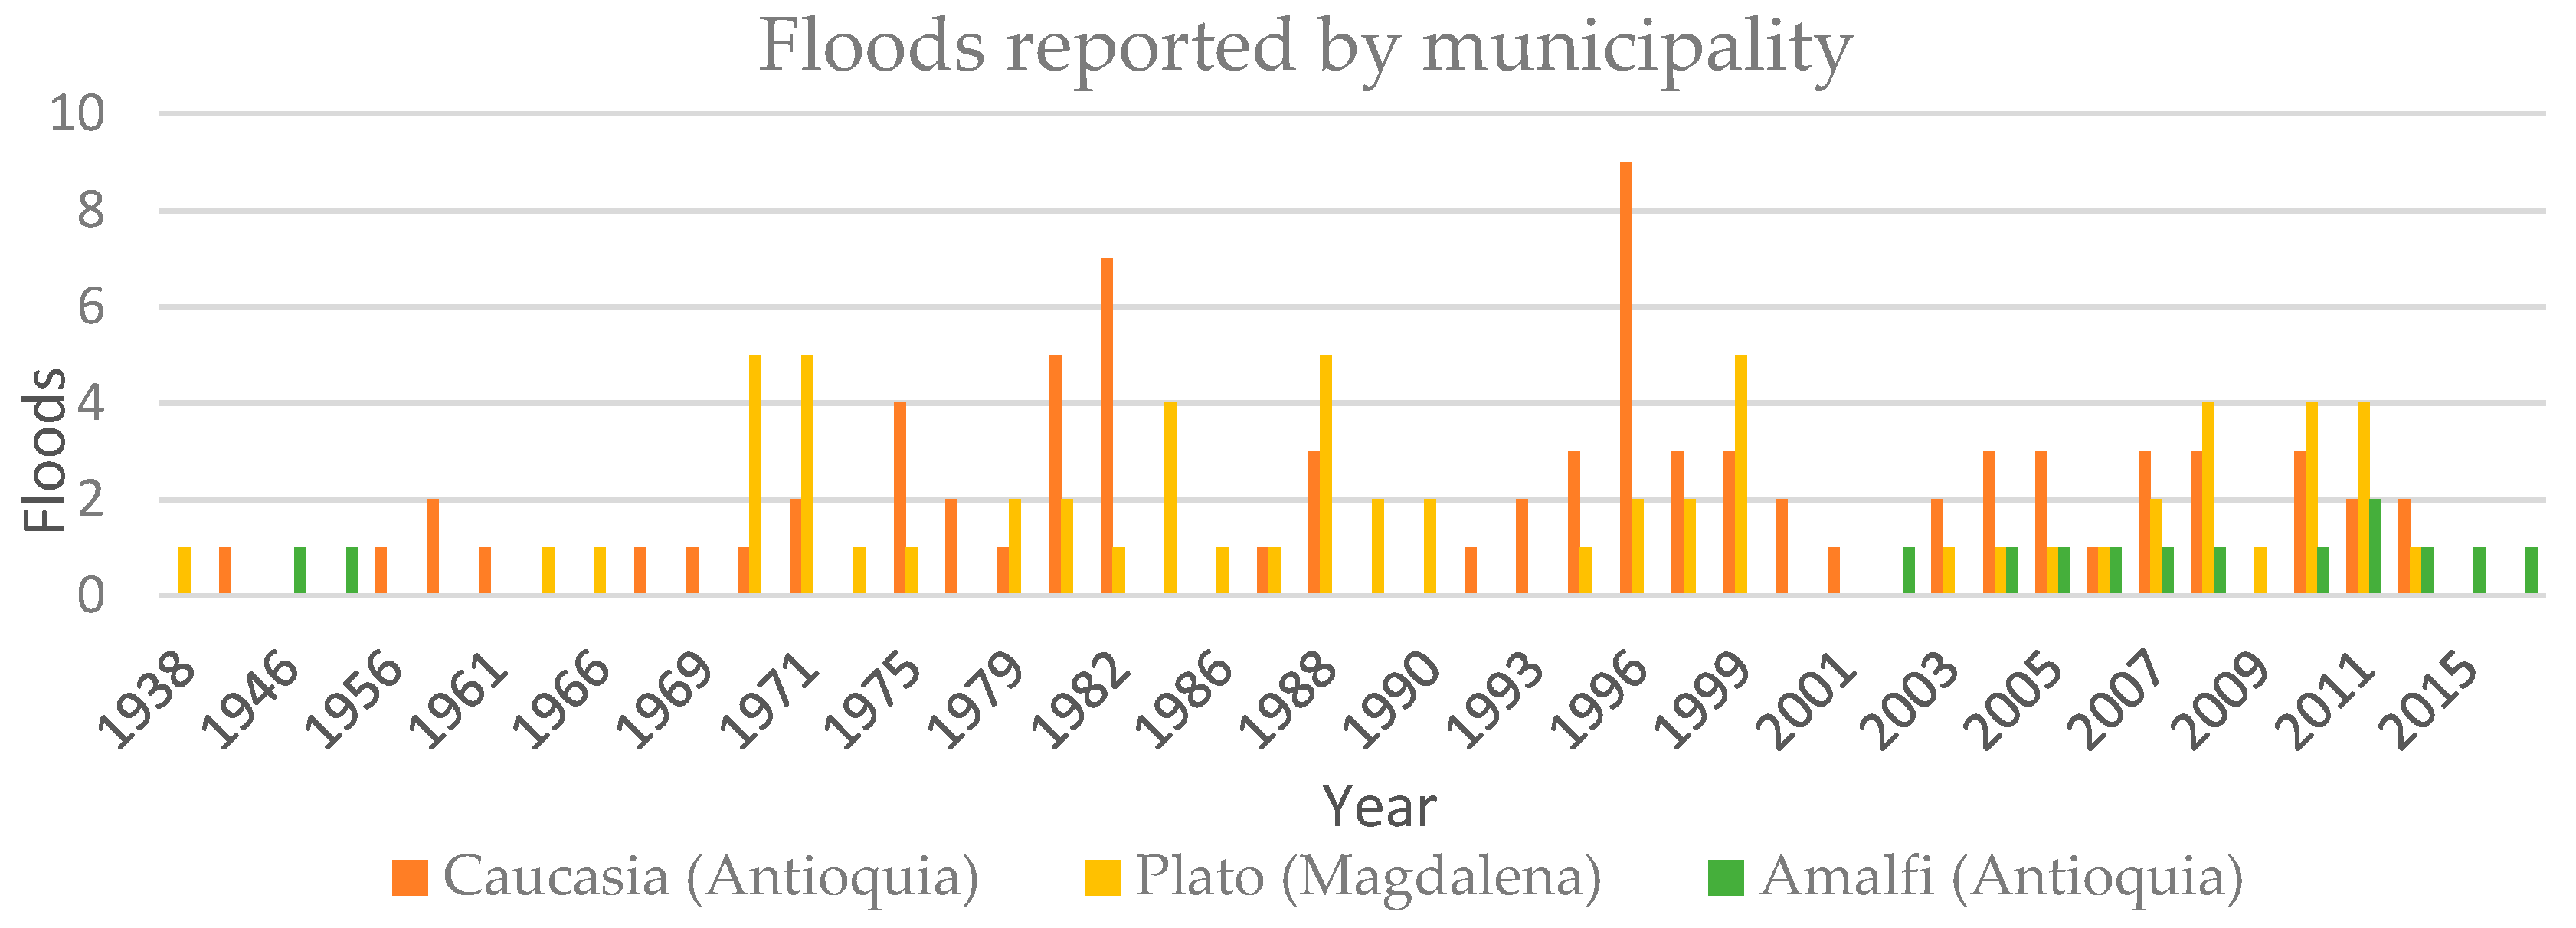
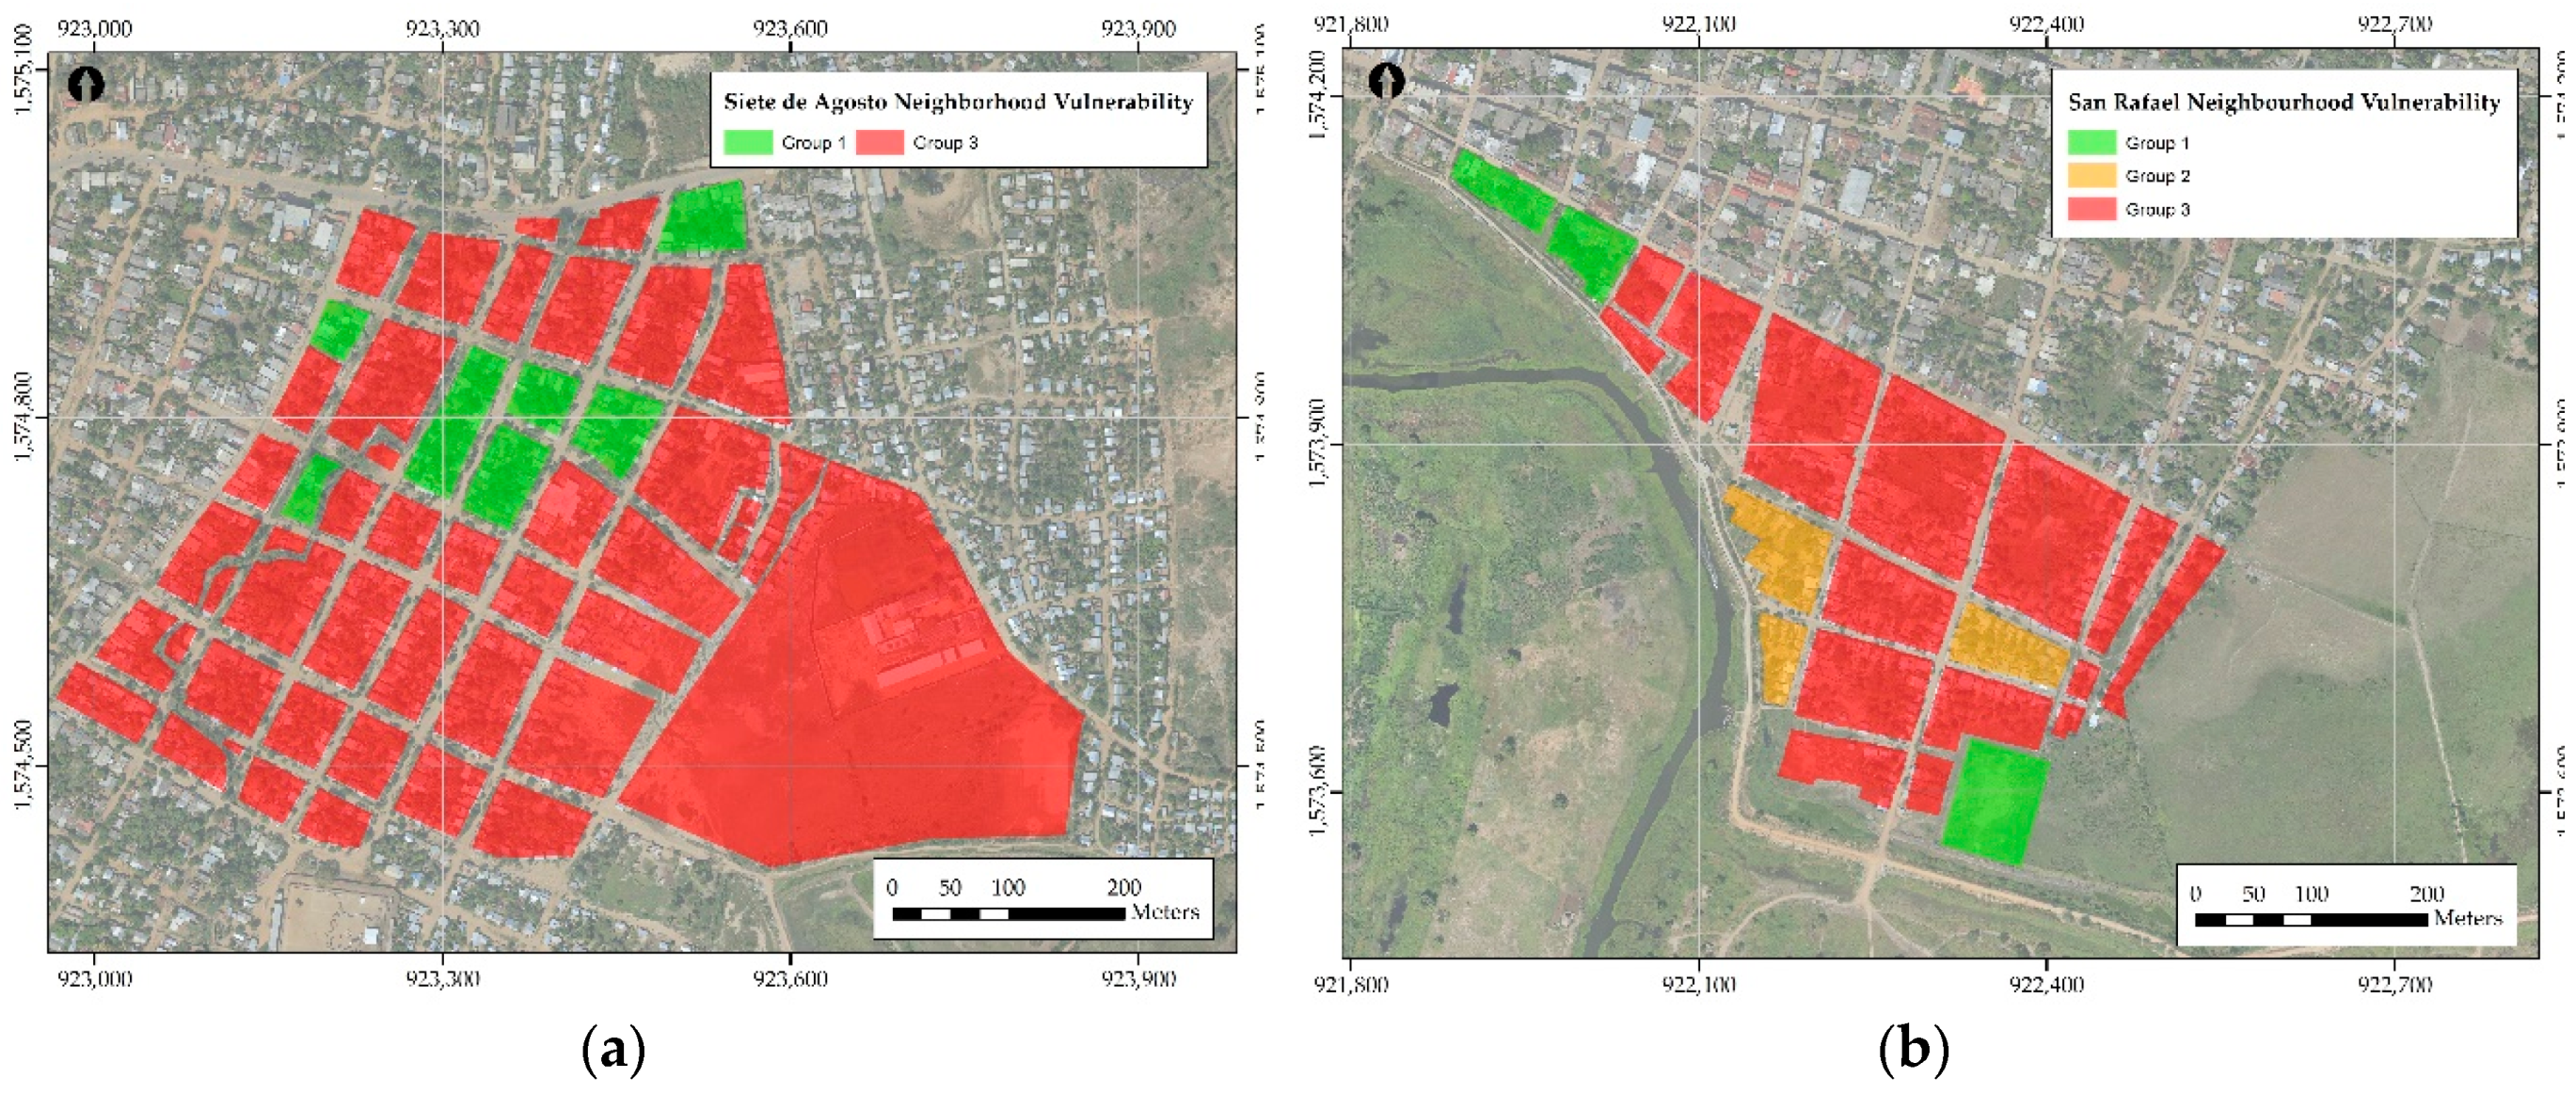
3.1. Slow-Onset Flood: Plato and Caucasia

We decided to aggregate both municipalities in the construction of the contingency table as the variables evaluated in both municipalities were the same. The graphical representation of the MCA results is shown in Figure 9, in which the two first dimensions are represented in the factorial plane resulting from the MCA. Both dimensions explain 18.7% of the inertia or variability. Even though this percentage is low and could be enhanced by using less variables, none were eliminated due to the importance that all of them have for the objective of this research and considering that they were recommended by local experts. The MCA plot of the two dimensions is useful in order to obtain a general exploratory idea of the database and the possible clusters that could be formed.
In the Figure 9, ellipses are highlighted to show the significant clusters where households in Group 1 were surveyed in the Siete de Agosto Neighborhood, Group 2 households in San Rafael, Group 3 in La Victoria, and Group 4 in San Miguel. Neighborhood Siete de Agosto is not significant, considering that it is located in the center of the graph. It appears to mask its own vulnerability conditions, and on the contrary, the neighborhoods of San Rafael, La Victoria, and San Miguel represent a greater variation, which is due to their location.
By removing the representation of households and agglomerated variables in the center of the graph, we looked for the most significant variables (variables that were furthest away from the edges, thus with the highest weight) for the evaluation of the vulnerability in the neighborhoods (Figure 10). We found that the structural condition (V9), household income (V10), access to public services (V12), loss of housing contents (V14), impact on the provision of public services (V15), evacuation (V17), humanitarian aid (V18), access to warning systems (V19), and housing availability after evacuations during floods (V23) were the variables that added the greatest variability to the behavior of the vulnerability in the neighborhoods.
In the cases of slow-onset floods, the variables that explain most of the vulnerability are those of the susceptibility component—the structural condition (S), household income (S), access to public services (S), loss of housing contents (S), impact on the provision of public services (S), evacuation (S); and the resilience component—humanitarian aid (R), access to alerts (R), housing availability after evacuations during floods (R), leaving out the most significant variables of the exposure component.
In order to build the vulnerability indicator, the equations and procedure of the section “Multiple Correspondence Analysis” were applied and obtained according to the division of the quartiles of the most vulnerable households. With green colors (Group 1) representing low vulnerability, orange (Group 2) medium vulnerability, and red (Group 3) high vulnerability, we produced vulnerability classification maps for households that, according to the homogeneity of the results, can be aggregated or generalized to block-level (Figure 11 and Figure 12).
The neighborhoods of Plato (Magdalena) appear to have mainly high vulnerability (Figure 11). The vulnerability levels of Siete de Agosto neighborhood are only at the extremes (high or low), and the San Rafael neighborhood showed all three types, with the blocks at the ends of the neighborhood being the least vulnerable. In the neighborhoods of Caucasia (Antioquia) shown in Figure 12, we found that the conditions of vulnerability among the neighborhoods are very heterogeneous. La Victoria, which is the closest to the Cauca River, only high vulnerability was found for all households and blocks analyzed, and in San Miguel, vulnerability is more varied since there are three levels of vulnerability. These insights may facilitate the prioritization of areas for improvement projects.

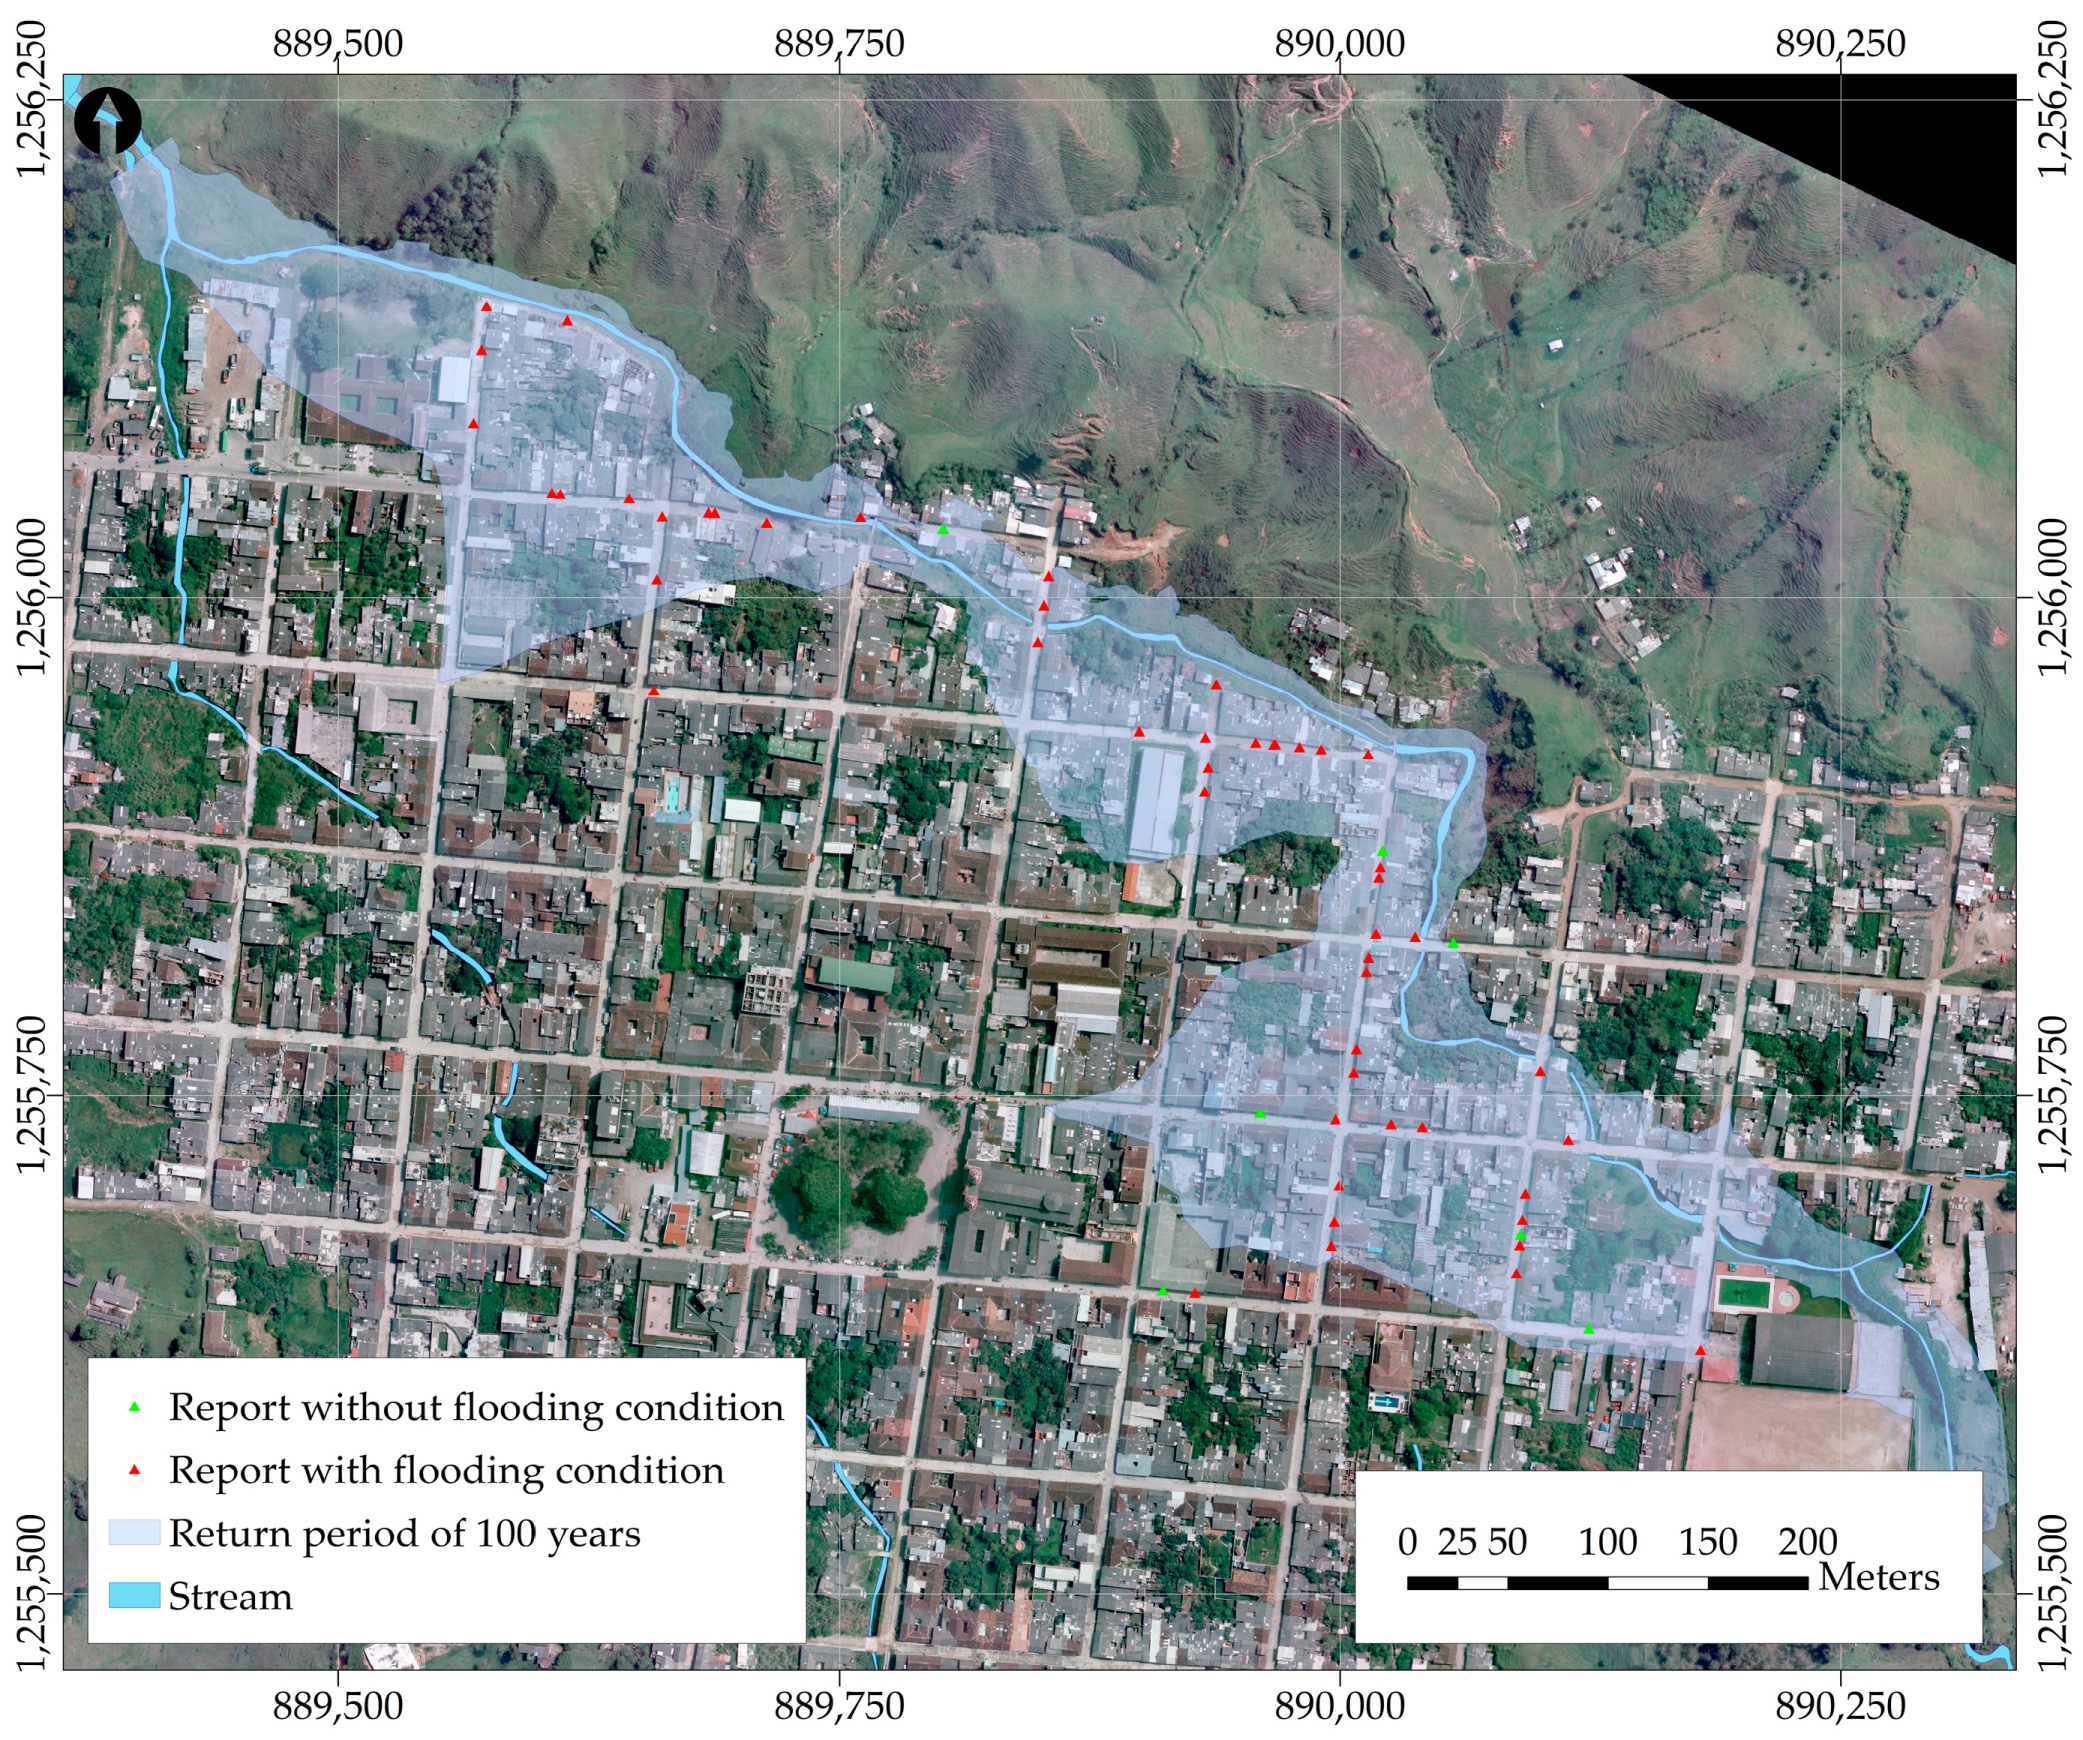
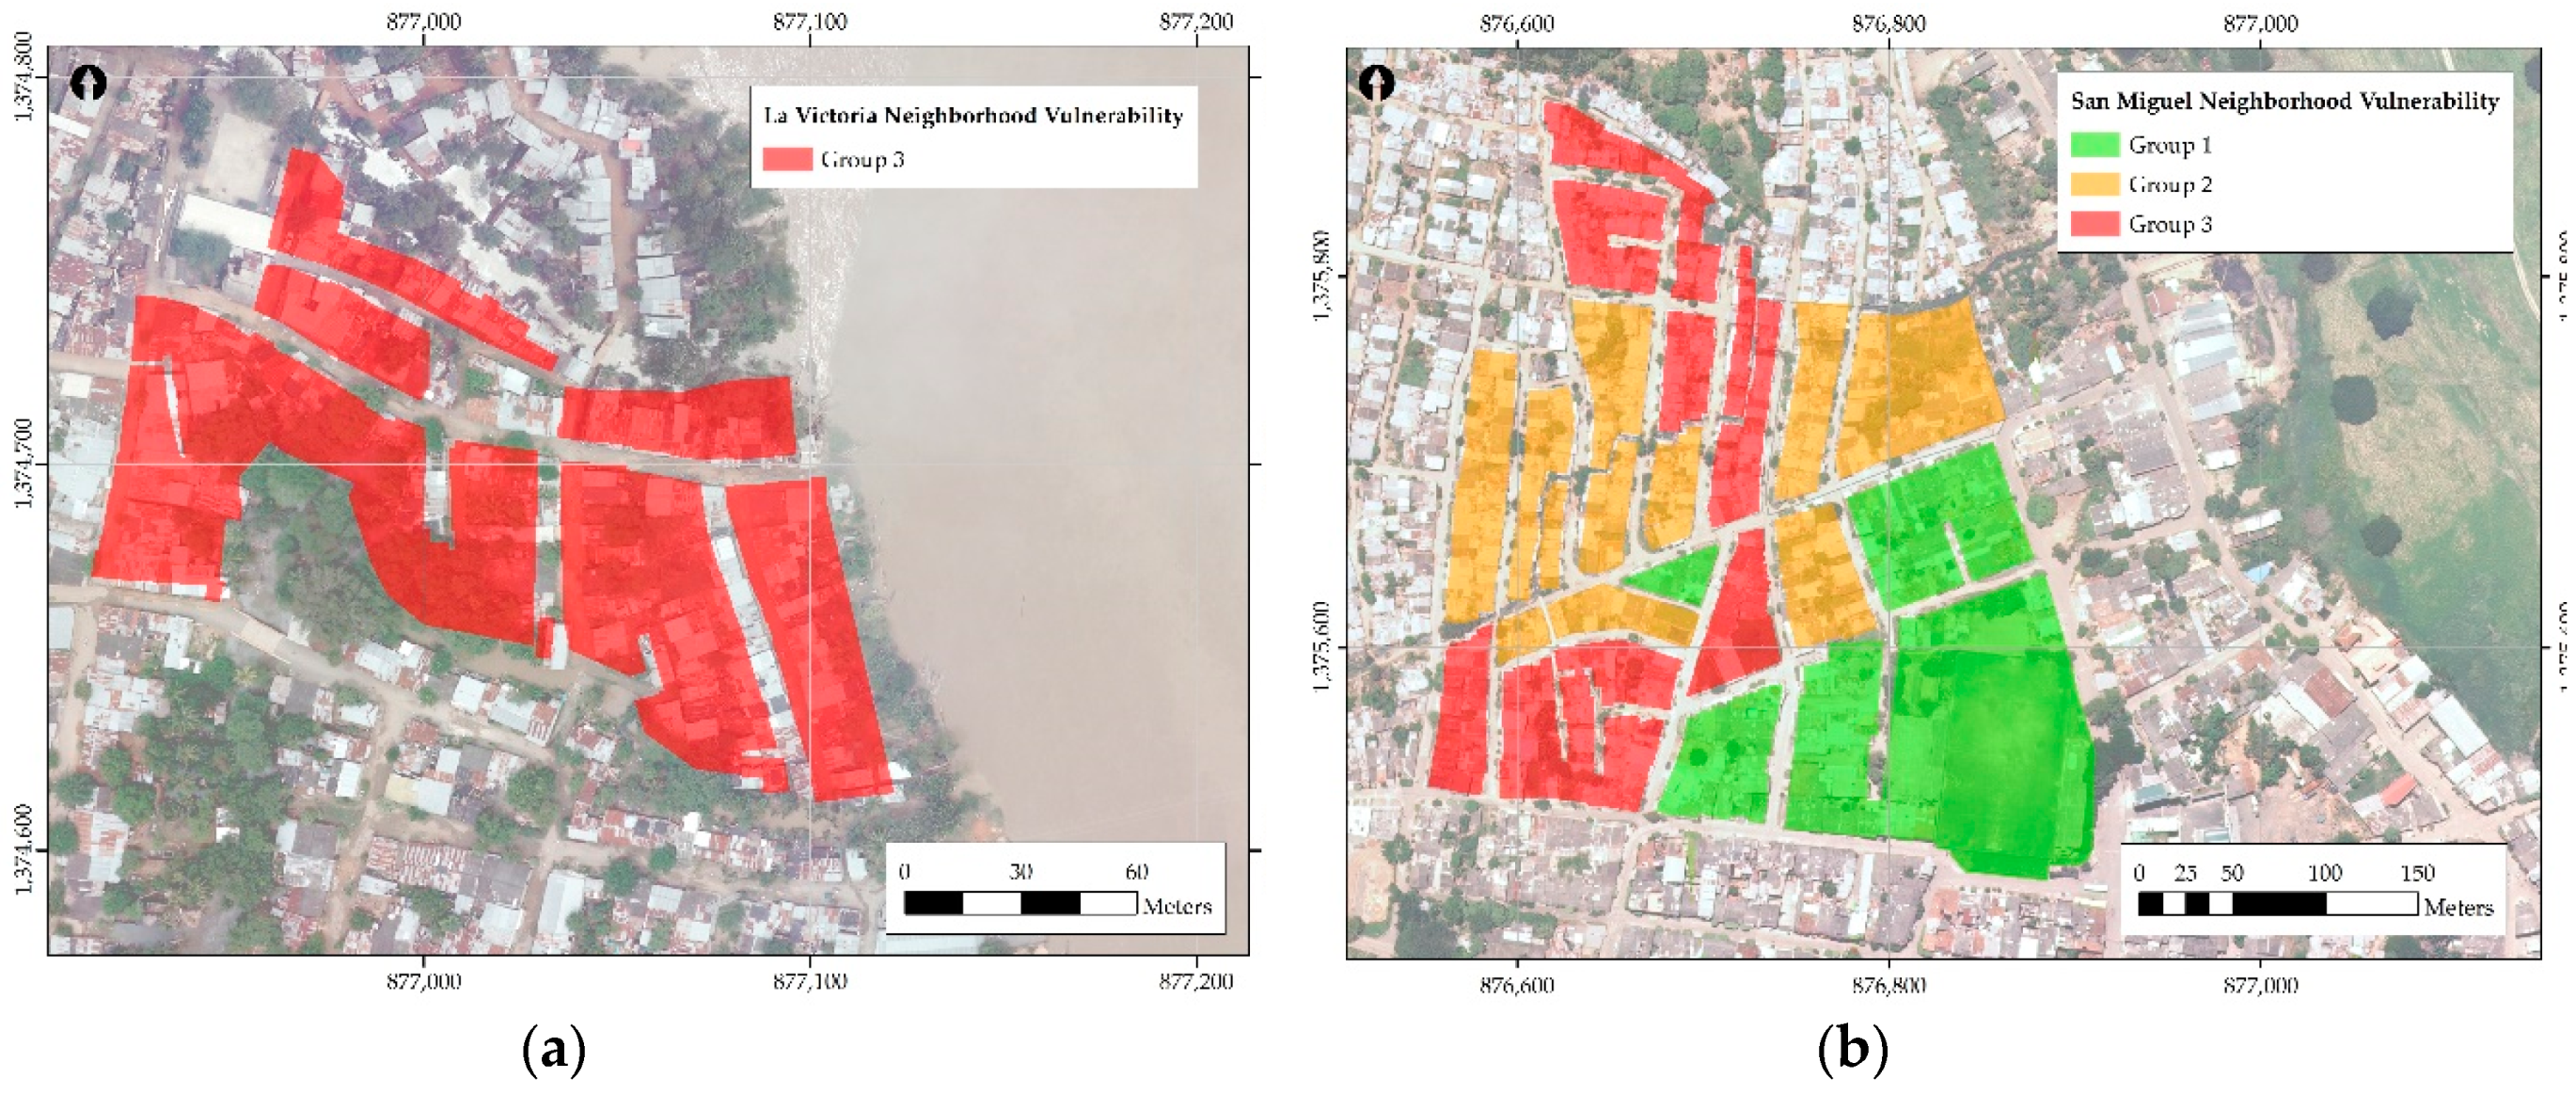
3.2. Sudden Floods: Amalfi

After the multiple correspondence analysis, we decided to consider the results in the first three dimensions to increase the percentage of inertia. Dimension 1 represents 8.7%, dimension 2 represents 6.5% and dimension 3 represents 5.9%, accounting in total for 21.1%. Figure 13 shows the most significant variables for each dimension, as follows: Type of structural foundation (V11), evacuation (V34), number of windows on the most exposed façade (V14), loss of flood energy considering block form (V3), distance to the nearest drainage (V6), year of construction of the building. (V8), and number of doors and windows on the most exposed façade (V15). It is necessary to clarify that the numbering of the variables is not the same for all case of studies.
For the case studies of sudden floods, the variables that explain most of the vulnerability belong to the susceptibility component: Type of structural foundation (S), evacuation (S), loss of flood energy considering block form (S), and year of construction of the building (S). Regarding the exposure component, these refer to the distance to the nearest drainage or river (E), and number of doors and windows on the most exposed façade (E).
Just like in the cases of Plato and Caucasia, in regard to the vulnerability indicator, the equations and procedure of the section “Multiple Correspondence Analysis” were applied. With green colors (Group 1) low vulnerability, orange (Group 2) medium vulnerability, and red (Group 3) high vulnerability. This resulted in the vulnerability classification maps for households (Figure 14).

4. Discussion and Conclusions

This paper shows a methodology for the assessment of vulnerability in low-income urban areas at the household level. Working at the smallest geographical unit facilitates the aggregation of the results in other geographical scales such as urban blocks, neighborhoods, or cities, which is essential for social and physical infrastructure investment decisions, maximizing the probability of resources being assigned to those who need it most. The property of scalability represents a bottom-up approach for vulnerability assessments in any urban flood-prone territories. Our methodology can be also used to generate maps relative to the vulnerability, by merging the results of the MCA with geographic data. The geographical representation of vulnerability will help decision-makers in risk reduction with the identification of areas in need of preventive measures, and the spatially differential levels of resilience to floods.
In addition, the formulation of the indicator uses a flexible framework that can be adapted to the social, physical, institutional, economic and environmental conditions of various low-income urban territories. The MCA results are obtained based on these specific conditions, which allows finding a particular weight for each specific variable according to its context. Also, by identifying which variables are more representative, interventions can be determined according to the variables’ importance for the reduction of vulnerability.
From the results presented, we have identified that whether it is a sudden or slow-onset flood, the susceptibility (S) component of vulnerability is the most significant. By reducing the predisposition of communities to suffer damages from the flood events, it is possible to achieve a reduction of total vulnerability. The S component is related to public management and planning for development. One approach for intervention in low-income territories could be an initial corrective intervention to attend these S variables, and then with more resources, implement more resource-consuming interventions such as the relocation of families and households in order to reduce susceptibility.
Considering the results from the slow-onset floods case studies, we argue that the long-term exposure to flooding of parts of the housing structures results in a permanent deterioration, affecting the ability to prevent further damage. This progressive deterioration of the structures is additional to the damages to belongings, such as furniture, appliances and other items inside the house, as well as low household income and the lack of public services. This means that the residents will not be able to invest in the maintenance of the household and in replacing the items at the same time. This situation increases their vulnerability and their unsatisfied basic needs. As for the variables related to the resilience (R) component of vulnerability, they reflect the relationship between a protectionist government ready to attend in case of an event and the preparedness of the communities to floods. Due to the nature of the flood (slow onset), people with access to early warning or alert systems are more likely to avoid damage to life and property.
On the other hand, regarding sudden floods, the timing of the event is most relevant. The variables with the most significance are related to the structural damage to the foundations of the buildings due to the impact of the flood. The age of the households and the structural type of the foundations may define the capacity to withstand flood and maintain the structural integrity. Also, the timing of the flood is of utmost importance for evacuation processes, and therefore a relevant variable for vulnerability. Additionally, for the specific case of Amalfi, where streets may act as waterways during a flood, the shape of the block is an important factor to reduce the energy of the flood.
For this case study, the other most important variables were those of exposure (E). Conditions such as the distance to the nearest drainage or river and the number of windows and doors in the most exposed façade, increase vulnerability.
Thus, for slow-onset floods, susceptibility and resilience are the most significant components for vulnerability; while for sudden floods the components are susceptibility and exposure. Other studies might further test this result and extend this framework. Our results reinforce the current approach to risk management (Sendai Framework [8]) in which susceptibility interventions can be compared with risk reduction processes, resilience with residual risk management processes (after reduction), and the increase in exposure with the reduction or generation of new risks.
The Sendai Framework [8] promotes risk reduction and avoidance of risk generation. With susceptibility being identified as the most relevant component of vulnerability, risk reduction and development planning should become priority activities in urban territories with low income, which are prone to slow as well as sudden floods.
We would like to clarify that we have applied the MCA results with the prioritization of certain situations, but that all the variables and components are important for the vulnerability assessment. Thus, all variables should be analyzed and interventions be designed for them, but given our focus on municipalities with particularly limited resources, this analysis provides a starting point for identifying the most effective investment strategy in flood risk management.
Regarding the methodology, the use of variables with statistical information from national programs and social services facilitates the replication of and longitudinal analyses to identify how vulnerability reduction evolves in the specific territories. We presented three case studies for two types of floods. With an adequate characterization of the vulnerability variables, it is possible to replicate this methodology for other hazards such as fires, avalanches, hurricanes, and flash floods. It is also important to emphasize that the information provided by the communities is used to generate spatialized knowledge and, thus, is useful for community decision-making.
The MCA has turned out to be a useful tool for community vulnerability assessment. The construction of a vulnerability indicator allows the evaluation of vulnerability conditions in a global manner and also for the evaluation of each component of vulnerability, such as susceptibility, exposure, and capacity.
According to Colombian legislation, the results of this research are equivalent to detailed technical studies for the incorporation of disaster risk management in territorial planning. The use of open-source software and statistical tools extends the audience of its application in methodologies, such as the one presented in this paper, which allows local administrations to work within tight budgets. Therefore, the application of the proposed methodologies is particularly useful for municipalities with a high occurrence of disasters and limited resources.

Author Contributions

Conceptualization, E.M.R.-G.; Data curation, E.M.R.-G. and S.O.-O.; Formal analysis, E.M.R.-G., A.B.-J. and V.B.-F.; Investigation, E.M.R.-G. and V.B.-F.; Methodology, E.M.R.-G., S.O.-O., A.B.-J. and V.B.-F.; Project administration, E.M.R.-G.; Software, E.M.R.-G. and A.B.-J.; Supervision, V.B.-F.; Validation, E.M.R.-G. and A.B.-J.; Writing—review & editing, S.O.-O., A.B.-J., E.M.R.-G., and V.B.-F.

Funding

This research was partially funded by the Administrative Department of Science Technology and Innovation of Colombia (COLCIENCIAS), grant number 1118-660-44118 and the Institución Universitaria Colegio Mayor de Antioquia research projects grants 2017.

Acknowledgments

The authors would like to acknowledge the local administrations and communities of the neighborhoods in Plato, Caucasia, and Amalfi for their collaboration during the data collection campaigns and workshops.

Conflicts of Interest

The authors declare no conflict of interest.

References

  1. Salas, M.A.; Jiménez, M. Inundaciones; Versión el Centro Nacional de Prevención de Desastres-CENAPRED: México, Mexico, 2013; ISBN 970-628-870-8. [Google Scholar]
  2. United Nations Organization. Naciones Unidas Rio+20 El Futuro que Queremos. Available online: https://www.un.org/es/sustainablefuture/disasters.shtml (accessed on 13 June 2019).
  3. Jha, A.K.; Bloch, R.; Lamond, J. Cities and Flooding. A Guide to Integrated Urban Flood Risk Management for 21st Century; World Bank: Washington, DC, USA, 2012; ISBN 978-08213-8866-2. [Google Scholar]
  4. Centre for Research on the Epidemiology of Disasters-CRED. EM-DAT: The OFDA/CRED International Disaster Database. Available online: http://www.emdat.be/database (accessed on 13 June 2019).
  5. Hoyois, P.; Guha-sapir, D. Three Decades of Floods in Europe: A preliminary Analysis of EMDAT Data; WHO collaborating centre for research on the epidemiology of disasters (CRED); Catholique University of Louvain: Louvain, Belgium, 2003; pp. 1–15. [Google Scholar]
  6. World Health Organization WHO|Flooding and Communicable Diseases Fact Sheet; World Health Organization: Geneva, Switzerland, 2012.
  7. Jakubicka, T.; Vos, F.; Phalkey, R.; Marx, M. Health Impacts of Floods in Europe; Centre for Research on the Epidemiology of Disasters—CRED: Brussels, Belgium, 2010. [Google Scholar]
  8. UN Office for Disaster Risk Reduction. Sendai Framework for Disaster Risk Reduction 2015–2030; UN Nations Office for Disaster Risk Reduction: Geneva, Switzerland, 2015. [Google Scholar]
  9. Revi, A.; Satterthwaite, D.E.; Aragón-Durand, F.; Corfee-Morlot, J.; Kiunsi, R.B.R.; Pelling, M.; Roberts, D.C.; Solecki, W. Urban Areas. In Climate Change 2014: Impacts, Adaptation, and Vulnerability. Part A: Global and Sectoral Aspects; Contribution of Working Group II to the Fifth Assessment Report of the Intergovernmental Panel on Climate Change; Cambridge University Press: Cambridge, UK; New York, NY, USA, 2014; pp. 535–612. [Google Scholar]
  10. Panel Intergubernamental de Cambio Climático—IPCC. Managing the Risks of Extreme Events and Disasters to Advance Climate Change Adaptation; Field, C.B., Barros, V., Stocker, T.F., Dahe, Q., Eds.; Cambridge University Press: Cambridge, UK, 2012; ISBN 9781139177245. [Google Scholar]
  11. Perles Roselló, M.J.; Sortino Barrionuevo, J.F.; Cantarero Prados, F. Cartografía de la vulnerabilidad del territorio frente al riesgo de inundación. Propuesta adaptada a la directiva europea de inundaciones y normativas derivadas. Boletín Asoc. Geógrafos Españoles 2017, 75, 341–372. [Google Scholar] [CrossRef]
  12. Gouldby, B.; Samuels, P.; Klijn, F.; Messner, F.; Ad Van, O.; Sayers, P. Language of Risk; HR Wallingford: Wallingford, UK, 2005. [Google Scholar]
  13. Congreso de la República de Colombia. Ley 1523 de 2012. Por la Cual se Adopta la Política Nacional de Gestión del Riesgo de Desastres y se Dictan Otras Disposiciones; Congreso de la República de Colombia: Bogotá, Colombia, 2012; p. 16. [Google Scholar]
  14. Adger, W.; Brooks, N.; Bentham, G.; Agnew, M. New Indicators of Vulnerability and Adaptive Capacity; Tyndall Centre Technical Report 7; Tyndall Centre for Climate Change Research: Norwich, UK, 2004. [Google Scholar]
  15. Bankoff, G. Constructing vulnerability: The historical, natural and social generation of flooding in metropolitan Manila. Disasters 2003, 27, 224–238. [Google Scholar] [CrossRef] [PubMed]
  16. Damm, M. Mapping Social-ecological Vulnerability to Flooding. Ph. D. Thesis, United Nations University, Tokyo, Japan, 2010. [Google Scholar]
  17. Fekete, A. Assessment of Social Vulnerability to River Floods in Germany. Ph. D. Thesis, United Nations University, Tokyo, Japan, 2010. [Google Scholar]
  18. García, C.E.; Hurtado, J.E. Modelo Basado en Lógica Difusa para la Construcción Indicadores Vulnerabilidad Frente de Indicador es de V ulnerabilidad Urbana Fr ente a Fenómenos Naturales. Gestión Ambient. 2003, 6, 1–22. [Google Scholar]
  19. Kuhlicke, C.; Scolobig, A.; Tapsell, S.; Steinführer, A.; Marchi, B. Contextualizing social vulnerability: Findings from case studies across Europe. Nat. Hazards 2011, 58, 789–810. [Google Scholar] [CrossRef]
  20. Cutter, S.L.; Boruff, B.J.; Shirley, W.L. Social vulnerability to environmental hazards. Soc. Sci. Q. 2003, 84, 242–261. [Google Scholar] [CrossRef]
  21. Blaikie, P.; Cannon, T.; Davis, I.; Wisner, B. Vulnerabilidad. El Entorno Social, Político y Económico de los Desastres; LA RED/ITDG: Bogotá, Colombia, 1996. [Google Scholar]
  22. Turner, B.L.; Kasperson, R.E.; Matsone, P.A.; McCarthy, J.J.; Corell, R.W.; Christensene, L.; Eckley, N.; Kasperson, J.X.; Luers, A.; Martello, M.L.; et al. A framework for vulnerability analysis in sustainability science. Proc. Natl. Acad. Sci. USA 2003, 100, 8074–8079. [Google Scholar] [CrossRef] [PubMed] [Green Version]
  23. Cannon, T. Vulnerability analysis and disasters. Floods 2000, 1, 45–55. [Google Scholar]
  24. Cupples, J. Gender and Hurricane Mitch: Reconstructing subjectivities after disaster. Disasters 2007, 31, 155–175. [Google Scholar] [CrossRef]
  25. Kubal, C.; Haase, D.; Meyer, V.; Scheuer, S. Integrated urban flood risk assessment—Adapting a multicriteria approach to a city. Nat. Hazards Earth Syst. Sci. 2009, 9, 1881–1895. [Google Scholar] [CrossRef]
  26. Zhang, Y.; Lindell, M.K.; Prater, C.S. Vulnerability of community businesses to environmental disasters. Disasters 2009, 33, 38–57. [Google Scholar] [CrossRef]
  27. Birkmann, J. Measuring Vulnerability to Natural Hazards: Towards Disaster Resilient Societies; United Nations University: New York, NY, USA, 2006; ISBN 92-808-1135-5. [Google Scholar]
  28. Secretaría Interinstitucional de la Estrategia Internacional para la Reducción de Desastres. Vivir con el Riesgo. Informe Mundial Sobre Iniciativas para la Reducción de Desastres; Secretaría Interinstitucional de la Estrategia Internacional para la Reducción de Desastres: Geneva, Switzerland, 2004; ISBN 92-1-300228-9. [Google Scholar]
  29. Rodríguez-Gaviria, E.M. Diseño Metodológico Para La Evaluación Del Riesgo Por Inundación A Nivel Local Con Información Escasa; Universidad Nacional de Colombia-Sede Medellín: Medellín, Colombia, 2016. [Google Scholar]
  30. Cutter, S.L.; Ash, K.D.; Emrich, C.T. The geographies of community disaster resilience. Glob. Environ. Chang. 2014, 29, 65–77. [Google Scholar] [CrossRef]
  31. Intergovernmental Panel on Climate Change (IPCC). Climate Change: New Dimensions in Disaster Risk, Exposure, Vulnerability, and Resilience. In Managing the Risks of Extreme Events and Disasters to Advance Climate Change Adaptation: Special Report of the Intergovernmental Panel on Climate Change; Intergovernmental Panel on Climate Change (IPCC): Geneva, Switzerland, 2012; Volume 9781107025, pp. 25–64. ISBN 9781139177245. [Google Scholar]
  32. Apel, A.; Thieken, A.H.; Merz, B.; Blösch, G. Flood risk assessment and associated uncertainties. Nat. Hazards Earth Syst. Sci. 2004, 4, 295–308. [Google Scholar] [CrossRef]
  33. Villagrán de León, J.C. Vulnerability. A Conceptual and Methodological Review; United Nations University Institute for Environment and Human Security (UNU-EHS): Bonn, Germany, 2006; ISBN 3981058240. [Google Scholar]
  34. Federal Emergency Management Agency (FEMA). Technical Manual FLOOD MODEL; Federal Emergency Management Agency (FEMA): Washington, DC, USA, 2004. [Google Scholar]
  35. Fekete, A.; Lauwe, P.; Geier, W. Risk management goals and identification of critical infrastructures. Int. J. Crit. Infrastruct. 2012, 8, 336–353. [Google Scholar] [CrossRef]
  36. Zahran, S.; Brody, S.D.; Peacock, W.G.; Vedlitz, A.; Grover, H. Social vulnerability and the natural and built environment: A model of flood casualties in Texas. Disasters 2008, 32, 537–560. [Google Scholar] [CrossRef] [PubMed]
  37. Chingombe, W.; Pedzisai, E.; Manatsa, D.; Mukwada, G.; Taru, P. A participatory approach in GIS data collection for flood risk management, Muzarabani district, Zimbabwe. Arab. J. Geosci. 2014, 8, 1029–1040. [Google Scholar] [CrossRef]
  38. Kienberger, S. Participatory mapping of flood hazard risk in Munamicua, District of Búzi, Mozambique. J. Maps 2014, 10, 269–275. [Google Scholar] [CrossRef]
  39. Tran, P.; Shaw, R.; Chantry, G.; Norton, J. GIS and local knowledge in disaster management: a case study of flood risk mapping in Viet Nam. Disasters 2009, 33, 152–169. [Google Scholar] [CrossRef] [PubMed]
  40. White, I.; Kingston, R.; Barker, A. Participatory geographic information systems and public engagement within flood risk management. J. Flood Risk Manag. 2010, 3, 337–346. [Google Scholar] [CrossRef]
  41. Peters-Guarín, G.; McCall, M.K.; van Westen, C. Coping strategies and risk manageability: Using participatory geographical information systems to represent local knowledge. Disasters 2012, 36, 1–27. [Google Scholar] [CrossRef]
  42. Lu, S.; Mei, P.; Wang, J.; Zhang, H. Fatality and influence factors in high-casualty fires: A correspondence analysis. Saf. Sci. 2012, 50, 1019–1033. [Google Scholar] [CrossRef]
  43. Dodgson, J.S.; Spackman, M.; Pearman, A.; Phillips, L.D. Multi-Criteria Analysis: A Manual; Department for Communities and Local Government: London, UK, 2009; Volume 11, ISBN 9781409810230. [Google Scholar]
  44. Abdi, H.; Valentin, D. Multiple correspondence analysis. Encycl. Meas. Stat. 2007, 95, 116–128. [Google Scholar]
  45. Conte, J.C.; Rubio, E.; García, A.I.; Cano, F. Occupational accidents model based on risk–injury affinity groups. Saf. Sci. 2011, 49, 306–314. [Google Scholar] [CrossRef]
  46. Abad, J.; Blanco, P.; García, A. Análisis de Correspondencias y estudio de historias de vida: Una aplicación a la Encuesta de Transición Educativo-Formativa e Inserción Laboral. Pecvnia 2008, 6, 1–27. [Google Scholar] [CrossRef]
  47. Reis, A.P.; Patinha, C.; Ferreira da Silva, E.; Sousa, A.; Figueira, R.; Sérgio, C.; Novais, V. Assessment of human exposure to environmental heavy metals in soils and bryophytes of the central region of Portugal. Int. J. Environ. Health Res. 2010, 20, 87–113. [Google Scholar] [CrossRef] [PubMed]
  48. United Nations Department of Economic and Social Affairs (UN/DESA); United Nations Conference on Trade and Development (UNCTAD); Economic Commission for Africa (ECA); Economic Commission for Europe (ECE); Economic Commission for Latin America and the Caribbean (ECLAC); Economic and Social Commission for Asia and the Pacific (ESCAP); Economic and Social Commission for Western Asia (ESCWA); The United Nations World Tourism Organization (UNWTO). World Economic Situation and Prospects 2018; United Nations Publication: New York, NY, USA, 2018; ISBN 9789211091779. [Google Scholar]
  49. Congreso de la República de Colombia. Ley 617 de 2000; Congreso de la República de Colombia: Bogotá, Colombia, 2000; p. 280. [Google Scholar]
  50. Contaduría General de la Nación. Categorización Municipios y Departamentos; Contaduría General de la Nación: Bogotá, Colombia, 2018. [Google Scholar]
  51. Brakenridge, R. Global Active Archive of Large Flood Events. Available online: http://floodobservatory.colorado.edu/Archives/ (accessed on 1 october 2015).
  52. Guha-Sapir, D.; Vos, F.; Below, R. Annual Disaster Statistical Review 2011-The Numbers and Trends; Centre for Research on the Epidemiology of Disasters (CRED), Centre for Research on the Epidemiology of Disasters (CRED), Université Catholique de Louvain: Brussels, Belgium, 2012. [Google Scholar]
  53. Congreso de Colombia. Ley 1523 de 2012; Congreso de Colombia: Bogotá, Colombia, 2012; p. 30. [Google Scholar]
  54. Ministerio de Vivienda Sociedad y Territorio. Decreto 1807 de 2014 en lo Relativo a la Incorporación de la Gestión del Riesgo en los Planes de Ordenamiento; Ministerio de Vivienda Sociedad y Territorio: Bogotá, Colombia, 2014. [Google Scholar]
  55. Instituto de Hidrología y Metereología y Estudios Ambientales-IDEAM. Clasificaciones Climáticas de Colombia. Available online: http://www.ideam.gov.co/documents/21021/21789/climas+%5BModo+de+compatibilidad%5D.pdf/d8c85704-a07a-4290-ba65-f2042ce99ff9 (accessed on 5 August 2019).
  56. Kottek, M.; Grieser, J.; Beck, C.; Rudolf, B.; Rubel, F. World map of the Köppen-Geiger climate classification updated. Meteorol. Z. 2006, 15, 259–263. [Google Scholar] [CrossRef]
  57. Institución Universitaria Colegio Mayor de Antioquia; Universidad Nacional de Colombia; Municipio de Amalfi. Propuesta Metodológica Para Evaluar El Riesgo Por Inundaciones Súbitas De La Quebrada Tequendamita (Amalfi, Antioquia); Colegio Mayor de Antioquia: Amalfi, Colombia, 2018. [Google Scholar]
  58. Estadística, D.A. Necesidades Básicas Insatisfechas (NBI) por Municipio. Available online: http://www.dane.gov.co/index.php/estadisticas-por-tema/pobreza-y-condiciones-de-vida/necesidades-basicas-insatisfechas-nbi (accessed on 14 June 2019).
  59. De Bruijn, K.; de Frans, K.; Ölfert, A.; Penning-Rowsell, E.; Simm, J.; Wallis, M. Flood Risk Assessment and Flood Risk Management; HR Wallingford: Wallingford, UK, 2009. [Google Scholar]
  60. Instituto de Hidrología y Metereología y Estudios Ambientales-IDEAM. Inundaciones. Available online: http://www.ideam.gov.co/web/agua/amenazas-inundacion (accessed on 15 May 2019).
  61. Unidad Nacional de Gestión del Riesgo Inundaciones. Available online: http://www.sigpad.gov.co/sigpad/paginas_detalle.aspx?idp=144 (accessed on 17 February 2019).
  62. Universidad Nacional de Colombia. Criterios Metodológicos Mínimos Para La Elaboración E Interpretación Cartográfica De Zonificaciones De Amenaza Por Inundaciones Fluviales Para El Territorio Colombiano Con Una Aplicación Práctica De Dos Áreas Piloto (Inundaciones Lentas Y Súbitas) Fase I.; Universidad Nacional de Colombia: Medellín, Colombia, 2010. [Google Scholar]
  63. Corporación OSSO. Base de Datos DAPARD, Colombia—Inventario de Desastres Antioquia; Corporación OSSO: Cali, Colombia, 2015. [Google Scholar]
  64. Unidad Nacional de Gestión del Riesgo. Reporte de Emergencias; Unidad Nacional de Gestión del Riesgo: Bogotá, Colombia, 2015. [Google Scholar]
  65. NOAA Center for Weather and Climate Prediction. Historical El Niño/La Niña Episodes (1950-Present). Available online: http://www.cpc.ncep.noaa.gov/products/analysis_monitoring/ensostuff/ensoyears.shtml (accessed on 9 July 2015).
  66. Berariu, R.; Fikar, C.; Gronalt, M.; Hirsch, P. Understanding the impact of cascade effects of natural disasters on disaster relief operations. Int. J. Disaster Risk Reduct. 2015, 12, 350–356. [Google Scholar] [CrossRef]
  67. Alcaldía Municipal de Amalfi. Plan de Desarrollo Municipal Amalfi Antioquia 2016–2019 “Amalfi, Amor y Pasión de Todos”; Alcaldía Municipal de Amalfi: Amalfi, Colombia, 2016. [Google Scholar]
  68. Alcaldía de Plato. Plan de Desarrollo Plato 2016–2019; Alcaldía de Plato: Plato, Colombia, 2016. [Google Scholar]
  69. Alcaldía de Caucasia. Plan de Desarrollo Caucasia 2016–2019; Alcaldía de Caucasia: Caucasia, Colombia, 2017. [Google Scholar]
  70. Botero, V. Geo-Information for Measuring Vulnerability to Earthquakes: A Fitness for Use Approach; University of Utrecht: Utrecht, The Netherlands, 2009. [Google Scholar]
  71. Martínez, J. The use of GIS and indicators to monitor intra-urban inequalities. A case study in Rosario, Argentina. Habitat Int. 2009, 33, 387–396. [Google Scholar] [CrossRef]
  72. Hartung, C.; Lerer, A.; Anokwa, Y.; Tseng, C.B.W. Open data kit: Tools to build information services for developing regions. In Proceedings of the 4th International Conference on Information and Communication Technologies and Development, London, UK, 13–16 December 2010. [Google Scholar]
  73. Buckle, P.; Mars, G.; Smale, R.S. New approaches to assessing vulnerability and resilience. Aust. J. Emerg. Manag. 2000, 15, 8–14. [Google Scholar]
  74. Thouret, J.C.; Ettinger, S.; Guitton, M.; Santoni, O.; Magill, C.; Martelli, K.; Zuccaro, G.; Revilla, V.; Charca, J.A.; Arguedas, A. Assessing physical vulnerability in large cities exposed to flash floods and debris flows: The case of Arequipa (Peru). Nat. Hazards 2014, 73, 1771–1815. [Google Scholar] [CrossRef]
  75. Universidad de Washington, Department of Computer Science and Engineering. Open Data Kit—ODK; Universidad de Washington, Department of Computer Science and Engineering: Washington, DC, USA, 2015. [Google Scholar]
  76. Caceres, A.; Basagaña, X.; Gonzalez, J.R. Multiple correspondence discriminant analysis: An application to detect stratification in copy number variation. Stat. Med. 2010, 29, 3284–3293. [Google Scholar] [CrossRef]
  77. Pinti, A.; Rambaud, F.; Griffon, J.-L.; Ahmed, A.T. A tool developed in Matlab for multiple correspondence analysis of fuzzy coded data sets: Application to morphometric skull data. Comput. Methods Programs Biomed. 2010, 98, 66–75. [Google Scholar] [CrossRef] [PubMed]
  78. Greenacre, M. Correspondence analysis of raw data. Ecology 2010, 91, 958–963. [Google Scholar] [CrossRef] [PubMed] [Green Version]
  79. Batista-Foguet, J.M.; Revilla, M.; Saris, W.E.; Boyatzis, R.; Serlavós, R. Reassessing the Effect of Survey Characteristics on Common Method Bias in Emotional and Social Intelligence Competencies Assessment. Struct. Equ. Model. 2014, 21, 596–607. [Google Scholar] [CrossRef]
  80. Husson, F.; Lê, S.; Mazet, J. Factor Analysis and Data Mining with R. 2006. Available online: http://ftp.auckland.ac.nz/software/CRAN/doc/packages/FactoMineR.pdf (accessed on 10 August 2019).
  81. R Core Team. R: A language and environment for statistical computing. Available online: http://www.r-project.org/ (accessed on 29 May 2019).
Figure 1. Vulnerability framework [22] (adapted by the authors).
Sustainability 11 04341 g001
Figure 2. Location of Colombia and the three municipalities under study (Plato, Caucasia, Amalfi).
Sustainability 11 04341 g002
Figure 3. Floods reported by municipality [63,64,65].
Sustainability 11 04341 g003
Figure 4. Flood zone by the stream “Tequendamita”—Amalfi (Antioquia).
Sustainability 11 04341 g004
Figure 5. Research neighborhoods in Plato (Magdalena)—San Rafael and Siete de Agosto.
Sustainability 11 04341 g005
Figure 6. Research neighborhoods in Caucasia (Antioquia)—San Miguel and La Victoria.
Sustainability 11 04341 g006
Figure 7. Visualization of the three applications of the ODK suite (a) ODK Build, (b) ODK Collect, (c) ODK Aggregate.
Sustainability 11 04341 g007
Figure 8. Visualization of collected data in Google Earth v.7.1.7.2606.
Sustainability 11 04341 g008
Figure 9. Simultaneous representation of variables and households on the first factorial plane.
Sustainability 11 04341 g009
Figure 10. Representation of the variables after removal of households and nonsignificant variables.
Sustainability 11 04341 g010
Figure 11. Prioritization conditions in regard to vulnerability by block in the evaluated neighborhoods of Plato (Magdalena): Siete de Agosto (a), San Rafael (b).
Sustainability 11 04341 g011
Figure 12. Prioritization conditions in regard to vulnerability by block in the evaluated neighborhoods of Caucasia (Antioquia): La Victoria (a) and San Miguel (b).
Sustainability 11 04341 g012
Figure 13. Variance of the variables analyzed by dimension of the multiple correspondence analysis (MCA). (a) Exposure, (b) Susceptibility, (c) Resilience.
Sustainability 11 04341 g013aSustainability 11 04341 g013b
Figure 14. Vulnerability map by households, urban center of the municipality of Amalfi.
Sustainability 11 04341 g014
Table 1. Vulnerability variables evaluated.
Vulnerability
ExposureSusceptibilityResilience
People with permanent disabilitiesEvacuation proceduresEducational level reached of the inhabitants of the home
Household inhabitants’ genderAccess to public servicesParticipation in associative organizations
Age of the inhabitants of the householdImpact on the provision of public servicesAccess to health services
Family structureEmployment level—Labor situationHousing availability after evacuations during floods (R)
OvercrowdingIncome per householdAccess to warning systems
Angle of the building with respect to the river channelEconomically dependent household membersAccess to humanitarian aid
Household height with respect to the base level of the river channelFamily debtsAccess to media
Protective elementsLoss of housing contentsAcceptance and result of the processes of prevention, attention, and education against risk
Number of windows and doors on the most exposed façadeInvestment on home repairs to avoid damage and losses due to floodsTrust in the government institutions response in case of an event.
Typology of the building—Material of walls and floorsPopulation density per block and homesAwareness of the relationship between environmental management and risk reduction
Distance to the nearest drainage or riverState of preservation of the structureAwareness of the ability of institutions to react to a risk situation
Building areaYear of construction of the buildingSelf-awareness of being under risk
Construction density of the blockHouse tenure
Loss of flood energy considering block formExistence of insurance culture and savings among the inhabitants of the municipality
Road density per block
Type of structural foundation
Table 2. Qualification example for the typology of the building—material of walls and floors variable [29].
VariableTypology of the Building—Material of Walls and Floors
Possible outcomes of the variableBlock, brick, stone, polished wood, stepped wall and adobe.Bahareque, prefabricated material, rough wood, board, plank.Guadua, cane, mat, other vegetable, zinc, cloth, cardboard, cans, waste, plastics.
Qualification (qualitative)Low (L)Medium (M)High (H)
Qualification (quantitative)(0.2)(0.3)(0.5)
Table 3. Example of table used as input for the MCA.
ViVi+1Vi+2……..Vn
Household 1MHM H
Household 2LLM L
...
Household nHHM H

