Comparative Study of Environmental Assessment Methods in the Evaluation of Resources and Environmental Carrying Capacity—A Case Study in Xinjiang, China

 ,
,
Abstract
:1. Introduction
2. Materials and Methods
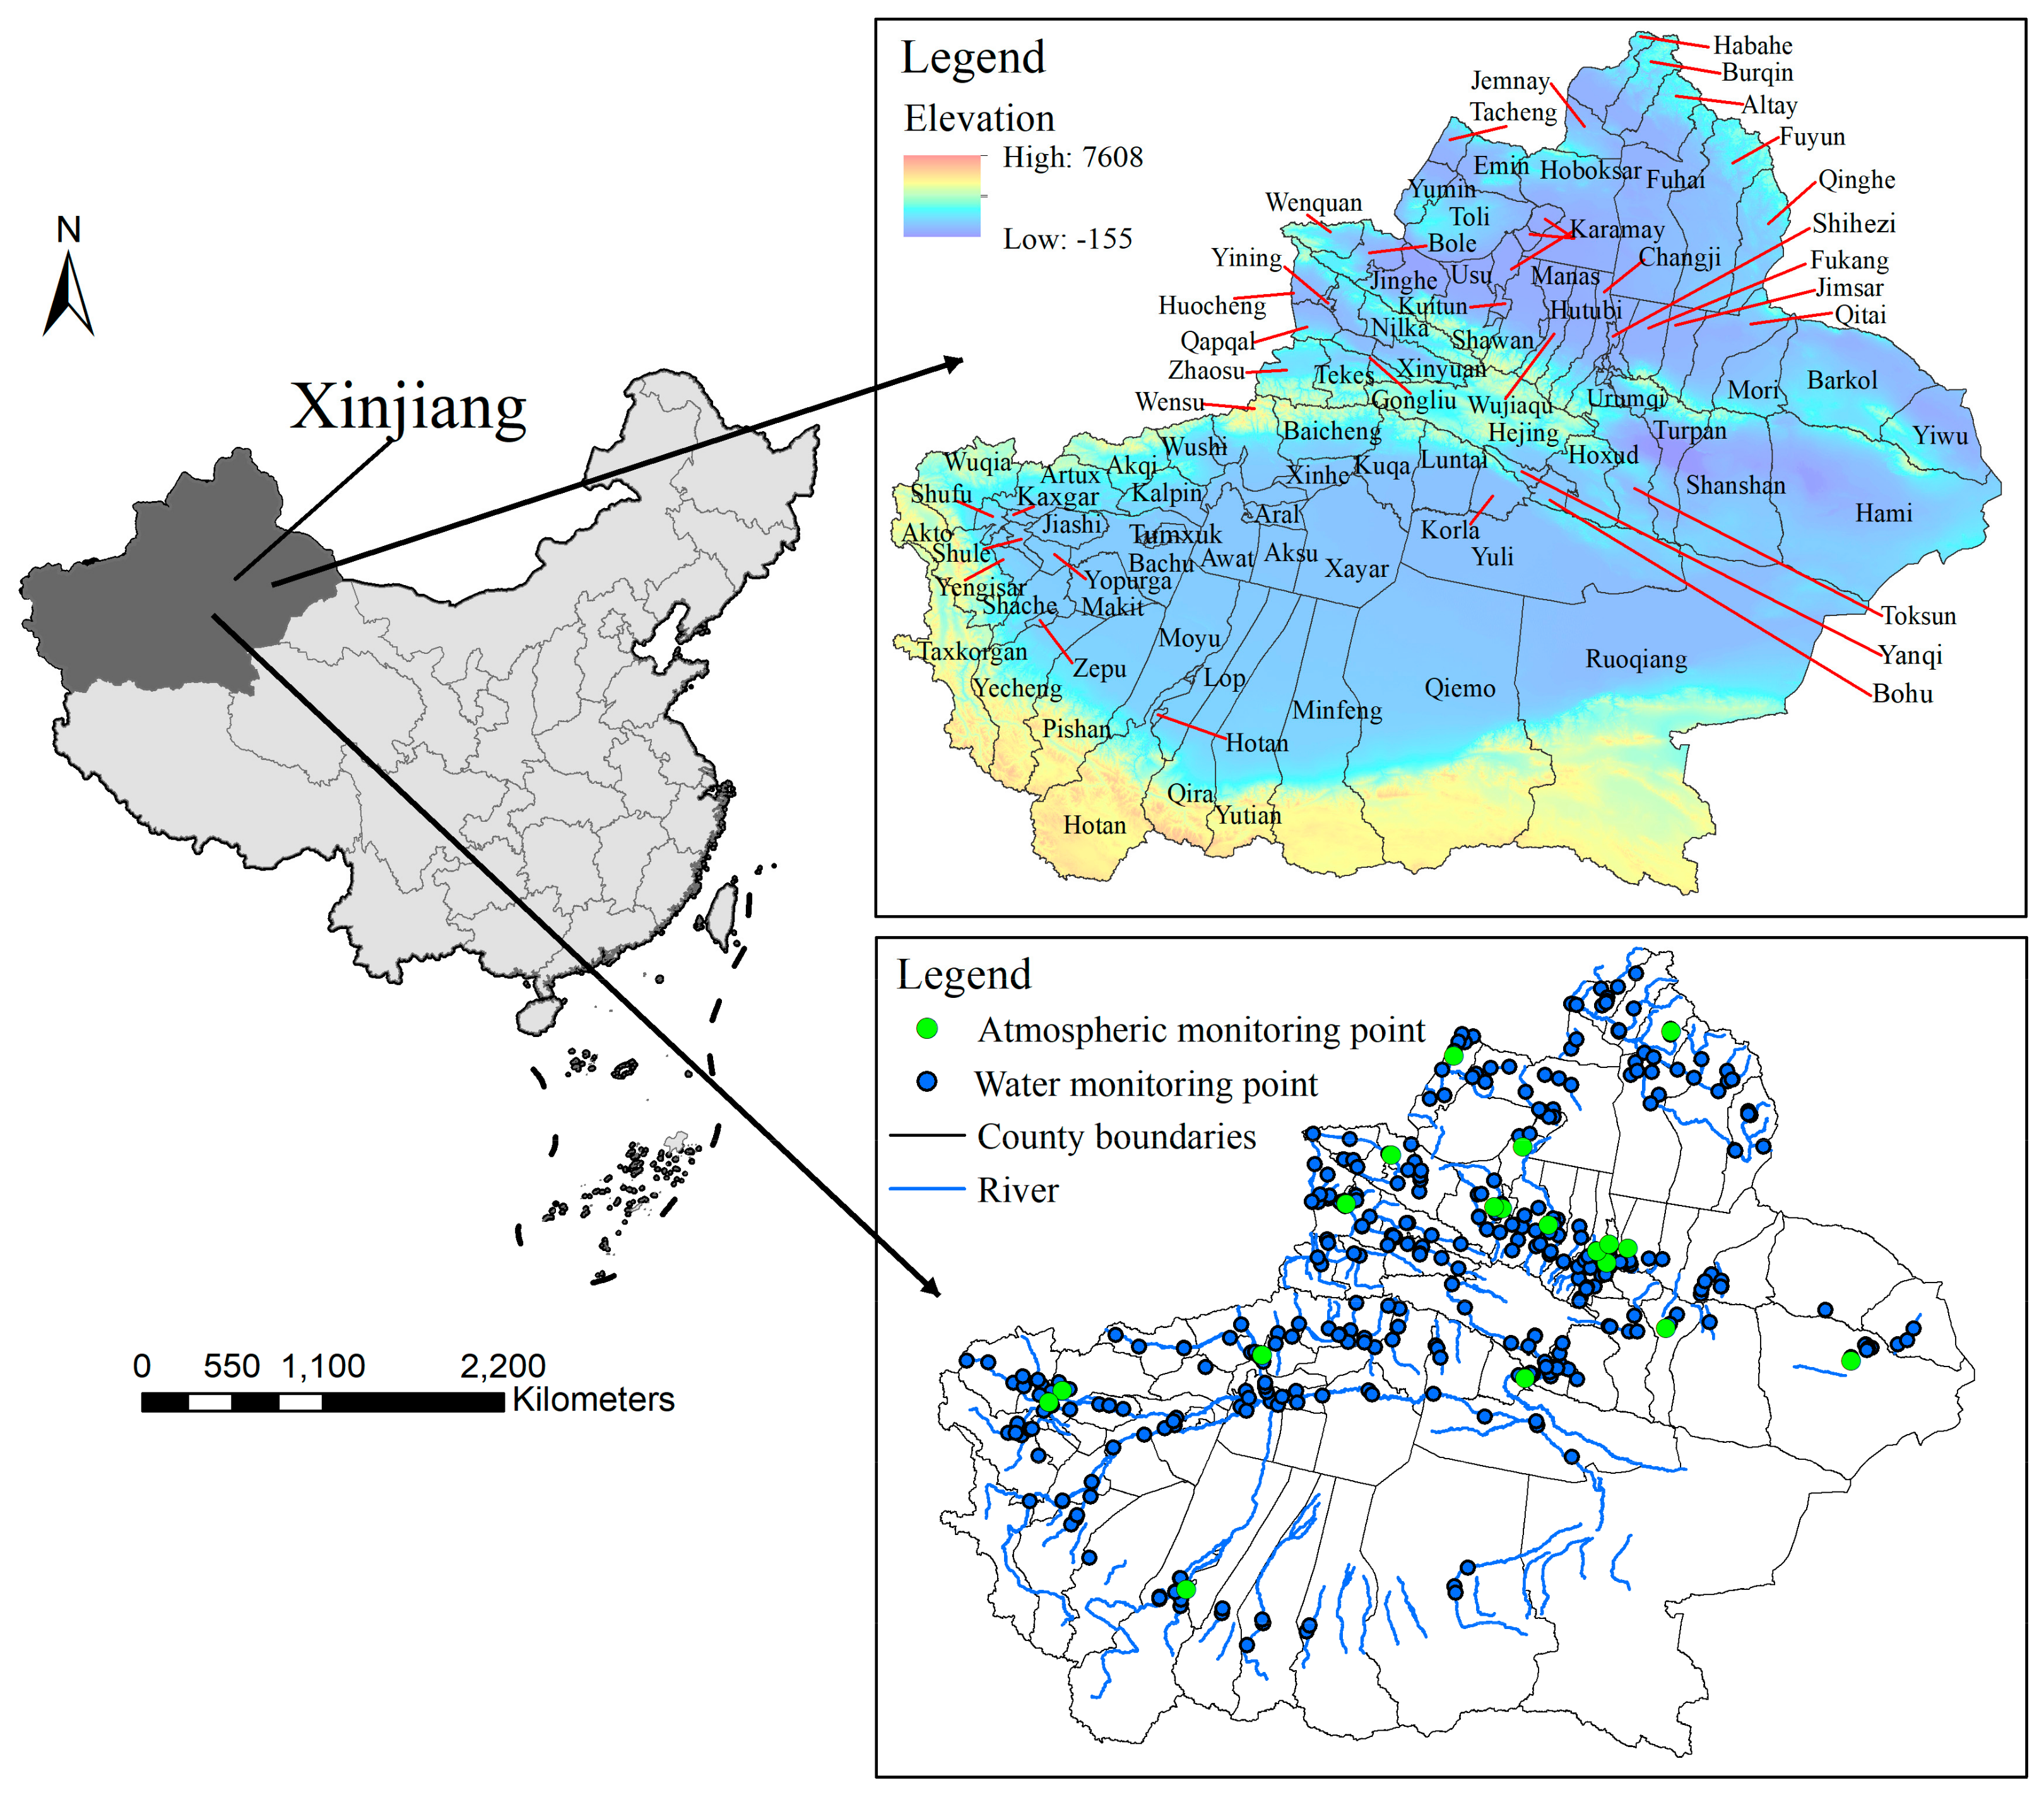
2.1. Study Area
2.2. Data Sources and Processing
2.3. ECC Evaluation Based on EQSs
2.3.1. Assessment of the Individual Pollutants
- when i = 1,
- when i = 2–7,
2.3.2. Assessment of the AECC
2.3.3. Assessment of the WECC
2.3.4. Assessment of the CECC
2.3.5. Threshold and Important Parameters
3. Results and Discussion
3.1. Assessment of the Individual Pollutants
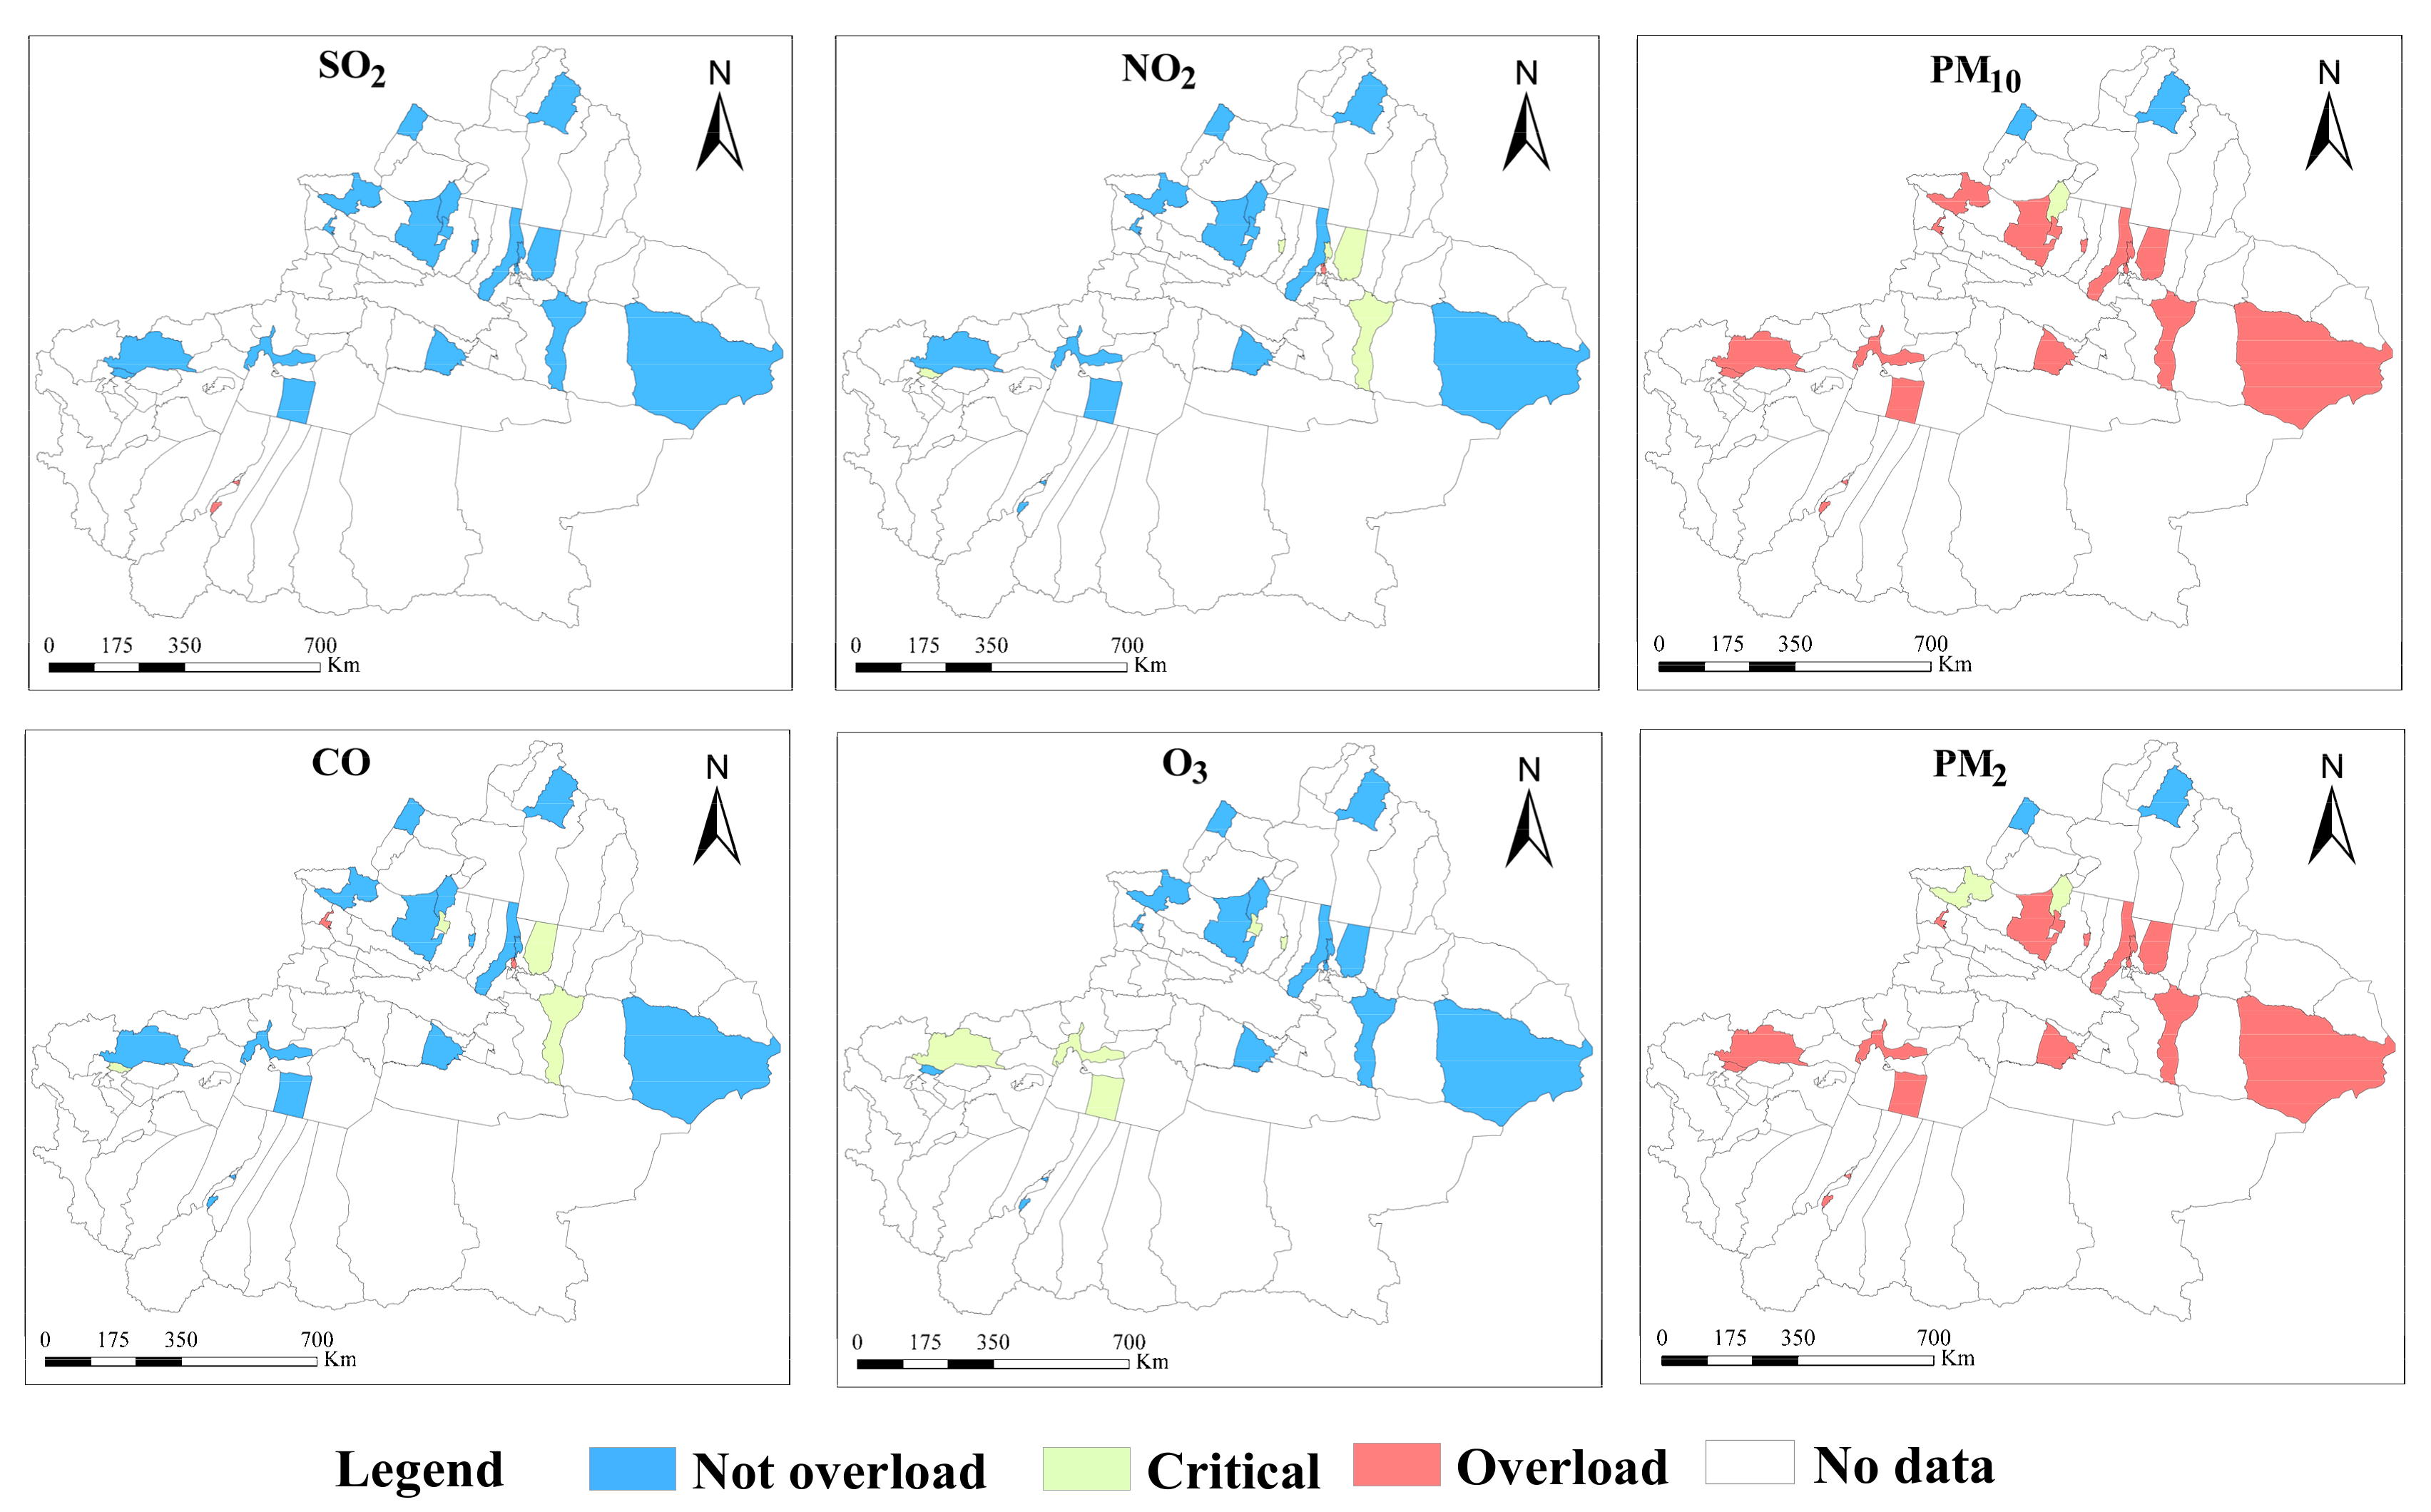
3.1.1. Atmospheric Pollutants
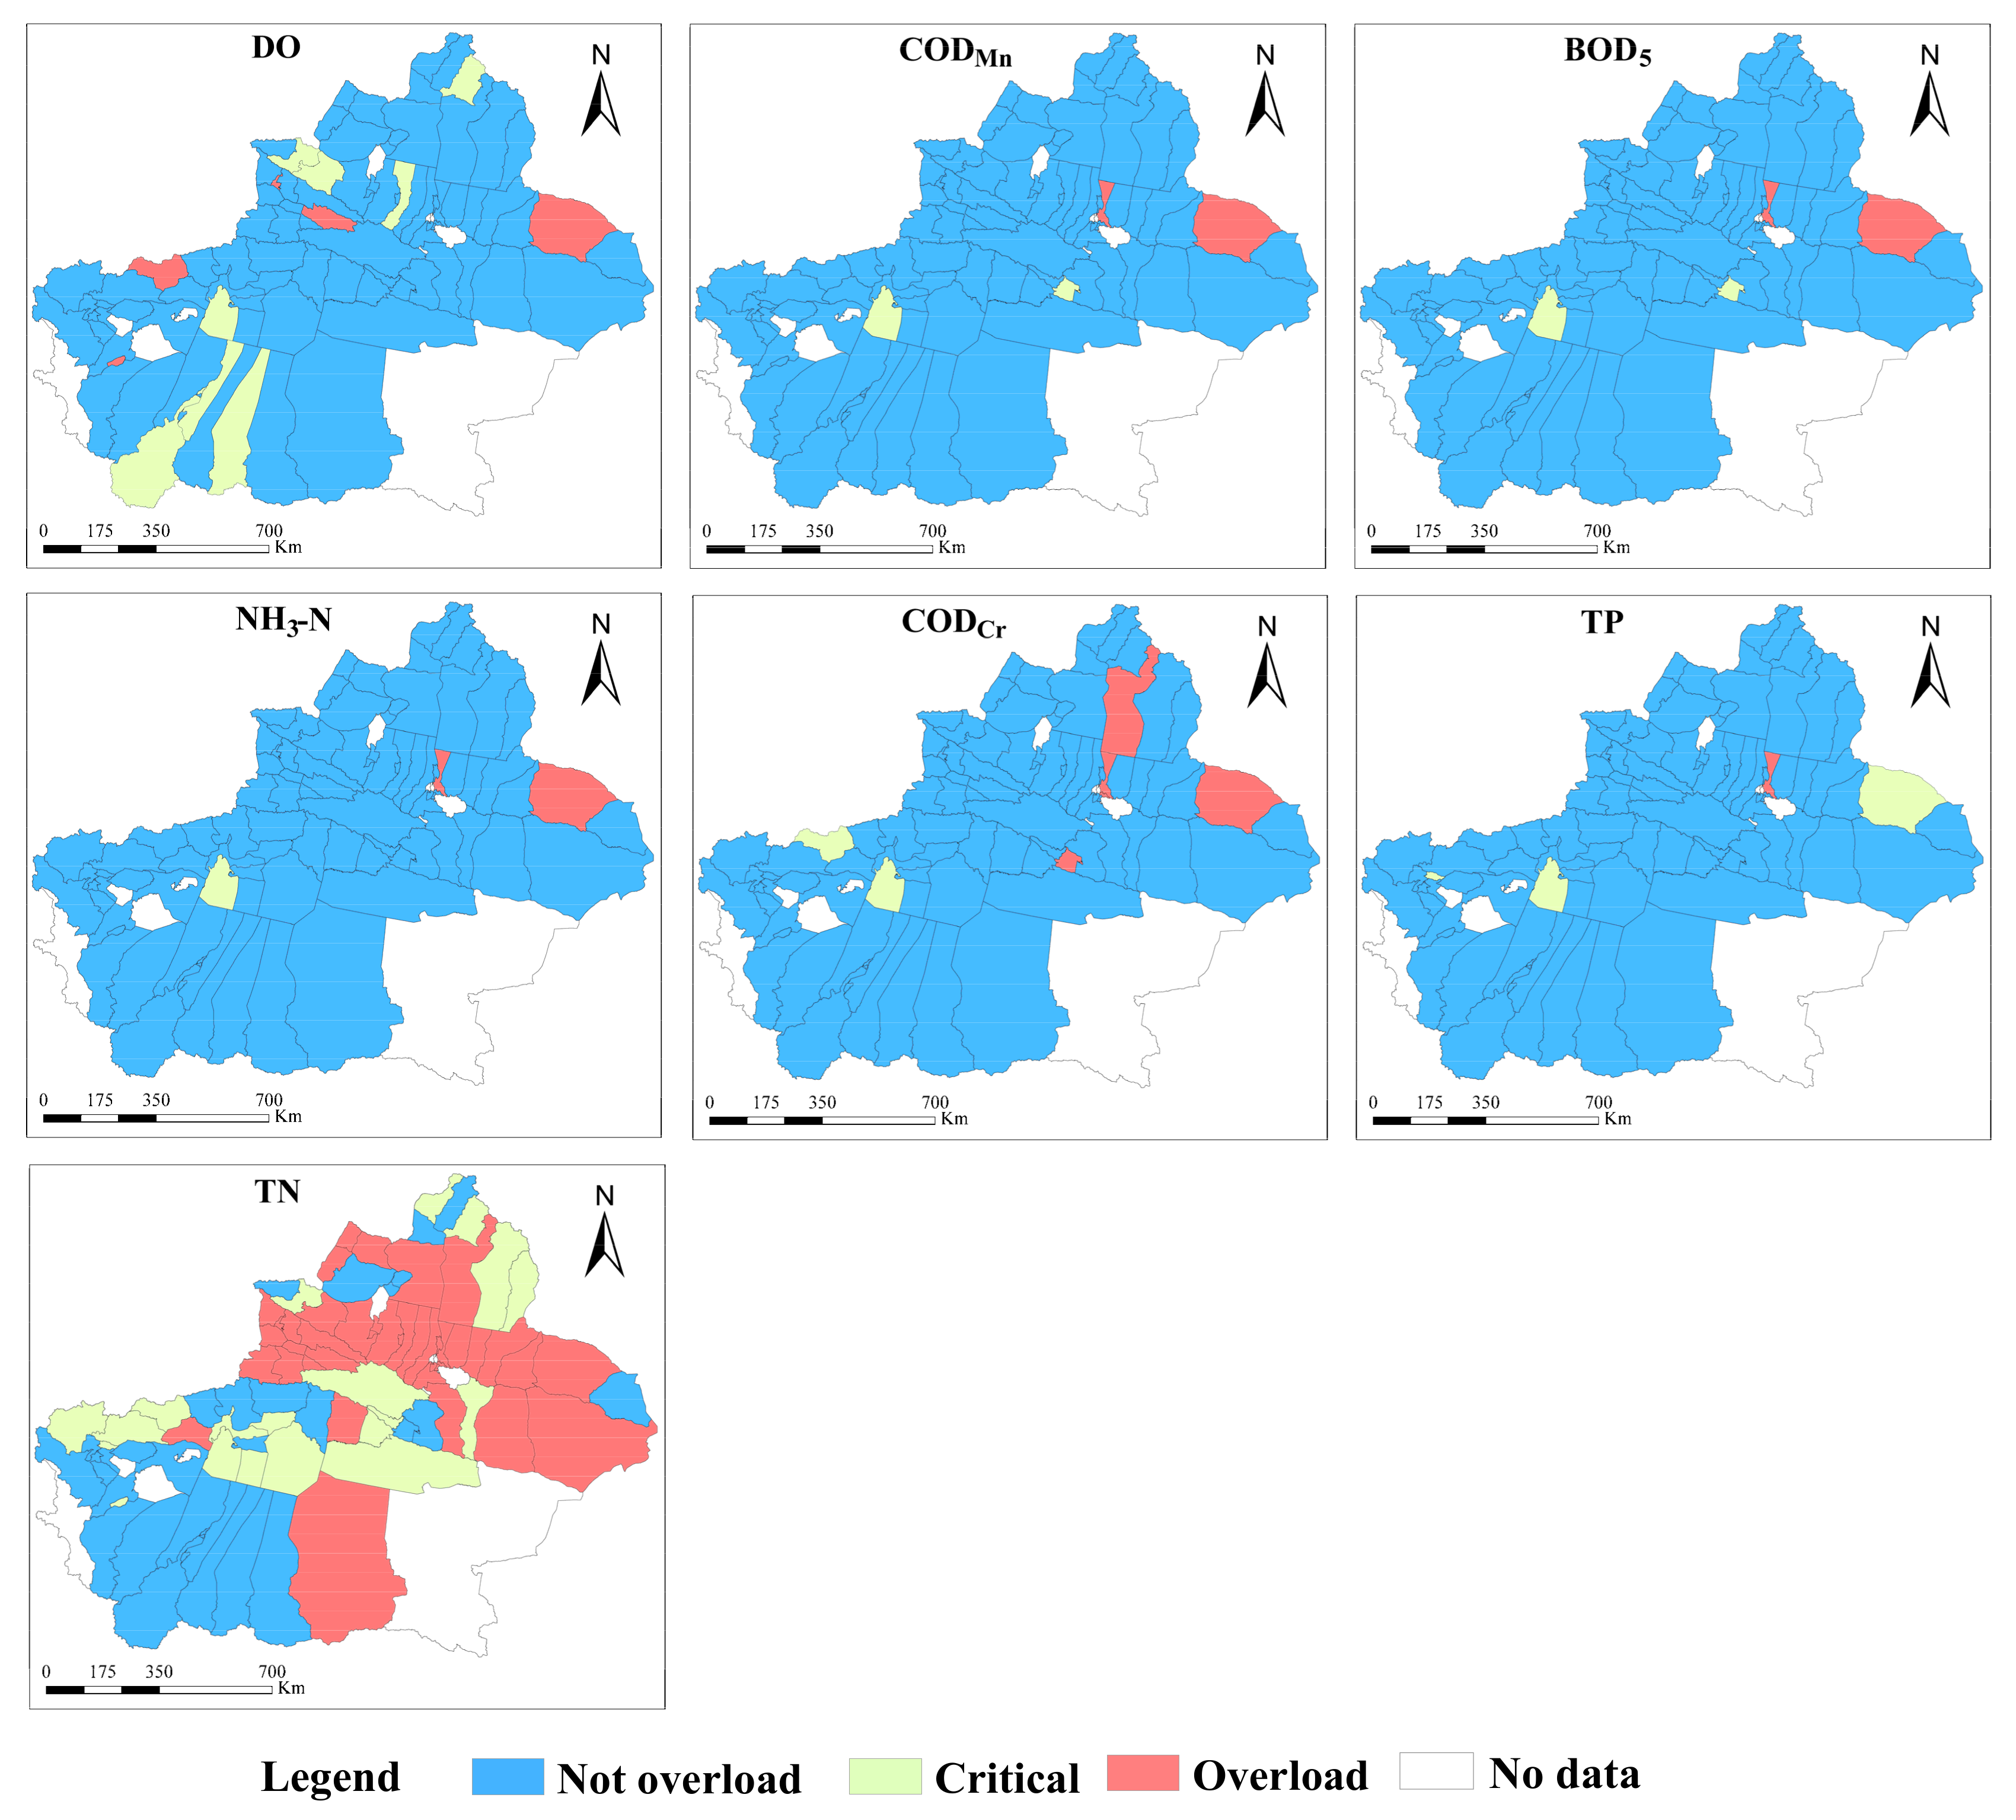
3.1.2. Water Pollutants
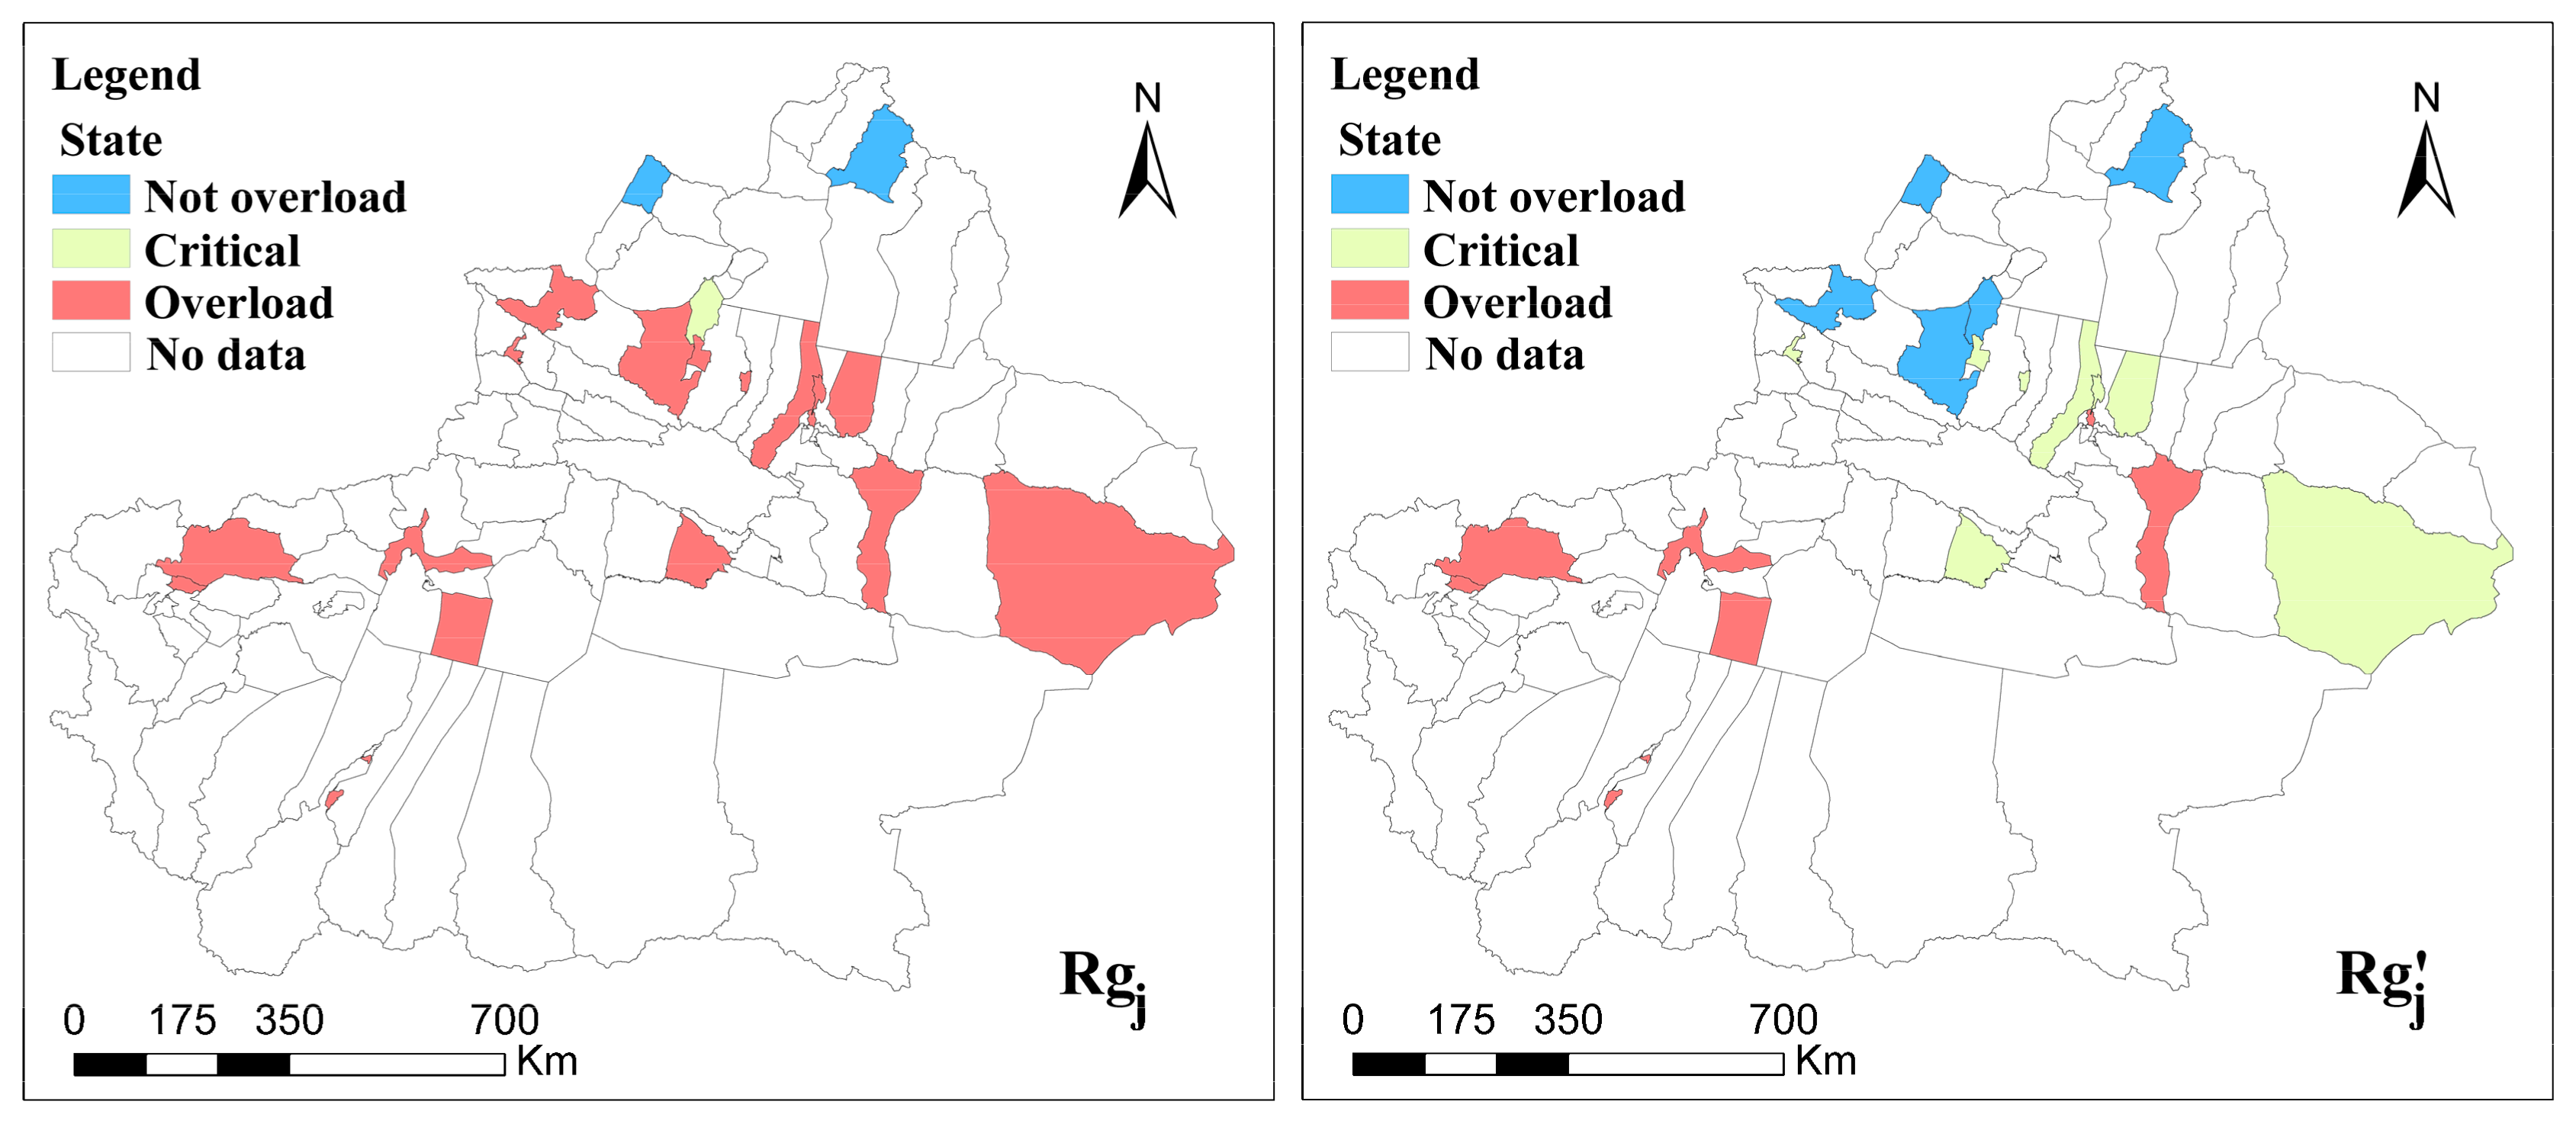
3.2. Assessment of the AECC
3.2.1. Short Board Effect
3.2.2. Weighted Average
3.2.3. Comparative Analysis
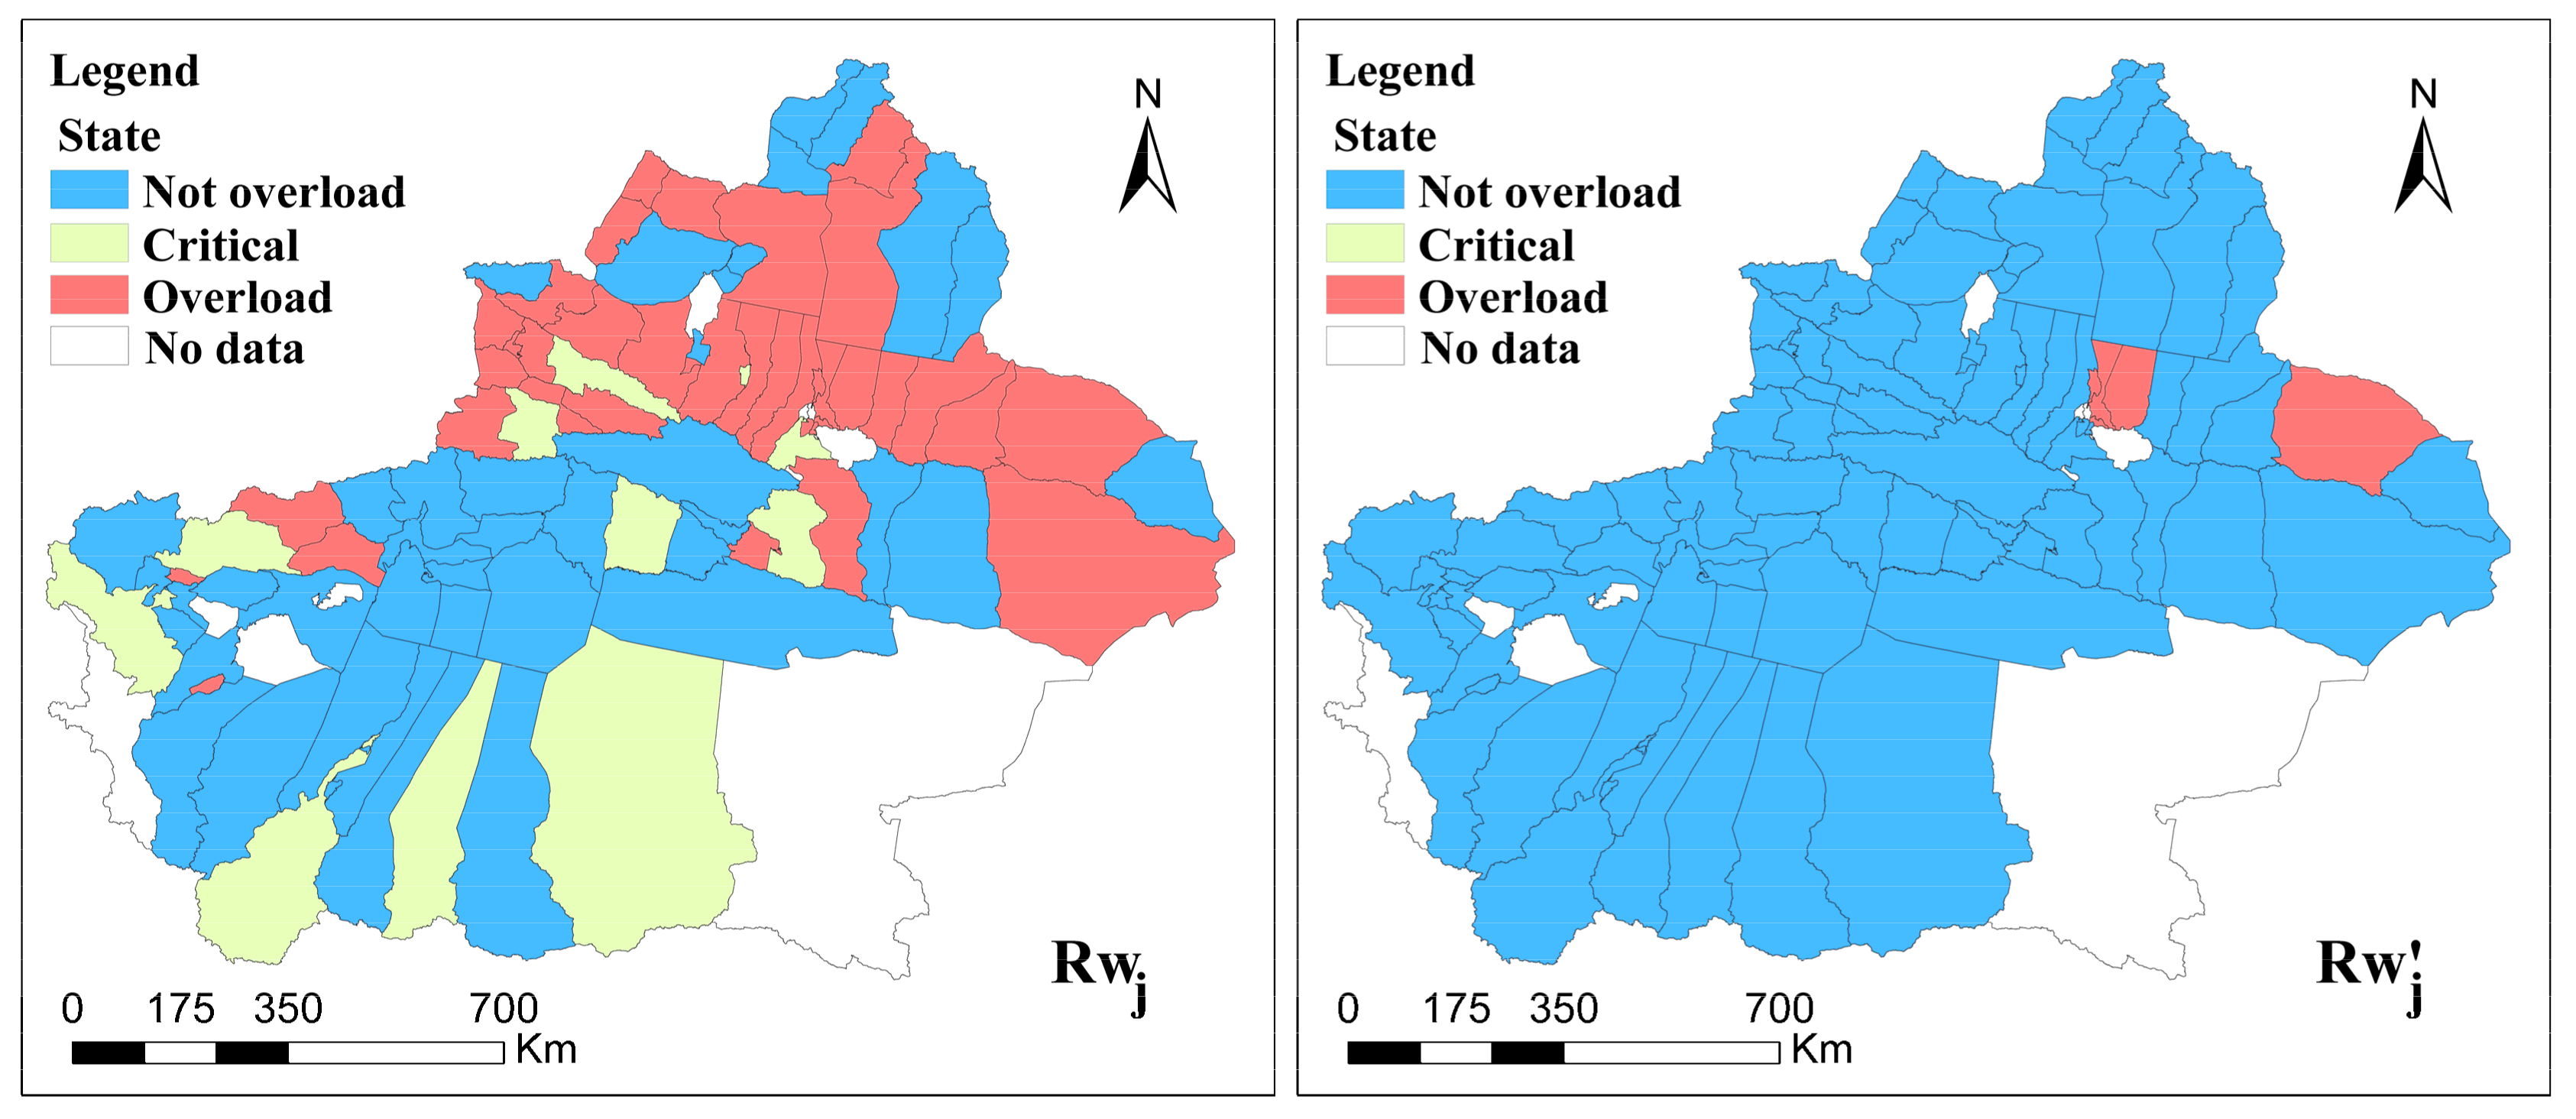
3.3. Assessment of the WECC
3.3.1. Short Board Effect
3.3.2. Weighted Average
3.3.3. Comparative Analysis
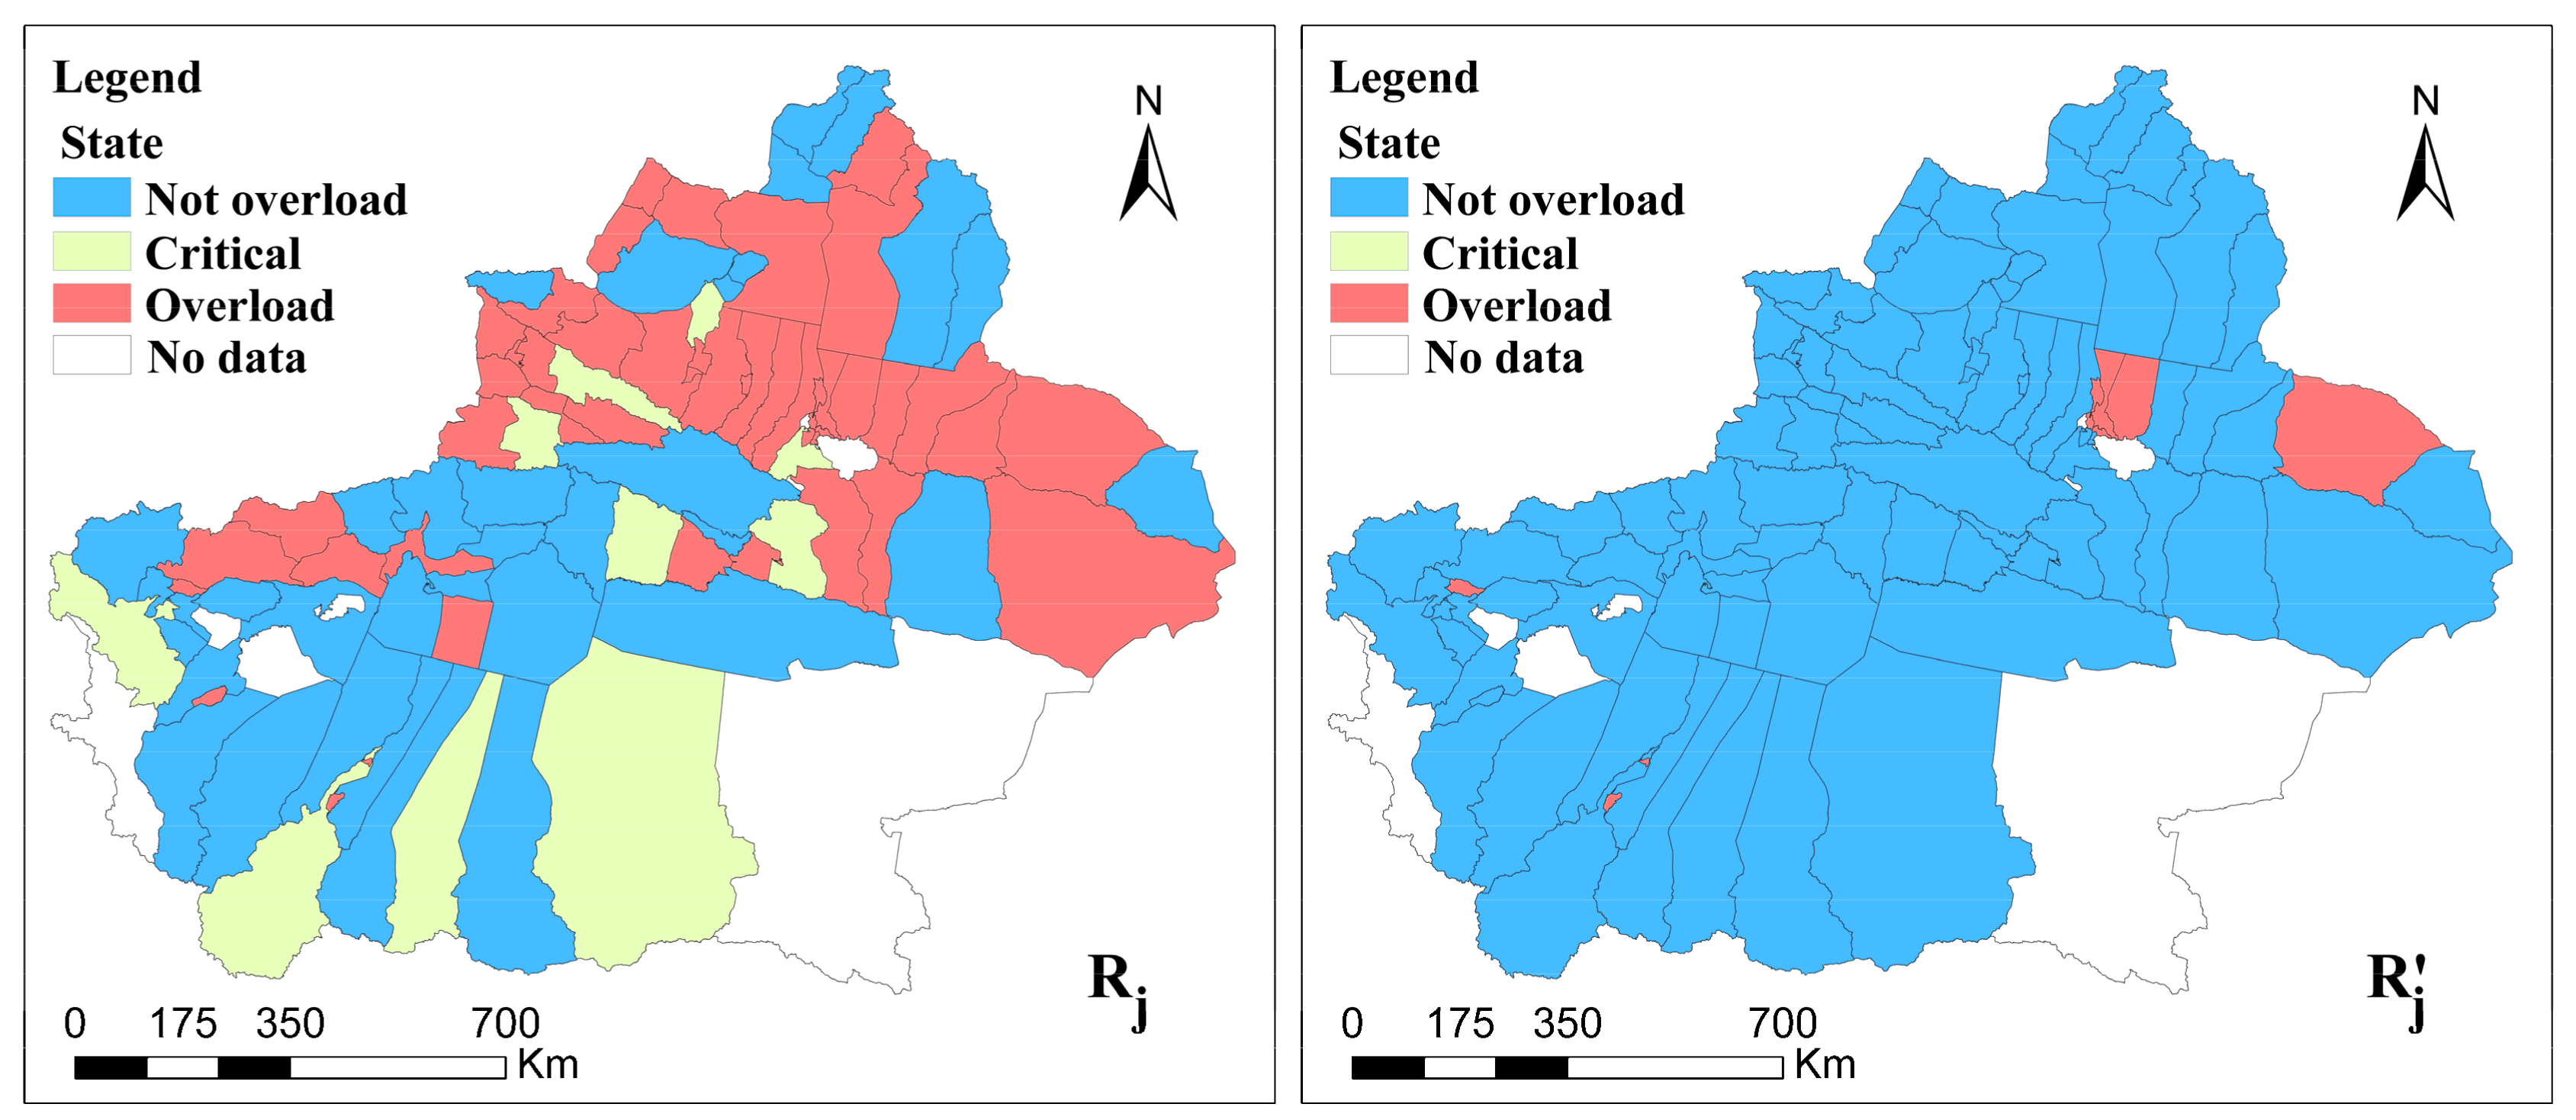
3.4. Assessment of the CECC
3.4.1. Short Board Effect
3.4.2. Weighted Average
3.4.3. Comparative Analysis
3.5. Applicability Analysis of the Methods
4. Conclusions and Implications
4.1. Conclusions
- (1)
- PM2.5 and PM10 were the main factors that exceeded the atmospheric environmental standard; they are closely related to drought, low rainfall amounts, wind and sand in the natural environment of Xinjiang. TN was the main factor that exceeded the water environmental standard and was the key water environmental factor in Xinjiang.
- (2)
- Based on a comparative study of the short board effect and weighted average methods, an evaluation of EQSs based on the weighted average was adopted in the factor layer, which was more suitable for evaluating the ECC in Xinjiang.
- (3)
- There are great differences in the natural environments of China. In the RECC evaluation, the short board effect was used in the environmental assessment from the element level to amplify the environmental constraints. The weighted average evaluation was used in the element-level assessment, while the short board effect evaluation was used in the comprehensive integration. This practice effectively prevented the influence of non-key factors from being amplified, and thus, more objective and reasonable final evaluation results were obtained.
4.2. Implications
Author Contributions
Funding
Acknowledgments
Conflicts of Interest
References
- Ebenstein, A.; Fan, M.; Greenstone, M.; He, G.; Zhou, M. New evidence on the impact of sustained exposure to air pollution on life expectancy from China’s Huai River Policy. Proc. Natl. Acad. Sci. USA 2017, 114, 10384–10389. [Google Scholar] [CrossRef] [PubMed]
- Sun, S.; Tian, L.; Cao, W.; Lai, P.C.; Wong, P.P.Y.; Lee, R.S.Y.; Mason, T.G.; Krämer, A.; Wong, C.M. Urban climate modified short-term association of air pollution with pneumonia mortality in Hong Kong. Sci. Total Environ. 2019, 646, 618–624. [Google Scholar] [CrossRef] [PubMed]
- Jiang, Y. China’s water scarcity. J. Environ. Manag. 2009, 90, 3185–3196. [Google Scholar] [CrossRef] [PubMed]
- Zuo, Q.; Jin, R.; Ma, J.; Cui, G. China pursues a strict water resources management system. Environ. Earth Sci. 2014, 72, 2219–2222. [Google Scholar] [CrossRef]
- Kiesewetter, G.; Schoepp, W.; Heyes, C.; Amann, M. Modelling PM2. 5 impact indicators in Europe: Health effects and legal compliance. Environ. Model. Softw. 2015, 74, 201–211. [Google Scholar] [CrossRef]
- Malthus, T.R. An Essay on the Principle of Population; Cambridge University Press: Cambridge, UK, 1826. [Google Scholar]
- Park, R.E.; Burgess, E.W. Introduction to the Science of Sociology; University of Chicago Press: Chicago, IL, USA, 1924; Volume 574. [Google Scholar]
- Bishop, A.B. Carrying Capacity in Regional Environmental Management; U.S. Government Printing Office: Washington, DC, USA, 1974; Volume 1.
- Zeng, W.; Wang, H.; Xue, J.; Ye, W.; Guan, B.; Mei, F. Environmental carrying capacity: A key to the coordination of the development of population, resources and environment. China Popul. Resour. Environ. 1991, 1, 33–37. (In Chinese) [Google Scholar]
- Peng, Z. The primary exploring of the research method of AESC. China Environ. Sci. 1996, 16, 6–10. (In Chinese) [Google Scholar]
- Feng, Z.; Yang, Y.; Yan, H. A review of resources and environment carrying capacity research since the 20th Century: From theory to practice. Resour. Sci. 2017, 39, 379–395. (In Chinese) [Google Scholar]
- Wang, J.; Sun, T.Y.; Li, P.J.; Li, F.Y. Research progress on environmental carrying capacity. J. Appl. Ecol. 2005, 16, 768–772. (In Chinese) [Google Scholar]
- Wang, C.; Feng, L.; Luo, W. Comprehensive evaluation of carrying capacity of water resources in Yangtze River Delta. J. Water Resour. Water Eng. 2012, 4, 38–42. (In Chinese) [Google Scholar]
- Wei, C.; Guo, Z.; Wu, J.; Ye, S. Constructing an assessment indices system to analyze integrated regional carrying capacity in the coastal zones–A case in Nantong. Ocean Coast. Manag. 2014, 93, 51–59. [Google Scholar] [CrossRef]
- Zheng, D.; Zhang, Y.; Zang, Z.; Sun, C. Empirical research on carrying capacity of human settlement system in Dalian City, Liaoning Province, China. Chin. Geogr. Sci. 2015, 25, 237–249. [Google Scholar] [CrossRef]
- Peng, J.; Du, Y.; Liu, Y.; Hu, X. How to assess urban development potential in mountain areas? An approach of ecological carrying capacity in the view of coupled human and natural systems. Ecol. Indic. 2016, 60, 1017–1030. [Google Scholar] [CrossRef]
- Zhang, F.; Wang, Y.; Ma, X.; Wang, Y.; Yang, G.; Zhu, L. Evaluation of resources and environmental carrying capacity of 36 large cities in China based on a support-pressure coupling mechanism. Sci. Total Environ. 2019. [Google Scholar] [CrossRef] [PubMed]
- Wackernagel, M.; Yount, J.D. The ecological footprint: An indicator of progress toward regional sustainability. Environ. Monit. Assess. 1998, 51, 511–529. [Google Scholar] [CrossRef]
- Thébault, J.; Schraga, T.S.; Cloern, J.E.; Dunlavey, E.G. Primary production and carrying capacity of former salt ponds after reconnection to San Francisco Bay. Wetlands 2008, 28, 841–851. [Google Scholar] [CrossRef] [Green Version]
- Sutton, P.C.; Anderson, S.J.; Tuttle, B.T.; Morse, L. The real wealth of nations: Mapping and monetizing the human ecological footprint. Ecol. Indic. 2012, 16, 11–22. [Google Scholar] [CrossRef]
- Jung, C.; Kim, C.; Kim, S.; Suh, K. Analysis of Environmental Carrying Capacity with Emergy Perspective of Jeju Island. Sustainability (Basel) 2018, 10, 1681. [Google Scholar] [CrossRef]
- Davies, E.G.; Simonovic, S.P. Global water resources modeling with an integrated model of the social–economic–environmental system. Adv. Water Resour. 2011, 34, 684–700. [Google Scholar] [CrossRef]
- Wang, Y.; Zhou, X.; Engel, B. Water environment carrying capacity in Bosten Lake basin. J. Clean. Prod. 2018, 199, 574–583. [Google Scholar] [CrossRef]
- Wang, W.; Zeng, W. Optimizing the regional industrial structure based on the environmental carrying capacity: An inexact fuzzy multi-objective programming model. Sustainability (Basel) 2013, 5, 5391–5415. [Google Scholar] [CrossRef]
- Xue, W.; Fu, F.; Wang, J.; He, K.; Lei, Y.; Yang, J.; Wang, S.; Hang, B. Modeling study on atmospheric environmental capacity of major pollutants constrained by PM2.5 compliance of Chinese cities. China Environ. Sci. 2014, 34, 2490–2496. (In Chinese) [Google Scholar]
- Li, N.; Yang, H.; Wang, L.; Huang, X.; Zeng, C.; Wu, H.; Ma, X.; Song, X.; Wei, Y. Optimization of industry structure based on water environmental carrying capacity under uncertainty of the Huai River Basin within Shandong Province, China. J. Clean. Prod. 2016, 112, 4594–4604. [Google Scholar] [CrossRef]
- Liu, R.; Borthwick, A.G. Measurement and assessment of carrying capacity of the environment in Ningbo, China. J. Environ. Manag. 2011, 92, 2047–2053. [Google Scholar] [CrossRef] [PubMed]
- Pandey, V.P.; Babel, M.S.; Shrestha, S.; Kazama, F. A framework to assess adaptive capacity of the water resources system in Nepalese river basins. Ecol. Indic. 2011, 11, 480–488. [Google Scholar] [CrossRef]
- Nianlei, L.; Yaling, L.; Hongqiang, J.; Xi, C. Environmental carrying capacity evaluation methods and application based on environmental quality standards. Prog. Geogr. 2017, 36, 296–305. (In Chinese) [Google Scholar]
- Yang, J.; Lei, K.; Khu, S.; Meng, W.; Qiao, F. Assessment of water environmental carrying capacity for sustainable development using a coupled system dynamics approach applied to the Tieling of the Liao River Basin, China. Environ. Earth Sci. 2015, 73, 5173–5183. [Google Scholar] [CrossRef]
- Zeng, W.; Wu, B.; Chai, Y. Dynamic simulation of urban water metabolism under water environmental carrying capacity restrictions. Front. Environ. Sci. Eng. 2016, 10, 114–128. [Google Scholar] [CrossRef]
- Carey, D.I. Development based on carrying capacity: A strategy for environmental protection. Glob. Environ. Chang. 1993, 3, 140–148. [Google Scholar] [CrossRef]
- Lane, M. The carrying capacity imperative: Assessing regional carrying capacity methodologies for sustainable land-use planning. Land Use Policy 2010, 27, 1038–1045. [Google Scholar] [CrossRef] [Green Version]
- Du, J.; Shu, J.; Yin, J.; Yuan, X.; Jiaerheng, A.; Xiong, S.; He, P.; Liu, W. Analysis on spatio-temporal trends and drivers in vegetation growth during recent decades in Xinjiang, China. Int. J. Appl. Earth Obs. 2015, 38, 216–228. [Google Scholar] [CrossRef]
- Wu, Z.; Zhang, H.; Krause, C.M.; Cobb, N.S. Climate change and human activities: A case study in Xinjiang, China. Clim. Chang. 2010, 99, 457–472. [Google Scholar] [CrossRef]
- Yushanjiang, A.; Zhang, F.; Yu, H. Quantifying the spatial correlations between landscape pattern and ecosystem service value: A case study in Ebinur Lake Basin, Xinjiang, China. Ecol. Eng. 2018, 113, 94–104. [Google Scholar] [CrossRef]
- Mamat, Z.; Yimit, H.; Eziz, A.; Ablimit, A. Oasis land-use change and its effects on the eco-environment in Yanqi Basin, Xinjiang, China. Environ. Monit. Assess. 2014, 186, 335–348. [Google Scholar] [CrossRef] [PubMed]
- Abulizi, A.; Yang, Y.; Mamat, Z.; Luo, J.; Abdulslam, D.; Xu, Z.; Zayiti, A.; Ahat, A.; Halik, W. Land-use change and its effects in Charchan Oasis, Xinjiang, China. Land Degrad. Dev. 2017, 28, 106–115. [Google Scholar] [CrossRef]
- Lei, X.; Lu, J.; Liu, Z.; Tong, Y.; Li, S. Concentration and distribution of antibiotics in water–sediment system of Bosten Lake, Xinjiang. Environ. Sci. Pollut. Res. 2015, 22, 1670–1678. [Google Scholar] [CrossRef]
- Liu, J.; Yao, X.; Lu, J.; Qiao, X.; Liu, Z.; Li, S. Distribution and factors affecting adsorption of sterols in the surface sediments of Bosten Lake and Manas Lake, Xinjiang. Environ. Sci. Pollut. Res. 2016, 23, 5892–5901. [Google Scholar] [CrossRef] [PubMed]
- Zhan, D.; Kwan, M.P.; Zhang, W.; Yu, X.; Meng, B.; Liu, Q. The driving factors of air quality index in China. J. Clean. Prod. 2018, 197, 1342–1351. [Google Scholar] [CrossRef]
- Chinese Research Academy of Environmental Sciences; National Environmental Monitoring Centre. Ambient air quality standards. In China National Standards (CN-GB); Standardization Administration of China: Beijing, China, 2012; Volume GB 3095-2012. [Google Scholar]
- Chinese Research Academy of Environmental Sciences. Environmental quality standards for surface water. In State Environmental Protection Administration of China; General Administration of Quality Supervision, Inspection and Quarantine of China: Beijing, China, 2002; Volume GB 3838-2002. [Google Scholar]
- LeBauer, D.S.; Treseder, K.K. Nitrogen limitation of net primary productivity in terrestrial ecosystems is globally distributed. Ecology 2008, 89, 371–379. [Google Scholar] [CrossRef]
- Carreiro, M.; Sinsabaugh, R.; Repert, D.; Parkhurst, D. Microbial enzyme shifts explain litter decay responses to simulated nitrogen deposition. Ecology 2000, 81, 2359–2365. [Google Scholar] [CrossRef]
- Zak, D.R.; Holmes, W.E.; Burton, A.J.; Pregitzer, K.S.; Talhelm, A.F. Simulated atmospheric NO3− deposition increases soil organic matter by slowing decomposition. Ecol. Appl. 2008, 18, 2016–2027. [Google Scholar] [CrossRef]
- Huang, C.B.; Zeng, F.J.; Lei, J.Q. Cultivation effects on the carbon and nitrogen dynamics at depth in oasis farmlands of the Southern Tarim Basin, China. Soil Sci. Plant Nutr. 2015, 61, 287–294. [Google Scholar] [CrossRef]
- Hou, X.; Fei, D.; Kang, H.; Zhang, Y.; Gao, J. Seasonal statistical analysis of the impact of meteorological factors on fine particle pollution in China in 2013–2017. Nat. Hazards 2018, 93, 677–698. [Google Scholar] [CrossRef]
- Ye, W.F.; Ma, Z.Y.; Ha, X.Z. Spatial-temporal patterns of PM2.5 concentrations for 338 Chinese cities. Sci. Total Environ. 2018, 631, 524–533. [Google Scholar] [CrossRef]
- Wang, Y.; Zhang, J.; Bai, Z.; Yang, W.; Zhang, H.; Mao, J.; Sun, Y.; Ma, Z.; Xiao, J.; Gao, S. Background concentrations of PMs in Xinjiang, West China: An estimation based on meteorological filter method and Eckhardt algorithm. Atmos. Res. 2019, 215, 141–148. [Google Scholar] [CrossRef]
- Yuhong, G. The summer dust weather occurred in the southern cities of Xinjiang, and the air quality was seriously polluted. Arid Environ. Monit. 2015, 29, 138. (In Chinese) [Google Scholar]
- Shen, Y.; Zhang, L.; Fang, X.; Ji, H.; Li, X.; Zhao, Z. Spatiotemporal patterns of recent PM2. 5 concentrations over typical urban agglomerations in China. Sci. Total Environ. 2019, 655, 13–26. [Google Scholar] [CrossRef]
- Chao, G.; Yuhong, G. Discussion of Quality Control Road-Inspection on PM10 Auto-Monitoring Instrument for City Environmental Air in Xinjiang. Arid Environ. Monit. 2010, 24, 34–38. (In Chinese) [Google Scholar]
- Yuhong, G.; Chao, G. Under the Air Unattended Station Arid Area Sandstorm Weather Moves the Question and the Solution Which Exists. Arid Environ. Monit. 2010, 24, 181–185. (In Chinese) [Google Scholar]
- Yuhong, G.; Zifa, W.; Hong, K.; Xiaoxiao, Z.; Yuan, J.; Jie, L.; Huansheng, C. Influence of monitoring index TSP and PM10 on ambient air quality grade at cities of Xinjiang, China. Arid Land Geogr. 2014, 37, 731–743. (In Chinese) [Google Scholar]
- Thomas, R.Q.; Canham, C.D.; Weathers, K.C.; Goodale, C.L. Increased tree carbon storage in response to nitrogen deposition in the US. Nat. Geosci. 2010, 3, 13. [Google Scholar] [CrossRef]
- Bradley, K.; Drijber, R.A.; Knops, J. Increased N availability in grassland soils modifies their microbial communities and decreases the abundance of arbuscular mycorrhizal fungi. Soil Biol. Biochem. 2006, 38, 1583–1595. [Google Scholar] [CrossRef]
- Adamek, M.; Corre, M.D.; Hölscher, D. Early effect of elevated nitrogen input on above-ground net primary production of a lower montane rain forest, Panama. J. Trop. Ecol. 2009, 25, 637–647. [Google Scholar] [CrossRef]
- Mack, M.C.; Schuur, E.A.; Bret-Harte, M.S.; Shaver, G.R.; Chapin, F.S., III. Ecosystem carbon storage in arctic tundra reduced by long-term nutrient fertilization. Nature 2004, 431, 440. [Google Scholar] [CrossRef]
- Janssens, I.; Dieleman, W.; Luyssaert, S.; Subke, J.A.; Reichstein, M.; Ceulemans, R.; Ciais, P.; Dolman, A.J.; Grace, J.; Matteucci, G. Reduction of forest soil respiration in response to nitrogen deposition. Nat. Geosci. 2010, 3, 315. [Google Scholar] [CrossRef]
- Kou, Y.; Li, J.; Wang, Y.; Li, C.; Tu, B.; Yao, M.; Li, X. Scale-dependent key drivers controlling methane oxidation potential in Chinese grassland soils. Soil Biol. Biochem. 2017, 111, 104–114. [Google Scholar] [CrossRef]
- Fan, J.; Wang, Y.; Tang, Q. Academic thought and technical progress of monitoring and earlywarning of the national resources and environment carrying capacity (V 2014). Sci. Geogr. Sin. 2015, 35, 1–10. (In Chinese) [Google Scholar]


| Contaminant | SO2 | NO2 | CO | O3 | PM2.5 | PM10 |
|---|---|---|---|---|---|---|
| Standard limit | 60 | 40 | 4 | 160 | 35 | 70 |
| Unit | μg/m3 | μg/m3 | mg/m3 | μg/m3 | μg/m3 | μg/m3 |
| Contaminants | DO | CODMn | CODCr | BOD5 | NH3-N | TP | TN |
|---|---|---|---|---|---|---|---|
| Standard limits | 5 | 6 | 20 | 4 | 1 | 0.2 | 1 |
| unit | mg/L | mg/L | mg/L | mg/L | mg/L | mg/L | mg/L |
© 2019 by the authors. Licensee MDPI, Basel, Switzerland. This article is an open access article distributed under the terms and conditions of the Creative Commons Attribution (CC BY) license (http://creativecommons.org/licenses/by/4.0/).
Share and Cite
Zhang, Z.; Xia, F.; Yang, D.; Zhang, Y.; Cai, T.; Wu, R. Comparative Study of Environmental Assessment Methods in the Evaluation of Resources and Environmental Carrying Capacity—A Case Study in Xinjiang, China. Sustainability 2019, 11, 4666. https://0-doi-org.brum.beds.ac.uk/10.3390/su11174666
Zhang Z, Xia F, Yang D, Zhang Y, Cai T, Wu R. Comparative Study of Environmental Assessment Methods in the Evaluation of Resources and Environmental Carrying Capacity—A Case Study in Xinjiang, China. Sustainability. 2019; 11(17):4666. https://0-doi-org.brum.beds.ac.uk/10.3390/su11174666
Chicago/Turabian StyleZhang, Zhiping, Fuqiang Xia, Degang Yang, Yufang Zhang, Tianyi Cai, and Rongwei Wu. 2019. "Comparative Study of Environmental Assessment Methods in the Evaluation of Resources and Environmental Carrying Capacity—A Case Study in Xinjiang, China" Sustainability 11, no. 17: 4666. https://0-doi-org.brum.beds.ac.uk/10.3390/su11174666