Article

The Prediction Model of Characteristics for Wind Turbines Based on Meteorological Properties Using Neural Network Swarm Intelligence

1
Department of Electrical and Electronics Engineering, Adana Alparslan Turkes Science and Technology University, 01250 Adana, Turkey
2
Department of Industrial Engineering, Adana Alparslan Turkes Science and Technology University, 01250 Adana, Turkey
3
Department of Computer Engineering, Adana Alparslan Turkes Science and Technology University, 01250 Adana, Turkey
4
Department of Energy Systems Engineering, Adana Alparslan Turkes Science and Technology University, 01250 Adana, Turkey
*
Author to whom correspondence should be addressed.
Sustainability 2019, 11(17), 4803; https://0-doi-org.brum.beds.ac.uk/10.3390/su11174803
Submission received: 17 July 2019 / Revised: 23 August 2019 / Accepted: 29 August 2019 / Published: 3 September 2019
(This article belongs to the Special Issue Artificial Intelligence for Renewable Energy Systems)

Abstract

:
In order to produce more efficient, sustainable-clean energy, accurate prediction of wind turbine design parameters provide to work the system efficiency at the maximum level. For this purpose, this paper appears with the aim of obtaining the optimum prediction of the turbine parameter efficiently. Firstly, the motivation to achieve an accurate wind turbine design is presented with the analysis of three different models based on artificial neural networks comparatively given for maximum energy production. It is followed by the implementation of wind turbine model and hybrid models developed by using both neural network and optimization models. In this study, the ANN-FA hybrid structure model is firstly used and also ANN coefficients are trained by FA to give a new approach in literature for wind turbine parameters’ estimation. The main contribution of this paper is that seven important wind turbine parameters are predicted. Aiming to fill the mentioned research gap, this paper outlines combined forecasting turbine design approaches and presents wind turbine performance in detail. Furthermore, the present study also points out the possible further research directions of combined techniques so as to help researchers in the field develop more effective wind turbine design according to geographical conditions.

1. Introduction

With the development of industrialization, it has become necessary to use clean and cheap energy sources instead of fossil fuels, which have a limited need for energy and are expected to be consumed in the near future. The use of renewable energy resources has increased in recent years in meeting energy demand. Biomass, wind, solar, hydropower, and geothermal as a renewable energy source can meet sustainable energy demands, based on the use of available, natural resources. From these sources, wind energy is one of the cleanest and most reliable sources of renewable energy that have increased in recent years. Wind energy has been used to meet the needs of human beings, such as pumping water, transport and grinding of goods. In meeting energy needs, wind energy has taken second place after solar energy as a renewable energy source. In wind energy applications, the power generated by the rotation of wind turbine blades is used in mechanical or electrical form. In addition to its widespread use, there are disadvantages of wind energy. It does not work efficiently in regions where wind speed is weak. Wind turbine parameters given by manufacturers can vary in their actual use. Since precise meteorological measurements and wind energy maps become more commonly effective developers can dependably estimate long-term economic analysis of wind farms. Wind turbines never work under perfect conditions in practice. This problem also makes real wind energy estimation difficult. Wind turbine parameters are much important in the performance monitoring of the turbine and also in prediction for wind power production. The capacity increase to make any improvements in wind turbines will also increase energy from wind. For this reason, wind turbine parameters are a significant ingredient for turbine performance monitoring, turbine control, and wind power forecasting [1].
Many efforts have been conducted by the researchers to determine wind turbine parameters [1,2,3,4,5,6,7,8,9,10,11,12,13,14,15,16,17,18,19,20,21,22,23,24,25,26,27,28,29,30,31,32,33,34,35,36,37,38]. There is a non-linear relationship between wind turbine parameters. Due to the non-linear relationship, artificial intelligence learning techniques are appropriate to apply in predicting wind turbine parameters. In recent years, the prediction of wind turbine aerodynamic parameters, such as turbine power output, power coefficient is a significant factor in monitoring wind turbine performance [2]. Precise prediction of turbine parameters, including the monitoring of turbine performance, is required for effective integration of wind power production into electric network systems. Realistic sizing of wind energy integration can be obtained from the wind turbine power characteristics curve [3,4]. Forecasting of wind power and the planning of wind farm expansion are able to the accurate computation of power characteristics curves [5,6]. The turbine performance specification and an indication of wind turbine service life can be deduced from the power characteristics curve. Generally speaking, theoretical wind turbine power characteristics curves are based on ideal meteorological and topographical conditions. In reality, however, the ideal conditions for wind power generation are never realized in practice. It is accepted that wind power is influenced by environmental factors. The location of turbines, air density, and the distribution of wind speed and wind direction can each significantly influence the power characteristics curve [3].
A number of methods and models have been mentioned in the literature for forecasting wind turbine performance parameters over the different duration of time and including a variety of physical models, statistical methods, hybrid physical‒statistical methods, artificial intelligence and neuro-fuzzy processing [7,8]. To optimize wind power systems new estimating methods are now being employed, including fuzzy logic (FL), artificial neural networks (ANN) and neuro-fuzzy logic (NF) [9,10,11]. The neuro-fuzzy system, referred to as an adaptive neuro-fuzzy inference system (ANFIS), has been offered by Jang [12]. Ruano [13] applied an ANFIS model in the identification of the non-linear components of a control system in the estimation of a chaotic time series. Liu et al. [14] introduced the prediction approach to wind speed by a combination of empirical mode decomposition (EMD) with ANN. An ANFIS model was established in a study conducted by Petkovic et al. [9] in which the prediction of the turbine power coefficient was possible in relation to two main turbine parameters. A hybrid EMD‒SVM model was built by Dang et al. [15] for the estimation of wind speed. Liu et al. [16] presented a hybrid forecasting method for wind speed with combining the wavelet transform (WT), the genetic algorithm (GA) and the support vector machine (SVM). Hou et al. [17] conducted short-term wind speed forecasting based on back-propagation (BP), WT and time series theory. Shamshirband et al. [18] analyzed three wind speed models and used them for the evaluation of these parameters in order to arrive at the most appropriate model. Liu et al. [19] investigated the decomposition and estimation performance considering different hybrid models such as fast ensemble empirical mode decomposition‒multilayer perceptron network (FEEMD-MLP) and FEEMD-ANFIS. Li et al. [20] estimated the shape and scale factors by the Weibull distribution function. The data of different capacity wind turbines in two locations in China were used to find the potential for wind power production. The power outputs and capacity factors were evaluated. Alimi et al. [31] examined wind speed features and wind power potential at the Gulf of Tunis in Tunisia. In his work, parameters were modeled by using Weibull probability function whose parameters were identified from four different methods such as the moment method, the cumulative probability method, the maximum likelihood method. The power density method investigated turbine parameters for the wind farm. Five horizontal axis wind turbines were chosen, and hub-height wind speed, power output and rotational speed measured from these turbines were used for assessment. In order to obtain parameters of the axial flow induction factor, power coefficient, thrust force coefficient, thrust force and tangential flow induction factor, Blade Element Momentum (BEM) theory was employed.
Najafian et al. [32] investigated the design parameters of a wind turbine. Design parameters were power coefficient, axial and angular induction factors, lift and drag coefficients on the blade, angle of attack and angle of the relative wind. His work showed that the wind speed variations have a major impact on turbine design parameters and power coefficient changes with wind speed, significantly. Pelletier et al. [33] developed wind turbine power curves using six important parameters. The parameters used in the model were derived from primary data, including air density, turbulence intensity, and wind shear. Bilgili et al. [34] studied on wind turbine parameters such as wind power (P), turbine power coefficient (CP), axial flow induction factor ( α ), rotational speed (Ω), tip speed ratio (λ), and thrust force (T) for the horizontal axis wind turbine (HAWT). The results were evaluated and discussed. Ciukaitis et al. [35] proposed a non-linear regression model for the power curve. Asghar [36,37] presented a new control algorithm based on adaptive neuro-fuzzy inference system (ANFIS) for turbine power coefficient as a function of tip-speed ratio and pitch angle. The artificial neural network (ANN) determines the parameters of fuzzy membership functions (MFs) using a hybrid optimization method. This study shows that ANFIS is appropriate to estimate the turbine power coefficient curve for instantaneous values of tip speed ratio (TSR) and pitch angle. Li and Shi [38] made a comparative study of three types of neural networks, the adaptive linear element, back-propagation, and the radial basis function, enabling prediction of hourly wind speed. They have confirmed that no single neural network model is superior to others in terms of its entire evaluation capability. The purpose of this work is to determine optimum wind turbine design parameters using two simple measurable meteorogical data (the hub-height wind speed and atmospheric temperature) from the geographical area where the wind farm is established. Thanks to two simple measurable meteorogical data, the cost of system measurements is decreased. The other contribution to literature is that the ANN-FA hybrid structure model is firstly used and also ANN coefficients are trained by FA to give a new approach in literature for wind turbine parameters’ estimation. This study will guide wind turbine manufacturers in the design of optimum wind turbines for wind farms to be installed in areas for geographical regions.
On account of limitations between existing literature, the aim of the present paper is the following:
  • To create a wind turbine characteristic model by using PSO and FA methods based on ANN and swarm as a hybrid model;
  • To examine firstly the ANN model, literately easy applicable and solutes to the problem fast and effectively, and forecast the parameters of the wind turbine in detail;
  • To use FA that is relatively successful method and recently recommended in the literature, with ANN;
  • To compare the PSO algorithm being a traditional method used with ANN;
  • To obtain the performance results in detail;
  • To reach wind turbine design and efficiency of the system at the optimum level.
As this paper primarily focuses on the aforesaid six aspects of optimum design for geographical features and optimum efficiency in the selection of the turbine to be used in the place where the wind farm will be established.

2. Materials and Methods

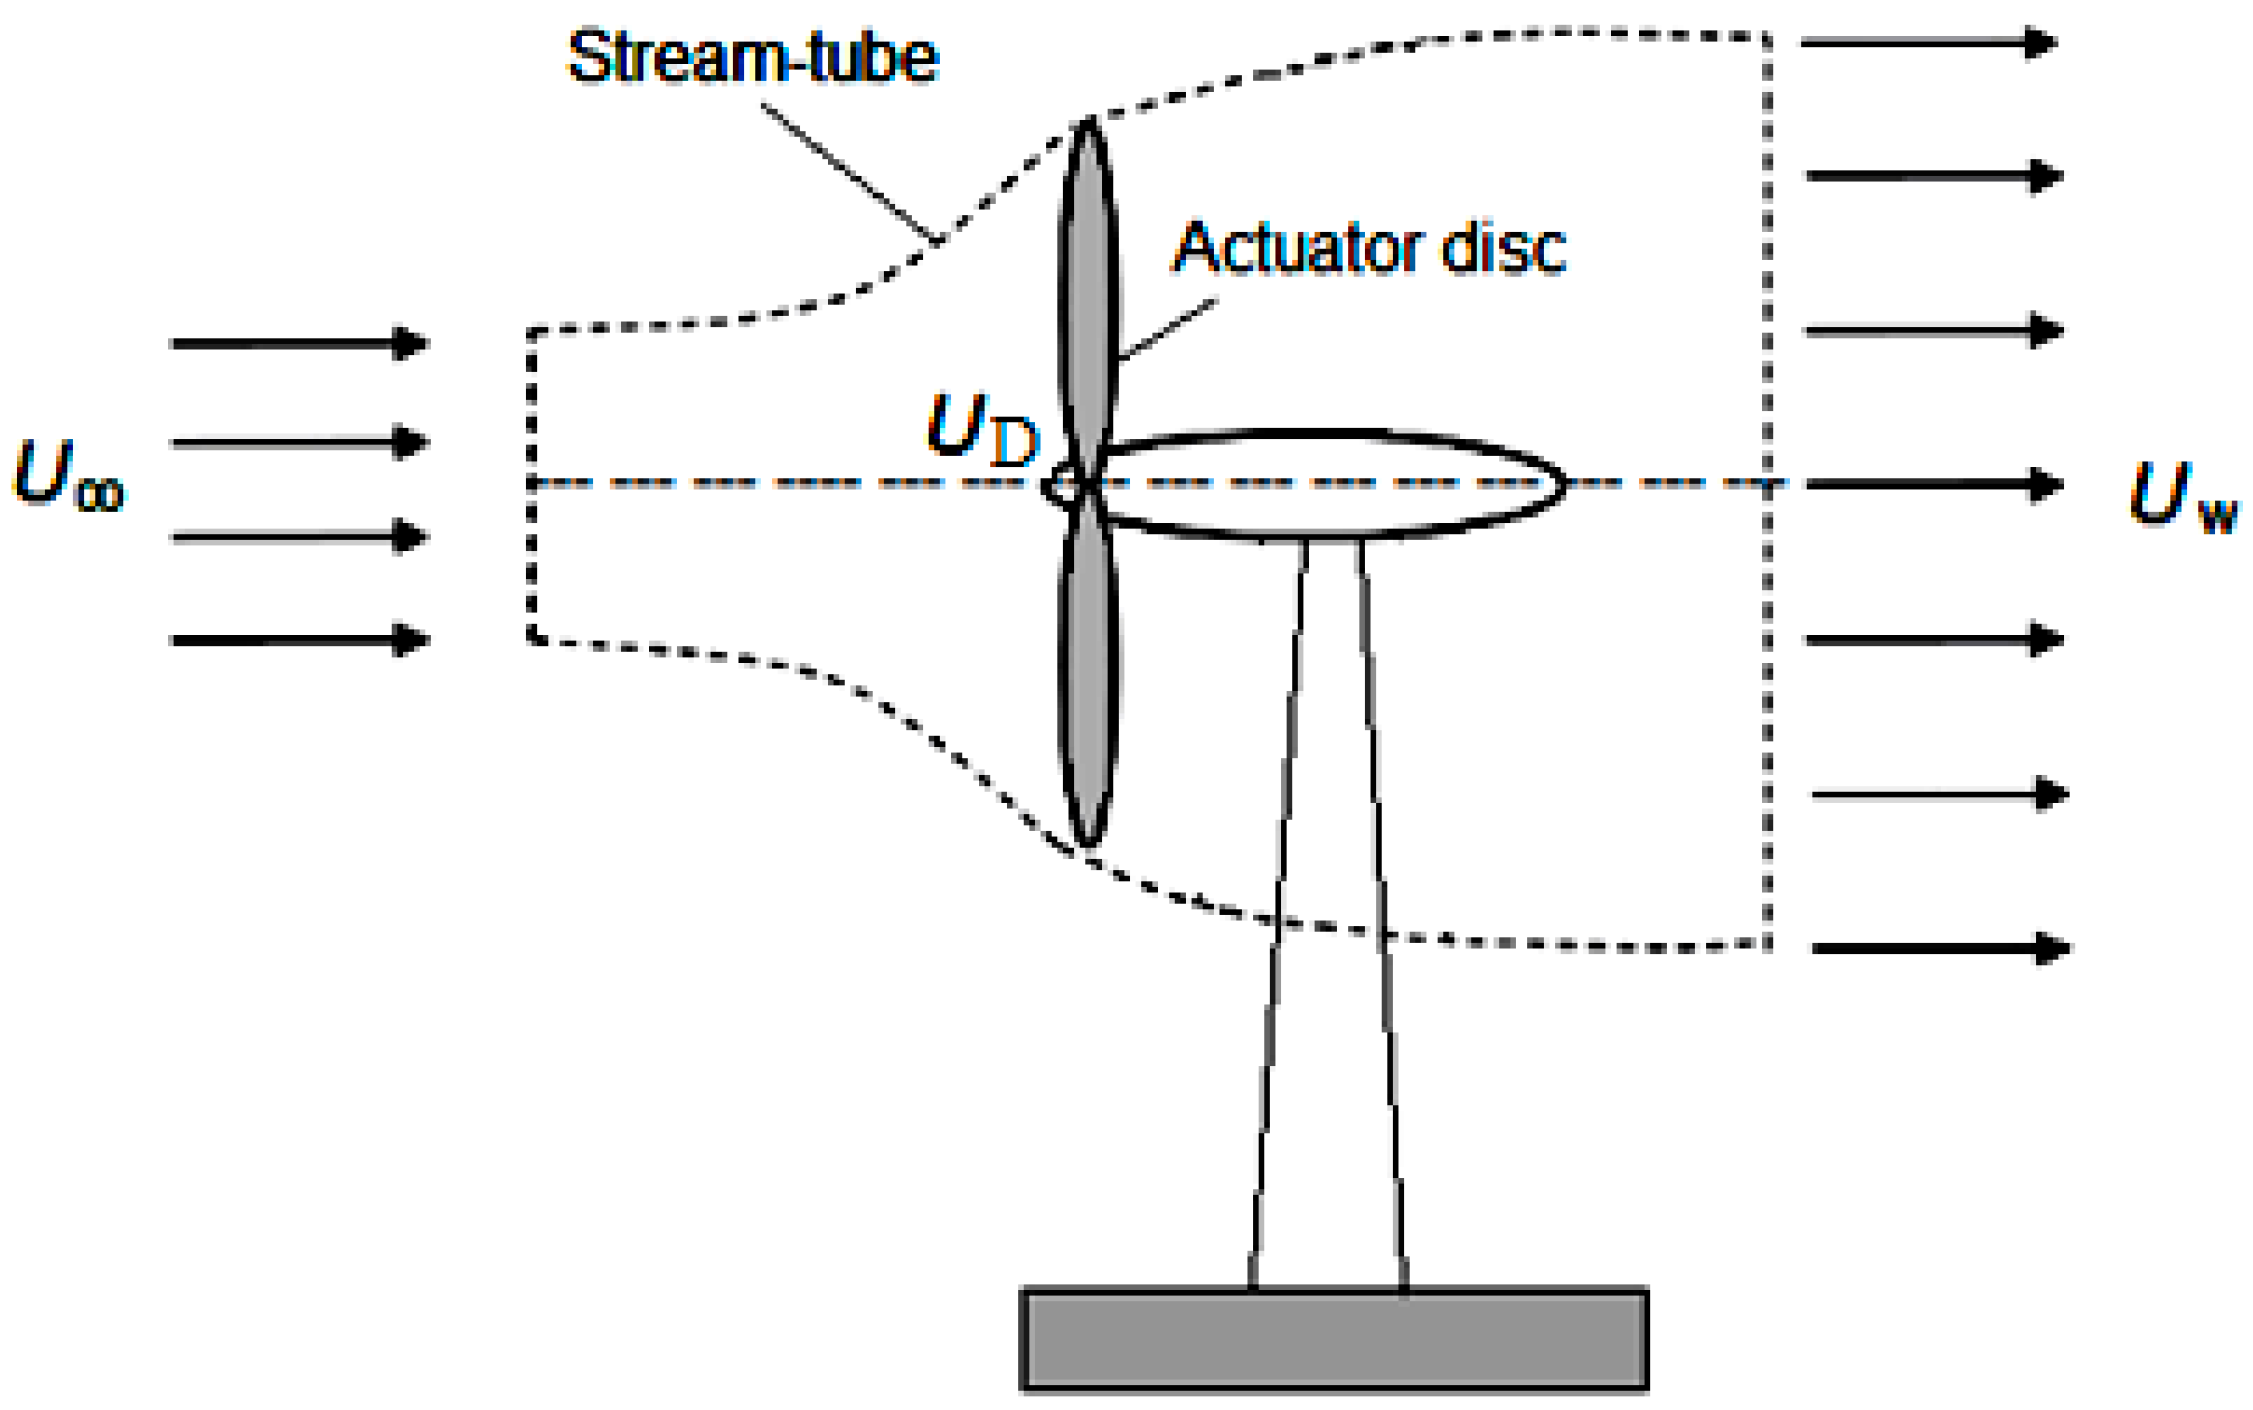
2.1. Wind Turbine Characteristics

Figure 1 shows an actuator disc and stream-tube for the wind turbine. Surface and two cross-sections of stream tube are given as the boundaries of control volume in the analysis of considered control volume. Uniform “actuator disc” represents the turbine and creates a pressure discontinuity on the air flowing through the stream tube. During steady-state flow, the conservation of mass principle can be expressed as:
m i n = m o u t
ρ A U = ρ A D U D = ρ A W U W
The power out, P, is equal to the thrust times the velocity at the disk:
P = 1 2 ρ A 2 ( U 2 U W 2 ) V 2 = 1 2 ρ A 2 U D ( U + U W ) ( U U W )
Substituting for U D and U W gives
P = 1 2 ρ A U 3 4 a ( 1 a ) 2
where the control volume area at the rotor, A 2 , is placed with A, the rotor area, and the free stream velocity U is replaced by U .
While denotations of ρ for density, A for the cross-sectional area and U for flow velocity are used in equations; subscripts of “ ”, “D” and “W” symbols refer to far upstream, disc and far wake conditions, respectively. Induction of velocity variation by the actuator disc that is superimposed on the free-stream velocity is shown by Equation (5) where U D stands for net stream-wise velocity [34]:
U D = U ( 1 α )
Velocity at far fake ( U W ) dependent on the free-stream velocity ( U ) and the velocity induction factor, a superimposed on the free-stream velocity is given as:
U W = U ( 1 2 α )
The general form of turbine power coefficient ( C P ) and its simplified form are defined as;
C P = P 0.5 ρ U 3 A D = R o t o r   p o w e r P o w e r   i n   t h e   w i n d
where P (kW) is the wind turbine power output. Thrust force (T), thrust force coefficient ( C T ) and blade tip speed ratio (λ) are defined by Equations (8)–(10), respectively.
T = 2 ρ A D U 3 α ( 1 α )
C T = T / ( 0.5 ρ U 2 A D )
λ = R Ω / U
where Ω is the rotational speed, and R is radius of rotor disc.

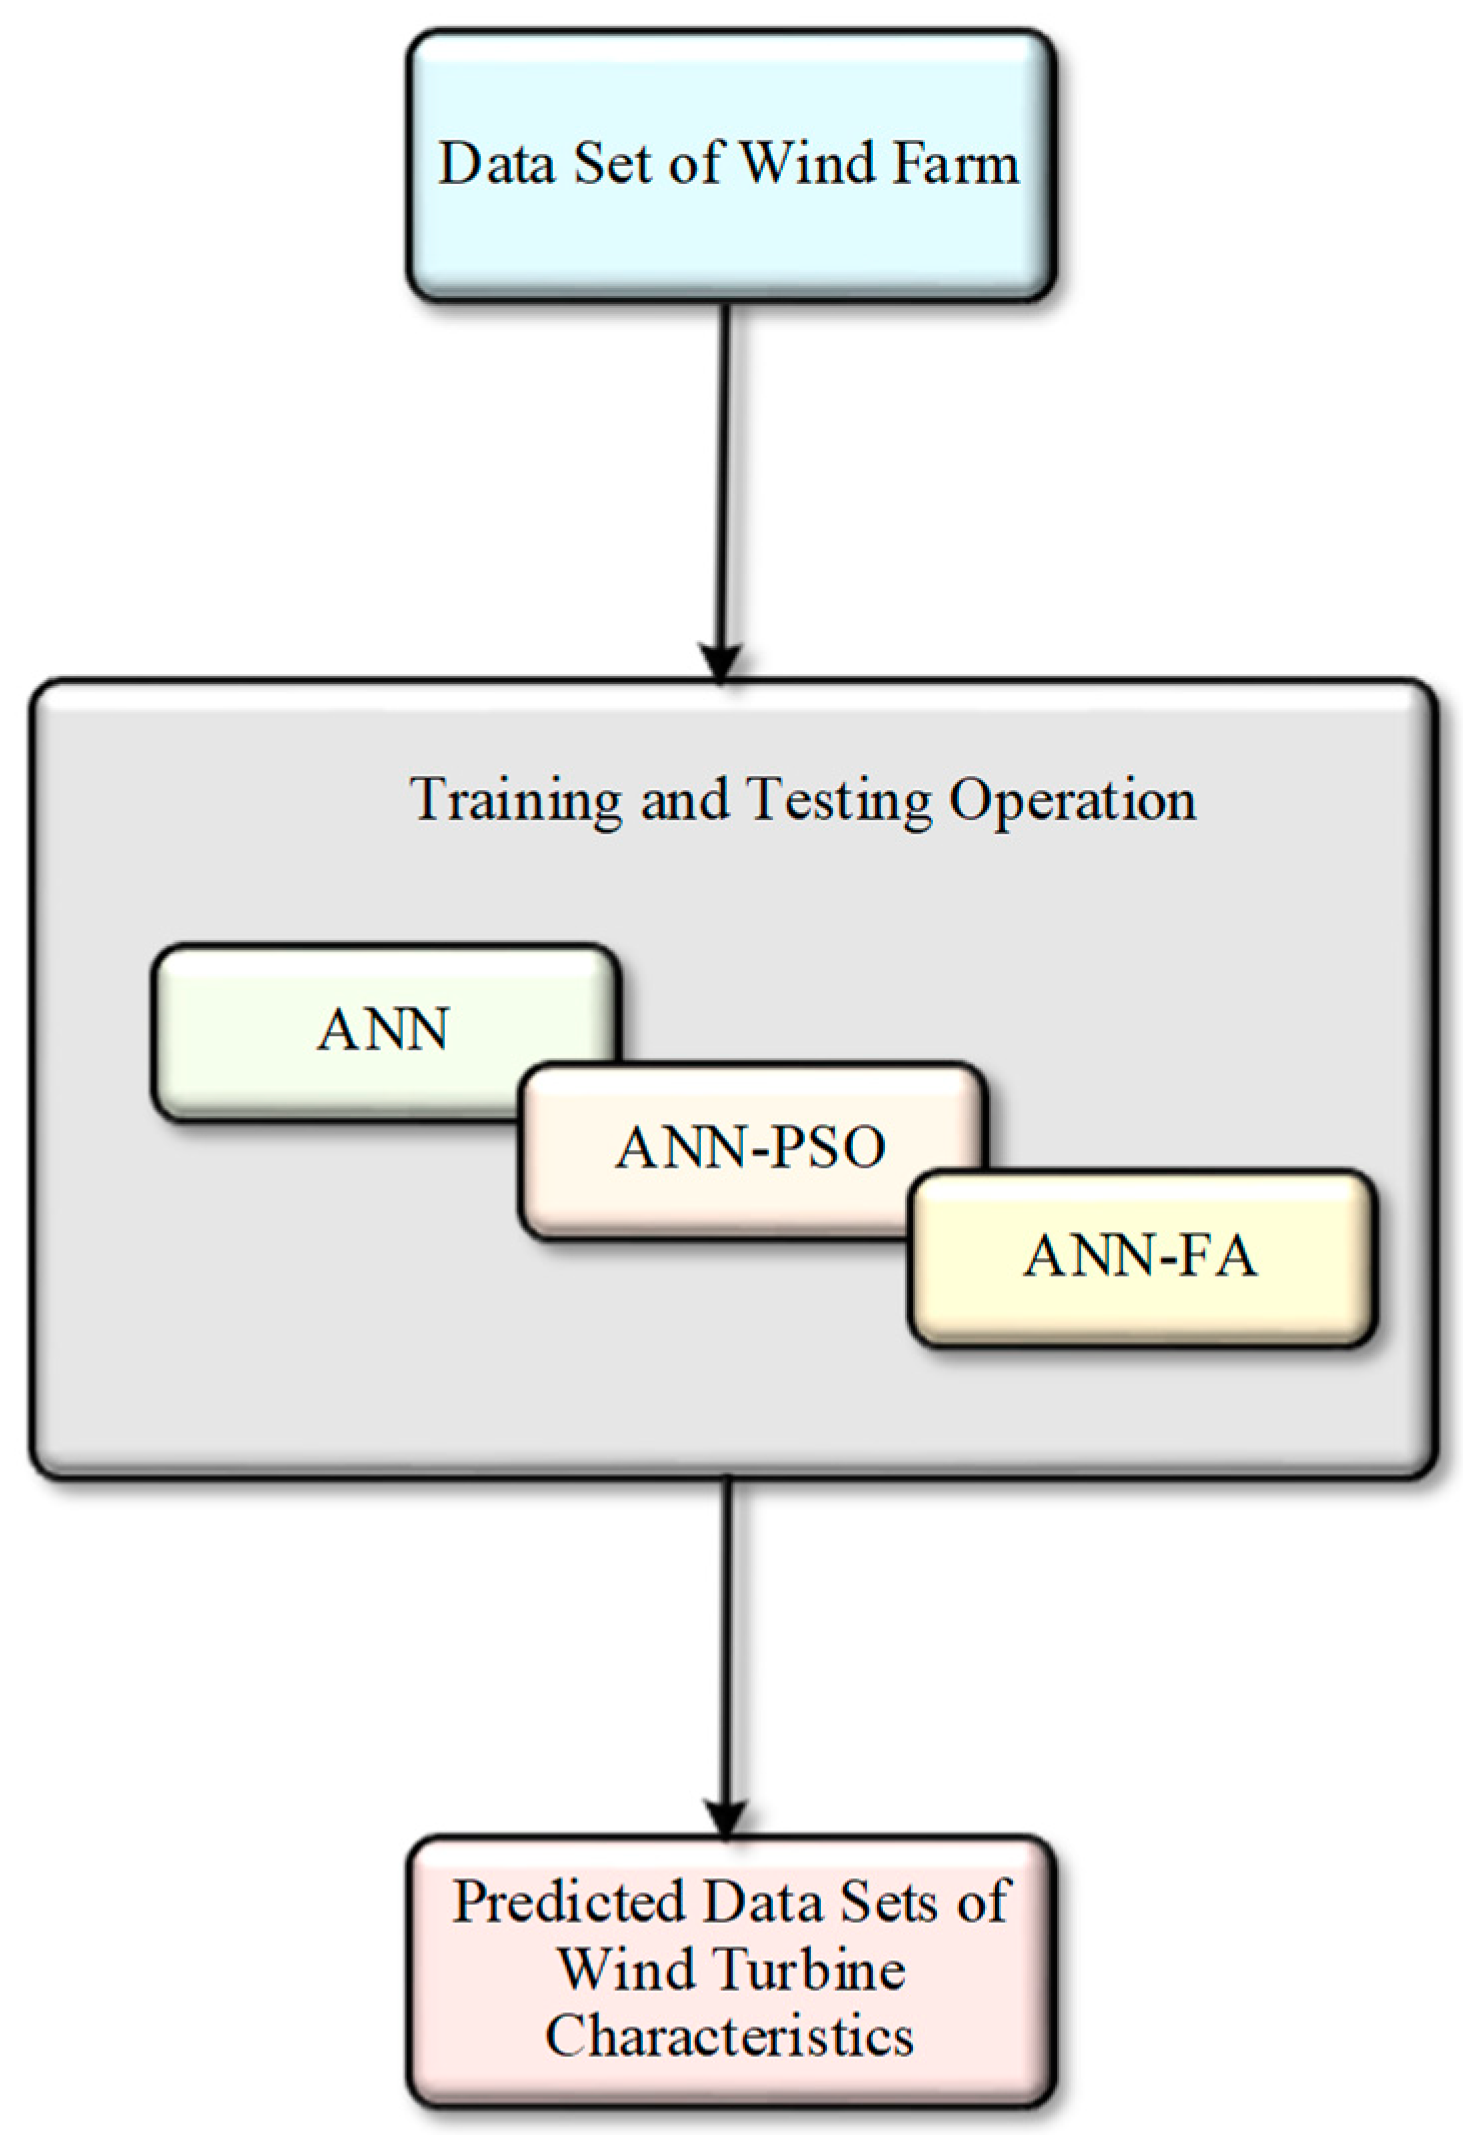
2.2. The Proposed Prediction Models

ANN structure and swarm-based optimization methods are used together in the present study. In the literature, there are many studies including in the hybrid structure of the PSO algorithms and the ANN structures [39,40,41,42,43]. When these studies are reviewed, it is seen that the quality of the network structure is increased by using hybrid structures.
A novel approach is developed in order to obtain the best results for this study. Firefly algorithm recently recommended as a new swarm method is used in the network training phase. According to literature, it is seen that the FA algorithm is used in many different areas [44,45,46]. This algorithm is firstly applied to estimate the wind turbine parameters in the present study. The methods are summarized in Figure 2. Approaches developed with every learning algorithm are implemented in MATLAB. Firstly, the data set is tested and then executed. Results depending on 4 different performance criteria; these are Mean Absolute Error (MAE), Root Mean Square Error (RMSE), Mean Absolute Percentage Error (MAPE) and Theil’s Inequality Coefficient (TIC).

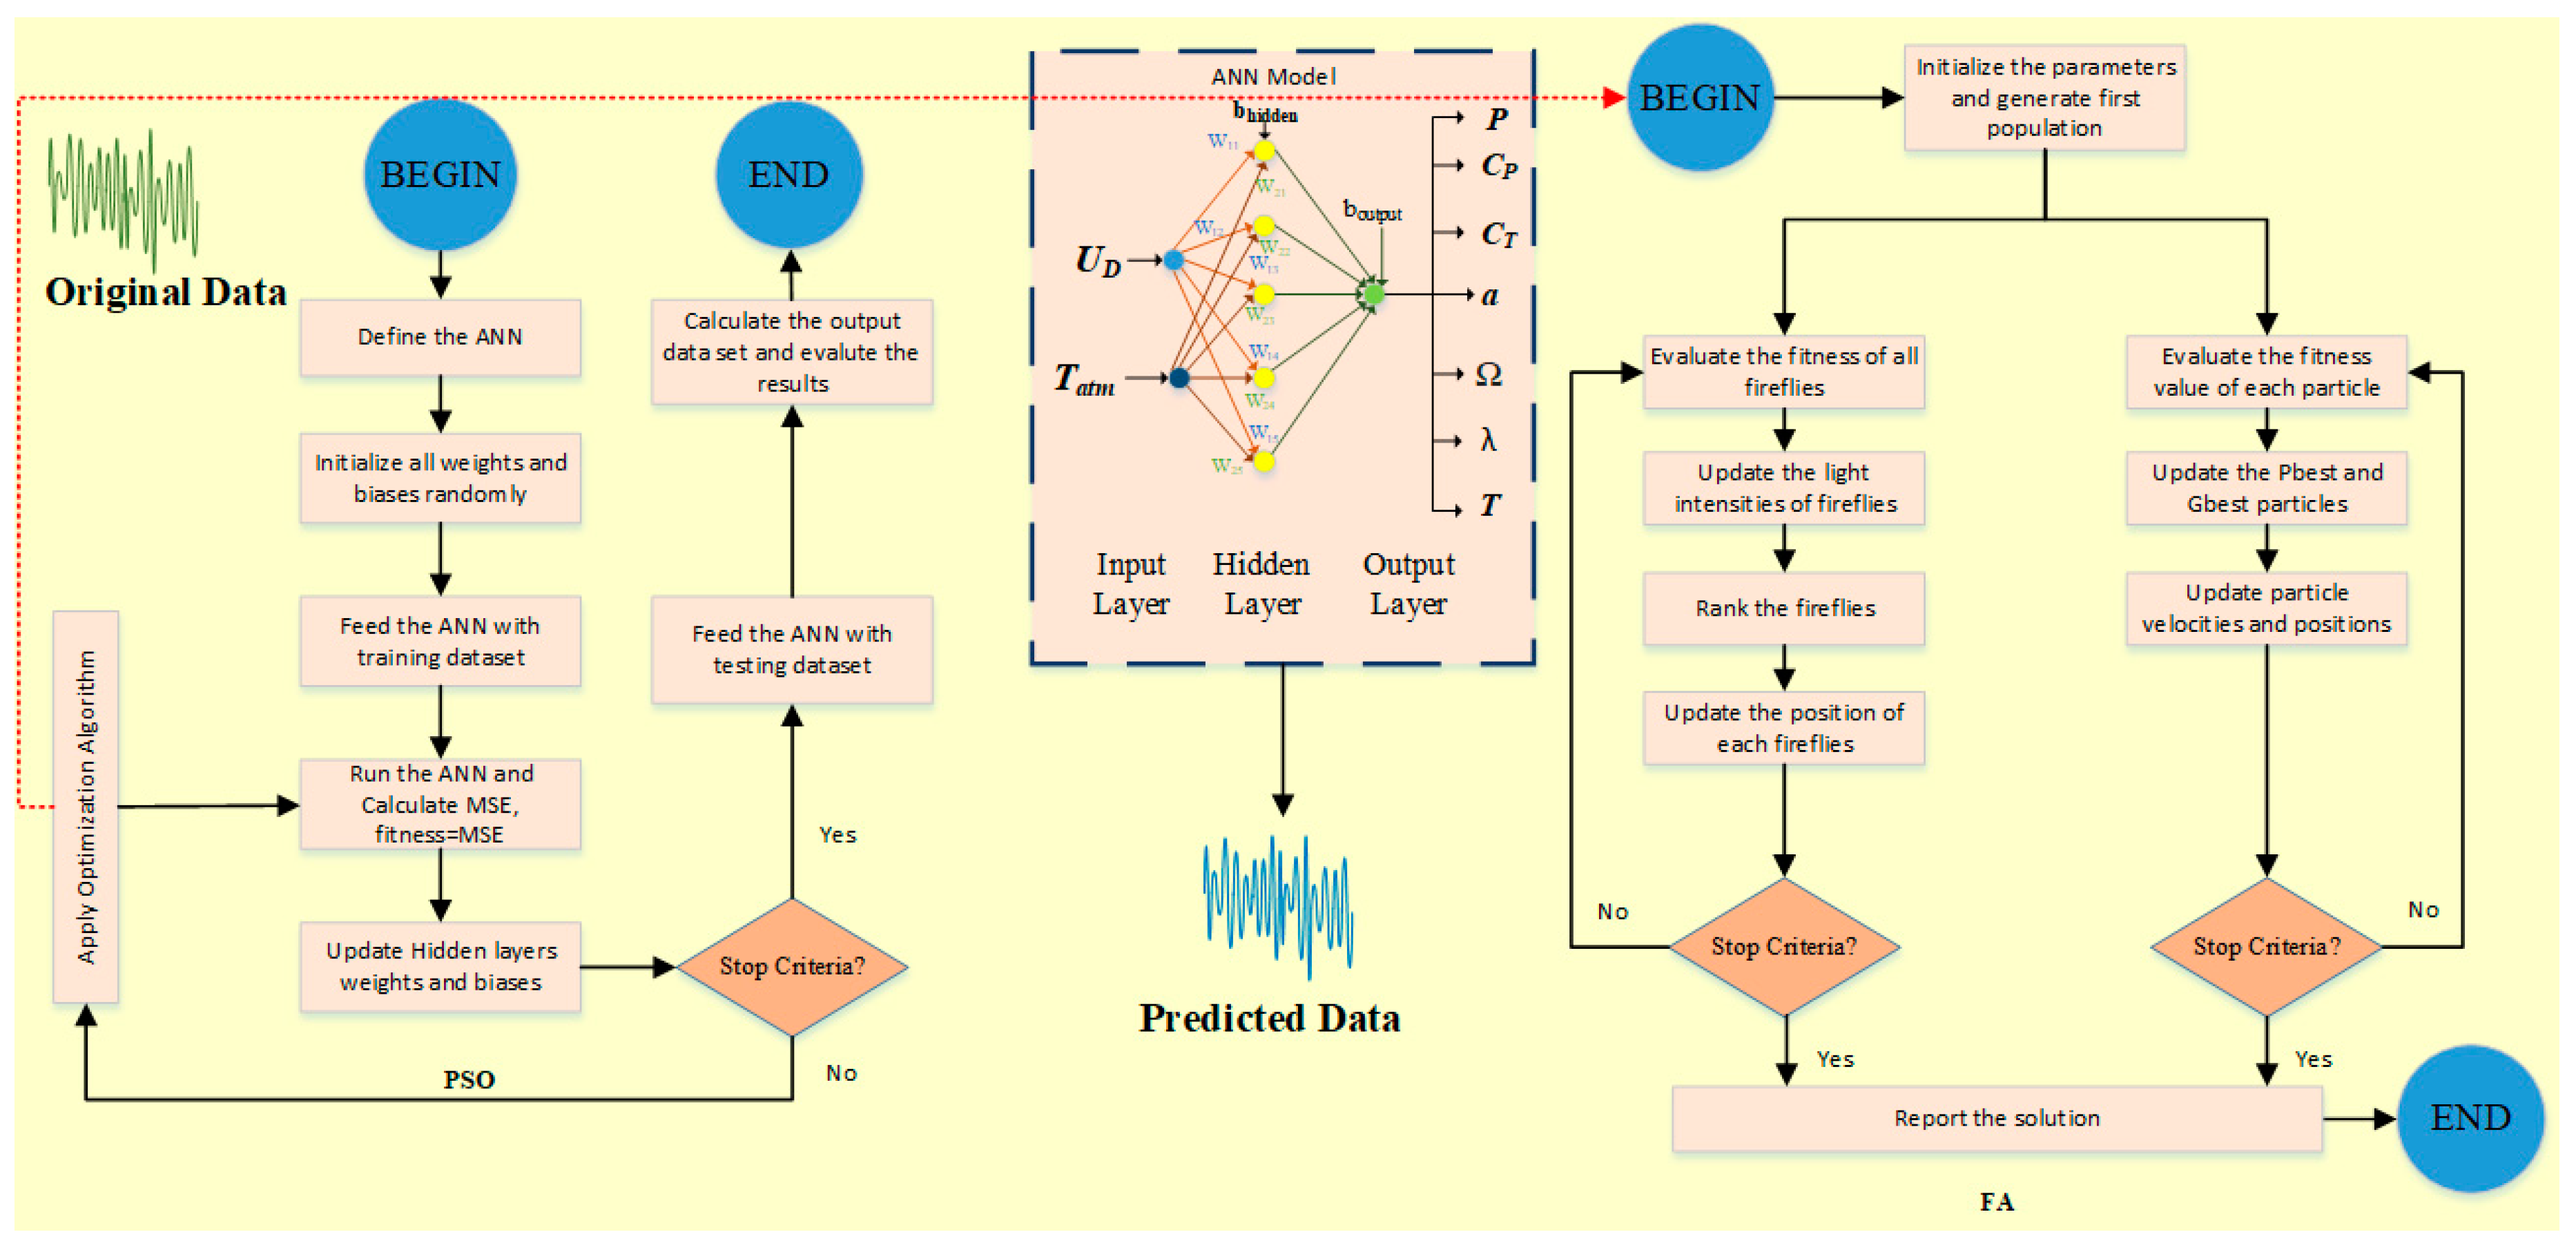
2.2.1. The Artificial Neural Networks (ANNs)

Artificial neural networks are approaches that try to create new systems by imitating the process of the human brain. The ANN which is based on nerve cell structure has a decision making mechanism according to learned knowledge. Like the human brain mechanism, ANN is generated by coming together of artificial nerve cells. In the ANN nerve model, every nerve cell sums up weighted inputs. These summations are passed from an activation function and it gives outputs. Moreover, nerve cells have a threshold value. It provides to decrease or increase the total value at the activation function input. Using the threshold provides flexibility at the network structure [1]. Network training is the process of identification of the weighted values of nerve element connections at the ANN. Initially, these values are determined randomly. Then, network parameters are updated in order to get the best yield at the network.
Network training is made by data sets completely known input and output values. Inıtially, network parameters are randomly assigned and network parameters are approximated to the optimum value for every iteration. Once the convergence of the learning method is occurred, the determined ANN weights are used for the estimation process. Multilayer feed-forward (MLFF) network structure which is an ANN network are used in this study. This network structure comprises 3 layers; an input layer, a hidden layer, and an output layer. The neuron number at the input and output layer depends on the problem structure. Output data connected parameters obtained by the network are given to the network as an input. The neuron number at the hidden layer is determined by the trial and error method. Every layer includes the neuron as suitable to network structure and each neuron link to another neuron located in the next layer. The network structure and parameters used in the study are shown in Figure 3 in detail.
If the weight coefficient between the i th and j th neurons is W i j and the threshold coefficient is b i , the output value of the i th neuron x i (output signal of the neuron) is calculated by this means:
φ i = j = 1 n w i j x j + b i
where φ i is the potential of the i th neuron. φ i value is obtained by passing from transfer function so the output value of the related neuron is achieved:
x i = f ( φ i )
where f ( φ i ) is the transfer function. Transfer functions of MLFF networks are selected as nonlinear functions, therefore, learning of nonlinear relations between the input data given to the network and output data intended from the network is provided.
MSE (mean square error) criteria is used as an objective function which is essential for the training of the network. Methods used during the network’s training update the network parameters in order to minimize the difference between results obtained at the real-time setting from the turbine ( X d e s i r e d ) and output results obtained by the neural network ( X a c t u a l ). MSE criteria are calculated in this way:
M S E = 1 n i = 1 n ( X d e s i r e d X a c t u a l ) 2
where X d e s i r e d is the data obtained from the neural network, X a c t u a l is the real-time data, and n is the data number at the data set. The aim of using training methods is to minimize the MSE value. Training of the neural network parameters is made by using different learning methods. In this study, network training is fulfilled by using the ANN and swarm-based meta-heuristic models.

2.2.2. Particular Swarm Optimization (PSO)

Particle Swarm Optimization (PSO) algorithms have global searching characteristics and are developed by being inspired herd of births behaviors. It is a population-based stochastic optimization technique [40]. This method proposed by Eberhart and Kennedy [40] is used with the ANN at the different areas so it is successfully practiced in many areas [41,42,43]. The most important difference between the PSO and other classical methods is that the PSO doesn’t need to derivative information. Compared to other meta-heuristic algorithms, the PSO is relatively easy in terms of its algorithm realization and being low adjustable parameter number.
PSO algorithm starts to work with a population consisting of randomly distributed solutions to the solution space. It updates to particle locations by using the best solution of the. It also uses the best solution of each particle at that moment. Thus, the PSO algorithm walks around the search space. Equations providing of particles’ motions are given;
v i ( t + 1 ) = w × v i ( t ) + c 1 × r 1 × ( p i b e s t x i ( t ) ) + c 2 × r 2 × ( g b e s t x i ( t ) )
x i ( t + 1 ) = x i ( t ) + v i ( t + 1 )
Equation (14) provides to particles’ speed update and Equation (15) provides to move of the particles in the search space according to updated speed value, respectively. Equations (14) and (15) are by this means: w is the inertia weight, t is iteration number and i is the index of the corresponding particle, respectively. x i demonstrates the location of the particle. c 1 and c 2 are acceleration coefficients chosen in [0, 2] interval. r 1 and r 2 values are random numbers which are selected in [0, 1] interval balance between local best and global best.

2.2.3. Firefly Algorithm (FA)

Firefly algorithm (FA) [39] is a flock based optimization algorithm being inspired glow-worms’ behaviors which provide to the communication of each other and the continuation of their life in nature. FA algorithm is used in many areas because it uses fewer parameters during the operation and adapted to problems easily and algorithm steps are understandable. FA algorithm’s operation logic has three disciplines:
  • All fireflies are unisex;
  • The degree of attraction of each firefly is depended on the degree of brightness of it;
  • The brightness of each firefly is being connected to the fitness function decided by the structure of the problem.
There are two significant parameters at the operation step of the FA method. These parameters are light intensity and attractiveness ( β ). The attractiveness of the firefly can be changed to distance from one to another firefly. Due to this, the distance between the two fireflies is firstly known. x i x i and x j values are supposed to a location of the ith and jth fireflies, the distance between the two fireflies is calculated by this means:
r i j = x i x j
As is known to distance between the two fireflies, the attractiveness of the firefly ( β ) is calculated by this means:
β ( r ) = β 0 e γ r 2
where β 0 is the maximum attractiveness parameter at r = 0 and γ is light-emitting coefficient, respectively. The fireflies at the search space move to more attractive fireflies. Movement from ith firefly to jth firefly is given at the below equation:
x i = x i + β 0 e γ r i j 2 ( x j x i ) + α ( r n d 1 2 )
r n d is a random real number and selected as [ 0 , 1 ] and α is a random selection parameter, respectively.

2.2.4. Performance Criteria

For the purpose of comparison between training models of the ANN, Mean Absolute Error (MAE), Root Mean Square Error (RMSE), Mean Absolute Percentage Error (MAPE) and Theil’s inequality coefficient (TIC) are used to see the convergence between actual and estimated values. Here, MAE, RMSE, MAPE, and TIC are defined as follows:
M A E = 1 n i = 1 n | X d e s i r e d X a c t u a l |
R M S E = 1 n i = 1 n ( X d e s i r e d X a c t u a l ) 2
M A P E = 1 n i = 1 n | X d e s i r e d X a c t u a l X a c t u a l |
T I C = 1 n i = 1 n ( X d e s i r e d X a c t u a l ) 2 1 n i = 1 n ( X d e s i r e d ) 2 + 1 n i = 1 n ( X a c t u a l ) 2
where n is the data number used in the data set. X d e s i r e d is obtained from the real-time result and X a c t u a l is a result predicted by the neural network.

3. Results and Discussion

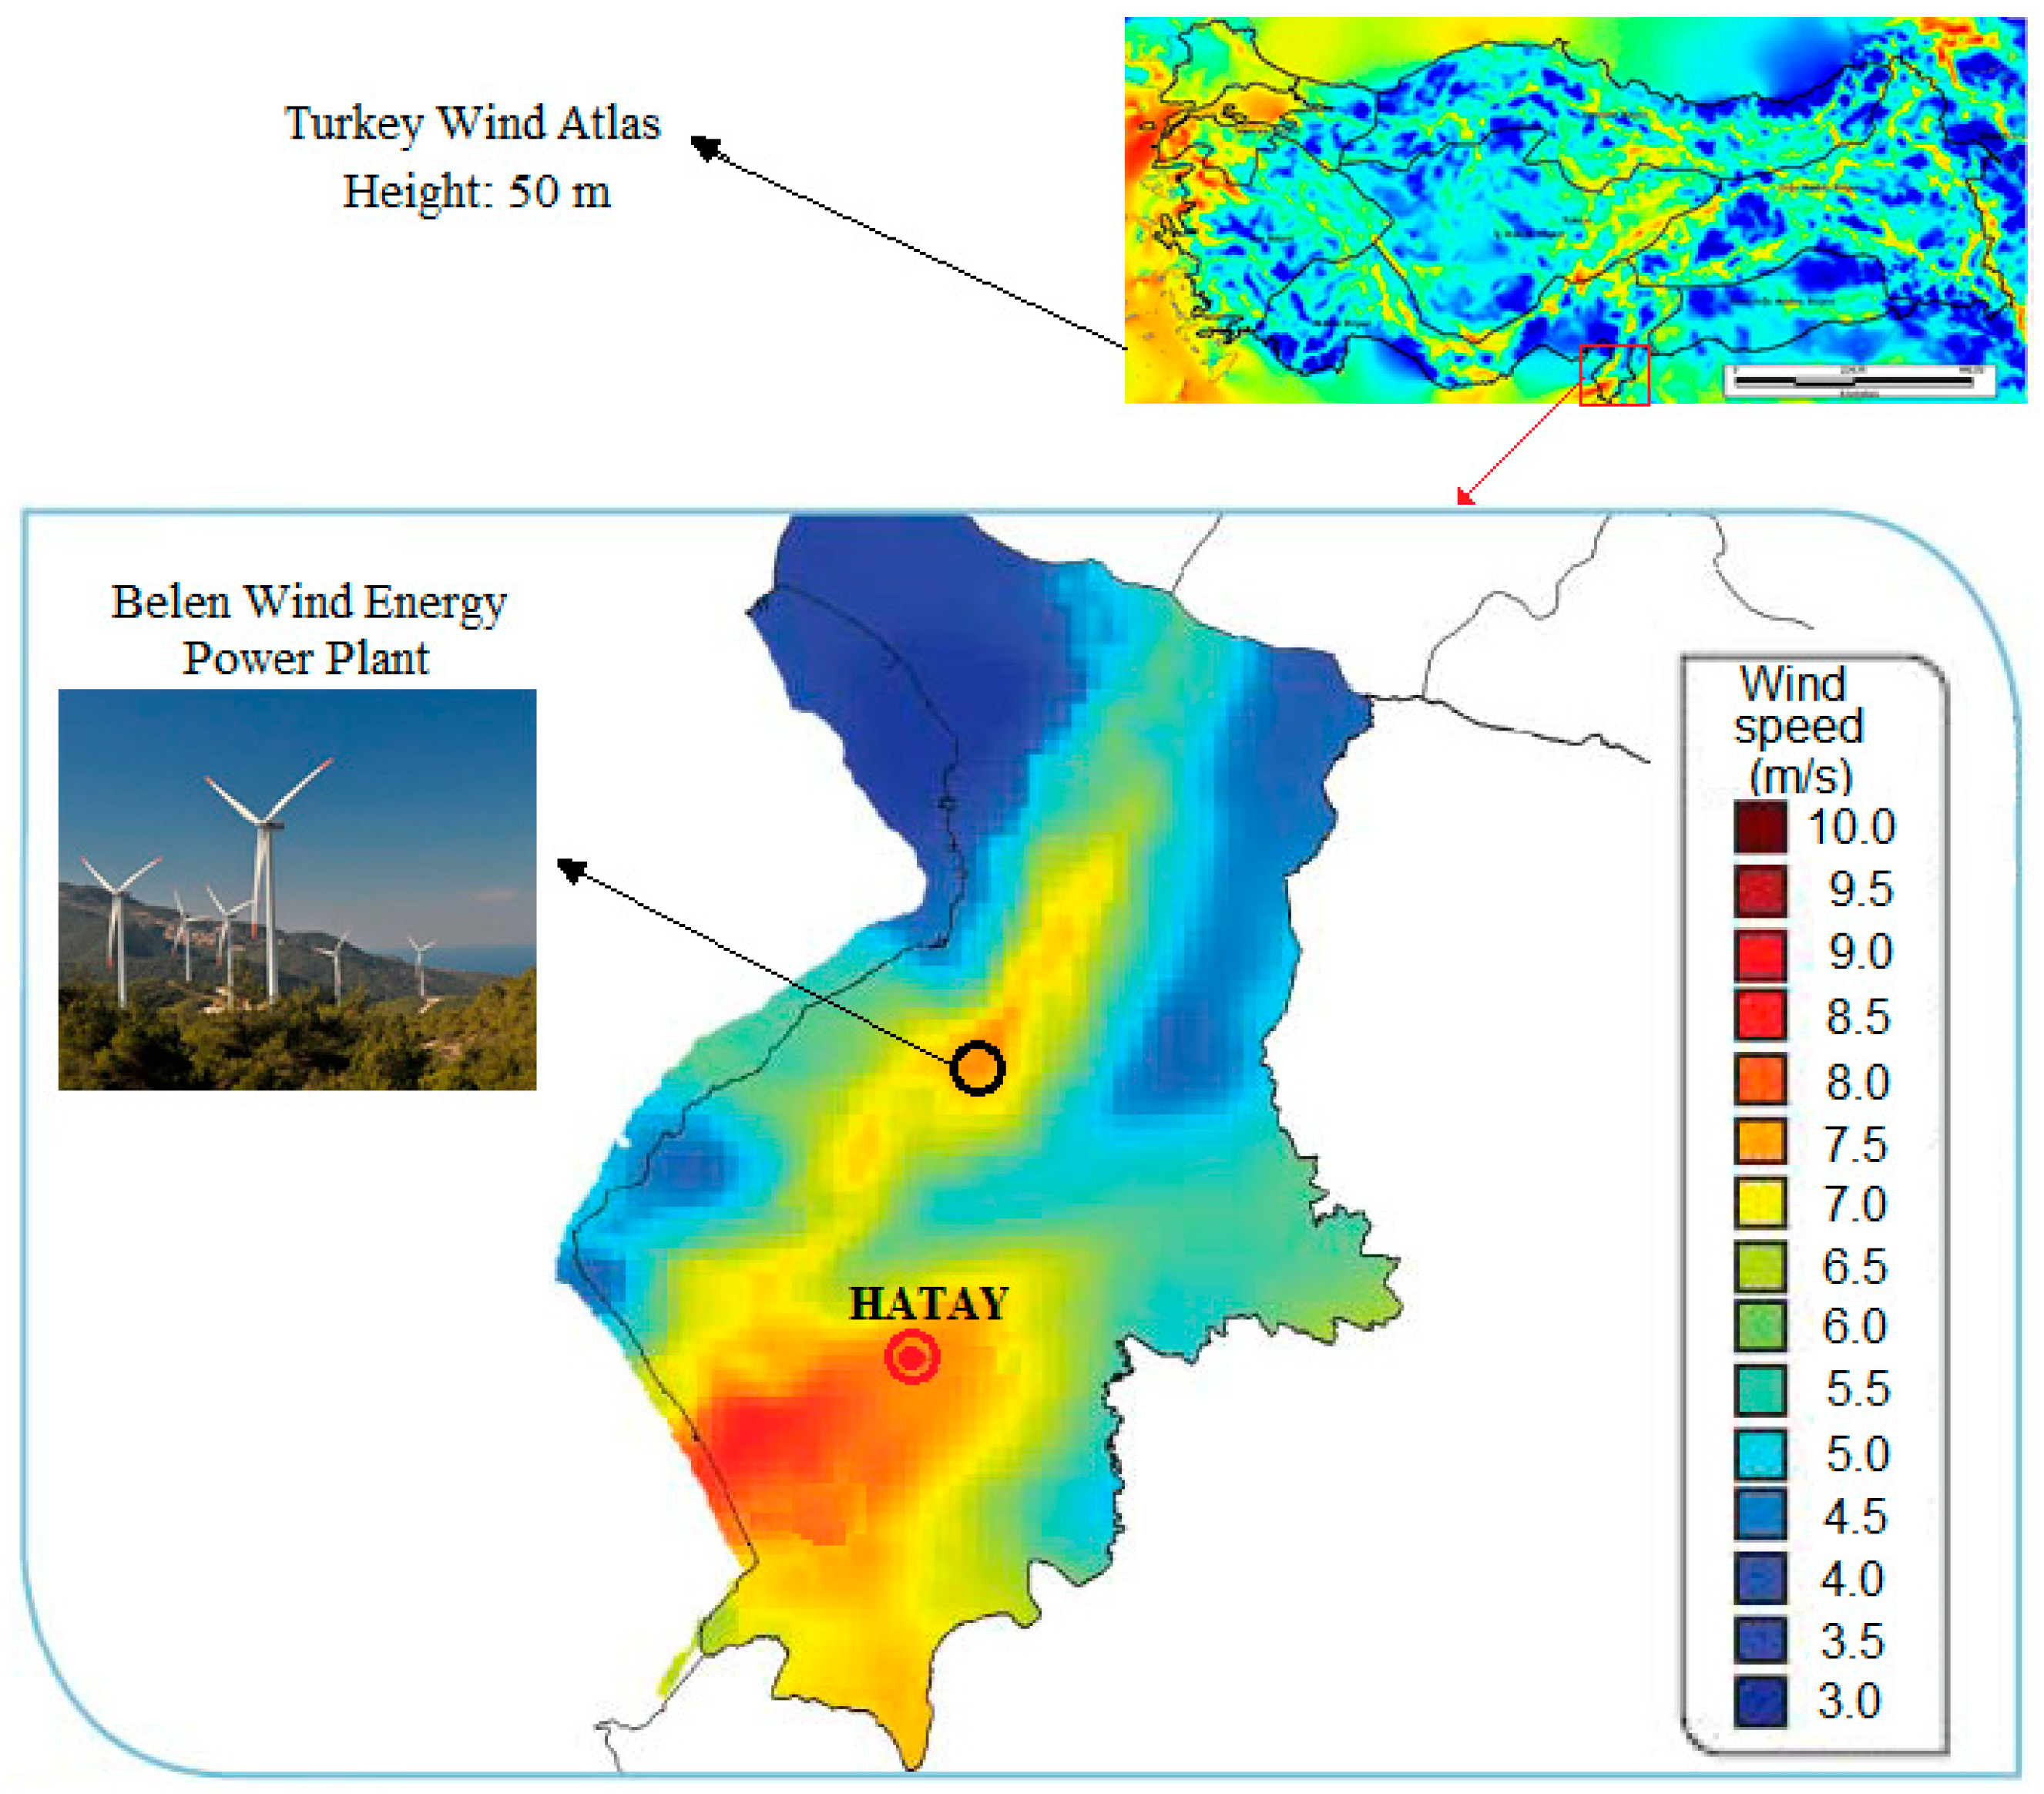
3.1. The Properties of Geographical Region and Turbine Parameters

The data used in this study are obtained from Belen Wind Energy Power Plant (WEPP) installed in Hatay, Mediterranean region of Turkey as shown in Figure 4. With an installed capacity of 48 MW, this WEPP is Turkey’s 46. major power plant. At this WEPP, 16 Vestas V90-3 MW wind turbines operate, and average electricity of 116 GWh per year is generated. First, five wind turbines (T1, T2, T3, T4, and T5) with 3 MW power are selected from this WEPP. Hub-height of the identical wind turbines is 80 m, and the rotor diameter corresponds to 90 m. Consequently, the total swept area of a single wind turbine is approximately 6362 m2. The wind turbines operate with wind speeds within the range of 4 ≤ U   ≤ 25 m/s and nominal speed of turbines corresponds to 15 m/s. Wind turbines are the pitch regulated upwind turbines with active yaw and a three-bladed rotor. The technical properties of wind turbines are given in Table 1.
In July 2016, hub-height wind speed ( U D , m/s), atmospheric air temperature ( T a t m , ° C ), turbine rotational speed (Ω, rpm) and turbine power output (P, kW) data were measured at intervals of one hour from each wind turbine. The wind turbine parameters of the selected turbines such as axial flow induction factor ( α ), wind turbine power coefficient ( C P ), thrust force coefficient ( C T ), thrust force (T, kN) and tip speed ratio (λ) are calculated using these measured atmospheric temperature and wind speed. Turbine power output, turbine rotational speed, axial flow induction factor, turbine power coefficient, thrust force coefficient, thrust force, and blade tip ratio parameters are used in the output layer of the network. For the development of forecasting models, the total 3682 data records are collected in the T1, T2, T3, T4 and T5 turbines. The data set is divided into two subsets such as training and testing data set. The training data set includes in a total of 2942 data recorded from the T1, T2, T3 and T4 turbines. The testing data set consists of 740 data records obtained from the T5 turbine.

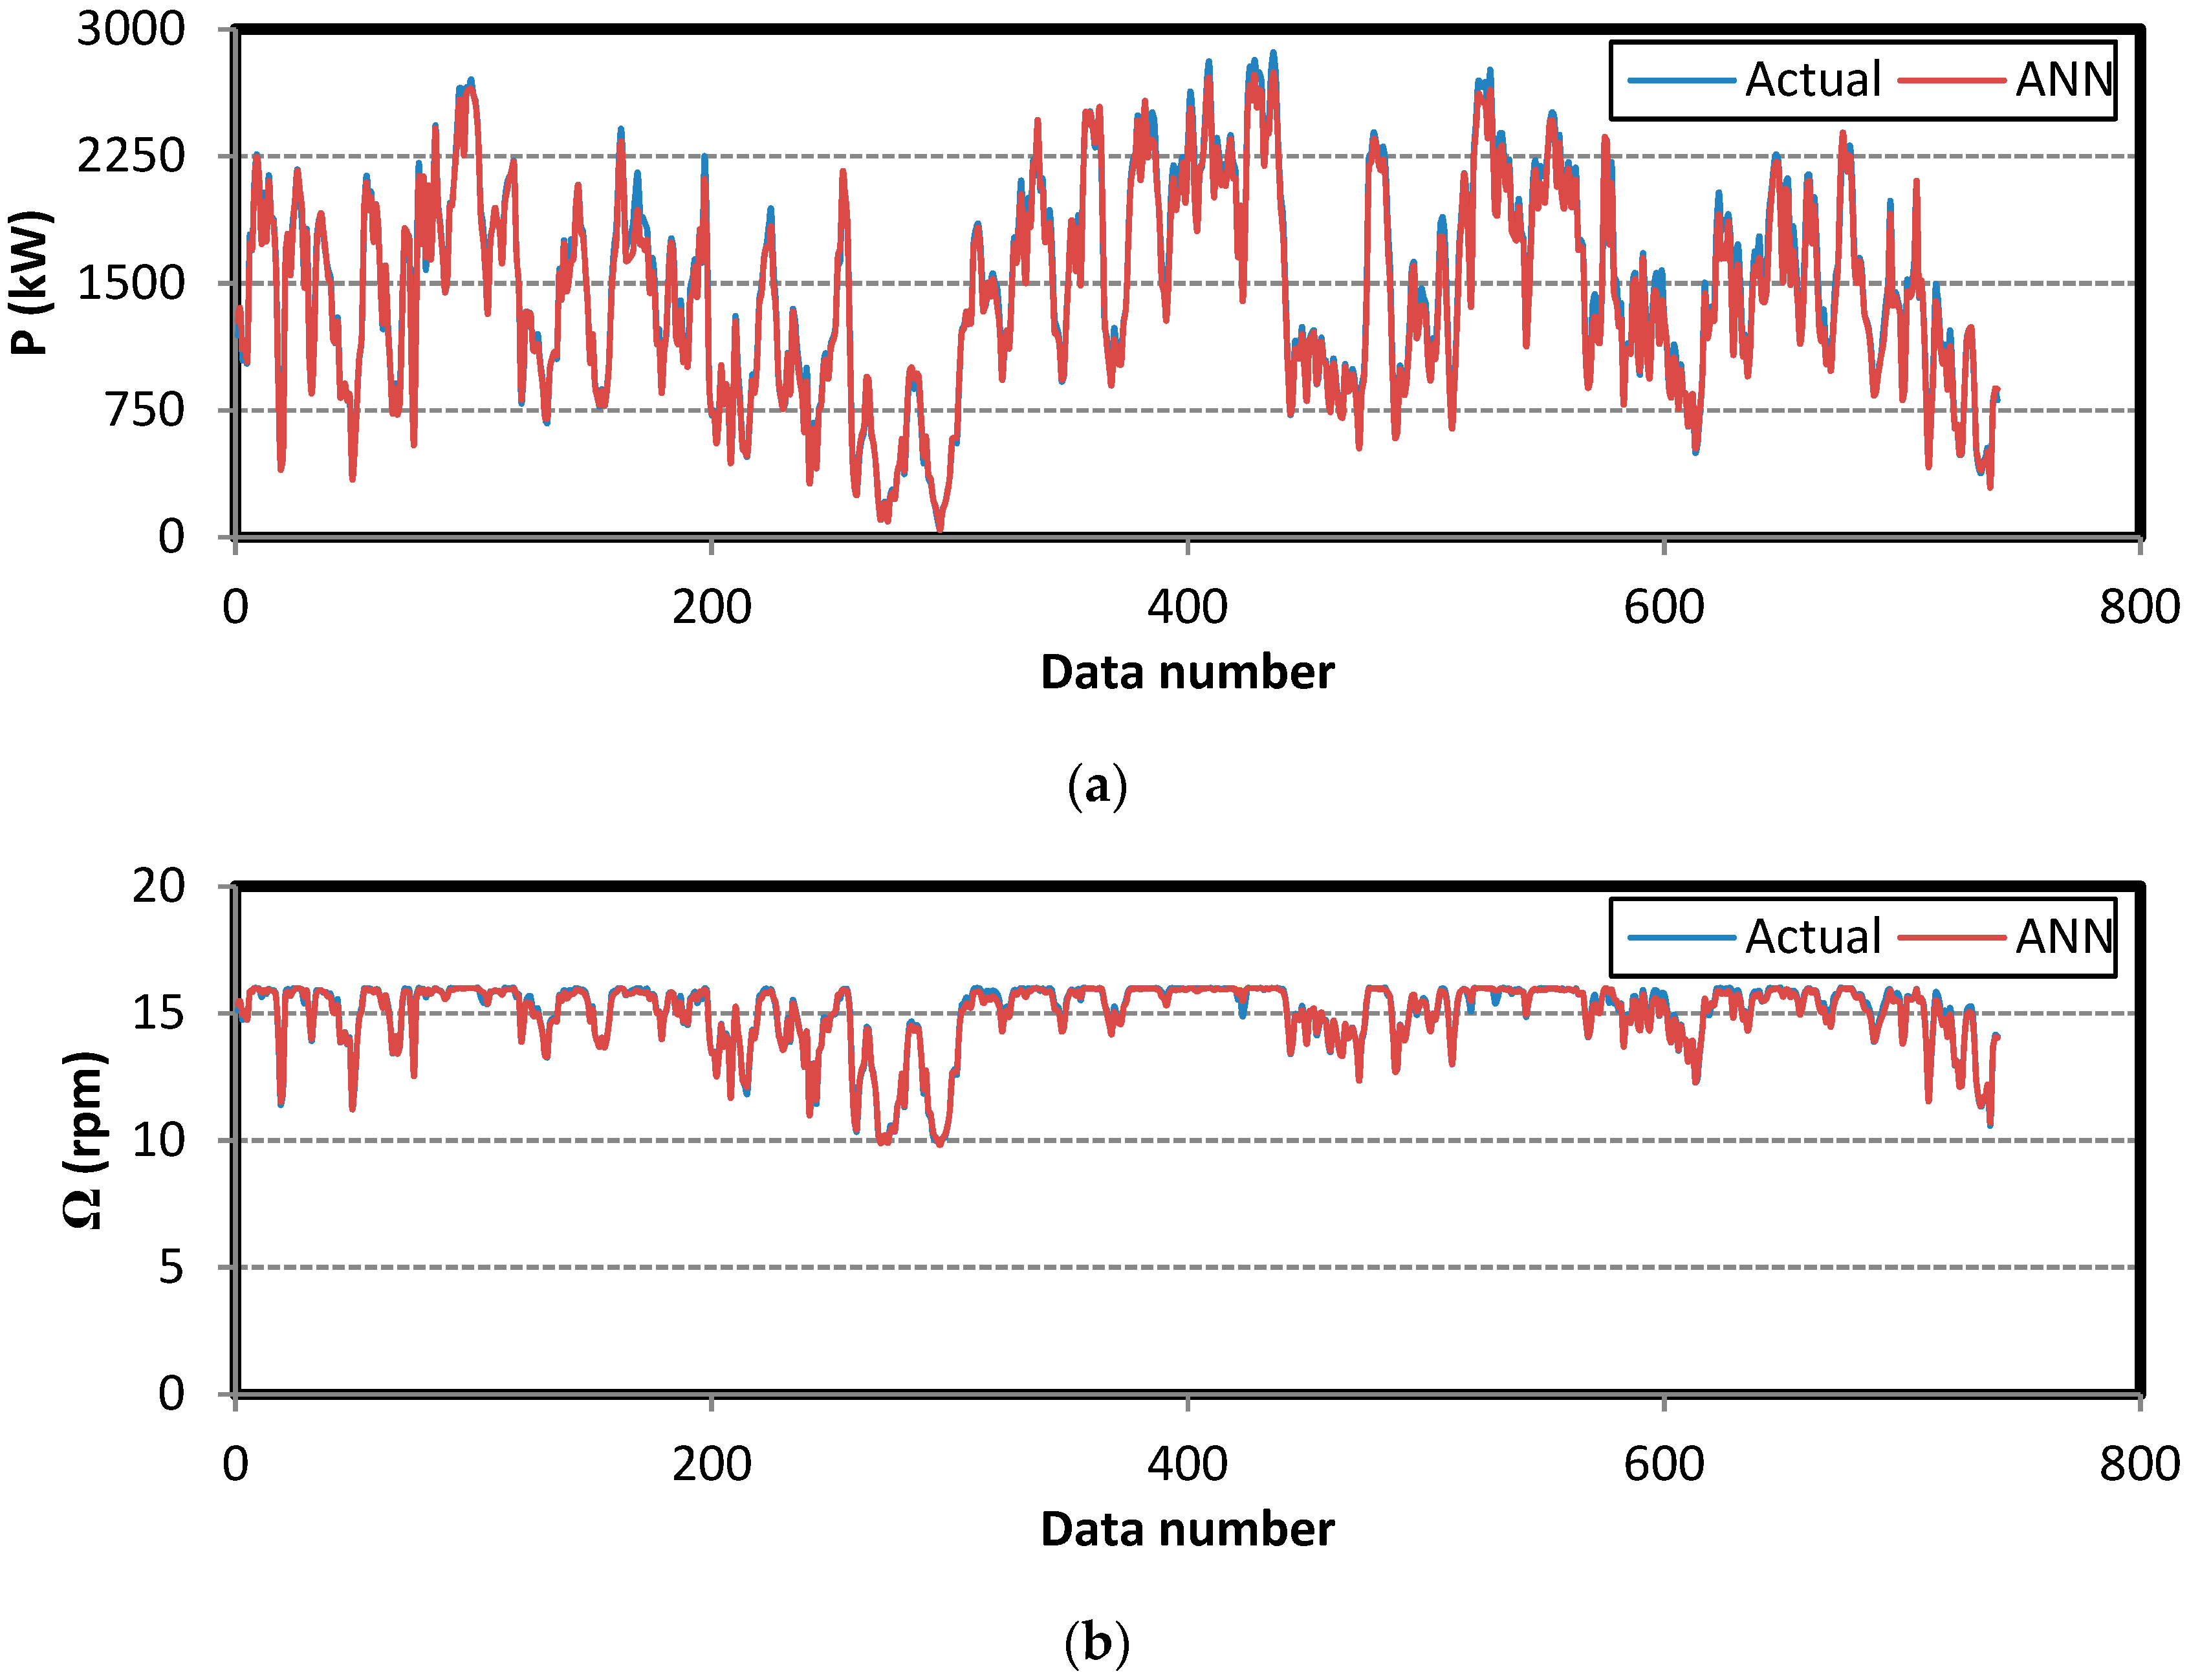
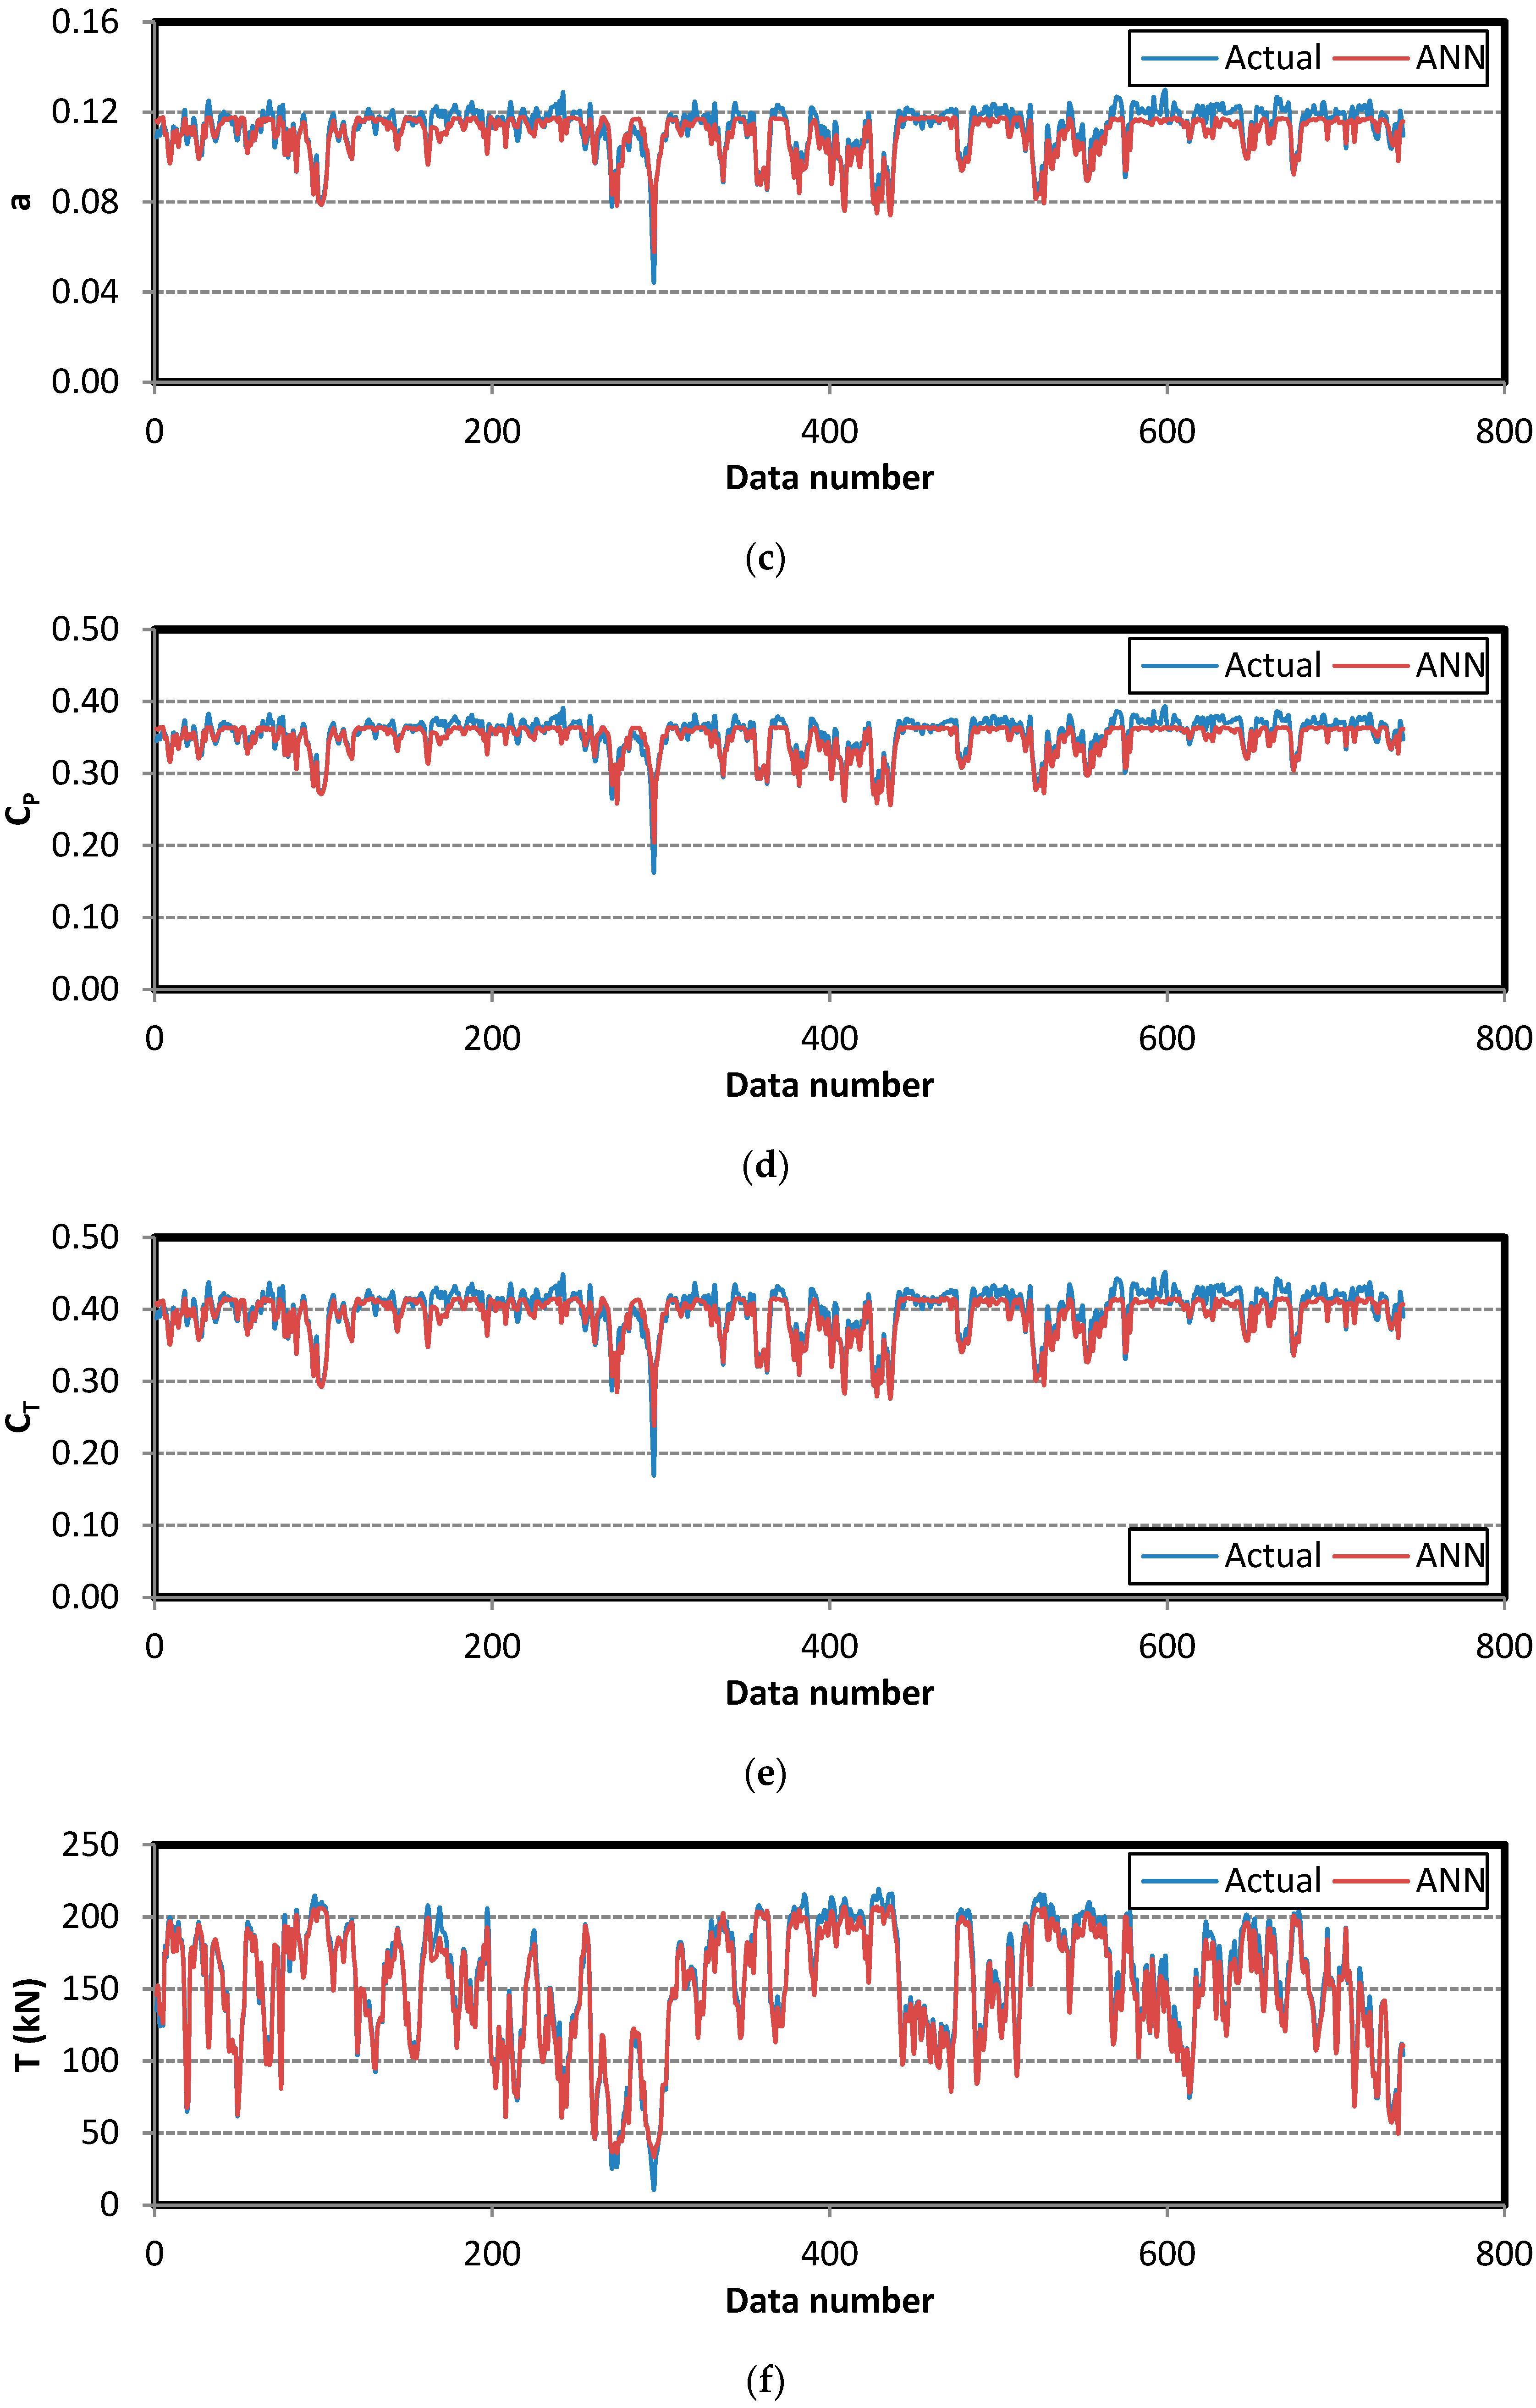
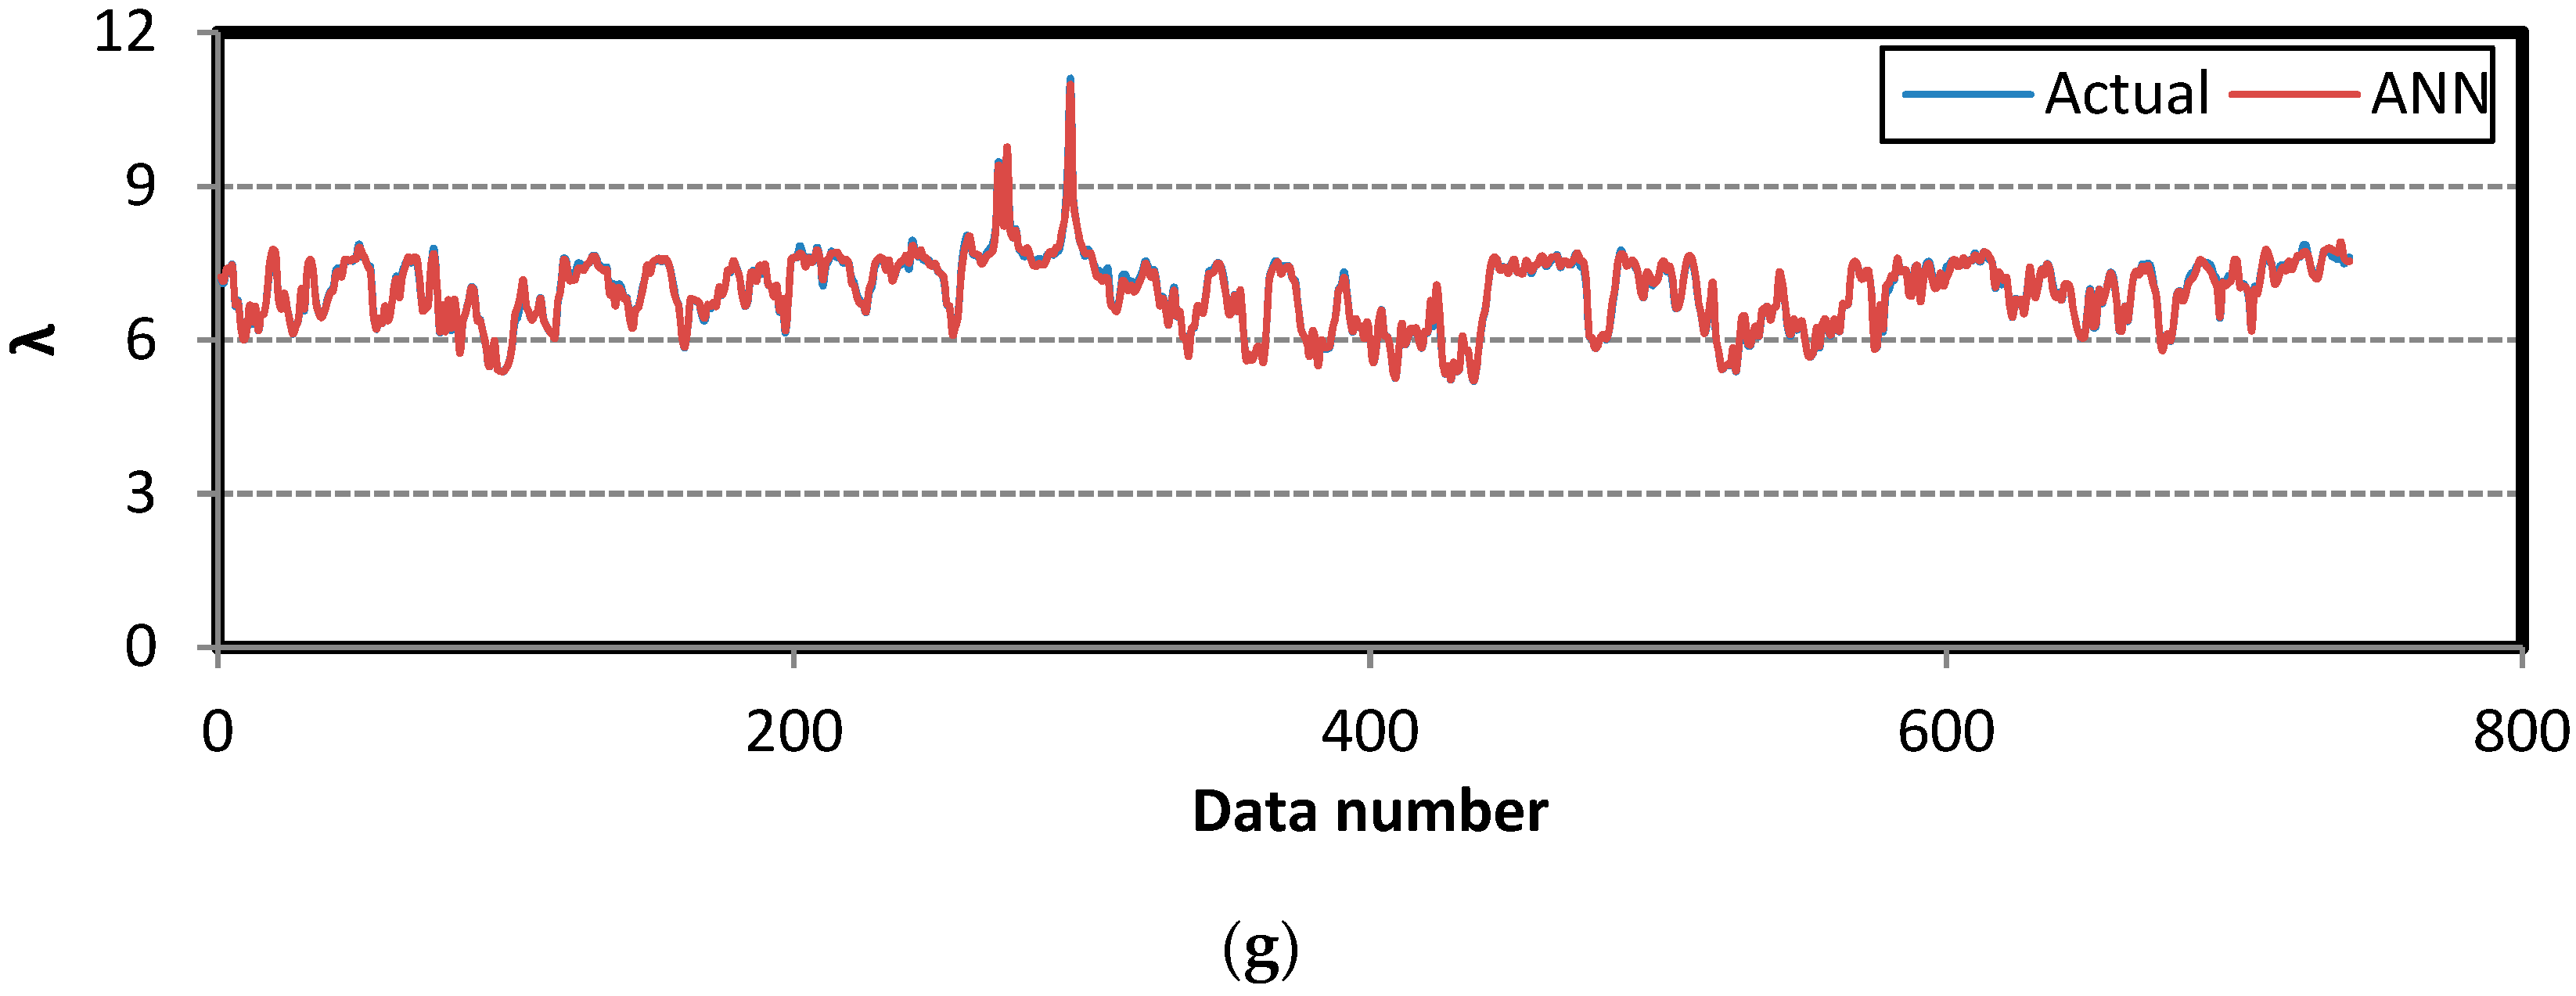
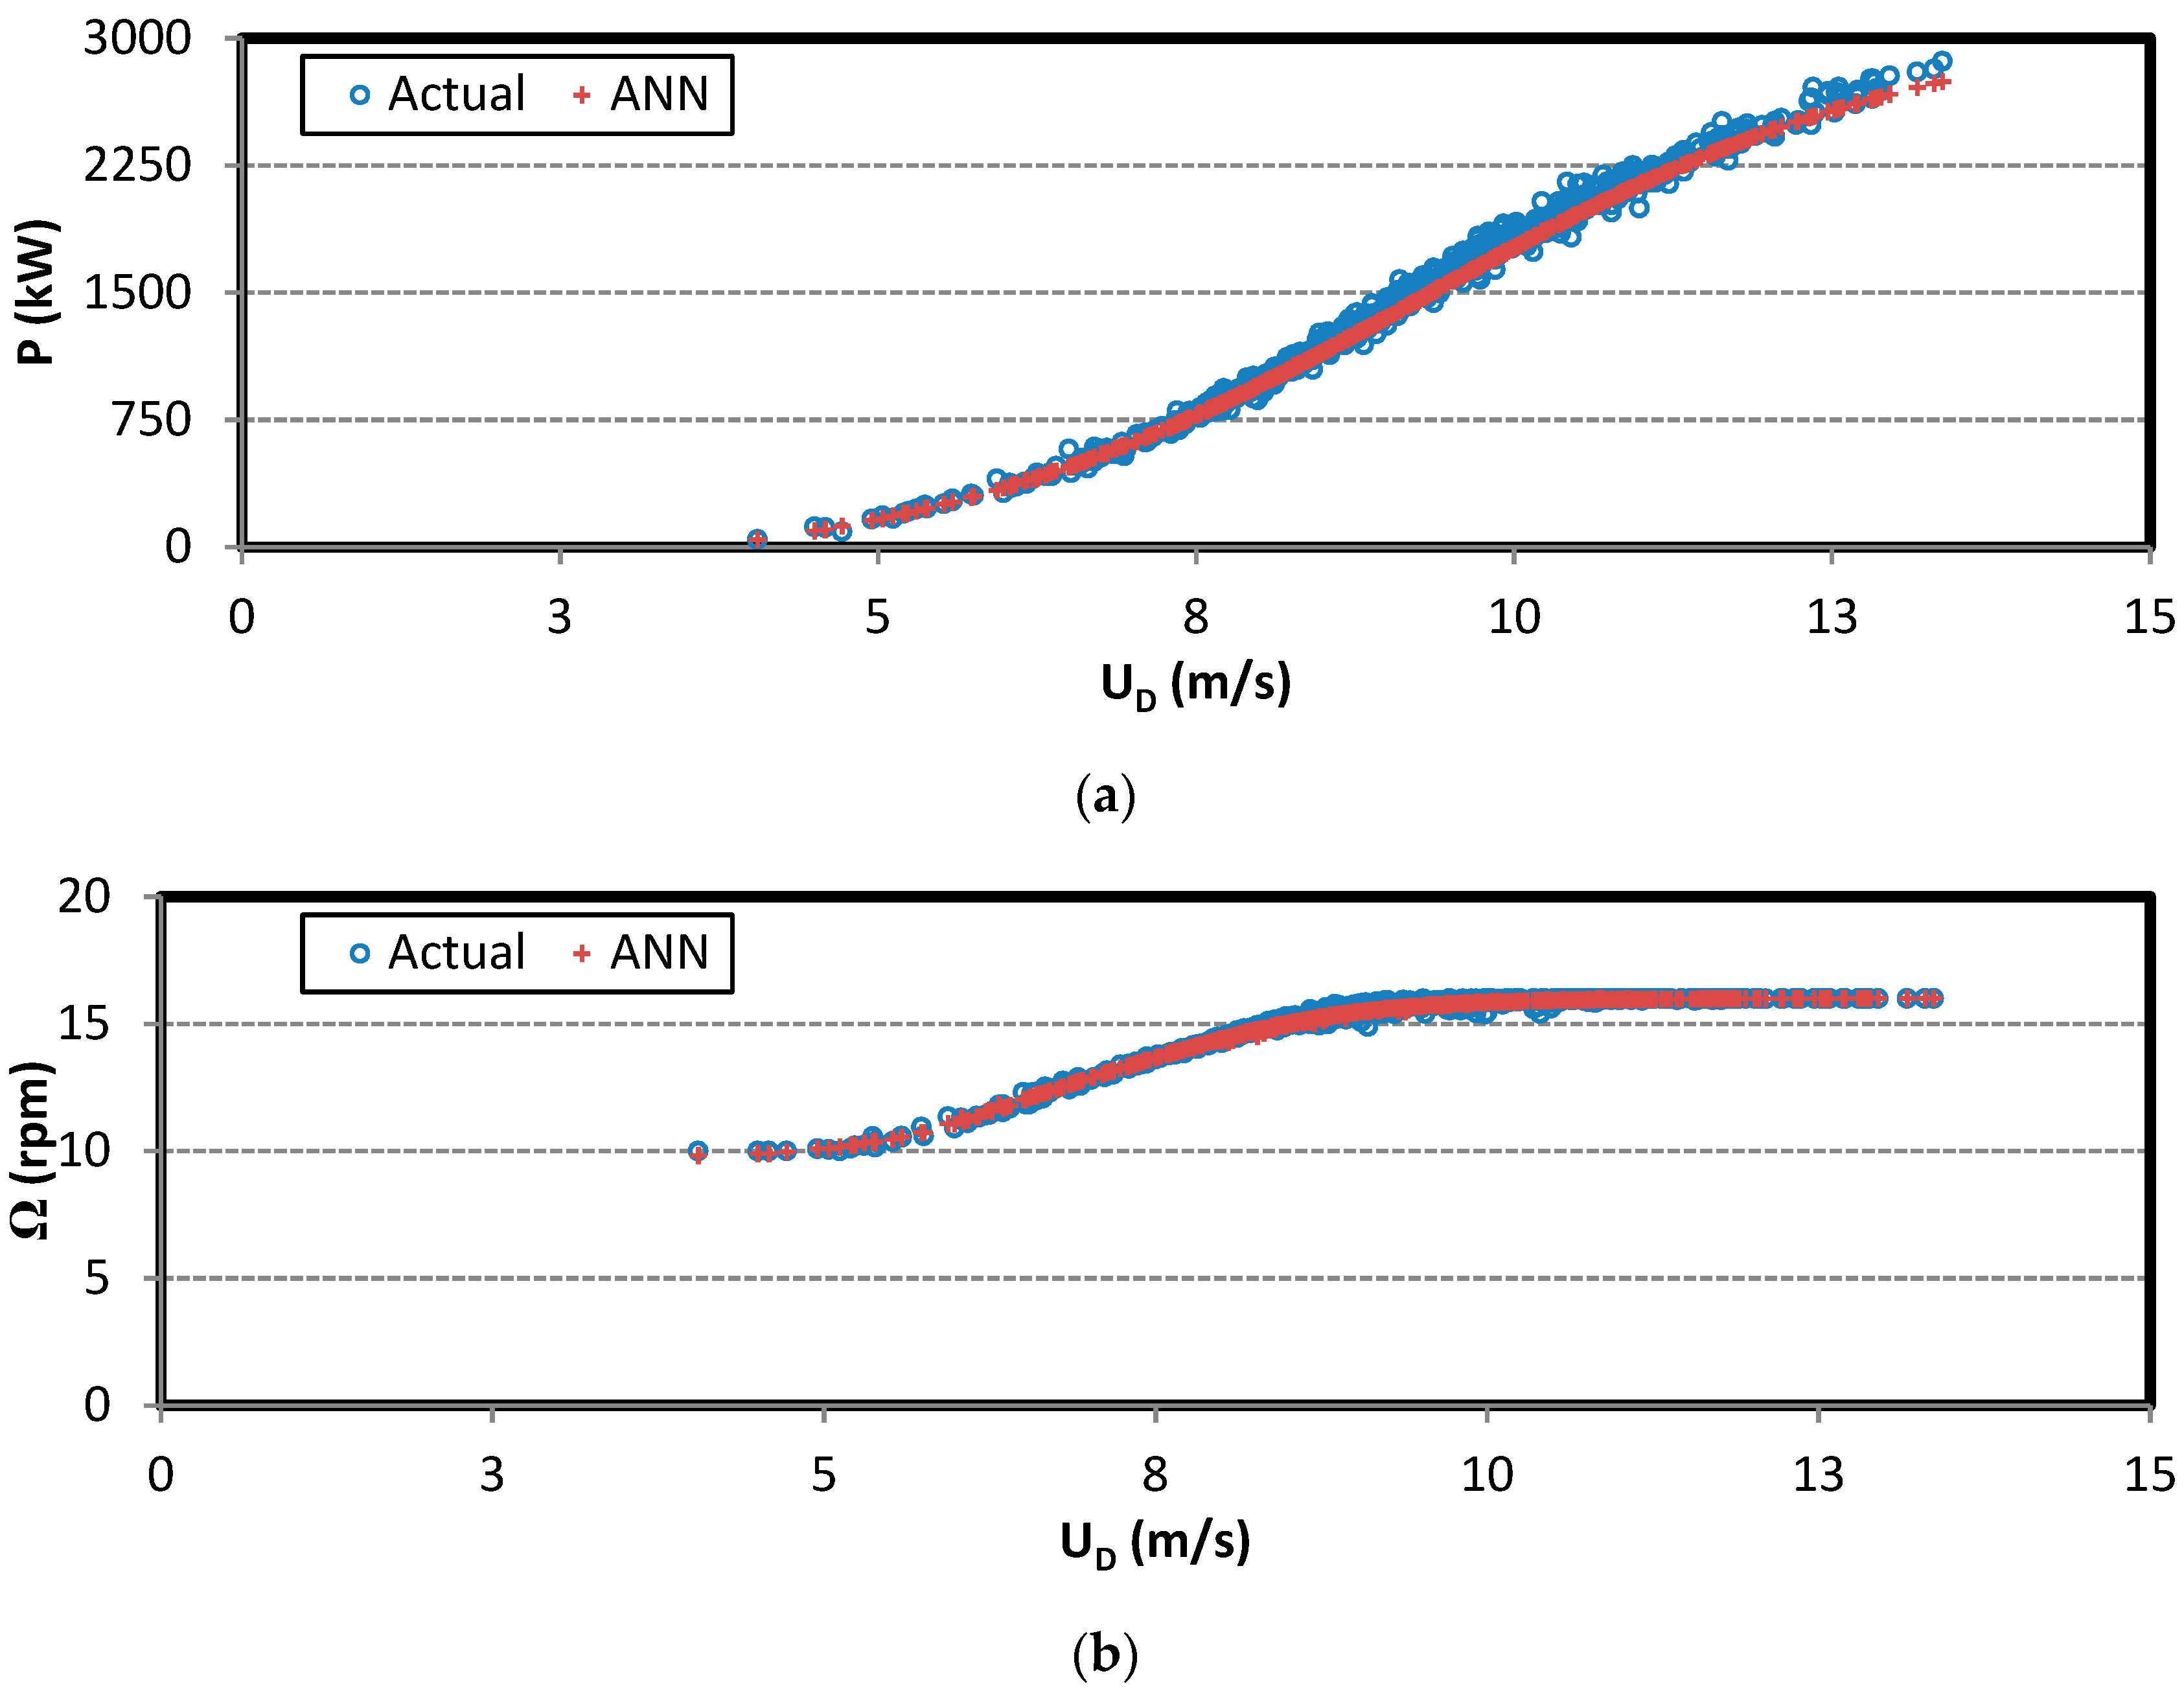
3.2. Performance Analysis

In this study, all parameters of the wind turbine are estimated in detail using two input parameters applied to three different models. The different models are implemented for training of the network parameters of the ANN. Network parameters are adjusted by these models during the training of the ANN. Thus, the minimization of the errors is obtained. These algorithms are shown in Figure 3.
The neural network is selected to have one hidden layer with five neurons and an output layer. The training network parameters are shown in this manner:
  • 10 weights between input-hidden layer;
  • 5 bias values for neurons at the hidden layer;
  • 5 weights between hidden-output layer;
  • 1 bias value for neuron at the output layer.
Thus, a totally 21 neural network parameters are trained during the using of the optimization methods. The network structure is used to decide 7 important parameters requiring turbine design. Network training is continued along 300 steps and during the training, totally 20 particle/firefly are used and 740 data are used to train the neural network. After completion of the training, the test phase is started.
Swarm based methods initially start to work with a randomly scattered population at this study. Then, they are moved by using an objective function determined its convenience value for every particle at the search space. Another step is that information of particles are updated depending on using algorithm related to its equations. Thus, the new generation is formed. These steps are continued till reach to termination criterion. When the testing is completed, ANN is constituted by using optimum values obtained by the best particle.
It is executed 25 independent runs for each dataset. The neural network is constituted with the best parameters. These parameters are obtained by the end of 25 run and neural network are used in the test phase. For the testing data sets such as P , Ω, α , C P , C T , T and λ data, the figures in Figure 5 of the ANN performance and the real values are presented to show the effectivity of the proposed model.
In addition, wind turbine parameters of the selected wind turbines including P , Ω, α , C P , C T , T and λ are performed as a function of hub-height wind speed ( U D ) for actual and predicted data based on ANN data. For the T5 turbine, distributions of these parameters based on the hub-height wind speed are presented in Figure 6. From the figure, it is clear that ANN, ANN-PSO, and ANN-FA models are able to accurately simulate the wind turbine parameters and the accuracy of the predictive ANN models are generally convenient with lower error values.
The FA algorithm has begun to be used in recent years because of its low number of parameters, its adaptability to problems and its understandable algorithmic steps during operation. The FA can also find the best local result at the same time as the global best result. In this regard, this algorithm is also very efficient and suitable for parallel applications. On the other hand, when looking at the PSO algorithm, it is more likely to discover local optimum points at the end of the study while working with too many local optimum points. Due to this disadvantage, the PSO can not achieve the best results while the FA is clustered around each optimum result. Thanks to this feature, FA can find the best result with the shortest iteration number.
Estimation results obtained at the test phase are viewed as MAE, MAPE, RMSE and TIC criteria. The performance values of the ANN, ANN-PSO and ANN-FA models for the testing data sets are given in Table 2. As seen from the table, the ANN-FA method gives the best results in applied methods at the end of the study. According to the derived results for all wind turbine characteristics, based on the testing data set, the MAE, MAPE, RMSE and TIC values ranged from 0.0033 to 46.51, from 0.55% to 3.38%, from 0.0043 to 61.39 and from 0.0042 to 0.0201, respectively. The maximum MAPE was found to be 3.38% for the P parameter. On the other hand, the best result was found to be 0.55% for the λ parameter. When Table 2 is examined in detail, the error values are within acceptable limits.
The highest error is seen in the wind power and the lowest error is seen in the λ; the number of variables that these parameters depend on and the effect of these variables on the parameter. Since the number of variables affecting the wind power is greater, the error margin in the affecting variables affects this parameter as a multiplier, so the error amount in this parameter is greater.

4. Conclusions

This paper has the capability of maintaining geographical features and optimum efficiency in the selection of the turbine to be used in the place where the wind farm will be established and designed optimally discussed and presented using the performance analyses. The performance results are verified with the real data obtained from the wind farm. In conclusion, a simple and effective wind turbine parameter has been presented in this paper, which is operated with some integrated wind farm systems.
In this study, the most important seven parameters, wind turbine power output (P), wind turbine power coefficient ( C P ), thermal coefficient ( C T ), axial flow induction factor ( α ), turbine rotational speed (Ω), tip speed ratio (λ), and thrust force (T), are used to provide optimum design of wind turbine. Two input meteorogical parameters are given to the input of the network and seven output parameters are obtained at the proposed estimation model. In the first step, the network training phase is completed by using real values in the objective method. In the second step, test phase of the network is performed by using different real data sets. For the estimation of the wind turbine parameters, hybrid prediction models are developed by using ANN and different swarm-based algorithms, as well as ANN structure. Using two different swarm-based intelligent algorithms, PSO and FA, are used. When the given diagrams and detailed table are viewed placed in the previous section, it is seen that ANN-based FA hybrid model show to the best performance and provide to the most important parameter estimation compared with conventional methods, successfully.
This work will guide wind turbine manufactures for optimum wind turbines design parameters for different geographical regions by using the proposed models. The predicted parameter values are compared with the selected turbines in Hatay WEPP. As the actual and predicted values are observed, the result presents that the data are close to each other. An analysis to test the robustness of this system is implemented on the MAE, MAPE, RMSE and TIC values both training and testing phases. In addition, the feasibility is proved by only two inputs the hub-height wind speed ( U D ) and atmospheric temperature ( T a t m ) used. The contribution of this study is to be able to be applied to similar studies. Thus, other possible potential locations are investigated even with other possibilities other than wind.

Author Contributions

Framework and conceptualization, T.D., P.T., F.E.; methodology, T.D. and F.E.; software, T.D. and I.O.A.; data and analysis, P.T. and F.E.; writing, review and editing, T.D., P.T., I.O.A. and F.E.

Funding

The Scientific Project Unit of Adana Alparslan Turkes Science and Technology University (BAP-19103005).

Acknowledgments

The authors would like to thank to the Scientific Project Unit of Adana Alparslan Turkes Science and Technology University (BAP-19103005) for full financial support.

Conflicts of Interest

The authors declare no conflict of interest.

References

  1. Bilgili, M.; Ozbek, A.; Sahin, B.; Kahraman, A. An overview of renewable electric power capacity and progress in new technologies in the world. Renew. Sustain. Energy Rev. 2015, 49, 323–334. [Google Scholar] [CrossRef]
  2. Carrillo, C.; Montano, A.F.O.; Diaz-Dorado, J.C.E. Review of power curve modelling for wind turbines. Renew. Sustain. Energy Rev. 2013, 21, 572–581. [Google Scholar] [CrossRef]
  3. Shokrzadeh, S.; Jozani, M.J.; Bibeau, E. Wind turbine power curve modeling using advanced parametric and nonparametric methods. IEEE Trans. Sustain. Energy 2014, 5, 1263–1269. [Google Scholar] [CrossRef]
  4. Wan, Y.H.; Ela, E.; Orwig, K. Development of an Equivalent Wind Plant Power-Curve; National Renewable Energy Laboratory: Dallas, TX, USA, 2010. [Google Scholar]
  5. Lydia, M.; Kumar, S.S.; Selvakumar, A.I.; Kumar, G.E.P. A comprehensive review on wind turbine power curve modeling techniques. Renew. Sustain. Energy Rev. 2014, 30, 452–460. [Google Scholar] [CrossRef]
  6. Trivellato, F.; Battisti, L.; Miori, G. The ideal power curve of small wind turbines from field data. J. Wind Eng. Ind. Aerodyn. 2012, 107, 263–273. [Google Scholar] [CrossRef]
  7. Morales, J.M.; Mínguez, R.; Conejo, A.J. A methodology to generate statistically dependent wind speed scenarios. Appl. Energy 2010, 87, 843–855. [Google Scholar] [CrossRef]
  8. Fadare, D.A. The application of artificial neural networks to mapping of wind speed profile for energy application in Nigeria. Appl. Energy 2010, 87, 934–942. [Google Scholar] [CrossRef]
  9. Petković, D.; Ćojbašič, Ž.; Nikolić, V. Adaptive neuro-fuzzy approach for wind turbine power coefficient estimation. Renew. Sustain. Energy Rev. 2013, 28, 191–195. [Google Scholar] [CrossRef]
  10. Ghandoor, A.A.; Samhouri, M. Electricity consumption in the industrial sector of Jordan: Application of multivariate linear regression and adaptive neuro-fuzzy techniques. Jordan J. Mech. Ind. Eng. 2009, 3, 69–76. [Google Scholar]
  11. Karray, F.O.; De Silva, C.W. Soft Computing and Tools of Intelligent Systems Design: Theory, Tools and Applications, 1st ed.; Pearson Education: London, UK, 2004. [Google Scholar]
  12. Jang, J.S.R. ANFIS: Adaptive-Network-Based Fuzzy Inference System. IEEE Trans. Syst. Man Cybern. 1993, 23, 665–685. [Google Scholar] [CrossRef]
  13. Ruano, A.E. Intelligent Control Systems Using Computational Intelligence Techniques, 1st ed.; IET: London, UK, 2005. [Google Scholar]
  14. Liu, H.; Chen, C.; Tian, H.; Li, Y. A hybrid model for wind speed prediction using empirical mode decomposition and artificial neural networks. Renew. Energy 2012, 48, 545–556. [Google Scholar] [CrossRef]
  15. Dang, X.J.; Chen, H.Y.; Jin, X.M. A method for forecasting short-term wind speed based on EMD and SVM. Appl. Mech. Mater. 2013, 392, 601–604. [Google Scholar] [CrossRef]
  16. Liu, D.; Niu, D.; Wang, H.; Fan, L. Short-term wind speed forecasting using wavelet transform and support vector machines optimized by genetic algorithm. Renew. Energy 2014, 62, 592–597. [Google Scholar] [CrossRef]
  17. Hou, G.; Sun, T.; Huang, F.; Jiang, P.; Zhang, J. Short-term wind speed prediction based on BP neural network with wavelet and time-series. ICIC Express Lett. 2014, 8, 867–874. [Google Scholar]
  18. Shamshirband, S.; Petkovic, D.; Tong, C.W.; Al-Shammari, E.T. Trend detection of wind speed probability distribution by adaptive neuro-fuzzy methodology. Flow Meas. Instrum. 2015, 45, 43–48. [Google Scholar] [CrossRef]
  19. Liu, H.; Tian, H.; Li, Y. Comparison of new hybrid FEEMD-MLP, FEEMD-ANFIS, Wavelet Packet-MLP and Wavelet Packet-ANFIS for wind speed predictions. Energy Convers. Manag. 2015, 89, 1–11. [Google Scholar] [CrossRef]
  20. Li, C.; Liu, Y.; Li, G.; Li, J.; Zhu, D.; Jia, W.; Li, G.; Zhi, Y.; Zhai, Z. Evaluation of wind energy resource and wind turbine characteristics at two locations in China. Technol. Soc. 2016, 47, 121–128. [Google Scholar] [CrossRef]
  21. Marvuglia, A.; Messineo, A. Monitoring of wind farms’ power curves using machine learning techniques. Appl. Energy 2012, 98, 574–583. [Google Scholar] [CrossRef]
  22. Ageze, M.B.; Hu, Y.; Wu, H. Wind turbine aeroelastic modeling: Basics and cutting edge trends. Int. J. Aerosp. Eng. 2017, 2017, 526–897. [Google Scholar] [CrossRef]
  23. Bai, C.J.; Wang, W.C. Review of computational and experimental approaches to analysis of aerodynamic performance in horizontal-axis wind turbines (HAWTs). Renew. Sustain. Energy Rev. 2016, 63, 506–519. [Google Scholar] [CrossRef]
  24. Bavanish, B.; Thyagarajan, K. Optimization of power coefficient on a horizontal axis wind turbine using BEM theory. Renew. Sustain. Energy Rev. 2013, 26, 169–182. [Google Scholar] [CrossRef]
  25. Hansen, M.O.L.; Sørensen, J.N.; Voutsinas, S.; Sørensen, N.; Madsen, H.A. State of the art in wind turbine aerodynamics and aeroelasticity. Prog. Aerosp. Sci. 2006, 42, 285–330. [Google Scholar] [CrossRef]
  26. He, Y.; Chan, P.; Li, Q. Wind characteristics over different terrains. J. Wind Eng. Ind. Aerodyn. 2013, 20, 51–69. [Google Scholar] [CrossRef]
  27. Naba, A.; Nadhir, A.; Hiyama, T. Optimal control of variable-speed wind energy conversion system based on fuzzy model power curve. Int. J. Electr. Comput. Sci. 2012, 12, 28–36. [Google Scholar]
  28. Bououden, S.; Chadli, M.; Filali, S.; El Hajjaji, A. Fuzzy model based multivariable predictive control of a variable speed wind turbine: LMI approach. Renew. Energy 2012, 37, 434–439. [Google Scholar] [CrossRef]
  29. Meharrar, A.; Tioursi, M.; Hatti, M.; Stambouli, A.B. A variable speed wind generator maximum power tracking based on adaptive neuro-fuzzy inference system. Expert Syst. Appl. 2011, 38, 7659–7664. [Google Scholar] [CrossRef]
  30. Ata, R.; Rocyigit, Y. An adaptive neuro-fuzzy inference system approach for prediction of tip speed ratio in wind turbines. Expert Syst. Appl. 2010, 37, 5454–5460. [Google Scholar] [CrossRef]
  31. El Alimi, S.; Maatallah, T.; Dahmouni, A.W.; Nasrallah, S.B. Modeling and investigation of the wind resource in the gulf of Tunis, Tunisia. Renew. Sustain. Energy Rev. 2012, 16, 5466–5478. [Google Scholar] [CrossRef] [Green Version]
  32. Ashrafi, Z.N.; Ghaderi, M.; Sedaghat, A. Parametric study on off-design aerodynamic performance of a horizontal axis wind turbine blade and proposed pitch control. Energy Convers. Manag. 2015, 93, 349–356. [Google Scholar] [CrossRef]
  33. Pelletie, F.; Masson, C.; Tahan, A. Wind turbine power curve modelling using artificial neural network. Renew. Energy 2016, 89, 207–214. [Google Scholar] [CrossRef]
  34. Bilgili, M.; Yasar, A. Performance evaluation of a horizontal axis wind turbine in operation. Int. J. Green Energy 2017, 14, 1048–1056. [Google Scholar] [CrossRef]
  35. Marciukaitis, M.; Zutautaite, I.; Martisauskas, L.; Joksas, B.; Gecevicius, G.; Sfetsos, A. Non-linear regression model for wind turbine power curve. Renew. Energy 2017, 113, 732–741. [Google Scholar] [CrossRef]
  36. Asghar, A.B. Estimation of wind turbine power coefficient by adaptive neuro-fuzzy methodology. Neurocomputing 2017, 238, 227–233. [Google Scholar] [CrossRef]
  37. Asghar, A.B.; Liu, X. Adaptive neuro-fuzzy algorithm to estimate effective wind speed and optimal rotor speed for variable-speed wind turbine. Neurocomputing 2018, 272, 495–504. [Google Scholar] [CrossRef]
  38. Li, G.; Shi, J. On comparing three artificial neural networks for wind speed forecasting. Appl. Energy 2010, 87, 2313–2320. [Google Scholar] [CrossRef]
  39. Yang, X.S. Firefly algorithm. In Nature-Inspired Metaheuristic Algorithms, 2nd ed.; Luniver Press: Frome, UK, 2008; pp. 79–90. [Google Scholar]
  40. Kennedy, J.; Eberhart, R.C. Particle swarm optimization. In Proceedings of the IEEE International Conference on Neural Networks 4, Perth, Australia, 27 November–1 December 1995; IEEE: Piscataway, NJ, USA, 1995; pp. 1942–1948. [Google Scholar]
  41. Armaghani, D.J.; Raja, R.S.N.S.B.; Faizi, K.; Rashid, A.S.A. Developing a hybrid PSO–ANN model for estimating the ultimate bearing capacity of rock-socketed piles. Neural Comput. Appl. 2017, 28, 391–405. [Google Scholar] [CrossRef]
  42. Gharghan, S.K.; Nordin, R.; Ismail, M.; Ali, J.A. Accurate wireless sensor localization technique based on hybrid PSO-ANN algorithm for indoor and outdoor track cycling. IEEE Sens. J. 2016, 16, 529–541. [Google Scholar] [CrossRef]
  43. Darmawan, M.F.; Hasan, H.; Sadimon, S.; Yusuf, S.M.; Haron, H. A Hybrid Artificial Intelligent System for Age Estimation Based on Length of Left Hand Bone. Adv. Sci. Lett. 2018, 24, 1047–1051. [Google Scholar] [CrossRef]
  44. Kora, P.; Kumari, C.U.; Meenakshi, K. Heart Arhythmia Detection Using Wavelet Coherence and Firefly Algorithm. Int. J. Comput. Appl. 2018, 975, 8887. [Google Scholar] [CrossRef]
  45. Muthuramalingam, A.; Gnanamanickam, J.; Muhammad, R. Optimum Feature Selection Using Firefly Algorithm for Keystroke Dynamics. In Proceedings of the International Conference on Intelligent Systems Design and Applications, Delhi, India, 14–16 December 2017; Springer: Cham, Switzerland, 2017; pp. 399–406. [Google Scholar]
  46. Abdullah, M.N.; Abdullah, N.L.; Jamian, J.J. Optimal power generation in microgrid system using firefly algorithm. In Proceedings of the 6th International Conference on Electrical Engineering and Informatics (ICEEI), Langkawi, Malaysia, 25–27 November 2017; pp. 1–6. [Google Scholar]
  47. REGD 2017, Renewable Energy General Directorate; Wind Energy Technical Potential for the Provinces of Turkey. Available online: http://www.eie.gov.tr/ (accessed on 7 July 2019).
Figure 1. Schematic representation of the actuator disc and stream-tube for wind turbine [34].
Sustainability 11 04803 g001
Figure 2. Optimization models used in this study.
Sustainability 11 04803 g002
Figure 3. Flowcharts of the hybrid structure of the ANN-PSO and ANN-FA models.
Sustainability 11 04803 g003
Figure 4. Belen Wind Energy Power Plant(WEPP) in Hatay province [47].
Sustainability 11 04803 g004
Figure 5. Comparison between prediction of the ANN model and actual results for (a) the turbine power output; (b) the turbine rotational speed; (c) axial flow induction factor; (d) the turbine power coefficient; (e) the thrust force coefficient; (f) thrust force; (g) the tip speed ratio.
Sustainability 11 04803 g005aSustainability 11 04803 g005bSustainability 11 04803 g005c
Figure 6. Distributions of wind turbine parameters based on the hub-height wind speed between prediction of the ANN model and actual results for (a) the turbine power output; (b) the turbine rotational speed; (c) axial flow induction factor; (d) the turbine power coefficient; (e) the thrust force coefficient; (f) thrust force; (g) the tip speed ratio.
Sustainability 11 04803 g006aSustainability 11 04803 g006bSustainability 11 04803 g006c
Table 1. Technical properties of selected wind turbines.
VariableProperties
ModelVESTAS V90-3 MW
Power regulationPitch regulated with variable speed
Operating data
Rated power3000 kW
Cut-in wind speed4 m/s
Rated wind speed15 m/s
Cut-out wind speed25 m/s
Wind classIECIA
Operating temperature range−20 °C to 40 °C
Rotor
Diameter90 m
Swept area 6362 m2
Nominal revolutions16.1 rpm
Operational interval8.6–18.4 rpm
Number of blades3
Air brakeFull blade fathering with 3 pitch cylinders
Electrical
Frequency50 Hz
Generator type4-pole doubly fed generator, slip rings
Nominal output50 Hz: 3000 kW
GearboxTwo planetary stages and one helical stage
Tower
TypeTabular steel tower
Hub height80 m
Blade dimensions
Length44 m
Max. chord3.5 m
Nacelle dimensions
Height for transport 4 m
Length12.2 m
Width3.5 m
Hub dimensions
Max. diameter3.6 m
Max. width4 m
Length4.2 m
Max. weight per unit for transportation79 t
Table 2. Analysis results with different criteria of optimal results obtained by three optimization Models.
MAEMAPE (%)RMSETIC
Power (kW)ANN46.51203.381961.39500.0195
ANN-PSO45.87603.264960.78570.0193
ANN-FA45.60763.201460.40090.0192
ANN0.09340.63380.12820.0043
ANN-PSO0.09110.61670.12640.0042
ANN-FA0.08970.60440.12440.0041
α ANN0.00343.06510.00440.0196
ANN-PSO0.00343.03220.00440.0197
ANN-FA0.00332.97300.00430.0193
CPANN0.00822.34810.01060.0150
ANN-PSO0.00812.30830.01040.0148
ANN-FA0.00802.26480.01020.0145
CTANN0.01072.69980.01370.0173
ANN-PSO0.01062.68770.01380.0174
ANN-FA0.01032.58770.01310.0166
T (kN)ANN4.95783.75706.23450.0199
ANN-PSO4.95543.46106.28640.0201
ANN-FA4.89333.31376.26210.0200
λANN0.04030.56530.05810.0042
ANN-PSO0.04020.56210.05820.0042
ANN-FA0.03950.55320.05800.0042

