The Socioeconomic Impact of Tourism in East Kazakhstan Region: Assessment Approach

 , ,
, ,
Abstract
:
1. Introduction
2. Literature Review
3. Materials and Methods
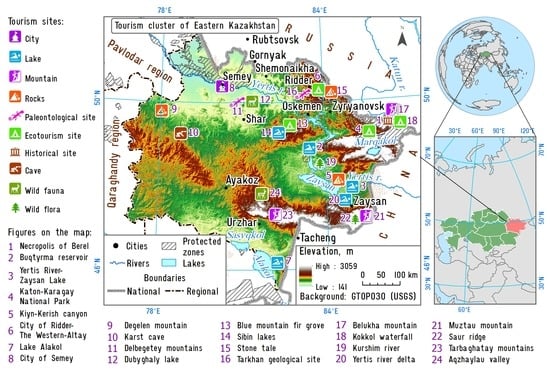
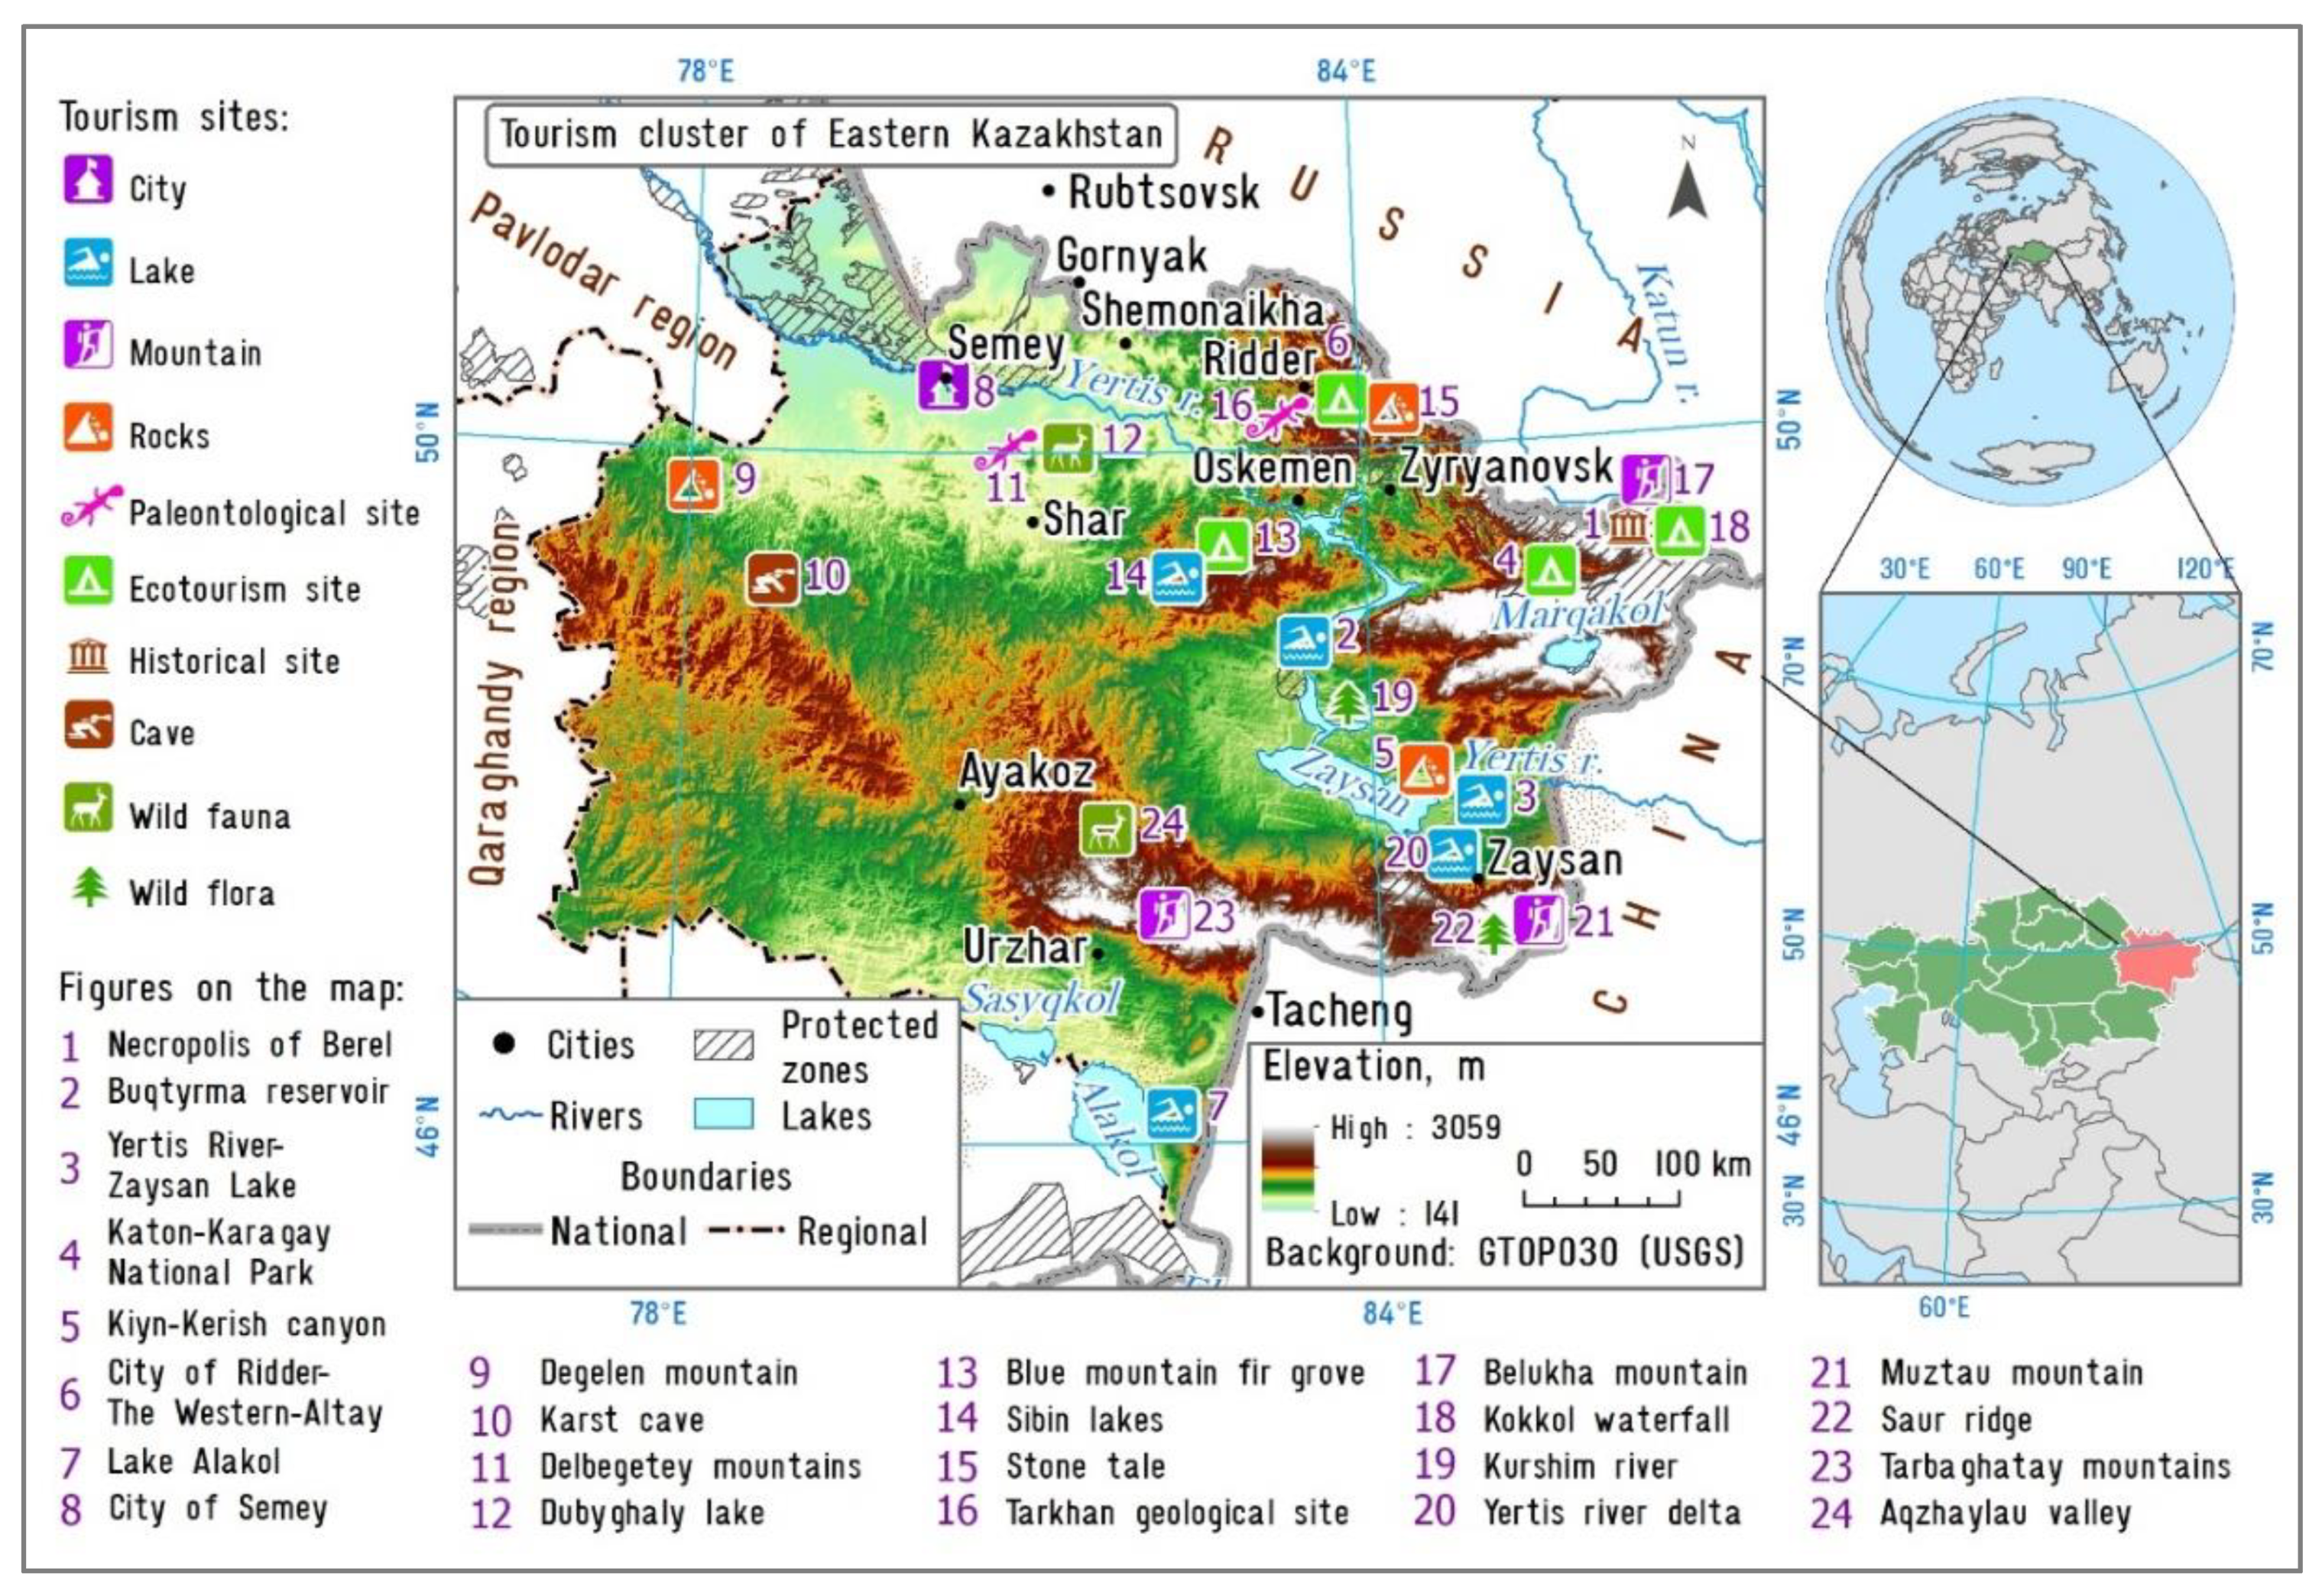
3.1. Study Area and Its Tourism and Recreation Resources
- (1)
- The State Historical and Cultural Reserve Museum “Berel”;
- (2)
- The Buqtyrma reservoir;
- (3)
- The Yertis River–Zaysan Lake;
- (4)
- The Katon-Karagay State National Natural Park;
- (5)
- The Kiyn-Kerish canyon;
- (6)
- The city of Ridder–The West Altay State Natural Reserve;
- (7)
- The Lake Alakol;
- (8)
- The city of Semey.
3.2. Research Methods
- (1)
- The complexity of the assessment of indicators;
- (2)
- Availability of the information used;
- (3)
- Simplicity and replicability of the methodology, its correct reproduction in other areas of Kazakhstan;
- (4)
- The possibility of obtaining a quantitative integral estimate, allowing comparative analysis for parts of the region.
4. Results
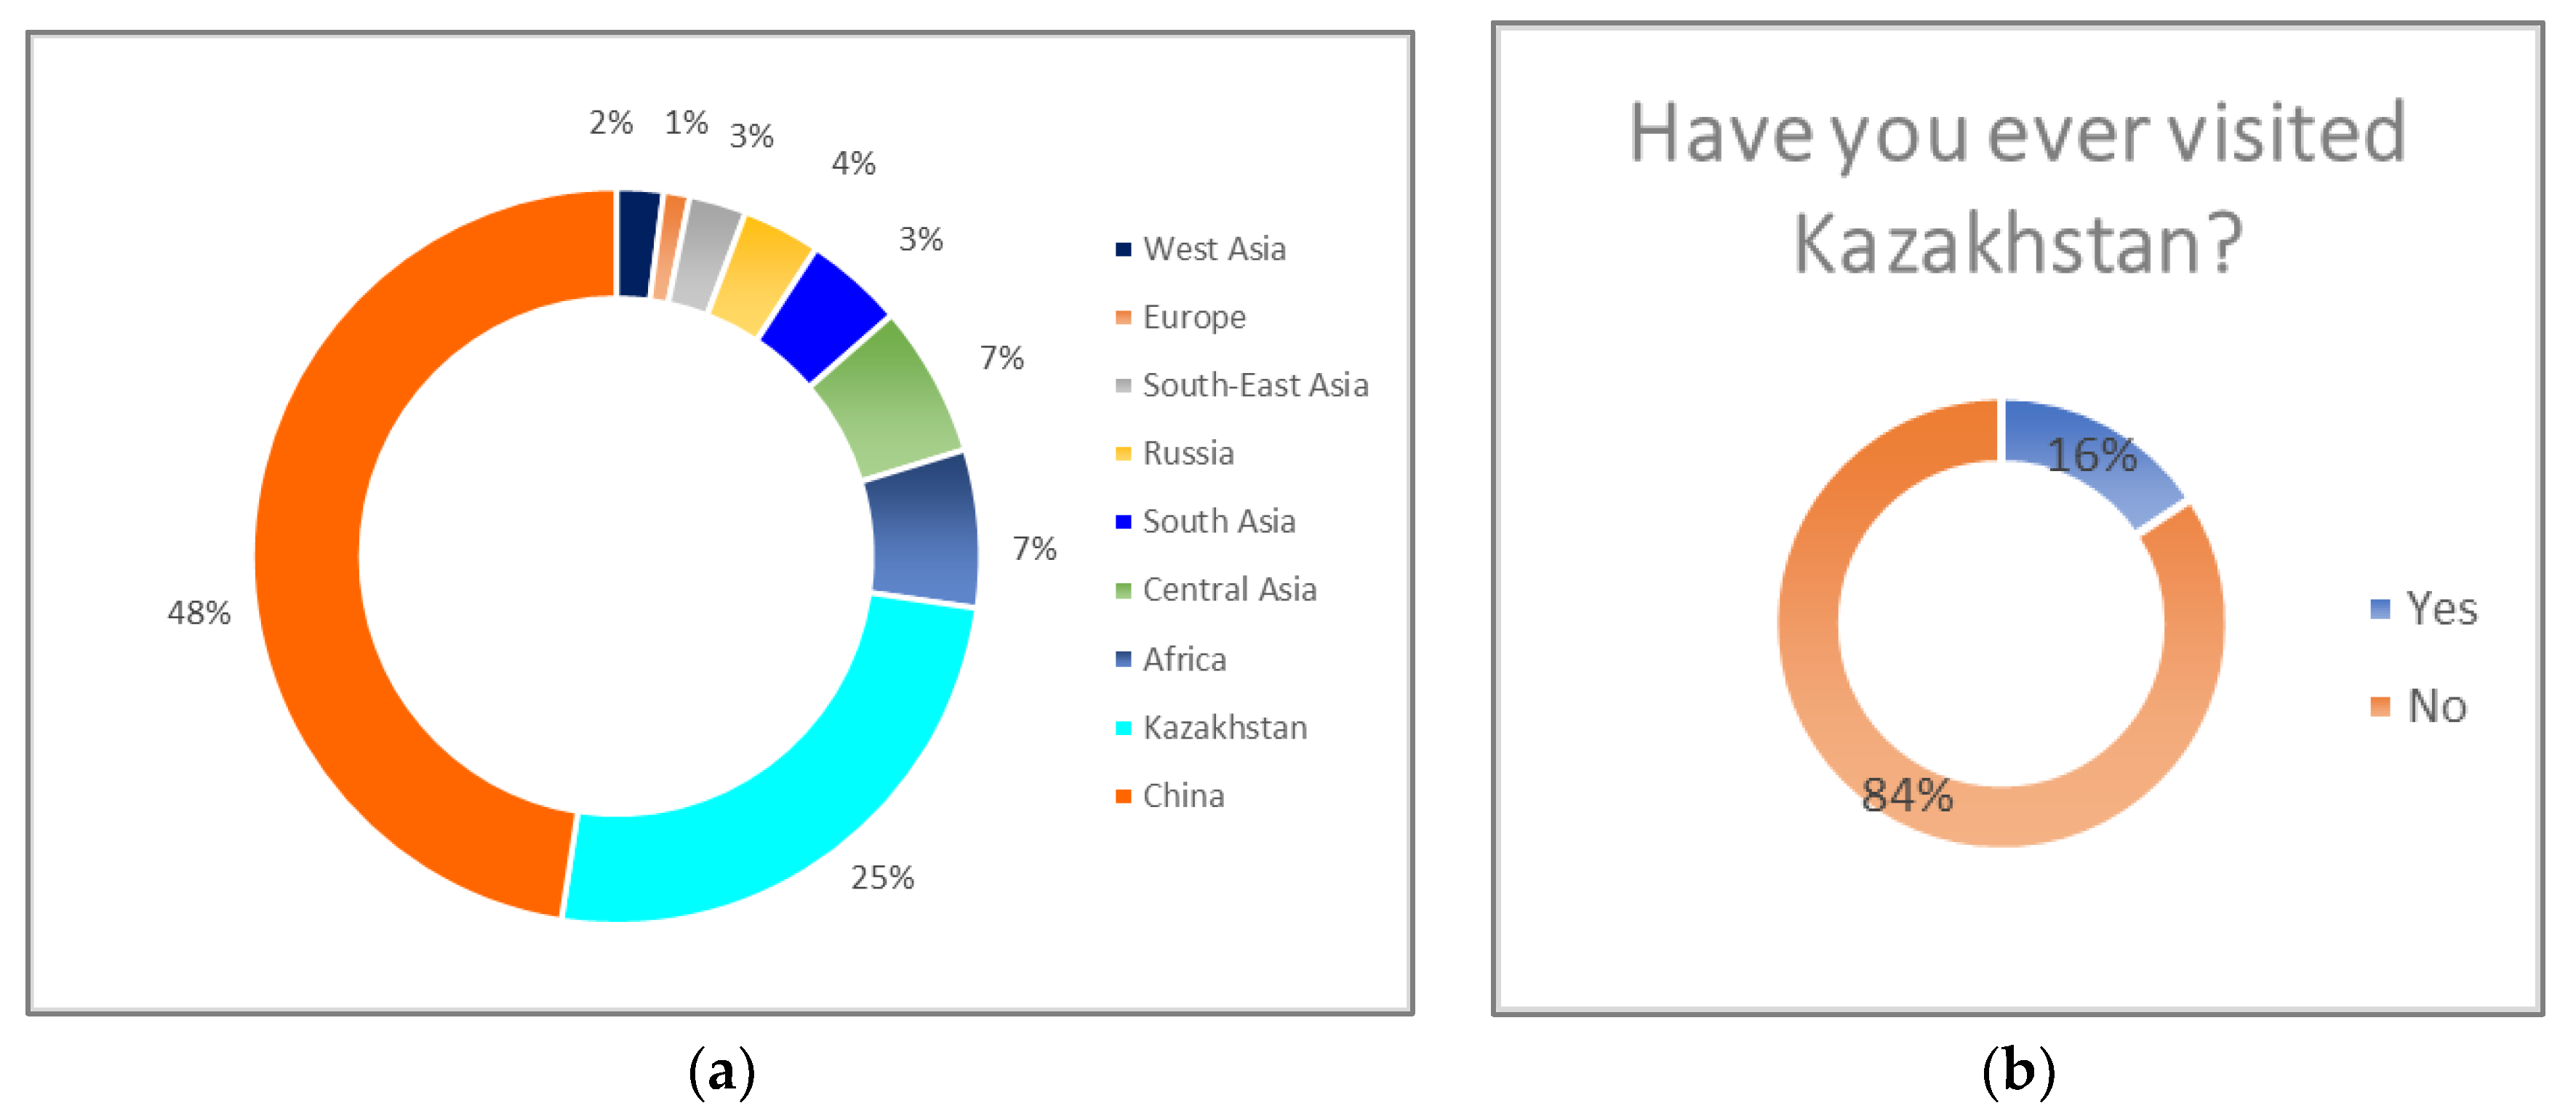
4.1. The Online Survey Results
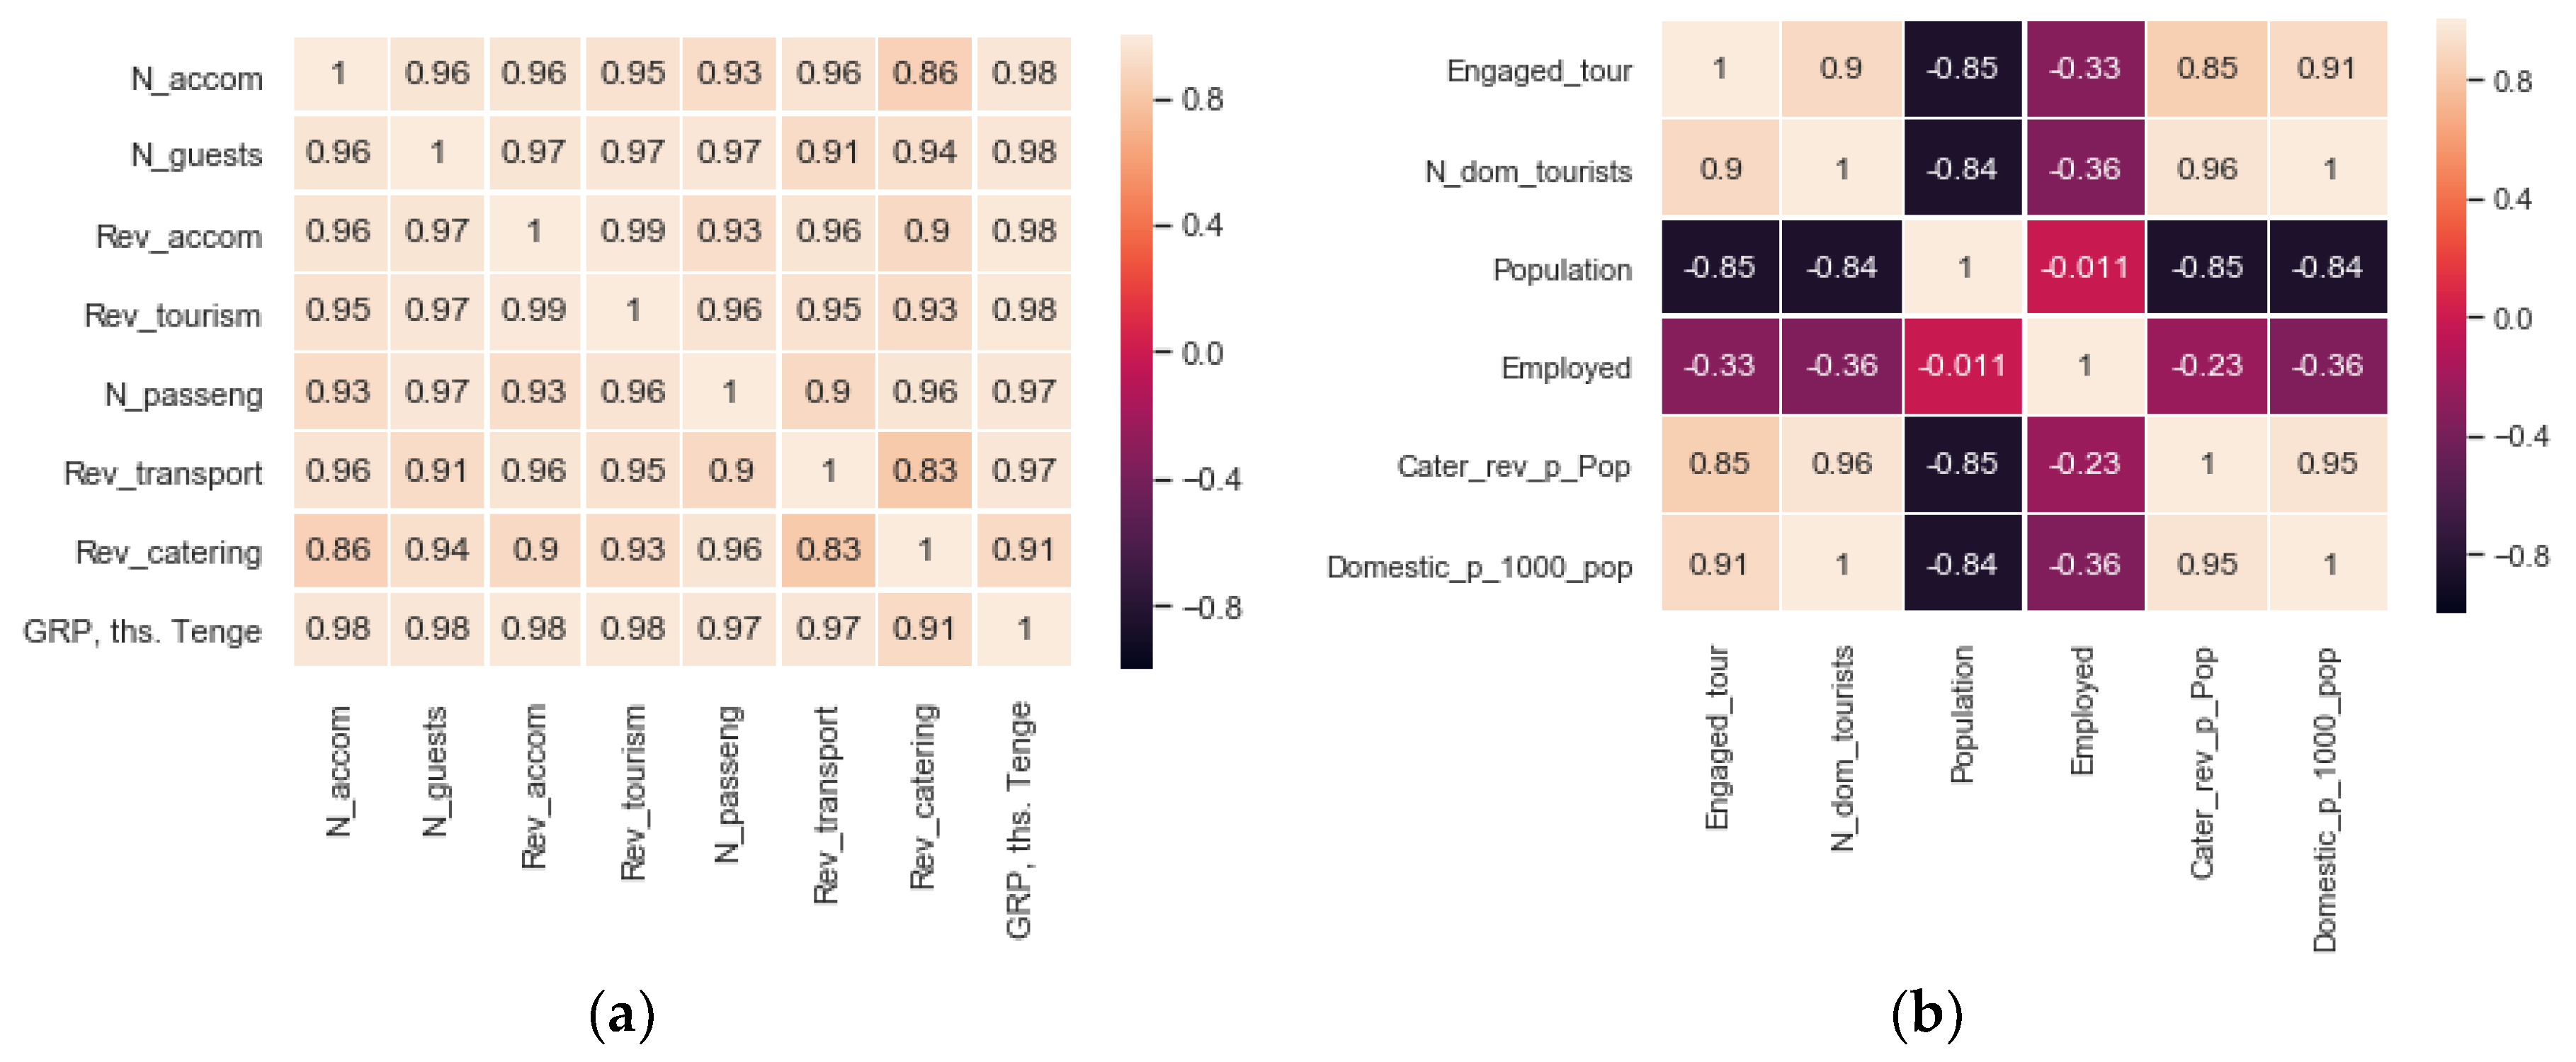
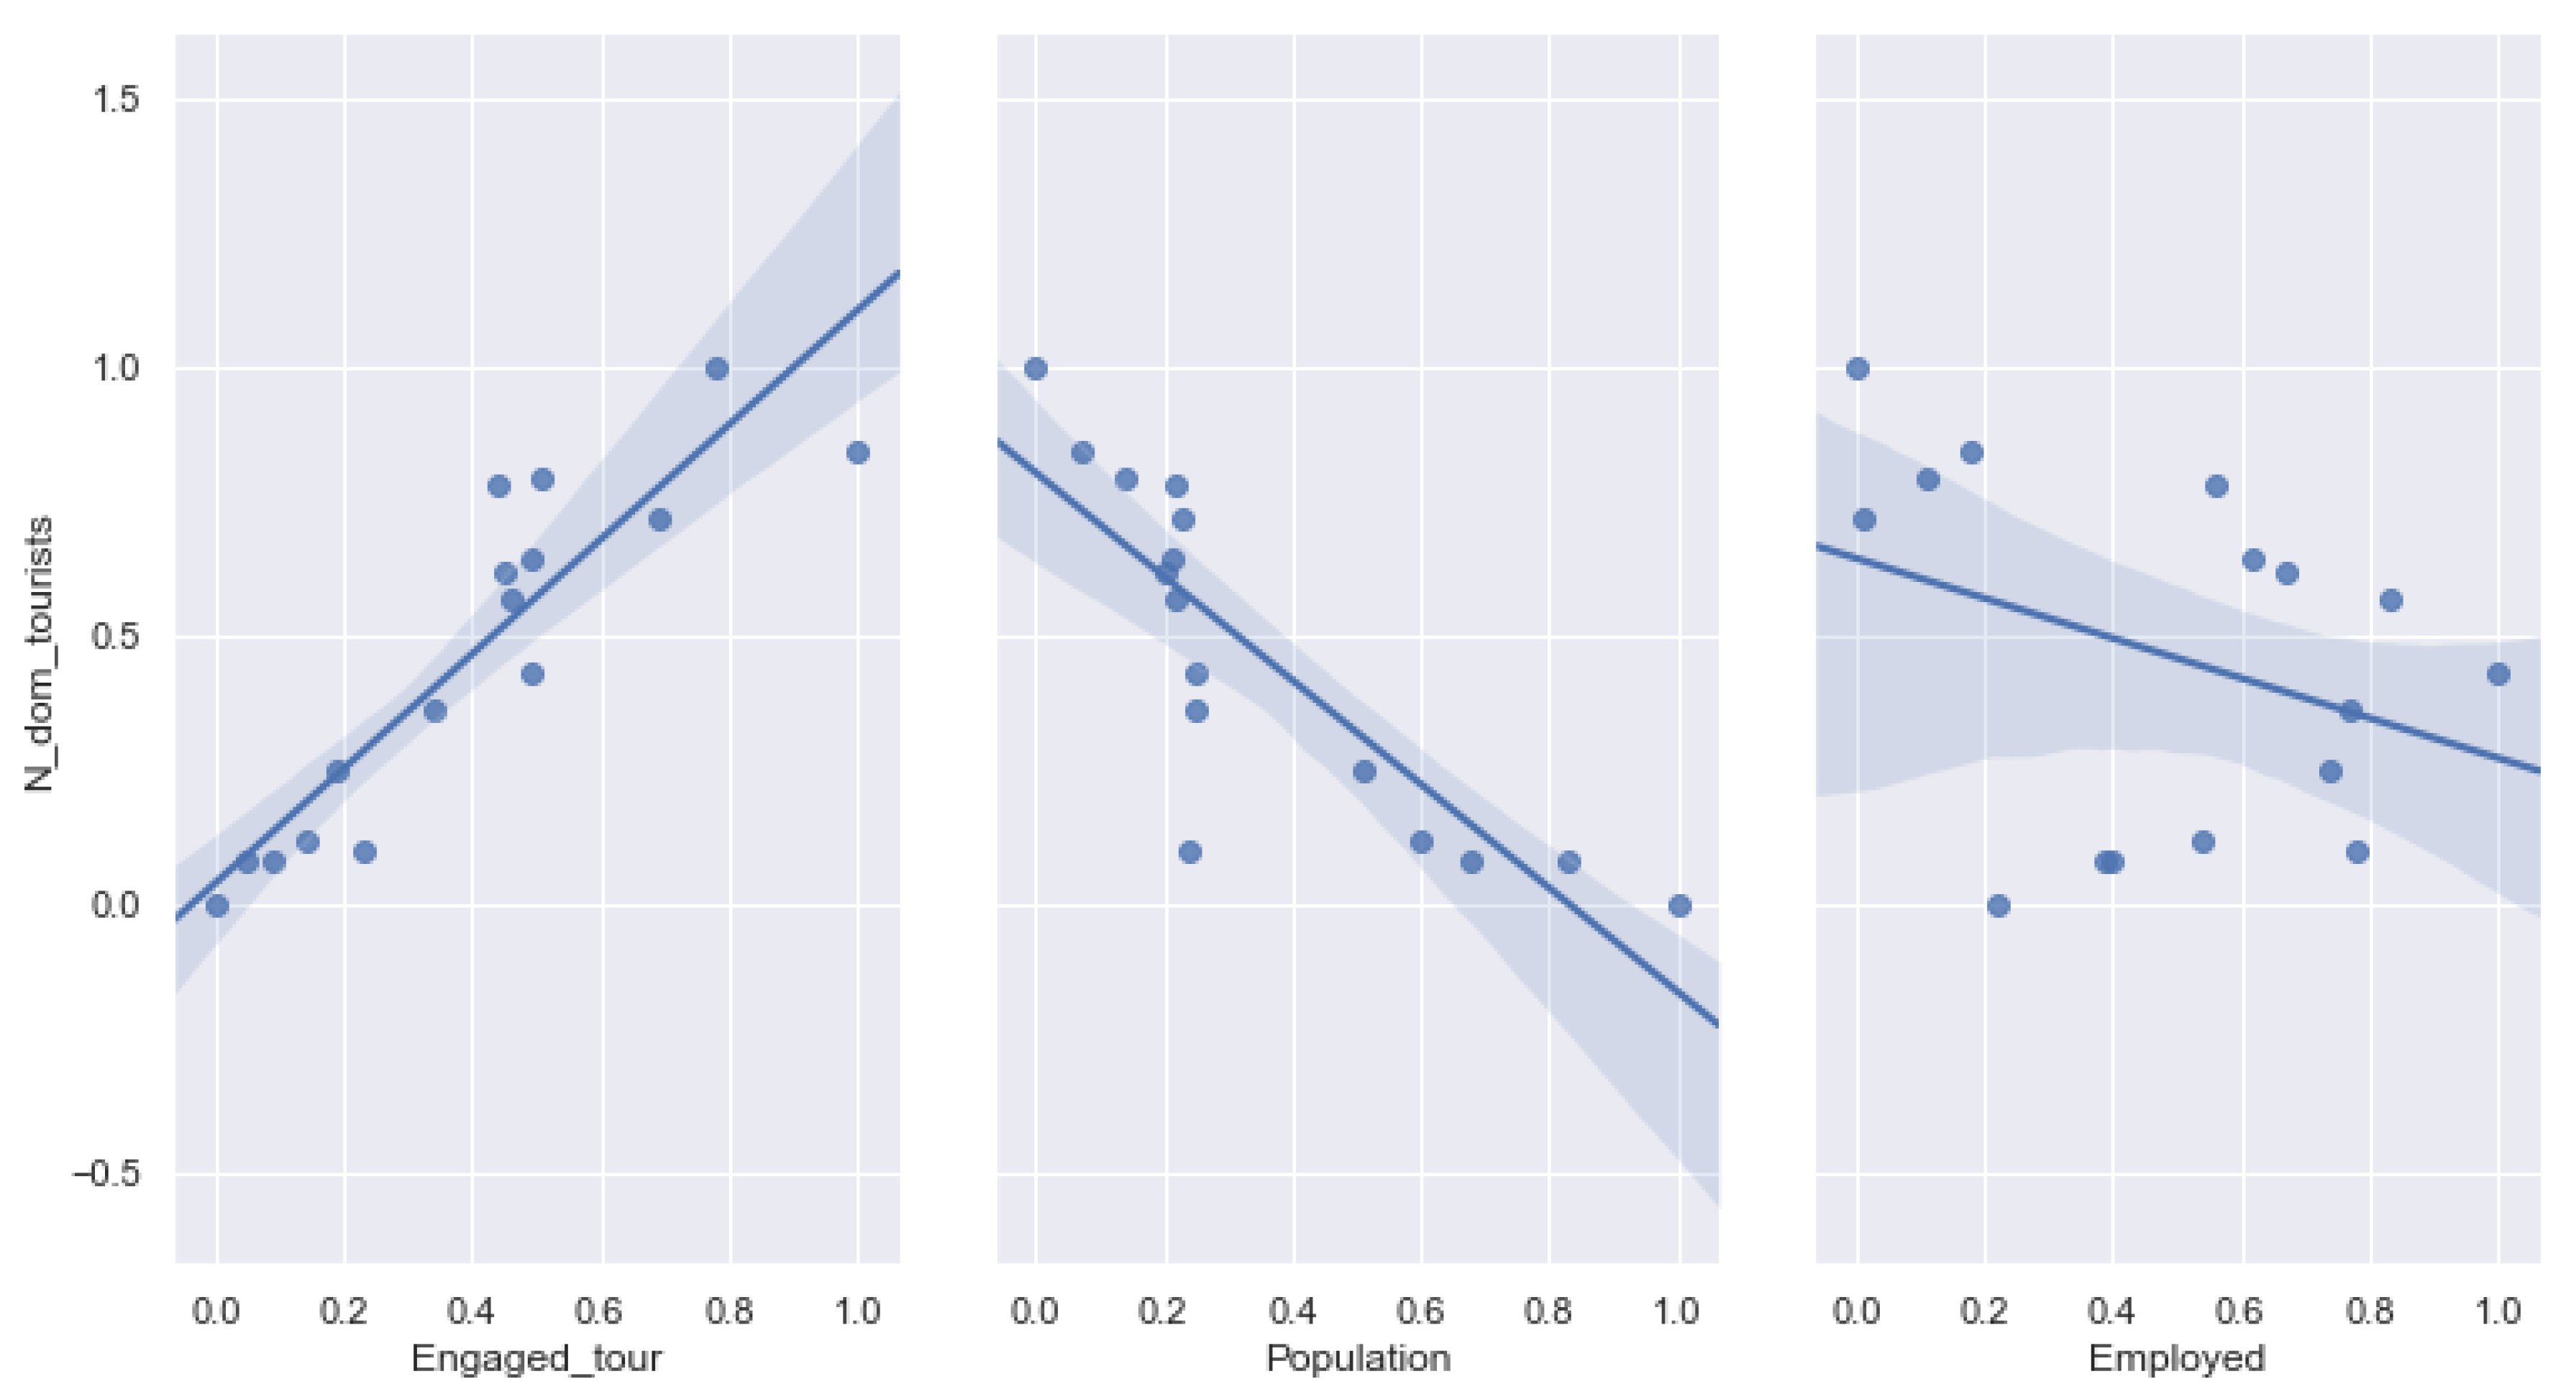
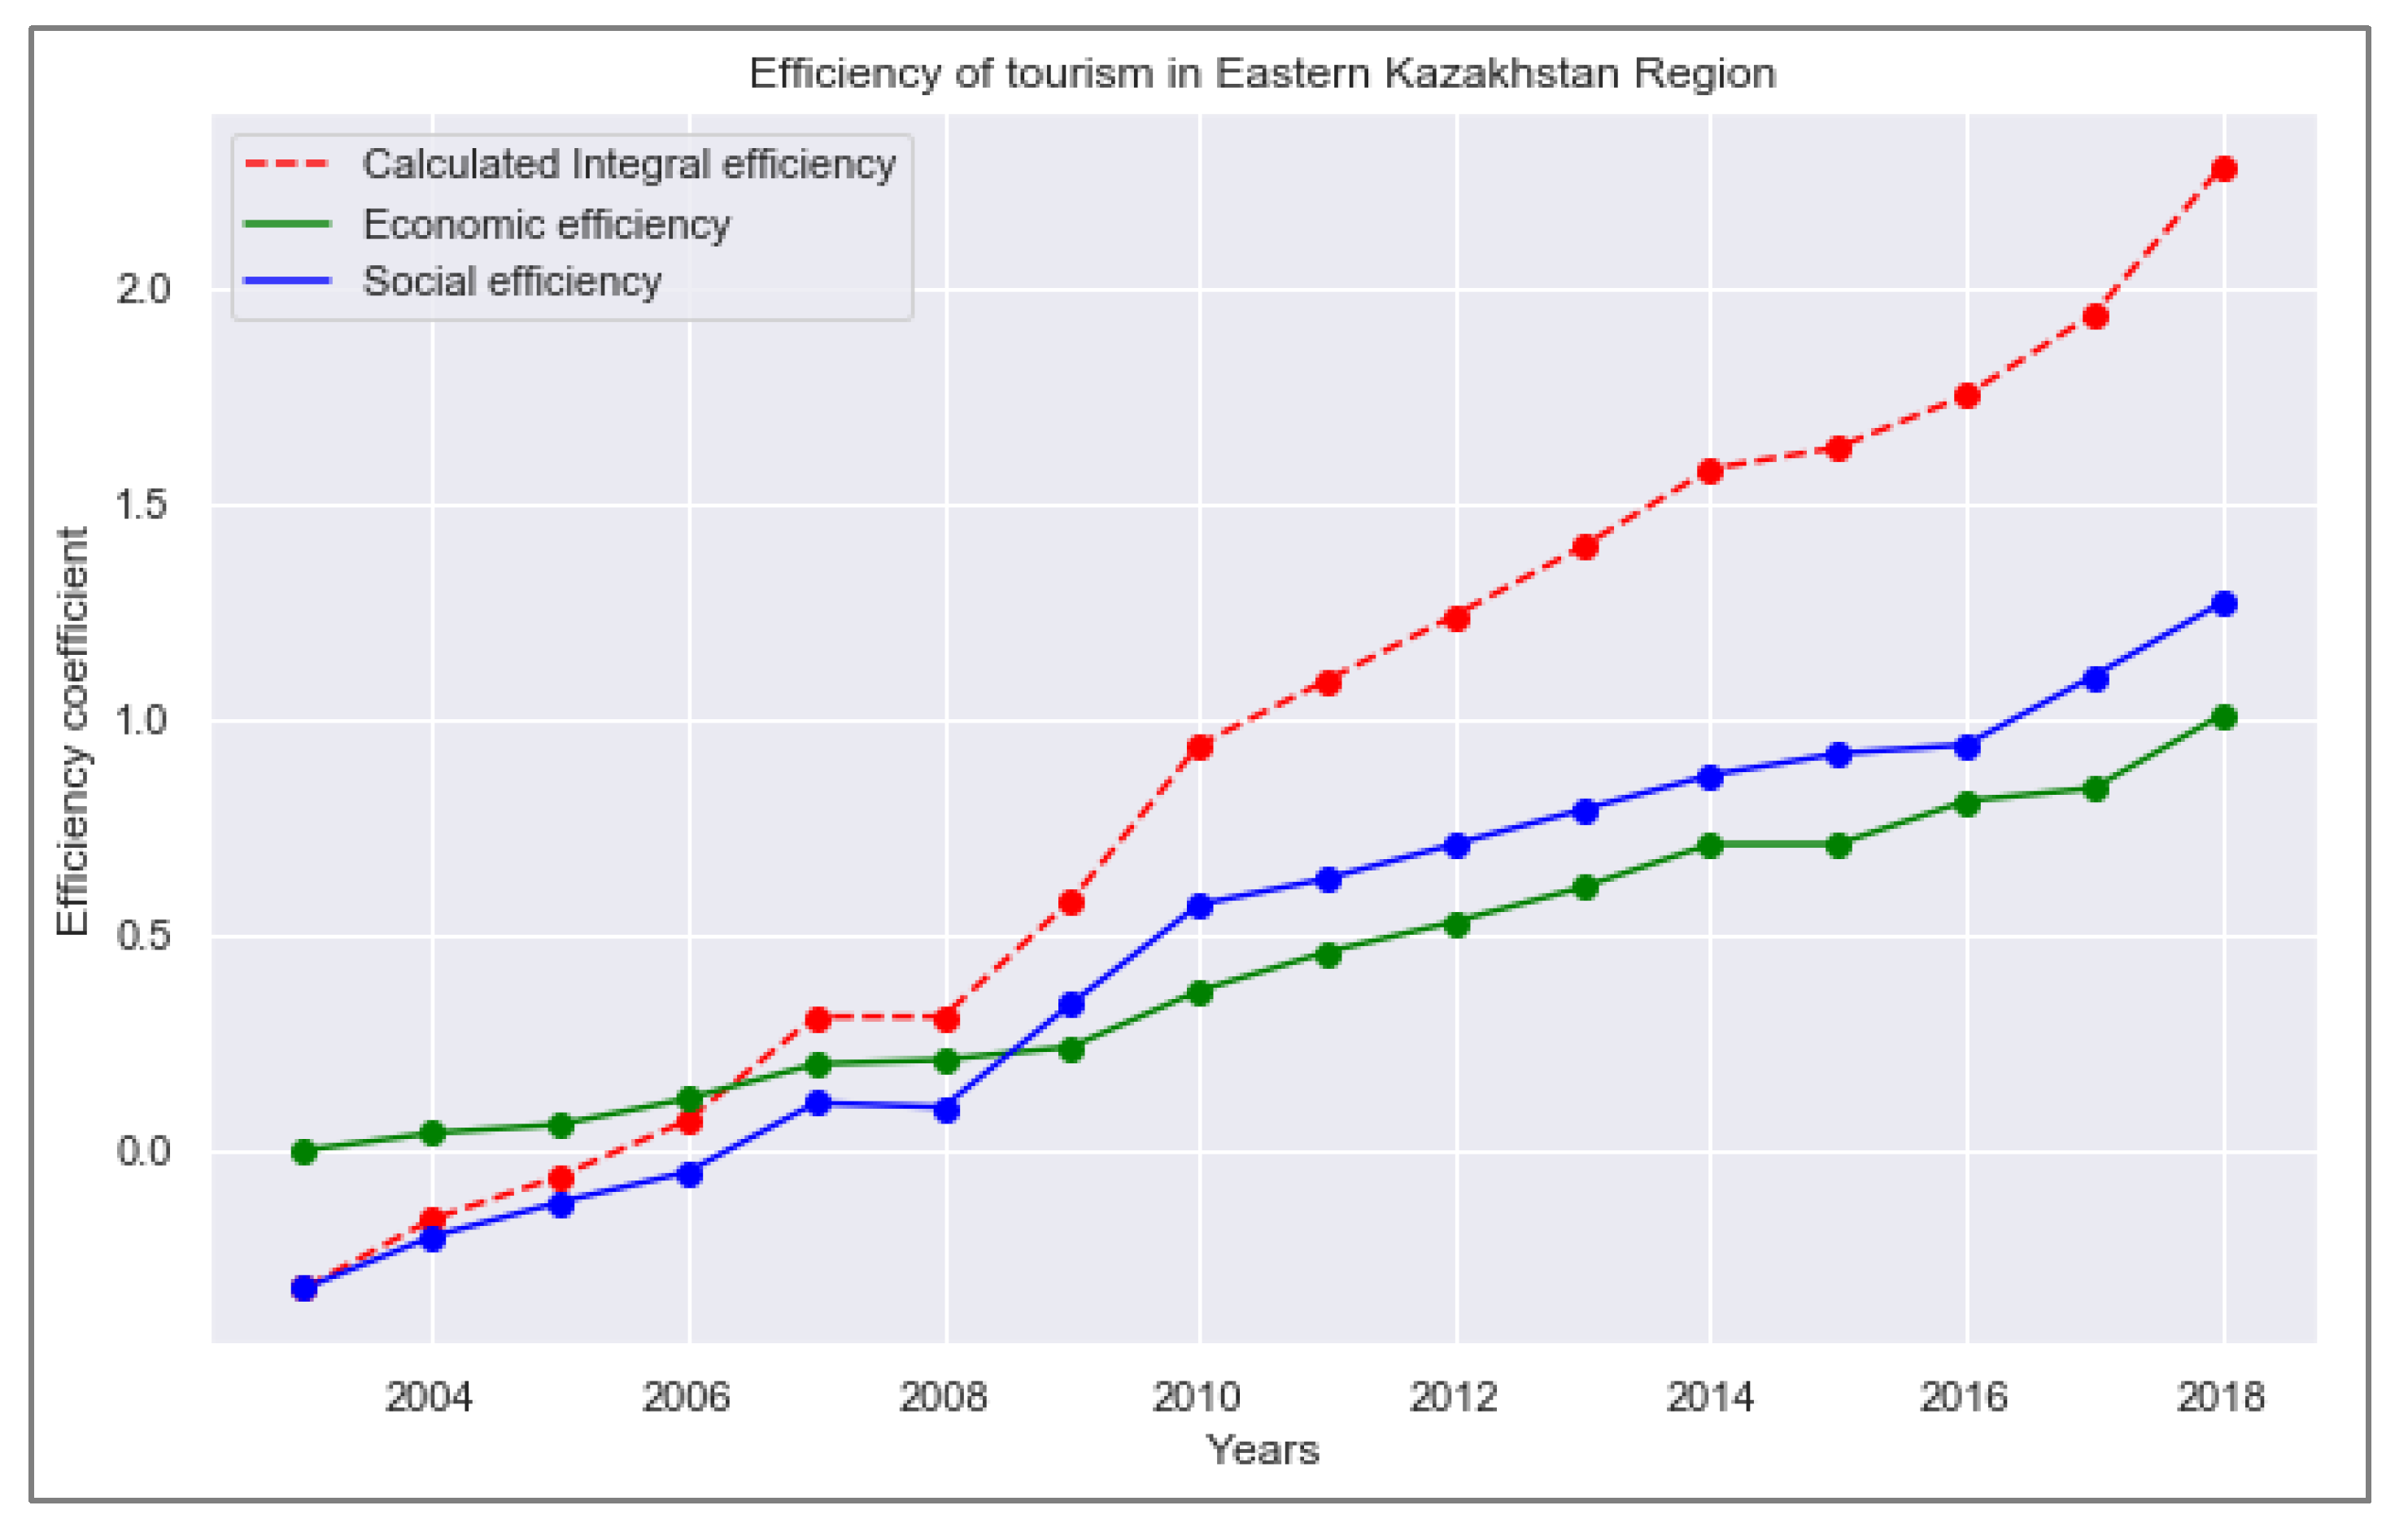
4.2. Tourism Efficiency Indicators in East Kazakhstan
5. Discussion
6. Conclusions
Author Contributions
Funding
Acknowledgments
Conflicts of Interest
References
- UN. Transforming Our World: The 2030 Agenda for Sustainable Development; UN: New York, NY, USA, 2015. [Google Scholar]
- Lenzen, M.; Sun, Y.Y.; Faturay, F.; Ting, Y.P.; Geschke, A.; Malik, A. The carbon footprint of global tourism. Nat. Clim. Chang. 2018, 8, 522–528. [Google Scholar] [CrossRef]
- Jafari, J. The socio-economic costs of tourism to developing countries. Ann. Tour. Res. 1974, 1, 227–262. [Google Scholar] [CrossRef]
- Romão, J.; Nijkamp, P. Spatial-Economic Impacts of Tourism on Regional Development: Challenges for Europe; Springer: Berlin, Germany, 2017. [Google Scholar]
- Gross, M. Global tourism’s growing footprint. Curr. Biol. 2018, 28, R963–R965. [Google Scholar] [CrossRef]
- Mathieson, A.; Wall, G. Tourism, Economic, Physical and Social Impacts; Longman: London, UK, 1982. [Google Scholar]
- Butler, R.W. Sustainable tourism: A state-of-the-art review. Tour. Geogr. 1999, 1, 7–25. [Google Scholar] [CrossRef]
- UNWTO. 2016 Edition UNWTO Tourism Highlights. Available online: https://www.e-unwto.org/doi/pdf/10.18111/9789284418145 (accessed on 13 May 2019).
- Heng, T.M.; Low, L. Economic impact of tourism in Singapore. Ann. Tour. Res. 1990, 17, 246–269. [Google Scholar] [CrossRef]
- Bramwell, B.; Richards, G.; Henry, I.; Jackson, G.; van der Straaten, J.; van‘t Zelfde, J.; Zarza, A.E.; Prat, A.G.; Laws, D.; Swarbrooke, J.; et al. Sustainable Tourism Management: Principles and Practice; Purdue University Press: West Lafayette, IN, USA, 1996. [Google Scholar]
- Harrill, R. Residents’ attitudes toward tourism development: A literature review with implications for tourism planning. J. Plan. Lit. 2004, 18, 251–266. [Google Scholar] [CrossRef]
- Song, H.; Dwyer, L.; Li, G.; Cao, Z. Tourism economics research: A review and assessment. Ann. Tour. Res. 2012, 39, 1653–1682. [Google Scholar] [CrossRef]
- Sharpley, R. Host perceptions of tourism: A review of the research. Tour. Manag. 2014, 42, 37–49. [Google Scholar] [CrossRef]
- Lee, C.C.; Chang, C.P. Tourism development and economic growth: A closer look at panels. Tour. Manag. 2008, 29, 180–192. [Google Scholar] [CrossRef]
- Cernat, L.; Gourdon, J. (UNCTAD) Is the Concept of Sustainable Tourism Development? Developing the sustainable tourism benchmarking tool. In Proceedings of the United Nations Conference on Trade and Development, New York, NY, USA, 16–17 February 2007; p. 37. [Google Scholar]
- Archer, B. Tourism multipliers: The state of the art. Univ. Wales Press 1977, 11, 85. [Google Scholar]
- Abelson, P. Evaluating major events and avoiding the mercantilist fallacy. Econ. Pap. A J. Appl. Econ. Policy 2011, 30, 48–59. [Google Scholar] [CrossRef]
- Archer, B.; Fletcher, J. The economic impact of tourism in the Seychelles. Ann. Tour. Res. 1996, 23, 32–47. [Google Scholar] [CrossRef]
- Frechtling, D.C.; Horvath, E. Estimating the multiplier effects of tourism expenditures on a local economy through a regional input-output model. J. Travel Res. 1999, 37, 324–332. [Google Scholar] [CrossRef]
- Blake, A. The dynamics of tourism’s economic impact. Tour. Econ. 2009, 15, 615–628. [Google Scholar] [CrossRef]
- Dwyer, L.; Forsyth, P.; Spurr, R. Evaluating tourism’s economic effects: New and old approaches. Tour. Manag. 2004, 25, 307–317. [Google Scholar] [CrossRef]
- Pratt, S. Economic linkages and impacts across the TALC. Ann. Tour. Res. 2011, 38, 630–650. [Google Scholar] [CrossRef]
- Jones, C.; MundaY, M.; Roberts, A. Regional tourism satellite accounts: A useful policy tool? Urban Stud. 2003, 40, 2777–2794. [Google Scholar] [CrossRef]
- Deery, M.; Jago, L.; Fredline, L. Rethinking social impacts of tourism research: A new research agenda. Tour. Manag. 2012, 33, 64–73. [Google Scholar] [CrossRef]
- Liu, J.C.; Sheldon, P.J.; Var, T. Resident perception of the environmental impacts of tourism. Ann. Tour. Res. 1987, 14, 17–37. [Google Scholar] [CrossRef]
- Doxey, G.V. A causation theory of visitor-resident irritants: Methodology and research inferences. In Proceedings of the Travel and Tourism Research Associations Sixth Annual Conference Proceedings, San Diego, California, 8–11 September 1975; pp. 195–198. [Google Scholar]
- Ap, J.; Crompton, J.L. Residents’ strategies for responding to tourism impacts. J. Travel Res. 1993, 32, 47–50. [Google Scholar] [CrossRef]
- Fredline, E.; Faulkner, B. Host community reactions: A cluster analysis. Ann. Tour. Res. 2000, 27, 763–784. [Google Scholar] [CrossRef]
- Faulkner, B.; Tideswell, C. A framework for monitoring community impacts of tourism. J. Sustain. Tour. 1997, 5, 3–28. [Google Scholar] [CrossRef]
- Kim, K.; Uysal, M.; Sirgy, M.J. How does tourism in a community impact the quality of life of community residents? Tour. Manag. 2013, 36, 527–540. [Google Scholar] [CrossRef]
- Sawant, M. Socio-Economic Impacts of Tourism Development at Aurangabad District; Research & Consultancy, Marathwada University: Aurangabad, India, January 2017; pp. 1–8. [Google Scholar]
- Osipov, B.A.; Sokolenko, V.V.; Shmidt, Y. Estimation procedure of social-economic efficiency of domestic tourism. Tomsk State Univ. Bull. 2011, 3, 3–11. [Google Scholar]
- Rubtsova, N.V. Practical Evaluation of Social-economical Effectiveness of tourist and recreation Field (interregional Comparisons). Tomsk State Univ. Bull. 2013, 2, 53–67. [Google Scholar]
- Abubakirova, A.; Syzdykova, A.; Kelesbayev, D.; Dandayeva, B.; Ermankulova, R. Place of Tourism in the Economy of Kazakhstan Republic. Procedia Econ. Financ. 2016, 39, 3–6. [Google Scholar] [CrossRef] [Green Version]
- World Tourism and Travel Council. 2019 Annual Research: Key highlights. Kazakhstan. Available online: https://www.wttc.org/economic-impact/country-analysis/country-data/ (accessed on 14 May 2019).
- Tourism. Basic Indicators for 2003–2018. The Official Statistical Information. Committee on Statistics of the Ministry of National Economy, Kazakhstan. Available online: http://stat.gov.kz/faces/wcnav_externalId/homeNumbersTourism?_afrLoop=9049464054177980#%40%3F_afrLoop%3D9049464054177980%26_adf.ctrl-state%3Djmr8fmire_72 (accessed on 14 May 2019).
- Ospanov, G.M. Analysis of the image of Kazakhstan on the world tourism market. Fundam. Issled. 2013, 482, 495–498. [Google Scholar]
- Takhtayeva, R.S. Tourism Management in the East Kazakhstan Region Based on Innovative Technologies; Baltic Academy of Tourism and Entrepreneurship: Saint-Petersburg, Russia, 2014. [Google Scholar]
- Vilesov, E.; Naumenko, A.; Veselova, L. Fizicheskaya Geografiya Kazahstana; Qazaq universiteti: Almaty, Kazakhstan, 2009. [Google Scholar]
- Karatayev, M.; Clarke, M.L. Current energy resources in Kazakhstan and the future potential of renewables: A review. Energy Procedia 2014, 59, 97–104. [Google Scholar] [CrossRef]
- Government of the Republic of Kazakhstan. Decree No. 406 of the Government of the Republic of Kazakhstan on Approval of the Concept of Development of the Tourism Industry of the Republic of Kazakhstan Until 2023. Yegemen Qazaqstan, 30 June 2017; No. 406. [Google Scholar]
- Bekbergenov, T. Tourism Map-Scheme of Kazakhstan; Delovoy Mir Astana: Astana, Kazakhstan, 2012; p. 2. [Google Scholar]
- EROS (USGS). Global 30 Arc-Second Elevation (GTOPO30); EROS (USGS): Reston, VA, USA, 2008.
- UNWTO. International Recommendations for Tourism Statistics; United Nations Publication: Madrid, Spain; New York, NY, USA, 2008; Volume SER.M/83, no. Rev. 1. [Google Scholar]
- UN; WTO; EST; OECD. Tourism Satellite Account: Recommended Methodological Framework 2008; ST/ESA/STA; United Nations Publication: New York, NY, USA, 2010. [Google Scholar]
- ASRK. Tourism in the East Kazakhstan. 2009–2013. Statistical Compilation Report; Agency of Statistics of the Republic of Kazakhstan: Ust-Kamenogorsk, Kazakhstan, 2014. [Google Scholar]
- Yuvanen, E.I. Ocenka social’no—Jekonomicheskoj jeffektivnosti vnutrennego turizma v regione. Tomsk State Univ. Bull. 2006, 3, 26–33. [Google Scholar]
- Buiter, W.H. Lessons from the 2007 Financial Crisis. Policy Insight 2007, 18, 1–17. [Google Scholar]
- Madani, D.; Sarsenov, I. Kazakhstan: Adjusting to Lower Oil Prices; Challenging Times Ahead. Kazakhstan Econ. Updat. 2015, 2, 1–28. [Google Scholar]


| 2013 | 2014 | 2015 | 2016 | 2017 | 2018 | |
|---|---|---|---|---|---|---|
| Foreign tourists | 586,038 | 679,018 | 692,213 | 722,515 | 891,911 | 830,922 |
| Domestic tourists | 2,721,714 | 3,125,429 | 3,110,012 | 3,495,267 | 4,387,495 | 4,695,942 |
| Competitiveness Parameter | Rating |
|---|---|
| Business climate | 44 |
| Safety and security | 72 |
| Health and hygiene | 7 |
| HR and the labor market | 37 |
| The readiness of information and communication technologies | 48 |
| Priority of tourism | 84 |
| International openness | 124 |
| Price competitiveness | 49 |
| Environmental sustainability | 91 |
| Air transport infrastructure | 76 |
| Land and sea infrastructure | 102 |
| Tourist service infrastructure | 81 |
| Natural resources | 111 |
| Cultural resources and infrastructure for business tourism | 101 |
| Indicator | 2003 | 2008 | 2013 | 2018 |
|---|---|---|---|---|
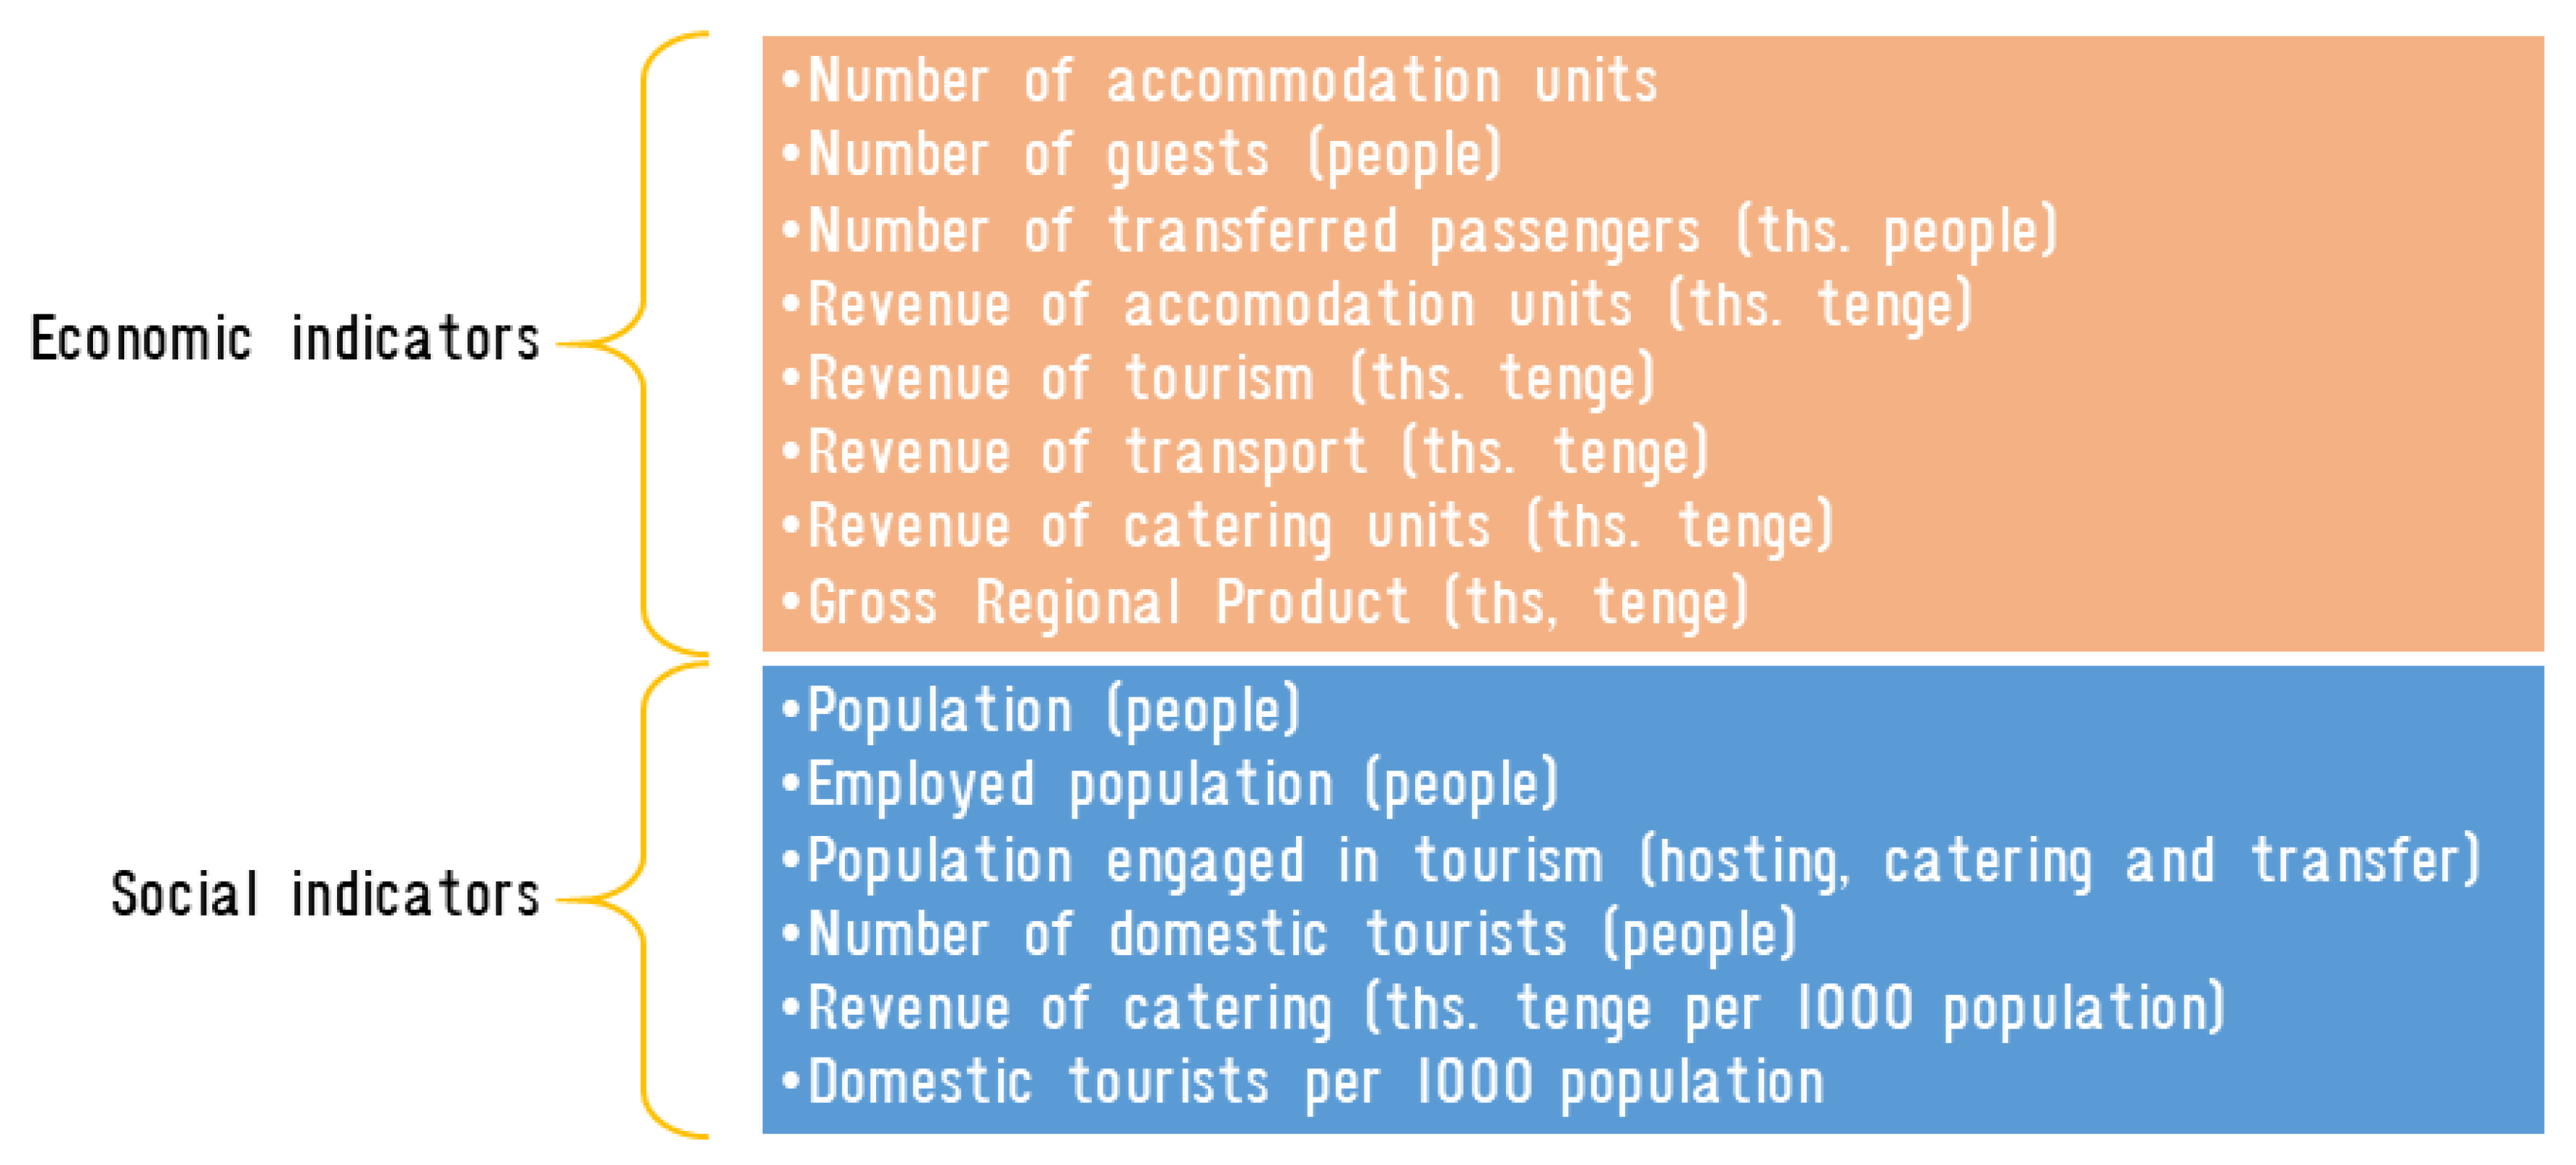
| Economic efficiency indicators | ||||
| Number of accommodation units | 0 | 0.34 | 0.48 | 1 |
| Number of guests | 0 | 0.31 | 0.62 | 1 |
| Number of transferred passengers | 0 | 0.28 | 0.87 | 1 |
| Revenue of accommodation units | 0 | 0.19 | 0.47 | 1 |
| Revenue of tourism | 0 | 0.1 | 0.53 | 1 |
| Revenue of transport | 0 | 0.09 | 0.41 | 1 |
| Revenue of catering units | 0 | 0.21 | 0.86 | 1 |
| Gross Regional Product | 0 | 0.19 | 0.59 | 1 |
| Social efficiency indicators | ||||
| Population | 1 | 0.24 | 0.21 | 0 |
| Employed population | 0.22 | 0.78 | 0.62 | 0 |
| Population engaged in tourism | 0 | 0.23 | 0.49 | 0.78 |
| Number of domestic tourists | 0 | 0.1 | 0.64 | 1 |
| Revenue of catering per 1000 population | 0 | 0.21 | 0.85 | 1 |
| Domestic tourists per 1000 population | 0 | 0.1 | 0.63 | 1 |
| Indicator | Weight | Weight | |
|---|---|---|---|
| Economic efficiency indicators | Social efficiency indicators | ||
| Number of accommodation units | 0.12 | Population | −0.31 |
| Number of guests | 0.13 | Employed population | −0.04 |
| Number of transferred passengers | 0.13 | The population engaged in tourism | 0.32 |
| Revenue of accommodation units | 0.13 | Number of domestic tourists | 0.34 |
| Revenue of tourism | 0.13 | Revenue of catering per 1000 population | 0.34 |
| Revenue for transport | 0.12 | Domestic tourists per 1000 population | 0.34 |
| Revenue of catering units | 0.12 | ||
| Gross regional product | 0.13 |
| Year | Economic Efficiency | Social Efficiency | Calculated Integral Efficiency | Modeled Integral Efficiency |
|---|---|---|---|---|
| 2003 | 0 | −0.32 | −0.32 | −0.32 |
| 2004 | 0.04 | −0.2 | −0.16 | −0.16 |
| 2005 | 0.06 | −0.12 | −0.06 | −0.06 |
| 2006 | 0.12 | −0.05 | 0.07 | 0.07 |
| 2007 | 0.2 | 0.11 | 0.31 | 0.31 |
| 2008 | 0.21 | 0.1 | 0.31 | 0.31 |
| 2009 | 0.24 | 0.34 | 0.58 | 0.58 |
| 2010 | 0.37 | 0.57 | 0.94 | 0.94 |
| 2011 | 0.46 | 0.63 | 1.09 | 1.09 |
| 2012 | 0.53 | 0.71 | 1.24 | 1.24 |
| 2013 | 0.61 | 0.79 | 1.4 | 1.4 |
| 2014 | 0.71 | 0.87 | 1.58 | 1.58 |
| 2015 | 0.71 | 0.92 | 1.63 | 1.63 |
| 2016 | 0.81 | 0.94 | 1.75 | 1.75 |
| 2017 | 0.84 | 1.1 | 1.94 | 1.94 |
| 2018 | 1.01 | 1.27 | 2.28 | 2.28 |
© 2019 by the authors. Licensee MDPI, Basel, Switzerland. This article is an open access article distributed under the terms and conditions of the Creative Commons Attribution (CC BY) license (http://creativecommons.org/licenses/by/4.0/).
Share and Cite
Aliyeva, S.; Chen, X.; Yang, D.; Samarkhanov, K.; Mazbayev, O.; Sekenuly, A.; Issanova, G.; Kozhokulov, S. The Socioeconomic Impact of Tourism in East Kazakhstan Region: Assessment Approach. Sustainability 2019, 11, 4805. https://0-doi-org.brum.beds.ac.uk/10.3390/su11174805
Aliyeva S, Chen X, Yang D, Samarkhanov K, Mazbayev O, Sekenuly A, Issanova G, Kozhokulov S. The Socioeconomic Impact of Tourism in East Kazakhstan Region: Assessment Approach. Sustainability. 2019; 11(17):4805. https://0-doi-org.brum.beds.ac.uk/10.3390/su11174805
Chicago/Turabian StyleAliyeva, Selvina, Xi Chen, Degang Yang, Kanat Samarkhanov, Ordenbek Mazbayev, Aday Sekenuly, Gulnura Issanova, and Sadyrbek Kozhokulov. 2019. "The Socioeconomic Impact of Tourism in East Kazakhstan Region: Assessment Approach" Sustainability 11, no. 17: 4805. https://0-doi-org.brum.beds.ac.uk/10.3390/su11174805