The Assessment of Non-Financial Risk Sources of SMES in the V4 Countries and Serbia


1
Institute of Applied Informatics and Logistics, Faculty of Economics and Business, University of Debrecen, 4032 Debrecen, Hungary
2
Center for Applied Economic Research, Faculty of Management and Economics, Tomas Bata University in Zlín, 760 01 Zlin, Czech Republic
3
Faculty of Economics and Social Sciences, Szent István University, 2100 Gödöllő, Hungary
4
Department of Economics, Faculty of Operation and Economics of Transport and Communications, University of Zilina, 010 15 Zilina, Slovakia
5
Institute of Sectoral Economics and Methodology, Faculty of Economics and Business, University of Debrecen, 4032 Debrecen, Hungary
*
Author to whom correspondence should be addressed.
Sustainability 2019, 11(17), 4806; https://0-doi-org.brum.beds.ac.uk/10.3390/su11174806
Submission received: 14 July 2019
/
Revised: 11 August 2019
/
Accepted: 31 August 2019
/
Published: 3 September 2019
(This article belongs to the Special Issue Optimal Decisions and Risk Assessment in Sustainable Supply Chains)
Abstract
:Risks are a very important part of the business environment. If risks are managed well, they can provide a higher level of competitiveness and sustainability advantages for a company. The first step towards successful risk management is an identification of risks. The aim of this article is to create a risk profile for (small and medium-sized enterprises) SMEs in V4 countries (Czech Republic, Slovakia, Poland, Hungary), compare them to each other and then compare the results with those for Serbia. The data were collected during an extensive research project organized by Tomas Bata University in Zlín in 2017 and 2018. In total 2110 answers of SMEs were analyzed. For the verification of hypotheses, a 5-point Likert scale, Multiple Correspondence Analysis (MCA) and Multiple Factors Analysis (MFA) and ANOVA were used. The level of legal, security, personnel and operational risks is statistically higher in Serbia than in V4 countries, and the lowest level is in Slovakia. Some significant differences among the exposure to risk according to economic sectors were identified.
Keywords:
risk management; sustainability; Multiple Correspondence Analysis; Multiple Factors Analysis; small and medium-sized enterprisesJEL Classification:
G32; K22; M121. Introduction
Risks are an integral part of the operations of every business. The most important impacts of the risks are felt in small and medium-sized businesses (SMEs), which are considered to be the most important part of the world economy and an engine of economic growth [1,2,3,4]. SMEs account for 99.8% of all companies in both V4 and EU countries [5]. Many researchers agree that SMEs are not only crucial for the growth of a country’s Gross Domestic Product, but also for the social and economic development of the entire world [2,6,7]. Particularly in times of high globalization, small enterprises must face high competition and pressure from low-cost countries [8]. More than 70% of SMEs contend with a lack of sustainability and do not survive beyond five years [9]. Supporting the sustainability of SMEs is vital for the entire economy [10]. One should also remember that the dynamics and uncertainty of the business environment greatly complicate the decision-making processes for the company’s executives and managers [11].
SMEs grow faster than larger companies and are often confronted with major challenges which bring many risks [12,13,14,15]. These types of companies are more sensitive to economic development, but on the other hand they are also more flexible and adaptable to changes [16]. Because of globalization and a rapidly changing market environment, businesses must face new forms of business risk [17] as without risk, there would be no motivation to conduct business [18]. Setyawan et al. [19] state that the traditional concept of risks has been extended to several new concepts. Disaster, terrorism, catastrophic expenditure, and corruption are now included among business risks [20].
The economic and social environment in a country is a major contributor of risks and can determine some sources of risks. The Visegrad bloc (Czech Republic, Slovakia, Poland, and Hungary) is considered as an important formation in the European economic system, containing member countries with similar levels of economic and social development [21]. Macroeconomic factors play an important role in the context of the business environment and the daily decisions of enterprises [22,23]. The state regulating entrepreneurship also plays an important role [23,24,25,26].
V4 countries have always been part of a single civilization sharing cultural and intellectual values and common roots in diverse religious traditions. In order to preserve and promote cultural cohesion, the Visegrad Group intends to promote cooperation, the sharing of values in the fields of culture, education, and science, and the exchange of information. Although these countries are members of the V4, their historical development, which provided the roots of industry, was not entirely consistent [21]. The Visegrad Group has been analyzed from many perspectives. One of these perspectives is the GCI (Global Competitiveness Index). It was found that the Czech Republic has the highest position, followed by Poland and Hungary, with Slovakia in the last position [27]. Serbia as a part of the Balkan area has a different historic development and economic and social environment in comparison with the V4 countries. However, Serbia is one of the candidate countries to be a member of European Union, while the other studied countries are already EU members. Therefore, the paper analyzes the sources of risks in V4 countries and compares them with the same analysis in Serbia. Serbia was chosen for a comparison because of the general expression of the differences in the assessment of the risks and risk management between countries from the European Union and other non-members of European Union. Serbia was selected as a candidate country and as a sample country, reflecting the significant progress made so far in structural and institutional reform. The very different assessment of Serbian SMEs can threaten their activity in the European market and the process of the internalization of the companies that is carried out in order to profit from the benefits which the EU offers in this area.
This article focuses on operational, personnel, security, legal and other business risks which SMEs face in business operations. The first part of the article analyzes SMEs and risks in general. This is followed by a detailed analysis of risks. In the second part, the aim, methodology, and hypotheses of the article are presented. The next part features the main results, while the last part focuses on a discussion of the result and main conclusion.
2. Literature Review
Many definitions of SMEs are used around the world. Because of the focus of the article, we will use the SME definition of the EU according to Official Journal of the European Union [28] based on the number of employees, turnover and the total value of the balance sheet. SMEs have several positive characteristics connected to their size (a higher level of flexibility and faster development of their strategies). On the other hand, negative signs can also be noticed (limited markets, a lower degree of diversification, higher risk level [29,30].
SMEs give work to 66.4% of all employees in the Czech Republic, to 72% in Slovakia, 68.1% in Poland, 88.8% in Hungary, and 66.4% in the European Union. In Serbia the situation is very similar—64.8% of all employees were employed in the SME segment in 2017. The number of employees and the value added from SMEs are both of great importance. The value added from small and medium-sized companies is around 50% across the V4 countries (the Czech Republic 54.7%, Slovakia 52.5%, Poland, 51.4% and Hungary 53.7%) and the EU-28 (56.8%). SMEs in Serbia contribute a value added figure of 9.2 billion EUR, which represents 55% of the total value added [31,32,33,34,35]. Economic progress is determined mainly by the survival of small and medium enterprises [36].
The first definition of risk was created by Bernoulli in 1738 as a geometric mean which was used for measuring risk and minimizing its spread [37]. Nowadays, the term risk has several definitions. Belás et al. [38] established in their research that perceptions of corruption is different between the Czech Republic and Slovakia. Perceived corruption is at a statistically significant lower level in the selected regions of the Czech Republic in comparison with Slovakia. Tibor et al. [39] and Meyer [40] define a risk as a potential occurrence of an unfavorable event. Božek and Urban [41] consider risk from a quantitative and qualitative perspective. The qualitative aspect defines a risk as a possibility that an undesirable event will occur. From the quantitative perspective, a risk is defined as a loss which can be expressed in money or other units. Buganova and Luskova [42] warn that there are many risks and risk consequences in business decision making. The condition for decision making is rarely perfect, and from these situations risks can arise. These risks can also be defined as business risks. Various authors classify business risks differently. Myšková and Doupalová [43] divided risks into two groups. In the first group risk is seen as an opportunity, while in the second the focus is on the negative side of risk, which can be characterized as a threat of loss. Doering and Parayre [44] and Mu et al. [45] created three groups of risks connected to a new project—technological risk, market risk, and organizational risk. Verbano and Venturini [46] classified nine groups of risks—financial risk, strategic risk, engineering risk, project risk, disaster risk, enterprise risk, insurance risk, supply chain risk, and clinical risk. It is mainly technical, financial, economic and political risks that are important for the SME segment and have a significant impact on business [47,48,49]. For comparison, the results for Central and Eastern Europe shown the following top 5 risks: over-regulation (38%), climate change and environmental damage (36%), changing consumer behavior (36%), cyber threats (30%), and uncertain economic growth (27%). In conclusion, besides geopolitical uncertainty, the perceived risks correspond with top risks in general [50].
Shortcomings in risk identification and inadequate implementation of risk management can cause problems for SMEs in terms of competitiveness and sustainability. Sustainability has become crucial for SMEs, which face great pressure from large firms. The majority of SMEs have little knowledge about the application of sustainable practices [9]. What is more, small enterprises are often undercapitalized and do not have enough resources for the operational running of processes. Therefore, sustainability is pushed into the background for economic reasons [51,52]. Sustainability in the context of SMEs has been the focus of many researchers, who also highlight the importance of risk management in this context [53,54,55]. A risk management process is a dynamic phenomenon and requires the continuous focus of management. It is also very important in the internalization of the company’s activities. In this process, the extensive requirements involved in the process of risk management can be identified [47,48,49].
Operational risk can be defined as business challenges and risks connected to the people, systems and process utilized by companies. It can also include other classes of risks such as legal risk, fraud risk, supply-chain risk, and environmental risk [56]. The most common operational risk is connected to the innovation process and its regular updating. Innovation is necessary to maintain business efficiency during the whole business process [57]. Sen and Ghandforoush [58] warn about the need to have technological and market knowledge when implementing innovation. Sustainable companies should create a development system to follow the best local practices. This system should involve the following practices: establishing a sustainable supply chain, initiating an innovative program for recycling, reducing innovation barriers, engaging strategic sustainable practices, and creating strategies for effective resources [59]. SMEs need to implement innovations in their processes in order to meet regulations and achieve competitiveness in sustainability [60]. Their absence can cause an operational risk.
Gao et al. [57] confirm that some businesses has a significant problem with understanding and dealing with the regulation of business. There are many areas that are relevant to businesses from the legal point of view. One of the most discussed regulatory topics is the EU´s General Data Protection Regulation (GDPR), which can represent a relatively high risk area. GDPR aims to tighten consumer safeguards around data disclosure. No prosecution has used the full scope of possible penalties yet—the regulation allows a fine of up to 4% of global revenue to be issued—but companies are wary of a sizeable additional loss associated with, for example, a major data breach due to negligence. Other areas of GDPR may have attracted less attention, but still pose significant potential sources of operational, security, and legal risk. Companies must provide customers with access to their own data, including the ability to correct or erase it in some cases; and they must report a data breach within 72 hours. New regulations are also offering up enticing targets for hackers [61]. In the research of reference [62], complicated legal procedures that regulate work were found to be one of the main obstacles to the successful development of businesses, followed by difficulties in the collection of receivables from debtors, high tax rates and employer contributions on wages, the negative impact of the global economic crisis, and expensive and complicated procedures for obtaining loans from commercial banks. Rahman et al. [63] declares that SMEs have a significant problem with sources of finance due to information opacity and their lack of physical assets.
According to Leach [64], many enterprises define security risk as potential direct and indirect losses due to the misuse, damage, destruction or unavailability of information. Access to information is a major challenge and one of the problems of SME sustainability [65]. Also, the study by Muller et al. [66] confirms the importance of resources, information and innovation capabilities as key preconditions for the sustainability of SMEs. Ušiak [67] tried to define the security environment of the Visegrad countries in both its narrow and broader senses. According to the author, state security policy is not created in a vacuum. Policy-making is affected by external and internal variables and influences the security environment, as well as responses to all of these factors. His findings highlighted significant challenges now affecting the security policies of all V4 countries including defense budgets, the crisis in Ukraine, the positions of EU member states, and growing nationalism and extremism.
Emphasizing the risks related to labor systems within SMEs active in the manufacturing industry was also the aim of the research conducted by Dumitrescu and Deselnicu [68]. The authors state that compared to other industrial sectors, manufacturing processes imply a high interaction between operator and equipment, hence new technology generates emerging risks which require adequate understanding and counter-measures. Personnel risks have appeared with the ongoing process of the division of labor and changes in the nature of labor [69]. Risks related to labor system may be generated from human resources errors, inadequate job descriptions, dangerous equipment, improper social relationships between employees, and/or physical/environmental factors [70]. Epstein and Rejc Buhovac [56] stated that SMEs face difficulties in filling job vacancies and obtaining inadequately trained staff.
The process of risk identification and risk analysis can be crucial for enterprises. Risks are no longer threats which should be avoided, but, in many cases, can be opportunities. Entrepreneurs must apply appropriate methods for risk management [71,72]. Dvorský et al. [73] state that small and medium-sized enterprises perceive risks more intensively in comparison with the pre-crisis era. They should implement risk management to avoid crises. During the research, it was established that the risk management processes of larger companies are more developed than the processes of small firms, which have a rather passive approach to risk management [74]. Risk management is perceived as one of a set of key tools known as sustainability management tools [75].
3. The Aim and Methodology
The main objective of the article is to create a risk profile for SMEs in V4 countries (Czech Republic, Slovakia, Poland, and Hungary), compare them to each other and then compare the results with Serbia, as a country that would like to join the European Union. The partial objective is to measure the importance of source of risks by selected non-financial risks (operational, personnel, security, legal and other business risks such as corruption and clientelism). The paper which focused on financial risks using data from this research has been already published [76]. For this reason, financial risks are not covered in this paper.
The data were collected during an extensive research project organized by Tomas Bata University in Zlín in 2017 and 2018. The same questionnaire was administered in all countries in the form of an on-line survey. Managers or risk managers of SMEs were asked to complete the questionnaire. The study covers 2110 small and medium-sized enterprises (408 respondents in the Czech Republic, 487 in Slovakia, 498 in Poland, 388 in Hungary and 327 in Serbia). The entrepreneurs were selected from national databases using the random selection method (the Czech Republic–Albertina Database, Slovakia–Cribis Database, Poland–Central Registration and Information on Business, Hungary–Hungarian Chamber of Commerce and Industry, and the Serbia–Statistical Office of the Republic of Serbia).
The questionnaire was divided into two parts. The first part covered general questions aimed at analyzing social and demographic factors, such as the gender and age of entrepreneurs, their education, the size of the company, the length of their business operations, and the region and sector of their business. The second part included questions about risks and their sources and the methods of risk management. The information about the sample and each category analyzed in the research are shown in Table 1 below.
Trading activity, and other services and industries were the first 3 dominant sectors in the sample. Czech and Slovak firms were the most experienced firms regarding international presence, length of business, and risk management.
Economics factors were included as characteristics of the countries (Table 2) in order to provide a better comparison and to better establish the hypotheses.
GDP per capita shows increasing economic activity for all of the studied countries, especially for Hungary and Poland. The development in material living standards was the lowest in the case of the Czech Republic. Interestingly, the percentage change in this indicator is relatively high in Serbia. Consumer prices increased the most in Hungary and the inflation rate was the lowest for Poland. The highest unemployment rate can be observed in Slovakia within the V4 group and the lowest was found in the Czech Republic. The unemployment rate is several times higher in Serbia then in the V4 countries. The volume changes in industry as well as the production activity grew enormously in Hungary while the largest growth can be seen in Poland, with a base year of 2015.
Regarding resource efficiency, the Czech Republic used its resources in a more sustainable manner than any other V4 country. Surprisingly, resource efficiency in Serbia in 2018 surpassed the level of all V4 countries except the Czech Republic. Slovakian foreign trade is the best balanced, and Serbia has more imports then exports. Hungary is among the V4 countries with the highest poverty rate, with a quarter of the population living in extreme poverty. This proportion is higher in Serbia, with almost a third of the population living in below the poverty line. The gross domestic consumption of energy was the highest in Poland and the lowest in Slovakia and Serbia.
Firstly, the group of risks were created according to the critical literature review of previous research. The common risk indicators which caused the risks were formulated on the basis of the major indicators mentioned, mainly in the findings of the European Commission and the World Bank. Table 3 presents the major indicators which helped to establish our hypotheses. Superscript letters indicate the risk source a given index belongs to.
Based on the indicators presented above, we could assume the following statements and hypotheses:
Serbia is more exposed to every source of risk. The chance of corruption and terrorism are higher, and the political stability and strength of legal rights is weaker. Hence, we could expect an increased level of legal and security risks, as well as a lower level of business confidence in the country. Because the capacity utilization could also be lower and the number of employees has fluctuated over recent years, we also presume there is a higher level of personal and operation risks in Serbia.
Hypothesis 1 (H1).
The level of legal and personal risks is statistically higher in Serbia than in V4 countries.
Furthermore, it can be seen that the proportion of company spending on security is the highest in the Czech Republic, Slovakia and particularly in Poland. For this reason, we can anticipate a lower level of security risk within these countries. In contrast, Hungary and Serbia should be facing higher security risks as the proportion of firms paying for security is rather small.
Hypothesis 2 (H2).
The level of security and operational risks is statistically more significant in Hungary and Serbia than in the Czech Republic, Slovakia and Poland.
Slovakia has extremely low indices values on terrorism and catastrophic expenditure and has the highest values on capacity utilization; political stability in Serbia is also very strong. Therefore, we suggest there is a lower level of security, operational challenges, and risks. On the other hand, we can observe a relatively higher level of corruption and a decreasing level of business confidence according to the latest findings, compared to the other countries in the Visegrad group. Hence, we can expect that business confidence is more vulnerable in Serbia than in other V4 countries.
Hypothesis 3 (H3).
The security, operational and personal risks are statistically lower in Slovakia than in other countries.
The Czech Republic presented a more mixed picture regarding risk sources. Although political stability is highest in this country, the strength of legal rights is relatively weak and the chances of terrorism is extremely high compared to the other V4 countries. The latest business confidence statistics showed stagnation, and we could expect an increased level of legal and business risks in the country.
Hypothesis 4 (H4).
The legal risks in the Czech Republic are statistically higher than in other countries.
Certain economic sectors, such as industry, construction, and agriculture are more highly exposed to operational risks (e.g. because their dependence on the weather) and personal risks (e.g., because of the higher probability of accidents and injury) in comparison with tourism. On the other hand, transportation and logistics should be more exposed to security risks than other economic sectors.
Hypothesis 5 (H5).
There are some significant differences among the exposure to risk according to economic sector.
To measure attitudes to the source of risks, a 5-point Likert scale was used. Multiple Correspondence Analysis (MCA) was used to create a joint map of the studied countries, firm sectors, and the important risk factors in such a way that a given country or sector should be located relatively closer to the risk factors it is more exposed to, and relatively far from risk factors which are relatively less important for the country or sector. MCA is an extremely useful tool to geometrically study the relationships between qualitative data and capture patterns in the dataset. A so-called “object score plot” should be created to detect special patterns and clusters. Multiple correspondence analysis was applied to show the impact of interactions with KIBS (Knowledge-Intensive Based Services) on the innovation capacities and behavior of SMEs [78]. Ramadan [79] applied this method to study the internationalization strategies of innovative SMEs in Lebanon. Lin and Lin [80] used correspondence analysis to study the effect of network relationship on the performance of SMEs.
Multiple Factor Analysis was used for a determining the number of general and group factors and displaying the groups of variables created with similar connections to each risk. MFA can work with both continuous variables as in Principal Component Analysis (PCA) and categorical variables as in MCA. In order to make different groups of variables comparable, a PCA is performed on each group as the first step, which is normalized or weighted by dividing all its elements by the square root of the first eigenvalue obtained from the PCA [81]. In the second step, a global PCA is performed on the normalized data matrix. The analysis can be performed by FactoMiner, an R software package for Multivariate Analysis [82]. Similarly to MCA, observations are represented in a lower dimensional space and the coordinates of the points are called factor scores. MFA provides a special concept of partial factor scores which enables us to position each observation from the perspective of the different groups of variables. MFA has recently been used in various scientific areas such as agriculture [83], statistics [84], chemometrics [85], health and medicine [86], and psychology [87]. MFA is a descriptive technique but also provides the factor scores on both dimensions (by Countries and by Sectors) which were used in further statistical analysis, such as the ANalysis of Variance/ANOVA/. We also used Bonferroni corrected p-values in pairwise multiple comparisons.
4. Results
The country with the highest risk perception is Hungary. All given risks in Hungary are considered to be important by businesses operating there. In Poland and Serbia only three of the given risks are highly important. For the Czech Republic the most important type of risk is personal risk, while in Slovakia all risks are considered to be below average importance. All the results can be seen in the Table 4 below.
In each risk group, 4 risk sources were defined. The source of each risk group and their average scores measured by a 5-point Likert scale can be seen in the following Table 5.
Table 5 suggests that Hungary and Serbia have very similar risk profiles, with special regard to operational and business risk sources. The level of business risk sources is the lowest in Poland, and Slovakian companies are quite exposed to business and legal risks.
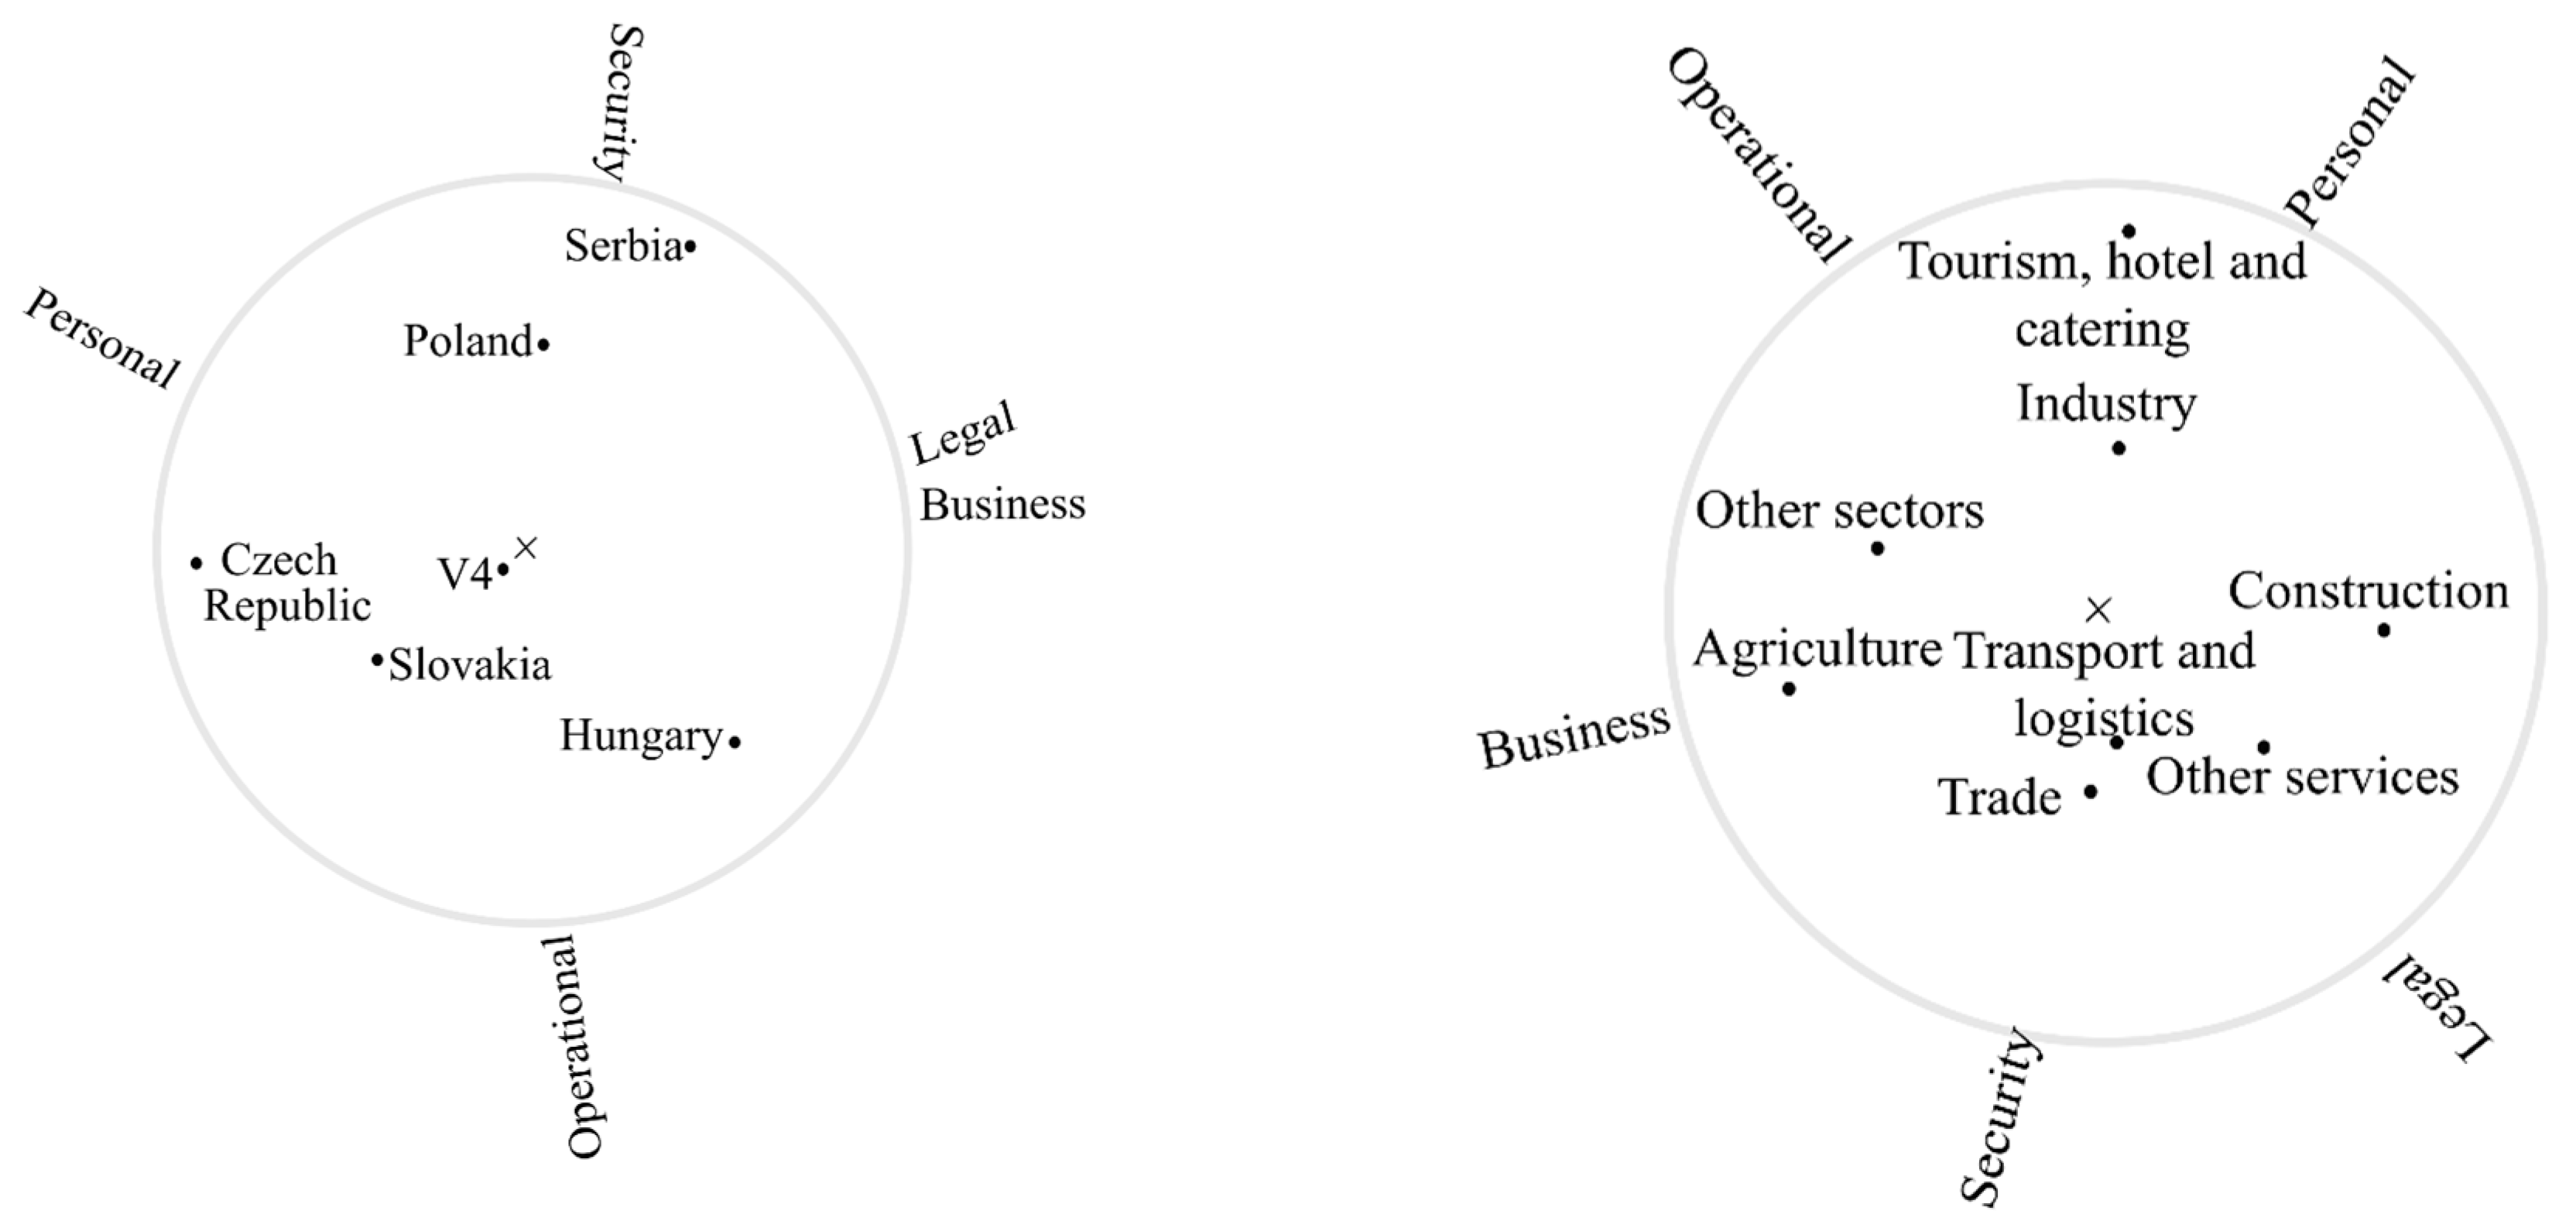
Figure 1 presents the result of the MCA, which was based on the proportion of companies from different countries who considered various risk sources to be of key importance. It can be seen that all the V4 countries lie near the average point, as expected. While examining the countries one by one, different patterns can be recognized. For example, in the case of Hungary, special emphasis has to be placed on operational, business and legal risks as key important sources compared to the other countries. Companies from Poland especially considered personal and security risks as key sources of risk. In the case of Serbia, legal, security and business risks stand out. Companies from the Czech Republic faced an above average level of personal risks. Slovakia has a very similar risk profile to the Czech Republic with the exception that personal risks are less important there.
Figure 1 also shows the different sectors with respect to the key important risk sources by using a Moon plot. For the tourism, hotel and catering, and the industry sectors, it is mostly the personnel and operational risks which are of key importance. Regarding construction companies, legal and personnel risk sources are of key importance, while trade and transportation and logistics companies mainly face legal and security risks. In the agricultural and other sectors, the most crucial risk sources are operational and business risks.
In the next step we present the results and figures from the MFA. The countries were depicted on the MFA maps according to the 5 sources of risk. In order to interpret these maps, we should define each dimension and their associations with the studied risk factors.
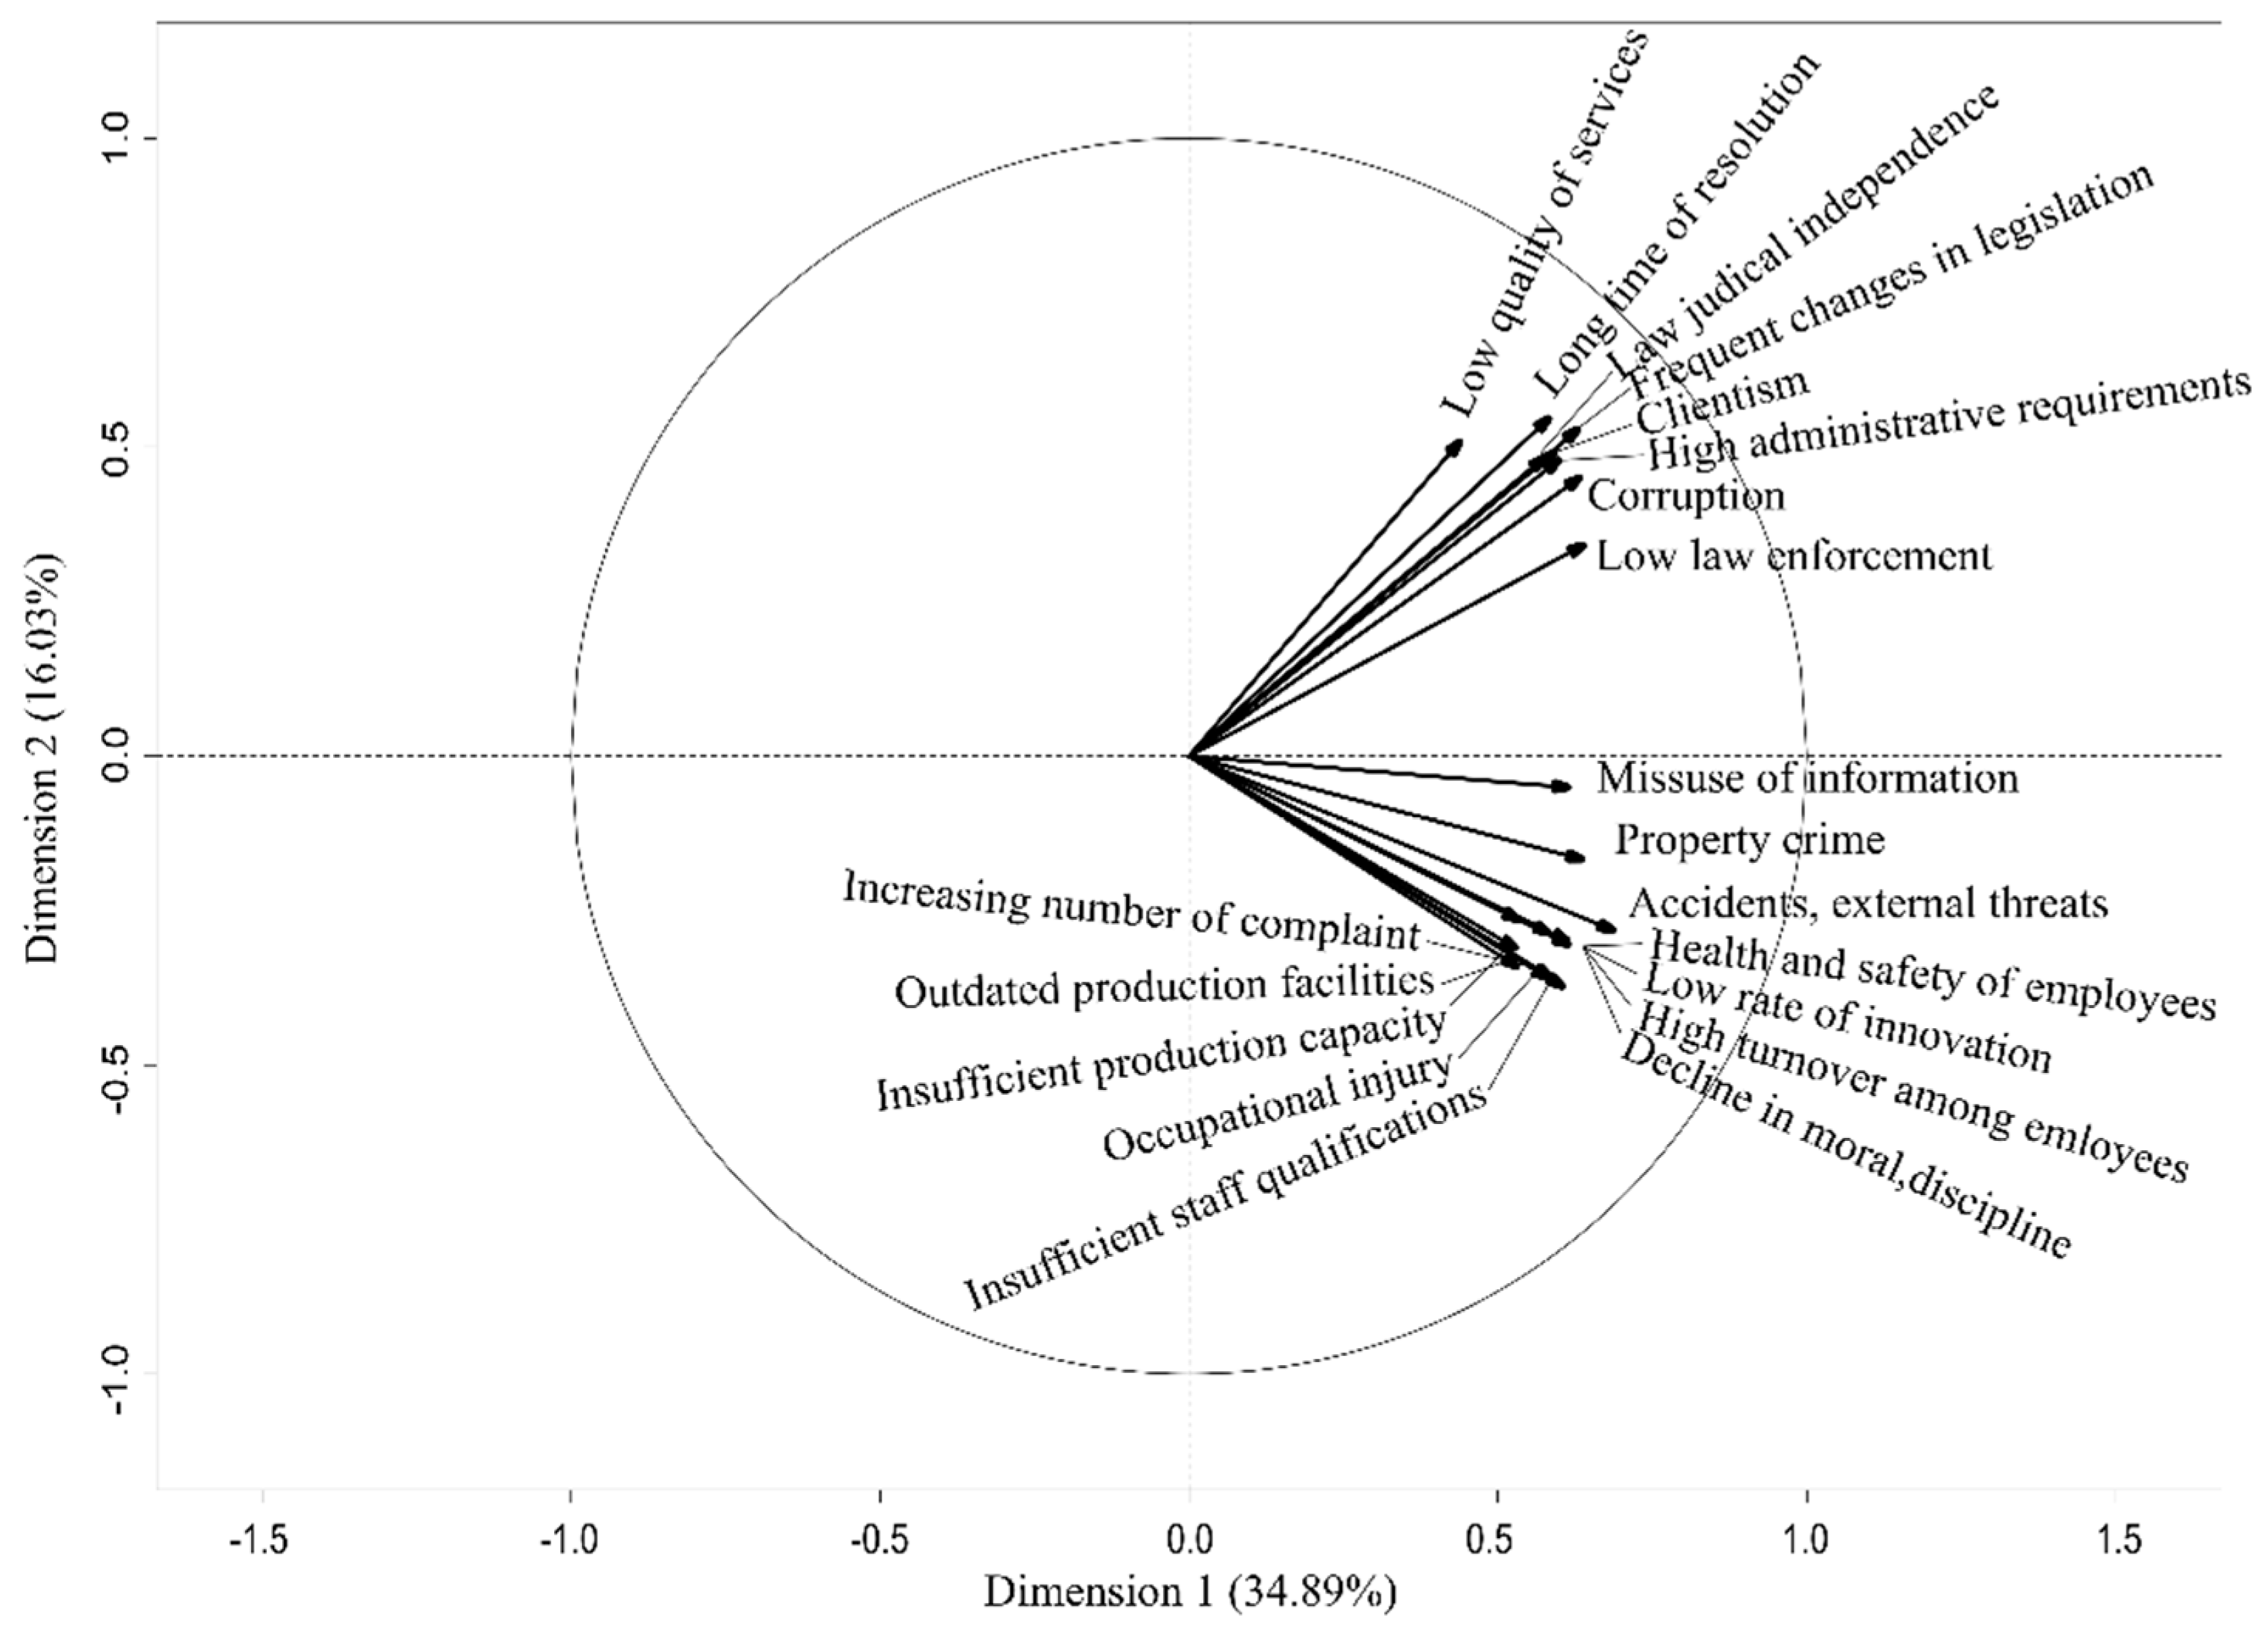
The correlation circle plot shows how much the MFA dimensions correlate with the specific risk factors. It can be seen from Figure 2 that the first dimension is strongly associated with personnel, security and operational risks, most importantly property crime, misuse of information, accidents and external threats and insufficient staff qualifications. The second dimension can be interpreted as business and legal risks, especially the low quality of services, the long times needed for dispute resolution, clientelism, corruption and high administrative requirements. Altogether MFA explains 51% of the total variance, which is a satisfactory result.
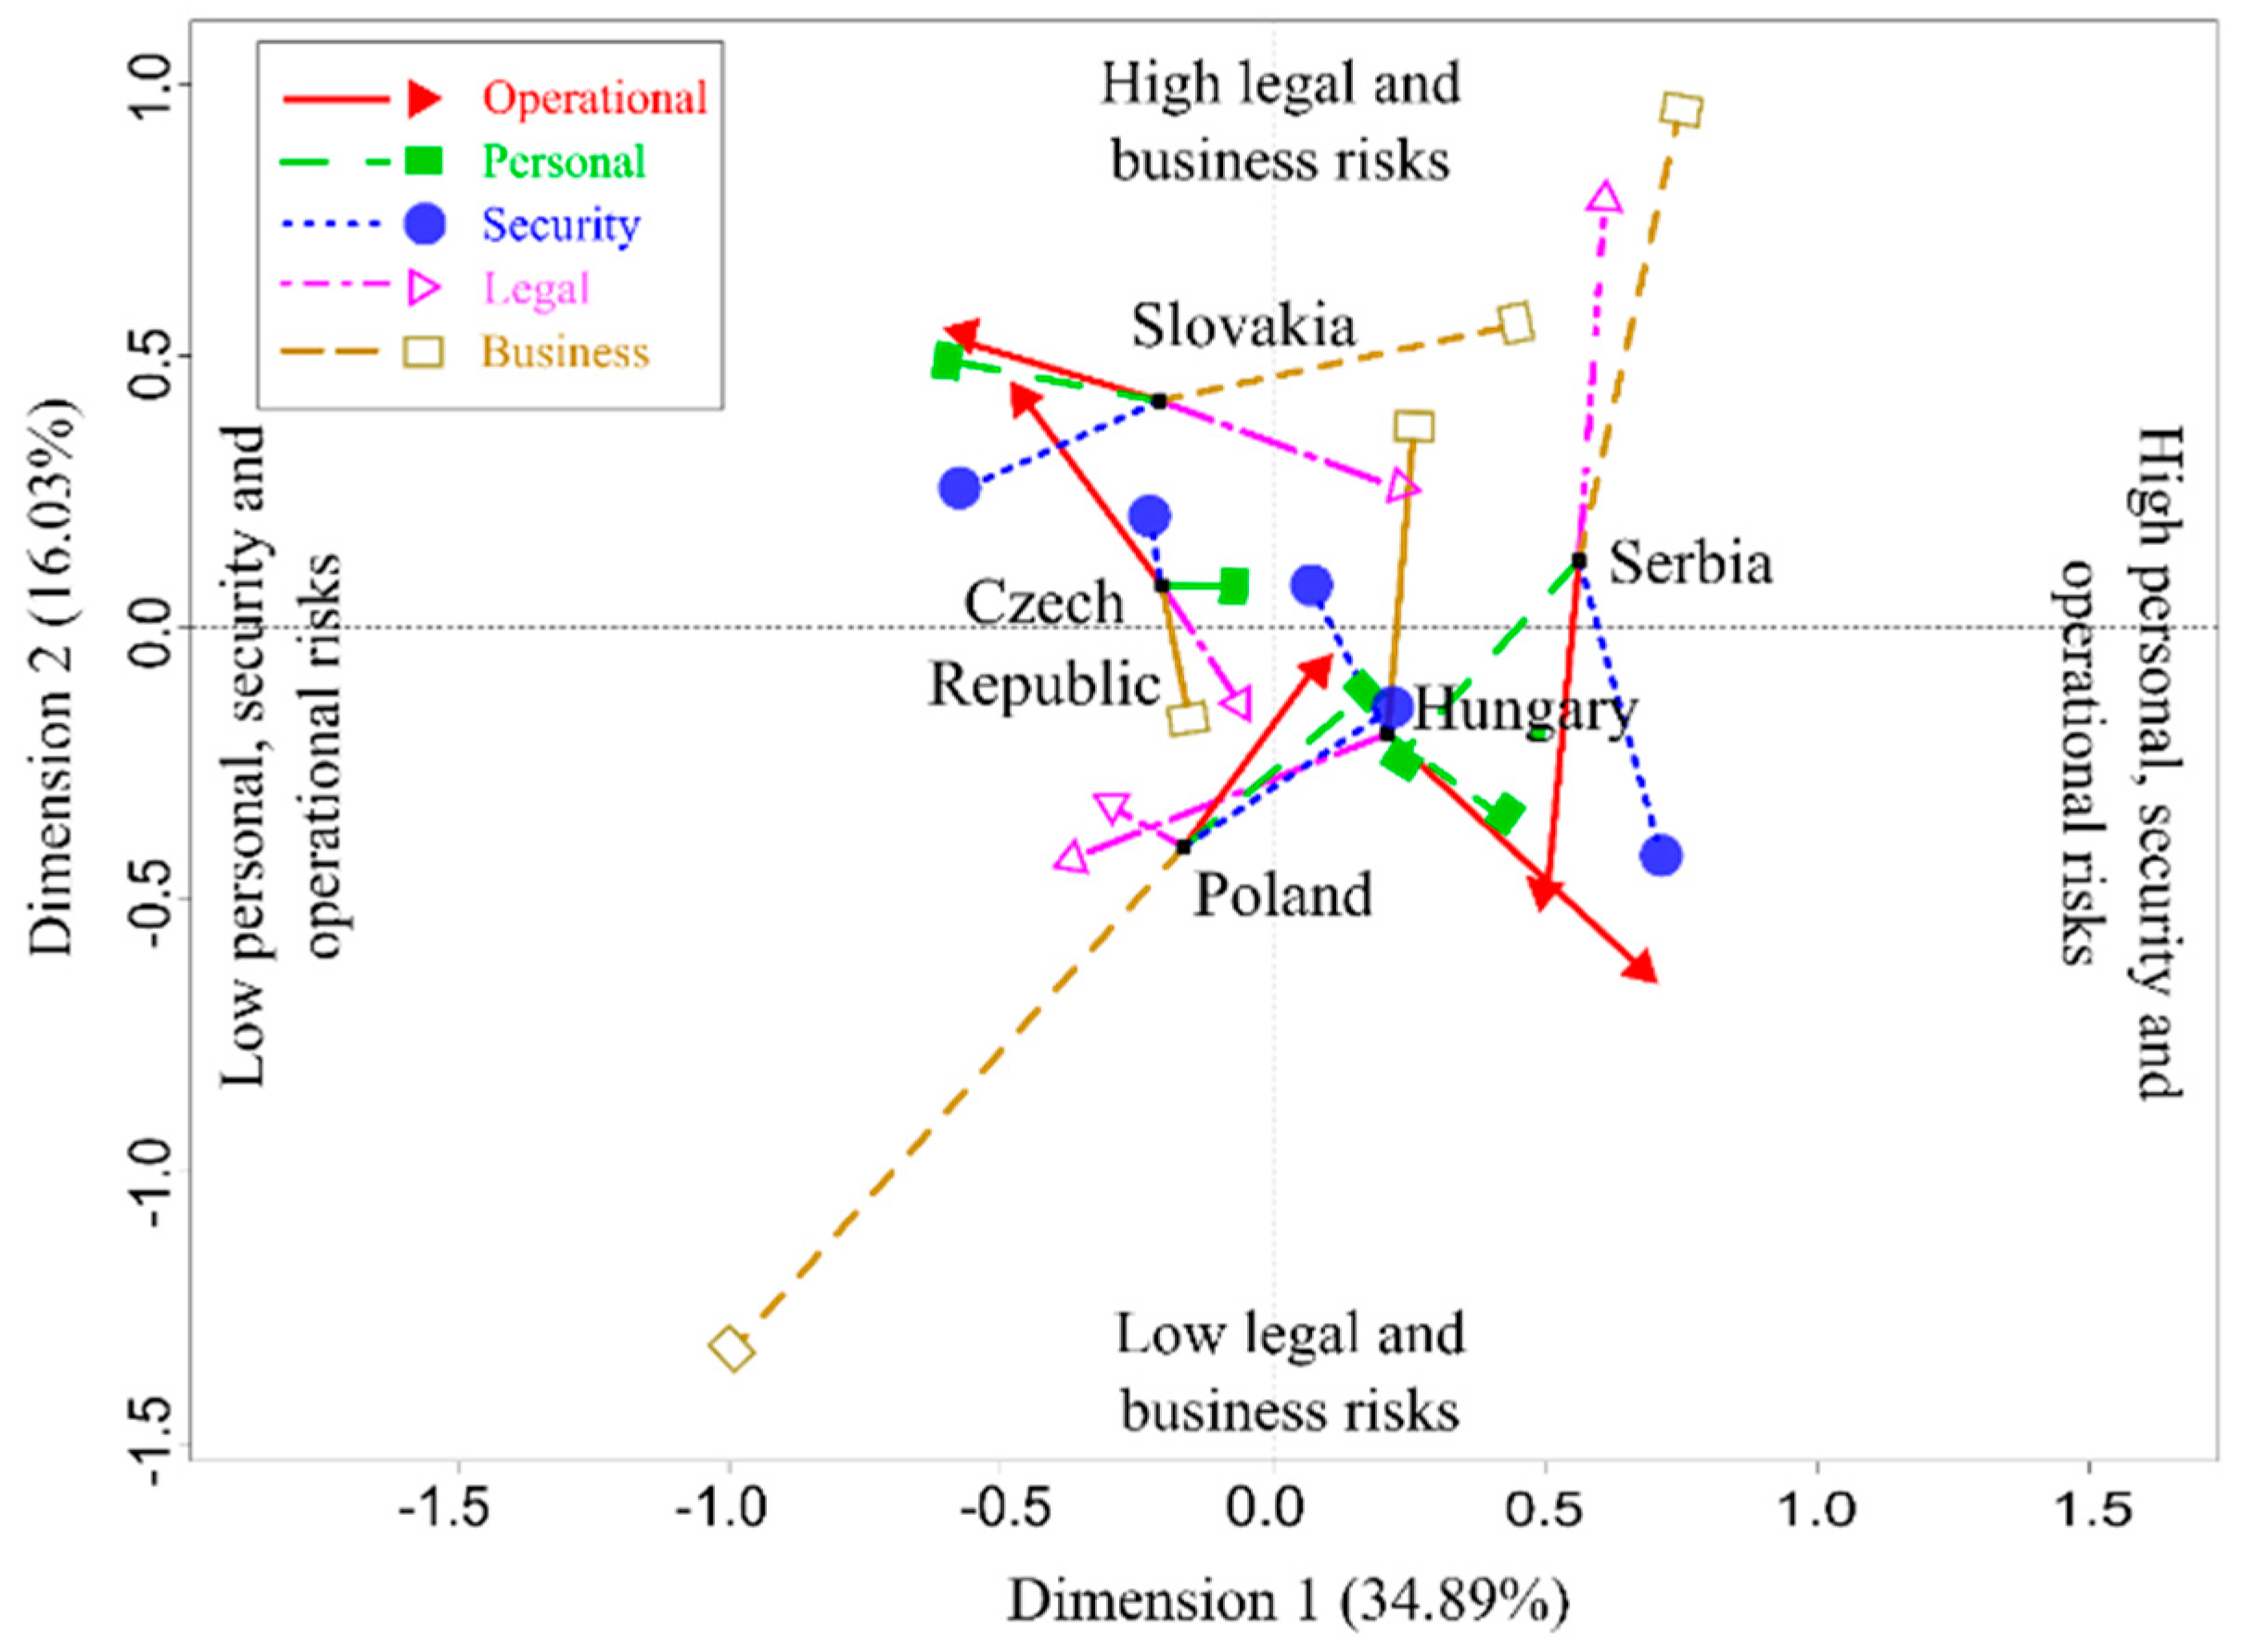
Figure 3 shows each country as a single point on a 2-dimensional map representing the general risk level. The partial points enable us to position each country from the viewpoint of the different risk sources. In this way, we can evaluate the individual risk sources as well as the general or overall risk of a given country. This is the double nature of MFA, so we can interpret the map in two ways. We also have to emphasize that MFA is merely a descriptive technique and further statistical analysis (i.e., the ANOVA) has to be applied to prove the hypotheses statistically. First, we make suggestions for the hypotheses by showing the MFA maps, and then we present the statistical evidence by analyzing the overall and partial MFA factor scores for the first and second dimensions by using ANOVA.
The MFA map can be divided into 4 quadrants. Each quadrant contains countries with a different risk profile. The first quadrant only contains Serbia, which is exposed to legal/business risks and to predominately personnel, security and operational risks. Slovakia and the Czech Republic belong to the second quadrant and mainly face higher than average legal and business risks and have lower personnel, security and operational risks. Slovakia is especially exposed to long times for dispute resolution, clientelism, and high administrative requirements.
Poland seems to be a less risky country, as it is located in the 3rd quadrant, which means a generally lower level of risk. Interestingly, the operational, personnel and security risks are higher in Poland compared to Slovakia and the Czech Republic. The first dimension is related to personal, security and operational risks and mainly separates the Czech Republic and Slovakia from Poland, Serbia, and Hungary. The partial point for Poland denoted by the red triangle indicates operational risks, and the partial point denoted by a green rectangle represents personal risks. Both points are located to the right, indicating higher personal and operational risks compared to the Czech Republic and Slovakia (the same partial points are located to the left, indicating lower operational and personal risks). The reason that Poland is finally located in the bottom of the map, which suggests a better outcome, is because of the extremely low level of business and legal risks which strongly compensates for the relatively higher operational and personal risks faced there.
Hungary is in the 4th quadrant because of its lower legal risks and higher operational and personnel risks, although the partial point of business risk shows greater chances of corruption, low quality of services and higher administrative requirements.
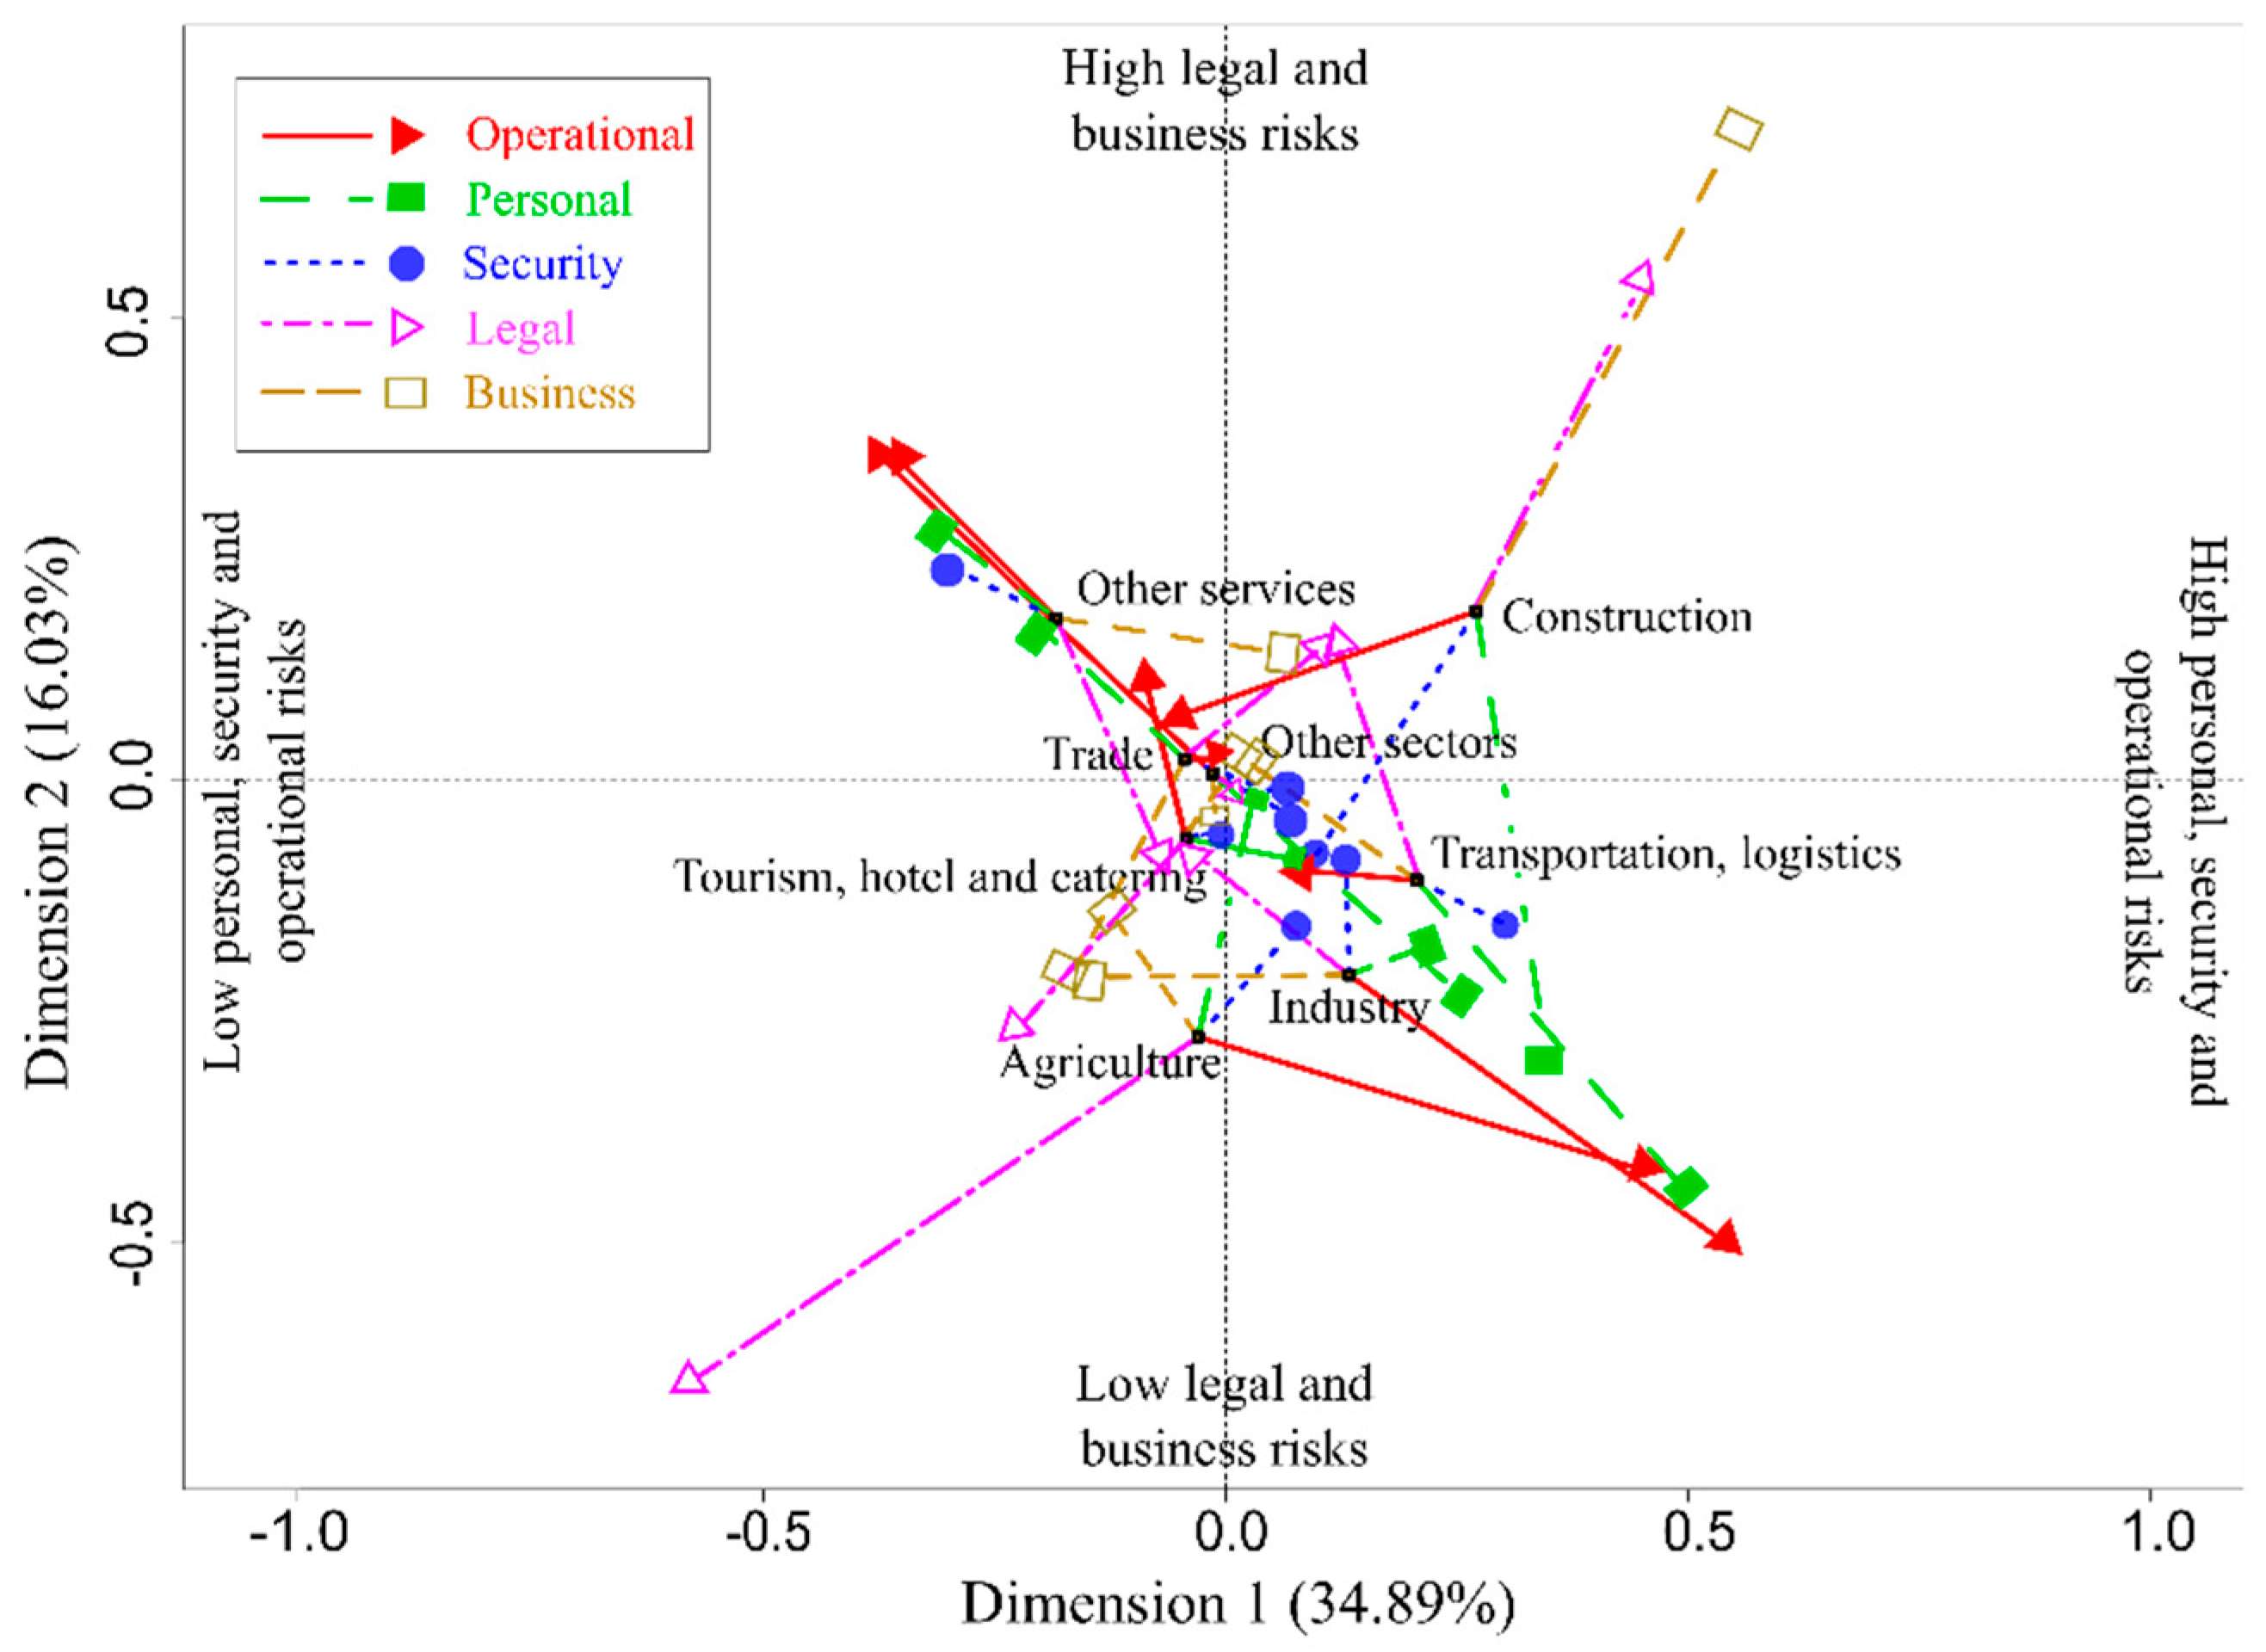
Figure 4 represents the MFA map of each sector according to both the general and partial risk level. We can observe the risk patterns of the different sectors depending on the quadrant they belong to. The construction sector (1st quadrant) is exposed to all sources of risk, especially personnel, legal and business risks. The 2nd quadrant consists of several sectors (other services, trade, other sectors). Trade and other sectors are located near the origin; therefore they are exposed to all sources of risk to an average degree. In the service sector the chances of personnel, security and operational risks are relatively low. The agriculture, and the tourism, hotel and catering sectors face the lowest legal risks, but agriculture is especially exposed to operational risks. The 4th quadrant consists of two very important sectors: the transportation and logistics industries. Both sectors have higher chances of personnel, security, and operational risks. Moreover, industry has the greatest chance of experiencing operational risk, while transportation and logistics have the greatest chance of facing personnel and security risks. Compared to construction, both sectors face relatively low business and legal risks. Based on the MFA map, we could visually cluster the 8 sectors into 5 clusters. Trade, tourism, hoteling and catering, and other sectors are place in the same cluster and exposed to these risk sources to an average degree. Based on Table 5 and on the MFA maps H1, H2, H3, and H5 can be supported.
Table 6 presents the F-statistics from the ANOVA of the MFA factor scores and the pairwise differences between the countries according to risk sources. Countries with different letters have significant differences in a given risk source. For example, regarding security risks, there is no difference between the Czech Republic, Hungary, and Slovakia, but Hungary and Slovakia differ with respect to security risks. It can be seen that there is a statistically significant difference between Serbia and the V4 countries regarding security and legal risks, but this is not the case with personal risk. The level of operational risk is statistically more significant in Hungary and Serbia than in other V4 countries. Studying the overall risk level for the first dimension, it can be stated that Hungary and Serbia have similar patterns and they differ from those in other countries. Therefore, H1 can be partially confirmed, but H2 is true. H3 is also partly true, just for personal risk, but also for security and operational risks Slovakia is not significantly different from the Czech Republic. H4 should be rejected as the Czech Republic is not significantly different in its level of legal risks. On the other hand, F-statistics showed significant differences between the 5 countries regarding each risk source.
Table 7 presents the F-statistics from the ANOVA of the MFA factor scores and the pairwise differences between the sectors according to risk sources. The F-statistics showed significant differences between the 8 sectors regarding each risk source, except for security risks. It can be seen that certain economic sectors, such as industry, trade and construction are more exposed to personal risks. Taking Figure 4 and Table 7 into consideration, it can be stated that agriculture and industry are more exposed to operational risks than other services. Regarding operational, personal, and security risks (overall risk from the first dimension) industry, construction and transportation form a very different cluster to the other economic sectors. Agriculture and tourism, and the hotel and catering sector have to deal with a lower level of legal risks, while construction has to cope with a higher level of legal and business risks. Hence, H5 can be confirmed, as we found some significant differences between economic sectors regarding the exposure to specific risk sources.
5. Discussion and Conclusions
Risk identification is a crucial step in successful risk management. In the SME segment, a lack of risk management can cause the failure of an enterprise. Appropriate risk management as a part of the entrepreneurial orientation of an SME can help also it to internationalize [88]. This article aimed to establish a risk profile for the V4 countries and for Serbia. The sub-questions of the extensive research were designed to analyze a perception of selected risks and their sources from the perspective of entrepreneurs. From the indicators, including the corruption index, business confidence, political stability, and the strength of legal rights among others, 5 groups of risks were defined (legal, security, personnel, operational and other business risks). Five hypotheses were suggested to validate the importance of each risk and the statistical significance of its impact in each country.
The results obtained indicate that the business environment in Serbia is riskier than in the V4 countries [76,89]. Particularly, the level of legal and personal risk in Serbia is higher than in the V4 countries. This can be caused by the different legislation in Serbia, which is not consistent with that of the V4 countries. The consistent and efficient implementation of European legislation and policies needs to be ensured [31]. Interestingly, the operational, personnel, and security risks are relatively high in Poland compared to in Slovakia and the Czech Republic. The security risk can be perceived as due to a lack of information. Innovation capability and access to information is a crucial precondition for a sustainable and competitive company, especially in a dynamic market environment [60,66]. The lack of information was proven in default prediction, especially in Slovak SMES [90]. Hungary and Slovakia differ from other countries in terms of security risks. There is a statistically significant difference between Serbia and the V4 countries in security and legal risks. It was confirmed that the level of security and operational risks is statistically more significant in Hungary and Serbia than in the rest of the V4 countries. The importance of access to information and networks for the international activity of SMEs was also confirmed by Carvalho [91]. Slovakia has a very similar risk profile to the Czech Republic, with the difference that personal risks are less important. Slovakia is especially exposed to longer time needed for dispute resolution, clientelism and high administrative requirements. Hungary has lower legal risks, but the partial point of other business risk shows a greater chance of corruption, low quality of services and higher administrative requirements. Companies from the Czech Republic face an above average level of personnel risks. This situation could be the result of the very low unemployment rate the country has experienced in recent years (the unemployment rate has not risen above 2%). Employers do not have a huge number of potential candidates for each position and in some cases need to accept employees without qualifications or with lower qualifications than was acceptable in the past. These results have been confirmed by other authors [92,93,94]. A lack of employees’ resources can limit SMEs in the adoption of sustainability practices.
The risks and their sources were also analyzed from the perspective of economic sectors. Significant differences among the exposure to risk according to the economic sectors were identified. Based on the MFA map, we could visually cluster the 8 sectors into 5 clusters. Trade, tourism, hoteling and catering, and other sectors are placed in the same cluster and exposure to these risk sources is at an average level. The results indicate that personnel and operational risks are most present in the tourism sector. The analysis confirms that agriculture and industry are more exposed to operational risks than other services. This may indicate that in many job types, people prefer to work in other sectors. For construction companies, legal and personnel risks are the most important forms of risk, while in the agricultural sector, operational and other business risks are crucial. The research of Kamil et al. [95] analyzed whether some industries in the Czech Republic are favored or not favoured by the government’s perception of SMEs, which can be perceived as a legal risk. It was proven that in some industries in the Czech Republic, there was no “favoritism” affecting SMEs.
The research results provide interesting information, which is intended primarily for the professional public and associations that help SMEs in selected countries. The comparison of SMEs in V4 countries which have already been accepted on the market of the European Union, and Serbia, which is a candidate for a membership of the European Union, also have benefits for each country analyzed in the research. The Serbian government can see the state of the perception of risks and risk sources of domestic SMEs, and their shortcomings. V4 countries can see space for improvement in this area. Despite these merits, we have identified several limits to this research. The first is the territorial validity of the research. The research was conducted in V4 countries and Serbia, so its results cannot be generalized. The second is the understanding of the questionnaire, which was translated from English into the home language in the specific country. The translation could contain inaccuracies, vague expressions, or errors that affected the answers. The differences found in this research can be caused by differences related to four of the countries’ membership in the European Union and also by idiosyncratic issues in Serbia. The causes of this differences were not analyzed in detail. Finally, we cannot rule out that the questionnaire might have been completed by a person who is not the owner of the business or is not responsible for risk management in the company. The paper has focused on the non-financial risks and does not cover financial risks. The paper does not analyze the causes of risks in detail, nor the attitude of entrepreneurs to risks and to risk management and the role of institutional factors influencing SME development.
Author Contributions
J.O., Z.V. and J.K. conceived and designed the experiments. S.K. analyzed the data. Z.V. and S.K. contributed analysis tools. J.O., Z.V., J.P. and S.K. wrote the paper.
Funding
This research was funded by National Research, Development, and Innovation Fund of Hungary grant number Project no. 130377 and by the János Bolyai Research Scholarship of the Hungarian Academy of Science.
Conflicts of Interest
The author declare no conflict of interest.
References
- Bădulescu, D. SMEs Financing: The Extent of Need and the Responses of Different Credit Structures. Theor. Appl. Econ. 2010, 17, 25–36. [Google Scholar]
- Henderson, J.; Weiler, S. Entrepreneurs and job growth: Probing the boundaries of time and space. Econ. Dev. Q. 2010, 24, 23–32. [Google Scholar] [CrossRef]
- Karpak, B.; Topcu, I. Small medium manufacturing enterprises in Turkey: An analytic network process framework for prioritizing factors affecting success. Int. J. Prod. Econ. 2010, 125, 60–70. [Google Scholar] [CrossRef]
- Meyer, N.; De Jongh, J.J. The importance of entrepreneurship as a contributing factor to economic growth and development: The case of selected European countries. J. Econ. Behav. Stud. 2018, 10, 287–299. [Google Scholar]
- Stoklasova, R. Econometric analysis of SMEs in Eurozone. Forum Sci. Oecon. 2018, 6, 19–29. [Google Scholar]
- Shuying, Z.; Mei, Z. Theory of SMEs financial risk prevention and control. In Proceedings of 2014 International Conference on Education, Management and Computing Technology (ICEMCT-14); Advances in Intelligent Systems Research; Atlantis Press: Amsterdam, The Netherlands, 2014. [Google Scholar] [Green Version]
- Meyer, D.F.; Meyer, N. Management of small and medium enterprise (SME) development: An analysis of stumbling blocks in a developing region. Pol. J. Manag. Stud. 2017, 16, 127–141. [Google Scholar] [CrossRef]
- Duľová Spišáková, E.; Mura, L.; Gontkovičová, B.; Hajduová, Z. R&D in the context of Europe of 2020 in selected countries. Econ. Comput. Econ. Cybern. Stud. Res. 2017, 51, 243–261. [Google Scholar]
- Gold, S.; Trautrims, A.; Trodd, Z. Modern slavery challenges to supply chain management. Supply Chain Manag. An Int. J. 2015, 20, 485–494. [Google Scholar] [CrossRef] [Green Version]
- Jahanshahi, A.A.; Brem, A. Sustainability in SMEs: Top management teams behavioral integration as source of innovativeness. Sustainability 2017, 9, 1899. [Google Scholar] [CrossRef]
- Melnyk, O.; Sroka, W.; Adamiv, M.; Shpak, Y. Information Diagnostic Support of Enterprise Under the Conditions of Uncertainty. Acta Univ. Agric. Silvic. Mendel. Brun. 2017, 65, 1403–1414. [Google Scholar] [CrossRef] [Green Version]
- Lavia López, O.; Hiebl, M.R. Management accounting in small and medium-sized enterprises: Current knowledge and avenues for further research. J. Manag. Account. Res. 2014, 27, 81–119. [Google Scholar] [CrossRef]
- Burgstaller, J.; Wagner, E. How do family ownership and founder management affect capital structure decisions and adjustment of SMEs? Evidence from a bank-based economy. J. Risk Financ. 2015, 16, 73–101. [Google Scholar] [CrossRef]
- Fiala, R.; Hedija, V. The relationship between firm size and firm growth: The case of the Czech Republic. Acta Univ. Agric. Silvic. Mendel. Brun. 2015, 63, 1639–1644. [Google Scholar] [CrossRef]
- Meyer, N.; Meyer, D.F.; Kot, S. The development of a process tool for improved risk management in local government. Qual. Access Success 2017, 18, 425–429. [Google Scholar]
- Frenakova, M. The venture capital and venture capital support in the Slovak Republic. Econ. Rev. 2007, 3, 416–426. [Google Scholar]
- Hudakova, M.; Masar, M.; Luskova, M.; Patak, M.R. The Dependence of Perceived Business Risks on the Size of SMEs. J. Compet. 2018, 10, 54–69. [Google Scholar] [CrossRef] [Green Version]
- Shpak, N.; Sorochak, O.; Hvozd, M.; Sroka, W. Risk evaluation of the reengineering projects: A case study analysis. Sci. Ann.Econ. Bus. 2018, 65, 215–226. [Google Scholar] [CrossRef]
- Setyawan, A.A.; Isa, M.; Wajdi, F.; Syamsudin, S. Disaster as Business Risk in SME: An Exploratory Study. Int. J. Res. Bus. Soc. Sci. 2017, 6, 52–63. [Google Scholar] [CrossRef] [Green Version]
- Máté, D.; Sadaf, R.; Tarnóczi, T.; Fenyves, V. Fraud detection by testing the conformity to benford’s law in the case of wholesale enterprises. Pol. J. Manag. Stud. 2017, 16, 115–126. [Google Scholar] [CrossRef]
- Siničáková, M.; Sulikova, V.; Gavurova, B. Twin deficits threat in the European Union. E+M Econ. Manag. 2017, 20, 144–156. [Google Scholar] [CrossRef]
- Bekeris, R. The impact of macroeconomic indicators upon SME’s profitability. Ekonomika 2012, 91, 117–128. [Google Scholar] [CrossRef]
- Dragnić, D. Impact of internal and external factors on the performance of fast-growing small and medium businesses. Manag. J. Contemp. Manag. Issues 2014, 19, 119–159. [Google Scholar]
- Marinescu, C.; Jora, O.D. Assessment on the “institutional economics” of corruption. Business and development in Romania, between formal and informal practices. Amfiteatru Econ. J. 2013, 15, 603–616. [Google Scholar]
- Bannò, M.; Piscitello, L.; Amorim Varum, C. The Impact of Public Support on SMEs’ Outward FDI: Evidence from I taly. J. Small Bus. Manag. 2014, 52, 22–38. [Google Scholar] [CrossRef]
- Kitching, J.; Hart, M.; Wilson, N. Burden or benefit? Regulation as a dynamic influence on small business performance. Int. Small Bus. J. 2015, 33, 130–147. [Google Scholar] [CrossRef]
- Ivanová, E.; Čepel, M. The impact of innovation performance on the competitiveness of the Visegrad 4 countries. J. Compet. 2018, 10, 54–72. [Google Scholar] [CrossRef]
- Official Journal of the European Union. Commission Recommendation of 6 May 2003 concerning the definition of micro, small and medium-sized enterprises (notified under document number C(2003) 1422) (Text with EEA relevance) (2003/361/EC). Off. J. Eur. Union 2003, 46, 36–41. [Google Scholar]
- Larson, D.W.; Shaw, T.K. Issues of microenterprise and agricultural growth: Do opportunities exist through forward and backward linkages? J. Dev. Entrep. 2001, 6, 203–220. [Google Scholar]
- Fetisovova, E.; Hucova, E.; Nagy, L.; Vlachynsky, K. Aktuálne problémy financií malých a stredných podnikov. Ekon. Bratisl. 2012, 1, 1–18. [Google Scholar]
- SBA. SBA Fact Sheet for Serbia; European Comission—DG Enterprise and Industry: Brussels, Belgium, 2017; Available online: https://translate.google.com/translate?hl=hu&sl=en&u=https://ec.europa.eu/neighbourhood-enlargement/sites/near/files/serbia_sba_fs_2017.pdf&prev=search (accessed on 3 April 2019).
- SBA. SBA Fact Sheet for Czech Republic; European Commission—DG Enterprise and Industry: Brussels, Belgium, 2018; Available online: http://webcache.googleusercontent.com/search?q=cache:fMFw1cPrixcJ:ec.europa.eu/DocsRoom/documents/26562/attachments/7/translations/en/renditions/native+&cd=2&hl=hu&ct=clnk&gl=hu&client=firefox-b-d (accessed on 3 April 2019).
- SBA. SBA Fact Sheet for Hungary; European Commission – DG Enterprise and Industry: Brussels, Belgium, 2018; Available online: http://webcache.googleusercontent.com/search?q=cache:qne9pRocudMJ:ec.europa.eu/DocsRoom/documents/26562/attachments/14/translations/en/renditions/native+&cd=2&hl=hu&ct=clnk&gl=hu&client=firefox-b-d (accessed on 3 April 2019).
- SBA. SBA Fact Sheet for Poland; European Commission—DG Enterprise and Industry: Brussels, Belgium, 2018; Available online: https://ec.europa.eu/docsroom/documents/22382/attachments/27/translations/en/renditions/pdf (accessed on 3 April 2019).
- SBA. SBA Fact Sheet for Slovakia; European Commission—DG Enterprise and Industry: Brussels, Belgium, 2018; Available online: https://translate.google.com/translate?hl=hu&sl=en&u=http://ec.europa.eu/docsroom/documents/16344/attachments/30/translations/en/renditions/native&prev=search (accessed on 3 April 2019).
- Mura, L.; Ključnikov, A. Small businesses in rural tourism and agro tourism: Study from Slovakia. Econ. Soc. 2018, 11, 286–300. [Google Scholar] [CrossRef]
- Bernoulli, D. Exposition of a new theory on the measurement of risk, translated by Louise Sommer. Econometrica 1954, 22, 22–36. [Google Scholar] [CrossRef]
- Belás, J.; Ključnikov, A.; Vojtovič, S.; Sobeková-Májková, M. Approach of the SME entrepreneurs to financial risk management in relation to gender and level of education. Econ. Soc. 2015, 8, 32–42. [Google Scholar] [CrossRef] [PubMed]
- Tibor, T.; Edina, K.; Laurentiu, D. Risk and growth analysis of small and medium size enterprises between 2010 and 2012. Procedia Econ. Financ. 2015, 32, 1323–1331. [Google Scholar] [CrossRef]
- Meyer, N. Risk Management As a Strategy for Promoting Sound Financial Management at Sedibeng District Municipality; North-West University: Vanderbijlpark, South Africa, 2013. [Google Scholar]
- Božek, F.; Urban, R. Risk Management-General Part; University of Defence: Brno, Czech Republic, 2008. [Google Scholar]
- Buganova, K.; Luskova, M. Possible Aproaches to Reducing Business Risk in Transport. Listopad 2013, 8, 6–12. [Google Scholar]
- Myšková, R.; Doupalová, V. Approach to Risk Management Decision-Making in the Small Business. Procedia Econ. Financ. 2015, 34, 329–336. [Google Scholar] [CrossRef] [Green Version]
- Doering, D.S.; Parayre, R. Identification and assessment of emerging technologies. In Wharton on Managing Emerging Technologies; Day, G.S., Schoemaker, P.J.H., Gunther, R.E., Eds.; John Wiley: New York, NY, USA, 2000; ISBN 978-0-471-36121-3. [Google Scholar]
- Mu, J.; Peng, G.; MacLachlan, D.L. Effect of risk management strategy on NPD performance. Technovation 2009, 29, 170–180. [Google Scholar] [CrossRef]
- Verbano, C.; Venturini, K. Development paths of risk management: Approaches, methods and fields of application. J. Risk Res. 2011, 14, 519–550. [Google Scholar] [CrossRef]
- Korombel, A. Enterprise Risk Management in Practice of Polish Small Business—Own Research Results, Business and Management. In Proceedings of the 7th International Scientific Conference, Vilnius, Lithuania, 10–11 May 2012. [Google Scholar]
- Belás, J.; Demjan, V.; Habánik, J.; Hudáková, M.; Sipko, J. The business environment of small and medium-sized enterprises in selected regions of the Czech Republic and Slovakia. E+M Ekon. A Manag. 2015, 18, 95–110. [Google Scholar] [CrossRef]
- Haviernikova, K.; Okręglicka, M.; Lemańska-Majdzik, A. Cluster cooperation and risk level in small and medium-sized enterprises. Pol. J. Manag. Stud. 2016, 14, 82–92. [Google Scholar] [CrossRef]
- Federation of European Risk Management Associations (FERMA). European Risk Manager Report 2018; FERMA: Brussels, Belgium, 2019; Available online: https://www.ferma.eu/publication/2018-european-risk-manager-report/ (accessed on 3 April 2019).
- Mikušova, M. Do small organizations have an effort to survive? Survey from small Czech organizations. Ekon. Istraž.Econ. Res. 2013, 26, 59–76. [Google Scholar] [CrossRef]
- Borbas, L. The role of SMEs in the European entrepreneurship policy. In Volume of Management, Enterprise and Benchmarking in the 21st Century; Óbuda University: Budapest, Hungary, 2015; pp. 71–88. Available online: https://kgk.uni-obuda.hu/sites/default/files/05_Borbas_0_0.pdf (accessed on 3 April 2019).
- Williams, S.; Schaefer, A. Small and medium-sized enterprises and sustainability: Managers’ values and engagement with environmental and climate change issues. Bus. Strategy Environ. 2013, 22, 173–186. [Google Scholar] [CrossRef]
- Font, X.; Garay, L.; Jones, S. Sustainability motivations and practices in small tourism enterprises in European protected areas. J. Clean. Prod. 2016, 137, 1439–1448. [Google Scholar] [CrossRef]
- Kornilaki, M.; Thomas, R.; Font, X. The sustainability behaviour of small firms in tourism: The role of self-e_cacy and contextual constraints. J. Sustain. Tour. 2019, 27, 1–21. [Google Scholar] [CrossRef]
- Epstein, A.; Rejc Buhovac, A. The Reporting of Organizational Risks for Internal and External Decision-Making; The Society of Management Accountants of Canada and The American Institute of Certified Public Accountants: Mississauga, ON, Canada, 2005; Available online: https://web.actuaries.ie/sites/default/files/erm-resources/295_The%20Reporting%20of%20Organizational%20Risks%20for%20Internal%20and%20External%20Decision-Making.pdf (accessed on 3 April 2019).
- Gao, S.S.; Sung, M.C.; Zhang, J. Risk management capability building in SMEs: A social capital perspective. Int. Small Bus. J. 2013, 31, 677–700. [Google Scholar] [CrossRef]
- Sen, T.K.; Ghandforoush, P. Radical and incremental innovation preferencesin information technology: An empirical study in an emerging economy. J. Technol. Manag. Innov. 2011, 6, 33–44. [Google Scholar] [CrossRef]
- Miklošik, A.; Hvizdova, E.; Žak, Š. Knowledge management as a significant determinant of competitive advantage sustainability. Ekon. časopis 2012, 60, 1041–1058. [Google Scholar]
- Staňkova, Š. Assessment of corporate social responsibility by using AHP method together with group decision making rague. In Proceedings of the 8th International Days of Statistics and Economics, Prague, Czech Republic, 11–13 September 2014; pp. 1430–1440. [Google Scholar]
- Risk, N. Infopro Digital Risk Top 10 Operational Risks for 2019; Infopro Digital Services Limited: London, UK, 2019; Available online: https://www.risk.net/risk-management/6470126/top-10-op-risks-2019 (accessed on 3 April 2019).
- Petković, S.; Jäger, C.; Sašić, B. Challenges of small and medium sized companies at early stage of development: Insights from Bosnia and Herzegovina. Manag. J. Contemp. Manag. Issues 2016, 21, 45–76. [Google Scholar]
- Rahman, A.; Rahman, M.T.; Ključnikov, A. Collateral and SME financing in Bangladesh: An analysis across bank size and bank ownership types. J. Int. Stud. 2016, 9, 112–126. [Google Scholar] [CrossRef]
- Leach, J. Do new information and communications technologies have a role to play in the achievement of education for all? Br. Educ. Res. J. 2008, 34, 783–805. [Google Scholar] [CrossRef]
- OECD. Enhancing The Contributions of SMEs in a Global and Digitalized Economy; OECD: Paris, France, 2017; Available online: http://www.oecd.org/cfe/smes/ (accessed on 3 April 2019).
- Muller, M.J.; Kiel, D.; Voigt, K.I. What Drives the Implementation of Industry 4.0? The Role of Opportunities and Challenges in the Context of Sustainability. Sustainability 2018, 10, 247. [Google Scholar] [CrossRef]
- Ušiak, J. The Security Environment of the V4 Countries. Politics Cent. Eur. 2018, 14, 21–37. [Google Scholar] [CrossRef] [Green Version]
- Dumitrescu, A.; Deselnicu, D.C. Risk assessment in manufacturing SMEs’ labor system. Procedia Manuf. 2018, 22, 912–915. [Google Scholar] [CrossRef]
- Balcerzak, A.P. Multiple-criteria evaluation of quality of human capital in the European Union countries. Econo. Soc. 2016, 9, 11–26. [Google Scholar] [CrossRef] [PubMed]
- Máté, D. Human capital, unions and productivity in a labour-skilled sectoral approach. Soc. Econ. 2014, 36, 369–385. [Google Scholar] [CrossRef] [Green Version]
- Liebenberg, A.P.; Hoyt, R.E. The determinants of enterprise risk management: Evidence from the appointment of chief risk officers. Risk Manag. Insur. Rev. 2003, 6, 37–52. [Google Scholar] [CrossRef]
- Beasley, M.S.; Clune, R.; Hermanson, D.R. Enterprise risk management: An empirical analysis of factors associated with the extent of implementation. J. Account. Public Policy 2005, 24, 521–531. [Google Scholar] [CrossRef]
- Dvorský, J.; Schönfeld, J.; Kotásková, A.; Petráková, Z. Evaluation of important credit risk factors in the SME segment. J. Int. Stud. 2018, 11, 204–216. [Google Scholar] [CrossRef] [PubMed]
- Brustbauer, J. Enterprise risk management in SMEs: Towards a structural model. Int. Small Bus. J. 2016, 34, 70–85. [Google Scholar] [CrossRef]
- Johnson, M.P.; Schaltegger, S. Two Decades of Sustainability Management Tools for SMEs: How Far Have We Come? J. Small Bus. Manag. 2016, 54, 481–505. [Google Scholar] [CrossRef]
- Oláh, J.; Kovács, S.; Virglerova, Z.; Lakner, Z.; Kovacova, M.; Popp, J. Analysis and Comparison of Economic and Financial Risk Sources in SMEs of the Visegrad Group and Serbia. Sustainability 2019, 11, 1853. [Google Scholar] [CrossRef]
- European Commission. Eurostat-Your Key to European Statistics; European Commission: Luxenbourg, 2017; Available online: https://ec.europa.eu/eurostat/data/database (accessed on 10 August 2019).
- Muller, E. Innovation Interactions between Knowledge-Intensive Based Services and Small and Medium-Sized Enterprises; Springer: Berlin, Germany, 2001; ISBN 978-3-642-57568-6. [Google Scholar]
- Ramadan, M. Internationalization Process of Innovatiove SMEs in Lebanon: An Analysis with Conceptual Model. In International Business: Concepts, Methodologies, Tools and Applications; Kedge Business School: Talence, France, 2016; Available online: http://www.irma-international.org/chapter/internationalization-process-of-innovative-smes-in-lebanon/147861/ (accessed on 3 April 2019).
- Lin, F.J.; Lin, Y.H. The effect of network relationship on the performance of SMEs. J. Bus. Res. 2016, 69, 1780–1784. [Google Scholar] [CrossRef]
- Abdi, H.; Williams, L.J.; Valentin, D. Multiple factor analysis: Principal component analysis for multitable and multiblock data sets. Wiley Interdiscip. Rev. Comput. Stat. 2013, 5, 149–179. [Google Scholar] [CrossRef]
- Lé, S.; Josse, J.; Husson, F. FactoMineR: An R Package for Multivariate Analysis. J. Stat. Softw. 2008, 25, 1–18. [Google Scholar] [CrossRef]
- Choisis, J.P.; Thévenet, C.; Gibon, A. Analyzing farming systems diversity: A case study in south-western France. Span. J. Agric. Res. 2012, 10, 605–618. [Google Scholar] [CrossRef]
- Lautre, I.G.A.; Fernández, E.A. A methodology for measuring latent variables based on multiple factor analysis. Comput. Stat. Data Anal. 2004, 45, 505–517. [Google Scholar] [CrossRef]
- Pagès, J.; Tenenhaus, M. Multiple factor analysis combined with PLS path modelling. Application to the analysis of relationships between physicochemical variables, sensory profiles and hedonic judgements. Chemom. Intell. Lab. Syst. 2001, 58, 261–273. [Google Scholar] [CrossRef]
- Bécue-Bertaut, M.; Kern, J.; Hernández-Maldonado, M.L.; Juresa, V.; Vuletic, S. Health-risk behaviour in Croatia. Public Health 2008, 122, 140–150. [Google Scholar] [CrossRef] [Green Version]
- Ramanaiah, N.V.; O’Donnell, J.P.; Ribich, F. Multi-group factor analysis of the Wechsler Intelligence Scale for Children. Clin. Psychol. Psychother. 1976, 38, 829–831. [Google Scholar]
- Karami, M.; Tang, J. Entrepreneurial orientation and SME international performance: The mediating role of networking capability and experiential learning. Int. Small Bus. J. 2019, 37, 105–124. [Google Scholar] [CrossRef]
- Dvorsky, J.; Popp, J.; Virglerova, Z.; Kovács, S.; Oláh, J. Assessing the importance of market risk and its sources in the SME of the Visegrad Group and Serbia. Adv. Decis. Sci. 2018, 22, 1–25. [Google Scholar]
- Wilson, N.; Ochotnický, P.; Káčer, M. Creation and destruction in transition economies: The SME sector in Slovakia. Int. Small Bus. J. 2016, 34, 579–600. [Google Scholar] [CrossRef]
- Carvalho, L.C. Handbook of Research on Internationalization of Entrepreneurial Innovation in the Global Economy; Universidade de Évora: Aberta, Portugal, 2015; ISBN 1466682175. [Google Scholar]
- Kozubíková, L.; Homolka, L.; Kristalas, D. The effect of business environment and entrepreneurs’ gender on perception of financial risk in the smes sector. J. Compet. 2017, 9, 36–50. [Google Scholar] [CrossRef]
- Ahmad, I.; Oláh, J.; Popp, J.; Máté, D. Does business group affiliation matter for superior performance? Evidence from Pakistan. Sustainability 2018, 10, 3060. [Google Scholar] [CrossRef]
- Belás, J.; Dvorský, J.; Kubálek, J.; Smrčka, L. Important factors of financial risk in the SME segment. J. Int. Stud. 2018, 11, 80–92. [Google Scholar] [CrossRef] [PubMed]
- Dobes, K.; Kot, S.; Jan, K.; Gabriela, S. The perception of governmental support in the context of competitiveness of SMEs in the Czech Republic. J. Compet. 2017, 9, 34. [Google Scholar] [CrossRef]
Figure 1.
Moon plot of the countries/sectors and risk sources, based on MCA results. Source: Authors’ own research, 2019.
Figure 1.
Moon plot of the countries/sectors and risk sources, based on MCA results. Source: Authors’ own research, 2019.

Figure 2.
Correlation plot of the studied risk factors and dimensions. Source: Authors’ own research, 2019.
Figure 2.
Correlation plot of the studied risk factors and dimensions. Source: Authors’ own research, 2019.

Figure 3.
MFA map of the countries, according to risk sources. Source: Authors’ own research, 2019.

Figure 4.
MFA map of the sectors according to risk sources. Source: Authors’ own research, 2019.


Table 1.
Descriptive statistics of the research sample by country.
| Factor/Category | Country | Total | ||||
|---|---|---|---|---|---|---|
| Czech Republic | Poland | Hungary | Slovakia | Serbia | ||
| Industry | 23.5% | 14.9% | 10.8% | 15.6% | 14.6% | 15.9% |
| Trade | 23.0% | 31.7% | 19.6% | 24.2% | 30.1% | 25.8% |
| Agriculture | 3.7% | 6.0% | 16.0% | 2.3% | 3.6% | 6.2% |
| Construction | 15.4% | 6.8% | 5.2% | 12.3% | 5.5% | 9.2% |
| Transportation, logistics | 0.0% | 11.4% | 7.2% | 6.4% | 6.1% | 6.4% |
| Tourism, hotel and catering | 6.4% | 6.2% | 10.6% | 8.8% | 16.1% | 9.2% |
| Other services | 20.6% | 17.1% | 28.9% | 27.5% | 19.5% | 22.7% |
| Other sectors | 7.4% | 5.8% | 1.8% | 2.9% | 4.6% | 4.5% |
| Experience level | Average value on a 4/5 point scale | |||||
| Length of business (4 point scale) 3 = 5–10 years | 3.35 | 3.13 | 3.06 | 3.25 | 3.19 | 3.19 |
| Length of international presence (5 point scale) 1 = less than 1 year, 2 = 1–5 years | 1.11 | 0.97 | 1.01 | 1.50 | 0.82 | 1.10 |
| Dealing with risk management (5 point scale) 1 = less than 1 year, 2 = 1–5 years | 1.62 | 1.02 | 1.09 | 2.11 | 1.43 | 1.46 |
| Number of companies | 408 | 498 | 388 | 487 | 329 | 2110 |
Note: Industry includes sections B and C of the Statistical classification of economic activities (NACE). The Other sectors include all other sections which are not mentioned. A deeper analysis of dependencies according to the economic sector is not important for this paper. Source: Authors’ own research, 2019.
Table 2.
Economic factors of the studied countries in 2018.
| Factor | Czech Republic | Hungary | Poland | Slovakia | Serbia | Unit |
|---|---|---|---|---|---|---|
| GDP * per capita | 2.6 | 5.1 | 5.2 | 4 | 4.6 | % change from 2017 |
| Annual average rate of change of inflation | 2.0 | 2.9 | 1.2 | 2.5 | 2.0 | % change from 2017 |
| Unemployment rate | 2.2 | 3.7 | 3.9 | 6.5 | 11.3 | % of active population |
| Employment rate | 79.9 | 74.4 | 72.2 | 72.4 | 63.1 | % of total population at age 20–64 |
| Production change in industry ** | 0.8 | 6.6 | 2.8 | 4.2 | −5.5 | Month/Month—12% *** |
| Production change in industry ** | 113.7 | 114.1 | 117.8 | 115.3 | 104.5 | % (base = 2015) |
| People at risk of poverty or social exclusion | 12.2 | 25.6 | 19.5 | 16.3 | 36.7 | % of total population |
| Final energy consumption by sector ***** | 24.4 | 17.9 | 69.1 | 9.9 | 8.4 | million tonnes of oil equivalent |
| Resource efficiency | 170.3 | 120.1 | 135.1 | 138.9 | 148.3 | GDP/DMC **** |
| Export to import ratio | 1.09 | 1.06 | 1.07 | 1.02 | 0.86 | % |
*: Gross Domestic Product; **: fixed base year (2015 = 100%) Laspeyres type volume-index; ***: growth rates with respect to the same month of the previous year from calendar adjusted figures; ****: Domestic Material Consumption; *****: data only available for 2017; Source: European Commission Eurostat [77].
Table 3.
Major indicators by country for establishing hypothesis.
| Indicator | Hungary | Czech Republic | Slovakia | Poland | Serbia | Period | Source | Measurement |
|---|---|---|---|---|---|---|---|---|
| Strength of legal rights L | 8.5 | 6.7 | 7 | 7 | 6 | 2013–2018 | World Bank | 0–12 scale 0 = weak 12 = strong |
| Political stability and absence of violence/terrorism: percentile rank S,B | 70 | 85 | 82 | 77 | 45 | 2010–2017 | World Bank | Percentile rank 0 = unstable 100 = stable |
| Terrorism index S,B | 0.74 | 1.46 | 0.18 | 0.55 | 1.05 | 2010–2017 | Institute for Economics and Peace | 0–10 scale 0 = no influence |
| Corruption index B | 50 | 52 | 48 | 59 | 39 | 2010–2017 | Transparency International | 0–100 100 = clean 0 = corrupt |
| Business confidence B | 7.10 | 0.3 | −5.7 | 5.1 | - | 2019 April | ECBS * | % points |
| Percentage of firms identifying crime, theft and disorder as a major constraint S | 4.10% | 8.80% | 3.60% | 8.20% | 7.40% | 2013 | World Bank | % |
| Risk of catastrophic expenditure S | 46.50% | 2.90% | 0.70% | 4.20% | 20.80% | 2014 | World Bank | (% of people at risk) |
| Life expectancy at birth P | 76.1 | 79.2 | 77.3 | 77.8 | 75.7 | 2018 | World Bank | Years |
| Ratio of firms paying for security S | 33.70% | 55.90% | 54.80% | 66.50% | 30.00% | 2013 | World Bank | % |
| Change in the number of employees O,P | 0.85% | 1.07% | 1.30% | 0.88% | 3.73% | 2016–2018 | EUROSTAT | Coefficient of variation (%) standard deviation/mean |
| Capacity utilization | 80.10% | 81.20% | 82.70% | 79.70% | 64.80% | 2013 | World Bank | % |
* European Commission, Business and Consumer Surveys (ECBS); O: operational risk; P: personal risk; S: security risk; L: legal risk; B: business risk; Source: Authors’ own research, 2019.
Table 4.
Proportion of companies considering a given risk type as being important.
| Risk Type | Country | Total | ||||
|---|---|---|---|---|---|---|
| Czech Republic | Poland | Hungary | Slovakia | Serbia | ||
| Operational | 23.8% | 23.1% | 51.5% | 22.4% | 15.8% | 27.2% |
| Personal | 48.5% | 44.2% | 49.5% | 27.9% | 29.2% | 39.9% |
| Security | 13.5% | 23.1% | 25.5% | 14.4% | 20.4% | 19.2% |
| Legal | 15.4% | 19.9% | 35.1% | 17.2% | 21.3% | 21.4% |
| Business | 0.0% | 6.8% | 14.2% | 0.0% | 6.7% | 5.3% |
Source: Authors’ own research, 2019.
Table 5.
Average scores of risk sources by countries on a 5-point Likert scale.
| Risk Source | Country | Total | |||||
|---|---|---|---|---|---|---|---|
| Czech Republic | Poland | Hungary | Slovakia | Serbia | |||
| Insufficient production capacity | Operational | 2.18 | 2.47 | 2.76 | 2.12 | 2.54 | 2.39 |
| Outdated production facilities | 2.21 | 2.39 | 2.69 | 2.16 | 2.62 | 2.39 | |
| Low rate of innovation | 2.29 | 2.47 | 2.80 | 2.29 | 2.67 | 2.49 | |
| Increasing number of complaints | 2.08 | 2.34 | 2.37 | 2.03 | 2.55 | 2.25 | |
| High turnover among employees | Personal | 2.52 | 2.57 | 2.96 | 2.39 | 2.46 | 2.58 |
| Insufficient staff qualifications | 2.66 | 2.64 | 2.91 | 2.47 | 2.76 | 2.67 | |
| Occupational injury | 2.38 | 2.66 | 2.40 | 2.21 | 2.72 | 2.46 | |
| Decline in morals and discipline of the employees | 2.60 | 2.68 | 2.76 | 2.25 | 2.77 | 2.60 | |
| Accidents, external threats | Security | 2.32 | 2.50 | 2.20 | 2.20 | 2.66 | 2.36 |
| Misuse of information | 2.40 | 2.29 | 2.59 | 2.18 | 2.40 | 2.36 | |
| Health and safety of employees | 2.05 | 2.35 | 2.18 | 1.99 | 2.42 | 2.19 | |
| Property crime | 2.16 | 2.44 | 2.40 | 2.10 | 2.87 | 2.37 | |
| Poor law enforcement | Legal | 2.75 | 2.47 | 2.41 | 2.75 | 2.86 | 2.64 |
| Frequent changes in legislation | 2.72 | 2.74 | 2.76 | 2.90 | 3.10 | 2.83 | |
| Low level of judicial independence | 2.36 | 2.47 | 2.32 | 2.65 | 2.97 | 2.54 | |
| Long times for dispute resolution | 2.84 | 2.56 | 2.64 | 2.92 | 3.08 | 2.80 | |
| Corruption | Other business | 2.38 | 2.08 | 2.83 | 2.83 | 3.07 | 2.61 |
| Clientelism | 2.56 | 1.97 | 2.82 | 2.97 | 3.21 | 2.67 | |
| Low quality of services | 2.55 | 2.36 | 2.66 | 2.83 | 3.04 | 2.67 | |
| High administrative requirements | 3.47 | 2.77 | 3.43 | 3.40 | 3.32 | 3.26 | |
Source: Authors’ own research, 2019.
Table 6.
ANOVA and pairwise comparisons of the MFA factor scores by country.
| Country | Risk Source | ||||||
|---|---|---|---|---|---|---|---|
| 1. Dimension | 2. Dimension | ||||||
| Security | Operational | Personal | Overall | Legal | Business | Overall | |
| Czech Republic | ab | a | b | a | ab | a | A |
| Poland | a | b | ab | a | a | c | B |
| Hungary | a | c | a | b | a | ab | C |
| Slovakia | b | a | c | a | b | b | D |
| Serbia | c | c | ab | b | c | b | A |
| F-statistic from ANOVA | 15.36 *** | 27.38 *** | 13.06 *** | 81.94 *** | 12.37 *** | 44.79 *** | 234.14 *** |
Different letters denote significant difference between Countries; Bonferroni corrected p values were used. ***: p < 0.001; ns: not significant. Source: Authors’ own research, 2019.
Table 7.
ANOVA and pairwise comparisons of the MFA factor scores by sectors.
| Sector | Risk Source | ||||||
|---|---|---|---|---|---|---|---|
| 1. Dimension | 2. Dimension | ||||||
| Security | Operational | Personal | Overall | Legal | Business | Overall | |
| Industry | a | a | Ad | ac | ab | a | a |
| Trade | a | b | Bd | b | ab | a | b |
| Agriculture | a | ab | Ab | ab | b | ab | a |
| Construction | a | b | Ad | c | a | b | c |
| Transportation, logistics | a | ab | A | ac | a | ab | ab |
| Tourism, hotel and catering | a | ab | Ab | ab | b | ab | b |
| Other services | a | c | cb | b | a | ab | c |
| Other sectors | a | b | ab | abc | a | ab | bc |
| F-statistic from ANOVA | 1.48 ns | 6.06 *** | 4.06 *** | 45.81 *** | 2.75 ** | 2.56 * | 11.55 *** |
Different letters denote significant difference between Sectors; Bonferroni corrected p values were used. *: p < 0.05; **: p < 0.01; ***: p < 0.001; ns: not significant. Source: Authors’ own research, 2019.
© 2019 by the authors. Licensee MDPI, Basel, Switzerland. This article is an open access article distributed under the terms and conditions of the Creative Commons Attribution (CC BY) license (http://creativecommons.org/licenses/by/4.0/).
Share and Cite
MDPI and ACS Style
Oláh, J.; Virglerova, Z.; Popp, J.; Kliestikova, J.; Kovács, S. The Assessment of Non-Financial Risk Sources of SMES in the V4 Countries and Serbia. Sustainability 2019, 11, 4806. https://0-doi-org.brum.beds.ac.uk/10.3390/su11174806
AMA Style
Oláh J, Virglerova Z, Popp J, Kliestikova J, Kovács S. The Assessment of Non-Financial Risk Sources of SMES in the V4 Countries and Serbia. Sustainability. 2019; 11(17):4806. https://0-doi-org.brum.beds.ac.uk/10.3390/su11174806
Chicago/Turabian StyleOláh, Judit, Zuzana Virglerova, József Popp, Jana Kliestikova, and Sándor Kovács. 2019. "The Assessment of Non-Financial Risk Sources of SMES in the V4 Countries and Serbia" Sustainability 11, no. 17: 4806. https://0-doi-org.brum.beds.ac.uk/10.3390/su11174806
Note that from the first issue of 2016, this journal uses article numbers instead of page numbers. See further details here.