Article

Contextualized Property Market Models vs. Generalized Mass Appraisals: An Innovative Approach

1
Department of Civil Engineering Sciences and Architecture, Polytechnic University of Bari, Via Orabona 4, 70125 Bari, Italy
2
Department of Engineering and Architecture, University of Trieste, 34127 Trieste, Italy
3
Department of Architecture and Design, Sapienza University of Rome, Via Flaminia 359, 00196 Rome, Italy
4
School of Engineering, University of Basilicata, Viale dell’Ateneo Lucano, 85100 Potenza, Italy
*
Author to whom correspondence should be addressed.
Sustainability 2019, 11(18), 4896; https://0-doi-org.brum.beds.ac.uk/10.3390/su11184896
Submission received: 18 July 2019 / Revised: 3 September 2019 / Accepted: 3 September 2019 / Published: 6 September 2019

Abstract

:
The present research takes into account the current and widespread need for rational valuation methodologies, able to correctly interpret the available market data. An innovative automated valuation model has been simultaneously implemented to three Italian study samples, each one constituted by two-hundred residential units sold in the years 2016–2017. The ability to generate a “unique” functional form for the three different territorial contexts considered, in which the relationships between the influencing factors and the selling prices are specified by different multiplicative coefficients that appropriately represent the market phenomena of each case study analyzed, is the main contribution of the proposed methodology. The method can provide support for private operators in the assessment of the territorial investment conveniences and for the public entities in the decisional phases regarding future tax and urban planning policies.

1. Introduction

In recent years, the awareness of the “value of the data” and its growing availability has determined an increasing diffusion of innovative techniques to measure, elaborate, and interrelate the detectable amount of information in all sectors. In the USA, the National Bureau of Economic Research has highlighted the opportunities in big data and its implications for the economics profession [1]. Several Scholars [2,3,4] have outlined the prominent role of “spatial” big data—in both the public and private sectors—in the future management and governance of smart cities. It should be outlined that in the urban planning sector, the concept of cognitive cities aims at overcoming the use of topographic maps and at making the interconnections explicit among the subjects involved (governments, citizens, businesses) through the inclusion of cognitive processes for decision-making that take into account a set of experiences and services that appropriately reflect the collective needs [5,6].
Following the US subprime mortgage crisis, in order to guarantee more objective and reliable valuations and to explain the functional relationships that link the market factors with property values, there has been also in the real estate sector the need to systematize the property data coming from heterogeneous sources [7,8] and to exploit the potentialities of more complex algorithms and software, usually named automated valuation models (AVMs), in processing the available amount of big data [9]. In particular, the term “Proptech” (property technology) refers to the new frontier of property data management: By accumulating the real estate data (sales, management, user interaction with the site), it is possible to outline growth trends in specific market segments and/or geographical areas that allow those in the sector to identify attractive initiatives for the potential investors. This new market largely takes into account art. 208 (3) (b) of the Capital Requirements Regulation (EU) No. 575/2013, which constitutes the main EU law aimed at decreasing the likelihood that banks go insolvent, and highlights the importance that credit institutions “use statistical methods to monitor the value of the immovable property and to identify the immovable property that needs revaluation”.
Although the utility of the AVMs for urban planning and for contributing to the performance of urban information systems has been widely recognized [10], several authors have highlighted the danger of using “black boxes”, i.e., models that are not transparent and/or are difficult to be managed by less competent users [11,12], who are inevitably forced to rely on experts, even when they are not sure how good these experts are [13]. Therefore, this contingency points out the need for models of mass appraisal that are capable, on the one hand, of constantly modifying in the short-term according to the variations of the starting scenario conditions, and on the other hand, of satisfying the empirical reliability of the results obtained and of providing for functional relationships that are easily interpretable and repeatable in different territorial contexts, avoiding excessively complex solutions, which inevitably lead to an excessive automatism of the process and an increase of uncertainty for the end-user [14].
The present paper aims at providing a contribution in the framework stated above. The research proposes the implementation of an innovative AVM on the data samples collected in different territorial contexts, able to generate a “unique” functional form that explains the market behavior in the areas considered. The relationships between the influencing factors and the selling prices are specified by different multiplicative coefficients that appropriately represent the market peculiarities of each case study. The analysis has been carried out on three study samples, each one constituted by two-hundred residential units sold in the years 2016–2017, respectively located in the South of Italy (Bari), in the Center of Italy (Rome), and in the North of Italy (Turin). For each study sample, the selling prices and the main technical and spatial factors that influence the price formation have been detected.
The advantages of the research are related to the definition of a methodology that could be simultaneously implemented in many territorial contexts: The outputs are models characterized by the same functional structure in terms of mathematical correlations among the variables, but differentiated by the multiplicative coefficients that reflect the specific market phenomena of each territorial area analyzed. Therefore, the proposed methodology can provide support for all professional subjects involved in the property market dynamics: (i) The public administrations, who could use the procedure for future tax policies, urban planning decisions, and for the verification of the reliability of the property selling prices declared in private transactions; (ii) the institutional entities (e.g., banks, asset management companies, etc.), who could quickly monitor the volatility of the property market, as provided by art. 208 (3) (a) of the Capital Requirements Regulation (EU) No. 575/2013, which stresses the need of frequent verifications of real estate values, and therefore the performances of the financed investments in any territorial area; (iii) the private/public investors interested in property development initiatives, who could automatically assess the revenues generated by these investments in different territorial contexts and identify the most convenient interventions; (iv) the private/public operators interested in investing in the “existent” property stock, who could define the combinations of the properties located in different territorial areas that minimize the total differential between the actual market values and the respective asking prices; and (v) the ordinary purchaser, who could independently verify the market reliability of the asking price of the property they are interested in.
Although the applications carried out are characterized by some limitations, mainly due to the sample sizes that it has been possible to collect, the research aims at providing a further contribution in the existing literature on mass appraisal methods through the analysis of a single functional form and the consequent generalization of the functional relationships among property market variables, even when the locations of the study samples are very different.
The paper is structured as follows. In Section 2, the main reference literature on mass appraisal techniques has been reported. In Section 3, the case studies have been presented and the influencing factors considered for the elaborations have been illustrated. In Section 4, the implemented AVM has been explained. In Section 5, the application of the method to the case studies has been described, the outputs obtained in terms of statistical performances and empirical reliability of the functional relationships have been highlighted, and the results have been interpreted. In Section 6, the hedonic price method has been applied to the sample data of each city in order to compare the results and outline the potentialities of the proposed methodology. Finally, in Section 7, the conclusions of the research have been discussed.

2. Background on the Main Mass Appraisal Techniques

The numerous applications in the reference literature have allowed us to appropriately outline the potentialities of mass appraisal techniques. McCluskey and Anand [15] elaborated a review of the main intelligent hybrid techniques for the mass appraisal of residential properties, highlighting the respective strengths and weaknesses. Pagourtzi et al. [16] and French and Gabrielli [17] collected the main AVMs employed in the real estate market, in order to provide a better understanding of the measurement of locational effects. Metzener and Kindt [18] schematized the main parameters to be considered for the implementation of an AVM in the assessment of residential properties. D’Amato and Kauko [19] highlighted the potentialities of AVM in the property assessments after the 2008 USA subprime crisis.
The hedonic price method constitutes the most popular mass appraisal technique, mainly due to its ability to allow an understanding forecast of the real estate markets’ dynamics. Generally focused on single-family houses and commercial properties [20,21,22,23], hedonic price modelling has been mainly used to assess the effects of social, environmental, and urban characteristics on property values [24,25,26,27,28,29,30], pointing out the weight of urban amenities [31,32,33,34,35,36], environmental externalities [37,38,39,40], access services and neighborhood attributes [41,42,43,44,45], and energetic factors [46,47,48]. Other studies have highlighted the influence of socio-economic factors on the property price formation [49,50,51,52]. Sdino et al. [53] have developed a pluri-parametric hedonic price model for the rapid assessment of a large real estate portfolio in various real estate market segments.
In addition to the classic mass appraisal method of the hedonic price modelling, numerous scholars have implemented different data-driven techniques, frequently characterized, on the one hand, by a higher flexibility than the common approach of the hedonic price method, on the other hand, by the difficulty to provide an explicit empirical interpretation of the functional relationships among the influencing factors and the property values [54]. Starting from the recent analysis reported in Kauko and D’Amato [55], the following mass appraisal methodologies have been studied in the reference literature and implemented in the real estate sector.
Artificial neural networks, often criticized for their “black box” nature, have been used for the prediction of properties’ values [56,57,58,59,60,61] and the property market segmentation [62,63,64].
Fuzzy logic models have been proposed by Byrne [65], Bagnoli, and Smith [66], and Mao and Wu [67]. Chang and Ko [68] combined the fuzzy set theory with a multi-objective programming approach in order to determine the relationship between the land use and future urban planning. Bonissone et al. [69] developed a neuro-fuzzy system to be applied in the property market. Siniak [70] elaborated a fuzzy method as an evolution of the standard valuation approaches.
Autoregressive integrated moving average models have been implemented in real estate appraisal by Tse [71] and Makridakis et al. [72]. Autoregressive vectorial approaches have been developed by Sivitanides et al. [73], Iacoviello [74], Elbourne [75], and Chen et al. [76]. Kim Hin and Calero Cuervo [77] employed a cointegration approach to demonstrate the correlation among the residential property prices, the real gross domestic product, and the rate for mortgage banking loans.
Methods of spatial statistical analysis have been applied to determine the influence of the access services [78,79,80,81]. Some authors have implemented spatial autocorrelation statistics [82,83] and kriging techniques [84,85] for the identification of the neighborhood factors that mainly affect the property prices. La Rose [86] studied the potentialities of triangulated irregular network for predictive purposes.
With reference to the goal programming logic applied to the property market, Kettani et al. [87] developed an evaluation model by integrating the multicriteria approach through the mathematical programming. Kettani and Khelifi [88] elaborated a decision support model to be applied for the rationalization of the municipal tax system. Estellita Lins et al. [89] designed a procedure based on data envelopment analysis for the evaluation of housing property prices located in different neighborhoods of Rio de Janeiro. Adolphson et al. [90] applied goal programming techniques for the evaluation of the obsolescence of properties owned by State Railways.
Recently, the logic of genetic algorithms has been applied to the real estate market by several Authors. Kròl et al. [91] have developed a fuzzy rule-based system to support the property assessment by employing an evolutionary algorithm to generate the rule base. Wang [92] has proposed a decision support system that, through data envelopment analyses, converts numerical data into information that can be used to evaluate real estate investments. Dzeng and Lee [93] have elaborated a model to optimize the development schedule of resort projects by using a polyploidy genetic algorithm.
A specific application of a multi-objective genetic algorithm for the identification of the “best” regression models, named evolutionary polynomial regression, has been recently implemented to several property issues. Initially applied to hydraulic systems [94,95,96], the methodology has been borrowed and used to elicit the correlations between the property market and socio-economic variables [97,98], energetic factors [99], and for property tax purposes [100]. Other studies have allowed researchers to highlight the advantages of the methodology compared to orthodox [101] and innovative mass appraisal approaches [102]. There are no other applications to the property market so far.

3. Case Studies

The three study sample areas are located in Italian territorial contexts that are different for geographical, socio-economic, and climatic conditions: The first one was collected in the city of Bari, which overlooks the Adriatic Sea and is the capital of the Apulia region, in Southern Italy; the second study sample was detected in the city of Rome, capital of Italy, located in the Lazio region, in Central Italy; the third study sample area is located in the city of Turin, capital of the Piedmont region, in Northern Italy.
A sample of two hundred residential units sold in the years 2016–2017 were collected for each of the three Italian cities analyzed. Regarding the selection of the factors that mainly contribute to the formation of the selling prices in the corresponding market segment of each property of the study samples, the reference literature has widely highlighted the unavoidable trade-off between bias from omitted variables and increased sampling variance associated with collinearity that is involved in this phase [103,104,105,106], even if there is a relative agreement on the major influencing factors [107,108]. In this research, the influencing factors have been identified by taking into account the indications of local appraisers and real estate agents consulted [109]. Therefore, having selected the unit selling price, expressed in €/m2 [P], as the dependent variable of the model, the following technical and spatial factors have been considered.
Technical factors
-
The total surface of the property, expressed in square meters of gross floor area of the property [S];
-
The number of the bathrooms in the property [B];
-
The floor on which the property is located [F];
-
The presence of the lift [L]. In the model, this variable is considered as a dummy variable, in particular the presence of the service is represented by the value “one”, whereas the absence of the service is indicated with the value “zero”;
-
The quality of the maintenance condition of the apartment, taken as a qualitative variable and differentiated, through a synthetic evaluation, by the categories “to be restructured” [Mp], “good” [Mg], and “excellent” [Me]. Following the logic of the dummy variables, the score “one” is assigned to the category that defines the specific quality of each property, and the score “zero” for the remaining two categories [110]. In particular, the “to be restructured” state refers to properties that require significant refurbishment interventions, due to the fact that the functionality of the property is compromised by the inappropriate conditions of the elements that compose it; the “good” state indicates properties whose maintenance conditions are acceptable and whose functions can be conducted without heavy interventions. Finally, the “excellent” state refers to buildings characterized by construction and aesthetic high quality, possibly affected by recent redevelopment and renovation initiatives;
-
The energy performance certificate (EPC) label [Ep], expressed, according with the current regulations, through the denominations from A4 (the highest level) to G (the lowest level). In the present research, the EPC labels from A4 to A are gathered into a single explanatory variable (EpA). Therefore, the variables considered are specified by the following abbreviations, which recall the label they belong to: EpA, EpB, EpC, EpD, EpE, EpF, EpG. Each parameter is interpreted as a dummy variable, assigning a score equal to “one” to the EPC label of the property and, consequently, the score equal to “zero” to all the others;
-
The age of the building in which the residential unit is located [O]. This variable is calculated as the difference between the year when the property was sold (2016–2017) and the year of construction of the building.
Spatial factors
-
The distance from the nearest highway, expressed in kilometers it takes to get there by car [T] (determined through the application on www.google.com/maps);
-
The distance from the nearest subway, expressed in kilometers it takes to walk to it [W] (determined through the application on www.google.com/maps);
-
The municipal trade area in which the property is located, considering the geographical distribution developed by the Italian Revenue Agency (http://www.agenziaentrate.gov.it), due to the different location characteristics that contribute to the formation of the selling prices. In particular, five trade areas are defined by the Italian Revenue Agency: “central”, “semi-central”, “peripheral”, “suburban”, and “rural”. With regard to the cities under analysis, the Italian Revenue Agency considers four trade areas: “central” [Uc], “semi-central” [Usc], “peripheral” [Up], and “suburban” [Usb]. For each property, the score “one” is assigned if the property belongs to the specific trade area, whereas the score “zero” is reported for all the remaining spatial factors.
Some considerations should be developed based on the sizes of the three data samples, which could appear as the main limitation of the applications performed. However, even if they are not very large, the sample data are certainly interesting compared to other Italian mass appraisal applications and taking into account the structural opacity that generally characterizes the Italian real estate market. For example, in Simonotti [111] the sample size is constituted by 33 data; in Curto [112] the sample size is equal to 66 data; in Del Giudice and De Paola [113] the sample size is equal to 64 data; and in D’Amato [114] the sample size is constituted by 114 data. It is evident that the sample size affects the number of influencing factors that can be involved in the regression model. Furthermore, it should be highlighted that the sizes of the three data samples satisfy the rule-of-thumb established in the current literature [115]. According to this rule, it must be N ≥ 50 + 8m for the multiple correlation and N ≥ 104 + m for the partial correlation, where N is the number of subjects in each data sample and m is the number of influencing factors considered.
Table 1 summarizes the variables in the analysis, specifying, for each one of them, the acronym used, the type (cardinal or dummy), and the measurement unit. Table 2, Table 3 and Table 4 show the main descriptive statistics of the selling prices and the influencing factors for the three cities analyzed. Regarding the selling prices of the collected properties, it should be noted that the average values are consistent with the quotations determined by official entities for the period in analysis (www.scenari-immobiliari.it).

4. The Method

The methodological approach in valuation, named evolutionary polynomial regression (EPR), constitutes a generalization of the stepwise regression. The method employs a simple genetic algorithm engine in order to combine the variables and to investigate the model mathematical structures through continuous reiteration: Specifically, the central idea of EPR is to search the best form of the function, which is a combination of independent variable vectors (the chosen variables, model inputs), by performing a regression with the least squares method, in order to obtain the value of the coefficients of each variable, elevated by the appropriate exponents. Therefore, the technique is based on both numerical and symbolic regression. In particular, EPR searches for the form of the polynomial expressions in which the monomial terms can be—more or less—complex combinations of the input variables, and it finds the values of the constants in the expressions by optimizing the least squares. The generic expression of the methodology is represented by Equation (1), which describes a generic nonlinear model structure:
Y = a 0 + i = 1 n [ a i ( X 1 ) ( i , 1 ) ( X j ) ( i , j ) f ( ( X 1 ) ( i , j + 1 ) ( X j ) ( i , 2 j ) ) ]
where n is the number of additive terms, i.e., the length of the polynomial expression (constant additive term excluded), a0 represents the constant additive term, ai are numerical parameters to be valued, Xi are candidate explanatory variables, (i, l)—with l = (1, …, 2j)—is the exponent of the l-th input within the i-th term in Equation (1), f is a function constructed by the process. The exponents (i, l) are also selected by the user from a set of candidate values (real numbers). The structure of f is set by the user, according to any physical insight. The iterative investigation of the model mathematical structures, implemented by exploring the mix of exponents for each candidate input variable in Equation (1), is carried out through a population-based strategy that applies the genetic algorithm, whose individuals are the sets of exponents in Equation (1) and selected by the user according to the complexity required for the model. For example, the exponents should belong to the set (0, 1) to generate an additive linear model, whereas if the exponent “2” is also included, the possibility of a quadratic model is admitted. Therefore, the number and the complexity of the solutions that the genetic algorithm will generate depend on the maximum number of terms allowed and on the possible exponents that the user defines in the preliminary phase. It should be pointed out that EPR does not require the exogenous definition of the mathematical expression and the number of parameters that fit better the detected data, as the iterative process of the underlying genetic algorithm directly generates the best mathematical expression.
The main potentiality of EPR is the ability to pursue an optimal Pareto frontier of three objective functions. These objectives are conflictual, and aim at (i) the maximization of the model accuracy, through the satisfaction of the appropriate statistical criteria of verification of the equation; (ii) the maximization of the model’s parsimony, through the minimization of the number of terms (ai) of the equation; and (iii) the reduction of the complexity of the model, through the minimization of the number of the explanatory variables (Xi) of the final equation. Through an electronic spreadsheet implemented in Excel (www.hydroinformatics.it), the optimization strategy, based on the Pareto dominance criteria defined above, allowed researchers to generate, at the end of the modelling phase, a set of model solutions—that represent the Pareto front of optimal models—for the three objectives. In this way, a range of models is offered to the operator, among which it is possible to choose the most appropriate solution according to the specific needs, the knowledge of the phenomenon in analysis, and the type of experimental data used. This condition provided by EPR constitutes an important innovation compared to the other mass appraisal techniques (e.g., a canonical hedonic price method)—in fact, in real estate literature the classic modality of treating the correlation between the property prices and the influencing factors consists of implementing the main functional forms (linear, semi-log, quadratic, log-linear) or in employing the Box–Cox and Box–Tidwell transformation [116,117], and then selecting the best data interpolation function.
Taking into account the advantages of EPR, an evolution of the methodology has been proposed and tested in this research. This approach develops generalized prediction models by simultaneously considering the variables from a number of individual data samples. With reference to the property market sector, the methodological approach, named multi-case strategy for EPR [118], simultaneously identifies the best set of significant explanatory variables (i.e., the influencing factors) and their best combination, able to describe the same phenomenon (i.e., the selling prices) in all the data samples analyzed. The mathematical logic of the multi-case strategy borrows the genetic algorithm search procedure of EPR, by using the least squares method in order to simultaneously estimate the unknown polynomial coefficient values for all the data samples considered, and by calculating the three objective function values (sum of squared errors, number of polynomial terms, number of significant explanatory variables) in order to assess each model structure’s fitness. In particular, the mathematical approach of the multi-case strategy does not calculate separately the statistical model accuracy of each model as a separate objective to be maximized—as the basic EPR does—, but it merges all data samples’ measures of model accuracy into a single fitness value, named CODMCS and defined in Equation (2):
C O D M C S = 1 k = 1 m N k ( y k y det e c t e d ) 2 N ( y det e c t e d m e a n ( y det e c t e d ) ) 2
where m is the number of data samples for which a generalized prediction model is required (k = 1, …, m); Nk is the size (i.e., number of individuals) of the k-th data sample; N is the total number of individuals that constitute all the m data samples in analysis; yk is the value of the dependent variable estimated by the methodology through the statistical inference on the k-th vector of parameters, ydetected is the corresponding observation, and mean(ydetected) is the average value of the collected values in the m data samples. The closer to the unit value the CODMCS is, the more suitable the model structure is in representing the overall observed dataset.

5. Application of the Multi-Case Strategy for EPR Method

5.1. The Generalized Model Obtained and Its Specification to the Case Studies

The multi-case strategy for EPR method has been implemented by considering the base model structure reported in Equation (1) with no function f selected. Each generated algebraic expression consists of a maximum number of ten terms and each additive monomial term is assumed as a combination of the inputs (i.e., the explanatory variables) elevated by the proper exponents. Taking into account that the larger the exponent range is, the higher the number of elaborations performed by the genetic algorithm underlying the method is, the eligible exponents have been assumed equal to nine (−2, −1.5, −1, −0.5, 0, 0.5, 1, 1.5, 2), in order to reduce the complexity of the calculation and at the same time to generate a wide range of models among which to select the “best compromise” in terms of CODMCS and empirical reliability of the relationships between the candidate inputs and the dependent variable (selling prices).
In Table 5, the mathematical specification of the multi-case for EPR model implemented has been reported.
In accordance with the mathematical formulations generally found in the current literature concerning the property market [27,119,120,121], the log-linear model has been used. Therefore, the dependent variable to be estimated in the model is Y = ln(P). The log-linear form has many attractive characteristics [122], compared to a classical linear form [123]: (i) it allows for the joint determination of expenditures in the regression, i.e., the prices of one component partially depend on the other factors in the house; (ii) the interpretation of the coefficients of a log-linear model is always simple, as they represent the percentage change in the dependent variable given a unit change in the explanatory variable [124]; (iii) it partially mitigates a common form of heteroskedasticity; (iv) the model is easy to be implemented and interpreted.
The implementation of the algorithm to the three case studies has generated nine equations, reported in Table 6, that are able to simultaneously describe the main relationships between the selling prices and the influencing factors in the Italian cities considered. The models are characterized, on the one hand, by a progressively articulated and complex algebraic form, on the other hand, by a gradually increasing level of statistical accuracy: The equations present a progressively increasing number of monomial terms and independent variables and, at the same time, a value of the statistical performance indicator (CODMCS) closer to the unit. The CODMCS relating to the models obtained, in fact, varies between a minimum value of 60.00%—Equation (3) in Table 5—and a maximum value of 78.32%—Equation (11) in Table 5.
In order to define a generalized model that allows researchers to simultaneously explain the price formation mechanism in the three different market segments analyzed, the model of Equation (11) has been selected; in fact, this model is characterized by the highest statistical accuracy and takes into account the largest number of influencing factors. In particular, the explanatory variables identified by the algorithm implemented in Equation (11) are the following: the location of the property in a central trade area (Uc); the distance from the nearest highway (T); the lowest EPC label (EpG); the highest EPC label (EpA); the “excellent” maintenance conditions (Me); the “to be restructured” maintenance conditions (Mp); the age of the building (O); the floor level of the property (F); the number of bathrooms (B); the presence of the lift (L); the total surface of the property (S); the distance from the nearest subway (W); and the location of the property in a suburban trade area (Usb). Therefore, taking into account the explanatory variables initially identified and detected for the three case studies, the generalized model elaborated by the multi-case strategy for EPR algorithm does not judge the “intermediate” values of the dummy variables considered—Mg, EpB, EpC, EpD, EpE, EpF, Usc, Up—as relevant in the explanation of the selling price formation phenomena in the residential market of the three Italian cities under analysis.
The main advantage of the methodology proposed is the possibility to obtain a unique functional form that is valid for all the case studies considered, with the determination of the coefficients ai for each sample according to the specific market conditions of the territorial context analyzed. In Table 7 the parameters of the generalized model selected—Equation (11) in Table 6, specified for each of the three study samples, have been reported.
Table 8 shows the final models for the three study samples and the respective main statistical performance indicators, i.e., the root mean squared error (RMSE); the mean absolute percentage errors (MAPE), that is, the average percentage error between the prices of the original sample and the values estimated; and the maximum absolute percentage errors (MaxAPE), that is the maximum percentage error between the prices of the original sample and the values estimated by the model. The indicators in Table 7 highlight, on the one hand, the good statistical reliability of the outputs obtained for all the three case studies, on the other hand, the ability of the genetic algorithm underlying the methodology employed to make the results statistically uniform, i.e., its capacity to simultaneously pursue the Pareto optimal solutions for all the study samples under analysis. In fact, it is not a coincidence that the best statistical indicators have not been obtained for a single case study: The lowest RMSE concerns the Rome case study (3.89%), which is instead characterized by the highest MAPE (3.02%); the lowest MAPE has been calculated for the Bari study sample (2.41%), which presents the highest MaxAPE (9.62%); the lowest MaxAPE has been verified for the Turin case study (8.24%), for which the highest RMSE has been determined (4.15%).
In order to also investigate the stability of the models obtained, a ten-fold cross-validation [125] has been implemented on the starting database for each model. The outputs obtained confirm the good prediction performances of the models—in Table 9, the average percentage errors between the detected prices and the estimated prices in the training set and in the validation set of each iteration have been reported. In all the tests, the statistical indicator is less than 4.0%; several iterations—nos. 2, 4, 6, and 9 for the model of the city of Bari; nos. 3, 5, 9 for the model of the city of Rome; nos. 2, 5, 8, and 9 for the model of the city of Turin—the average percentage error calculated for the validation set is less than the corresponding indicator for the training set.
Table 10 summarizes the explanatory variables identified by the genetic algorithm as the main influencing factors on the selling prices of each residential market segment analyzed, and able—through the appropriate combinations described by the models’ expressions—to pursue the optimal Pareto frontier of the three objective functions (statistical accuracy, minimization of the number of terms, reduction of the complexity of the model).
It should be firstly outlined that, if the number of the bathrooms (B) and the presence of the lift (L) are the only characteristics that appear in all the three models, a different market behavior is verified in the city samples in regards to the other factors. With reference to the energetic components, the model for the Bari study sample only takes into account the “extreme” conditions of the EPC label (EpA and EpG); the model for the Rome case study only selects the worst label (EpG); whereas the Turin model does not provide a relevant market appreciation of the energetic characteristics in the housing prices formation. In regards to the quality of the maintenance condition, the models for the Bari and Turin samples appreciate the contribution of the excellent state (Me) on the selling prices, whereas the Rome model reveals a higher importance for the worst condition (Mp). The floor of the property (F) and the total surface (S) are identified by the models for the cities of Bari and Rome, whereas the age of the building (O) is only selected by the model for the Rome study sample. The distance from the nearest subway (W) incorporates the contribute of the location factor in the model for the Bari sample, whereas in the Rome model the position in the central (Uc) and the suburban (Usb) trade areas are also included; finally, in the model for the Turin study sample the spatial characteristics identified by the genetic algorithm are the distance from the nearest highway (T) and the position in the central perimeter of the city (Uc).

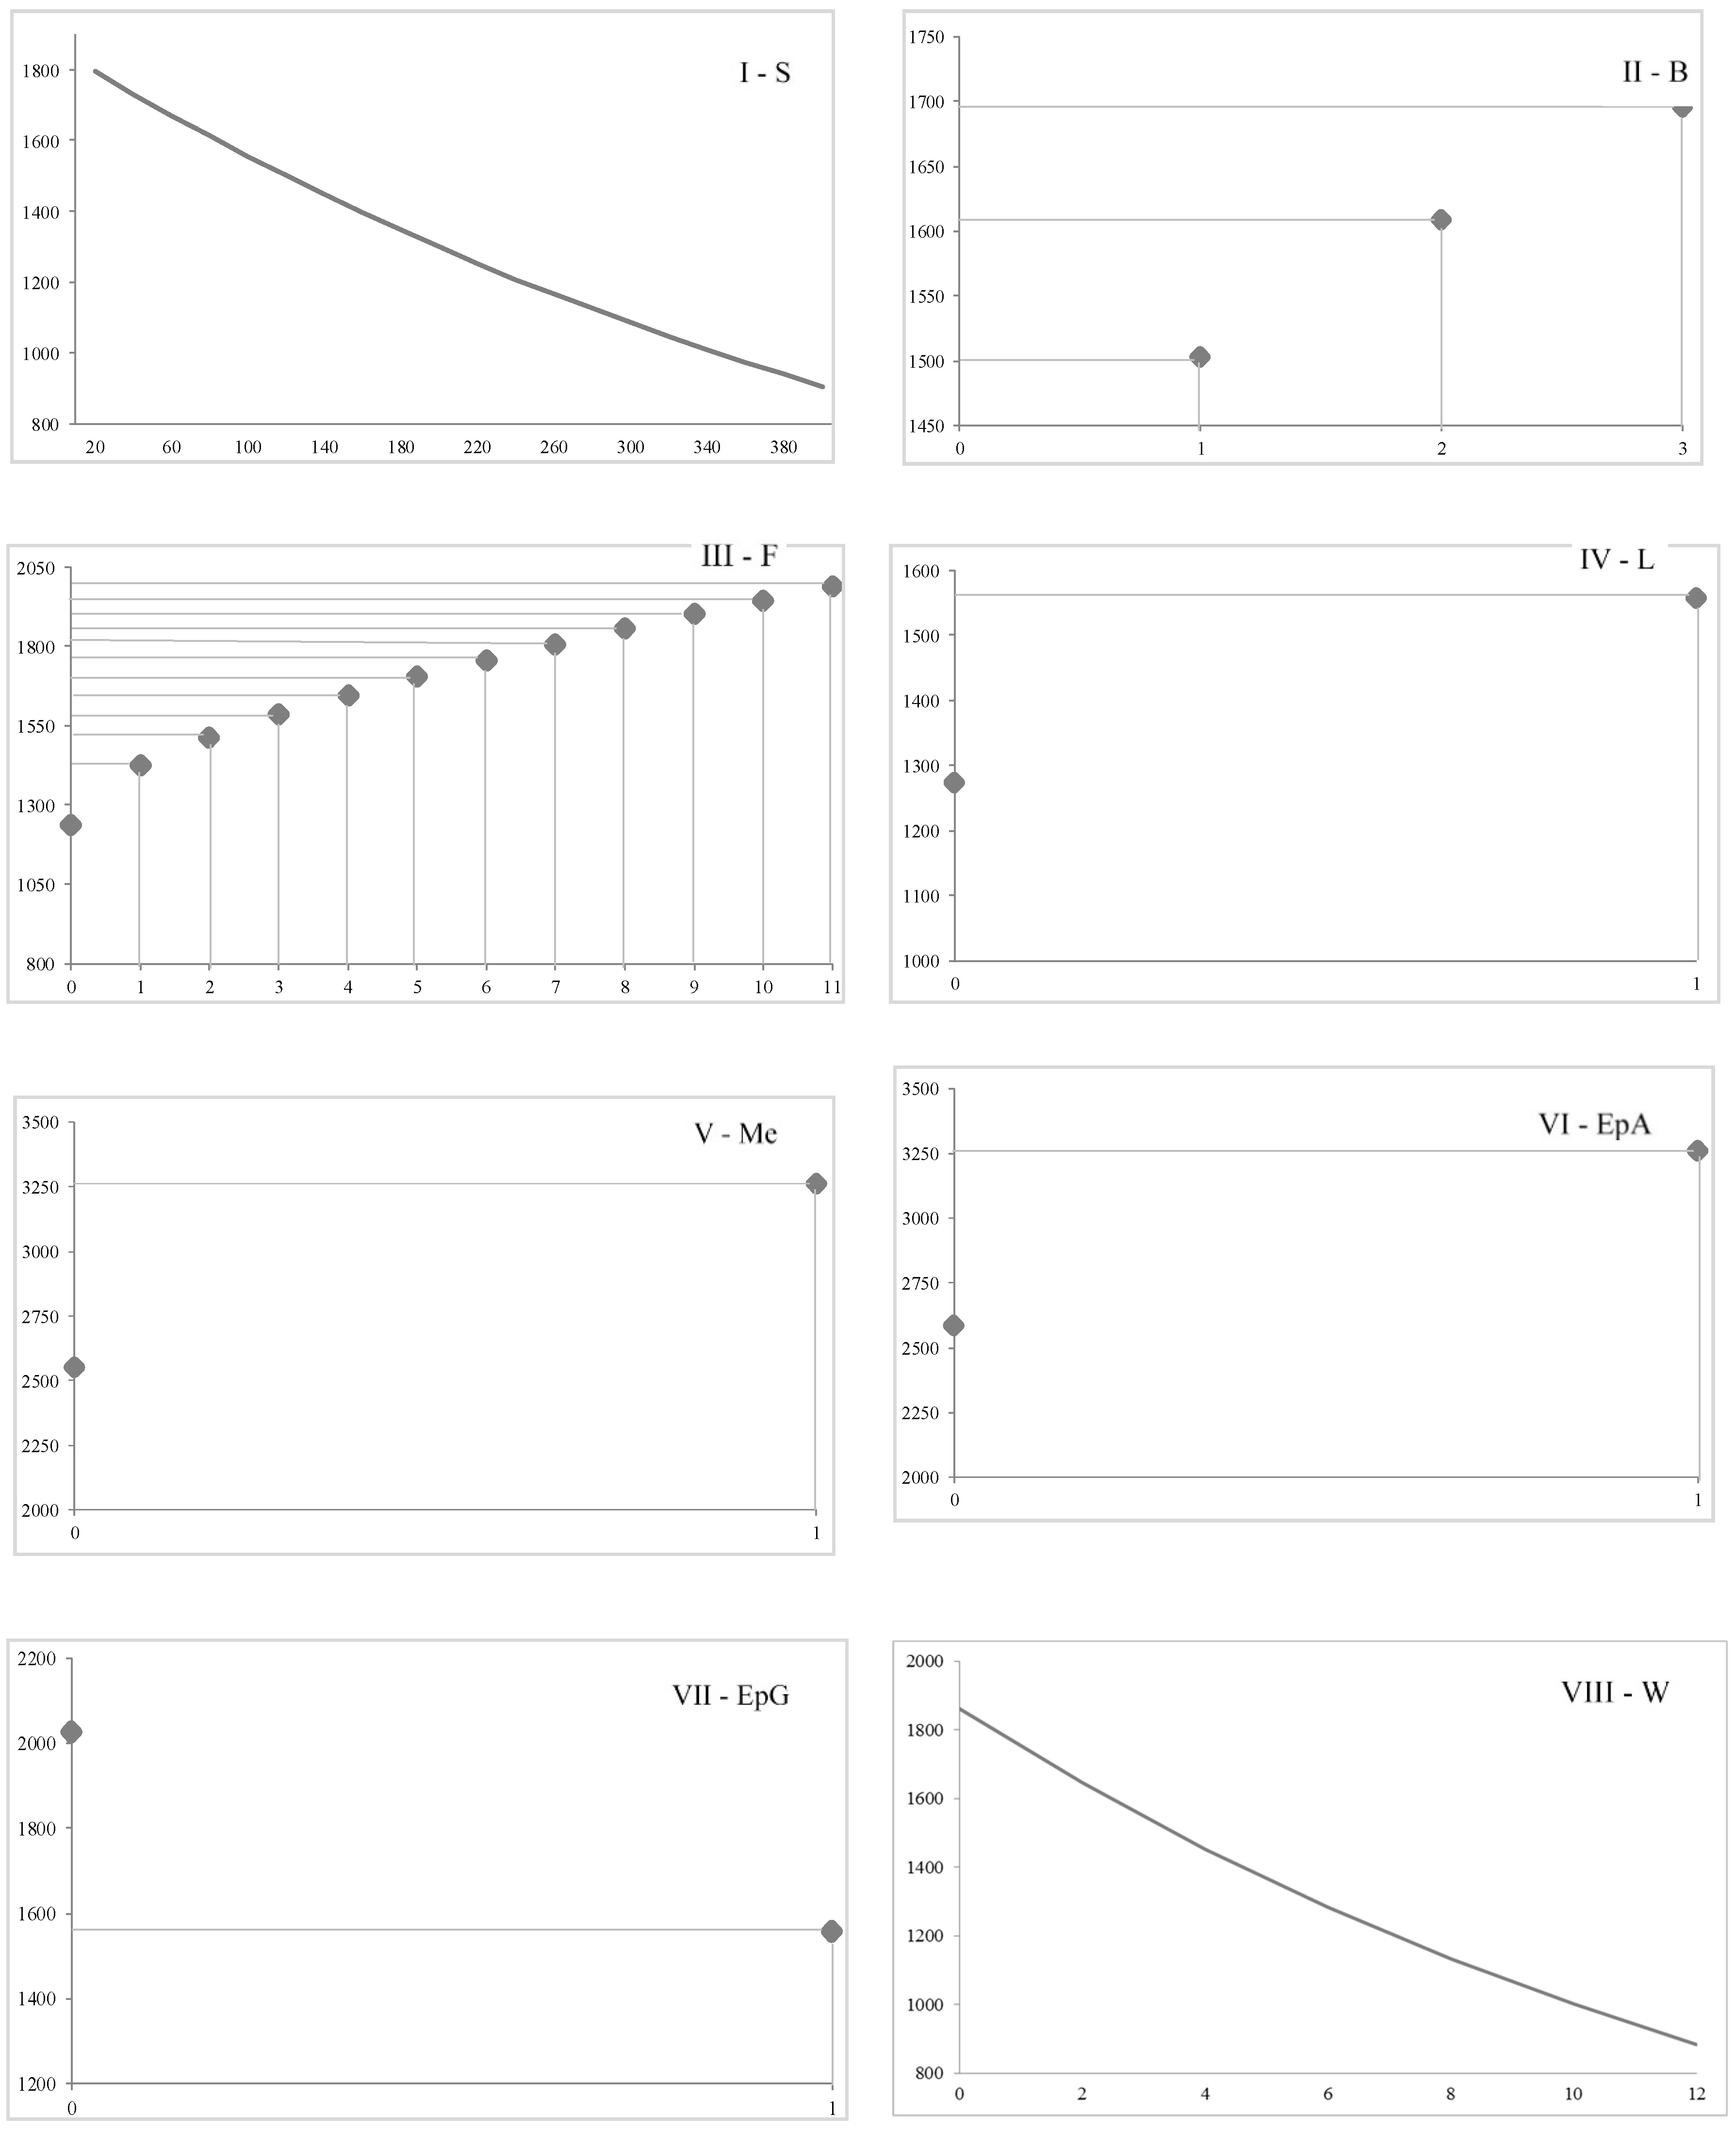
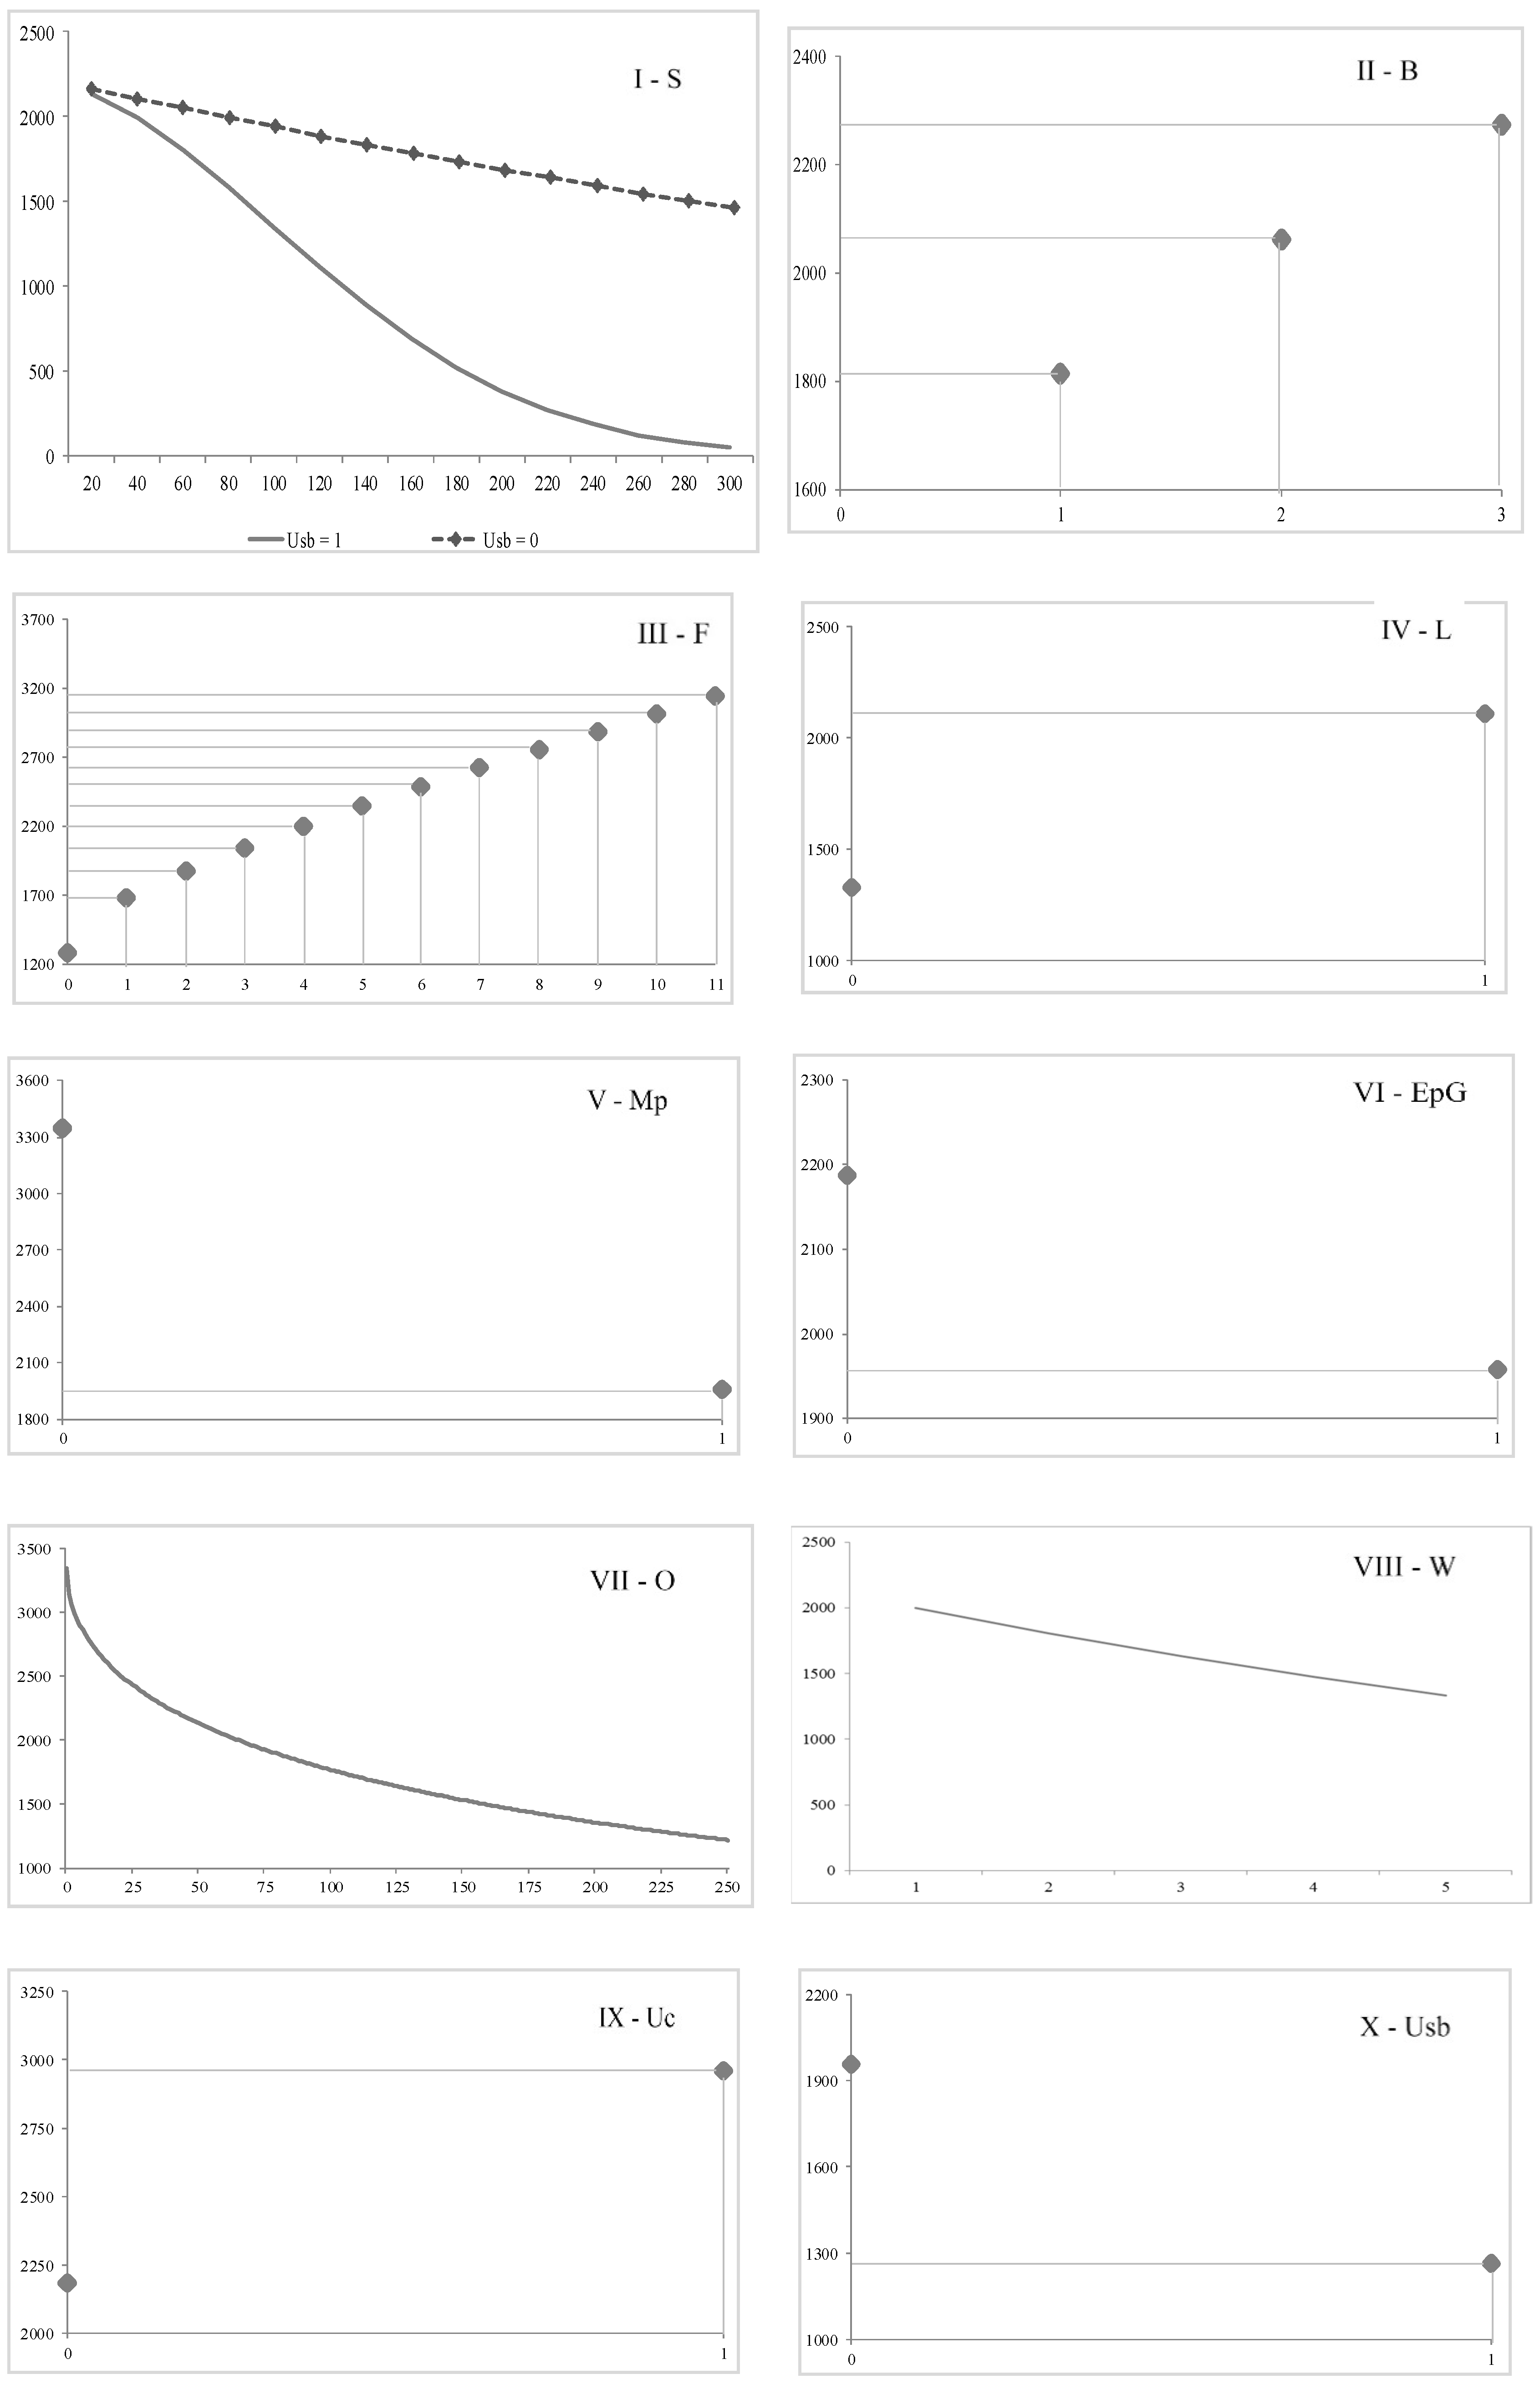
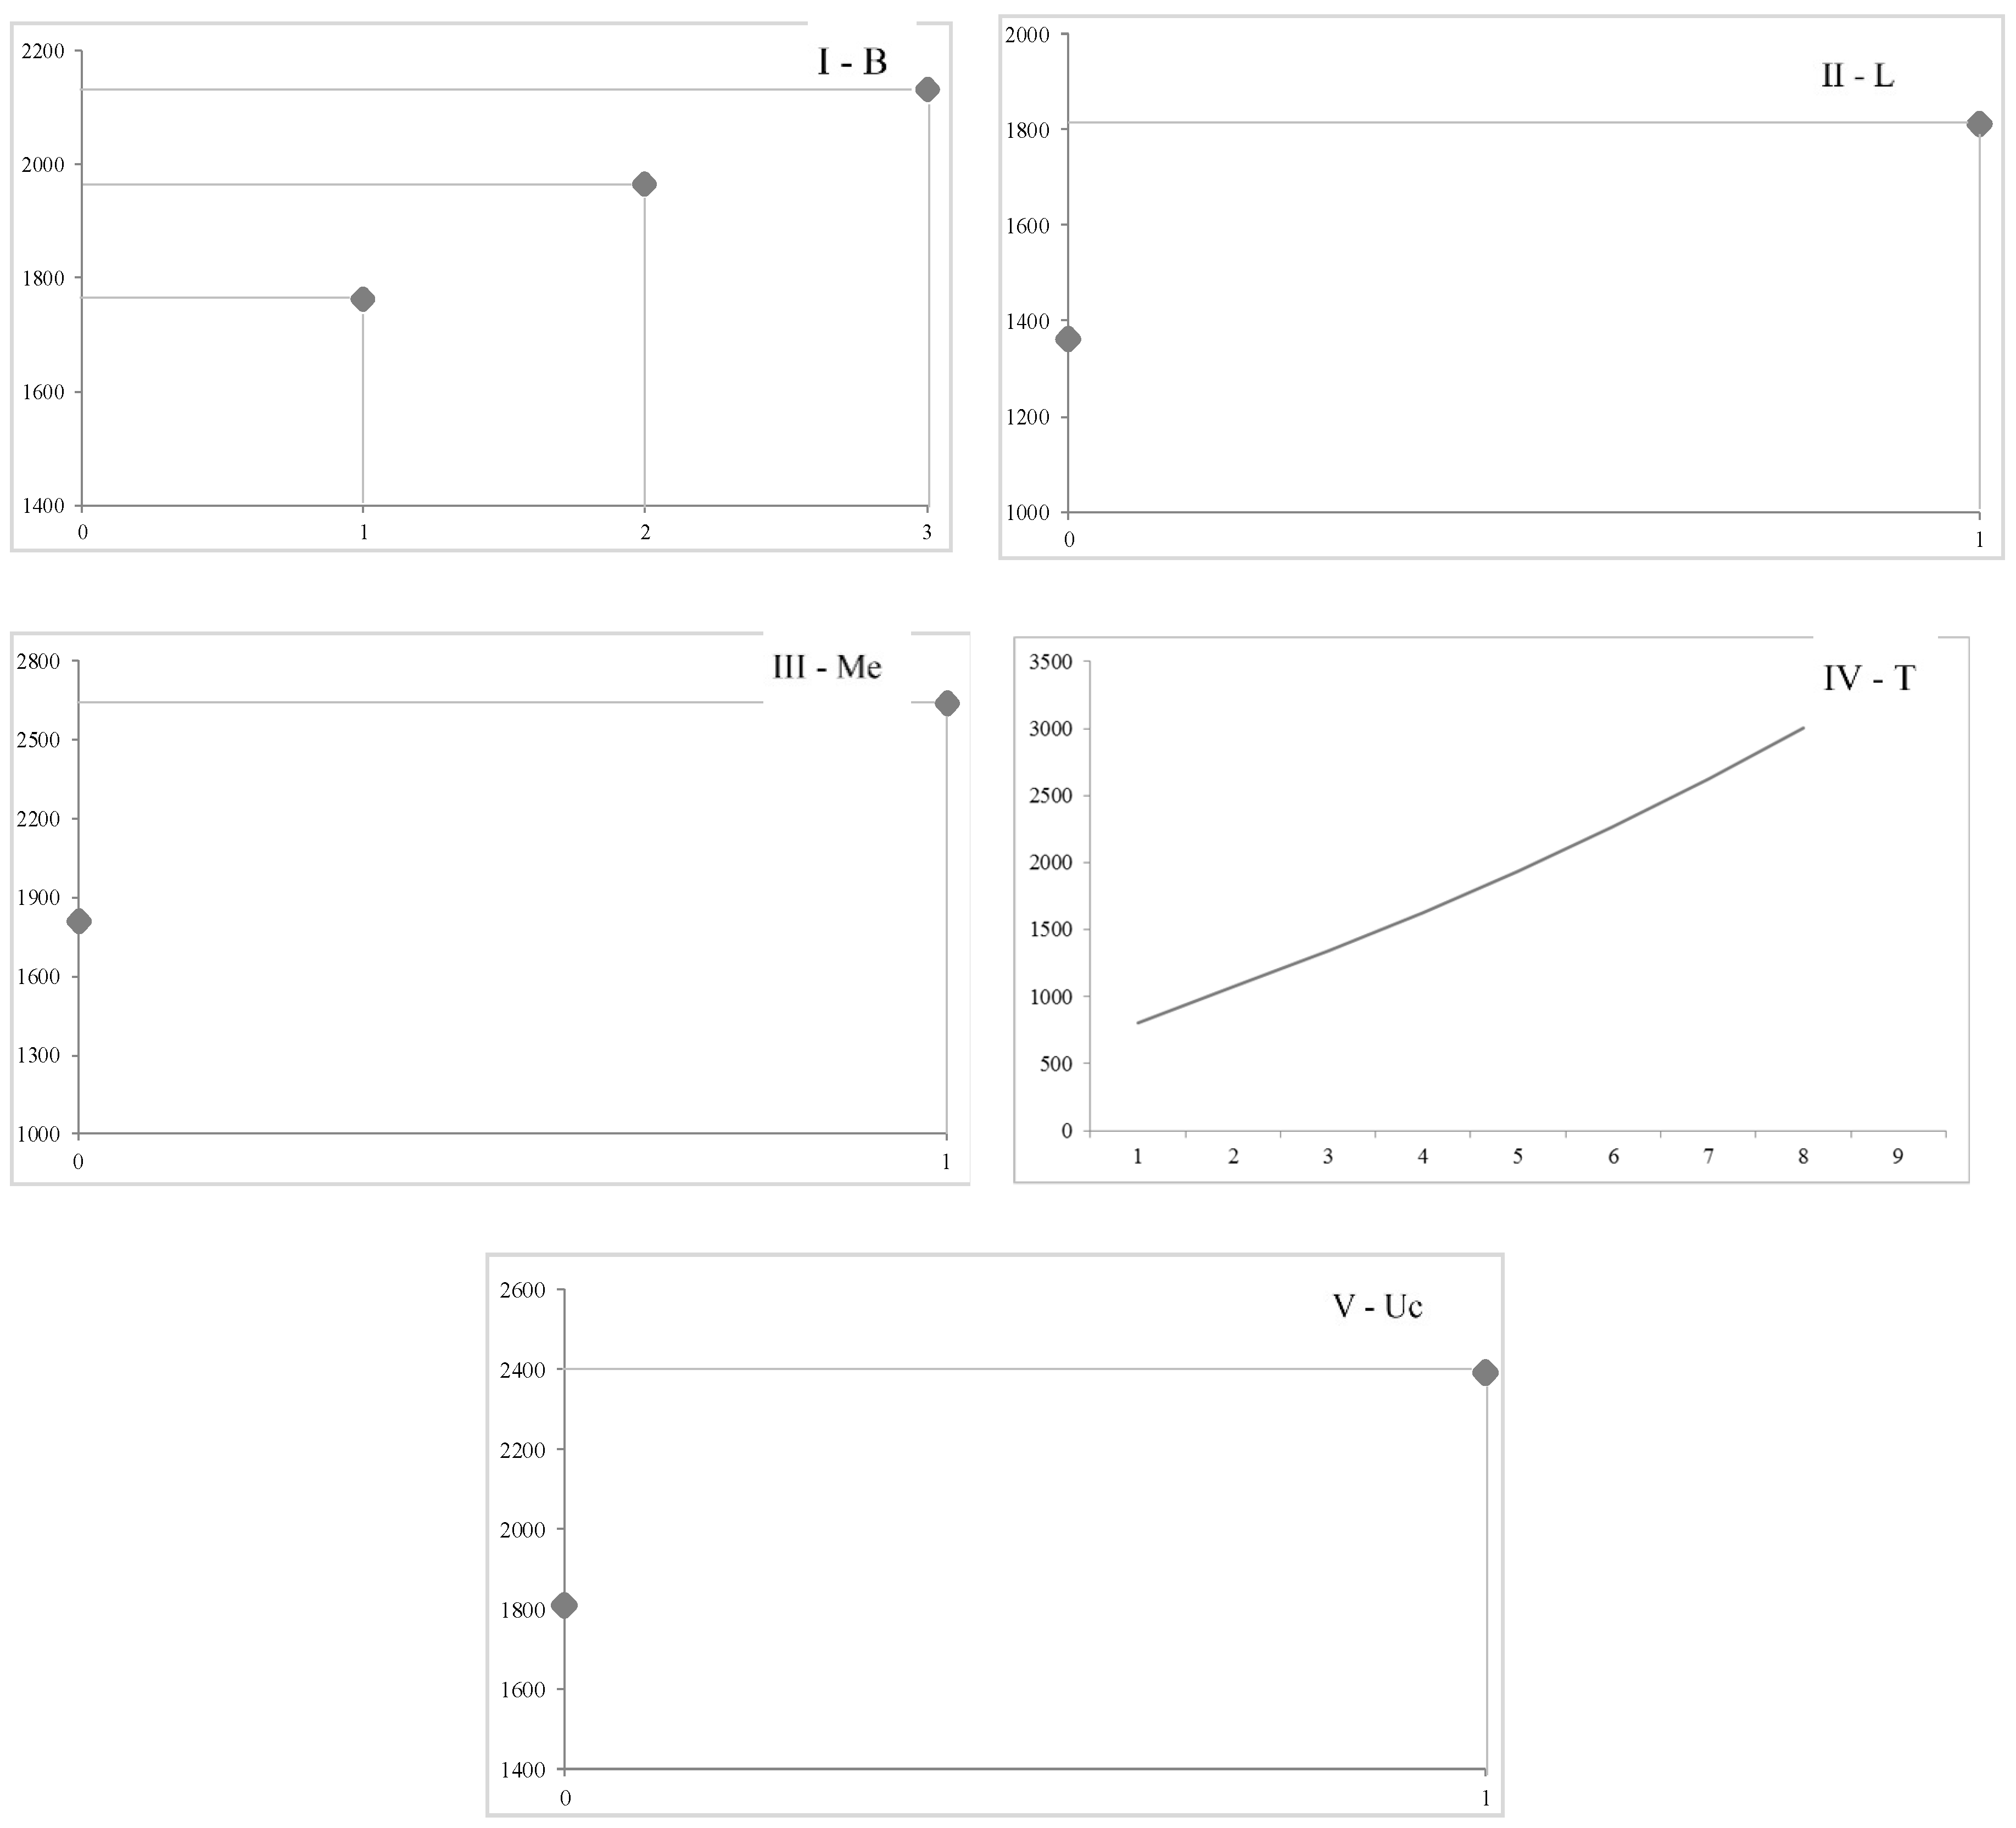
5.2. Empirical Analysis of the Functional Relationships in Each City Model

In order to verify, beyond the statistical accuracy of the models that has been already pointed out, the empirical coherence of the functional relationships determined by the implementation of the multi-case strategy for EPR on the three study samples and to explicit the quantitative contribution of each influencing factor on the selling price formation, a logical-mathematical approach has been adopted. This procedure constitutes an exogenous simplified method that, instead of determining the partial derivative of the dependent variable—P = eY, which is the transformation of the logarithm, in order to obtain the outputs in €/m2 measurement unit—with respect to the i-th variable, provides for the variation of the i-th variable studied in the variation interval in the observed sample by keeping constant and equal to the respective average value the mathematical terms of the other variables.
The application of the defined approach has allowed us to represent the outputs in Figure 1, Figure 2 and Figure 3, which describe the contribution of the influencing factors identified for each study sample on the selling prices in the cities of Bari, Rome, and Turin.
The obtained results confirm the empirically expected relationships between the housing prices and the influencing factors selected by the multi-strategy methodology.
The models for the cities of Bari and Rome have demonstrated a negative functional relationship between the surface of the property (S) and the unit housing prices. With reference to increments equal to 20 m2 in the amplitude range of the samples collected [20–400 m2], in the city of Bari the unit selling prices decreased by −3.5%; for the city of Rome, instead, the obtained model has revealed a particular market behavior—in fact, the contribution of the surface on the unit selling prices is not very significant (−2.5%) if the property is located in a trade area that is different from the “suburban” one (Usb = 0), whereas there is a relevant influence (−23%) if the property belongs to the suburban zone (Usb = 1). This phenomenon, clearly represented in the graph I of Figure 2, is a characteristic of the marginal zone of the city of Rome, in which a substantial absence of market transactions for large property sizes is actually verified.
All of the three models confirm the empirical evidence of the positive correlation between the housing prices and the presence of the lift (L), as well as the selling prices and the number of the bathrooms (B). In particular, the increase of the unit selling price determined by the presence of the lift is equal to +22.22% for the Bari sample, +58.52% for the Rome sample, and +32.96% for the Turin case study, whereas the marginal contribution of the variable B is equal to +6.21% for the city of Bari, +12% for the city of Rome, and +10% for the city of Turin. It should be outlined that the importance of the presence of the lift—especially in the city of Rome—reflects a specific contingence of the Italian context, that is the high percentage of elderly people, generally characterized by a higher purchasing power than the younger ones—according to the United Nations Development Programme (www.undp.org), the average age of Italian people (approximately equal to 45 years old) is the highest in Europe, after Germany (approximately equal to 46 years old).
The floor on which the residential unit is located (F) constitutes an influencing factor on the selling prices in the models for the cities of Bari and Rome; in particular, the models have highlighted a significant increase of the unit housing price if the same property is “transferred” from the ground floor to the first floor (+15.38% for the Bari sample and +31.07% for the Rome case study), whereas the positive marginal contribution is lower for subsequent increments of the floor height (+3.4% for the city of Bari and +6.5% for the city of Rome).
The “excellent” quality of the maintenance condition of the property (Me) presents a relevant positive contribution in both the Bari and Turin residential segments (respectively, +27.70% and +45.82%), whereas the model for the city of Rome has outlined an important inverse correlation (−41.42%) between the “to be restructured” maintenance conditions (Mp) and the housing prices, but this negative contribute only occurs when the property is characterized by the “G” EPC label.
In regards to the energetic variables, according to the model generated for the Bari study sample, the “extreme” EPC labels (EpA and EpG) are characterized by a significant influence on the housing selling prices of the Italian southern city. In fact, other things being equal, the highest EPC label is able to determine an increase of the unit selling prices equal to +26.07%, whereas the lowest EPC label can depreciate a property value of −23.10%. A lower contribution of the “G” EPC label has been detected by the model for the city of Rome, for which this condition involves a decrease of the unit residential price equal to −10.46%. Finally, the model for the city of Turin has not revealed any correlation between the energetic components and the housing prices—this output is consistent with the results obtained by the recent research of Fregonara et al. [126], concerning the limited influence of the energetic components on the selling price in the Turin housing market. The contingence detected is related, on the one hand, to the lack of specific Italian regulations that bind the transactions of existing properties characterized by non-performing energy ratings—probably also to avoid further damaging an already depressed market—, and on the other hand, to the “ordinary” typology of property sold in the Italian metropolitan cities. In fact, the Italian property assets is the oldest in Europe, of which, 70% is represented by buildings realized before 1976, whereas the 25% of the total housing stock has never been affected by any renovation [127,128,129].
The age of the building in which the residential unit is located (O) represents an influencing factor only in the model for the city of Rome. In particular, the graph VII in Figure 2 confirms the empirical evidence of a negative correlation between this parameter and the unit housing price. However, the model obtained has revealed a difference of the unit selling price equal to about −20% between new buildings and recent constructions (<20 years), whereas this negative effect decreases for older properties (−6.0% every ten years).
In regards to the influence on the housing prices of the spatial factors, the models for the cities of Rome and Turin have pointed out a significant influence (respectively, +35.45% and +32.14%) of the property position in the “central” trade area (Uc). Furthermore, the model for the Rome study sample has denoted an inverse correlation between the housing prices and the location of the property in a suburban trade area (Usb), by determining a decrease of the selling prices equal to −35.39%. The distance from the nearest subway (W) has been recognized as an influencing factor in the models for the cities of Bari and Rome, characterized by a negative marginal contribution equal to −6.0% for the Bari sample and −4.8% for the Rome case study. Finally, the contribution of the distance from the nearest highway (T) on the selling prices has been identified by the model for the city of Turin—in this case, the higher distance from air and noise pollution zones determines a higher appreciation of the residential units, equal to about +20% for each further kilometer.

6. Comparison with the Hedonic Price Method

In order to highlight the potentialities of the proposed methodology, the hedonic price method has been implemented on the sample data of each studied city. Table 11, Table 12 and Table 13 show the hedonic models obtained, by considering the log-linear form and the variables selected by the multi-case strategy for EPR algorithm.
The best performances of the proposed methodology are evident. For the city of Bari, the coefficient of determination of the hedonic model was lower (=62.05%) than the statistical indicator related to the corresponding model in Table 8, and the Student’s t-test indicated to exclude some variables (total surface, number of bathrooms, and floor), which instead have been selected by the corresponding model in Table 8 as significant explanatory factors. For the city of Rome, the coefficient of determination of the hedonic model was rather low (=55.77%), the Student’s t-test indicated to exclude several variables (total surface, number of bathrooms, “to be restructured” maintenance conditions, and “G” Energy Performance Certificate label) and the direct correlation between the distance from the nearest subway (W) and the selling prices was not empirically consistent. Finally, the hedonic model for the city of Turin was characterized by better outputs compared to the previous two hedonic models, as the coefficient of determination was equal to 76.52% and the Student’s t-test indicated that all the variables offer a significant contribution to the explanation of the selling prices, however the multi-case strategy for EPR algorithm has allowed us to identify a combination of the factors that is characterized by a better statistical accuracy.

7. Conclusions

Following the global economic crisis triggered by the US subprime, the present research takes into account the current need for rational valuation methodologies, able to correctly interpret the available market data and provide a quick check tool of the punctual assessments performed by the direct valuers that operate in the territory. Therefore, an innovative AVM has been applied to three study samples, collected in three different Italian cities. After detecting, for each case study, the selling prices and the main influencing factors, the implemented methodology, named multi-case strategy for EPR, has generated a “unique” functional form. This is able to simultaneously describe the market relationships in the three different study samples and to generate, for each study sample, the endogenous specification of the multiplicative coefficients of the additive terms in the generalized model.
The application of the methodology has allowed us to define a model, valid at the same time for the three city samples, characterized by a good statistical performance; the specification of the multiplicative coefficients, which reflect the market dynamics of each case study, has allowed us to verify the empirical reliability of the functional relationships between the housing prices and the influencing factors selected by the algorithm of the methodology.
The ability to automatically and quickly select the optimal regressive function for different territorial contexts—in terms of statistical accuracy and understanding—is the main advantage of the implemented algorithm. The comparison with the results obtained by the application of the hedonic price method has highlighted a better statistical performance and a higher empirical reliability related to the models generated by the proposed methodology. Furthermore, the obtained models are easy to interpret and allow people to quickly check the empirical consistency of the functional relationships; in this sense, the methodology could be a further support for direct valuers, as a supplementary tool for the verification of property valuations, in order to avoid the complexity related to more sophisticated methods that, even if they can be statistically more precise, often generate “black boxes” for professional practitioners.
The main limitation of the implemented methodology concerns the sample sizes that have been possible to collect, due to the structural opacity that generally characterizes the Italian real estate market. However, the methodology and the relative application offers a further contribution in the property valuation field and in the reference literature explaining the steps and moving forward in the artificial intelligence methods implemented in the real estate sector. The definition of a single functional form, valid for more territorial contexts and able to synthesize the market relationships between the influencing factors and the selling prices, could provide support for private operators in the assessment of the territorial investment conveniences and for public entities in the decisional phases regarding future tax and urban planning policies, especially when the valuations are simultaneously required for very different locations. That is why further insights could concern the application of the methodology to a multitude of study samples—even different areas of a same city, taking into account the frequent heterogeneousness among the neighborhoods and, consequently, the different market appreciations of the influencing factors in different territorial contexts— in order to define a generalized model, with the corresponding specification of the coefficients according to the market peculiarities of the sites analyzed, which could be effectively used for social, environmental, and economic aims.
Finally, further developments of the analysis aimed at improving the obtained models can concern: the inclusion of the “supply of services” and the “green areas” in the spatial factors [130]; the database extension—whereby it is possible to collect other transactions data in order to validate the analysis outputs better; the comparison of the models obtained for each city with the outputs generated by other methodologies (e.g., a geographically weighted regression when the data are georeferenced).

Author Contributions

The paper is to be attributed in equal parts to the authors.

Funding

This research received no external funding.

Conflicts of Interest

The authors declare no conflict of interest.

References

  1. Lohr, S. The Age of Big Data. New York Times, 11 February 2012. [Google Scholar]
  2. Gillespie, T. The relevance of algorithms. In Media Technologies: Essays on Communication, Materiality, and Society; Gillespie, T., Boczkowski, P.J., Foot, K.A., Eds.; MIT Press: Cambridge, MA, USA, 2014. [Google Scholar]
  3. Thatcher, J. Big Data, Big Questions. Int. J. Commun. 2014, 8, 1765–1783. [Google Scholar]
  4. Rabari, C.; Storper, M. The digital skin of cities: Urban theory and research in the age of the sensored and metered city, ubiquitous computing and big data. Camb. J. Reg. Econ. Soc. 2015, 8, 27–42. [Google Scholar] [CrossRef]
  5. Mostashari, A.; Arnold, F.; Mansouri, M.; Finger, M. Cognitive cities and intelligent urban governance. Netw. Ind. Q. 2011, 13, 4–7. [Google Scholar]
  6. Terán, L.; Kaskina, A.; Meier, A. Maturity model for cognitive cities. In Towards Cognitive Cities. Studies in Systems, Decision and Control; Portmann, E., Finger, M., Eds.; Springer: Cham, Switzerland, 2016; Volume 63, pp. 37–59. [Google Scholar]
  7. Dachuan, C.; Baoshan, Z. The applications of big data in housing information system. J. Inf. Commun. Technol. 2012, 5, 4. [Google Scholar]
  8. Juan, Y. The precise marketing based on big data in the real estate enterprises. J. Mark. Wkly. 2013, 9, 66–67. [Google Scholar]
  9. Du, D.; Li, A.; Zhang, L. Survey on the applications of Big Data in Chinese Real Estate Enterprise. Proced. Comput. Sci. 2014, 30, 24–33. [Google Scholar] [CrossRef]
  10. Stumpf González, M.A.; Torres Formoso, C. Mass appraisal with genetic fuzzy rule-based systems. Prop. Manag. 2006, 24, 20–30. [Google Scholar] [CrossRef]
  11. Batty, M. Smart cities, big data. Environ. Plan. B 2012, 39, 191–193. [Google Scholar] [CrossRef]
  12. Burgess, J.; Bruns, A. Twitter archives and the challenges of “big social data” for media and communication research. M/C J. 2012, 15, 1–7. Available online: http://www.journal.mediaculture.org.au/index.php/mcjournal/arti-cle/view/561 (accessed on 20 February 2018).
  13. Giddens, A. The Consequences of Modernity; Polity Press: Cambridge, MA, USA, 1990. [Google Scholar]
  14. Siwei, C. The fundamentals and research methods of fictitious economy. J. Manag. Rev. 2009, 21, 3–18. [Google Scholar]
  15. McCluskey, W.; Anand, S. The application of intelligent hybrid techniques for the mass appraisal of residential properties. J. Prop. Invest. Financ. 1999, 17, 218–238. [Google Scholar] [CrossRef]
  16. Pagourtzi, E.; Assimakopoulos, V.; Hatzichristos, T.; French, N. Real estate appraisal: A review of valuation methods. J. Prop. Invest. Financ. 2003, 21, 383–401. [Google Scholar] [CrossRef]
  17. French, N.; Gabrielli, L. Pricing to market: Property valuation revisited: The hierarchy of valuation approaches, methods and models. J. Prop. Invest. Financ. 2018, 36, 391–396. [Google Scholar] [CrossRef]
  18. Metzner, S.; Kindt, A. Determination of the parameters of automated valuation models for the hedonic property valuation of residential properties: A literature-based approach. Int. J. Hous. Mark. Anal. 2018, 11, 73–100. [Google Scholar] [CrossRef]
  19. D’Amato, M.; Kauko, T. Advances in Automated Valuation Modeling; Springer: Cham, Switzerland, 2017. [Google Scholar]
  20. Jud, G.D.; Winkler, D.T. Location and Amenities in Determining Apartment Rents: An Integer Programming Approach. Apprais. J. 1991, 59, 266–275. [Google Scholar]
  21. Des Rosiers, F.; Thériault, M. Rental Amenities and the Stability of Hedonic Prices: A Comparative analysis of Five Market Segments. J. Real Estate Res. 1996, 12, 17–36. [Google Scholar]
  22. Mejia, L.C.; Benjamin, J.D. What Do We Know About the Determinants of Shopping Center Sales? Spatial vs. Non-Spatial Factors. J. Real Estate Lit. 2002, 10, 3–26. [Google Scholar]
  23. Des Rosiers, F.; Thériault, M.; Ménétrier, L. Spatial Versus Non-Spatial Determinants of Shopping Center Rents: Modeling Location and Neighborhood-Related Factors. J. Real Estate Res. 2005, 27, 293–319. [Google Scholar]
  24. Emerson, F. Valuation of residential amenities: An econometric approach. Apprais. J. 1972, 40, 268–278. [Google Scholar]
  25. Blomquist, G.; Worley, L. Hedonic prices, demand for urban housing amenities and benefit estimates. J. Urb. Econ. 1981, 9, 212–221. [Google Scholar] [CrossRef]
  26. Sirmans, G.S.; Benjamin, J.D. Determining apartment rent: The value of amenities, services and external factors. J. Real Estate Res. 1989, 4, 33–43. [Google Scholar]
  27. Fletcher, M.; Gallimore, P.; Mangan, J. The modelling of housing submarkets. J. Prop. Invest. Financ. 2000, 18, 473–487. [Google Scholar] [CrossRef]
  28. Morancho, A. A hedonic valuation of urban green areas. Landsc. Urb. Plan. 2003, 66, 35–41. [Google Scholar] [CrossRef]
  29. Jim, C.Y.; Chen, W.Y. Impacts of urban environmental elements on residential housing prices in Guangzhou (China). Landsc. Urb. Plan. 2006, 78, 422–434. [Google Scholar] [CrossRef]
  30. Brander, L.M.; Koetse, M.J. The Value of urban open space: Meta-analyses of contingent valuation and hedonic pricing results. J. Environ. Manag. 2011, 92, 2763–2773. [Google Scholar] [CrossRef] [PubMed]
  31. Li, M.; Brown, J. Micro-neighbourhood externalities and hedonic housing prices. Land Econ. 1980, 56, 125–141. [Google Scholar] [CrossRef]
  32. Hickman, E.P.; Gaines, J.P.; Ingram, F.J. The influence of neighbourhood quality on residential values. Real Estate Apprais. Anal. 1984, 50, 36–42. [Google Scholar]
  33. Clark, D.E.; Herrin, W.E. The impact of public school attributes on home sale prices in California. Growth Chang. 2000, 31, 385–407. [Google Scholar] [CrossRef]
  34. Figlio, D.N.; Lucas, M.E. What’s in a grade? School report cards and the housing market. Am. Econ. Rev. 2004, 94, 591–604. [Google Scholar] [CrossRef]
  35. Xu, T.; Zhang, M.; Aditjandra, P.T. The impact of urban rail transit on commercial property value: New evidence from Wuhan, China. Transp. Res. Part A Policy Pract. 2016, 91, 223–235. [Google Scholar] [CrossRef] [Green Version]
  36. Yang, L.; Wang, B.; Zhang, Y.; Ye, Z.; Wang, Y.; Li, P. Willing to pay more for high-quality schools? A hedonic pricing and propensity score matching approach. Int. Rev. Spat. Plan. Sustain. Dev. 2018, 6, 45–62. [Google Scholar] [CrossRef]
  37. Crompton, J.L. The impact of parks on property values: A review of the empirical evidence. J. Leis. Res. 2001, 33, 1–31. [Google Scholar] [CrossRef]
  38. Din, A.; Hoesli, M.; Bender, A. Environmental variables and real estate prices. Urb. Stud. 2001, 38, 1989–2000. [Google Scholar] [CrossRef]
  39. Lutzenhiser, M.; Netusil, N.R. The effect of open spaces on a home’s sale price. Contemp. Econ. Policy 2001, 19, 291–298. [Google Scholar] [CrossRef]
  40. Netusil, N.R. Urban environmental amenities and property values: Does ownership matter? Land Use Policy 2013, 31, 371–377. [Google Scholar] [CrossRef]
  41. Kestens, Y.; Thériault, M.; Des Rosiers, F. The Impact of Surrounding Land Use and Vegetation on Single-Family House Prices. Environ. Plan. B Plan. Des. 2004, 31, 539–567. [Google Scholar] [CrossRef]
  42. Andersson, D.E.; Shyr, O.F.; Fu, J. Does high-speed rail accessibility influence residential property prices? Hedonic estimates from southern Taiwan. J. Transp. Geogr. 2010, 18, 166–174. [Google Scholar] [CrossRef]
  43. Deng, T.; Nelson, J.D. Bus rapid transit implementation in Beijing: An evaluation of performance and impacts. Res. Transp. Econ. 2013, 39, 108–113. [Google Scholar] [CrossRef]
  44. Shyr, O.F.; Andersson, D.E.; Li, Y.T.; Tu, C.H. The Xueshan Tunnel and the enlargement of the Taipei Metropolitan Area. Surv. Built Environ. 2018, 26, 9–31. [Google Scholar]
  45. Yang, L.; Zhou, J.; Shyr, O.F.; Huo, D. Does bus accessibility affect property prices? Cities 2019, 84, 56–65. [Google Scholar] [CrossRef]
  46. Feige, A.; Mcallister, P.; Wallbaum, H. Rental price and sustainability ratings: Which sustainability criteria are really paying back? Constr. Manag. Econ. 2013, 31, 322–334. [Google Scholar] [CrossRef]
  47. Taltavull de La Paz, P.; Perez-Sanchez, V.R.; Mora-Garcia, R.T.; Perez-Sanchez, J.C. Green Premium Evidence from Climatic Areas: A Case in Southern Europe, Alicante (Spain). Sustainability 2019, 11, 686. [Google Scholar] [CrossRef]
  48. Manganelli, B.; Morano, P.; Tajani, F.; Salvo, F. Affordability Assessment of Energy-Efficient Building Construction in Italy. Sustainability 2019, 11, 249. [Google Scholar] [CrossRef]
  49. Potepan, M.J. Explaining intermetropolitan variation in housing prices, rents and land prices. Real Estate Econ. 1996, 24, 219–245. [Google Scholar] [CrossRef]
  50. Taltavull de La Paz, P. Determinants of housing prices in Spanish cities. J. Prop. Invest. Financ. 2003, 21, 109–135. [Google Scholar] [CrossRef]
  51. Kryvobokov, M. What location attributes are the most important for market value? Extraction of attributes from regression models. Prop. Manag. 2007, 25, 257–286. [Google Scholar]
  52. Gibler, K.M.; Tyvimaa, T.; Kananen, J. The relationship between the determinants of rental housing satisfaction and considering moving in Finland. Prop. Manag. 2014, 32, 104–124. [Google Scholar] [CrossRef]
  53. Sdino, L.; Zorzi, F.; Rosasco, P.; Magoni, S. The Mass Appraisal Tool: Application of a Pluri-Parametric Model for the Appraisal of Real Properties. In Appraisal: From Theory to Practice; Stanghellini, S., Morano, P., Bottero, M., Oppio, A., Eds.; Springer: Cham, Switzerland, 2017. [Google Scholar]
  54. Boyd, D.; Crawford, K. Critical questions for big data, Information. Commun. Soc. 2012, 15, 662–679. [Google Scholar] [CrossRef]
  55. Kauko, T.; D’Amato, M. Mass Appraisal Methods: An International Perspective for Property Valuers; John Wiley & Sons: New Jersey, NJ, USA, 2009. [Google Scholar]
  56. Borst, R. Artificial neural networks: The next modelling/calibration technology for the assessment community? Prop. Tax J. 1991, 10, 69–94. [Google Scholar]
  57. Collins, A.; Evans, A. Artificial Neural networks: An application to residential valuation in the U.K. J. Prop. Valuat. Invest. 1994, 11, 195–204. [Google Scholar]
  58. Worzala, E.; Lenk, M.; Silva, A. An exploration of neural networks and its application to real estate valuation. J. Real Estate Res. 1995, 10, 185–201. [Google Scholar]
  59. Bonissone, P.P.; Cheetam, W.; Golibersuch, D.C.; Khedkar, P. Automated Residential Property Valuation: An Accurate and Reliable Approach Based on SoftComputing. In Soft Computing in Financial Engineering; Ribeiro, R., Zimmermann, H., Yager, R.R., Kacprzyk, J., Eds.; Physica-Verlag: Heidelberg, Germany, 1998. [Google Scholar]
  60. McGreal, S.; Adair, A.; McBurney, D.; Patterson, D. Neural networks: The prediction of residential values. J. Prop. Valuat. Invest. 1998, 16, 57–70. [Google Scholar] [CrossRef]
  61. Gallego, J. La inteligencia artificial aplicada a la valoración de inmuebles. Un ejemplo para valorar Madrid. Rev. CT/Catastro 2004, 50, 51–67. [Google Scholar]
  62. Kauko, T.; Hooimeijer, P.; Hakfoort, J. Capturing housing market segmentation: An alternative approach based on neural network modeling. Hous. Stud. 2002, 17, 875–894. [Google Scholar] [CrossRef]
  63. Do, A.Q.; Grudnitski, G. A neural network analysis of the effect of age on housing values. J. Real Estate Res. 1993, 8, 253–264. [Google Scholar]
  64. Islam, K.S.; Asami, Y. Housing market segmentation: A review. Rev. Urban Reg. Dev. Stud. 2009, 21, 93–109. [Google Scholar] [CrossRef]
  65. Byrne, P. Fuzzy analysis: A vague way of dealing with uncertainty in real estate analysis. J. Prop. Valuat. Invest. 1994, 13, 22–41. [Google Scholar] [CrossRef]
  66. Bagnoli, C.; Smith, H.C. The theory of fuzzy logic and its application to real estate valuation. J. Real Estate Res. 1998, 16, 169–200. [Google Scholar]
  67. Mao, Y.; Wu, W. Fuzzy real option evaluation of real estate project based on risk analysis. Syst. Eng. Proced. 2011, 1, 228–235. [Google Scholar] [CrossRef]
  68. Chang, Y.; Ko, T. An interactive dynamic multi-objective programming model to support better land use planning. Land Use Policy 2013, 36, 13–22. [Google Scholar] [CrossRef]
  69. Bonissone, P.P.; Cheetham, W. Financial applications of fuzzy case-based reasoning to residential property valuation. Fuzz IEEE 1997, 1, 37–44. [Google Scholar]
  70. Siniak, N. Fuzzy Numbers for the Real Estate Valuation. In Proceedings of the 9th European Real Estate Society Conference (ERES), Glasgow, UK, 4–7 June 2002. [Google Scholar]
  71. Tse, R.Y.C. An application of the ARIMA model to real estate prices in Hong Kong. J. Prop. Financ. 1997, 8, 152–163. [Google Scholar] [CrossRef]
  72. Makridakis, S.; Wheelwright, S.C.; Hyndman, R.J. Forecasting: Methods and Applications, 3rd ed.; John Wiley & Sons: New York, NY, USA, 1998. [Google Scholar]
  73. Sivitanides, P.; Southard, J.; Torto, R.G.; Wheaton, W.C. The determinants of appraisal-based capitalization rates. Real Estate Financ. 2001, 18, 27–38. [Google Scholar]
  74. Iacoviello, M. Consumption, house prices, and collateral constraints: A structural econometric analysis. J. Hous. Econ. 2004, 13, 304–320. [Google Scholar] [CrossRef]
  75. Elbourne, A. The UK housing market and the monetary policy transmission mechanism: An SVAR approach. J. Hous. Econ. 2008, 17, 65–87. [Google Scholar] [CrossRef]
  76. Chen, N.K.; Chen, S.S.; Chou, Y.H. House prices, collateral constraint, and the asymmetric effect on consumption. J. Hous. Econ. 2010, 19, 26–37. [Google Scholar] [CrossRef]
  77. Kim Hin, D.H.; Calero Cuervo, J. A cointegration approach to the price dynamics of private housing. J. Prop. Invest. Financ. 1999, 17, 35–60. [Google Scholar] [CrossRef]
  78. Anselin, L.; Getis, A. Spatial statistical analysis and geographic information systems. Ann. Reg. Sci. 1992, 26, 19–33. [Google Scholar] [CrossRef]
  79. Griffith, D.A. Advanced spatial statistics for analyzing and visualizing geo-references data. Int. J. Geogr. Inf. Syst. 1993, 7, 107–124. [Google Scholar] [CrossRef]
  80. Zhang, Z.; Griffith, D. Developing user-friendly spatial statistical analysis modules for GIS: An example using ArcView. Comput. Environ. Urb. Syst. 1993, 21, 5–29. [Google Scholar] [CrossRef]
  81. Levine, N. Spatial statistics and GIS: Software tools to quantify spatial patterns. J. Am. Plan. Assoc. 1996, 62, 381–390. [Google Scholar] [CrossRef]
  82. Ord, J.K.; Getis, A. Spatial autocorrelation statistics: Distribution issues and an application. Geogr. Anal. 1995, 27, 286–306. [Google Scholar] [CrossRef]
  83. Tiefelsdorf, M.; Boots, B. A note on the extremities of local Moran’s its and their impact on global Moran’s I. Geogr. Anal. 1997, 29, 248–257. [Google Scholar] [CrossRef]
  84. Dubin, R.A. Spatial autocorrelation and neighbourhood quality. Reg. Sci. Urb. Econ. 1992, 22, 433–452. [Google Scholar] [CrossRef]
  85. Wyatt, P.J. Using a GIS for property valuation. J. Prop. Valuat. Invest. 1995, 14, 67–79. [Google Scholar] [CrossRef]
  86. La Rose, T.A. Global response surface analysis used to update appraisals in a computer assisted mass appraisal environment. Presented at the World Congress III of Computer Assisted Valuation and Land Information Systems, Cambridge, MA, USA, 7–12 August 1988. [Google Scholar]
  87. Kettani, O.; Oral, M.; Siskos, Y. A multiple criteria analysis model for real estate valuation. J. Glob. Optim. 1998, 12, 197–214. [Google Scholar] [CrossRef]
  88. Kettani, O.; Khelifi, K. PariTOP: A goal programming-based software for real estate assessment. Eur. J. Oper. Res. 2001, 133, 362–376. [Google Scholar] [CrossRef]
  89. Estellita Lins, M.P.; De Lyra Novaes, L.F.; LoureiroLegey, L.F. Real Estate Appraisal: A double perspective data envelopment analysis approach. Ann. Oper. Res. 2005, 138, 79–96. [Google Scholar] [CrossRef]
  90. Adolphson, D.L.; Cornia, G.C.; Walters, L.C. Railroad property valuation using Data Envelopment Analysis. Interfaces 1989, 19, 18–26. [Google Scholar] [CrossRef]
  91. Król, D.; Lasota, T.; Trawiński, B.; Trawiński, K. Investigation of evolutionary optimization methods of TSK fuzzy model for real estate appraisal. Int. J. Hybrid Intell. Syst. 2008, 5, 111–128. [Google Scholar] [CrossRef] [Green Version]
  92. Wang, W.K. A knowledge-based decision support system for measuring the performance of government real estate investment. Expert Syst. Appl. 2005, 29, 901–912. [Google Scholar] [CrossRef]
  93. Dzeng, R.J.; Lee, H.Y. Optimizing the development schedule of resort projects by integrating simulation and genetic algorithm. Int. J. Proj. Manag. 2007, 25, 506–516. [Google Scholar] [CrossRef]
  94. Rezania, M.; Javadi, A.A.; Giustolisi, O. An evolutionary-based data mining technique for assessment of civil engineering systems. Eng. Comput. 2008, 25, 500–517. [Google Scholar] [CrossRef]
  95. Mancarella, D.; Simeone, V. Modellazione e previsione nei sistemi idrogeologici mediante la tecnica EPR (Evolutionary Polynomial Regression). G. Geol. Appl. 2008, 8, 5–16. [Google Scholar]
  96. Giustolisi, O.; Savic, D. Advances in data-driven analyses and modelling using EPR-MOGA. J. Hydroinf. 2009, 11, 225–236. [Google Scholar] [CrossRef]
  97. Morano, P.; Tajani, F.; Locurcio, M. Land use, economic welfare and property values: An analysis of the interdependencies of the real estate market with zonal and macro-economic variables in the municipalities of Apulia Region (Italy). Int. J. Agric. Environ. Inf. Syst. 2015, 6, 16–39. [Google Scholar] [CrossRef]
  98. Tajani, F.; Morano, P.; Ntalianis, K. Automated Valuation Models for real estate portflios: A method for the value updates of the property assets. J. Prop. Invest. Financ. 2018, 36, 324–347. [Google Scholar] [CrossRef]
  99. Morano, P.; Tajani, F.; Locurcio, M. GIS application and econometric analysis for the verification of the financial feasibility of roof-top wind turbines in the city of Bari (Italy). Renew. Sustain. Energy Rev. 2017, 70, 999–1010. [Google Scholar] [CrossRef]
  100. Tajani, F.; Morano, P.; Torre, C.M.; Di Liddo, F. An Analysis of the Influence of Property Tax on Housing Prices in the Apulia Region (Italy). Buildings 2017, 7, 67. [Google Scholar] [CrossRef]
  101. Tajani, F.; Morano, P.; Locurcio, M.; Torre, C.M. Data-driven techniques for mass appraisals. Applications to the residential market of the city of Bari (Italy). Int. J. Bus. Intell. Data Min. 2016, 11, 109–129. [Google Scholar] [CrossRef]
  102. Morano, P.; Tajani, F.; Locurcio, M. Multicriteria analysis and genetic algorithms for mass appraisals in the Italian property market. Int. J. Hous. Mark. Anal. 2018, 11, 229–262. [Google Scholar] [CrossRef]
  103. Grether, D.M.; Mieszkowski, P. Determinants of real estate values. J. Urb. Econ. 1974, 1, 127–145. [Google Scholar] [CrossRef]
  104. Gelfand, A.E.; Ghosh, S.; Knight, J.R.; Sirmans, C.F. Spatio-temporal modeling of residential sales data. J. Bus. Econ. Stat. 1998, 16, 312–321. [Google Scholar]
  105. McCluskey, W.J.; Deddis, W.G.; Lamont, I.G.; Borst, R.A. The application of surface generated interpolation models for the prediction of residential property values. J. Prop. Invest. Financ. 2000, 18, 162–176. [Google Scholar] [CrossRef] [Green Version]
  106. Selim, H. Determinants of house prices in Turkey: Hedonic regression versus artificial neural network. Expert Syst. Appl. 2009, 36, 2843–2852. [Google Scholar] [CrossRef]
  107. Janssen, C.; Yang, Z. Estimating the market value of a proposed townhouse development. J. Prop. Invest. Financ. 1999, 17, 501–516. [Google Scholar] [CrossRef]
  108. Bourassa, S.; Cantoni, E.; Hoesli, M. Predicting house prices with spatial dependence: A comparison of alternative methods. J. Real Estate Res. 2010, 32, 139–159. [Google Scholar]
  109. Bourassa, S.; Hoesli, M.; Peng, V.S. Do housing submarkets really matter? J. Hous. Econ. 2003, 12, 12–28. [Google Scholar] [CrossRef] [Green Version]
  110. Hardy, M.A. Regression with Dummy Variables. Sage Publ. 1993, 93. [Google Scholar]
  111. Simonotti, M. Un’applicazione dell’analisi di regressione multipla nella stima di appartamenti. Genio Rurale 1991, 2, 209–227. [Google Scholar]
  112. Curto, R. La quantificazione e costruzione di variabili qualitative stratificate nella multiple regression analysis (MRA) applicata ai mercati immobiliari. Aestimum 1994, 2, 195–223. [Google Scholar]
  113. Del Giudice, V.; De Paola, P. Spatial analysis of residential real estate rental market with Geoadditive Models. In Advances in Automated Valuation Modeling; D’Amato, M., Kauko, T., Eds.; Springer: Cham, Switzerland, 2017. [Google Scholar]
  114. D’Amato, M. Location value response surface model as Automated Valuation Methodology: A case in Bari. In Advances in Automated Valuation Modeling; D’Amato, M., Kauko, T., Eds.; Springer: Cham, Switzerland, 2017. [Google Scholar]
  115. Green, S.B. How many subjects does it take to do a regression analysis? Multivar. Behav. Res. 1991, 26, 499–510. [Google Scholar] [CrossRef] [PubMed]
  116. Box, G.E.; Tidwell, P.W. Transformation of the independent variables. Technometrics 1962, 4, 531–550. [Google Scholar] [CrossRef]
  117. Box, G.E.; Cox, D.R. An analysis of transformations. J. R. Stat. Soc. Ser. B. Methodol. 1964, 26, 211–252. [Google Scholar] [CrossRef]
  118. Berardi, L.; Kapelan, Z. Multi-case EPR strategy for the development of sewer failure performance indicators. In Proceedings of the World Environmental and Water Resources Congress 2007: Restoring Our Natural Habitat, Tampa, FL, USA, 15–19 May 2007; pp. 1–12. [Google Scholar]
  119. Cassel, E.; Mendelsohn, R. The choice of functional forms for hedonic price equations: Comment. J. Urb. Econ. 1985, 18, 135–142. [Google Scholar] [CrossRef]
  120. Bowes, D.R.; Ihlanfeldt, K.R. Identifying the impacts of rail transit stations on residential property values. J. Urb. Econ. 2001, 50, 1–25. [Google Scholar] [CrossRef]
  121. Lynch, A.K.; Rasmussen, D.W. Proximity, neighbourhood and the efficacy of exclusion. Urb. Stud. 2004, 41, 285–298. [Google Scholar] [CrossRef]
  122. Malpezzi, S.; Chun, G.H.; Green, R.K. New place-to-place housing price indexes for US metropolitan areas, and their determinants. Real Estate Econ. 1998, 26, 235–274. [Google Scholar] [CrossRef]
  123. Morano, P.; Tajani, F. Estimative analysis of a segment of the bare ownership market of residential property. In Proceedings of the 13th International Conference on Computational Science and Its Applications (ICCSA 2013), Ho Chi Minh City, Vietnam, 24–27 June 2013; pp. 433–443. [Google Scholar]
  124. Cropper, M.L.; Leland, B.D.; McConnell, K.E. On the choice of functional form for hedonic price functions. Rev. Econ. Stat. 1988, 70, 668–675. [Google Scholar] [CrossRef]
  125. Efron, B. Estimating the error rate of a prediction rule: Improvement on cross-validation. J. Am. Stat. Assoc. 1983, 78, 316–330. [Google Scholar] [CrossRef]
  126. Fregonara, E.; Rolando, D.; Semeraro, P. Energy performance certificates in the Turin real estate market. J. Eur. Real Estate Res. 2017, 10, 149–169. [Google Scholar] [CrossRef]
  127. Building Stock Observatory. 2018. Available online: https://ec.europa.eu/energy/en/eubuildings (accessed on 4 March 2018).
  128. D’Alpaos, C.; Bragolusi, P. Buildings energy retrofit valuation approaches: State of the art and future perspectives. Valori e Valutazioni 2018, 20, 79–94. [Google Scholar]
  129. Malerba, A.; Massimo, D.E.; Musolino, M.; Nicoletti, F.; De Paola, P. Post Carbon City: Building valuation and Energy Performance Simulation Programs. Smart Innov. Syst. Technol. 2019, 2019, 101. [Google Scholar]
  130. Oppio, A.; Bottero, M.; Arcidiacono, A. Assessing urban quality: A proposal for a MCDA evaluation framework. Ann. Oper. Res. 2018, 1–18. [Google Scholar] [CrossRef]
Figure 1. Functional relationships between the unit housing prices (€/m2) and the influencing factors in the Bari model (total surface (S), number of bathrooms (B), floor level (F), presence of the lift (L), “excellent” maintenance conditions (Me), the highest EPC label (EpA), the lowest EPC label (EpG), distance from the nearest subway (W)).
Sustainability 11 04896 g001
Figure 2. Functional relationships between the unit housing prices (€/m2) and the influencing factors in the Rome model (total surface (S), number of bathrooms (B), floor level (F), presence of the lift (L), “to be restructured” maintenance conditions (Mp), the lowest EPC label (EpG), age of the building (O), distance from the nearest subway (W), central trade area location (Uc), suburban trade area location (Usb)).
Sustainability 11 04896 g002
Figure 3. Functional relationships between the unit housing prices (€/m2) and the influencing factors in the Turin model (number of bathrooms (B), presence of the lift (L), “excellent” maintenance conditions (Me), distance from the nearest highway (T), central trade area location (Uc)).
Sustainability 11 04896 g003
Table 1. Specification of the variables in analysis.
VariableAcronymType of VariableMeasure
Unit selling pricePcardinal€/m2
Technical factors
Floor surfaceScardinalm2
Number of bathroomsBcardinalnumber
FloorFcardinalnumber
Presence of liftLdummy1—presence, 0—absence
Quality of the maintenance condition of the apartmentMpdummy1—category that defines the specific quality of each property, 0—the remaining two categories
Mg
Me
EPC labelEpAdummy1—EPC label of the property, 0—all the others
EpB
EpC
EpD
EpE
EpF
EpG
Age of the buildingOcardinalNumber—difference between the year of sale and the construction year of the building
Spatial factors
Distance from the nearest highwayTcardinalkm by car
Distance from the nearest subwayWcardinalkm by walking
Municipal zoneUcdummy1—if the property belongs to the specific trade area, 0—all the remaining spatial factors
Usc
Up
Usb
Table 2. Sample descriptive statistics for the city of Bari.
VariableMeanStandard DeviationLevels/IntervalsFrequency
Unit selling price [€/m2]2244812
Technical factors
Floor surface [m2]99.0848.27
<500.105
50–700.19
70–1100.30
110–1500.26
>1500.145
Number of bathrooms [n.]1.4850.558
10.545
20.425
30.03
Floor [n.]2.5852.264
00.12
10.335
20.10
30.165
40.085
50.065
>50.13
Presence of lift [1—presence, 0—absence]0.720.45
00.28
10.72
Quality of the maintenance condition To be restructured0.53
Good0.29
Excellent0.18
EPC label A0.155
B0.08
C0.105
D0.12
E0.085
F0.16
G0.295
Age of the building [difference between the year of sale and the construction year of the building]42.512.52
<100.285
10–300.11
30–500.19
>500.415
Spatial factors
Distance from the nearest highway [km by car]2.7751.409
<20.315
2–30.265
3–40.18
>40.24
Distance from the nearest subway [km by walking]2.8762.338
<10.255
1–20.21
2–60.395
>60.14
Municipal zone Central0.505
Semi-central0.17
Peripheral0.11
Suburban0.215
Table 3. Sample descriptive statistics for the city of Rome.
VariableMeanStandard DeviationLevels/IntervalsFrequency
Unit selling price [€/m2]29921569
Technical factors
Floor surface [m2]10752.02
<500.115
50–700.12
70–1100.39
110–1500.245
>1500.13
Number of bathrooms [n.]1.570.64
10.51
20.405
30.085
Floor [n.]2.461.85
00.095
10.27
20.205
30.175
40.115
50.075
>50.065
Presence of lift [1—presence, 0—absence]0.700.46
00.3
10.7
Quality of the maintenance condition To be restructured0.305
Good0.335
Excellent0.36
EPC label A0.185
B0.045
C0.085
D0.055
E0.11
F0.255
G0.265
Age of the building [difference between the year of sale and the construction year of the building]70.5057.25
<100.14
10–500.24
50–800.335
>800.285
Spatial factors
Distance from the nearest highway [km by car]3.291.52
<20.19
2–30.35
3–40.225
>40.235
Distance from the nearest subway [km by walking]1.201.04
<0.50.295
0.5–10.315
1–30.335
>30.055
Municipal zone Central0.34
Semi-central0.35
Peripheral0.135
Suburban0.175
Table 4. Sample descriptive statistics for the city of Turin.
VariableMeanStandard DeviationLevels/IntervalsFrequency
Unit selling price [€/m2]24681316
Technical factors
Floor surface [m2]79.3944.33
<500.27
50–700.295
70–1100.27
110–1500.105
>1500.06
Number of bathrooms [n.]1.210.45
10.81
20.17
30.02
Floor [n.]2.411.64
00.045
10.335
20.19
30.215
40.095
50.09
>50.03
Presence of lift [1—presence, 0—absence]0.750.44
00.255
10.745
Quality of the maintenance condition To be restructured0.23
Good0.29
Excellent0.48
EPC label A0.235
B0.055
C0.17
D0.22
E0.11
F0.075
G0.135
Age of the building [difference between the year of sale and the construction year of the building]83.2574.03
<100.14
10–500.24
50–800.33
>800.29
Spatial factors
Distance from the nearest highway [km by car]4.991.38
<30.13
3–50.345
5–60.275
>60.25
Distance from the nearest subway [km by walking]1.571.15
<0.50.235
0.5–10.185
1–30.465
>30.115
Municipal zone Central0.30
Semi-central0.48
Peripheral0.22
Suburban0.00
Table 5. Mathematical specification of the multi-case strategy for EPR model implemented.
Polynomial Expression Structure Y = a 0 + i = 1 n [ a i ( X 1 ) ( i , 1 ) ( X j ) ( i , j ) f ( ( X 1 ) ( i , j + 1 ) ( X j ) ( i , 2 j ) ) ]
Inner Function fNo function f
Modeling TypeStatical Regression
Maximum Number of Terms10
Exponents[−2, −1.5, −1, −0.5, 0, 0.5, 1, 1.5, 2]
Regression MethodLS (Least Squares)
Table 6. Equations obtained by the implementation of the proposed methodology.
Equation (n)ModelCODMCS [%]
(3) Y = + a 1 U s b 0.5 + a 2 T + a 3 M e 0.5 + a 4 L 0.5 + a 0 60.00
(4) Y = + a 1 U c 0.5 + a 2 T + a 3 M e 0.5 + a 4 B 0.5 L 0.5 + a 5 S 2 U s b + a 0 63.78
(5) Y = + a 1 U c 0.5 + a 2 T + a 3 E p G 0.5 + a 4 M e 0.5 + a 5 L 0.5 + a 6 S 0.5 + a 7 S 2 U s b + a 0 65.89
(6) Y = + a 1 U c 2 + a 2 T 0.5 + a 3 E p G 0.5 + a 4 M e 0.5 + + a 5 L 0.5 + a 6 S W 0.5 + a 7 S 2 U s b + a 0 66.13
(7) Y = + a 1 U c 0.5 + a 2 T 0.5 + a 3 E p G 0.5 + a 4 M e 0.5 + a 5 L 0.5 + + a 6 F 0.5 + a 7 S W 0.5 + a 8 S 2 U s b + a 0 69.60
(8) Y = + a 1 U c 0.5 + a 2 T 0.5 + a 3 E p G 0.5 + a 4 M e 0.5 + a 5 L 0.5 + + a 6 F 0.5 E p G 0.5 + a 7 S U s b + a 8 S W + a 0 70.87
(9) Y = + a 1 U c 0.5 + a 2 T 0.5 + a 3 E p G 0.5 + a 4 E p A 0.5 + a 5 M e 0.5 + + a 6 L 0.5 + a 7 F 0.5 E p G 0.5 + a 8 S W + a 9 S 2 U s b + a 0 71.28
(10) Y = + a 1 U c 0.5 + a 2 T 0.5 + a 3 E p G 0.5 + a 4 E p A 0.5 + a 5 M e 0.5 + + a 6 M p + a 7 F 0.5 E p G 0.5 + a 8 B 0.5 L 0.5 + a 9 S W + a 10 S 2 U s b + a 0 72.34
(11) Y = + a 1 U c 0.5 + a 2 T 0.5 + a 3 E p G 0.5 + a 4 E p A 0.5 + a 5 M e 0.5 + a 6 M p E p G O 0.5 + + a 7 F 0.5 E p G 0.5 + a 8 B 0.5 L 0.5 + a 9 S W + a 10 S 2 U s b + a 0 78.32
Table 7. Parameters (a0 and ai) of the model for the three case studies.
a0a1a2a3a4a5a6a7a8a9a10
BARI7.5900−0.490.230.2400.140.16−0.00060
ROME7.420.300000−0.060.270.37−0.0009−3.8E-05
TURIN5.500.280.77000.38000.2600
Table 8. Models for the three case studies and respective statistical performance indicators.
ModelRMSE [%]MAPE [%]MaxAPE [%]
BARI Y = 7.59 0.49 E p G 0.5 + 0.23 E p A 0.5 + 0.24 M e 0.5 + + 0.14 F 0.5 E p G 0.5 + 0.16 B 0.5 L 0.5 0.0006 S W 4.032.419.62
ROME Y = 7.42 + 0.30 U c 0.5 0.06 M p E p G Y 0.5 + 0.27 F 0.5 E p G 0.5 + + 0.37 B 0.5 L 0.5 0.0009 S W 0.00003 S 2 U s b 3.893.028.37
TURIN Y = 5.50 + 0.28 U c 0.5 + 0.77 T 0.5 + + 0.38 M e 0.5 + 0.26 B 0.5 L 0.5 4.152.588.24
Table 9. Average percentage errors [%] between the detected prices and the estimated prices obtained through a ten-fold cross-validation.
BARIROMETURIN
Training SetValidation SetTraining SetValidation SetTraining SetValidation Set
Iteration 12.5452.9852.9853.2543.0213.245
Iteration 22.8162.6572.8353.3272.8542.745
Iteration 33.1203.2473.0212.9892.9683.040
Iteration 43.0583.0493.2543.6542.4762.847
Iteration 52.4592.8433.1153.0183.1242.980
Iteration 62.8472.6423.5413.8993.0163.124
Iteration 72.0122.4513.0953.3672.0122.743
Iteration 82.2672.8972.9993.2532.9152.802
Iteration 93.1963.0743.0012.8993.0473.000
Iteration 103.0873.5473.1523.4732.6823.086
Table 10. Variables selected by the model for the three case studies.
SBFLMpMeEpAEpGOTWUcUsb
BARI Sustainability 11 04896 i001 Sustainability 11 04896 i001 Sustainability 11 04896 i001 Sustainability 11 04896 i001 Sustainability 11 04896 i001 Sustainability 11 04896 i001 Sustainability 11 04896 i001 Sustainability 11 04896 i001
ROME Sustainability 11 04896 i001 Sustainability 11 04896 i001 Sustainability 11 04896 i001 Sustainability 11 04896 i001 Sustainability 11 04896 i001 Sustainability 11 04896 i001 Sustainability 11 04896 i001 Sustainability 11 04896 i001 Sustainability 11 04896 i001 Sustainability 11 04896 i001
TURIN Sustainability 11 04896 i001 Sustainability 11 04896 i001 Sustainability 11 04896 i001 Sustainability 11 04896 i001 Sustainability 11 04896 i001
Table 11. Hedonic price method results for the city of Bari.
VariableCoefficientSignificance
constant7.5181***
S−0.0006-
B0.0108-
F0.0136-
L0.2304***
Me0.2479***
EpA0.2127***
EpG−0.2736***
W−0.0403***
Notes: “***” is for <0.01, “**” is for <0.05, “*” is for <0.1; sample size = 200; residual standard error = 0.2592; R2 = 0.6358; adjusted R2 = 0.6205; F-statistic = 41.685 on 191 degrees of freedom, p-value: <0.0001; VIF statistics < 5.
Table 12. Hedonic price method results for the city of Rome.
VariableCoefficientSignificance
constant7.2210***
S0.0008-
B0.0810-
F0.0338**
L0.4320***
Mp−0.0652-
EpG−0.0607-
W0.1160***
O−0.0009*
Uc0.2697***
Usb−0.5254***
Notes: “***” is for <0.01, “**” is for <0.05, “*” is for <0.1; sample size = 200; residual standard error = 0.3674; R2 = 0.58; adjusted R2 = 0.5577; F-statistic = 25.972 on 188 degrees of freedom, p-value: <0.0001; VIF statistics < 5.
Table 13. Hedonic price method results for the city of Turin
VariableCoefficientSignificance
constant6.1522***
B0.1196***
L0.2630***
Me0.3748***
T0.1840***
Uc0.2684***
Notes: “***” is for <0.01, “**” is for <0.05, “*” is for <0.1; sample size = 200; residual standard error = 0.2627; R2 = 0.7711; adjusted R2 = 0.7652; F-statistic = 130.74 on 194 degrees of freedom, p-value: <0.0001; VIF statistics < 5.

