Article

Assessing and Representing Livability through the Analysis of Residential Preference

1
Department of Geoinformatics—Z_GIS, University of Salzburg, 5020 Salzburg, Austria
2
Department of Public Affairs, Latin American Social Sciences Institute–FLACSO, Quito 170135, Ecuador
3
Center for Geographic Analysis, Harvard University, Cambridge, MA 02138, USA
4
Centre for the Future of Places, KTH Royal Institute of Technology, Drottning Kristinas väg 30, 114 28 Stockholm, Sweden
*
Author to whom correspondence should be addressed.
Sustainability 2019, 11(18), 4934; https://0-doi-org.brum.beds.ac.uk/10.3390/su11184934
Submission received: 24 July 2019 / Revised: 15 August 2019 / Accepted: 6 September 2019 / Published: 10 September 2019
(This article belongs to the Special Issue Assessing The New Urban Agenda)

Abstract

:
Livability reflects the quality of the person–environment relationship, namely how well the built environment or the available services in a city fulfill the residents’ needs and expectations. We argue that livability assessment can aid the implementation of certain New Urban Agenda (NUA) goals by providing a flexible way to assess urban environments and their quality. However, a reliable and transferable assessment framework requires the key elements of livability to be defined in such a way that measurable factors adequately represent the person–environment relationship. As an innovative approach, we determined key livability elements accordingly and asked over 400 residents worldwide to evaluate their urban environments using these parameters. Thereby, we could calibrate the livability assessment workflow by including personal aspects and identifying the most relevant livability factors through an ordinal regression analysis. Next, we performed relational-statistical learning in order to define the individual and combined contribution of these statistically significant factors to the overall livability of a place. We found that urban form and mobility-related factors tend to have the highest influence on residential satisfaction. Finally, we tested the robustness of the assessment by using geospatial analysis to model the livability for the city of Vienna, Austria. We concluded that the workflow allows for a reliable livability assessment and for further utilization in urban planning, improving urban quality by going beyond simple city rankings.

1. Introduction

Cities are facing diverse challenges worldwide, both of local and global origin. Some cities are experiencing intensified urban heat [1] or natural disasters induced by climate change [2], while others suffer from air and noise pollution due to traffic and industrial activity [3,4]. These problems often generate or exacerbate social challenges, including poverty, segregation, gentrification, and overpopulation [4]. All of these phenomena tend to influence the perceived “livability” of cities—that is, the quality of the person–environment relationship, or how well the built environment and the available services fulfill the residents’ needs and expectations. These impacts on livability are usually perceived as negative—although not every city is affected to an equal extent, due to their geographic locations or socioeconomic conditions [5].
The term “livability” has become popular mainly thanks to livability rankings and indices aiming to quantify urban quality [6]. However, in this work, we argue that “livability”—if interpreted appropriately—is more than just a statistical index or marketing tool. By facilitating the evaluation of the person–environment relationship, livability can serve as a useful conceptual and analytical framework to improve the quality of urban life. This evaluation should aim to specifically measure how well the built environment and the available services in a city fulfill the residents’ needs and expectations.
In recent years, two international landmark agreements have focused attention on urban challenges and the high relevance of improving the quality of life in cities: the United Nations’ Sustainable Development Goals (SDGs) and the New Urban Agenda (NUA). In particular, SDG #11 aims for inclusive, safe, resilient, and sustainable cities, while the NUA articulates a number of actions needed to improve cities all over the world [7]. In the case of the SDGs, there is extensive language about “good health and well-being”, “clean water and sanitation”, solid waste management, air quality, provision of basic services and infrastructure, control of sprawl, and other cornerstones of urban livability. In the case of the NUA, there is even more specific language about “enhancing livability”.
It is important to recognize the challenges of creating more livable cities and to raise awareness amongst citizens and decision-makers about urban issues; however, both the SDGs and the NUA represent only the starting point of any solution for these challenges. While researchers and decision-makers seem to be aware of what goals should be achieved and why, the follow-up question is how to actually achieve these goals. As part of the SDG framework, several UN institutes designed a list of indicators to facilitate the achievement of the SDG targets [8]. However, these indices predominantly focus on data and quantitative metrics to allow for statistical performance values, instead of addressing how the residents experience living in a given city. For example, SDG indicator 11.2.1 describes the “proportion of population that has convenient access to public transport, by sex, age and persons with disabilities”, where we may need to define first what “convenient access” means to these different groups, ideally followed by the mapping of this accessibility within the city to differentiate where and what types of problems are attributed to public transport. Such a spatially explicit approach could diagnose priority areas for planning actions, and may help to improve the understanding of such problems. We argue that the concept of livability, by focusing on the different aspects of the person–environment relationship, can provide a transferable framework for this purpose. Transferability of the assessment procedure is crucial, as one measure may work in a given city, but may not be a solution elsewhere.
To this end, existing urban quality (or livability) assessment approaches usually do not consider the person–environment relationship at different thematic and spatial scales, especially in a transferable way. Their analyses often focus either on a city or a region, e.g., [9,10,11], or provide frameworks for ranking cities through complex indices, e.g., [6,12]. Works in the former group are usually quite thorough, but often not transferable; their direct adaptation to other cities is thereby limited. On the other hand, complex statistical indices for city ranking often ignore spatial aspects, especially regarding the intra-urban variance of the different factors, as well as the varying socioeconomic backgrounds of the residents included in the analysis [13,14].
Hence, in this work we have proposed a methodology for conceptualizing urban livability and its assessment in a systematic way. As a follow-up to the conceptual framework, we designed a survey to inspect the subjective aspects of livability along with the satisfaction of dwellers concerning urban life. Next, we applied regression analysis to our questionnaire responses, which served as an input for relational-statistical learning. We were thereby able to estimate the contribution of each livability factor (individually and combined) in the form of probability values of being satisfied with urban life in a given area. To validate the results of these probabilities we compared our modeled values with the ones from the questionnaire for the city of Vienna, Austria. Overall, by identifying key factors to assess, and by developing a transferable analysis workflow, we have argued that the resulting livability assessment framework can “diagnose” a city by assessing the quality of the person–environment relationship. This approach can thereby help planners to improve urban quality of life more efficiently, and also in line with the objectives of the NUA and SDGs.

2. Challenges of Defining and Assessing Livability

Livability is a widely used term, especially when referring to urban environments, and yet there is no general consensus on how to define it precisely [15,16]. The existence of numerous similar and overlapping concepts (e.g., quality of life, well-being, sustainability) makes a consistent interpretation even more challenging [15,17,18,19,20,21]. Livability is one of the main types of quality of life, and refers to an outer quality that can influence inner qualities of life such as life satisfaction [19]. Quality of life can be interpreted as a multiscale concept that represents conditions of individuals and society [22,23], and can be defined according to Glatzer through positive and negative well-being expectations and perceptions [24]. Moreover, quality of life is also a multidimensional concept that can be interpreted by understanding dimensions of physical, material, and emotional well-being, as well as development (e.g., individual choice or competence) and activity (e.g., work, leisure) [25].
To provide a general overview on the variety of available livability definitions, we mainly focused on available literature review studies evaluating a large amount of urban environmental quality-related research, such as the work of van Kamp et al. [15] who scrutinized conceptual models (both theoretical and empirical) related to livability. The majority of the definitions collected by the authors agreed upon some basic elements of livability: what the urban living environment (both natural and built elements) provides and how it is connected to the individuals, e.g., according to their needs or capabilities, etc. The authors listed livability-related factors such as personal characteristics, community, built and natural environment, or public services, but did not consider their analysis per se, or how the overall livability of a place could be assessed. Van Kamp et al. [15] concluded that the concepts of livability, environmental quality, and sustainability overlap, because all of them represent different aspects of the person–environment relationship.
Pacione investigated this relationship, emphasizing the subjectivity of the objective environment, and explained that this “[…] perception of the city is represented as a joint function of the objective environmental conditions (e.g., population density, temperature, pollution levels) and the individual characteristics of the person (e.g., adaptation level, previous experience, and time in the city).” [18] (p. 8). One such personal factor is residential satisfaction, which depends on, among other things, the person’s length of residence in the neighborhood and their socio-economic level [26]. Besides residential satisfaction, the degree of integration of the individual into society [27], the hierarchy of human needs [28], and the individual’s aspiration level [29] are factors which can affect one’s perception towards the environment.
To represent the highly practical aspects of livability, Young and Hermanson [20] systematically synthesized current practices in livability improvement and examined overlapping definitions and concepts. The authors analyzed interpretations by local actors, such as associations, governmental organizations, and policy makers, who implement livability-related principles on a daily basis. Their work reflects the relevance and importance of livability in planning [30].
The fact that the connection between the environment and the person is bi-directional increases the challenges of livability assessment and improvement even further [21,31]. People perceive their environment according to their individual characteristics, but as Pacione [18] observed, the “[…] built environment can influence the behavior and well-being of people [as well] by, for example, facilitating or discouraging interaction, fostering a sense of identity, or alienating people from their surroundings.” [18] (p. 12). Once this effect of the built environment is understood, the efficiency of decision makers’ and urban planners’ actions toward creating livable places can be enhanced. Since livability-related improvements are complex, this endeavor requires a firm theoretical basis and assessment of the current situation, as well as cooperation among planners, architects, social scientists, and policy makers [31,32].
Although there is a common agreement that livability is an essential concept in urban planning, assessing livability is still vulnerable to subjective variation among residents. Even if there is a set of (measurable) characteristics that define when a place is livable, these features do not have the same importance for everyone, and even for the same person, the importance varies over time [17,18,19,21]. Furthermore, even seemingly objective factors are not perceived objectively, and their representativeness, in general, is hard to assess because of their ad hoc nature [22]. Due to these individual and varying characteristics regarding human needs and the subjectivity of people’s perceptions, one must be careful not to try to over-assert the livability of a given place as an independent objective condition. Obviously, there are objective characteristics of a city (such as crime rates, demographical statistics, infrastructure-related metrics), but they are not directly usable as factors in livability assessment where the goal is to describe the highly contextual relationship between human needs and the functionality provided by the environment, and to what extent these needs are fulfilled. For example, crime rates (provided as official statistics) and the actual perceived safety (relying on subjective perception) can have very different interpretations.
Therefore, we have differentiated between measurable and objective factors in our assessment framework. A factor might be measurable (e.g., perceived safety), but instead of objectivity, our aim was to detect the relevance or perception of that specific factor for citizens on an individual level. In this context, it is helpful to treat cities as complex systems, due to the large number of different sub-systems featuring various spatial and temporal characteristics (e.g., transportation, road network, natural environment, building infrastructure) [33,34]. Due to the dynamic nature of cities, it is crucial to consider the spatial and temporal aspects of these (sub)systems in urban analysis, which can be done by using geographic information systems (GIS) in a systematic way. The benefit of GIS is their demonstrated value in collecting, storing, and analyzing data systematically, usually with spatial (and temporal) relations, and also according to thematic groups representing various elements of the urban system (e.g., transportation, urban green, shopping facilities). Moreover, GIS combined with other methods, such as sensor measurements and questionnaires, can provide a powerful methodology for assessment and analysis, e.g., [35,36,37]. By visualizing the results of various GIS analyses in the form of maps, we can support planners and decision-makers or other stakeholders in urban quality improvement. However, before leveraging GIS in a new assessment framework, livability as a concept needs a more precise definition, particularly since its factors and their transferable assessment have not been sufficiently investigated to date.
Accordingly, instead of static, separate factors, the spatio-temporal patterns of urban life should be grasped in context to understand most of the phenomena. This can be performed by applying an integrated approach in an assessment framework where not only are simple values measured, but the connections between the factors and spatio-temporal aspects are also considered. For instance, encounters, optional and necessary outdoor activities and their spatio-temporal characteristics, or accessibility to specific functions (e.g., shopping, leisure, meeting) can provide indirect information on urban environmental quality, and therefore have an influence on livability. However, simple factors and metrics such as the number of shops or parks (without considering how they can actually be accessed) are not able to represent these phenomena in relation to each other, and thereby actual information on the person–environment relationship is lacking [21,38]. The difference might be not so significant in the input data sets or the analysis methods, but the overall interpretation for livability is highly relevant.

3. The Conceptual Livability Framework

3.1. Theoretical Foundations

As stated above, we have interpreted livability as the quality of the person–environment relationship, based on what the environment provides and how it fulfills the needs and expectations of the residents. Regarding livability and urban life in general, we can differentiate between basic needs (shelter, safety, clean water, electricity, etc.), where the physical environment and infrastructure is clearly dominant [28,39,40], and advanced needs (sense of belonging, creative activities, or prestige), where the environment is just the medium in which some of these activities take place. In this sense, the more needs a place can “effectively” satisfy, the more livable it is [28,39,40]. However, in the case of these more specific needs, there is a much stronger, non-physical benefit, which should be considered as well.
A common but difficult question is how one person’s individual needs relate to the needs of other citizens. Although it is a challenging situation for planners who aim to improve livability if the interests of given people and groups conflict with the values or needs of other groups, a full investigation of this question is beyond the scope of this article. These conflicts often arise at a personal scale, owing, for example, to different personal tastes, especially in the case of more advanced needs, such as leisure or identity. However, conflicts are less frequent at larger intersubjective scales, where more “average” and shared tastes might apply, related to rather basic needs, such as mobility, safety, or legibility. Overall, scale can remain a major problem: the interpretation of livability is more subjective at individual scales, whereas planning actions are carried out on larger scales. Therefore, the acknowledgment of more intersubjective and more universal measures of livability might be beneficial.
Another significant challenge with livability as a basis of assessments is the subjective and potentially vague nature of the concept. A way to clarify the concept and its “intersubjective” status is the so-called “capability approach”. Developed primarily by Nussbaum and Sen [41], this approach establishes a deeper theoretical basis for livability assessment. People’s capabilities are real opportunities to do and be what they have reason to value [42]. Thus, the livability of the environment is, in part, the degree to which it enhances these capabilities, or, conversely, frustrates them. The concept of capability (and the related concept of “affordance” [43]) has been used in a wide range of economic and social fields, and has also been applied to the context of urban life and quality, e.g., [16,41,44]. However, to our knowledge, the direct application of the capability approach to overall livability assessment is a new line of inquiry.
By using the capability approach, we can acknowledge and manage the high level of subjectivity in livability assessment, since this concept relies on individual differences in the ability to transform resources into valuable activities [41,42]. This statement reemphasizes the essence of livability, namely that the urban environment is there for every dweller in a city, but provides only “life chances” [19], and, depending on the person’s characteristics and motivation, it can result in very different perceptions and utilization of the same environment.

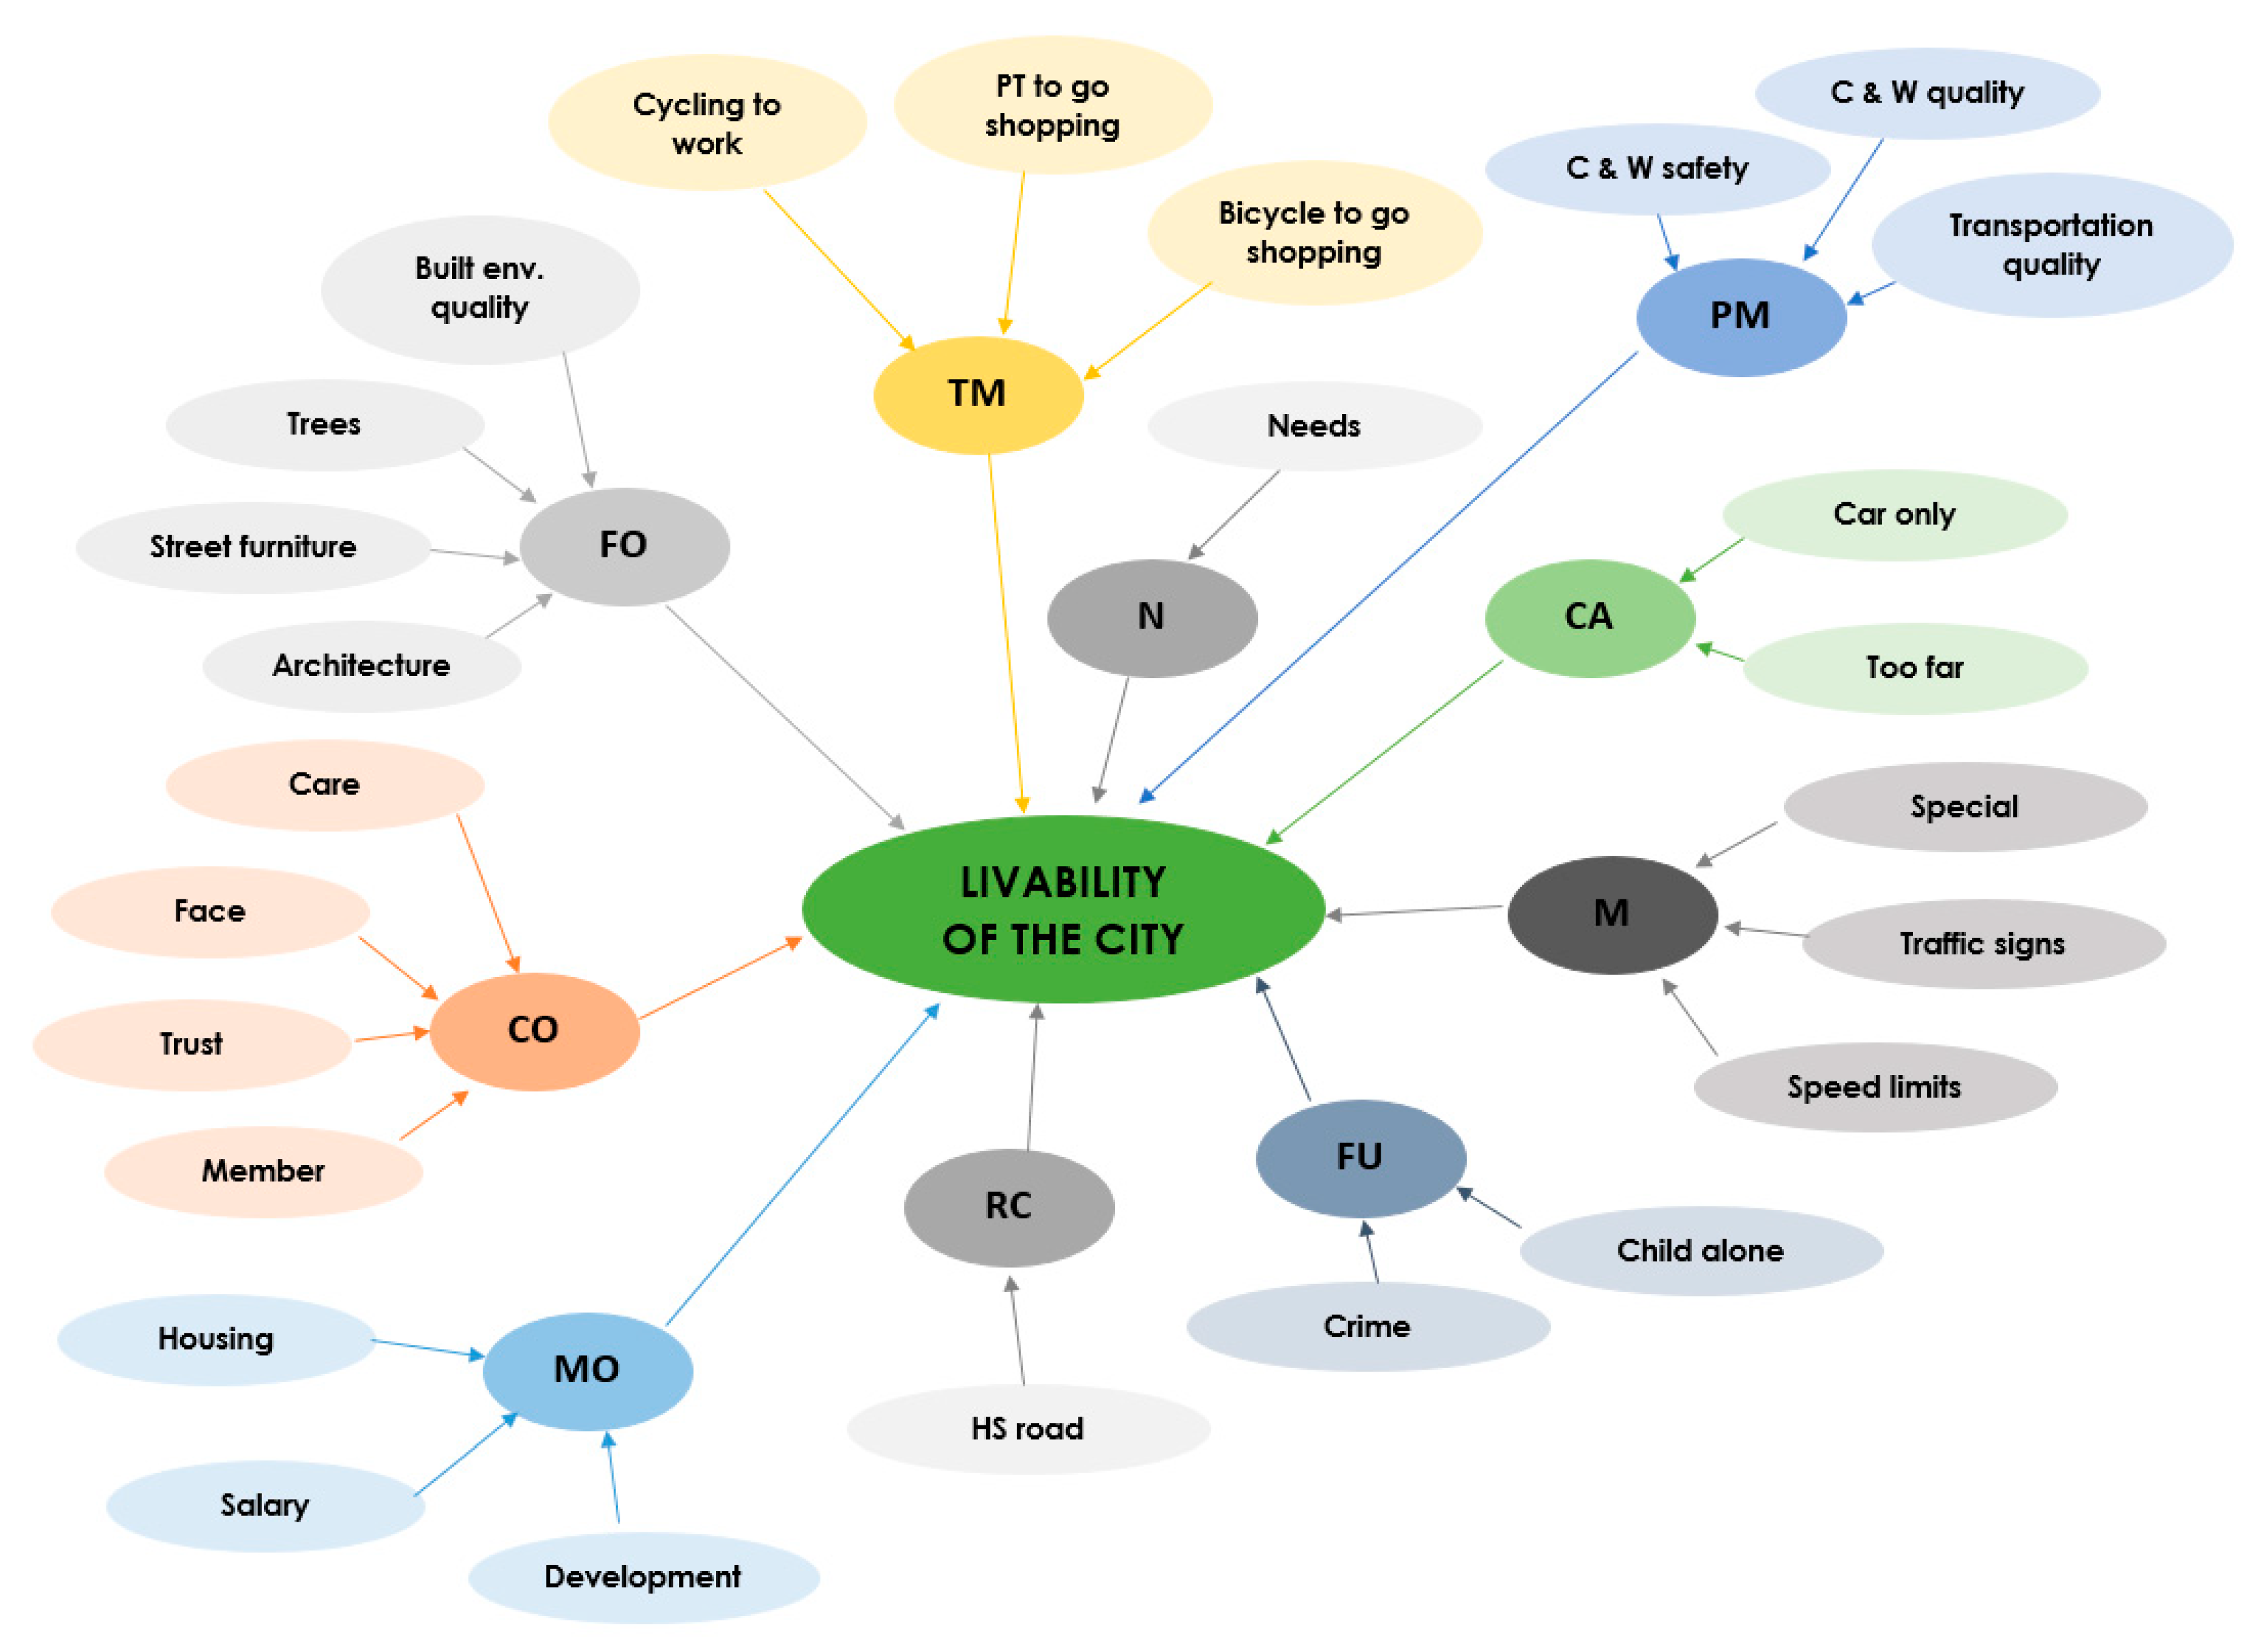
3.2. Key Elements and Their Relationships in the Conceptual Livability Framework

To conceptualize livability, we generalized urban life to three main components reflecting the key elements of the person–environment relationship [15,18]. The first component is the built and natural environment along with the infrastructure, described as “urban form”. The second component represents what this environment can provide for the citizens as “urban functions”, also reflecting how the people use the environment in light of its functionality. The third component is the quality of the previous two components itself, described as “urban livability”, i.e., how well the environment can satisfy the citizens’ needs and expectations. As also acknowledged by the capability approach, this component depends on many individual factors, such as length of the residency, sense of place, and even the degree of integration into society, while the needs and expectations themselves can also vary according to the development of an area (Figure 1).
Figure 1 attempts to generalize the interrelationship of urban form, urban function, and livability. The upper part represents the expectations, i.e., the goal state towards the urban environment on an individual level, whereas the lower part contains elements of the urban environment as the appraisal (or actual) state on city level [45]. Among individual preferences, the two main elements are human needs and personal values, which define the goals and capabilities of the people and raise challenges in livability assessment by causing high subjectivity and variability. However, this approach is able to reflect the important aspects of urban life from different social groups’ or individuals’ perspective.
On a city level, we can distinguish urban form and urban function, but cannot separate them because of their complex mutual influence on each other [46]. Urban form represents the physical environment, including what people see and how they feel in this urban environment, and urban functions show how this environment is used or can be used. Figure 1 illustrates that livability is the representation of individuals’ perception of the quality of urban form and function according to their own needs and further personal features.
One reason for mobility being highlighted in Figure 1 as a key phenomenon is that its aspects are related to all elements of livability. Human needs and available urban functions define the destination that a person intends to reach, while personal values might affect the transportation mode. Moreover, urban form influences the actual route according to the infrastructure. Therefore, we argue that mobility has a special role in livability. We tested this hypothesis by including it in our survey (Section 4.1) to see how residents perceive mobility conditions in detail. Based on this hypothesis, mobility conditions in livability assessment should not just reflect quantitative aspects such as existing infrastructure, because, if interpreted correctly the analysis can also reveal important connections among other factors such as safety, health, or even economics.
Another aspect of the relevance of mobility is the ability to represent effective access to urban functions. For instance, if we compare two areas with the same number and quality of functions, the area where the accessibility of these functions is better can be considered more livable. The reason for this is that better functionality cannot itself compensate weaknesses in mobility and accessibility, as those functions must also be reached by the people. Furthermore, data on people’s mobility (e.g., trajectories) are tangible for quantitative livability measures. At the same time, they can also represent qualitative characteristics, such as the quality of the urban environment, based on the amount of time spent there and the preferences of the people, for instance, by comparing which route they took, what the destination is, or what transportation mode they chose. Therefore, using mobility as an indicator or proxy for livability assessment needs to be further examined, because it represents more than just one of the many livability factors. Rather, it allows the connections between other livability factors and urban phenomena to be revealed and highlights the relevance of spatio-temporal aspects when assessing livability.

4. Methodology

4.1. The Design of the Survey

The conceptual framework for livability is detailed in Section 3, which was used as a basis for our survey to collect the views of residents in various cities on their interpretations of a livable environment (Figure 2). As study areas, we selected eight cities with different development statuses to represent a wide spectrum of population. The survey addressed five main livability categories as well as general satisfaction with living in the given city. The topics were sense of community, urban form, urban function, mobility, and housing. The whole questionnaire consisted of 49 questions and was available in four languages (English, German, Spanish, and Hungarian). Except for León, Nicaragua (and some instances in Nairobi, Kenya) we used the online version of the questionnaire to ask local people. As livability is a highly subjective concept, it was difficult to unambiguously define a representative population sample. Our selection criteria relied on the following principles:
  • Represent different levels of economic development: Livability rankings tend to focus only on large cities located in countries with a mature development status; these rankings therefore predominantly represent a Western culture. To get a broader overview, we included cities from Africa and Latin America to study whether the level of economic development and cultural differences may influence the perception of relevant livability factors.
  • Different population sizes: We selected the study areas to represent cities with different sizes and political roles, such as regional centers and capitals with a few million people.
  • Age and sex of the respondents: We asked that residents were at least 18 years old, but we also tried to represent the older population, as their needs and expectations may be specific. In terms of sex, we tried to represent both sexes in around the same proportion.
  • Local expertise: Although we did not aim for city-specific results, it was relevant to select cities where the authors or their colleagues were familiar with the local circumstances.
  • Around 50 participants per study area: This sample size was not enough to support city-scale analysis, however, a minimum of 50 responses rendered it possible to represent the various age groups and areas within a city, while keeping the effort required to find respondents reasonable.
Our study area included eight cities from six different countries (Table 1). Nicaragua, Kenya, and Ecuador represented developing areas, whereas Austria, the United States, and Hungary illustrated more developed countries. Altogether, 440 responses were used for the statistical analysis. Table 1 summarizes the most important information about all study areas.
Our study areas representing developed areas included five cities, four from Europe and one from the United States. The comparisons of Austrian and Hungarian cities (Vienna–Budapest, and Salzburg–Szeged respectively) were interesting, because they often shared similarities in their cultural, geographical, and historical settings; however, their livability scores according to international rankings show high variances [6]. By including a North American city, we intended to consider the different nature of urban development between Europe and the United States. Portland, OR is not a huge metropolis, so comparison with European cities was still adequate. On the other hand, for developing areas, we considered Quito and Nairobi, capitals with significant roles in the urban hierarchy, and consequently with larger populations, whereas León has similarities in terms of population size and position in the urban hierarchy with Salzburg and Szeged, and thereby represented the respective aspects for developing areas in contrast with Europe. In future works, we intend to investigate these city-specific aspects and their effects on the satisfaction of the residents. The current manuscript serves as a conceptual and methodological basis for this further, more in-depth livability assessment, where local differences can also be more emphasized and evaluated.
In our detailed questionnaire, we included altogether more than 100 possible livability factors representing the thematic categories described in Section 4.1.1 (see the full questionnaire and further results in the data descriptor by Kovacs-Györi and Cabrera-Barona [53]). These factors were mainly identified by state-of-the-art research and our previous work regarding livability assessment [54]. This list of factors can never be complete, due to the inherent complexity of the concept of livability; however, through a thematic grouping we aimed to address all potentially relevant aspects. Using this extensive list of factors, as a first step, we intended to get an overview of the identified livability parameters, considering the subjective preferences of the respondents.

4.1.1. Thematic Categories of the Questionnaire

  • General information: As the introductory part of the questionnaire, this section contained questions about demography (sex, age, marital status, education, household members, etc.) and monthly income.
  • Sense of community and belonging: In the first main part of the questionnaire, participants were asked about the neighborhood and community they lived in and their general satisfaction with it. The community meant their home and the group of people living in its closest surroundings (few buildings/building blocks). The neighborhood is the part of the city where this community lives.
  • Urban form: Participants were asked about their perceptions of the built environment in their neighborhoods. Built environment consists of the buildings, public spaces, and other elements of the street such as trees and street furniture.
  • Mobility: This part of the questionnaire investigated transportation mode preferences according to different activity types, motivations for dominant car usage, importance and availability of different mobility-related factors, perceived transportation safety, and self-reported overall quality of walking, cycling, and transportation.
  • Urban functions: In the fifth part of the questionnaire, people were asked about specific urban functions and their accessibility, also considering further mobility parameters. We also asked respondents to evaluate the general fulfilment of their needs by urban functions.
  • Housing: This part of the questionnaire addressed housing conditions and related infrastructure.
  • General satisfaction: As a final topic, we asked the participants about their general satisfaction in terms of city quality.

4.1.2. Street Network Density Categories

By deriving an intersubjective parameter that represents street network density, we intended to test the following hypotheses:
  • A denser street network might provide better accessibility, and this could induce the perception of higher livability. However, too high density might have the opposite effect (higher building/population density may imply an overcrowded environment with more motorized traffic, which means more pollution and less traffic safety)
  • The density of the street network might be a better predictor of the level of perceived livability/mobility conditions than the city-specific characteristics, or the level of economic development, mainly because people from areas with similar street network densities might have more similar perceived livability values than people from the same city but with different street network densities, due to the varying accessibility of functions.
As input data, we used the street network extracted from OpenStreetMap (OSM), because this dataset was available globally for all the study areas. However, data accuracy and data richness might vary in different study areas, as OSM is maintained by volunteers and there is no official verification of the available information beyond crowdsourcing. In our analysis, we intended to differentiate road types based on whether they prioritized human-scale or motorized traffic. “Human-scale” road types support pedestrians and cyclists over cars and other motorized vehicles, whereas the “motorized traffic” category included all the major and minor roads where pedestrians and cyclists were not allowed to go, or where they clearly had a subordinate role in traffic. The following queries were used to categorize the road segments:
Human-scale:
“fclass” = ‘cycleway’ OR “fclass” = ‘footway’ OR “fclass” = ‘living_street’ OR “fclass” = ‘path’ OR “fclass” = ‘pedestrian’ OR “fclass” = ‘steps’
Motorized traffic:
“fclass” = ‘motorway’ OR “fclass” = ‘motorway_link’ OR “fclass” = ‘primary’ OR “fclass” = ‘primary_link’ OR “fclass” = ‘secondary’ OR “fclass” = ‘secondary_link’ OR “fclass” = ‘service’ OR “fclass” = ‘tertiary’ OR “fclass” = ‘tertiary_link’ OR “fclass” = ‘trunk’ OR “fclass” = ‘trunk_link’
Initially we used a third category, labeled “residential”, where no specific priority applied for any transportation mode. However, this variable was later excluded from the analysis, as it was not relevant in representing livability conditions. After the query was performed, we run the Line Density tool using the software ArcMap 10.6 for both road types and all cities, segmented the result layer to get more homogenized density areas, and reclassified the values into three categories (high-, normal-, and low-density, see Figure 3 as an example). We had no information about the respondents’ addresses at street level, so we used the neighborhood in which they lived to assign each response semi-automatically to a density category. Local expertise of the authors particularly helped in heterogeneous areas, so we could decide on the density categories closest to the real situation. These final density categories for both human-scale and motorized traffic roads were added as parameters to the main data set containing all the responses before we performed the regression analysis.

4.2. Evaluation of the Survey Results

In Section 4.1, we described our survey framework and explained why the large number of potential livability factors was necessary to use. However, in the next step, it was important to identify a set of final livability factors that were essential to many respondents in our study areas. For this purpose, we used logistic regression for the factors in each thematic group (Figure 2). Using this method, we intended to identify which of the parameters did actually have a statistically significant relationship with the value representing satisfaction with living in the city, also interpreted as perceived livability in this case. The results of this modeling step, however, showed statistical relationships and trends and not actual causal relationships.
We used GLM (generalized linear models) in RStudio to perform the statistical analysis. As a preprocessing step, we converted all the categorical values to binary ones and used the binomial version of GLM. This was necessary, as almost all the factors were categorical (Not at all, Somewhat, Mostly, Completely), slightly skewed towards the more positive values (Mostly, Completely), and with only a few responses for the lowest score (Not at all). Thus, after the conversion, the responses were divided into two groups (Not at all/Somewhat = 0, Mostly/Completely = 1) instead of four to give more responses for each answer category.
As a follow-up, Cronbach’s alpha was calculated on the subset of factors identified as statistically significant, to test their reliability for consistency, or, in other words, how closely related these sets of items were as a group. A higher alpha value indicates higher consistency; the factors were therefore able to represent the subject of the survey, in this case livability.

4.3. Relational-Statistical Learning

The results of the binomial regression provided a few key factors for each thematic group, based on people’s self-reported preferences. In the next step of the analysis (Figure 2), we wanted to identify the relative contribution of each factor to livability. For this purpose, we chose probabilistic modeling, also called Bayesian inference, to discover how likely it was that if a factor was fulfilled (e.g., having trees along the street), a person would be satisfied with living in the city. This modeling was based on a Bayesian network, and an algorithm calculated these probabilities using the data represented by the responses of the residents as input. We selected this method because it can be reliably applied to a relatively small sample size, compared to other machine learning algorithms such as random forest. Furthermore, the algorithm that calculated these probability values was not a “black box”; the results can be derived and replicated by mathematical operations and these results were always the same. An even more significant advantage of the method is the ability to provide these probability values not just for single factors or as a final value considering all parameters, but also the probabilities of each possible combination (see Results and the Data Descriptor [53]).

4.4. Validation—GIS Analysis

To test the validity of the final results (probabilities), we used these values as weights and “predicted” the livability in Vienna, Austria using geospatial data and compared it with the responses from the questionnaire (Figure 2). This was however, not just a validation, but could serve as an assessment scheme for any city where the required type of information representing the given livability factors is available. The only restriction is data availability, as the method can be applied in the first round mainly for parameters that have spatial reference.
For test purposes we used the group of factors with the highest probability based on 4.3, and collected the adequate data sets representing them from the open data portal of Vienna and OSM. In the next step we calculated a weighted value for each parameter in every analysis unit. As a last step, using again the probability values from the relational-statistical learning (see Section 4.3 and Section 5.3), we summarized whether the individual values of these intersubjective (spatial) livability parameters would result in a higher satisfaction with living in the city and compared it with the original value from the questionnaire. Using this calculation, we were able to verify whether these spatial variables were indeed representing livability appropriately.

5. Results

5.1. Respondents of the Questionnaire

As described in Section 4, we had 440 responses overall within eight cities on three continents. Figure 4 shows the distribution of the responses according to city, age groups, and sex. The proportion of the participants among the cities varied from 7 to 21%, but for five cities it is around 10%. In terms of age groups, around half of the respondents were 35 years old or younger (55%) and the remaining 45% represented populations older than 35. There were slightly more women (58%) than men (42%) among the respondents. Overall, almost half of the participants (47%) were mostly satisfied with living in their city, and only one third of the residents were only “somewhat” or “not at all” satisfied. Further statistics are available in the data descriptor [53].

5.2. Logistic Regression

Table 2 contains the statistically significant livability parameters based on the GLM algorithm. The different types of the questions we used are further detailed in the footer of Table 2 for each variable. Most often, the questions asked for the personal relevance of a factor, or how well that factor represented given characteristics. We also had a few questions with binary response options (yes/no), or where quality (poor to excellent) or frequency (every day to never) had to be rated. Only two variables in the table offered a different answering system: (a) “level of development”, which was developing or developed based on the respondent’s country, and (b) “salary” (less, more, or around the amount they needed to fulfill their basic needs). As stated above, we converted almost all parameters to binary values in the preprocessing step for the GLM (see Reference [53]). Three factors among the community-related variables were not used in the next step of the analysis (and are therefore not included in the table) because the distributions of the responses among the study areas (and answer options, respectively) were strongly different from the other variables, also meaning that their interpretation was not self-explanatory.
The Cronbach’s alpha indicated a reliability of 0.7366, which is, according to Nunnally [55], an appropriate value for such an exploratory research. For calculation of the alpha we did not use the car-related variables because they were only asked of those participants who used a car on an almost daily basis, and therefore the sample size was considerably different.
Interestingly, two variables with comparatively higher estimate coefficients indicated negative connection to satisfaction with urban life. This means that those people who found an element extremely important (e.g., special transportation services) or used it frequently (e.g., bicycle for shopping), reported lower satisfaction with living in the city—which in this case might even mean a real causality, not just statistical correlation. For example, if someone uses a bicycle almost every time to go shopping, that might reflect their lack of choice of better access to shopping facilities. However, if a person commutes by bicycle, that activity may be more associated with higher satisfaction levels associated with an urban environment that supports convenient cycling. In contrast to shopping by bicycle, commuting by bicycle might indicate a real choice, not just a constraint.

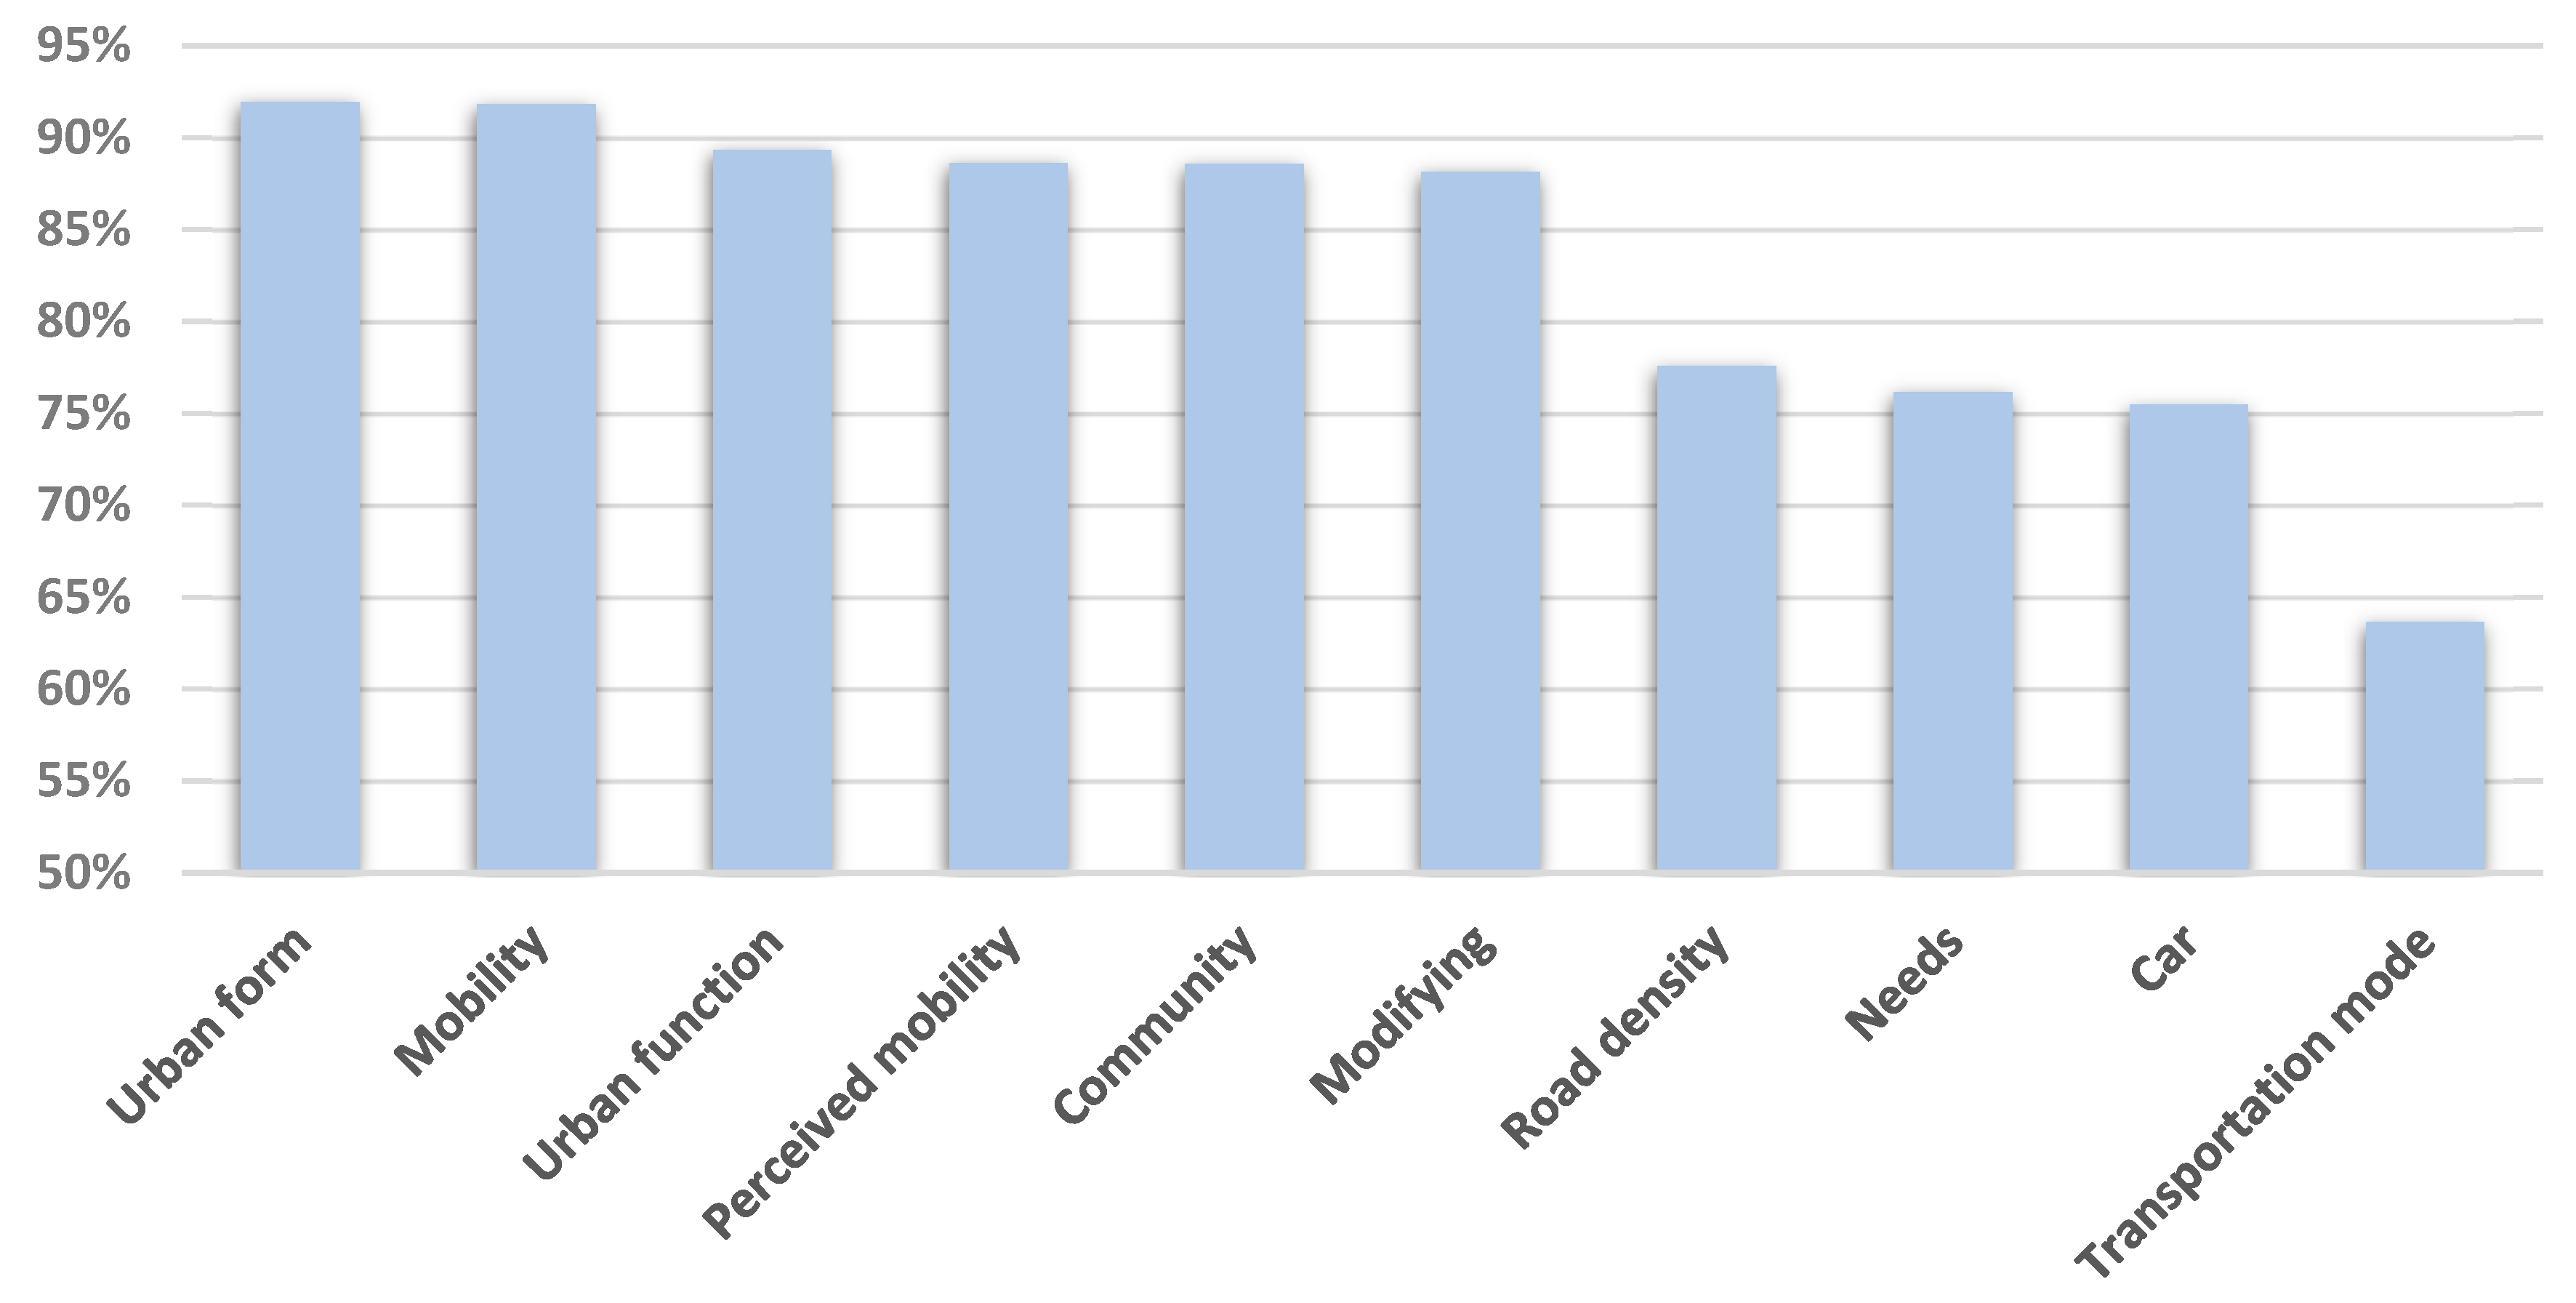
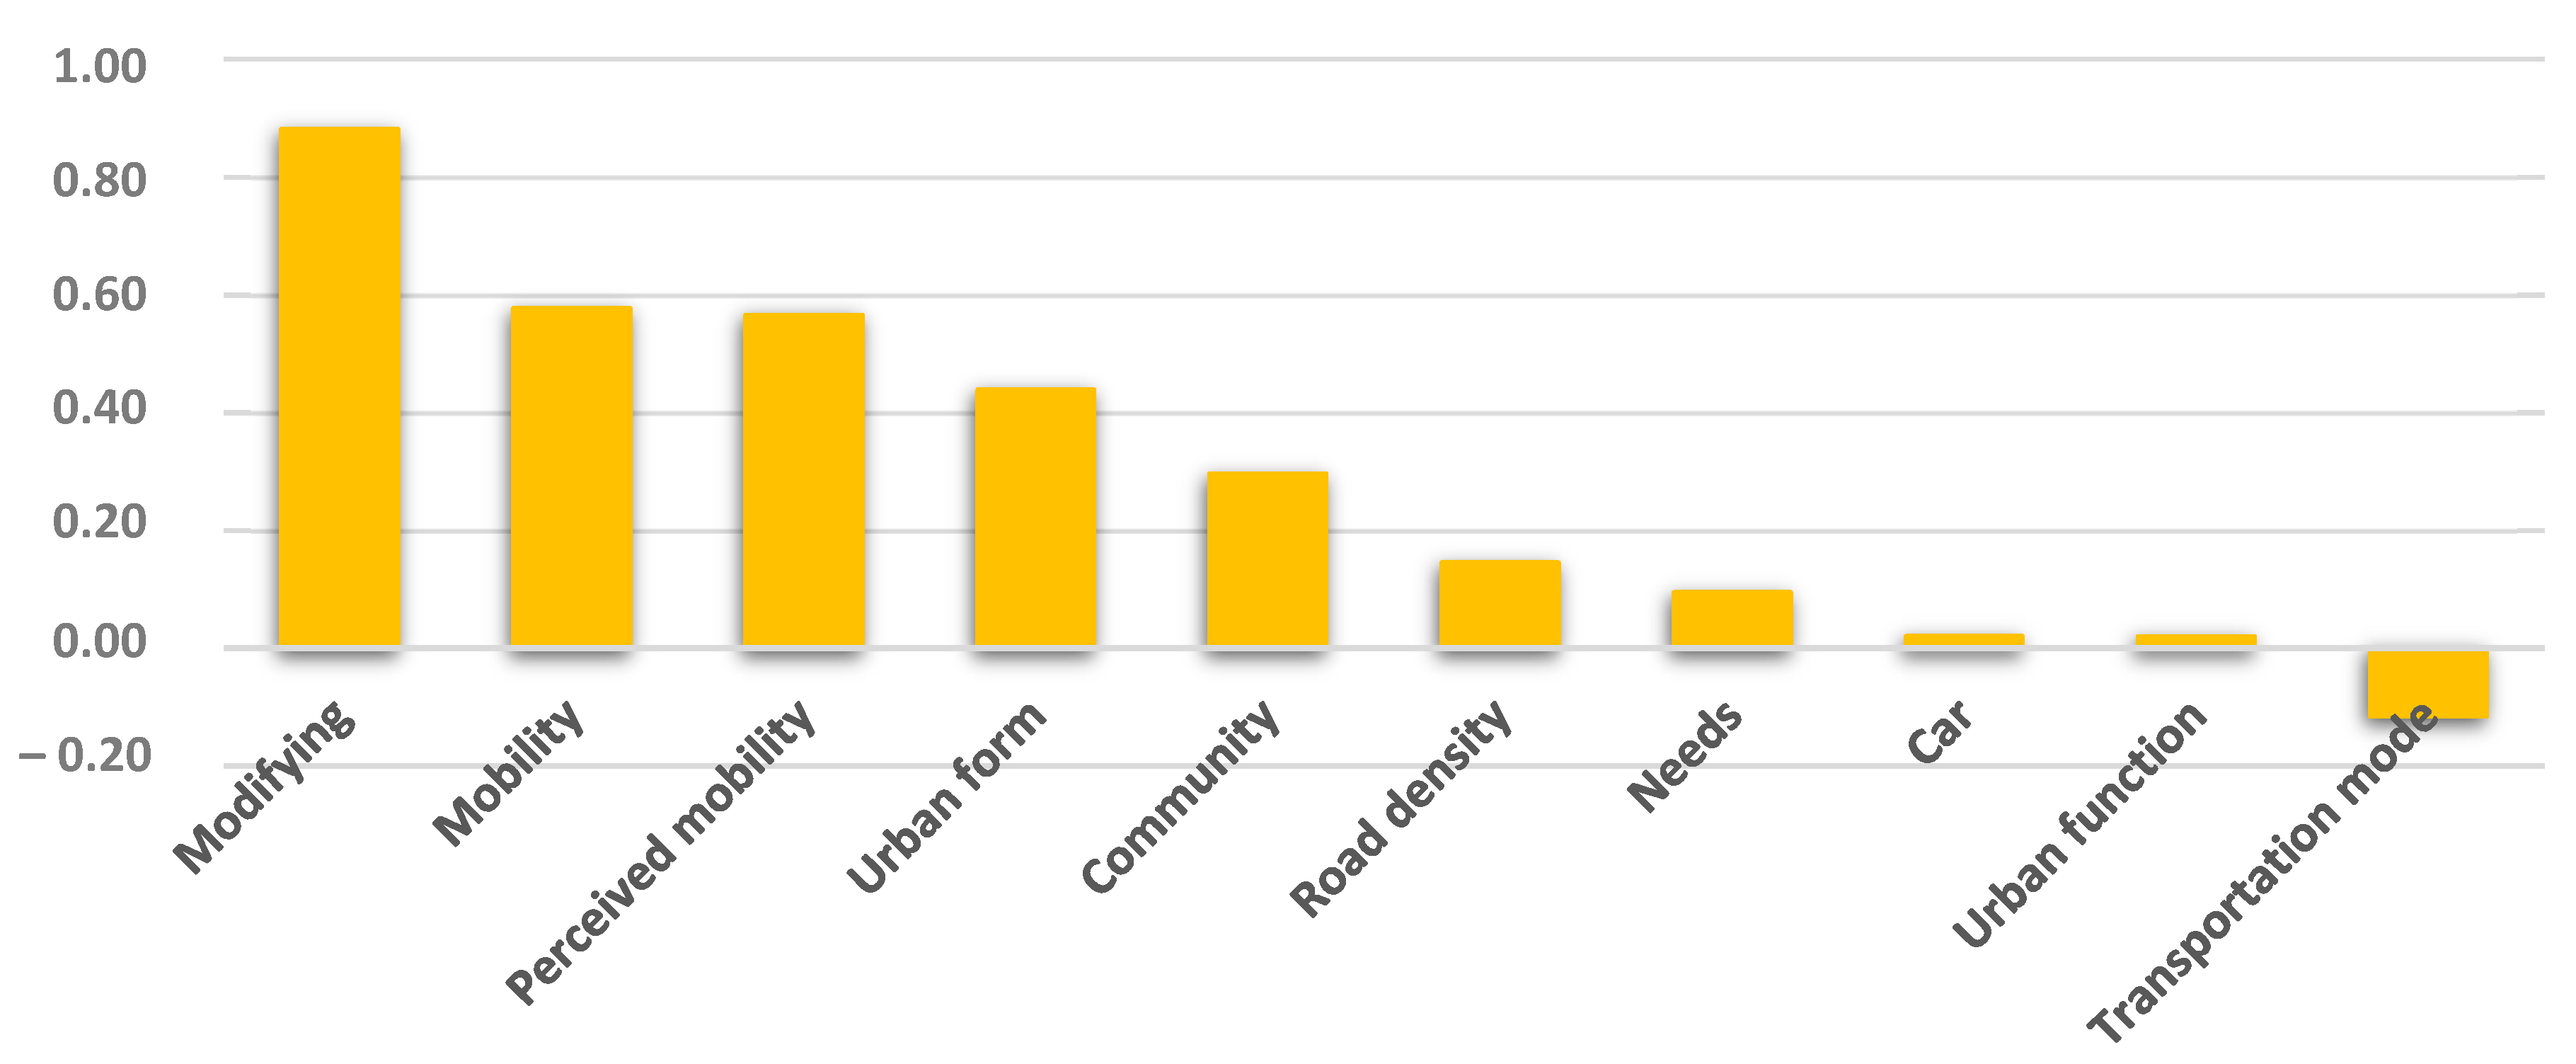
5.3. Relational-Statistical Learning
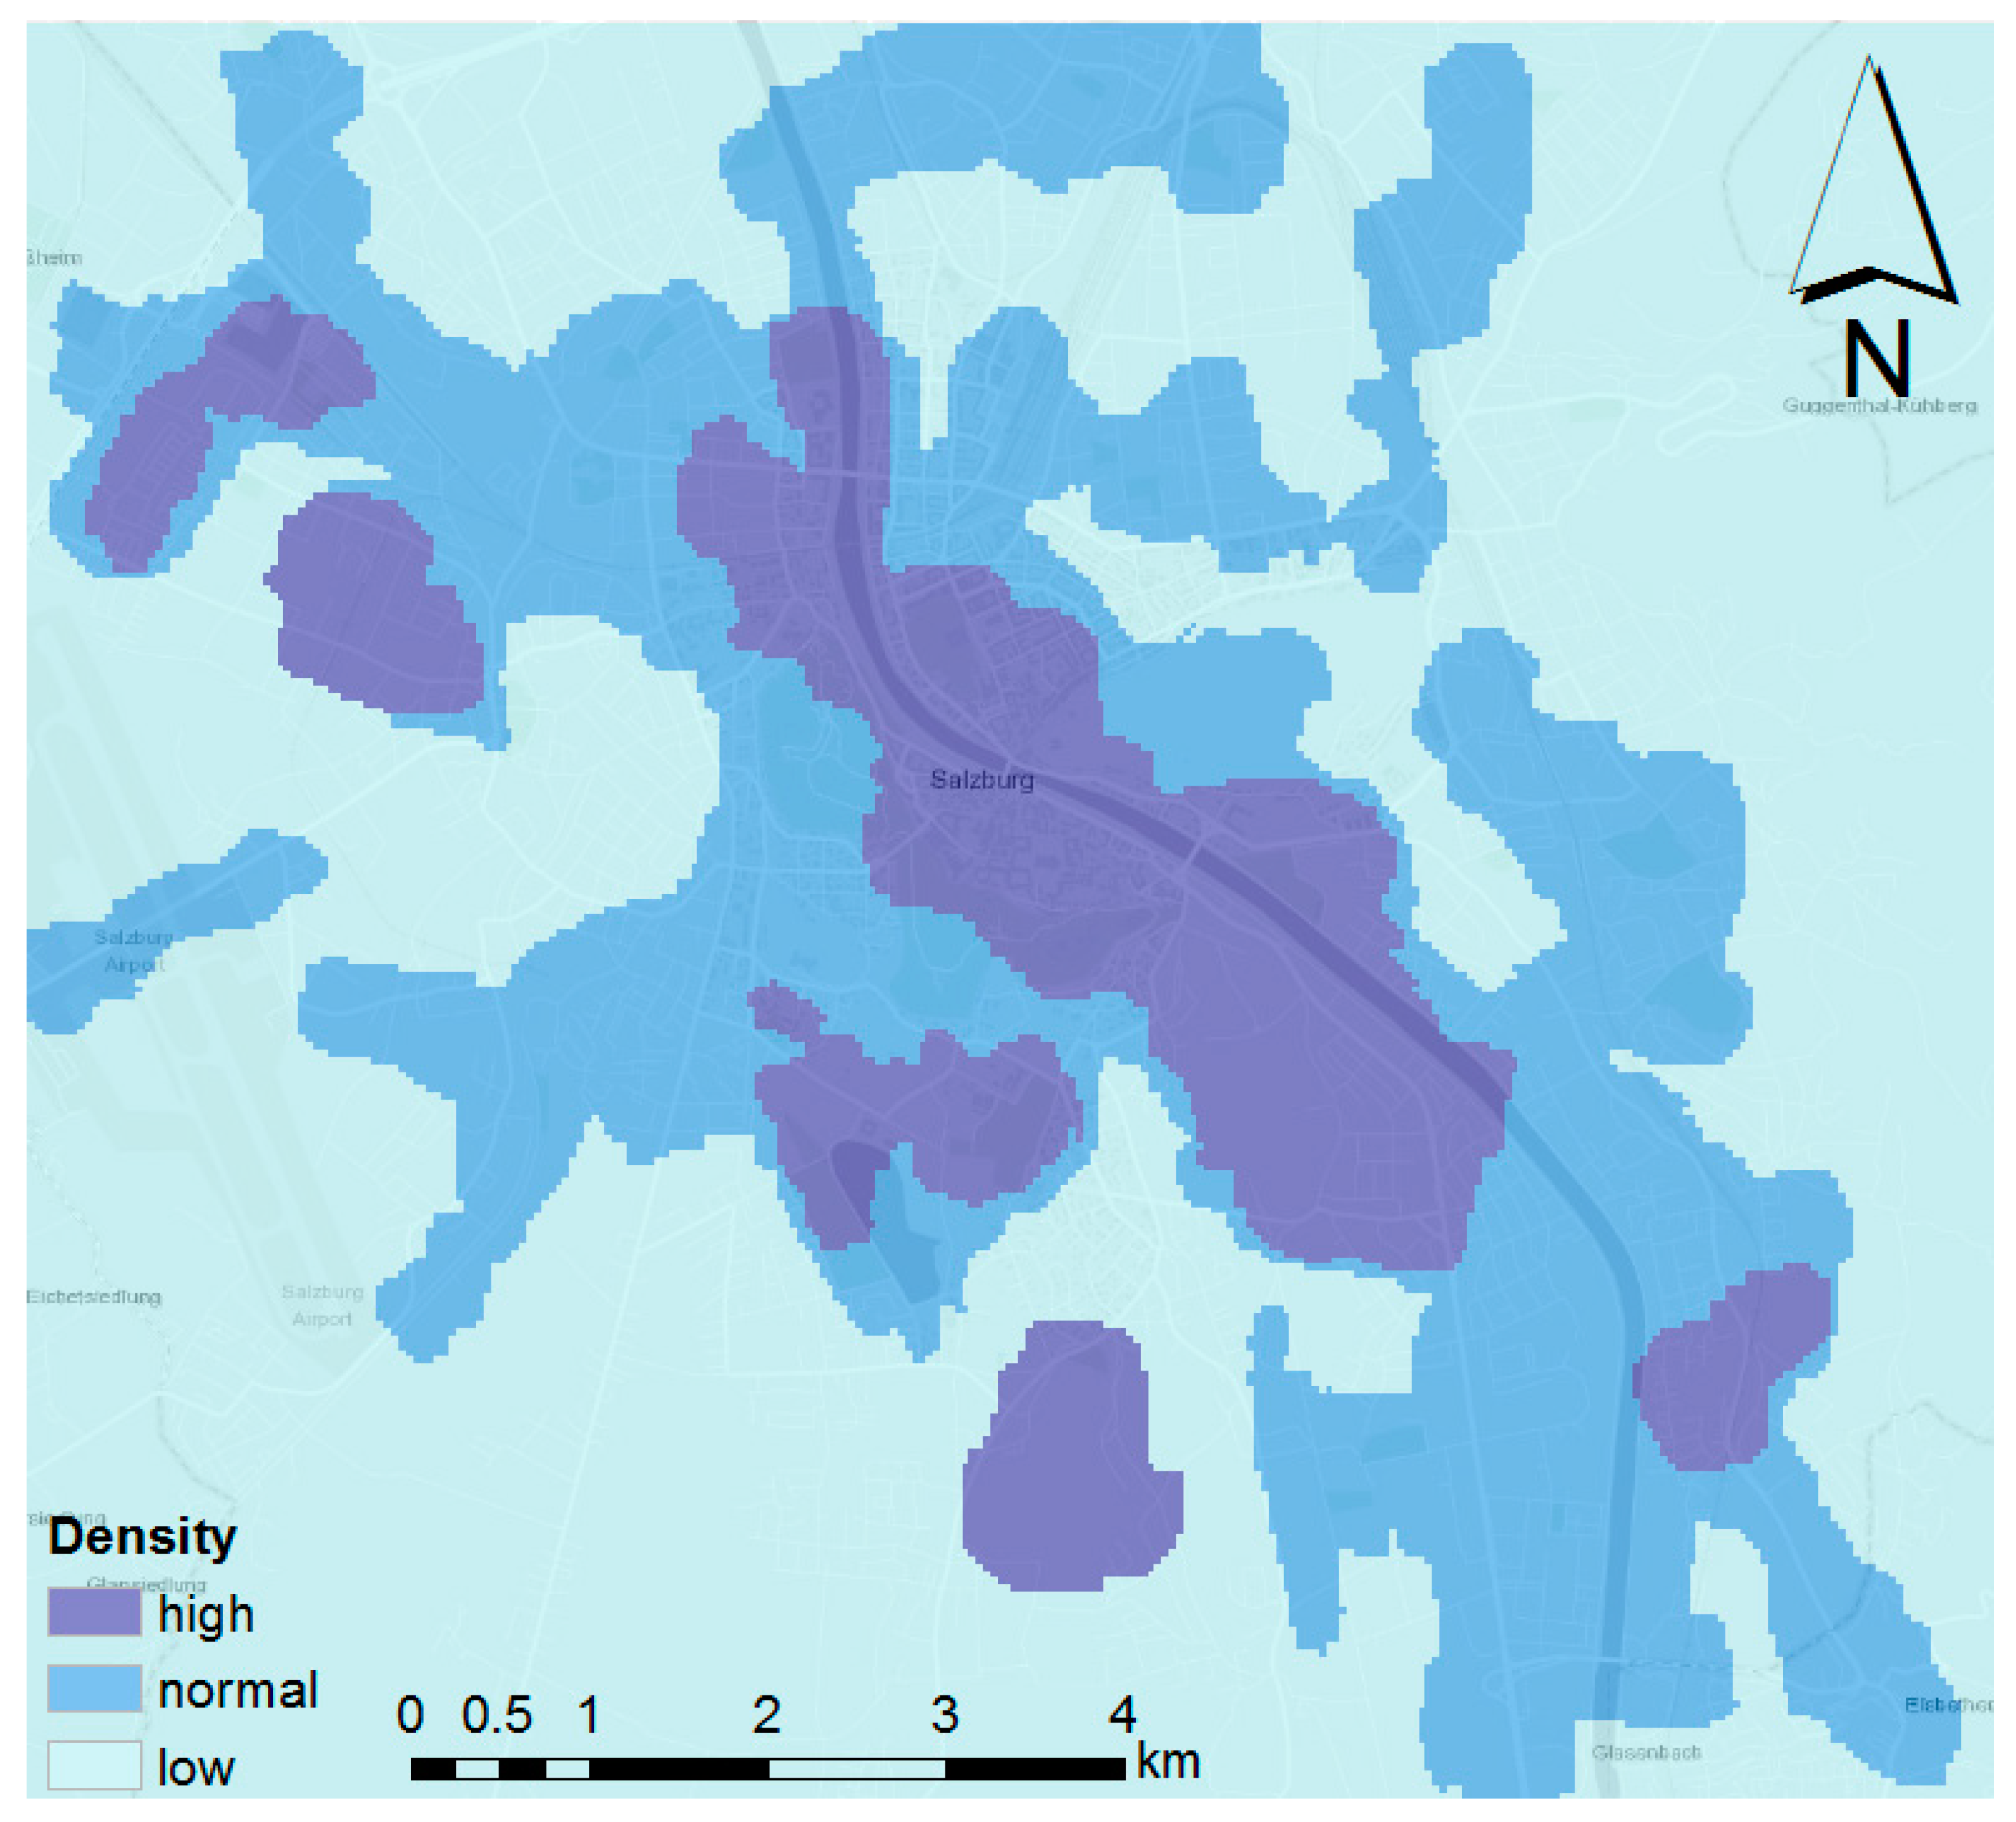
Figure 5 shows the Bayesian network used for our probabilistic modeling. The acronyms and full descriptions of the factors can be found in Table 2 and Table 3.
Table 3 shows the individual and combined probability values of each livability factor identified in the previous analysis step. This probability refers to the satisfaction of living in the given city for a given person, if that variable happens to be true or has a value indicating good quality. For example, if all the urban form-related parameters are fulfilled (i.e., true), there is a 91% likelihood that a person living in that area will have a higher perceived livability value. For almost all categories, the combined probability was higher than the corresponding values of single parameters. This can be explained by the nature of livability: if more parameters are positive and fulfilled, the area may be considered more livable.
Interestingly, the values for the category “Modifying factors” were different from the other livability-related parameters. These are the parameters that (also based on the probabilities) were likely to influence perceived livability greatly when combined, but they were relatively weak separately. For example, a person living in a developed area but with less optimal housing conditions may have relatively low livability. Likewise, a very high value for one single factor within one of the categories may not dominate the results for the whole category.
Figure 6 illustrates the combined probability values for each thematic category in our livability assessment. Urban form had the highest probability of representing higher satisfaction with living in a city, and we therefore also used this group for the validation step as an illustration (Section 5.4). Even the lowest probability was above 60%, referring to the transportation mode used to commute or for shopping. However, interestingly, other mobility-related parameters had a much higher probability value, such as perceived mobility conditions or speed limits and traffic signs. We found that street density showed a relatively low probability compared to urban form or urban function parameters. However, compared to the level of development (0.47727), we found that the probability was higher, so our respective hypothesis from Section 4.1.2 can be justified.
When we additionally investigated how much the probability of the thematic group values increased if all the factors were true in a group, compared to when none of them was fulfilled—as scenarios—we found a different picture (Figure 7). This showed the relative relevance of the livability factor groups compared to the absolute values from Table 3. Modifying parameters that were not inherently livability-related but had a huge impact on the perception of the urban life produced an increase of more than 0.8, which shows how relevant the basic needs in livability assessment are. Good housing conditions, a salary that is enough to cover basic needs, and a higher level of development in general are without a doubt all important factors contributing to satisfaction with living in a given area. Conversely, the more qualitative aspects regarding urban form and urban function ranked lower. Interestingly, transportation-mode-related factors had a low probability in general, but according to this additional comparison, it also made little difference if these were fulfilled or not, mostly because they originally referred to lower satisfaction (except for cycling to work).

5.4. GIS Analysis

For validation purposes, we selected the urban form factors, not only because they had the highest probability, but because the factors concerning street furniture and trees represented quantitative measurement in an area, instead of qualitative measurement of their appeal, which would be more subjective. We therefore did not include the initially calculated architectural similarity in the final validation, because the factor referred to the personal importance of it. For street furniture and trees, we used the census tracts as spatial units and calculated the average distribution per kilometer along the streets within a given unit. Trees located 20 m or more away from the road were excluded from the analysis. We considered a value of at least one item per km for street furniture (bench, trash bin, fountain, drinking fountain) and 20 trees per km as optimal. If the calculated value was higher than this, we assigned “1” for the given spatial unit. The value “0” was assigned if these two criteria were not met.
The last parameter was the overall perception of the built environment, which was a subjective variable. Therefore, we used the responses from the questionnaire to represent individual differences. Using the results of the relational-statistical learning, we assigned a probability value for each combination of the three factors. As we inherently had probability values skewed to higher values (>0.6), we defined a threshold of 0.75 to distinguish a high (≥0.75) or low (<0.75) satisfaction value, indicated by 1 and 0. Table 4 shows the performance of our prediction in the form of a confusion matrix. Overall, the prediction yielded an 80% accuracy. This is a remarkable result for using only two calculated and one self-reported value, compared to the original set of over a hundred different livability parameters. A value of 80% can also be considered reliable because there will always be a segment of livability, which is highly subjective and cannot be grasped by intersubjective measures.

6. Discussion

Although our sample sizes did not facilitate reliable city-specific results, we could still identify typical characteristics of perceived livability in developing and developed areas. This is also relevant, because urban processes influencing the livability of a city often differ in developing and developed areas. For example, due to rapid urbanization, many developing cities struggle with informal settlements [4] or lacking access to other basic needs, such as clean drinking water, as is also reflected by several SDGs and NUA goals addressing the issues of developing areas [7]. Differences between developing and developed countries in our survey were marked by the expectations that citizens based the satisfaction of their needs on the available urban services and facilities. While in developing countries people may often aim to have access to basic services such as clean water or a continuous electricity supply, in developed countries, practically almost all citizens are satisfied with the available basic services and they aim rather for higher quality of life, for instance having access to leisure facilities or urban greenery. This was also reflected by the overall satisfaction with living in a given city, where residents of cities from developing areas generally tended to have a lower satisfaction with urban life; however, in terms of the importance of the given factors asked about in the questionnaire, there were smaller gaps.
In the case of mobility, there were differences in the typical transportation modes between developing and developed areas, especially in motivations for car usage (Figure 8). It was clearly shown that in developing areas, the main reason why one might use a car on a daily basis was thanks to a lack of competitive alternatives, such as safe cycling infrastructure or accessible public transportation. Further details of car usage and the distribution of responses regarding other mobility-related factors can be found in Reference [53].
The livability framework described in the previous sections served as a basis for performing the actual livability assessment (Figure 9). The assessment has two possible use cases. It either considers all the livability-related elements in the form of a general assessment by analyzing all of the factors for the whole city (or a given area), or it can be used as a preparatory diagnostic step for specific projects on urban quality improvement. In the latter case, depending on the goal of such a project, a subset of the relevant assessment factors should be selected.
Our results can also be utilized and interpreted for implementation of the NUA and SDGs in various ways:
  • Detailed investigation using all factors: This approach provided a thorough analysis, where individual perceptions and expectations were given a high relevance. The limitation of the method is clearly how time- and resource-consuming it is to interview enough people. Therefore, this approach might be optimal for smaller areas, and for investigating the expectations of different socioeconomic groups. However, by adding spatial aspects based on the approximate addresses of the people, the GIS analysis can reveal further issues and differences at finer spatial scales as well. If the investigation has a more specific purpose than a “general diagnosis”, some thematic factor groups may be omitted. For example, in a transportation-related project, community aspects might have a lower relevance.
  • Using the key livability parameters: By using the identified subset of livability parameters, researchers and planners can still investigate the quality of an area thoroughly, but in a slightly less resource-consuming way. This type of assessment can still provide details about the different aspects of livability, along with the calculated probability values that can be utilized as weights in the end. Again, the responses of the people can be localized at finer scales within the city; it is therefore possible to locate areas with given problems based on the responses. For example, if in one area people are less likely to commute by bike, or have a lower level of perceived safety, such information may provide relevant input and starting points for further planning steps.
  • Using probability values as weights: Researchers and planners might decide to only use the calculated probability values as weights for some or all the listed parameters to evaluate the overall performance of an area in terms of livability. In this case, spatial aspects might have a lower relevance, depending on the purpose of the analysis.
  • Modeling: As our validation example illustrated, if a comprehensive analysis is not required, using only three parameters can also represent livability in an area very well. In our case, out of these three parameters, only one had personal relevance, which can again limit the direct involvement of residents in the analysis process. When asking a large enough number of people only about their overall perceptions of the built environment, combined with the spatial analysis of the other two parameters, it was still possible in our study to get a good approximation of the level of livability.
Overall, researchers, decision-makers, urban planners, and other stakeholders can profit from considering spatial and temporal characteristics of livability and various urban subsystems using GIS. Especially valuable is the ability to identify and “diagnose” areas where residents have lower satisfaction. This “diagnosis” of a city, combined with different visualization techniques, can help raise awareness about the residents’ needs and expectations, and aid in the achievement of SDGs and NUA goals. By using this assessment workflow in a local context, planners would be able to assess and address local circumstances in terms of livability and the satisfaction of the residents. For example, in the case of mobility, by considering the person–environment relationship, issues with commuting or specific problems with the quality and accessibility of public transportation can be identified and addressed within a systematic livability framework. Thus, the concept of livability can guide a whole-systems approach to the person–environment relationship, integrating spatio-temporal aspects as well as highly variable local circumstances.
Beyond utilizing the whole-systems approach of livability assessment in planning, these results can also be directly connected to specific SDGs and NUA goals. SDG 11 targets emphasize the role of adequate housing conditions (11.1), safe and affordable public transport (11.2), good air quality (11.6), and safe and inclusive public (green) spaces (11.7), and the relevance of these aspects in livability was also justified by our results (see also Reference [53]). However, urban form and active mobility aspects (such as walking and cycling) were identified as even more important in terms of livability, but they are not addressed directly as targets in the SDGs. Active mobility can serve as an important way to reduce greenhouse gas emission (emphasized in the NUA); however, this is, again, more like an ultimate goal per se than a way to achieve such goals. Providing attractive conditions and environments for walking and cycling (as considered in our assessment framework) can have a widespread impact on people’s perception and satisfaction, and also overall as an overspill effect on sustainability. Last, access to basic needs was also acknowledged as an essential characteristic of livable cities as part of both the SDGs and NUA [53], and the spatio-temporal analysis approach can help to investigate this access in cities, contributing to the long-term achievement of the respective goals.
Once again it must be noted that livability assessments, like many other concepts and frameworks, have their limitations. These limitations might be deeply rooted in the concept itself, such as the high level of subjectivity in articulating human needs and perception, or the complexity arising from the several interrelated parameters. At the same time, this subjectivity should never be neglected or underrepresented in the process. This means that subjective parameters cannot be tested without surveying at least some residents. Other—less inherent—limitations tend to be more related to the data used for the assessment. For example, it matters whether they are available at the right spatial scale or for the right temporal extent, not to mention their representativeness regarding the investigated phenomena. As our GIS analysis illustrated, the results of an assessment usually have to be aggregated in spatial units. Like every aggregation, such a step may entail some information loss. However, aggregation at the right scale increases the range of assessment options, as data at very fine spatial scales are rarely available. In this sense, we suggest that future research related to our investigation could apply multi-level regression modeling in order to identify variations of livability perception through diverse zones within the city. The advantage of this modeling is that regression analysis considers both spatial (census tracts, neighborhoods) and human (interviewees) aspects.
As a follow-up of this work, it could be further investigated whether there is a general, intersubjective measure of “good quality” for those parameters with inherent spatial aspects. This includes most of the introduced variables, except for the community-related ones. A deeper investigation of the street network density categories and their influence on livability could also bring new insights into livability assessment and improvement. Another promising field of future research is the integration of a sense of place into the GIS-based modeling of livability. Due to its perceptional and spatial characteristics, livability may be interpreted through a function-based model of place, where place is seen “as a system of interrelated components” [56] (p. 16). Moreover, components of livability could be modeled considering the integration of concepts of urban quality of life and geospatial information [23].

7. Conclusions

Because of its complexity, livability assessment requires a whole-systems approach, considering both its key elements and their evaluation. First, we identified several such key elements, and then designed a survey to ascertain city-dwellers’ preferences for the individual factors. As a follow-up, we implemented regression analysis and relational-statistical learning to investigate the role of individual factors in the overall livability of a place. We found that urban form and particular mobility-related factors had the strongest connection with experiencing high urban livability. However, the development of an area, the salary in terms of satisfying basic needs, and general housing conditions also strongly influenced this overall satisfaction with living in a city. As a final step, we illustrated the potential of GIS analysis by modeling livability based on two specific urban form-related factors, considering street furniture and trees.
We can conclude that the residential preferences towards the various elements of livability are similar in developing and developed areas; however, the overall satisfaction with urban life already shows significant differences, as dwellers in developing areas often lack access to basic services. Further city-specific results were beyond the scope of this research article, as we were focusing on transferable assessment techniques. However, in the case of planning actions, these local characteristics are essential to consider in order to improve livability more efficiently or to achieve SDGs and NUA goals.
Finally, we discussed possible methods by which to utilize the livability assessment framework in planning, in particular in implementing both SDGs and NUA goals. Although this approach has evident limitations, we concluded that it could be beneficial in urban planning to “diagnose” a city by measuring livability characteristics before and after performing actual planning actions, with the assessment of livability thereby providing better guidance in the process of urban quality improvement.

Author Contributions

All authors have contributed to this paper. A.K.-G. proposed the main idea. A.K.-G. and P.C.-B. were involved in the design of methodology and performed the analyses. A.K.-G. drafted the manuscript. B.R., M.M., T.B. provided supervision and contributed to the final version by reviewing and editing of the paper.

Funding

This research was funded by the Austrian Science Fund (FWF) through the Doctoral College GIScience at the University of Salzburg (DK W 1237-N23). We would like to express our gratitude to the Austrian Science Fund (FWF) also for supporting the projects “Urban Emotions” (reference number I-3022), and “The Scales and Structures of Intra-Urban Spaces” (reference number P 29135-N29).

Acknowledgments

The authors want to thank you for the work of Francis Oloo, Mona Bartling, and Erika Blaschke in reviewing the questionnaire.

Conflicts of Interest

The authors declare no conflict of interest. The funders had no role in the design of the study; in the collection, analyses, or interpretation of data; in the writing of the manuscript, or in the decision to publish the results.

References

  1. Corburn, J. Cities, climate change and urban heat island mitigation: Localising global environmental science. Urban Stud. 2009. [Google Scholar] [CrossRef]
  2. Baker, J.L. Climate Change, Disaster Risk, and the Urban Poor; Baker, J.L., Ed.; The World Bank: Washington, DC, USA, 2012. [Google Scholar]
  3. Knoflacher, H. From myth to science in urban and transport planning: From uncontrolled to controlled and responsible urban development in transport planning. Int. J. Inj. Control Saf. Promot. 2009. [Google Scholar] [CrossRef] [PubMed]
  4. Pacione, M. Urban Geography: A Global Perspective; Routledge: Abingdon, UK, 2009; ISBN 9780415462020. [Google Scholar]
  5. Gasper, R.; Blohm, A.; Ruth, M. Social and economic impacts of climate change on the urban environment. Curr. Opin. Environ. Sustain. 2011, 3, 150–157. [Google Scholar] [CrossRef]
  6. Okulicz-Kozaryn, A. City Life: Rankings (Livability) Versus Perceptions (Satisfaction). Soc. Indic. Res. 2013, 110, 433–451. [Google Scholar] [CrossRef]
  7. United Nations General Assembly. Habitat III New Urban Agenda: Quito Declaration on Sustainable Cities and Human Settlements for All; United Nations General Assembly: Quito, Ecuador, 2016. [Google Scholar]
  8. Inter-agency and Expert Group on SDG Indicators. Tier Classification for Global SDG Indicators. 2019. Available online: https://unstats.un.org/sdgs/files/Tier_Classification_of_SDG_Indicators_22_May_2019_web.pdf (accessed on 15 August 2019).
  9. Saitluanga, B.L. Spatial Pattern of Urban Livability in Himalayan Region: A Case of Aizawl City, India. Soc. Indic. Res. 2014, 117, 541–559. [Google Scholar] [CrossRef]
  10. Antognelli, S.; Vizzari, M. LISAM: An open source GIS-based model for liveability spatial assessment. In Proceedings of the 4th Open Source Geospatial Research and Education Symposium (OGRS2016), Perugia, Italy, 12–14 October 2016. [Google Scholar]
  11. Conteh, F.M.; Oktay, D. Measuring liveability by exploring urban qualities of Kissy Street, Freetown, Sierra Leone. Open House Int. 2016, 41, 23–30. [Google Scholar]
  12. Giap, T.K.; Thye, W.W.; Aw, G. A new approach to measuring the liveability of cities: The Global Liveable Cities Index. World Rev. Sci. Technol. Sustain. Dev. 2014, 11, 176–196. [Google Scholar] [CrossRef]
  13. Caprotti, F.; Cowley, R.; Datta, A.; Broto, V.C.; Gao, E.; Georgeson, L.; Herrick, C.; Odendaal, N.; Joss, S. The New Urban Agenda: Key opportunities and challenges for policy and practice. Urban Res. Pract. 2017, 10, 367–378. [Google Scholar] [CrossRef]
  14. Costanza, R.; Fioramonti, L.; Kubiszewski, I. The UN Sustainable Development Goals and the dynamics of well-being. Front. Ecol. Environ. 2016. [Google Scholar] [CrossRef]
  15. Van Kamp, I.; Leidelmeijer, K.; Marsman, G. Urban environmental quality and human well-being: Towards a conceptual framework and demarcation of concepts; a literature study. Landsc. Urban Plan. 2003, 65, 5–18. [Google Scholar] [CrossRef]
  16. Blečić, I.; Bibo Cecchini, A.; Talu, V. The capability approach in urban quality of life and urban policies: Towards a conceptual framework. In City Project and Public Space; Springer: Berlin/Heidelberg, Germany, 2013; ISBN 9789400760370. [Google Scholar]
  17. Brown, L.L. An Annotated Bibliography of the Literature on Livability, with an Introduction and an Analysis of the Literature; Kansas State University: Manhattan, KS, USA, 1975. [Google Scholar]
  18. Pacione, M. Urban Liveability: A Review. Urban Geogr. 1990, 11, 1–30. [Google Scholar] [CrossRef]
  19. Veenhoven, R. The Four Qualities of Life. J. Happiness Stud. 2000, 1, 1–39. [Google Scholar] [CrossRef]
  20. Young, E.; Hermanson, V. Livability Literature Review: A Synthesis of Current Practice; U.S. Department of Transportation: Washington, DC, USA, 2012.
  21. Ruth, M.; Franklin, R.S. Livability for all? Conceptual limits and practical implications. Appl. Geogr. 2014, 49, 18–23. [Google Scholar] [CrossRef] [PubMed]
  22. Marans, R.W.; Stimson, R. An Overview of Quality of Urban Life. In Investigating Quality of Urban Life: Theory, Methods, and Emperical Research; Wiley: Hoboken, NJ, USA, 2011; pp. 1–29. [Google Scholar]
  23. Cabrera-Barona, P.; Merschdorf, H. A Conceptual Urban Quality Space-Place Framework: Linking Geo-Information and Quality of Life. Urban Sci. 2018, 2, 73. [Google Scholar] [CrossRef]
  24. Glatzer, W. Monitoring and Analyzing Quality of Life–An Introduction. In Global Handbook of Quality of Life: Exploration of Well-Being of Nations and Continents; Glatzer, W., Camfield, L., Møller, V., Rojas, M., Eds.; Springer: Dordrecht, The Netherlands, 2015; pp. 1–11. [Google Scholar]
  25. Felce, D.; Perry, J. Quality of life: Its definition and measurement. Res. Dev. Disabil. 1995, 16, 51–74. [Google Scholar] [CrossRef]
  26. Bonaiuto, M.; Aiello, A.; Perugini, M.; Bonnes, M.; Ercolani, A.P. Multidimensional Perception of Residential Environment Quality and Neighbourhood Attachment in the Urban Environment. J. Environ. Psychol. 1999, 19, 331–352. [Google Scholar] [CrossRef]
  27. Taube, G.; Levin, J. Public Housing as Neighborhood: The Effect of Local and Non-Local Participation. Soc. Sci. Q. 1971, 52, 534–542. [Google Scholar]
  28. Maslow, A.H. A Theory of Human Motivation. Psychol. Rev. 1943, 50, 370–396. [Google Scholar] [CrossRef]
  29. Campbell, A. The Human Meaning of Social Change; Campbell, A., Converse, P.E., Eds.; Russel Sage: New York, NY, USA, 1972. [Google Scholar]
  30. Brown, A.L. Increasing the utility of urban environmental quality information. Landsc. Urban Plan. 2003, 65, 85–93. [Google Scholar] [CrossRef]
  31. Pacione, M. Urban environmental quality and human wellbeing—A social geographical perspective. Landsc. Urban Plan. 2003, 65, 19–30. [Google Scholar] [CrossRef]
  32. Myers, D. Building Knowledge about Quality of Life for Urban Planning. J. Am. Plan. Assoc. 1988, 54, 347–358. [Google Scholar] [CrossRef]
  33. Von Bertalanffy, L. General System Theory: Foundation, Development, Application; Aldine Publishing Company: London, UK, 1968. [Google Scholar]
  34. Batty, M. The New Science of Cities; MIT Press: Cambridge, MA, USA, 2013; ISBN 9780262019521. [Google Scholar]
  35. Cabrera-Barona, P.; Wei, C.; Hagenlocher, M. Multiscale evaluation of an urban deprivation index: Implications for quality of life and healthcare accessibility planning. Appl. Geogr. 2016, 70, 1–10. [Google Scholar] [CrossRef]
  36. Kothencz, G.; Kolcsár, R.; Cabrera-Barona, P.; Szilassi, P. Urban green space perception and its contribution to well-being. Int. J. Environ. Res. Public Health 2017, 14, 766. [Google Scholar] [CrossRef]
  37. Haslauer, E.; Delmelle, E.C.; Keul, A.; Blaschke, T.; Prinz, T. Comparing Subjective and Objective Quality of Life Criteria: A Case Study of Green Space and Public Transport in Vienna, Austria. Soc. Indic. Res. 2014, 124, 911–927. [Google Scholar] [CrossRef]
  38. Mehaffy, M. Place Networks, The Structure of Healthy Streets and Sidewalks. Available online: http://www.livablecities.org/blog/michael-mehaffy-place-networks-healthy-streets-and-sidewalks (accessed on 19 April 2017).
  39. Costanza, R.; Fisher, B.; Ali, S.; Beer, C.; Bond, L.; Boumans, R.; Danigelis, N.L.; Dickinson, J.; Elliott, C.; Farley, J.; et al. Quality of life: An approach integrating opportunities, human needs, and subjective well-being. Ecol. Econ. 2007, 61, 267–276. [Google Scholar] [CrossRef]
  40. Zeisel, J. Sociology and Architectural Design; Free Press: New York, NY, USA, 1975. [Google Scholar]
  41. Nussbaum, M.; Sen, A. The Quality of Life; Nussbaum, M., Sen, A., Eds.; Oxford University Press: Oxford, UK, 1993; ISBN 9780198287971. [Google Scholar]
  42. Robeyns, I. The Capability Approach. In Stanford Encyclopedia of Philosophy; Stanford University: Stanford, CA, USA, 2016. [Google Scholar]
  43. Gibson, J.J. The Ecological Approach to Visual Perception; Houghton Mifflin: Boston, MA, USA, 1979; ISBN 0395270499. [Google Scholar]
  44. Steen, M. Organizing design-for-wellbeing projects: Using the capability approach. Des. Issues 2016. [Google Scholar] [CrossRef]
  45. Cutter, S.L. Rating Places—A Geographer’s View on Quality of Life; Assosiation of American Geographers: Washington, DC, USA, 1985; ISBN 0-89291-191-3. [Google Scholar]
  46. Salzano, E. Seven Aims for the Livable City. In The Wisdom of Cities; Lennard, H.L., Crowhurst Lennard, S.H., Eds.; Gondolier Press: USA, 2005; pp. 20–25. [Google Scholar]
  47. INIDE. Anuario Estadístico 2015; INIDE: Managua, Nicaragua, 2016. [Google Scholar]
  48. Demographia World Urban Areas: 15th Annual Addition; Demographia. 2019. Available online: http://www.demographia.com/db-worldua.pdf (accessed on 15 August 2019).
  49. INEC Proyección de la Población Ecuatoriana; INEC: Quito, Ecuador, 2013.
  50. Statistik Austria. Die größten Städte in Österreich am 1. Januar 2019 (in Einwohnern); Statistik Austria: Vienna, Austria, 2019. [Google Scholar]
  51. United States of America Census Bureau City and Town Population Totals: 2010–2018. Available online: https://www.census.gov/data/tables/time-series/demo/popest/2010s-total-cities-and-towns.html (accessed on 2 October 2018).
  52. Központi Statisztikai Hivatal. Magyarország Közigazgatási Helynévkönyve; Központi Statisztikai Hivatal: Budapest, Hungary, 2018. [Google Scholar]
  53. Kovács-Győri, A.; Cabrera-Barona, P. Assessing Urban Livability through Residential Preference–An International Survey. Data, under review.
  54. Kovács-Győri, A.; Reinel, B. Reflecting Individual Preferences and Spatiality in Livability Measurements: A Livability Assessment Platform for the City of Salzburg. In AMPS Proceedings Series 10—Cities, Communities and Homes: Is the Urban Future Livable? Tracada, E., Cairns, G., Eds.; AMPS C.I.O.: Derby, UK, 2017; pp. 211–221. [Google Scholar]
  55. Nunnally, J. Psychometric Theory, 2nd ed.; McGraw Hill: New York, NY, USA, 1978; ISBN 9788578110796. [Google Scholar]
  56. Papadakis, E.; Resch, B.; Blaschke, T. Composition of place: Towards a compositional view of functional space. Cartogr. Geogr. Inf. Sci. 2019. [Google Scholar] [CrossRef]
Figure 1. Key elements of livability.
Sustainability 11 04934 g001
Figure 2. Methodology workflow.
Sustainability 11 04934 g002
Figure 3. Example of human-scale road type density in the case of Salzburg.
Sustainability 11 04934 g003
Figure 4. General statistics about the distribution of the responses.
Sustainability 11 04934 g004
Figure 5. Bayesian network (acronyms are written in the first column of Table 2 and Table 3).
Sustainability 11 04934 g005
Figure 6. Probability of each thematic group of representing high satisfaction with living in a given city.
Sustainability 11 04934 g006
Figure 7. Relative relevance of livability variable groups in representing high satisfaction with living in a given city.
Sustainability 11 04934 g007
Figure 8. Motivation for daily car usage (based on Reference [53]).
Sustainability 11 04934 g008
Figure 9. Livability assessment, from conceptualization to application.
Sustainability 11 04934 g009
Table 1. Population (rounded) and number of responses for each study area.
CountryCityPopulationNumber of Responses *
NicaraguaLeón168,000 [47]32 *131 responses from developing countries
KenyaNairobi5,970,000 [48]46 *
EcuadorQuito2,700,000 [49]53
AustriaVienna1,900,000 [50] 91309 responses from developed countries
Salzburg154,000 [50] 51
United StatesPortland, OR653,000 [51]43
HungaryBudapest1,800,000 [52]69
Szeged161,000 [52]55
* In Nicaragua and Kenya, where paper-based questionnaires were used, not every question may have been completely answered.
Table 2. Statistically significant livability parameters based on the results of the generalized linear models (GLM) algorithm.
Category (Acronym)VariableEstimatep-Value
Modifying factors (MO)Level of development (developing/developed)1.71583<0.001 ***
Salary compared to basic needs0.651580.02730 *
Overall housing conditions 12.20714<0.001 ***
Community (CO)Being a member of this community makes me feel good. 21.2085<0.001 ***
I trust people in this community. 20.97520.001618 **
Most community members know me by face. 20.99790.008569 **
Members of this community care about each other. 21.11830.008702 **
Urban form (FO)Buildings in a street with similar style (architectural design). 3−0.844880.089097 ·
Street furniture (benches or chairs to sit. dustbins. shade. drinking fountains. etc.) 40.709850.089852 ·
Trees along the streets. 41.163640.005797 **
Overall quality of the built environment. 11.47969<0.001 ***
Transportation mode (TM) 7Going to work by bicycle. 51.800050.01753 *
Going to shop by public transport. 5−0.812670.03276 *
Going to shop by bicycle. 5−2.133420.00474 **
Perceived mobility (PM) 8Perceived cycling and walking safety. 60.53080.06222.
Perceived cycling and walking quality. 10.97280.00109 **
Perceived overall transportation quality. 11.2<0.001 ***
Car (CA) 9Car is the only way to reach the person’s destination. 2−0.815820.068534.
Car is used because the person’s destinations are too far. 20.987350.021055 *
Mobility infrastructure (M) 10Special transportation services. 3−3.2276760.0118 *
Easy to read traffic signs. 42.1167240.0448 *
Enforced speed limits. 41.1945530.0372 *
Function & needs (FU, N)I would let my children to walk/cycle alone. 20.89910.00227 **
There is a lot of crime in the neighborhood. 2−0.89120.01426 *
Needs are fulfilled by the available urban functions. 20.46740.040538 *
p-value: “***” < 0.001, “**” < 0.01, “*” < 0.05, “·” < 0.1. 1 Quality: Poor/Fair/Good/Very good/Excellent; 2 How well represents: Not at all/Somewhat/Mostly/Completely; 3 Importance: Not at all/Somewhat/ Important/Extremely important; 4 Binary: Have/Not have, Yes/No; 5 Frequency: Every day/Weekly/Monthly/Yearly/Never; 6 Safety: Very dangerous/Dangerous/Safe/Very safe; 7 What transportation mode (and how frequently) the people use for going to work, going shopping, or to reach their destination for free-time activities? 8 How do people perceive overall mobility conditions in terms of safety and quality for walking and cycling, or the transportation in general? 9 What are the reasons for a person to use a car as their main transportation mode (every day or almost every day)? 10 What factors or characteristics are the most relevant factors according to the people for the mobility infrastructure (e.g., road network, transportation services)?
Table 3. Results of the relational-statistical learning.
Category (Acronym)VariableProbability
Modifying factors (MO)Level of development.0.477270.88142
Salary compared to basic needs.0.125
Overall housing conditions.0.2
Community (CO)Being a member of this community makes me feel good.0.697670.88571
I trust people in this community.0.67857
Most community members know me by face.0.53125
Members of this community care about each other.0.75
Urban form (FO)Buildings in a street with similar style (architectural design). 0.794120.91935
Street furniture (benches or chairs to sit, dustbins, shade, drinking fountains, etc.) 0.7037
Trees along the streets.0.52
Overall quality of the built environment.0.75
Transportation mode (TM)Going to work by bicycle.0.99990.63636
Going to shop by public transport.0.66667
Going to shop by bicycle.0.33333
Perceived mobility (PM)Perceived cycling and walking safety.0.477270.88608
Perceived cycling and walking quality.0.63636
Perceived overall transportation quality.0.71429
Car (CA)Car is the only way to reach the person’s destination.0.333330.75439
Car is used because the person’s destinations are too far.0.78261
Mobility infrastructure (M)Special transportation services.0.459460.91827
Easy to read traffic signs.0.625
Enforced speed limits.0.69231
Function & needs (FU, N)I would let my children to walk/cycle alone.0.66660.89326
There is a lot of crime in the neighborhood. *0.64734
Needs are fulfilled by the available urban functions.0.76144
Road network density (RC)Higher density of road network supporting human-scaled mobility0.77559
* inverse (as all the other statements were formulated to represent better livability conditions, we used inverse values to refer to higher safety).
Table 4. Confusion matrix of the livability prediction (n = 75).
Predicted Higher SatisfactionPredicted Lower Satisfaction
Actual Higher Satisfaction5311
Actual Lower Satisfaction47

