Article

Analysis of Space-Time Variation of Passenger Flow and Commuting Characteristics of Residents Using Smart Card Data of Nanjing Metro

1
College of Automobile and Traffic Engineering, Nanjing Forestry University, Nanjing 210037, China
2
China Design Group Co., Ltd., Nanjing 210014, China
3
School of Transportation, Southeast University, Nanjing 210096, China
*
Author to whom correspondence should be addressed.
Sustainability 2019, 11(18), 4989; https://0-doi-org.brum.beds.ac.uk/10.3390/su11184989
Submission received: 7 August 2019 / Revised: 30 August 2019 / Accepted: 9 September 2019 / Published: 12 September 2019
(This article belongs to the Section Sustainable Transportation)

Abstract

:
The rapid development of cities has brought new challenges and opportunities to traditional traffic management. The usage of smart cards promotes the upgrading of intelligent transportation systems, and also produces considerable big data. As an important part of the urban comprehensive transportation system, Nanjing metro has more than 1 million inbound and outbound records of traffic smart cards used by residents every day. How to process these traffic data and present them visually is an urgent problem in modern traffic management. In this study, five working days with normal weather conditions in Nanjing were selected, and the swiping records of the smart cards were extracted, and the space–time characteristics were analyzed. In terms of time analysis, this research analyzed the 24-h fluctuation of daily average passenger flow, peak hour coefficient of passenger flow, 24-h fluctuation of passenger flow on different metro lines, passenger flow intensity on different metro lines and passenger flow comparison at different stations. In spatial analysis, this study uses thermodynamic charts to represent the inflow and outflow of passengers at different stations during early and evening peak periods. The analysis results and visualized images directly reflect the area where Nanjing metro congestion is located, and also shows the commuting characteristics of residents. It can solve the problem of urban congestion, carry out the rational layout of urban functional areas, and promote the sustainable development of people and cities.

1. Introduction

With the continuous expansion of urban scale, the integrated transportation system is becoming more and more complex to meet the emergence needs of different residents. The construction of traffic informationization has brought about the development of intelligent transportation, and also put forward new requirements for traffic management. The traffic big data analysis emerges as the times require. Traffic big data technology needs to obtain a large number of effective data from daily traffic operations and use mathematical methods to analyze and predict the data.
A traffic smart card is the basic tool for urban residents to use various means of transport, recording passengers’ daily travel records. For the urban metro, the automatic ticket-selling and checking system at the metro station will record the card swiping information of each passenger entering and leaving the station. Even temporary passengers have to buy reusable smart cards to take the subway. The large data of urban metro passenger flow mainly comes from the information of passenger card swiping.
The passenger flow of urban metro varies with different time and space, including working days, holidays, seasons, residential areas, business centers, workplaces, and other factors, including climate, other modes of transportation connecting with the metro, and future planning of the city. The big data of urban metro reflects residents’ commuting habits, and how space–time variables affect these travel habits. Despite the imbalance and randomness of the metro passenger flow data, the big data technology can find the law of equilibrium and certainty behind the big data.
In the past, the analysis methods of metro passenger flow often took the form of questionnaires, which is difficult to make accurate quantitative analysis by using the survey data to evaluate and predict. Each city’s public transport system has its own unique structure, which reflects the travel characteristics of urban residents and the spatial and economic structure of the city. Smart cards can record passengers using different means of transport and show a complete route. The number of smart cards provides a large number of accurate passenger travel data, from which a large number of effective information can be excavated. Now, the rapid development of big data mining and deep learning technology provides a technical possibility for the analysis of large traffic data.
Some researchers applied various models to study the prediction of subway passenger flow. Wei Y et al. proposed a prediction method combining empirical mode decomposition and back propagation neural network to predict the short-term passenger flow in the metro system. The prediction effect was good [1]. Liu S et al. used the improved particle swarm optimization algorithm to optimize the parameters and put forward a new evaluation index. Taking the passenger flow data of Guangzhou metro station in China during the national day as an example, the effectiveness of this method was verified [2]. Li L et al. proposed a hybrid model for capturing complex patterns. The performance of the hybrid model was compared with ARIMA model and BP neural network using the actual data of Xi’an metro line 1. The results show that the hybrid model is superior to the other two models [3].
Controlling subway passenger flow can effectively alleviate the congestion. Jiang M et al. established a passenger source station selection model based on utility theory, corrected the distribution of incoming passenger flow between stations, and validated it by taking Beijing metro as an example [4]. Li S et al. can effectively calculate the optimal control law by using quadratic programming algorithm for solving the problem of optimal joint dispatch of trains and passenger flow control strategy [5]. Yang J et al. put forward a composite strategy of passenger flow control and bus bridge service, which can effectively reduce the number of stranded passengers and relieve the pressure of congestion [6].
Shi J et al. proposed an effective method for collaborative optimization of train timetable and accurate passenger flow control strategy on supersaturated metro lines. The performance and validity of the proposed method was verified by the operation data of Beijing metro system [7]. Li S et al. proposed a train traffic model for metro line operation based on the uncertain hybrid switching system, which guaranteed the stability of the metro line system under disturbance [8].
In the research of metro big data, some researchers use the smart card data of automatic checking ticket systems to study the travel law of passenger flow. Lee Y K et al. proposed a clustering analysis method for metro passenger travel patterns. Using the real data set in the Seoul metro network, the passenger movement patterns were visualized [9]. Lee K et al. developed a time distance algorithm based on T-card transaction database to measure the time distance between each pair of transmissions and analyzed the spatial structure of accessibility between two time points in the Seoul metropolitan area [10]. Sun L et al. proposed a comprehensive Bayesian statistical reasoning framework to describe the passenger flow distribution model in the complex metro network. The analysis of Singapore’s metro network shows that travel time reliability is of great significance to metro operation [11].
Noh K tried to use Seoul’s urban public data to explore ways to improve the congestion situation of Seoul’s subway, and put forward a policy to establish a new bus route to connect with the subway station [12]. Kim J used multivariate regression analysis and big data processing technology to monitor the congestion degree in real time through the existing congestion situation of the subway, and to analyze the information of its departure and arrival stations [13]. Based on taxi and subway passenger data, Zhu Y explored the post-hurricane recovery model of New York’s road and subway systems. The results show that the road network has a higher elasticity than the subway [14]. Hong L et al. proposed a metro passenger flow assignment method based on automatic ticket sales and checking data. The preliminary application of OD pair classification for Shanghai metro system shows that the method is feasible [15].
Visualization of big traffic data can facilitate observers to have an intuitive understanding of big data. Wibisono A and others used a fast incremental model to analyze and predict very large traffic data sets, and visually predict traffic flow in sensor points generated in actual map simulation [16]. Zhang J et al. used a spatial interpolation method to discretize bus passenger flow into continuous regional distribution on the basis of big data of Beijing bus IC card and analyzed the spatial and temporal variation trend of all-day passenger flow in Beijing [17]. Hwang U took Yunzhou airport as the research object and carried out big data analysis and visualization analysis to determine the needs of airport users. The results show that airport users are interested in the terminals of railways, highways, and express buses [18].
Nanjing metro network is evolving, and passenger flow has also changed accordingly. Based on the smart card data of the Nanjing metro system in China, Fu X et al. studied the changes of passenger flow and travel time after the new metro line 4 opened in 2017 [19]. Li J et al. established a passenger flow fluctuation model to evaluate the impact of weather conditions on the fluctuation of single-line passenger flow of Nanjing metro in China [20]. Wei Y et al. established the supernetwork model of Nanjing metro network, proposed new parameters to describe the model, and compared it with the traditional space L and space P models [21]. Yu W et al. used the complex network method to analyze the space–time evolution of Nanjing metro network according to the opening sequence of 10 metro lines in Nanjing [22]. Zhao J et al. used the multiple regression model and multiplication model, respectively. Taking Nanjing metro system as an example, the paper discussed the influencing factors of passenger flow between stations and stations [23].
Nanjing metro, together with other modes, constitutes an integrated transportation system. Yang M and others surveyed commuters who entered the subway using public bicycles and analyzed users’ personal characteristics and their commuting experiences [24]. Wu J et al. used the survey data in Nanjing and applied mixed logic to analyze the influencing factors of urban metro commuters’ entry and exit mode selection, and summarized the transfer needs of different groups of commuters in segments [25]. Li Y et al. collected data from Mobiles’ shared bicycle system and applied cluster analysis to analyze the activity pattern of the system near Nanjing metro station [26].
In this study, the smart card data of Nanjing metro were used to select the representative passenger inbound and outbound records of five working days and the space–time characteristics of the passenger flow in the metro were analyzed. This study mainly analyzed the 24-h fluctuation of daily average passenger flow, peak hour coefficient of passenger flow, 24-h fluctuation of passenger flow of different metro lines, passenger flow intensity of different metro lines, and passenger flow comparison of different stations. In spatial analysis, this study uses thermodynamic charts to represent the inflow and outflow of passengers at different stations during early and evening peak periods. These visual figures provide a useful attempt to understand traffic data intuitively.
By analyzing the big data of metro passenger flow, the research can grasp the space–time variation of metro passenger flow, predict the future passenger flow, and lay the foundation for traffic management and traffic planning. Furthermore, traffic planning and urban commercial planning can be combined to achieve the dynamic balance of residents’ residence and work, improve the level of urban public services, and promote the sustainable development of the city.

2. Nanjing Metro Line and Population Situation

2.1. Opening Lines of Nanjing Metro

Figure 1 shows the route map of Nanjing metro in 2017. As of 17 January 2017, Nanjing metro has opened six lines in the order of 1, 2, 10, S1, S8, and 3. Figure 1 shows different lines in different colors. The name of stations of the metro lines are indicated in the figure. From the subway map, we can see that the main lines are line 1, line 2, and line 3, which run through the main urban area of Nanjing. Line 10, line S1, and line S8 are extension lines connecting remote suburbs of Nanjing. Xinjiekou Station, the intersection of line 1 and line 2, is the geographical and commercial center of Nanjing. Line 1 and line 3 form a circular structure, which depicts the outline of the main urban area of Nanjing. The two intersections are Nanjingzhan of the old railway station and Nanjingnanzhan of the new railway station. They are also important transportation hubs.
Table 1 shows the opening sequence and performance of Nanjing metro lines in 2017. From 2005 to 2017, Nanjing metro opened six metro lines. Line 1 and line 2 were opened at a relatively long-time interval, and then entered a high-frequency period of opening, especially in 2014, when line 10, line S1, and line S8 were opened together. Line 1 was opened in 2005, from Maigaoqiao to Aotizhonxin, a total of 16 stations. Later, line 1 was opened with the south extension line in 2010, and some stations have changed names. These 27 stations were later collectively referred to as line 1. Line S1 was opened at eight stations in 2014. Some site names have changed. Lines 1, 2, and 3 are the main lines, and the number of stations of these lines is obviously larger than the other three extension lines. The number of stations on the extension line 10, S1, and S8 is small, but the overall distance is not short, which is due to the large distance between stations in remote areas.

2.2. Nanjing Population Situation

According to the Nanjing national economic development and statistical bulletin of 2016, issued by Nanjing statistical bureau, by the end of 2016, Nanjing’s urban and county data population had been growing steadily at a low speed. By the end of 2016, the city’s permanent population was 8.27 million, an increase of 34.1 thousand people, or 0.41 percent, over the end of last year. Among them, 678.14 million people live in cities and towns, accounting for 82% of the total population, an increase of 0.6 percentage points over the end of last year. The population of Nanjing has a direct impact on the subway passenger flow. With the opening of more metro lines, there will be further land planning and opening around the metro stations, which has a clustering effect on residents’ living. More people will choose the convenient public transport mode of metro.

3. Weather and Workday Selection

In order to analyze the big data of Nanjing metro, we choose the nearest 2017 data, which is from January 9 to January 13, that is, the working day from Monday to Friday. The data come from weather statistics of meteorological departments, which reflect the real weather situation for post-event statistics rather than pre-forecast. The weather is normal, not extreme weather, so as not to affect the normal passenger flow analysis. Table 2 shows the date and weather of the five working days. On 18 January 2017, Nanjing metro line 4 opened. Before that time, the situation of Nanjing metro lines was the same as in 2016.

4. Time Analysis of Metro Passenger Flow in Nanjing

4.1. Big Data Sources and Analysis Procedure

Nanjing metro passenger flow data comes from smart card swiping data collected by relevant management departments, including card number, card type, station, inbound and outbound time data, etc. Time data is accurate to seconds. In the following analysis, in order to simplify data processing, the daily data are counted to 24 h, 0–23 o’clock. The passenger flow released by the official metro management department is generally the sum of passenger flow and transfer times. The passenger flow in this study does not consider the number of transfers, that is, the number of inbound or outbound records between any two stations. According to the corresponding relationship, the number of passengers entering and leaving the station is the same. For individual abnormal data, deletion processing was carried out.

4.2. Comparison of Passenger Flow in Five Working Days

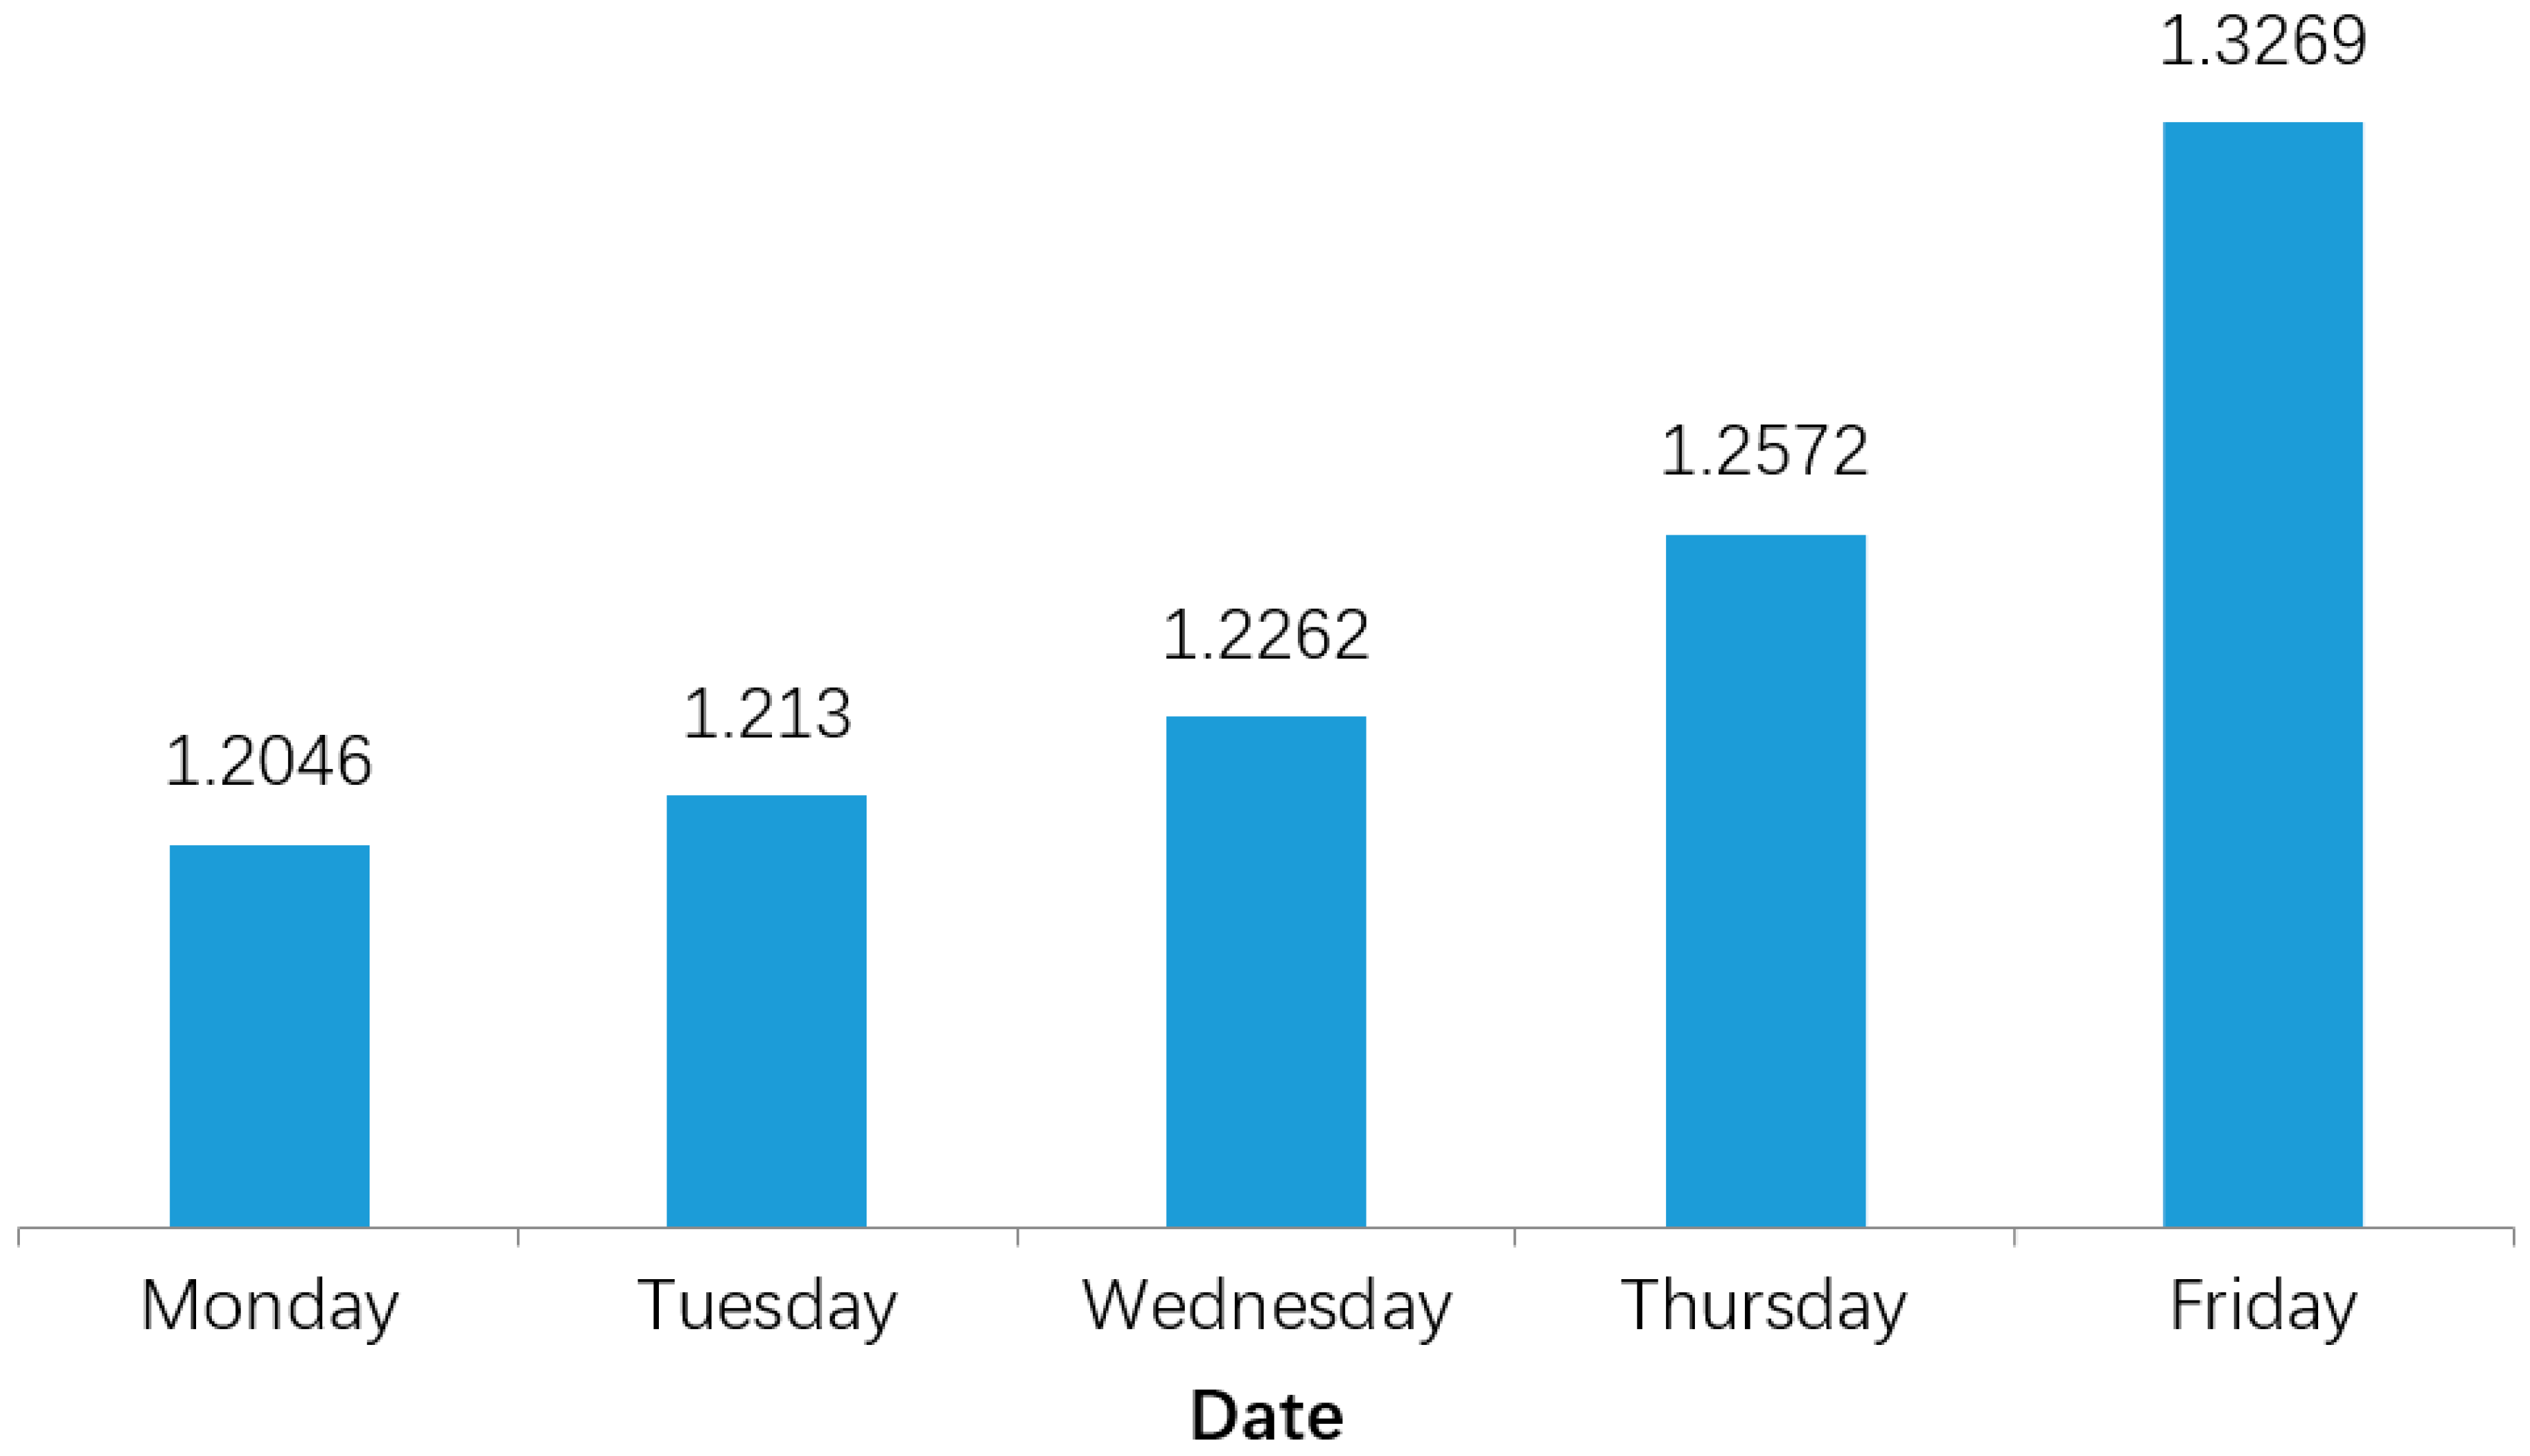
Figure 2 shows the statistics of daily passenger flow of Nanjing metro in five working days. As can be seen from the figure, the passenger flow from Monday to Friday ranges from 1.20 million to 1.32 million. Passenger flow from Monday to Friday is increasing gradually, but the increase is not large, about 0.12 million. At the end of 2016, the permanent population of Nanjing was 8.27 million, which can be used to calculate the proportion of pedestrians to the permanent population in about one seventh. Considering the commuting needs of the same resident, the actual number of people taking the subway is much smaller.
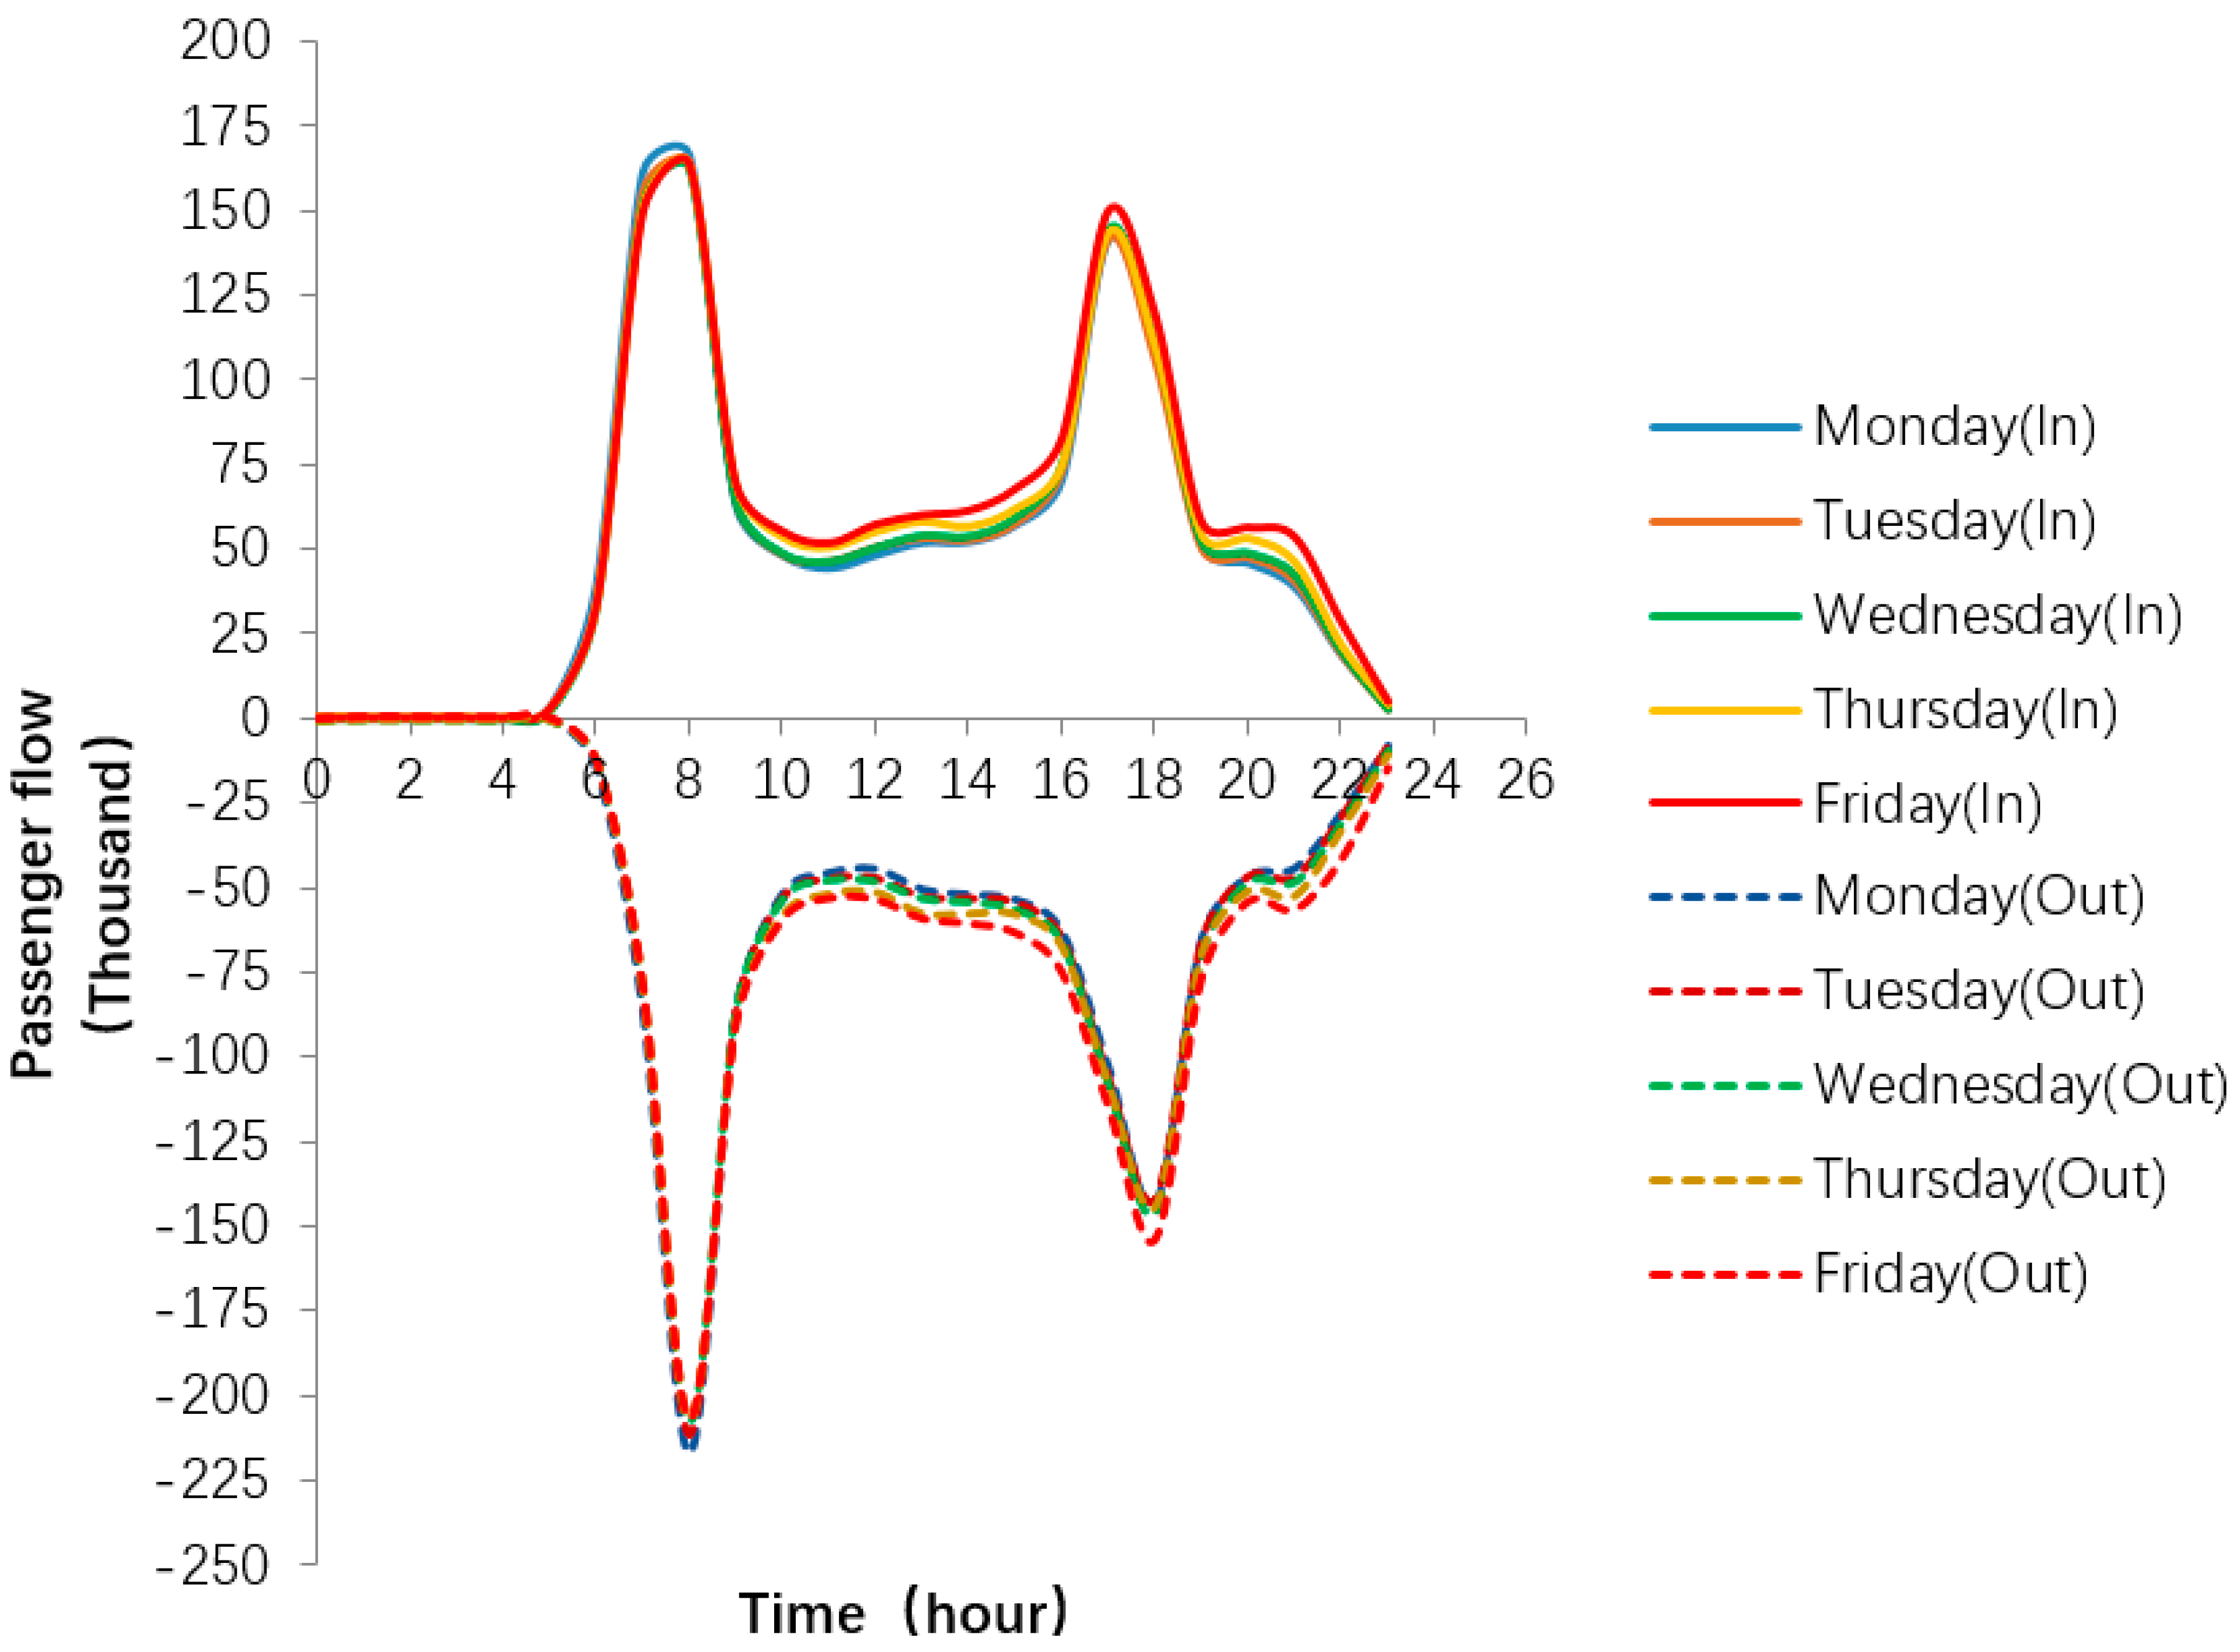
Figure 3 shows the 24-h passenger flow fluctuation of the metro in five working days. The time is from 0:00 to 23:00. The positive number of passenger flow indicates the number of inbound passengers and the negative number indicates the number of outbound passengers. The five-day inbound curve is basically the same as the five-day outbound curve, because the daily passenger flow gap is not large. If the passenger flow disperses to 24 h, the gap will become smaller. The difference is that the morning peak of the station is a blunt angle, with two peaks of 7:00 and 8:00, while the morning peak of the station is a sharp angle, with an 8:00 peak. Inbound and outbound evening peaks are sharp corners, with a peak of 18:00. Before 6:00 in the morning, almost no one took the subway. By 18:00 p.m., it was a small peak, and then the number of passengers began to decrease. By 23:00 p.m., almost no one took the subway.
During the peak hours at 7:00 and 8:00 a.m., the number of people entering the station was about 170,000 per hour. During the morning peak at 8:00, the number of people leaving the station was about 220,000 per hour. This is because the normal working time in Nanjing is from 9:00 to 17:00. Residents have to go to work before 9:00. Considering the distance, the number of outbound passengers is more concentrated than that of inbound passengers. During the evening peak, the number of arrivals at 17:00 is about the same as that at 18:00, about 150,000.

4.3. Peak Analysis of Passenger Flow

In order to facilitate data analysis and take into account the similarity of passenger flow data in five working days, the average passenger flow data in five working days wastaken, that is, daily average passenger flow. The peak hour coefficient of daily average passenger flow is used to reflect the crowding degree of passenger flow at the time point. Peak hour coefficient refers to the proportion of passenger flow concentrated in one hour in a day to the total passenger flow. This index is mainly used to reflect the unbalanced travel time of passengers. In practice, the design scale of many transportation facilities is based on this.
C i = F i / F t ( i = 0 , 1 , 2 , 23 )
In Equation (1), C i is peak hour coefficient, F i is one hour passenger at i o’clock, F t is passenger flow of one day, and i is the time, from 0:00 to 23:00.
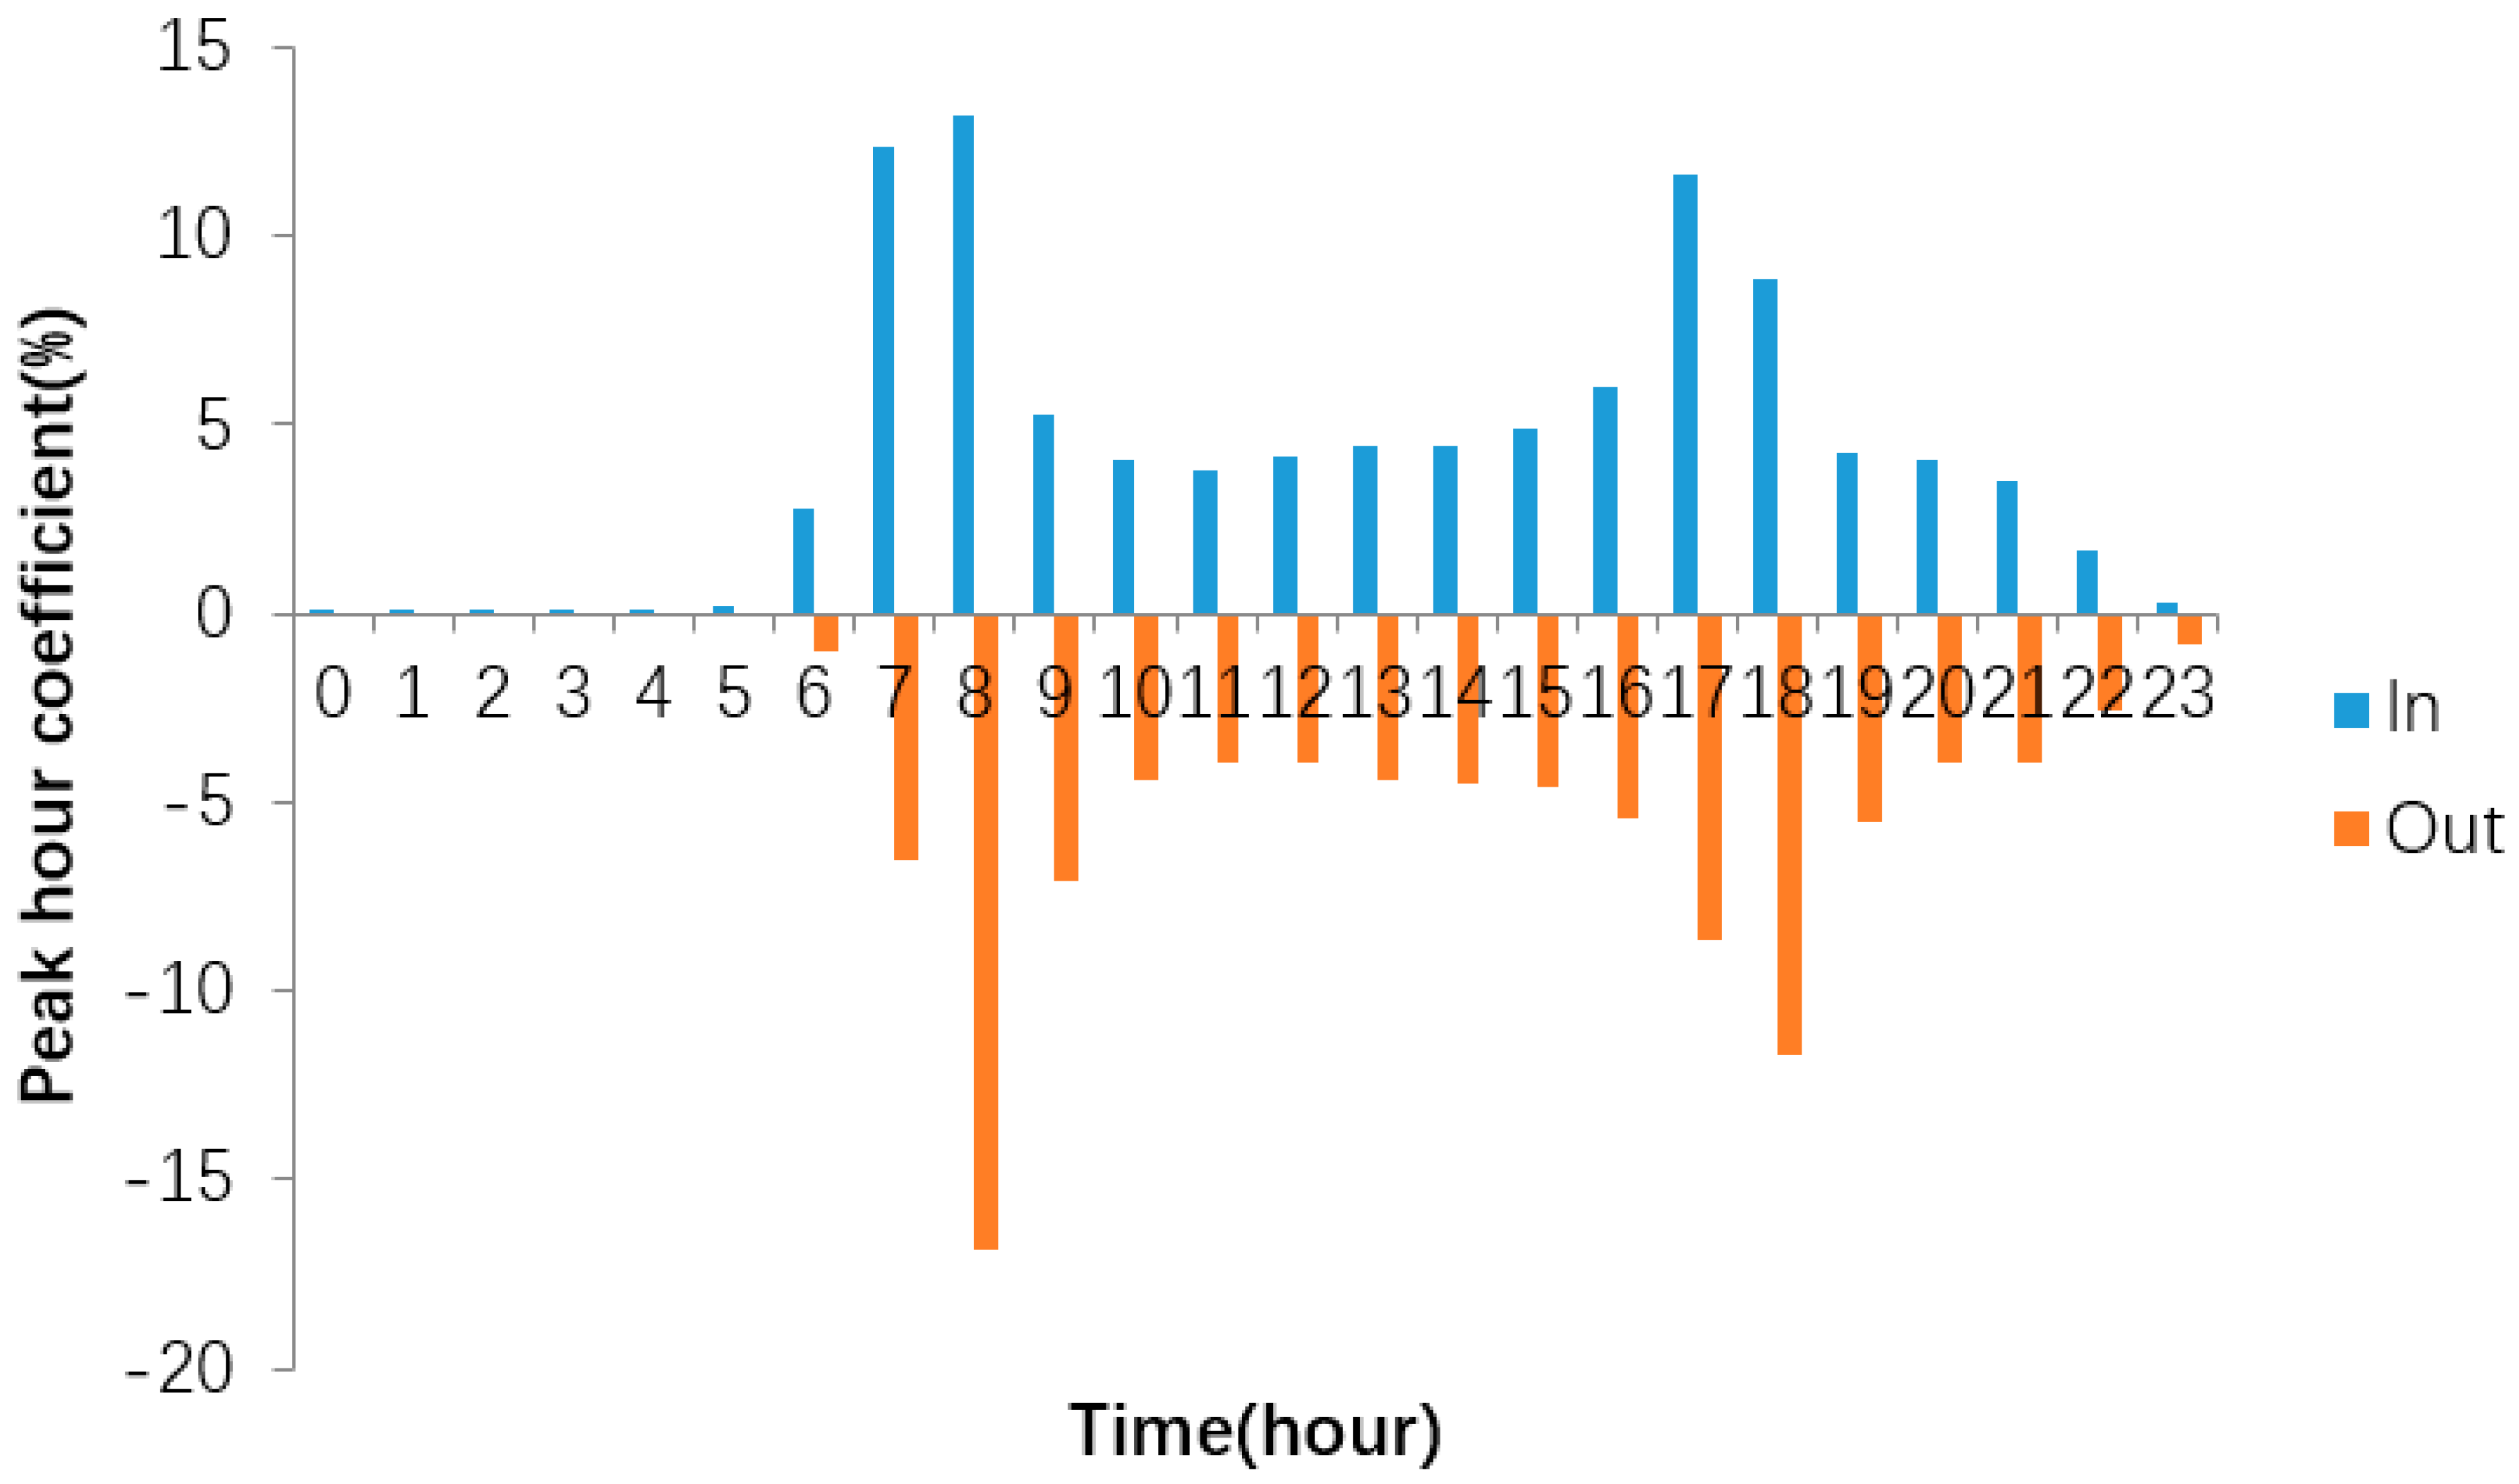
Figure 4 shows the peak hour coefficient of daily average passenger flow. Figure 4 corresponds to Figure 3 to some extent, but the peak hour coefficient can be expressed by histogram and proportion, which can visually show the crowding degree of passenger flow at time points. During the morning peak period, the number of arrivals concentrated at 7:00 and 8:00, accounting for 12% and 13% respectively, while the number of departures concentrated at 8:00, accounting for about 17%. These data reflect that some subway passengers in Nanjing use the subway as a commuting tool, starting work at 9:00 in the morning. Considering the distance of different routes, many passengers choose to leave at 7:00 or 8:00.
Then the number of arrivals and departures began to decline, reaching a low of less than 5% at 11:00, which is also lunchtime. After noon, the number of inbound and outbound passengers gradually increased and reached a new height at the evening peak. The passengers are mainly commuters, and there are not many other passengers who use the Nanjing metro for leisure or tourism.
During the evening peak period, the number of arrivals reached the highest at 17:00, about 12%. The number of people leaving the station reached the highest at 18:00, about 12%. It also shows that there is a lag relationship between inbound and outbound peak, which is concentrated around 18:00. After 19:00, the number of inbound and outbound passengers began to decrease gradually, less than 5%. Some passengers choose the subway as their commuting tool. The off-duty time is concentrated at 17:00, while the commuting time is not too long, basically concentrated in two hours.
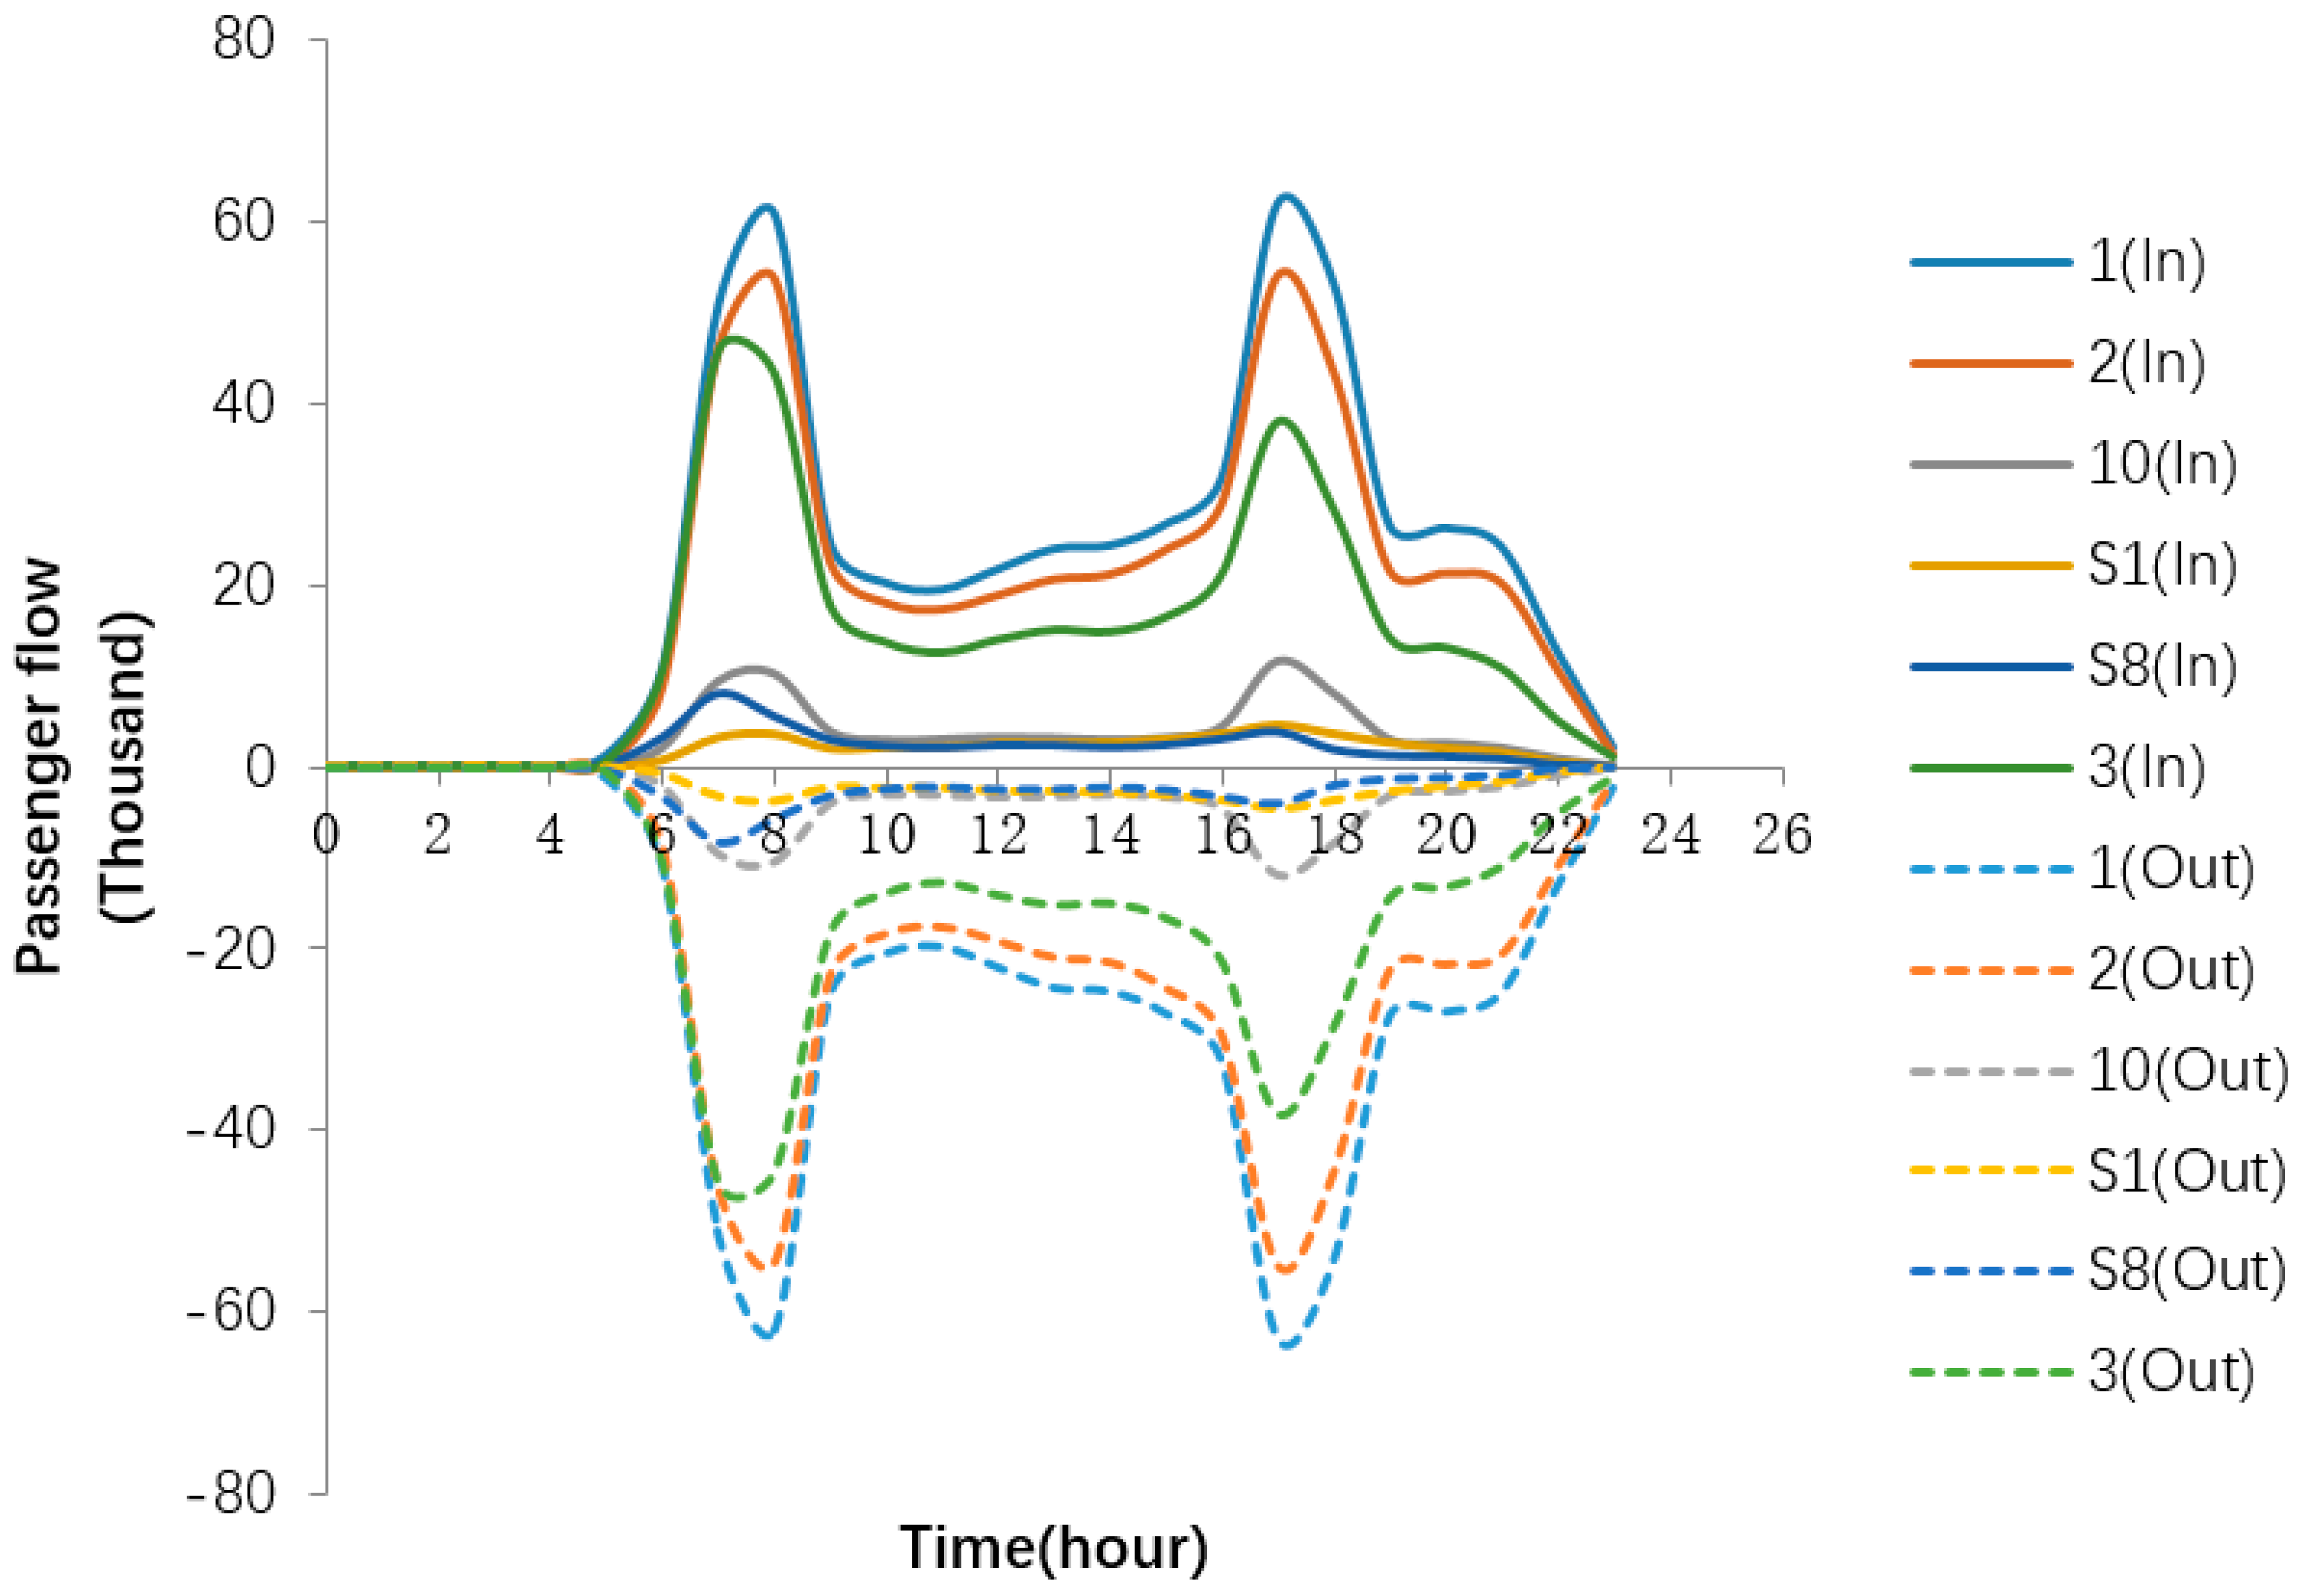
Figure 5 shows the 24-h distribution of the daily average passenger flow of six metro lines. Here, the traffic of all stations on each subway line is counted on each line. As can be seen from the figure, the order of passenger flow is line 1, 2, 3, 10, S8, and S1. The passenger flow of trunk line 1, 2, and 3 is much larger than that of branch line 10, S1, and S8.
During the morning peak period, the wave peaks of inbound and outbound stations of line 1 and line 2 are concentrated at 8:00, which is about 60,000. The wave peaks of other lines are concentrated at 7:00. The wave peaks of line 3 are slightly less than 50,000, while those of line 10, S1, and S8 are all less than 10,000. This shows that there are fewer people and more rest time on the main lines 1 and 2 before 7:00. Residents on other routes travel earlier and may need to make longer-distance transfers through the trunk lines.
During the evening peak hour, all the inbound and outbound peaks are concentrated at 17:00. The number of inbound and outbound passengers of line 1 and line 2 is basically the same, similar to the morning peak, about 50,000. However, the number of inbound and outbound passengers on line 3 is lower than the peak value during the morning peak period, which is about 35,000. After 19:00, the number of inbound and outbound stations decreased from peak to sub-peak and remained stable until 21:00. After 21:00, the number of inbound and outbound passengers began to decrease sharply, which indicated that the whole city had entered a rest time.
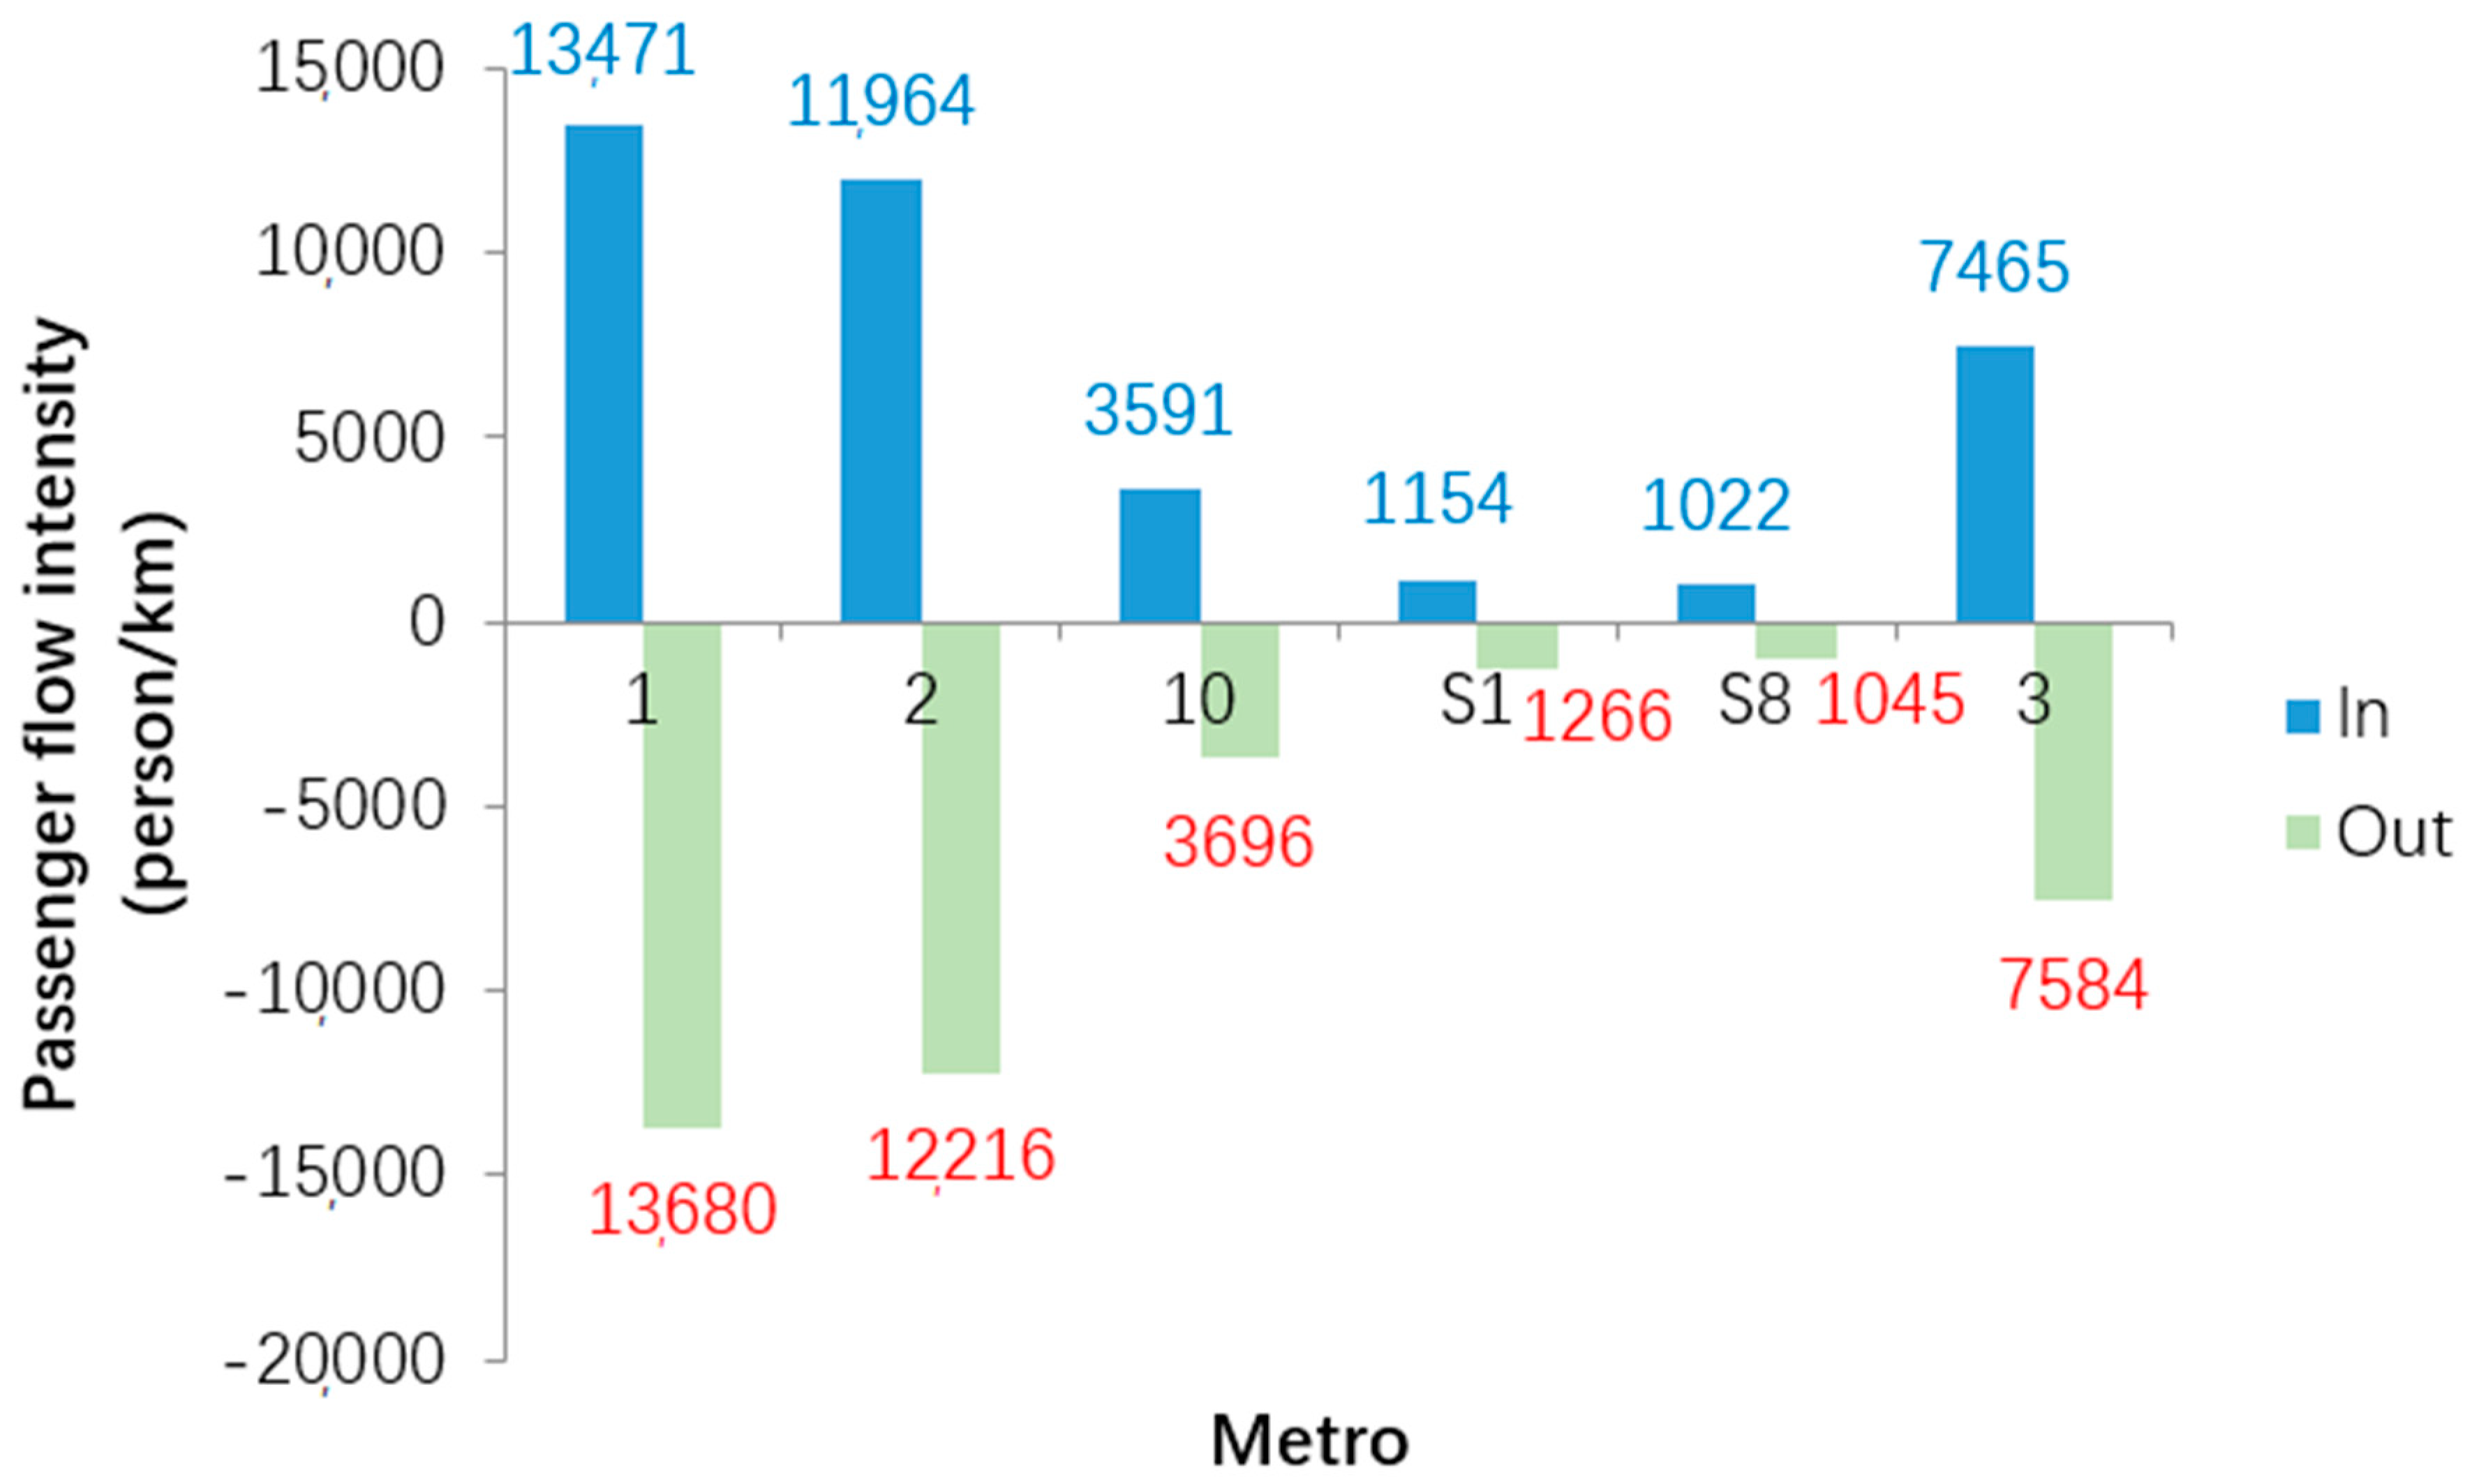
Passenger flow intensity of metro line is the ratio of passenger flow and mileage, which reflects the operation efficiency and compression capacity of the metro line.
S j = F j / L j ( j = 1 , 2 , 3 , 6 )
In Equation (2), S j is passenger flow intensity, F j is passenger flow of the line j , L j is the length of the line j , and j is the line number of Nanjing metro lines.
Figure 6 shows the daily average passenger flow intensity of six metro lines. The daily average passenger flow of five working days was used to calculate the passenger flow here. Passenger flow intensity unit is per person/kilometer. As can be seen from the figure, the intensity of passenger flow in and out of the same line is not very different. For the inbound passenger flow, line 1 and line 2 have the strongest passenger flow, which are 13,471 and 11,664, respectively. This shows that line 1 and line 2 have higher operational efficiency and play a role of the main line. The passenger flow intensity of line 3 is only 7465, which is much lower than that of line 1 and line 2. The reason is that the extension direction of line 3 is roughly the same as that of line 1. The passenger flow of line 3 is shared by line 1. The passenger flow intensity of line 10 is 3591, which is much lower than that of the main line. However, the passenger flow intensity of line S1 and line S8 is lower, 1154 and 1021, respectively, because the two antenna paths extend too far into the region. However, with the gradual maturity of real estate and commercial development around metro stations, the number of resident populations will gradually increase, and the passenger flow intensity of metro extension line will also increase, playing an evacuation role for the resident population in urban centers.

5. Spatial Analysis of Metro Passenger Flow

5.1. Passenger Flow Comparison of Stations

By the end of 2016, Nanjing had opened six metro lines with 113 stations. There are some similar intersections between these lines, which play the role of transportation hub and transfer. Table 3 shows the code of Nanjing metro stations. The codes of these stations are marked by automatic fare collection system, which is used to record passenger’s origin–destination data of swiping smart cards.
Figure 7 shows a comparison of the average daily passenger flow at 113 metro stations. From the figure, we can see that there is a certain mapping relationship between inbound and outbound passenger flow, and the basic figure is consistent. The station with the largest passenger flow is very obvious, reaching about 90,000, which is Xinjiekou. Xinjiekou is the intersection of metro line 1 and line 2. It is also the geographical and commercial center of Nanjing. Although the city scale of Nanjing is expanding and the new commercial center is also dispersing passenger flow, Xinjiekou still occupies an important commercial position after transformation and upgrading. In addition to Xinjiekou, some stations with large passenger traffic remain around 30,000–40,000. There are also many stations with passenger flow of less than 3000, which indicates that these stations are in relatively remote areas, so passenger flow is very small, and further commercial development is needed to drive passenger flow.
Because the codes of Nanjing metro stations are related to the sequence of line opening, the earlier the station coding number on the subway line opening, the smaller the number of station coding. The codes of stations on each metro line are basically continuous. From Figure 7, it can be seen that different metro lines have different carrying capacities for passenger flow. Most of the passenger flow is carried by the early main lines, and the passenger carrying capacity of some remote lines has not been brought into full play. The passenger carrying capacity of different stations on the same line is also different. Generally, there is a central station. Several other stations around the central station form a small central area, which carries most of the passenger flow on the metro line.
In order to analyze the passenger flow distribution law of Nanjing metro station, the most representative morning and evening peaks were selected to analyze the congestion situation of metro passenger flow. The morning peak time is 8:00 in the morning and the evening peak time is 18:00 in the evening.
Figure 8 shows the comparison of metro stations of inbound passenger flow at 8:00 and outbound passenger flow at 18:00. The figure shapes of 8:00 inbound passenger flow and 18:00 outbound passenger flow are very similar at metro stations, only individual stations are different. Inbound passenger flow at some stations is slightly larger than outbound passenger flow. The three stations with the highest passenger flow at 8:00 are Maigaoqiao, Youfangqiao, and Liuzhoudonglu, which are about 10,000. Other inbound passenger flows are basically below 5000. The four stations with the highest outbound passenger flow at 18:00 are Liuzhoudonglu, Xinjiekou, Maigaoqiao, and Youfangqiao, which are about 7000–8500. The outbound passenger flow of other stations is basically below 5000. Among the symmetry comparison of inbound and outbound graphics, the most unusual one is Xinjiekou, where the inbound passenger flow at 8:00 is less than other stations, while the outbound passenger flow at 18:00 is more than other stations. The reason may be that Xinjiekou, as a commercial center, is gradually decreasing in population, so fewer people go out to work and more people leave work at 18:00.
Figure 9 shows the comparison of metro stations of outbound passenger flow at 8:00 and inbound passenger flow at 18:00. The figure shapes of outbound passenger flow at 8:00 and inbound passenger flow at 18:00 of the subway station are very similar. The outbound passenger flow at the same station is much larger than the inbound passenger flow. The reason may be that the statutory working day in Nanjing is 9:00, so the passenger flow is concentrated to 8:00. At 18:00, Xinjiekou, the station with the highest passenger flow, had about 12,000. Inbound passenger flow of other stations was basically below 5000. The highest outbound passenger flow at 8:00 was Xinjiekou, which was about 2000. The stations with more passenger flow were Zhujianglu, Jimingsi, and Daxinggong, which had 9000–10000. The passenger flow of other stations was basically below 5000.

5.2. Spatial Distribution of Station Flow at Morning and Evening Peaks

In order to study the spatial distribution of station traffic during morning peak and evening peak, the time periods of 8:00 during morning peak and 18:00 during evening peak were selected to analyze the passenger traffic of 113 stations. Here, the image of passenger flow thermogram is used to express the passenger flow of the subway station. The thermogram shows the route of passenger flow and the geographical area where passenger flow is located in the form of special highlights. The passenger flow thermogram of metro stations is used to express the crowding degree of metro stations, and different colors are used to express the different passenger flow of the stations.
According to the international general color warning standards, there are four kinds of color. Green represents unimpeded, 0–2999, yellow represents congestion, 3000–5999, orange represents congestion, 6000–8999, red represents very congested, more than 9000. In order to express the warning color conveniently, the color of the subway line waschanged to grey. The circle represents different subway stations, and the color in the circle represents the passenger flow of the subway stations. On the thermodynamic chart, the name of the starting station, the intersection station, and the station divided by the congestion state of the metro line are labeled.
Figure 10 shows the inbound passenger flow distribution at 8:00 of morning peak. From the picture, we can see that the red stations are Liuzhoudonglu, Maigaoqiao, and Youfangqiao. Yellow stations are Tianruncheng, Nanjinglinyedaxue.xinzhuang, Maqun, Sanshanjie, Zhonghuamen, Andermen, and Shuanglongdadao. Crowded stations are concentrated on the main lines of the metro. For metro line 1, the most congested stations were Maigaoqiao, Sanshanjie, Zhonghuamen, and Shuanglongdadao. Andermen is an important transfer station because of the large number of residents nearby. For metro line 2, there are more residents near Youfangqiao and Maqun. For line 3, Nanjinglinyedaxue. xinzhuang is an important public transport hub, and close to the railway station, so the passenger flow is large. Liuzhoudonglu and Tianruncheng are special kinds of sites, which are separated from the main urban area by the Yangtze river. In this area, a large number of real estate has been developed and there are many inhabitants. Other residents who need to cross the river and enter the city also need to transfer to the subway here. Because of the congestion of the Yangtze river bridge, the subway is a necessary and effective travel choice compared with bus and driving.
Figure 11 shows the outbound passenger flow distribution at 8:00 of the morning peak. From the picture, we can see that the red stations are Xinjiekou, Daxinggong, Gulou, and Zhujianglu. The orange sites areRuanjiandadao and Shanghailu. The yellow stations are Nanjingzhan, Xinmofanmalu, Xuanwumen, Jimingsi, Hanzhongmen, Xianmen, Sanshanjie, Zhangfuyuan, Changfujie, Jiqingmendajie, Aotidong, Yuantong, Tianlongsi, and Nanjingnanzhan. The crowded area of outbound passenger flow is concentrated in the main urban area of Nanjing, first in the commercial center area with Xinjiekou as the main part, and secondly in the new urban area with Aotidong as the main part. This shows that although Nanjing has established some new commercial centers after many years of urban planning, it has not effectively replaced the old central area. Xinjiekou area is still the first choice for residents to leave the station at morning peak. The Aotiarea is close to Xinjiekou area, sharing part of the outbound passenger flow. In the new urban commercial and real estate planning, it is also necessary to disperse the working residents to new areas, so that the subway can play an effective role in dredging.
Figure 12 shows the inbound passenger flow distribution at 18:00 of evening peak. From the picture, we can see that the red station is Xinjiekou, and the yellow station is Daxinggong, Gulu, Zhujianglu, and Ruanjiandadao. Inbound passenger flow base is relatively smooth, but the Xinjiekou area is still relatively congested, which is also due to going off work of people working nearby. The Ruanjiandadao is another congested station. Ruanjiandadao is an important trunk road in the software valley of the Yuhuatai district of Nanjing. There are many software enterprises along the road, and there are many staff that leave work at 18:00.
Figure 13 shows the outbound passenger flow distribution at the 18:00 of evening peak. From the picture, we can see that the orange sites are Xinjiekou, Yuantong, Magaoqiao, and Liuzhoudonglu. The yellow stations are Maqun, Sanshanjiet, Shuanglongdadao, and Tianruncheng. As a commercial center, Xinjiekou has many people here for leisure and consumption at night, so the outbound passenger flow at night is also relatively large. Yuantong is an important transfer hub. Liuzhoudonglu is the first station for metro line 3 to cross the river. There are many buses transferring here. Sanshanjie, Maqun, Shuanglongdadao, and Tianruncheng are residential centers, which also bring a large number of outbound passengers.

6. Conclusions

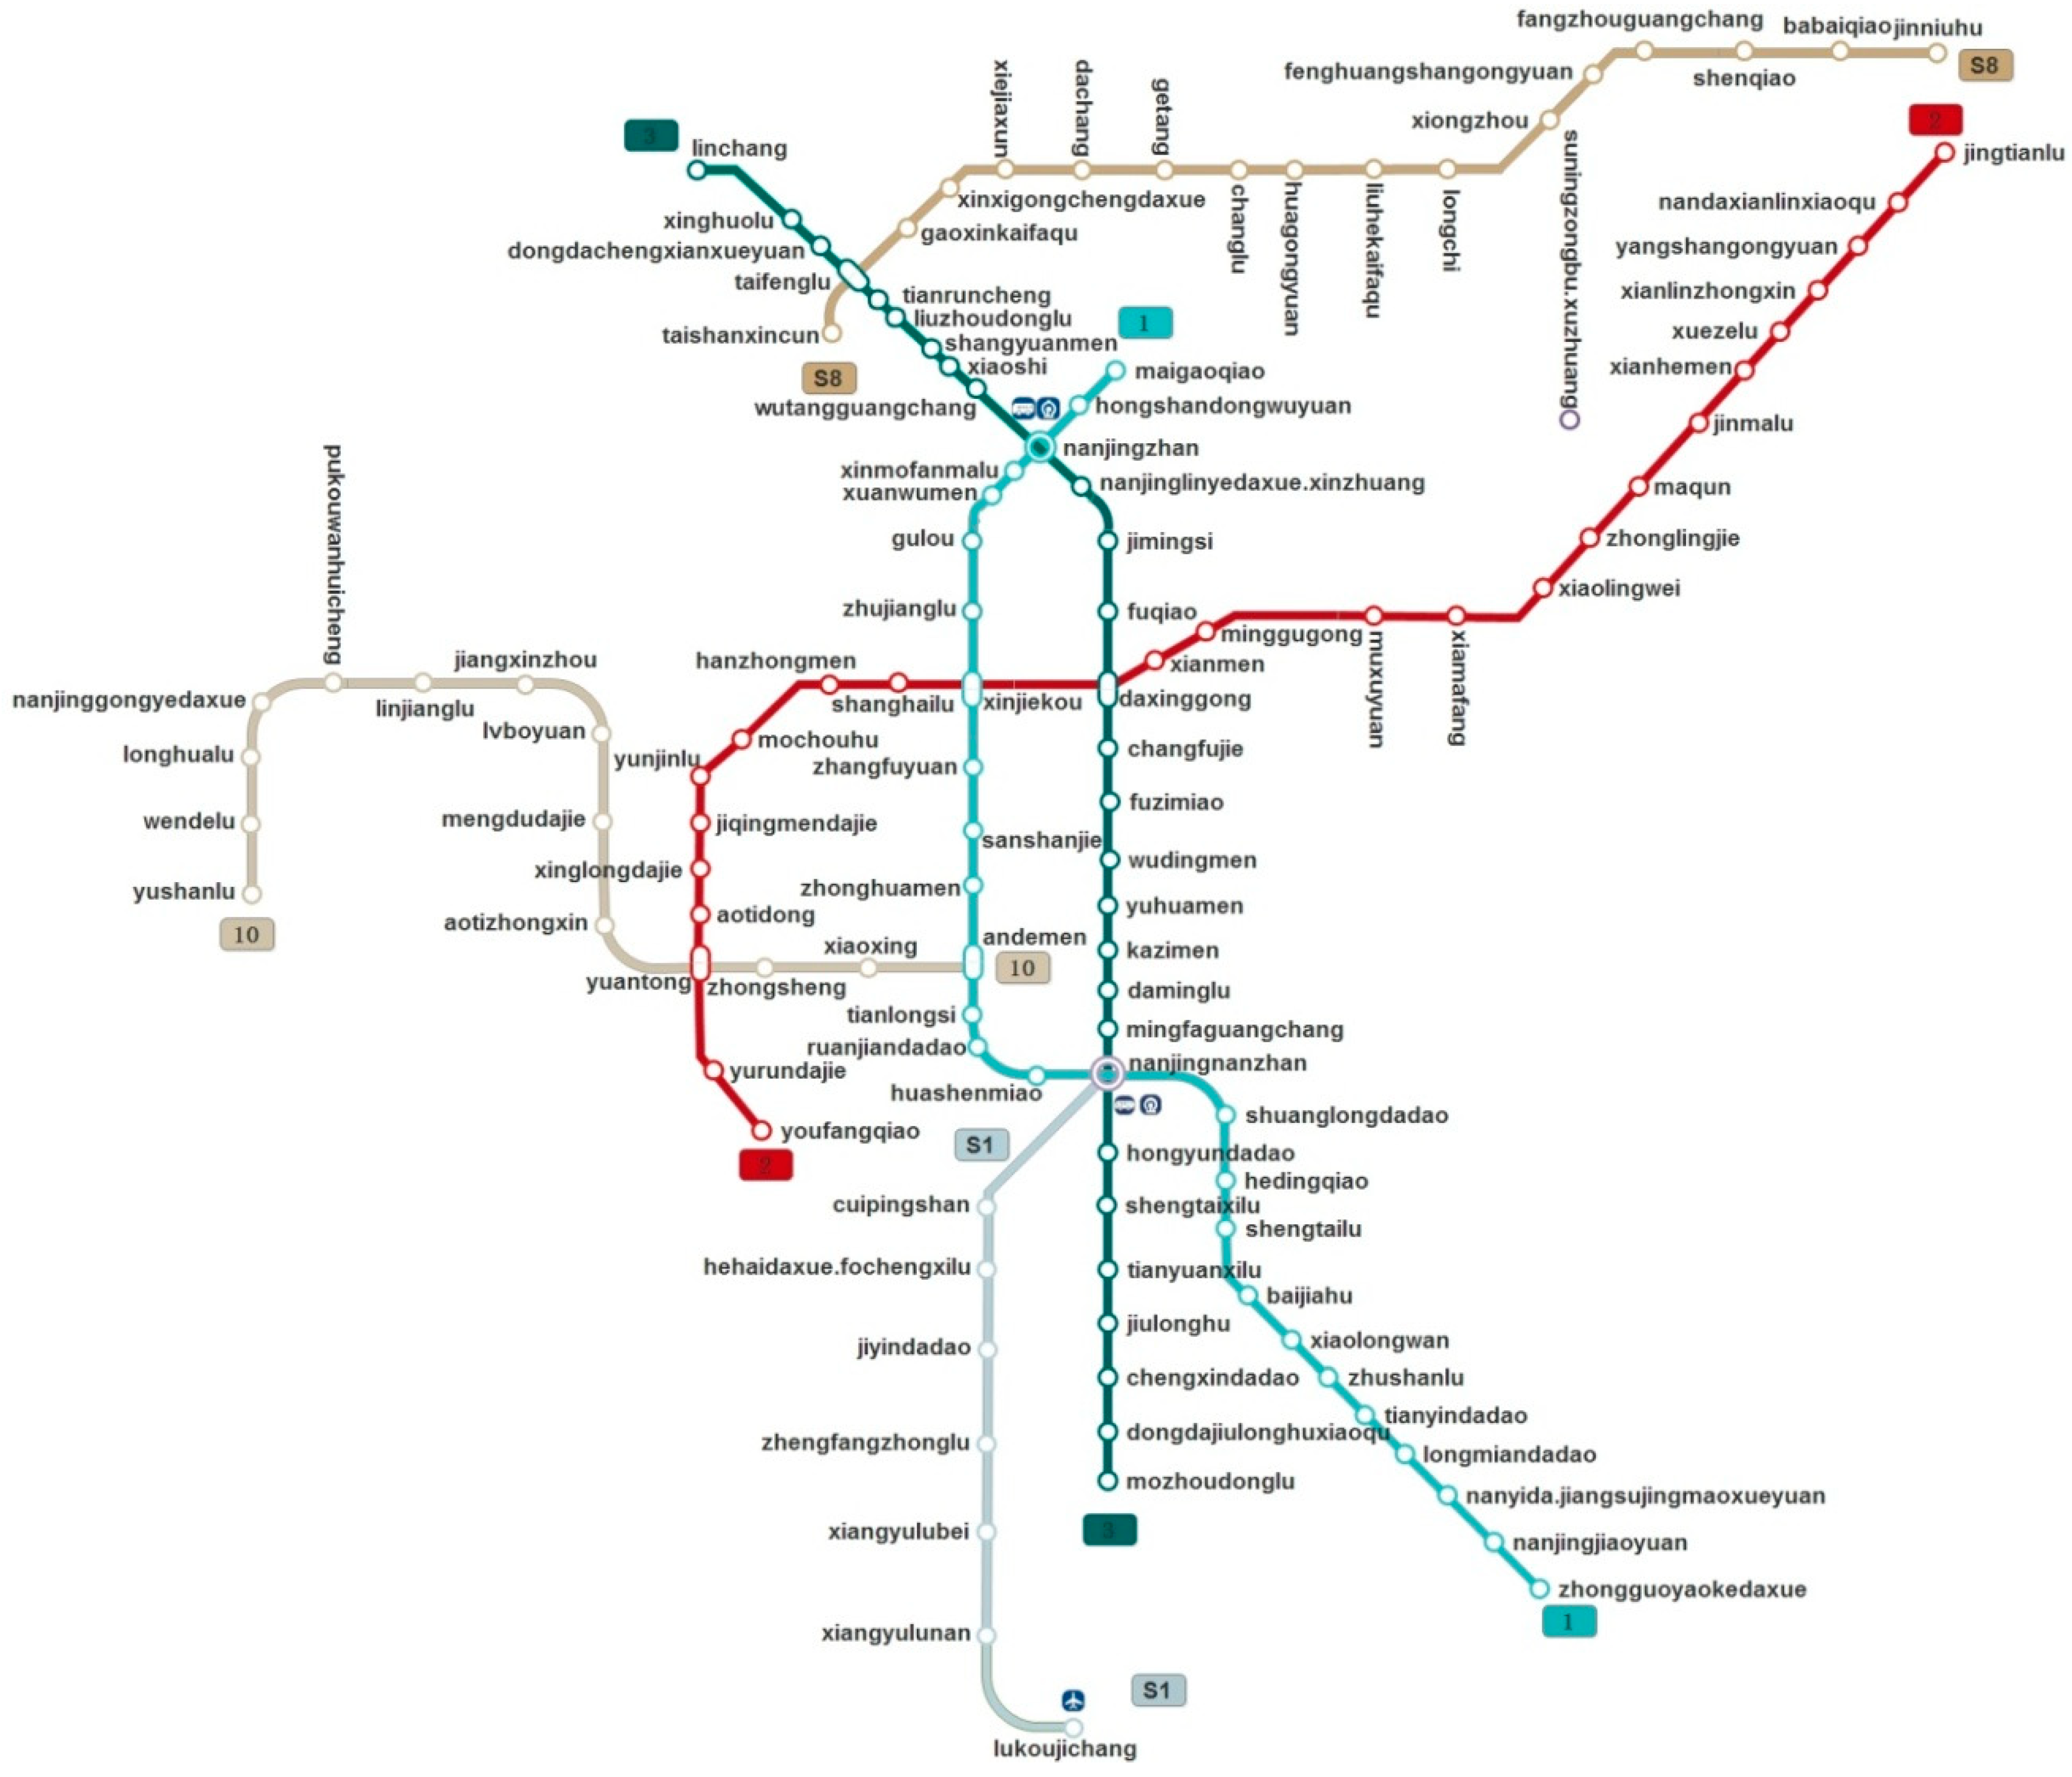
By 2016, Nanjing had opened six metro lines, namely trunk line 1, 2, 3, and extension line 10, S1, and S8. The rapid development of the metro system to a certain extent connects the main urban and suburban areas, alleviating the traffic pressure of the city, but still faces traffic management problems such as congestion. The automatic ticket-checking system of Nanjing metro records a large number of passengers’ information of swiping cards, more than one million cards per day. These large metro data provide the original basis for analyzing space–time characteristics of residents’ travel. In addition, various images were selected to visualize the subway passenger flow.
In this study, the smart card swiping records during five working days with normal weather were selected for statistical analysis of passenger flow. The daily card swiping data were counted to 24 h, from 0:00 to 23:00. Passenger flow from Monday to Friday increased from 1.20 million to 1.32 million. The five-day inbound curve is basically coincidental with the five-day outbound curve. The inbound and outbound curves also have a certain reflection relationship.
Passenger flow during morning and evening peak periods can effectively reflect the degree of urban traffic congestion. The peak hour coefficient of daily average passenger flow is used to reflect the crowding degree of passenger flow at the time point. During the morning peak, the number of arrivals and departures concentrated at 7:00 and 8:00, while the number of departures concentrated at 8:00. During the evening peak period, the number of arrivals reached the highest at 17:00 and the number of departures reached the highest at 18:00.
During the morning peak period, the peak values of inbound and outbound waves of line 1 and line 2 are concentrated at 8:00, while those of other lines are concentrated at 7:00. This shows that people entering the main line 1 and 2 have more rest time. During the evening peak, all the inbound and outbound peaks are concentrated at 17:00. The passenger flow intensity of metro reflects the passenger flow per unit length of metro. For the inbound passenger flow, line 1 and line 2 have the strongest passenger flow, higher operational efficiency, and play the role of the main lines. The passenger flow intensity of line 3 is slightly higher than that of other branch lines.
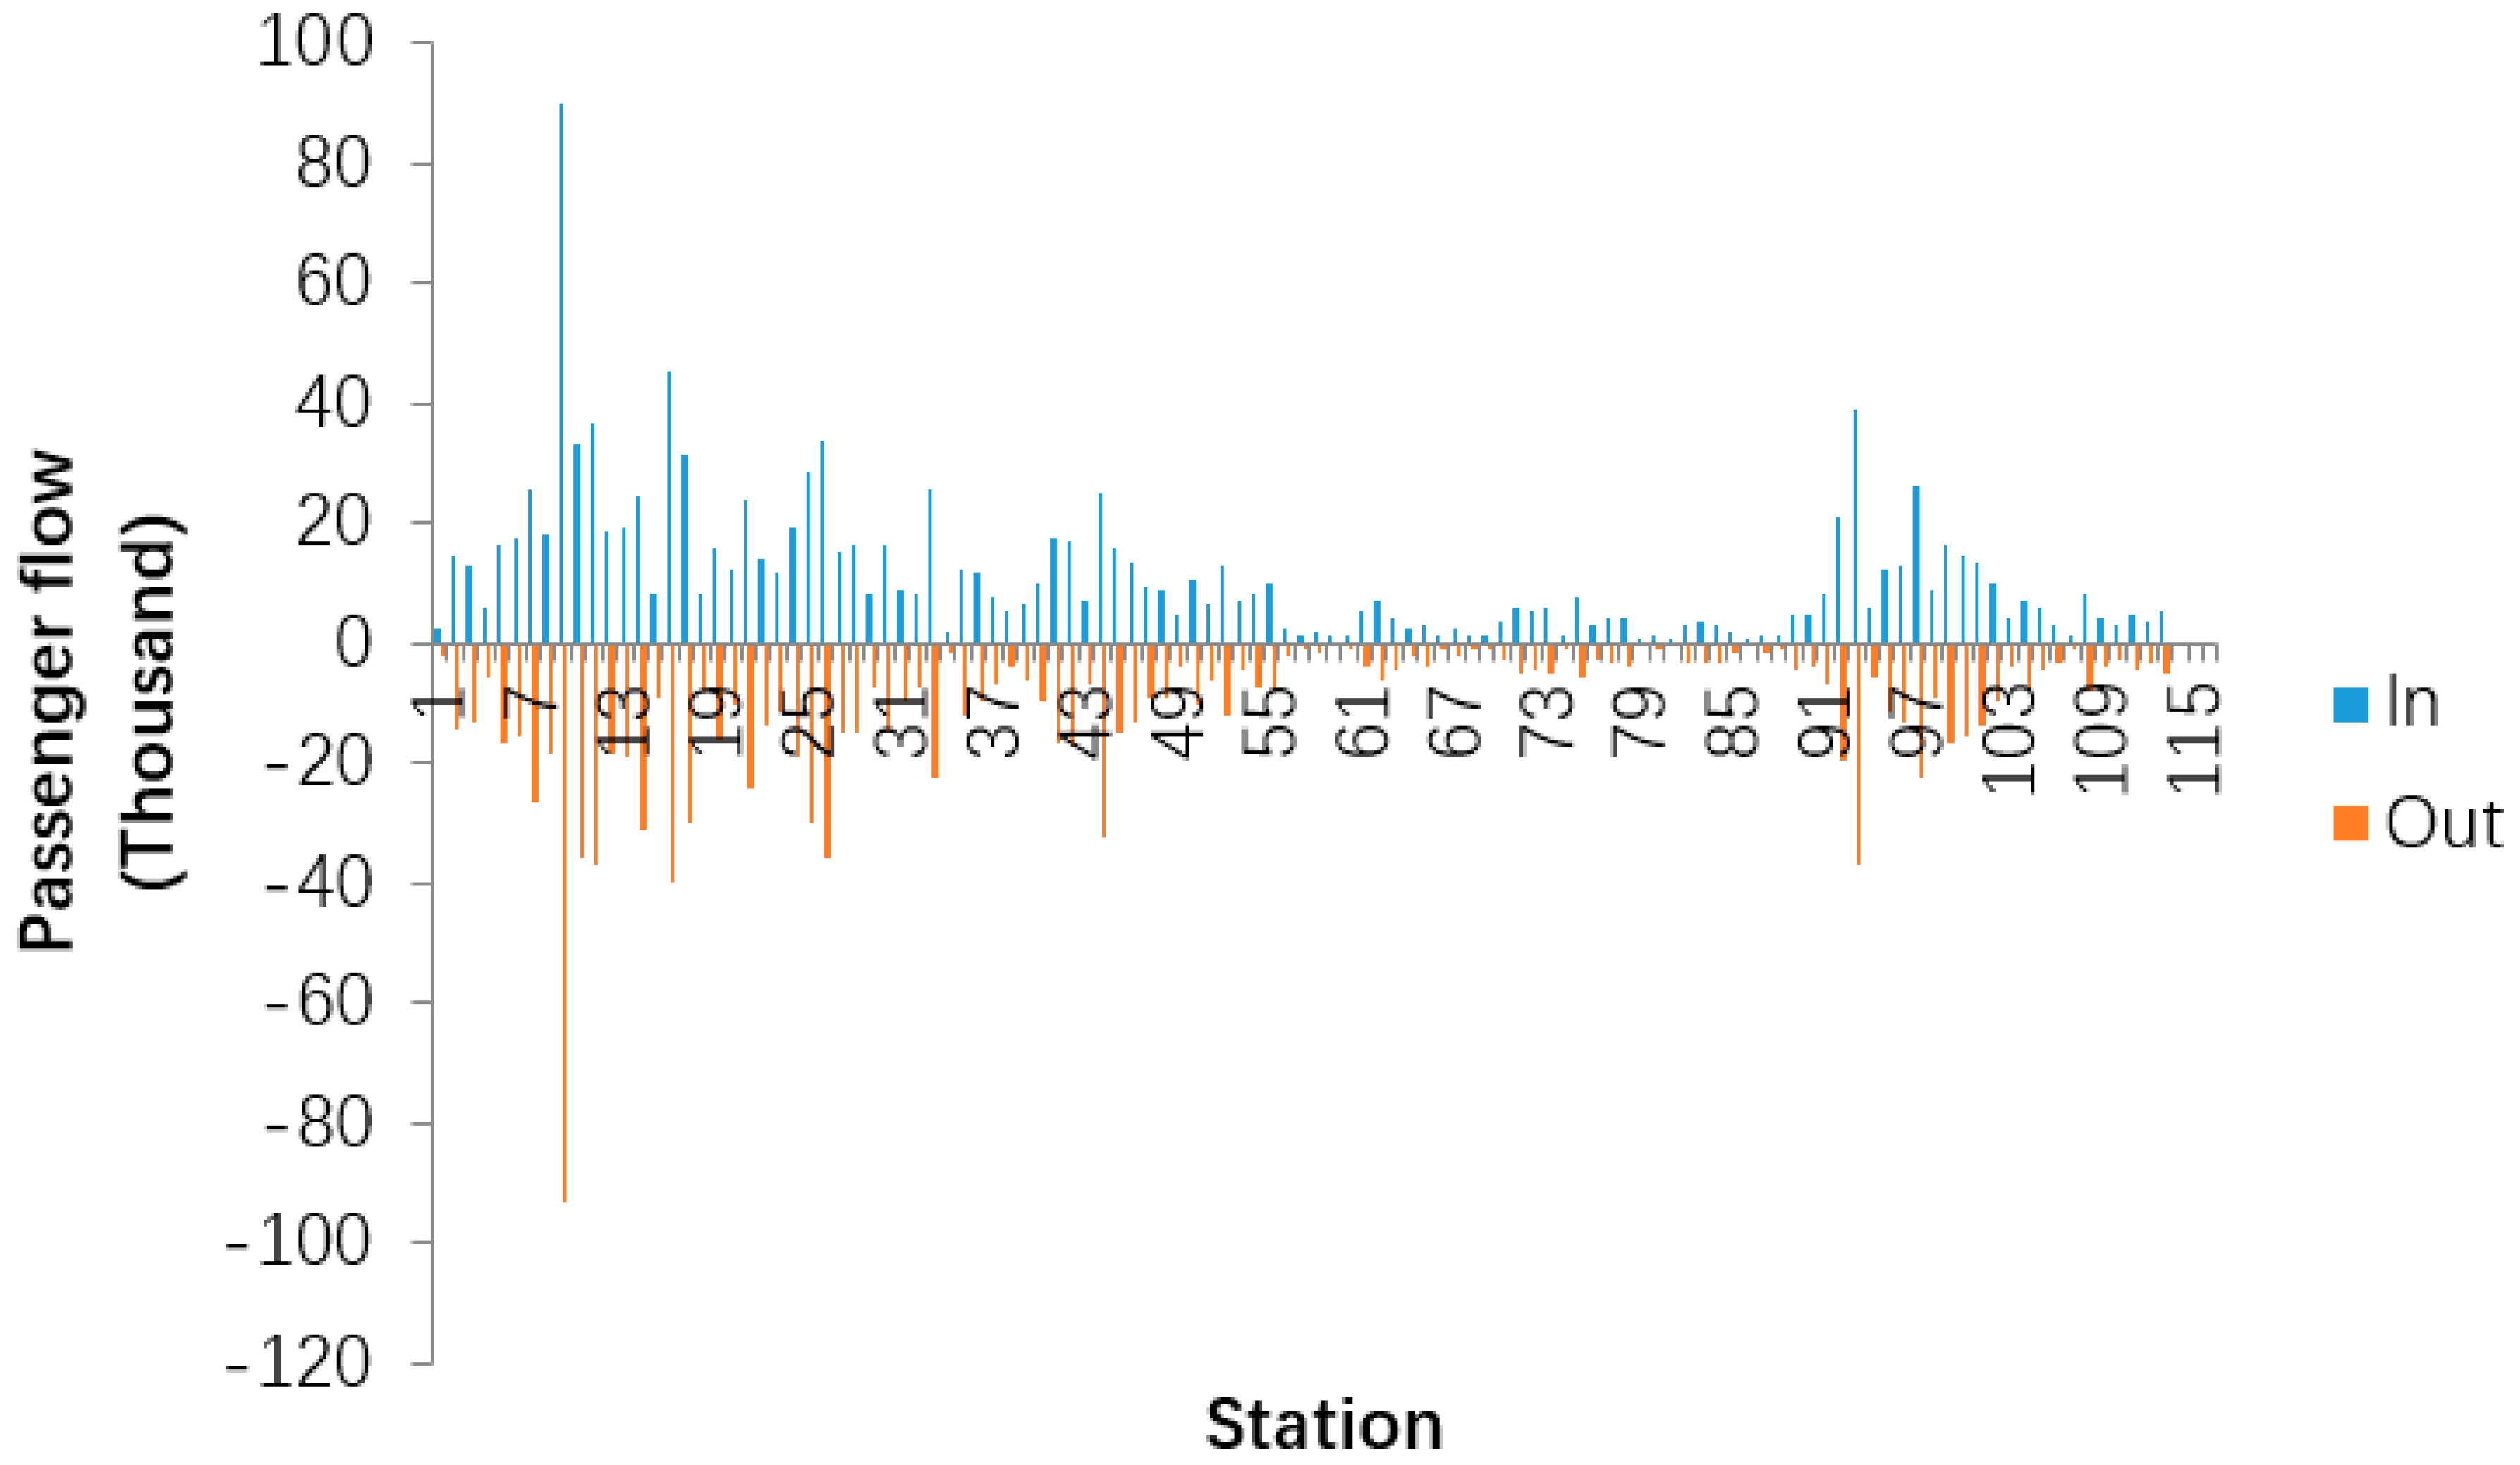
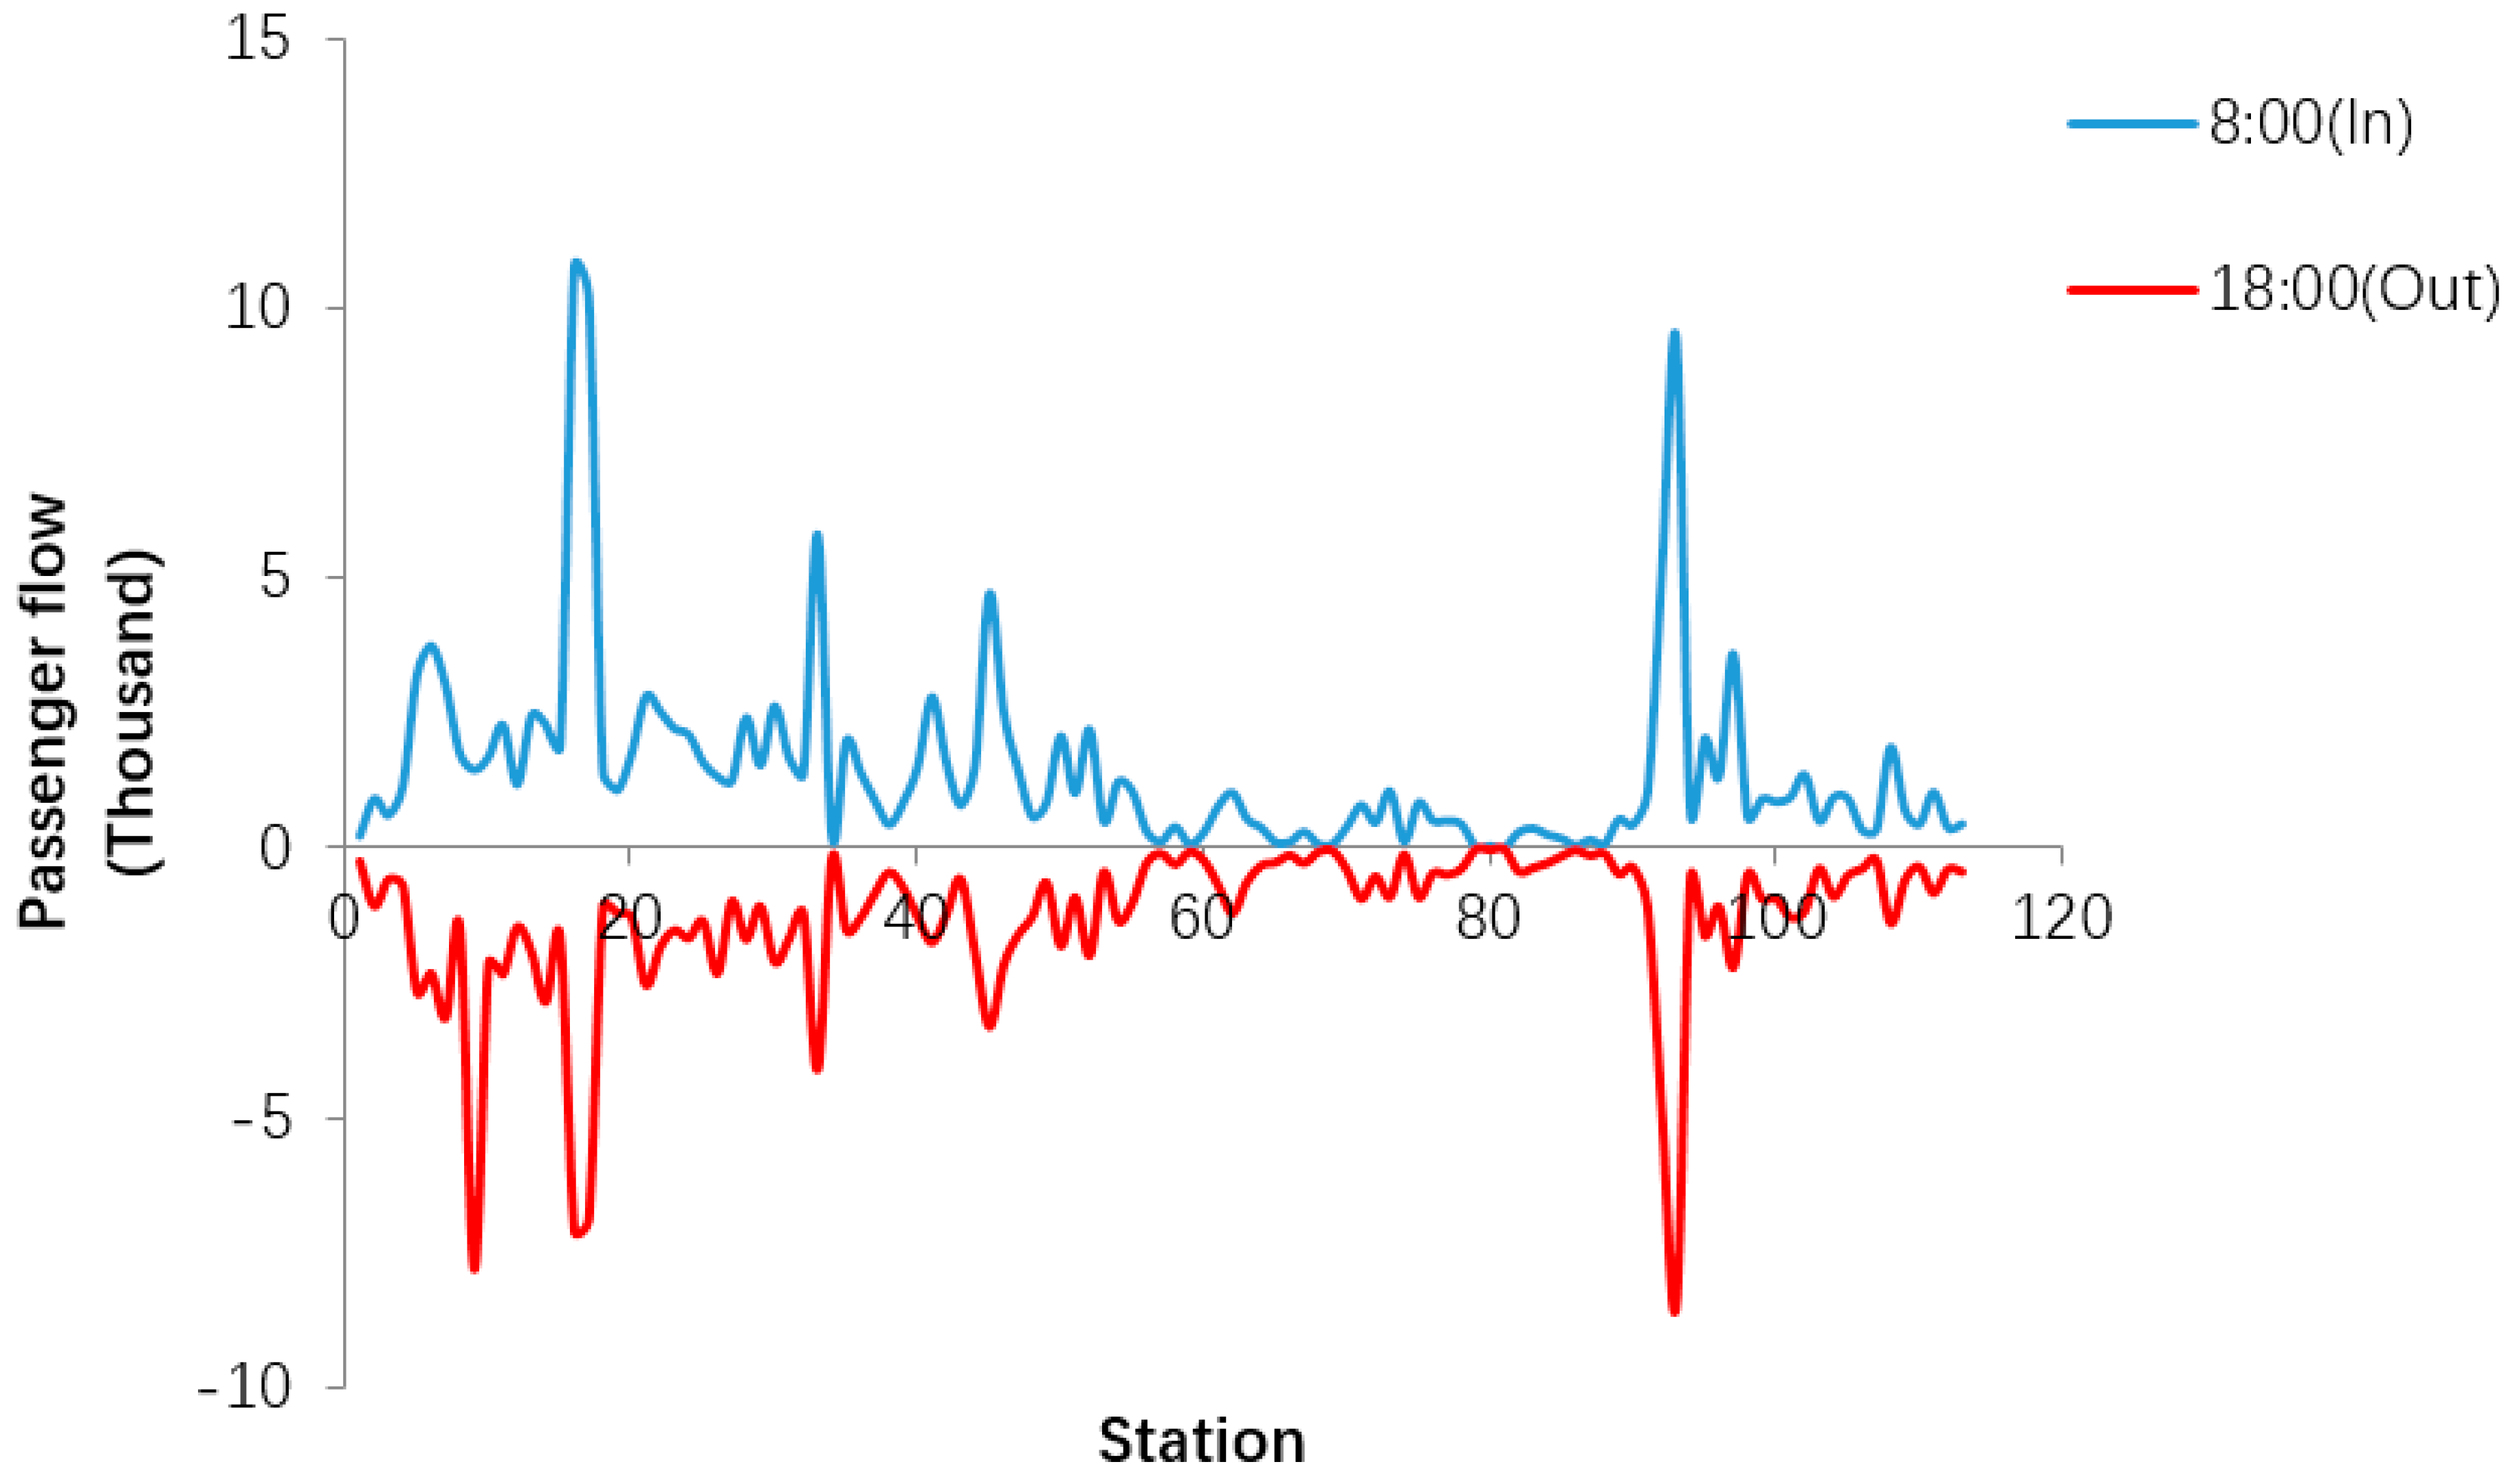
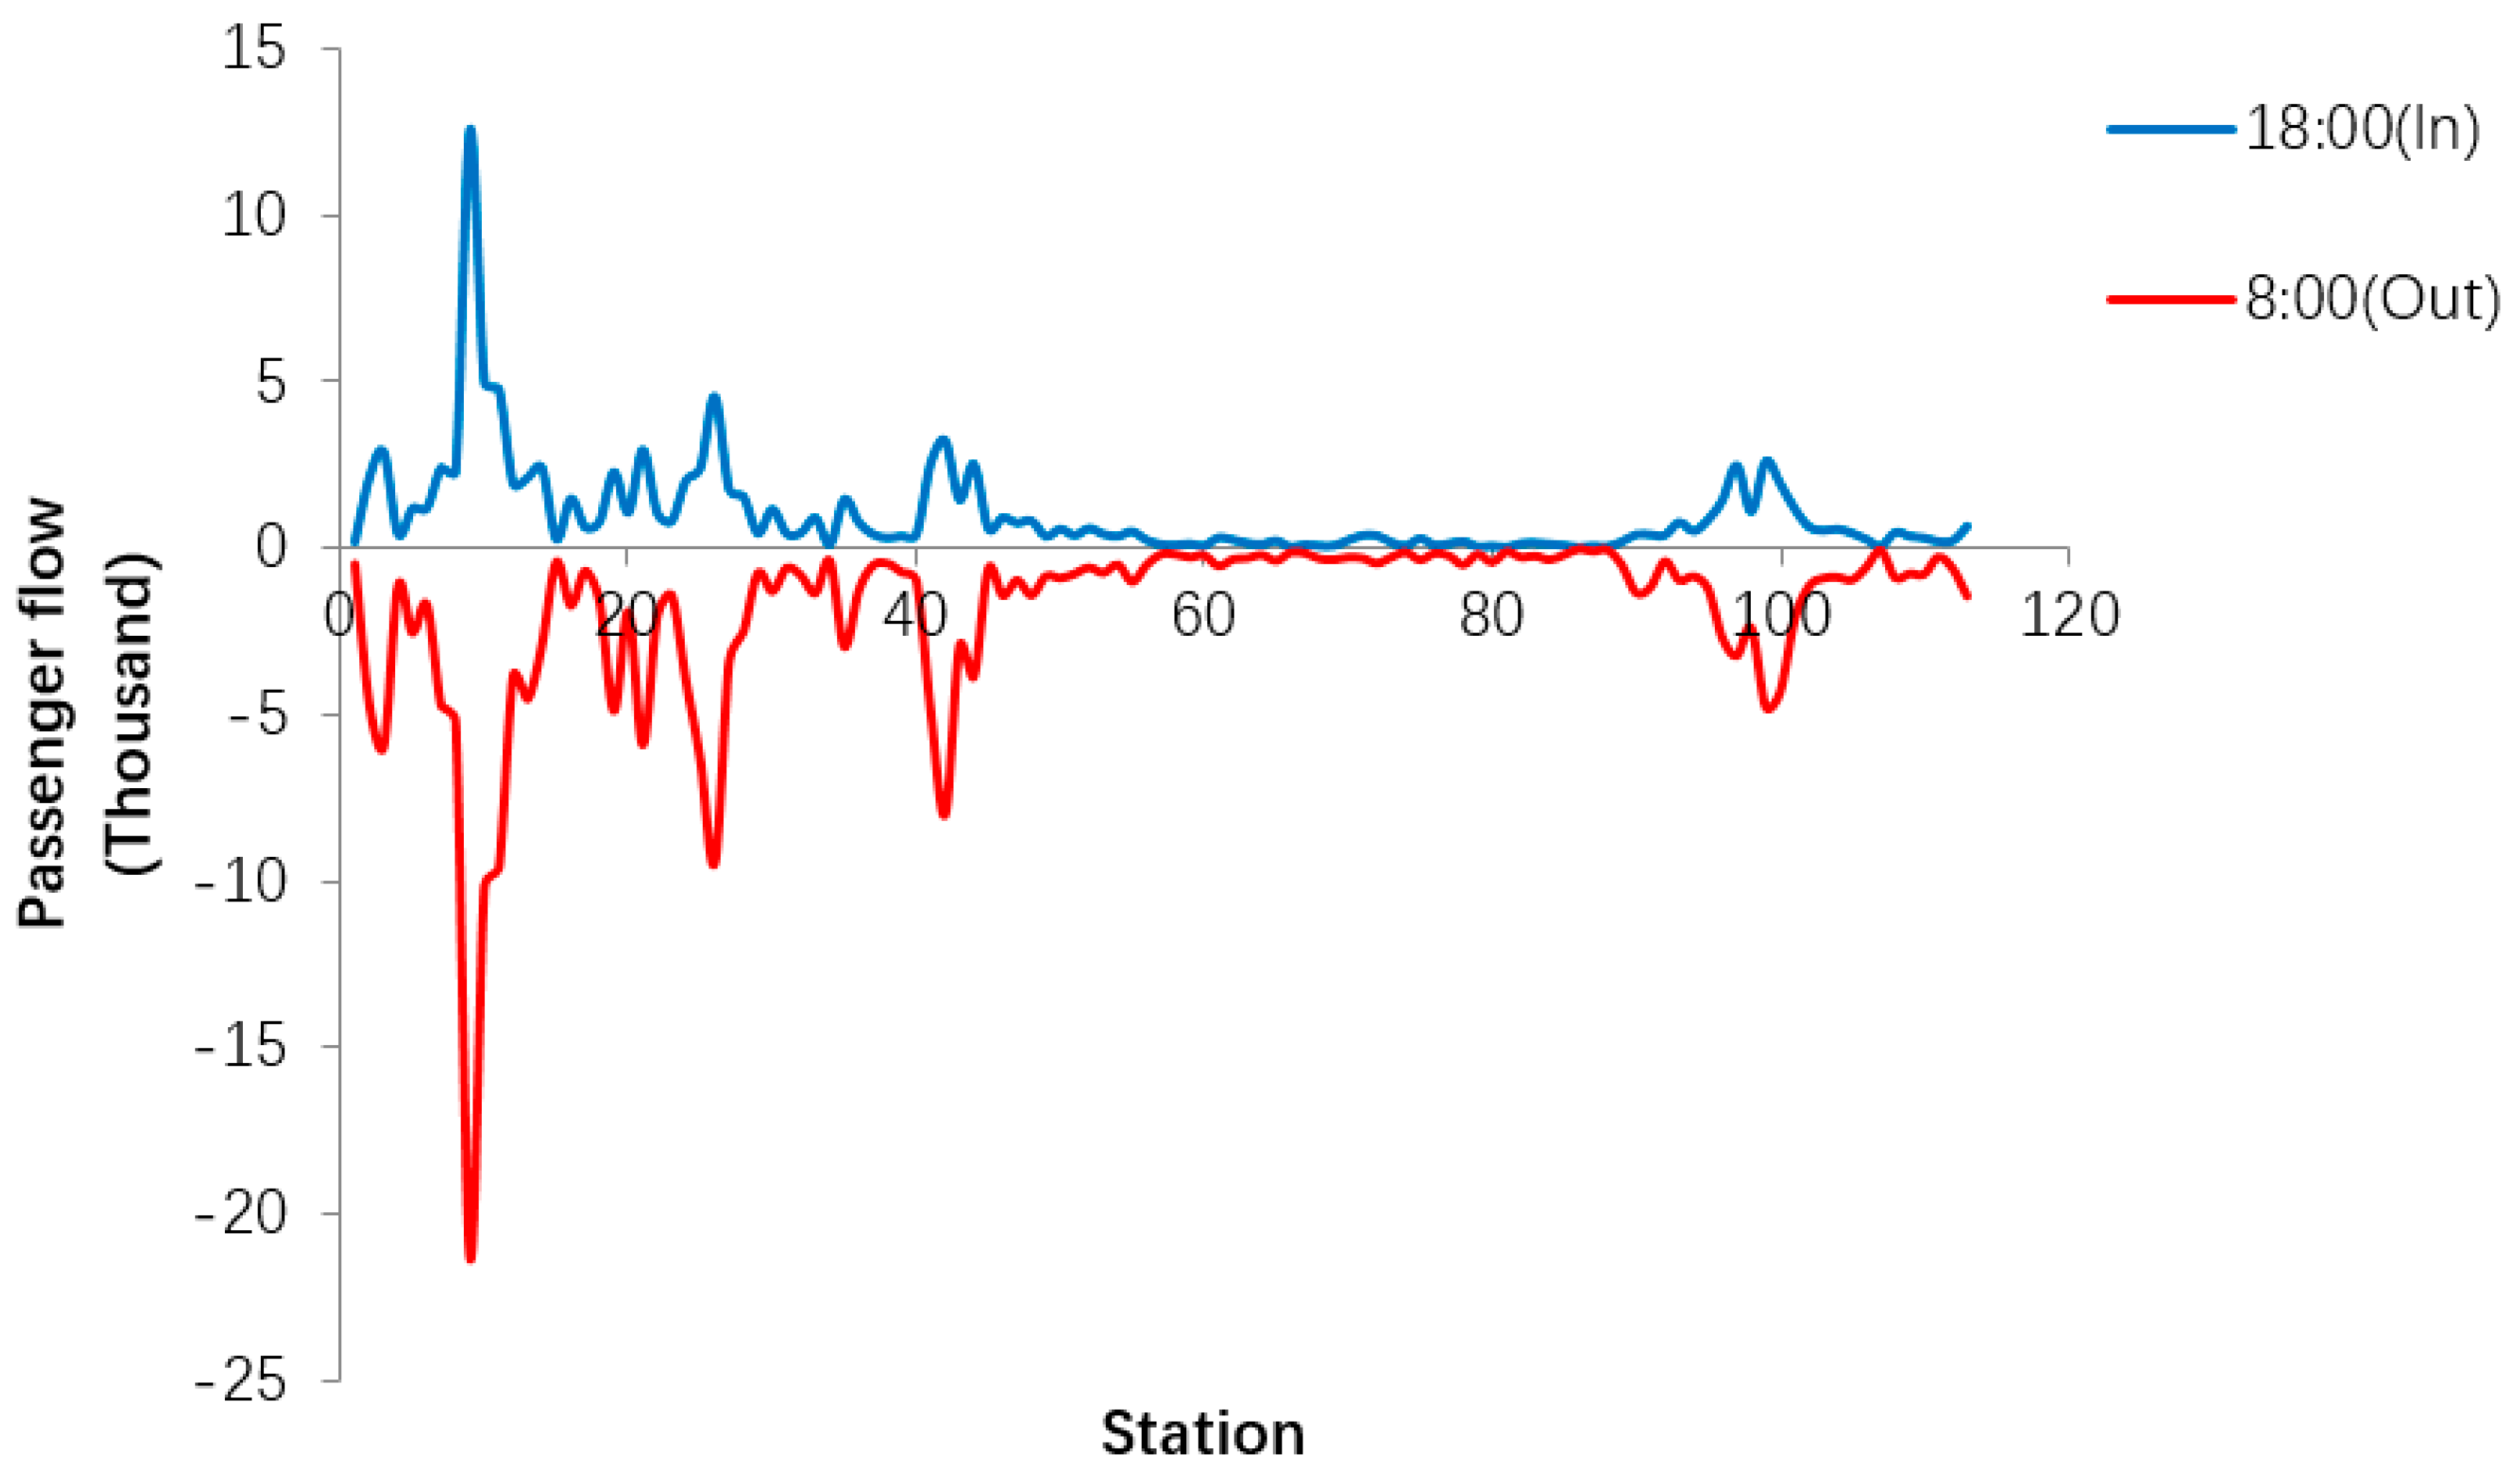
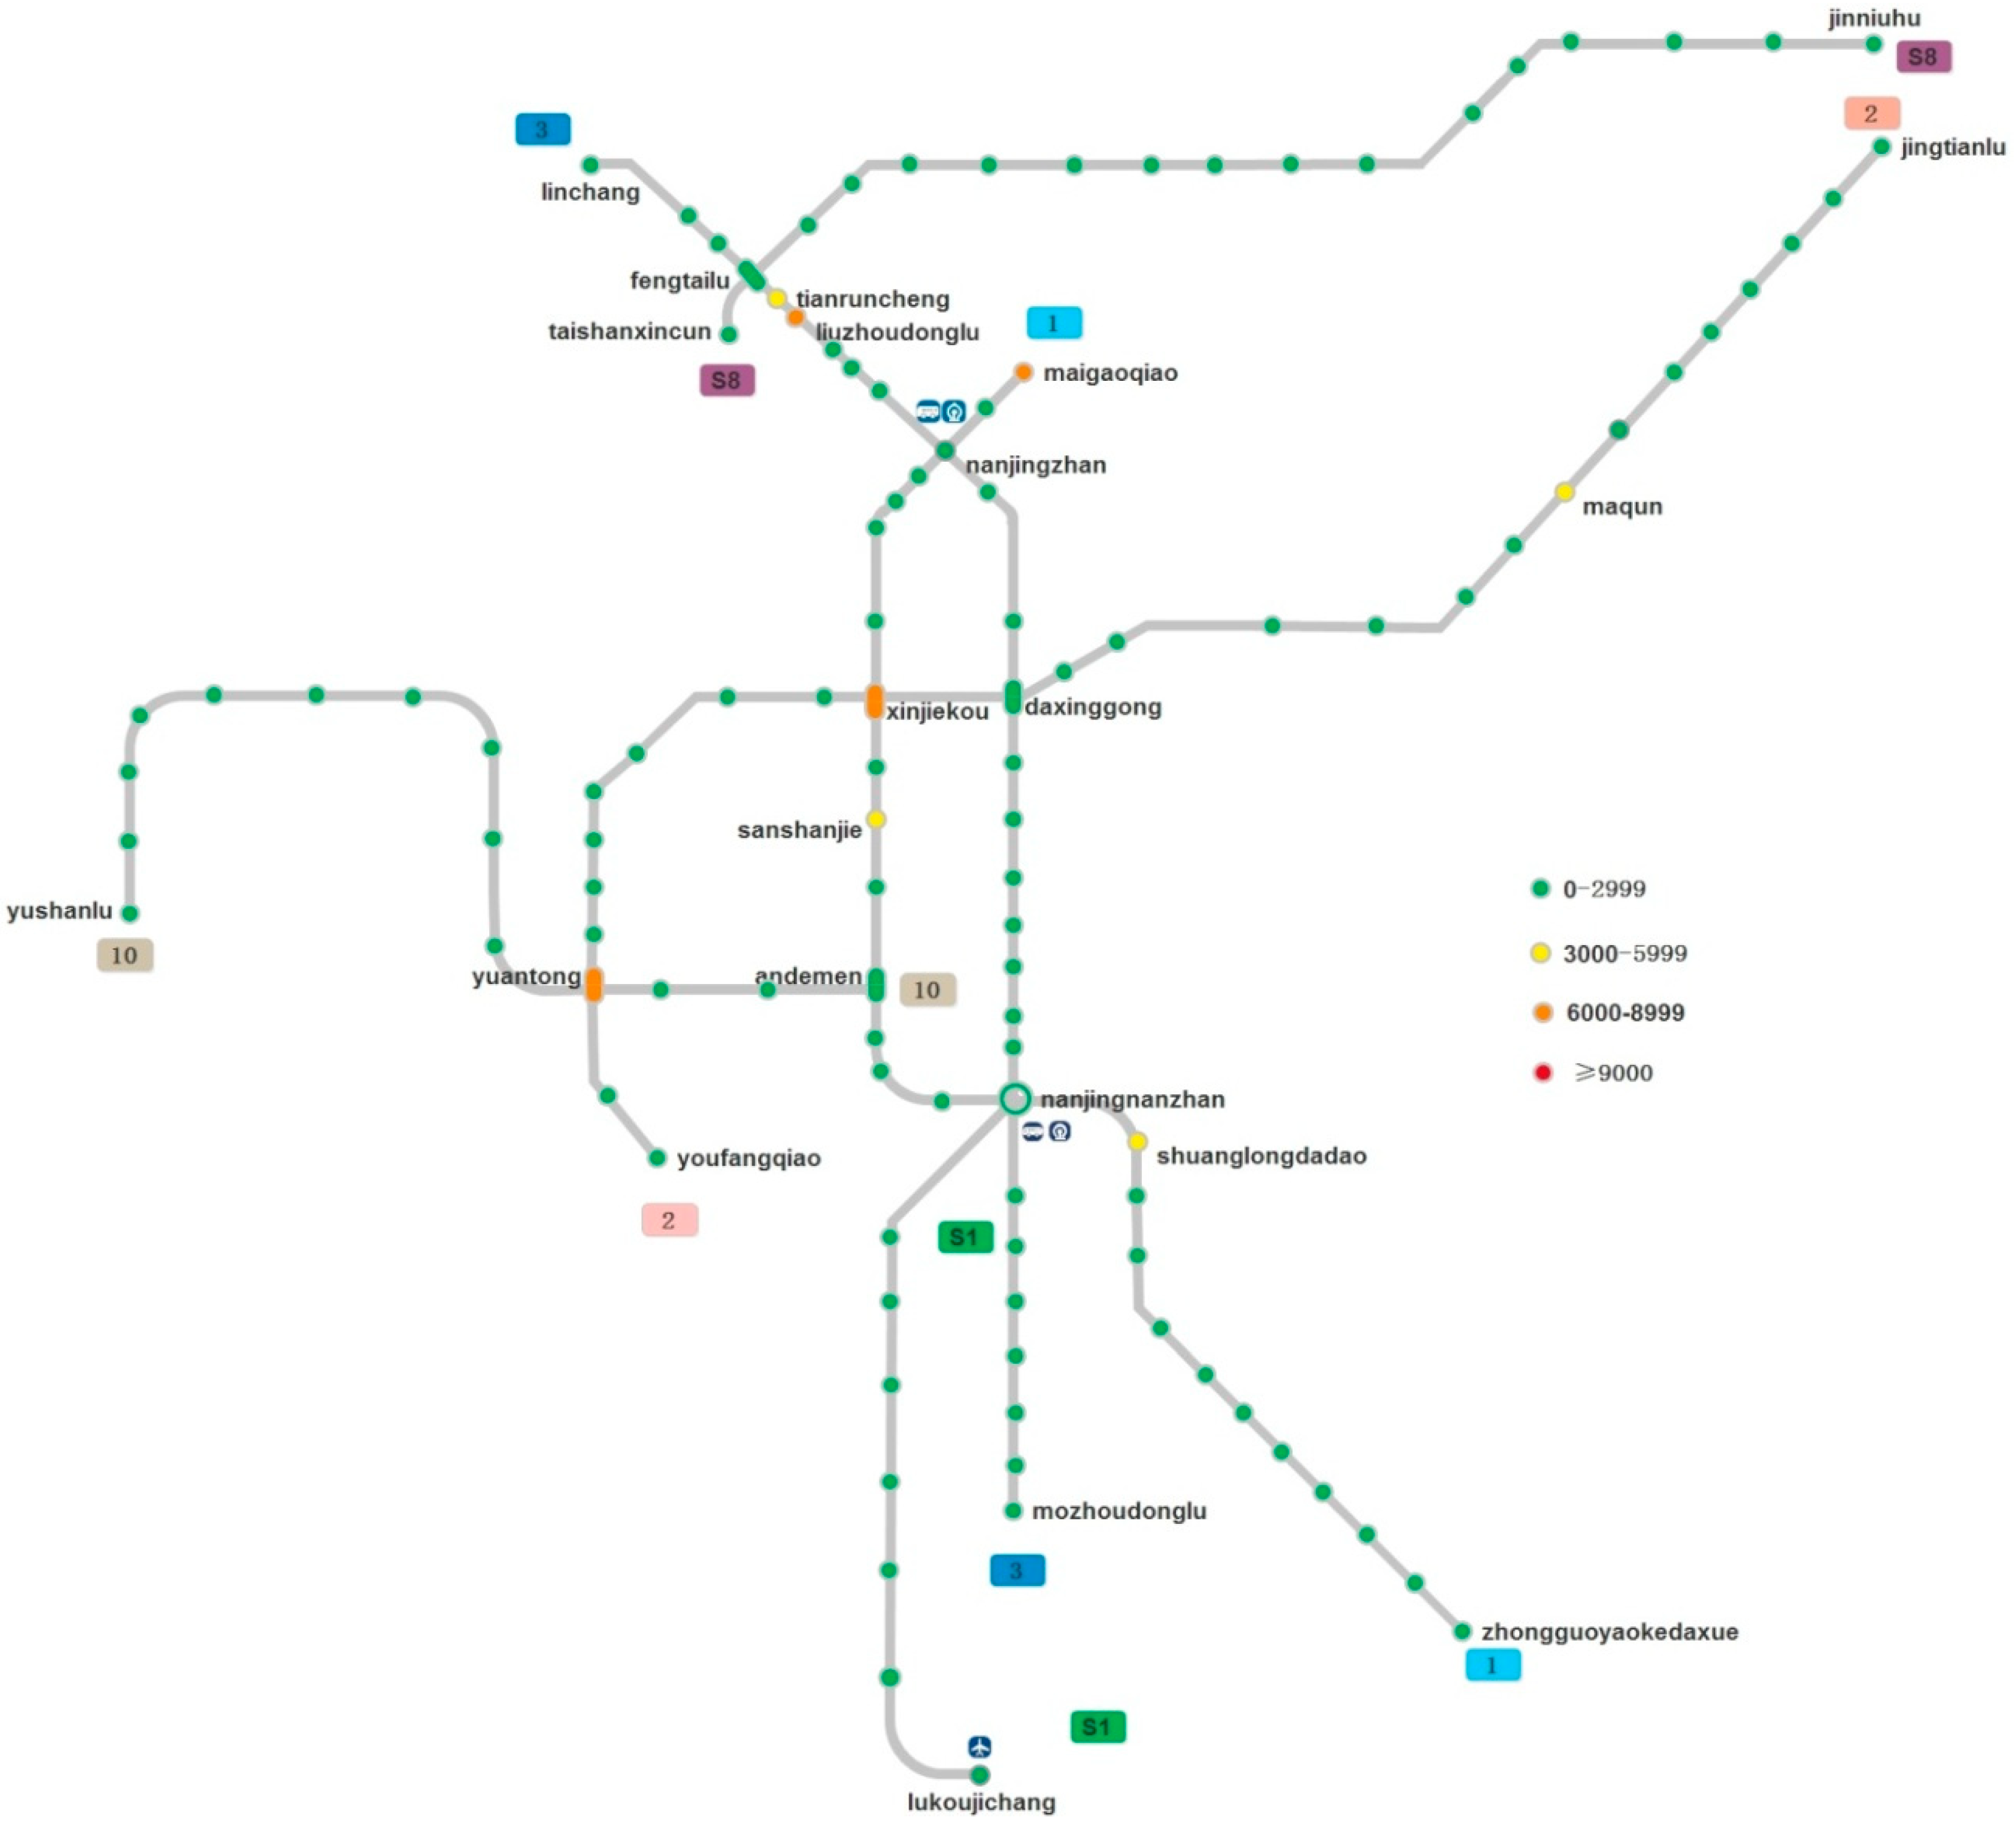
There is a certain mapping relationship between the inbound and outbound passenger flow of 113 metro stations, and the basic graphics are consistent. Passenger flow at Xinjiekou is obviously larger than that at other stations. Passenger flow at many remote stations is very small. The figure shapes of inbound passenger flow at 8:00 and outbound passenger flow at 18:00 in the subway station are very similar, just like inbound passenger flow at 8:00 and outbound passenger flow at 18:00.
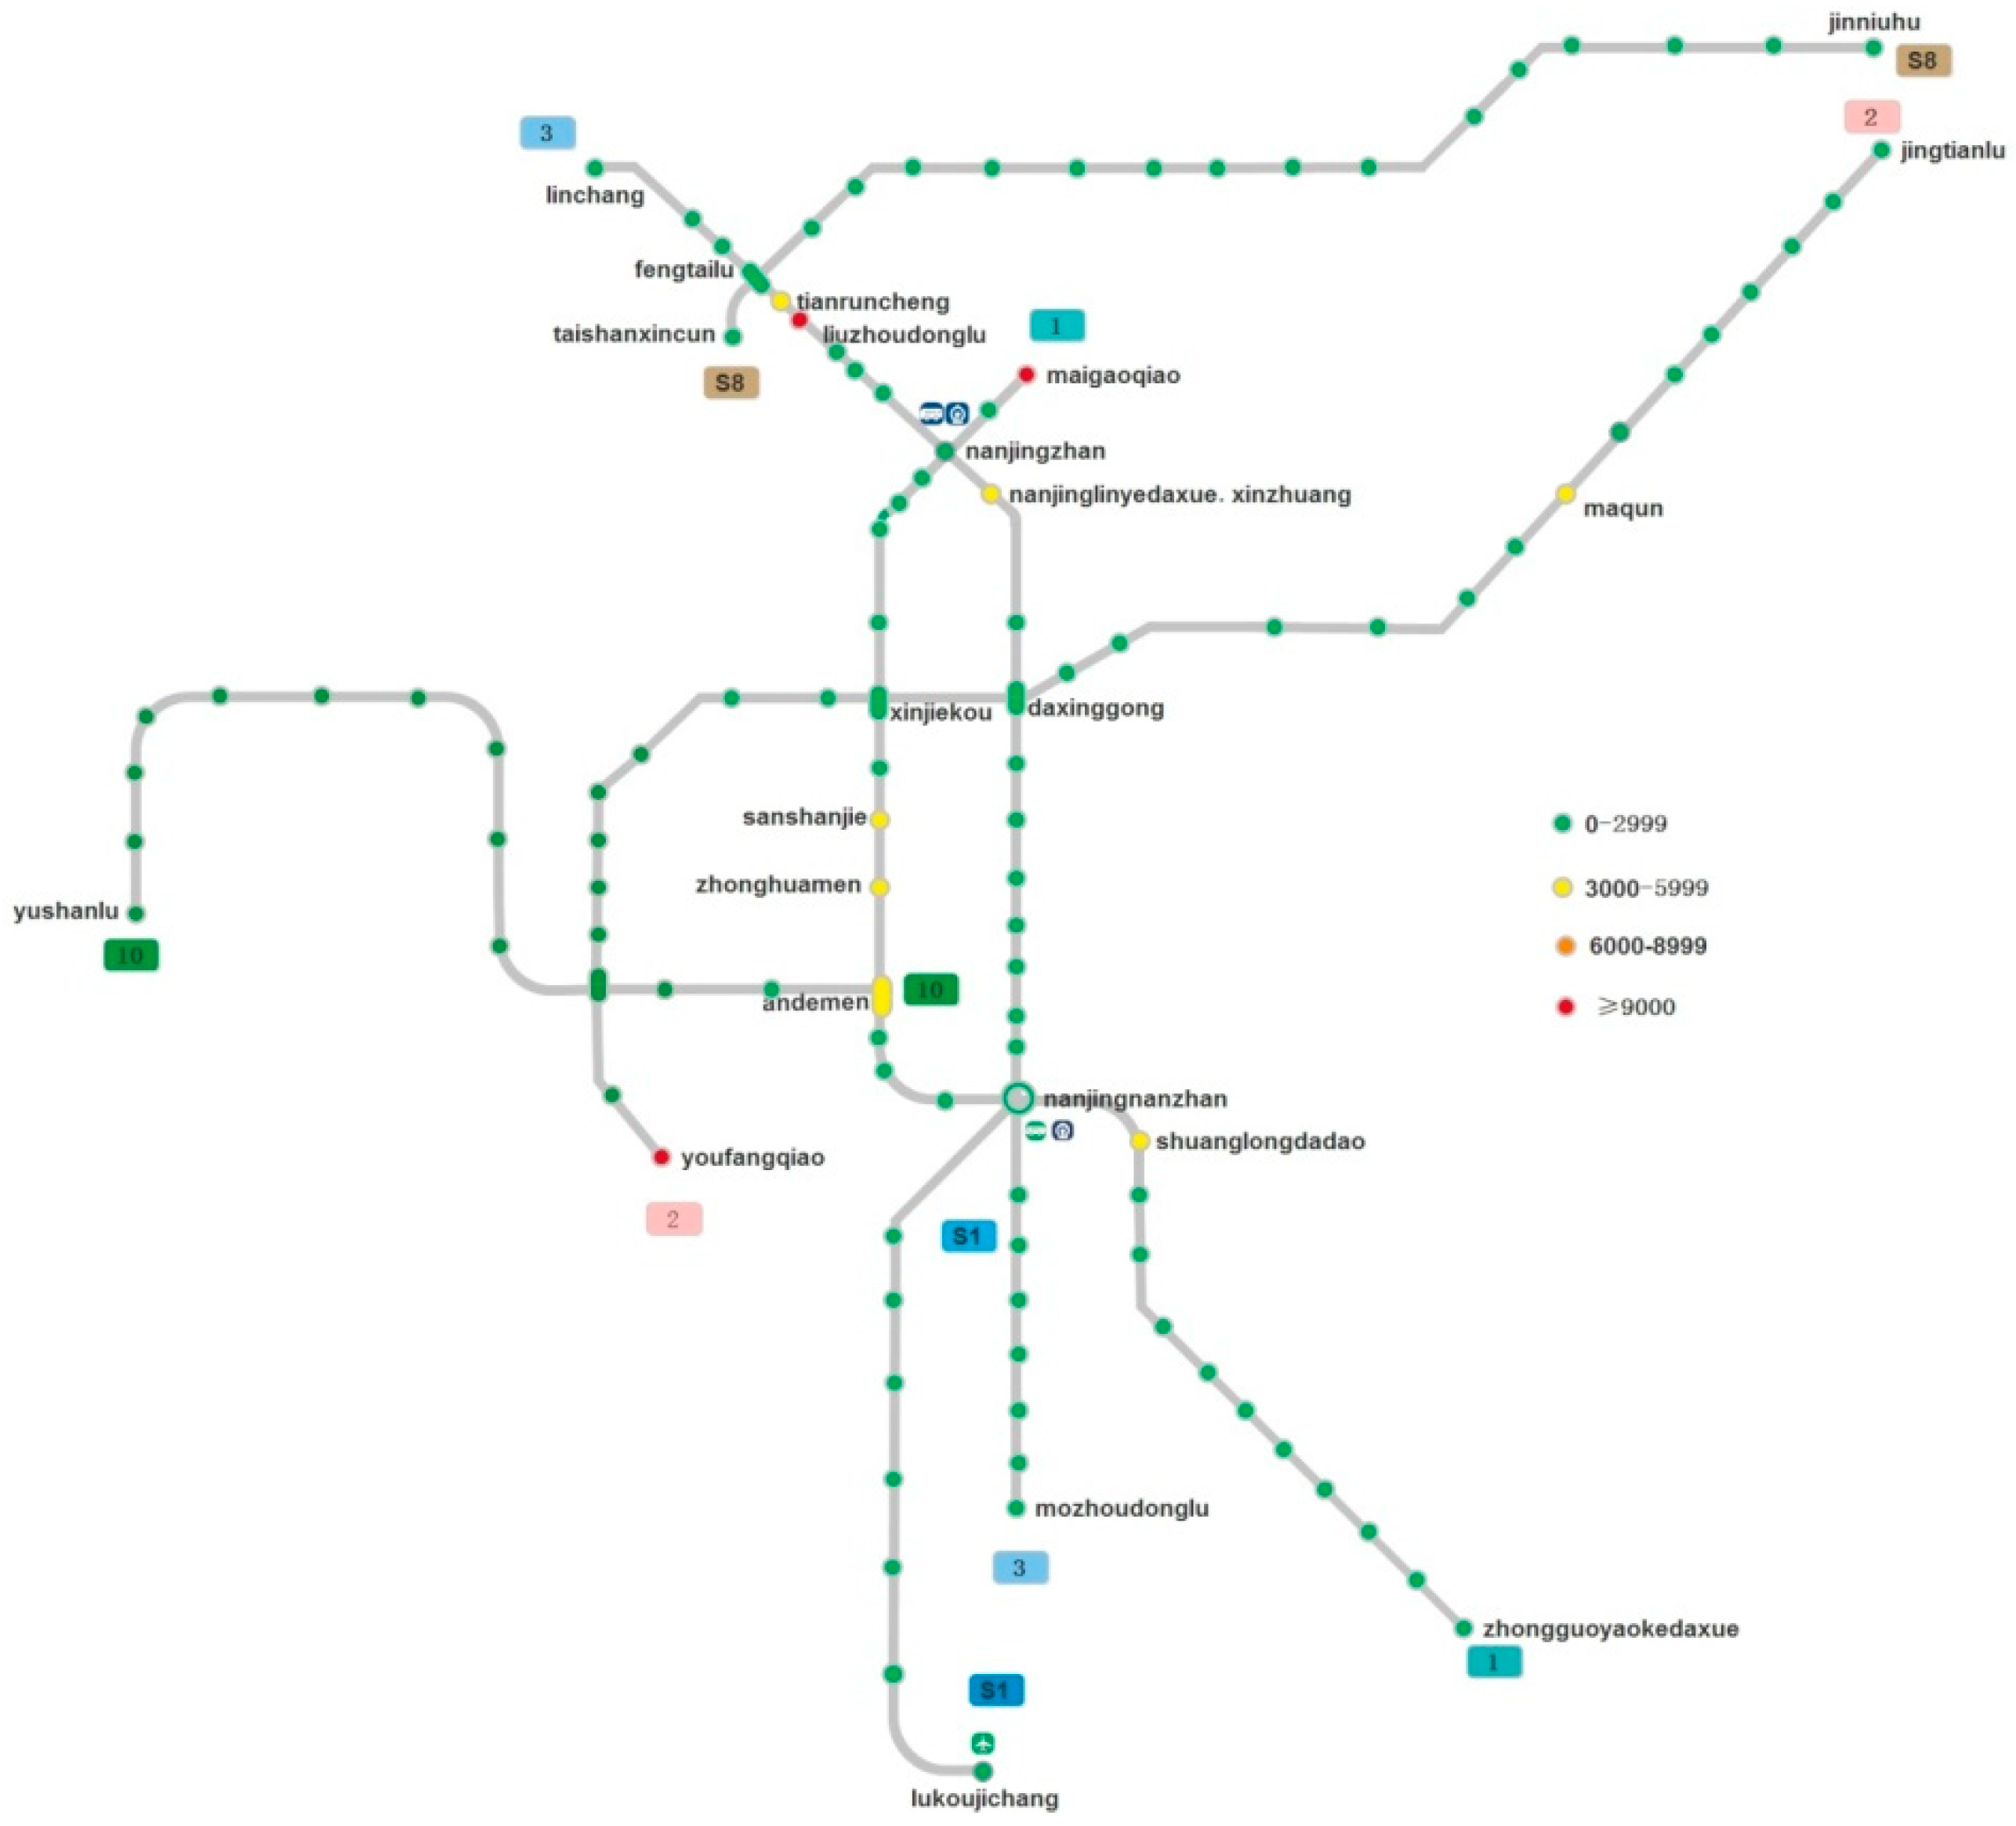
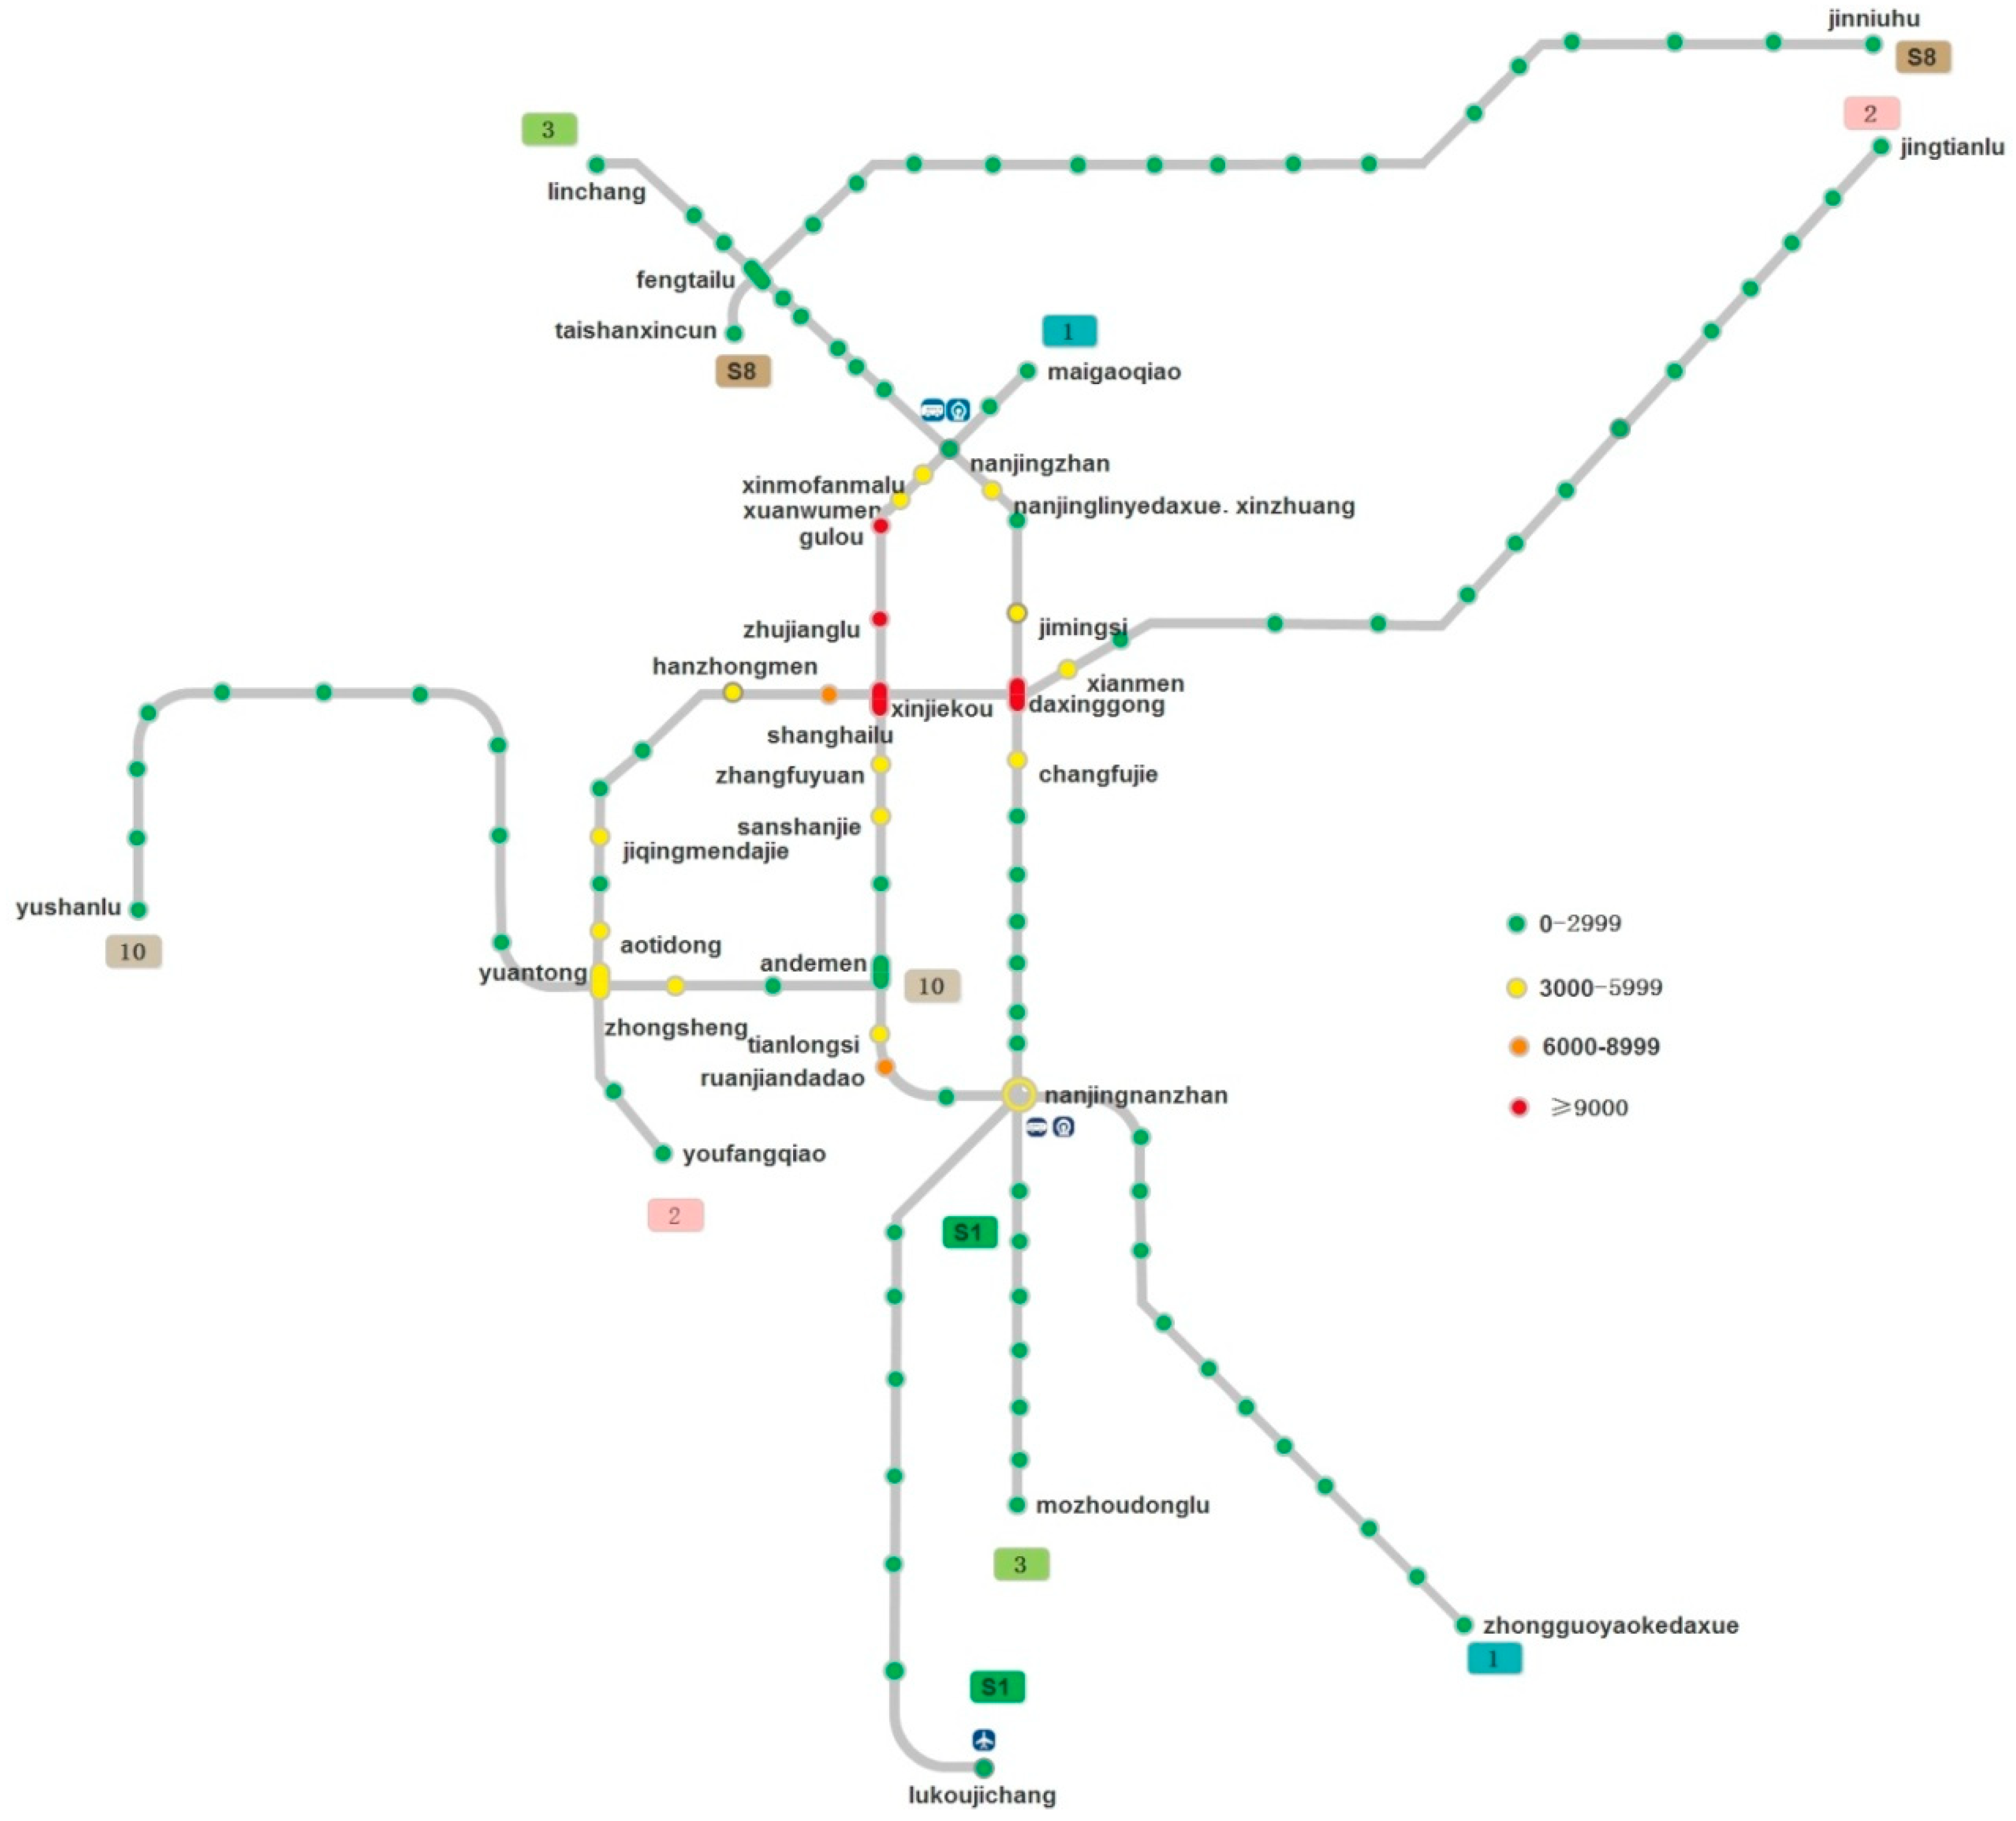
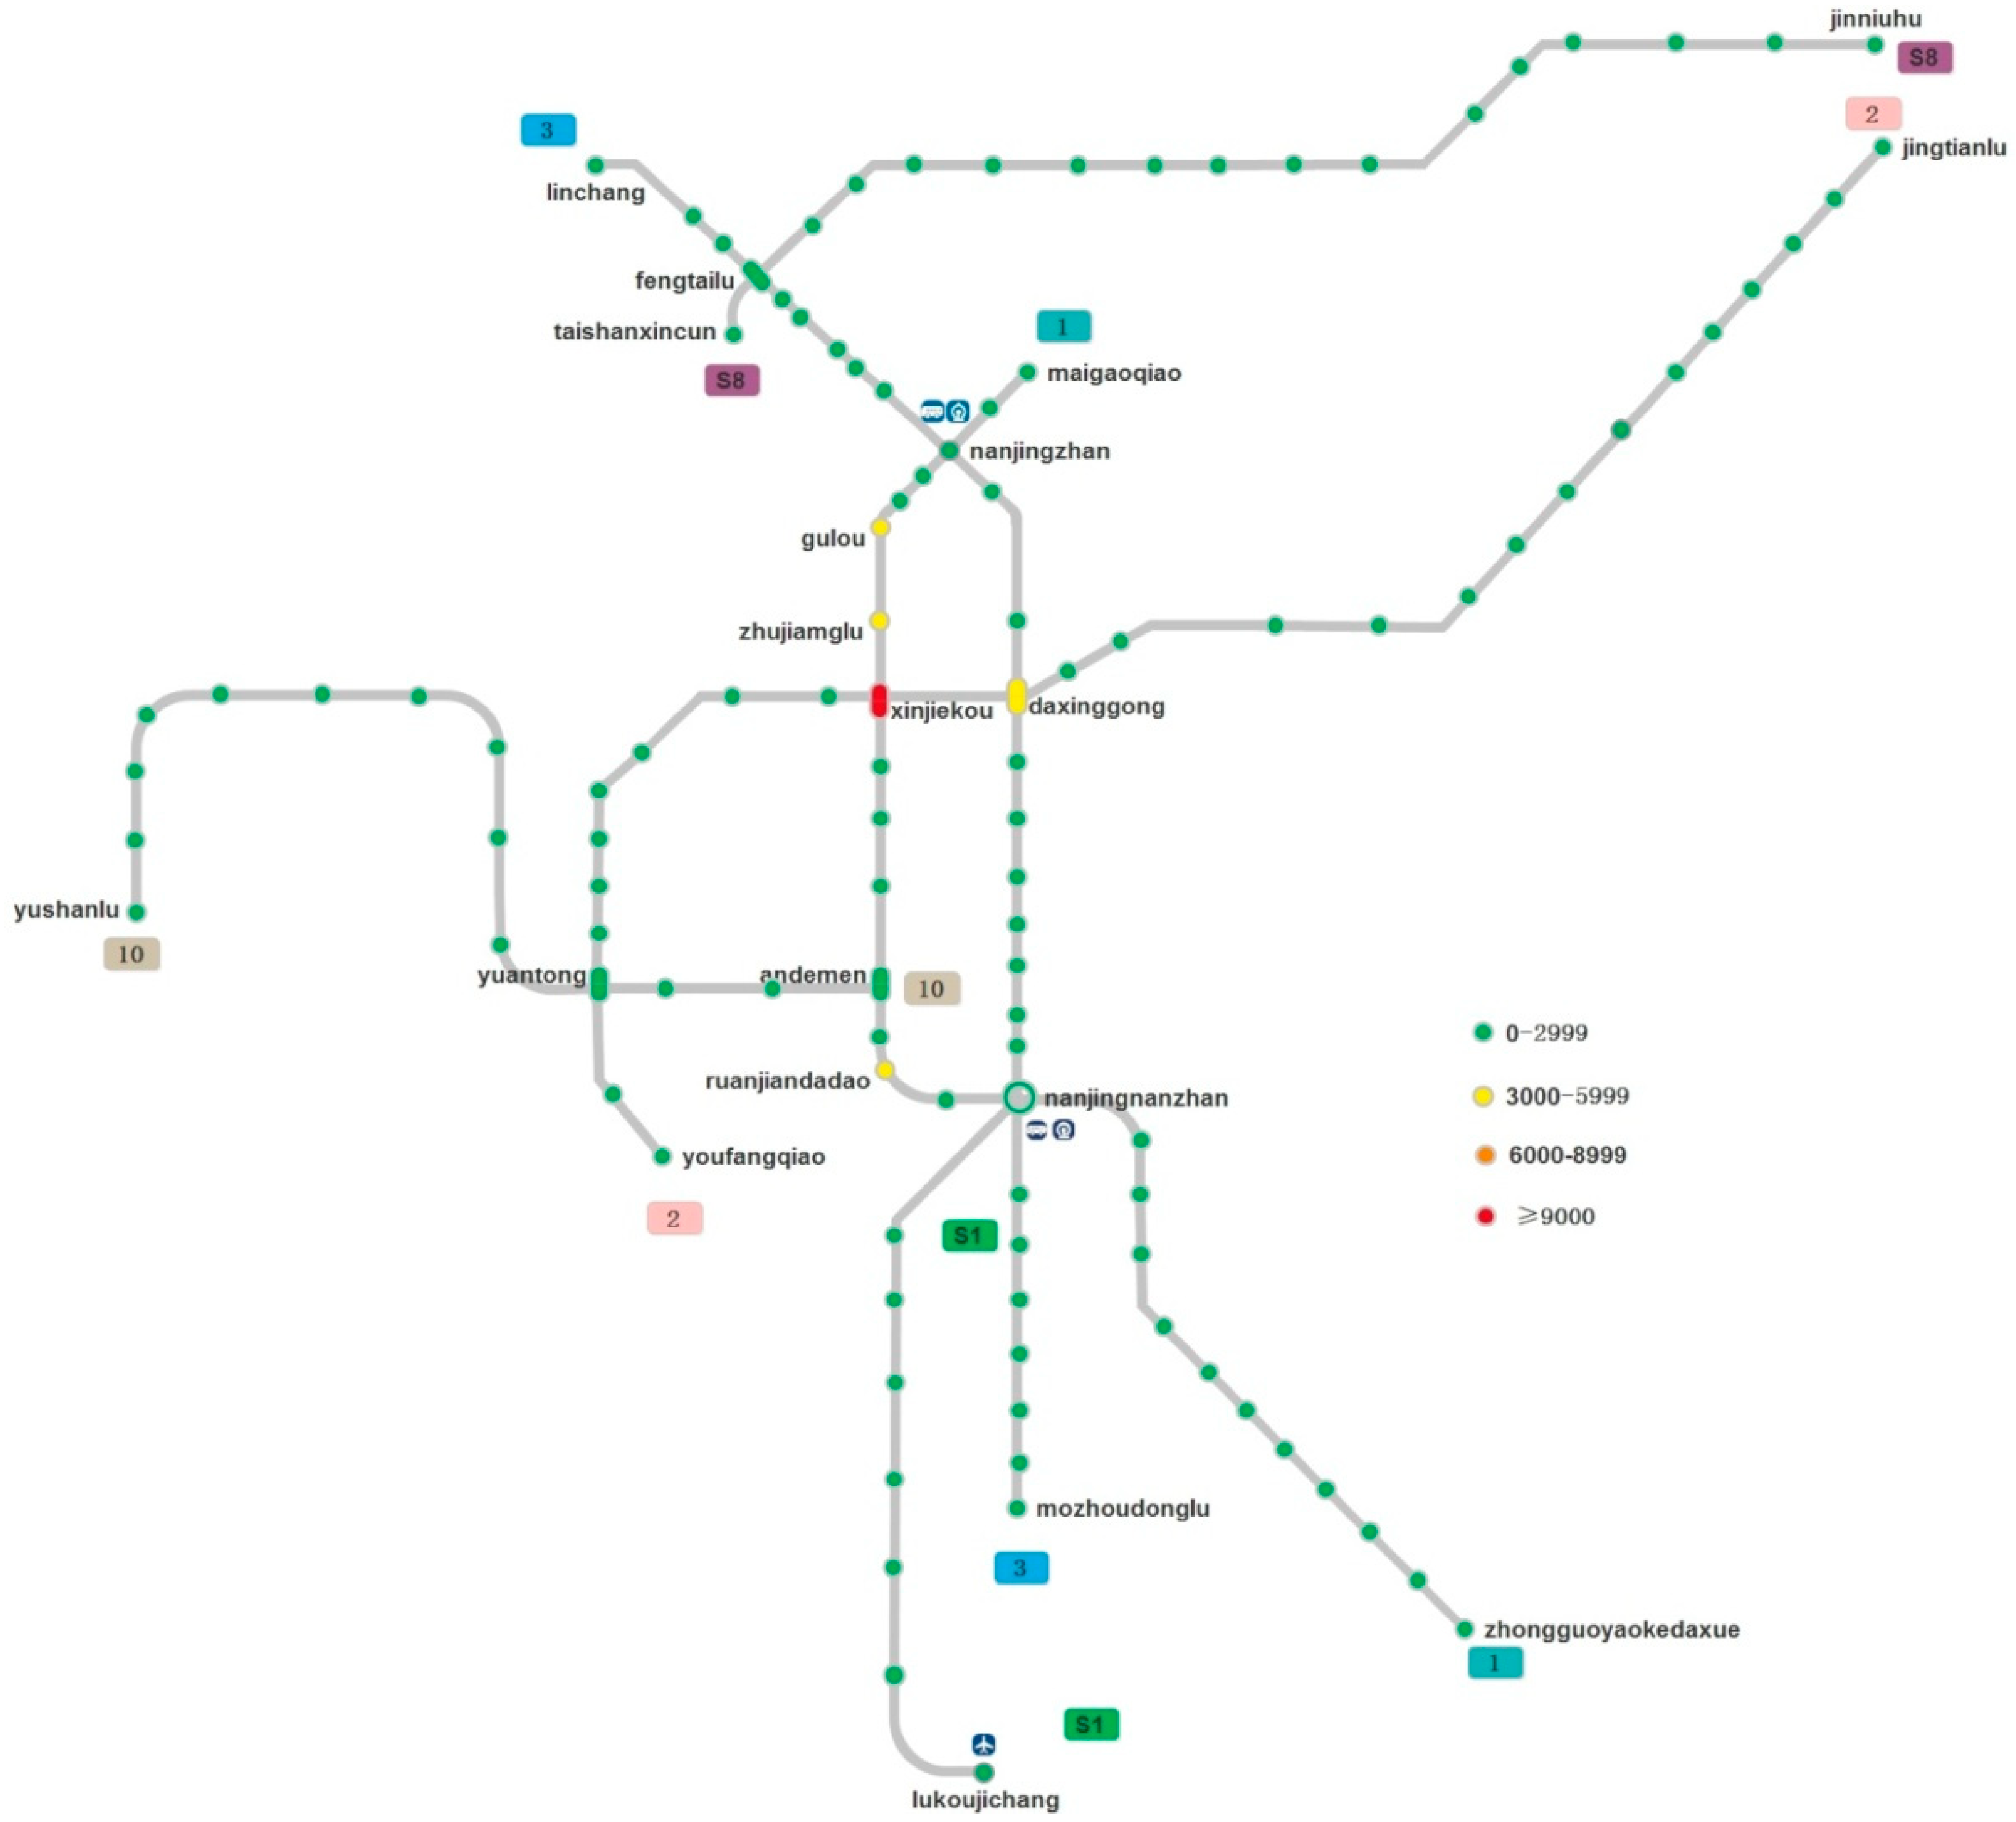
In this study, green, yellow, orange, and red warning colors are used to indicate the crowding degree of passenger flow at Nanjing metro stations. For the inbound passenger flow at 8:00 of the morning peak, the crowded stations are concentrated in the main lines of the metro, as well as some nearby stations with a high density of residents. For the distribution of outbound passenger flow at 8:00 of the morning peak, the crowded area is concentrated in the main urban area of Nanjing. For the distribution of inbound passenger flow at 18:00 of the evening peak, the basis of passenger flow is relatively smooth, but the Xinjiekou area is still relatively congested. The Ruanjiandadao is another congested site. For the outbound passenger flow at 18:00 of the evening peak, Xinjiekou area is still relatively crowded, and some transfer hubs and residential centers are also crowded.
There is still much space for further research. This research chose five working days of data, although to some extent this reflects the travel law of residents, but follow-up scientific research can be compared with rest days, holidays, and other data, showing the fluctuation law of week, month, season, and year. In addition, factors such as climate and failure can be considered. The classification of passengers can be further determined, which can be combined with urban geography, reflecting the relationship between passenger flow and business, work, and residential areas. In short, the use of metro big data can not only improve the level of traffic management, master residents’ travel rules, provide a basis for future traffic planning, but can also be combined with the commercial planning and development of real estate, so that the metro plays a dual role in transportation and commerce in the city.

Author Contributions

H.B. undertook the data collection. J.C. provided an interpretation of the results. W.Y. wrote the majority of the paper. X.Y. contributed to the paper review and editing.

Funding

This research was funded by Key Project of National Natural Science Foundation of China (No. 51638004), and Basic Research Program of Science and Technology Commission Foundation of Jiangsu Province (No. BK20180775).

Acknowledgments

The authors would like to express their sincere thanks to the anonymous reviewers for their constructive comments on an earlier version of this manuscript.

Conflicts of Interest

The authors declare no conflict of interest.

References

  1. Wei, Y.; Chen, M.C. Forecasting the short-term metro passenger flow with empirical mode decomposition and neural networks. Transp. Res. Part C Emerg. Technol. 2012, 21, 148–162. [Google Scholar] [CrossRef]
  2. Liu, S.; Yao, E. Holiday Passenger Flow Forecasting Based on the Modified Least-Square Support Vector Machine for the Metro System. J. Transp. Eng. Part A Syst. 2017, 143, 04016005. [Google Scholar] [CrossRef]
  3. Li, L.; Wang, Y.; Zhong, G.; Zhang, J.; Ran, B. Short-to-medium term passenger flow forecasting for metro stations using a hybrid model. KSCE J. Civ. Eng. 2018, 22, 1937–1945. [Google Scholar] [CrossRef]
  4. Jiang, M.; Li, H.Y.; Xu, X.Y.; Xu, S.P.; Miao, J.R. Metro passenger flow control with station-to-station cooperation based on stop-skipping and boarding limiting. J. Cent. South Univ. 2017, 24, 236–244. [Google Scholar] [CrossRef]
  5. Jiang, M.; Li, H.Y.; Xu, X.Y.; Xu, S.P.; Miao, J.R. Joint optimal train regulation and passenger flow control strategy for high-frequency metro lines. Transp. Res. Part B Methodol. 2017, 99, 113–137. [Google Scholar]
  6. Yang, J.; Jin, J.G.; Wu, J.; Jiang, X. Optimizing Passenger Flow Control and Bus-Bridging Service for Commuting Metro Lines. Comput. Aided Civ. Infrastruct. Eng. 2017, 32, 458–473. [Google Scholar] [CrossRef]
  7. Shi, J.; Yang, L.; Yang, J.; Gao, Z. Service-oriented train timetabling with collaborative passenger flow control on an oversaturated metro line: An integer linear optimization approach. Transp. Res. Part B Methodol. 2018, 110, 26–59. [Google Scholar] [CrossRef]
  8. Li, S.; Yang, L.; Gao, Z. Optimal switched control design for automatic train regulation of metro lines with time-varying passengers arrival flow. Transp. Res. Part C Emerg. Technol. 2018, 86, 425–440. [Google Scholar] [CrossRef]
  9. Lee, Y.K. Discovery of travel patterns in seoul metropolitan subway using big data of smart card transaction systems. J. Soc. E Bus. Stud. 2013, 18, 211–222. [Google Scholar]
  10. Lee, K.; Park, J.S. Accessibility changes in the metropolitan Seoul subway system: time-distance algorithms based on the T-card big data and an accessibility measurement model for un-fixed transportation networks. J. Econ. Geogr. Soc. Korea 2014, 17, 98–113. [Google Scholar]
  11. Sun, L.; Lu, Y.; Jin, J.G.; Lee, D.H.; Axhausen, K.W. An integrated Bayesian approach for passenger flow assignment in metro networks. Transp. Res. Part C Emerg. Technol. 2015, 52, 116–131. [Google Scholar] [CrossRef]
  12. Noh, K. An exploratory study on improvement method of the subway congestion based big data convergence. J. Digit. Converg. 2015, 13, 35–42. [Google Scholar]
  13. Kim, J. Subway congestion prediction and recommendation system using big data analysis. J. Digit. Converg. 2016, 14, 289–295. [Google Scholar] [CrossRef]
  14. Zhu, Y.; Ozbay, K.; Xie, K.; Yang, H. Using big data to study resilience of taxi and subway trips for hurricanes sandy and irene. Transp. Res. Rec. 2016, 2599, 70–80. [Google Scholar] [CrossRef]
  15. Hong, L.; Li, W.; Zhu, W. Assigning passenger flows on a metro network based on automatic fare collection data and timetable. Discret. Dyn. Nat. Soc. 2017, 2017, 4373871. [Google Scholar] [CrossRef]
  16. Wibisono, A.; Jatmiko, W.; Wisesa, H.A.; Hardjono, B.; Mursanto, P. Traffic big data prediction and visualization using Fast Incremental Model Trees-Drift Detection (FIMT-DD). Knowl. Based Syst. 2016, 93, 33–46. [Google Scholar] [CrossRef]
  17. Zhang, J.; Chen, Z.; Liu, Y.; Du, M.; Yang, W.; Guo, L. Space–time visualization analysis of bus passenger big data in Beijing. Clust. Comput. 2018, 21, 813–825. [Google Scholar] [CrossRef]
  18. Hwang, U. Visualization analysis of big data on issue of interest to passengers at wonju airport. J. Hotel Resort 2019, 18, 147–163. [Google Scholar]
  19. Fu, X.; Gu, Y. Impact of a new metro line: analysis of metro passenger flow and travel time based on smart card data. J. Adv. Transp. 2018, 2018, 9247102. [Google Scholar] [CrossRef]
  20. Li, J.; Li, X.; Chen, D.; Godding, L. Assessment of metro ridership fluctuation caused by weather conditions in asian context: using archived weather and ridership data in Nanjing. J. Transp. Geogr. 2018, 66, 356–368. [Google Scholar] [CrossRef]
  21. Wei, Y.; Ning, S. Establishment and analysis of the super network model for Nanjing metro transportation system. Complexity 2018, 2018, 4860531. [Google Scholar] [CrossRef]
  22. Yu, W.; Chen, J.; Yan, X. Space-time evolution analysis of the Nanjing metro network based on a complex network. Sustainability 2019, 11, 523. [Google Scholar] [CrossRef]
  23. Zhao, J.; Deng, W.; Song, Y.; Zhu, Y. Analysis of Metro ridership at station level and station-to-station level in Nanjing: an approach based on direct demand models. Transportation 2014, 41, 133–155. [Google Scholar] [CrossRef]
  24. Yang, M.; Liu, X.; Wang, W. Empirical analysis of a mode shift to using public bicycles to access the suburban metro: Survey of Nanjing, China. J. Urban Plan. Dev. 2016, 142, 05015011. [Google Scholar] [CrossRef]
  25. Wu, J.; Yang, M.; Sun, S. Modeling travel mode choices in connection to metro stations by mixed logit models: a case study in Nanjing, China. Promet Traffic Transp. 2018, 30, 549–561. [Google Scholar] [CrossRef]
  26. Li, Y.; Zhu, Z.; Guo, X. Operating characteristics of dockless bike-sharing systems near metro stations: case study in Nanjing city, China. Sustainability 2019, 11, 2256. [Google Scholar] [CrossRef]
Figure 1. Route map of Nanjing metro in 2017.
Sustainability 11 04989 g001
Figure 2. Statistics of daily passenger flow of Nanjing metro in five working days.
Sustainability 11 04989 g002
Figure 3. 24-h passenger flow fluctuation in five working days.
Sustainability 11 04989 g003
Figure 4. Peak hour coefficient of average daily passenger flow.
Sustainability 11 04989 g004
Figure 5. 24-h distribution of daily average passenger flow on six metro lines.
Sustainability 11 04989 g005
Figure 6. Passenger strength of metro lines.
Sustainability 11 04989 g006
Figure 7. Distribution of daily average passenger flow at metro stations.
Sustainability 11 04989 g007
Figure 8. Comparison of metro stations of inbound passenger flow at 8:00 and outbound passenger flow at 18:00.
Sustainability 11 04989 g008
Figure 9. Comparison of metro stations of outbound passenger flow at 8:00 and inbound passenger flow at 18:00.
Sustainability 11 04989 g009
Figure 10. Distribution of inbound passenger flow at 8:00 of morning peak.
Sustainability 11 04989 g010
Figure 11. Distribution of outbound passenger flow at 8:00 of morning peak.
Sustainability 11 04989 g011
Figure 12. Distribution of inbound passenger flow at 18:00 of evening peak.
Sustainability 11 04989 g012
Figure 13. Distribution of outbound passenger flow at 18:00 of evening peak.
Sustainability 11 04989 g013
Table 1. Sequence and performance table of Nanjing metro lines in 2017.
Opening SequenceNumber of StationsLength (km)Opening Time
127(16)38.92005
22637.952010
101421.62014
S1837.32014
S81745.22014
32944.92015
Table 2. Of five working days.
DataWeekWeatherTemperatureWind speed
9 January 2017MondayCloudy/Cloudy8 °C/2 °CNorth wind level 3–4/Northeast wind level 3–4
10 January 2017TuesdayCloudy/Cloudy8 °C/4 °CNortheast wind level 3–4/East Wind level ≤3
11 January 2017WednesdayCloudy/Light rain8 °C/4 °CNortheast wind level ≤3/North wind level ≤3
12 January 2017ThursdayCloudy/Cloudy10 °C/0 °CWest wind level 3–4/West wind level 3–4
13 January 2017FridaySunny/Sunny11 °C/−1 °CSouthwest wind level 3–4/West wind level 3–4
Table 3. Code of Nanjing metro stations.
Station Code (1–57)Station NameStation Code (58–113)Station Name
1aotizhongxin58jiangxinzhou
2yuantong59linjiang
3zhongsheng60pukouwanhuicheng
4xiaoxing61nanjinggongyedaxue
5andemen62longhualu
6zhonghuamen63wendelu
7sanshanjie64yushanlu
8zhangfuyuan65lukoujichang
9xinjiekou66xiangyulunan
10zhujianglu67xiangyulubei
11gulou68zhengfangzhonglu
12xuanwumen69jiyindadao
13xinmofanmalu70hehaidaxuefochengxilu
14nanjingzhan71cuipingshan
15hongshandongwuyuan72taishanxincun
16maigaoqiao73taifenglu
17youfangqiao74gaoxinkaifaqu
18yurundajie75xinxigongchengdaxue
19aotidong76xiejiadian
20xinglongdajie77dachang
21jiqingmendajie78getang
22yunjinlu79changlu
23mochouhu80huagongyuan
24hanzhongmen81liuhekaifaqu
25shanghailu82longchi
26daxinggong83xiongzhou
27xianmen84fenghuangshangongyuan
28minggugong85fangzhouguangchang
29muxuyuan86shenqiao
30xiamafang87babaiqiao
31xiaolingwei88jinniuhu
32zhonglingjie89linchang
33maqun90xinghuolu
34jinmalu91dongdachengxianxueyuan
35xianhemen92tianruncheng
36xuezelu93liuzhoudonglu
37xianlinzhongxin94shangyuanmen
38yangshangongyuan95wutangguangchang
39nandaxianlinxiaoqu96xiaoshi
40jingtianlu97nanjinglinyedaxue.xinzhuang
41tianlongsi98jimingsi
42ruanjiandadao99fuqiao
43huashenmiao100changfujie
44nanjingnanzhan101fuzimiao
45shuanglongdadao102wudingmen
46hedingqiao103yuhuamen
47shengtailu104qiazimen
48baijiahu105daminglu
49xiaolongwan106mingfaguangchang
50zhushanlu107hongyundadao
51tianyindadao108shengtaixilu
52longmiandadao109tianyuanxilu
53nanyida.jiangsujingmaoxueyuan110jiulonghu
54nanjingjiaoyuan111chengxindadao
55zhongguoyaokedaxue112dongdajiulonghuxiaoqu
56mengdudajie113mozhoudonglu
57lvboyuan

