1. Introduction
The concept of critical infrastructure protection (CIP) has been an ongoing concern not just for individual countries or for their owners/operators and dependents, but also for supranational entities, such as the European Union. The process of globalization has led to the emergence of regionally and globally distributed critical infrastructure networks which are vulnerable to cascading disruptions and other specific phenomena. These latter disruptive events are not only the result of external shocks, but may even derive from internal aspects of complex systems, resulting in the transfer and escalation of effects [
1]. No discussion of CIP is possible without mentioning the concept of resilience, which is “the ability to prepare and plan for, absorb, recover from, and more successfully adapt to adverse events” [
2]. There are emerging issues with complexity and uncertainty when it comes to interdependent infrastructural systems which can only be addressed by pursuing resilience, even in the design phase of the systems and their regulatory structures [
3].
Critical infrastructures (CI) have numerous definitions contingent to the particular visions of the institutions and states articulating them, but all of the definitions share common elements in regard to the mixed, socio-technical nature of the systems and the concern for the impact which their disruption or destruction may have on economic life, on society, and on the safety and security of the states and their citizens. Starting with [
4], which identified “those physical and cyber-based systems essential to the minimum operations of the economy and government” as critical infrastructures, and continuing with [
5], which established a category of European Critical Infrastructures which are “essential for the maintenance of vital societal functions, health, safety, security, economic, or social well-being of people” and would impact two or more Member States “as a result of the failure to maintain those functions,” the notion of critical infrastructure networks has continuously been enlarged to acknowledge growing global complexities and interdependencies, not just as a reality of systems architecture, but also, of policymaking. [
6] emphasizes that “a severe disruption in the system can go beyond geographical, organizational, and administrative boundaries, thus activating a multifaceted set of actors whose ability to collaborate is required to restore the situation.”
1.1. Space Systems as Critical Infrastructures
Space systems have steadily taken on a greater role in the functioning of the critical infrastructure—system-of-systems (SoS). An SoS view has infrastructure made up of components which may be large-scale systems in their own right, sometimes operating autonomously from a technical and administrative standpoint, yet are indelibly tied to other components through interaction which results in the propagation of risks and disruptions so that systemic consequences may arise from localized disruptions [
7,
8]. It is possible to argue for space systems as critical infrastructures, key assets, or key resources within complex systems [
9,
10]. This emergence has taken place as a result of steady evolution in:
The number of space systems;
The capabilities of space systems, qualitatively (ex: the sensitivity of sensors) and quantitatively;
The permeation of space services throughout various systemically important infrastructures, such as transport, finance, communications, and many others.
1.1.1. The Reliance on Space Systems
The various trends point towards the direction of increasing reliance on space systems. Firstly, there is an ongoing reduction in the cost of access to space, exemplified by the growing number of space assets utilizing cubesat and smallsat architectures [
11], made possible by advances in miniaturization, component hardening and the use of adequate commercial, off-the-shelf solutions. Secondly, there is an anticipated revolution in the cost of launching space systems, exemplified by the price transparency of companies such as SpaceX, the emphasis from it and other companies on developing partly or totally reusable launch vehicles, and the growing number of actors developing small- and medium-launch capabilities [
12]. Thirdly, the process of globalization implies a tighter coupling of systems which, on average, will necessitate the use of space capabilities for proper systemic functioning and efficiency. As an example, global supply and production chains have become dependent on global navigation satellite systems, which are also responsible for the coordination of electricity grids, the time stamping of transactions and the synchronization of databases [
13]. An oblique example that shows the spread in the use of space services comes from their use by the World Bank to solve various problems in targeted countries, such as remote sensing in Africa for sustainable resource use [
14]. More and more, the level of advancement, efficiency, and sophistication of an economy is correlated with the use of space services in a direct (communications and data gathering) and indirect (precision agriculture) manners. This is in line with the observation of [
15] that there has been “rapid change in the organizational, operational, and technical aspects of infrastructures,” and that, in exchange for positive effects on the well-being of populations, formerly autonomous and vertically integrated systems with few points of contact to other infrastructures, now feature significant dependencies and tight couplings. Space systems are, thus, both initiators of systemic changes and facilitators of the same, enabling the tighter couplings and the more surface contact points between infrastructures; and CIP efforts from both spacefaring and non-spacefaring nations will have to take into account their dependency on space systems, and their exposure to space risks and space-mediated risks in order to understand their security environment and formulate adequate policies.
The issue is compounded by the increased role that space systems play in exactly those systems, which, in an empirical study by [
16] found were most likely to be the culprits for a cascading disruption phenomenon in the Netherlands—out of 830 reports of incidents in the Netherlands, 47% of all cascades originate within the energy sector, 44% within telecommunications and the Internet, and 3.2% in transportation. Space systems, as critical components within the Energy SoS or the Communications SoS, are feasible trigger points for cascading disruptions.
The present paper underlines the importance of space systems by presenting a thought device that served as a proof of concept for an undisclosed project regarding critical infrastructure simulation and modelling. It is a highly abstracted model that was run through five scenarios especially chosen to highlight the variety of points of engagement between a critical infrastructure system and the critical space infrastructures and their environment. The subject chosen was the global air transport network and the simplified model created was subjected to scenarios highlighting accidental and deliberate threats, first- and second-order consequences, and the differences in the global distribution of event impacts based not just on geographic location, but also local degrees of preparedness.
1.1.2. Transportation Systems
The development and resilience of transportation systems has been a continuous subject of study, as these systems underpin the functioning of regionalized and globalized economic systems with important divisions of labor [
17]. The air transport network (or networks) is a subset of these systems, but is no less important for it. According to [
18], 3.979 billion air travelers were recorded in 2017. As stated in [
19], the transport of goods may represent only 9% of airline industry revenue, but it is systemically important—the 52 million metric tons transported by air in 2018 were 35% of the value of global trade in goods (or 6.8 trillion dollars), despite being only 1% of the volume. As for systemic relevance, [
20] estimates that an increase in 1% in air cargo connectivity translates to an increase of 6% in overall trade; so the air transport industry is a lodestar for globalization and the integration of global supply and production chains, and therefore, their attendant infrastructure systems.
In 2019, [
21] used a multi-scale analysis on the basis of purchased OAG (an important air travel intelligence company with headquarters in the United Kingdom) data to show that the “global air transport network contains a core with approximately 80 nodes (less than 1%), whilst the remaining 9000 are peripheral nodes,” which they concluded resulted in low robustness to accidental or targeted failures. This sort of concentration results from high efficiency and economies of scale, but also indicates that a simpler analysis, such as the one presented herein, can potentially be scaled to a level where the results may capture a large proportion of the systemic impact of a critical space infrastructure disruption.
1.2. From Space and Critical Infrastructures to Space-Critical Infrastructures
Reference [
22] conceptualized space and critical infrastructures, rather than critical space infrastructures [
23]. The difference relates to whether the individual space assets are considered separate critical infrastructures or just critical components of larger CI systems. This is a relevant question from a governance perspective, as the designation as a CI for a particular system creates obligations on the part of the owner/operator and the competent authorities as part of the established National or European CIP framework. We would argue that the most useful perspective is that of CI, specifically because of the governance issue, and the current observable trend for stakeholders, such as the European Union, which is establishing a separate agency for the administration of its space concerns, and it has declared the GNSS system Galileo (and EGNOS) and the Copernicus remote sensing systems to be European critical infrastructures, while NATO is moving towards declaring space to be a new operational domain on this basis [
24]. At the same time, a complex system governance perspective [
25] would find the distinction to be less relevant, as the purposeful development of control, communication, coordination, and integration functions within a complex system dedicated to, for instance, global supply chains, would eventually recognize the criticality of the space systems involved. The property of complex systems is to feature emergent phenomena from the interplay between components and the environment, but the whole, provides the impetus for a holistic view of the system-of-systems, in which critical space components will have to be accounted for by stakeholders.
The systems most likely to be critical are satellites in orbit of Earth and their ground stations, along with their communication links, though methodologies of assessing criticality are still required for the identification and designation as CIs and the allocation of scarce security resources. The open-source satellite database of the Union of Concerned Scientists estimates that just 2062 satellites were active in orbit on March 31st, 2019 [
26], a large proportion of which were smaller satellites launched since 2014, when [
27] noted a spike in satellite launches through the breakthrough of usable smallsat architecture. This trend has held since then. With such a relatively small inventory of assets servicing a large number of clients and numerous indirect beneficiaries, the criticality of certain space systems is undeniable, especially in circumstances related to emergency and crisis situations.
The main capabilities provided by critical space infrastructures are navigation, positioning, and timing (GNSS networks, such as the US NavStar, Russian Glonass, Chinese Beidou, and European Galileo); communications and remote sensing—the latter of which are especially important circumstantially, such as when Earth-based replacement systems are disrupted (undersea cables for communications etc.); or when there is a crisis or emergency situation whose management or alleviation depends on space services (Earth observation of extreme weather phenomena). [
28] argues in favor of a continuous situational awareness that leads to an ongoing reassessment of criticality that reflects changing circumstances, interactions, and dynamics. Such a dynamic criticality concept is useful for space stakeholders, who may otherwise underplay the importance of one system or another because of a variation in criticality according to unheeded scenarios.
1.3. Challenges for the Smooth-Functioning of Space-Critical Infrastructures
1.3.1. Cascading Disasters
In line with the application of the CIP framework of thought to space systems, we find that cascading disruption phenomena are also a concern, since these systems provide a useful starting point for such a chain of events. [
29] differentiates between cascading disasters, which are extreme events, and cascading effects, which are the dynamics leading to such events and are multidimensional and complex, evolving from underlying conditions: “Cascading disasters are extreme events, in which cascading effects increase in progression over time and generate unexpected secondary events of strong impacts. These tend to be at least as serious as the original event and contribute significantly to the overall duration of the disaster’s effect.” Within the limitations of the proposed model, we tried to exemplify the issue of cascading disruption, though not of cascading effects. Of course, this does not mean that such disasters are predestined, since [
30] emphasizes that cascading disasters are a function of the accumulation of vulnerabilities and rigidities across multiple domains, whose release comes from the “fortuitous” alignment of breaking points. A lack of alignment would stop the cascading phenomenon in its tracks. In this regard, some space systems act as an aligner of vulnerabilities, since their efficiency perpetuates “just-in-time” economic and logistics systems without reserves and redundancies to handle crises. However, it is not just a problem of technical and organizational issues which could feasibly be ameliorated through investment and innovation, but also, according to [
30], a series of social issues which promote the accumulation of rigidities which then hamper the process of adaptation during a critical challenge to the system.
In the case of space systems, two inflection points may be identified. The first is the difficulty in replacing a particular system and the lack of substitution and redundancy which is promoted by the practice of designing bespoke systems for specific missions, due to weight limitations. The second is the difficulty in coordinating independent actors for collective action in the international space environment, where there are significant gaps in the legislative and administrative framework, incentives to not coordinate, and concerns over the free-rider issue in areas such as active debris mitigation, or space situational awareness programs. The space debris issue, in particular, seems to be a possible starting point for a “tragedy of the orbital commons” type of situation. Ultimately, all of the issues stem from the environmental security of space.
1.3.2. Space Debris and Space Weather Phenomena
The space environment poses significant challenges, including specific threats, such as space debris and space weather phenomena. The ambient conditions of the orbital environment, featuring significant variations in temperature and background radiation, lead to significant occurrences of spontaneous malfunctions.
Space debris resulting from human activity in space, and natural sources, presents a significant hazard concentrated naturally in areas with the most intense activity, such as low-Earth orbit. According to [
31], there are 8500 tons of objects surrounding Earth, of which active systems are only a small portion. A total of 22,300 objects are tracked by the Space Surveillance Networks and maintained in their catalogues, but statistical models estimate that there are 34,000 debris objects sized over 10 cm, 900 thousand objects between 1 cm and 10 cm and 128 million below 1 cm. All of these have the capacity to inflict potentially lethal damage to space systems. [
32] emphasized the difficulties in the governance of space debris through the voluntary adoption of standards and practices, in the absence of negative reinforcement, which tracks also with the various typologies of SoS, in which directed, centralized models are contrasted with collaborative systems, where voluntary work by different stakeholders towards a goal is the norm [
33].
Space debris may also be the result of deliberate activity, such as the testing of ASAT (anti-satellite) weaponry for the purpose of demonstrating the capability and to place psychological pressure on adversaries. Should a conflict start or extend into space, then the creation of space debris may become not only the result of targeting space systems which have been designated as legitimate targets, but also an actual weapon of war, in order to degrade the environment beyond use by an adversary, thereby limiting his advantage. This is the vision which is compelling NATO to steadily include space issues in its strategic planning and exercises.
Another specific space phenomenon is space weather, of which solar storms represent an important component. [
34] details the widespread impact of significant space weather phenomena on infrastructure both in space and on the ground, with significant examples, such as the great geomagnetic storm of 13–14 March 1989, resulting in power outages in Quebec, the UK, and other countries, along with the loss of positional data for 1000 space objects for the week of the storm [
34]. [
35] emphasizes the dire effects that a superstorm would have on the US electricity grid, with blackouts affecting 130 million consumers and potentially damaging over 350 transformer stations. They also set out the role of space systems in mitigating this threat, by providing early warning of incoming solar flares which would allow infrastructure operators to implement emergency measures that minimize the damage suffered as a result of geomagnetically-induced currents.
1.3.3. Other Threats
Other deliberate threats require fewer resources and are more accessible to a wide array of actors, such as cyber-attacks, jamming, and laser attacks, which are becoming not only feasible but regularly used as part of an emerging counterspace dynamic [
36] that also sees the application of pressure in the space field through comprehensive financial and economic partnerships [
37]. These are factored into “hybrid warfare” and “gray zone threats” which utilize means other than military and do not cross the threshold necessitating a declaration of war and armed response.
These elements of the space security environment were used in formulating the scenarios for the model analyzed in the paper and they were selected to underline both the variety of threats, and the complicating factors of state rivalries and strategic considerations.
2. Materials and Methods
2.1. Agent-Based Modeling
Agent-based modeling (ABM) is defined as a computational method that enables a researcher to create, analyze, and experiment with models comprised of agents that interact within an environment [
38,
39]. Agent-based models allow a deeper analysis of a system’s behavior; the relationships among dynamic components; and last but not least, the ability to model unforeseen dynamics in certain model cases that would otherwise be smoothed out in classic numerical models [
40]. In ABM, a system is modeled as a collection of autonomous decision-making entities called agents. Each agent individually assesses its situation and makes decisions on the basis of a set of rules. Agents may execute various behaviors that are appropriate for the system they represent; in our case, the simulated agents are the airplane, the airports, the holding centers, and the control centers [
41]
A typical agent-based model has three elements: [
42]
A set of agents, their attributes, and behaviors.
A set of agent relationships and methods of interaction: An underlying topology of connectedness defines how and with whom agents interact.
The agents’ environment: Agents interact with their environment in addition to other agents.
As stated by [
43] and [
44], ABM has several limitations as follows:
The conditional nature of an agent-based simulation’s results:
The uncertainty of the results;
The transparency of the results;
The reproducibility of the results.
The present model was programmed in Netlogo, a free application with important resource libraries at the disposal of amateur programmers. The software was chosen for several reasons, but mostly for its advantageous mix of ease of use, capabilities, and flexibility. Other reasons include: free and unlimited access to the software; the fact that it is relatively well optimized in regard to hardware use, although the model sorely pushed its limits; the numerous online guides and tutorials; the ease of the workflow within the application; the logical interface and simple programming language; and the community of users maintaining libraries of generic code for use by other users. Given the objective of this study, the adopted technology provided the proof of concept.
The model simulates the air traffic flow between a significant number of airports grouped by a geographic criterion in order to run scenarios which demonstrate a link between the air transport critical infrastructure and space systems, and the exposure to risks transferred through space vectors. The model illustrates the critical dependence of a chosen critical infrastructure system on another system, supporting the argument that space systems are, in fact, a new type of critical infrastructure.
2.2. Description of the Model
In the model, the flow of airplanes is arbitrary, based on simplistic decision models, but it allows us to emphasize the systemic effects of the application of the chosen scenarios, which are all based on the idea of limited or total disruption within a part or the entirety of our system. The system inputs change from the baseline to values chosen by the authors to illustrate various considerations regarding the specificities of actors and systems associated with the various airport centers. The differences between results during the running of the model under normal conditions and the results during each scenario illustrate the impact of specific space phenomena, and the disruption or constraints of access to space services that are considered critical.
2.2.1. Components of the Proposed Model
Before running the simulation, the user sets: the number of centers (6), the number of active airports for each center (3), the number of airplanes per center (500), the processing capacity of the control centers, the storage capacity of the holding centers, the maximum time of delay, the time to departure, and the flight time. The simulation runs endlessly, until the user triggers one of the in-built scenarios of the model. The tests have limited durations and then the system returns to normal. There are no permanent systemic changes, especially to allow for comparisons between normal and crisis events. The system process is as follows. A new actor is generated at a given moment at a random airport, as long as there is still capacity in the system. It sets a departure time and a destination airport. When the time reaches zero, the actor queries the control center affiliated to its airport to see if it may lift off. If it may not, the plane stays at its initial airport in a holding area, awaiting its opportunity to continue on its way. The system tracks these delays. After it departs and arrives at its destination according to a variable formula, it queries the control center to see if it can coordinate its journey’s end phase. If it cannot, it is stored in a holding area until there is sufficient system capacity to allow it through. Otherwise, if the plane exceeds its maximum waiting time, it drops out of the system and is considered to have been rerouted to another airport outside of the system because of fuel issues or malfunctions. If it passes through the control center, then the plane is reset and the process starts all over again from the beginning. The system is heavily abstracted, but offers a baseline to compare with the effects of the preprogrammed disruptions. [
45]
Models such as this one only partly reflect reality and are isomorphic constructions prone to errors produced by the significant abstracting and simplifications of processes which, in real life, are extraordinarily complex. No model can represent reality in full, and will all develop a series of assumptions and model limitations which must be factored in by the user when analyzing the model and its results critically. The conclusions must be considered with the limitations of the system in mind.
By using agent-based modeling, the system simulates thousands of airplanes randomly flying between 18 airports clustered in six regions which have been assigned an air traffic control center. To ease the strain of computing, that was just one of the areas in which abstraction was necessary to run the simulation. The six control centers, each with three airports, are:
North America—New York control center;
Western Europe—London, Benelux, and Berlin centers;
Asia—Moscow and Beijing centers.
They were chosen to illustrate the global reach of critical space infrastructure malfunctions, while also enabling the addition of more context to the test scenarios. In order to choose the scenarios, there was a large literature survey driven and several meetings were organized with space systems’ specialists. Afterwards, there were two major sources of risk chosen to be embedded within the tests: extreme space weather events and cyber-attacks, as in [
46].
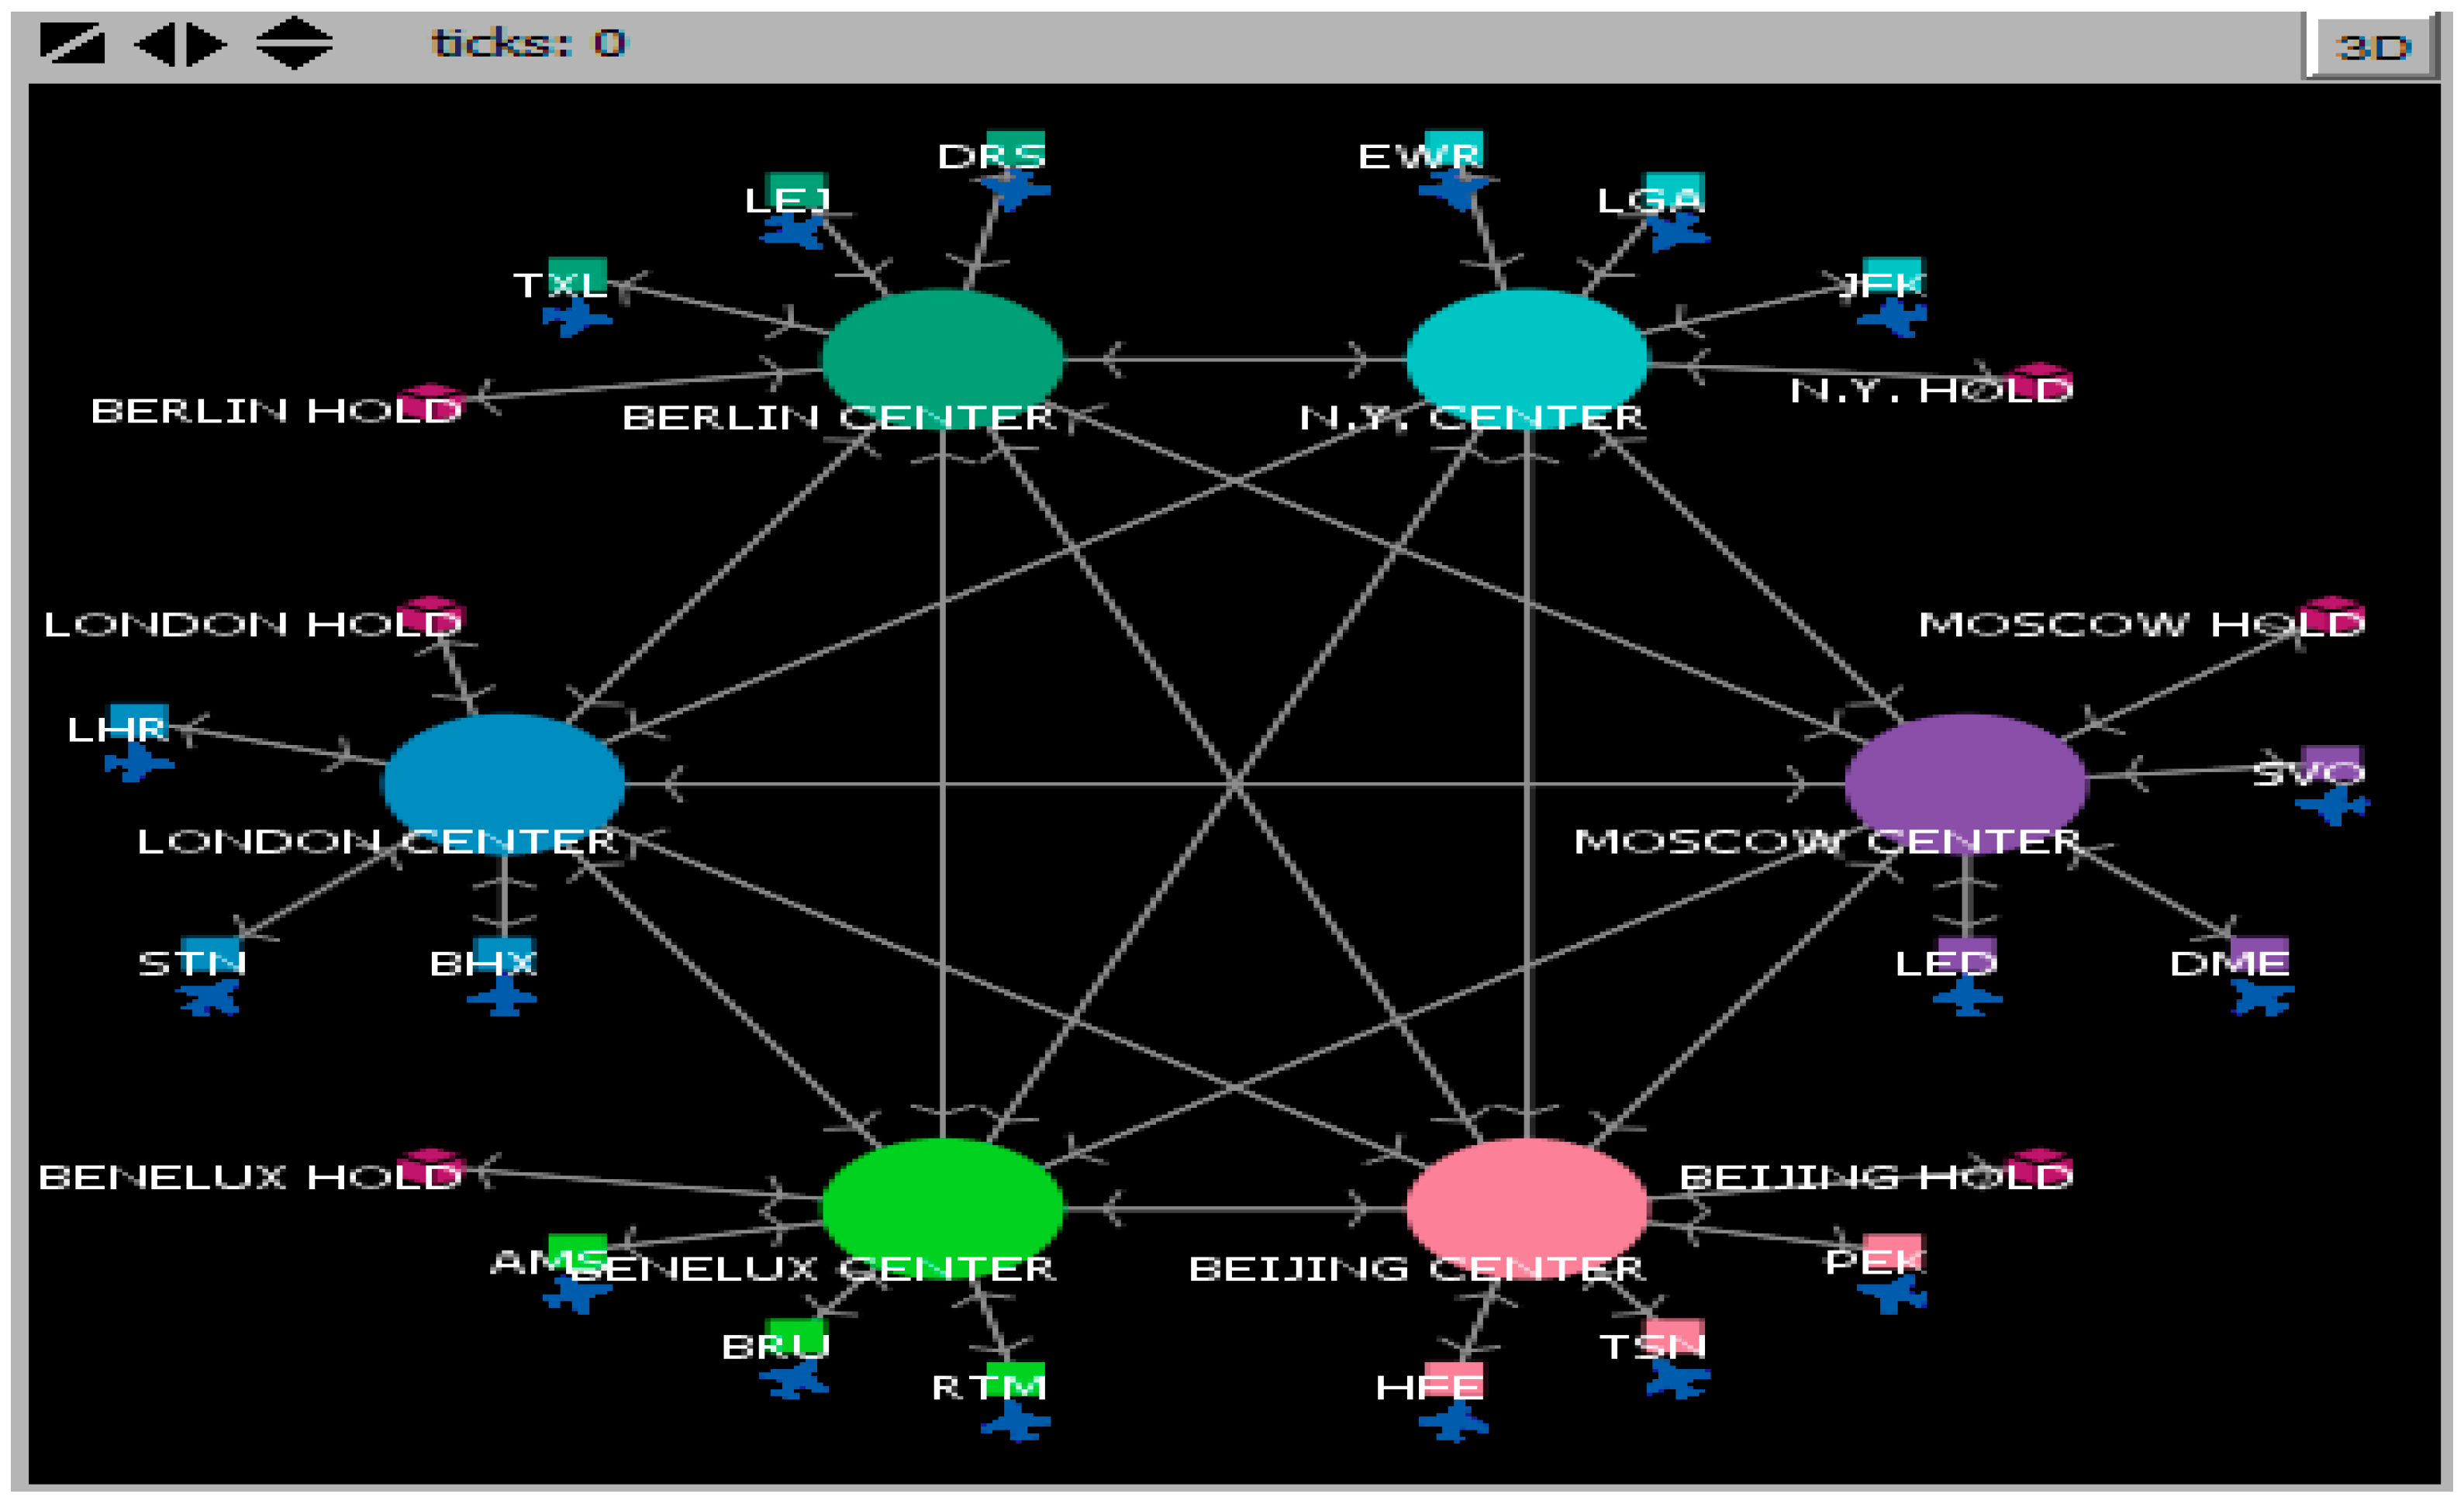
The model contains four key elements: the simulated agent, which is the airplane; the airports; the holding centers; and the control centers. Airplanes are defined by speed, starting position, and destination, and may find themselves delayed, canceled, or detoured. Airports are the sources and destinations of the airplanes. Control centers are the gatekeepers of the system, processing flight requests and coordinating movements between airports. Holding centers are a necessary abstraction, being the equivalent of queues attached to control centers. If there is sufficient processing capacity for safe flights, airplanes move instantly through the holding center and towards their destination. Otherwise, they queue up until the congestion subsides, generating delays.
2.2.2. The Operating Process
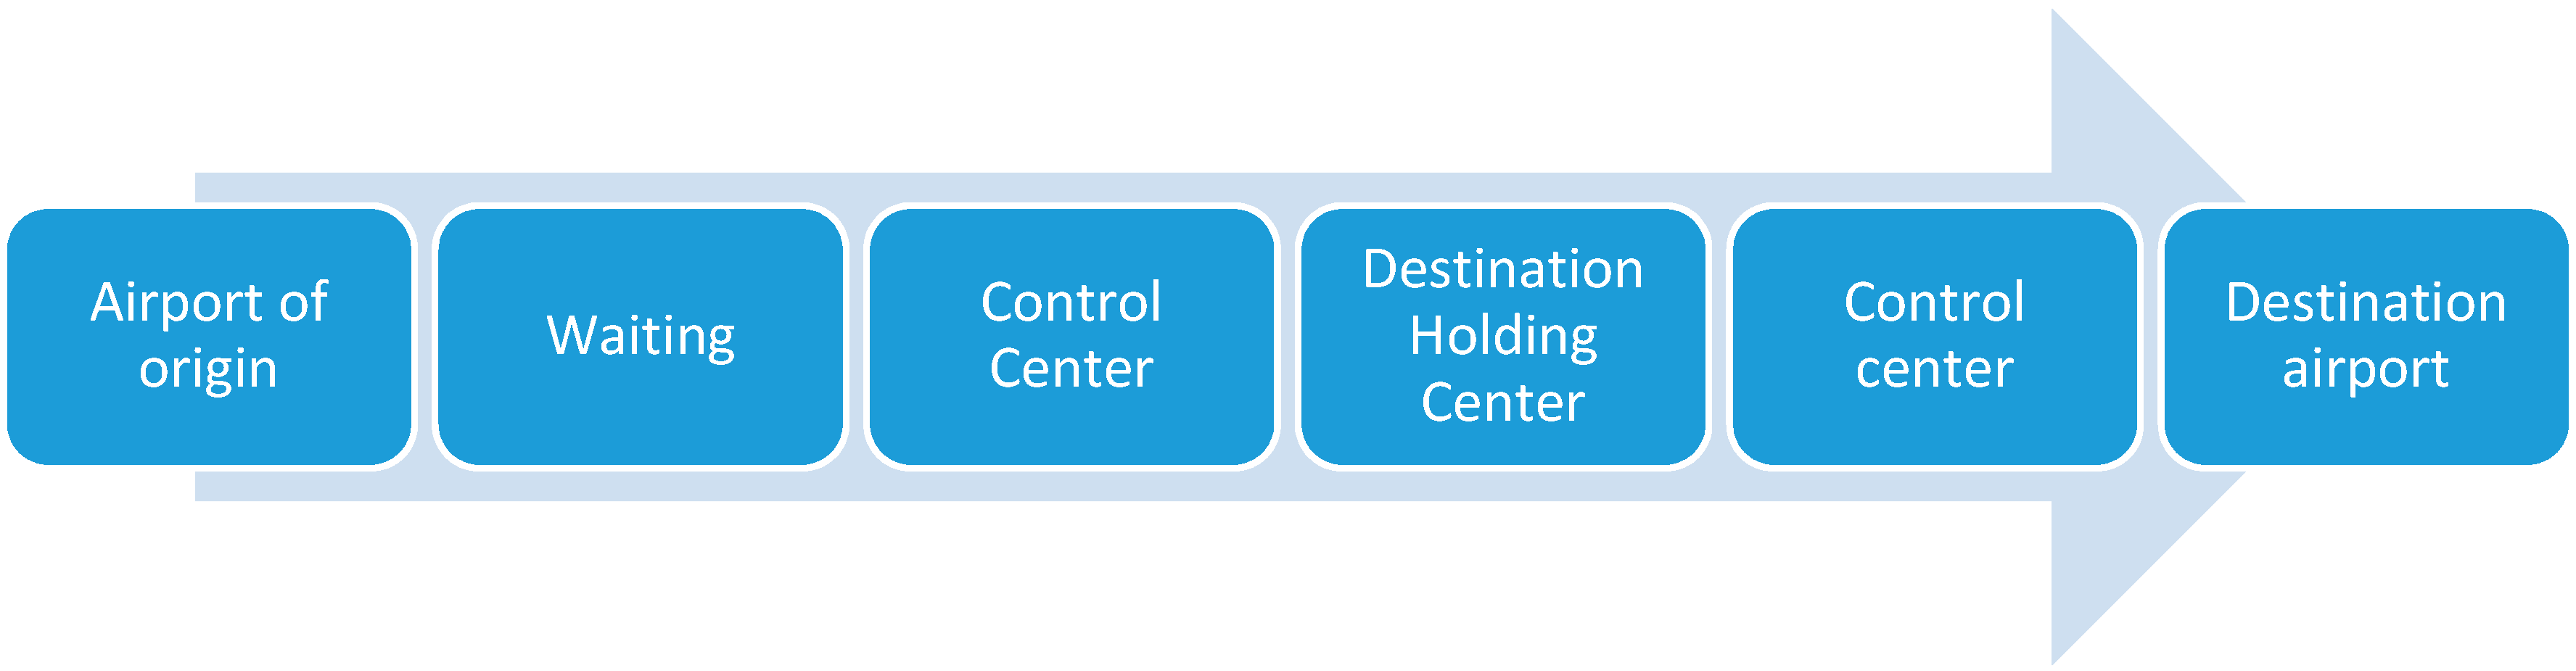
Figure 1 shows a visualization of the four entities (agents) and how the system simulates the process of air traffic control under the pattern described in
Figure 2.
The system subject to modeling embeds numerous variables which can be tweaked by the user. The operating process is as follows: an agent is generated at a random airport, with a random destination and time of departure. If the control center has insufficient processing capacity, it is delayed. If it can be processed, it moves on at its given speed towards the destination holding center, where the destination control center is queried for capacity. If there is enough capacity, the agent moves to the destination airport and is removed from the system. If not, it may wait in the holding center. Waiting for too long (a system variable) leads to the airplane dropping out of the system by choosing a non-listed airport to resupply.
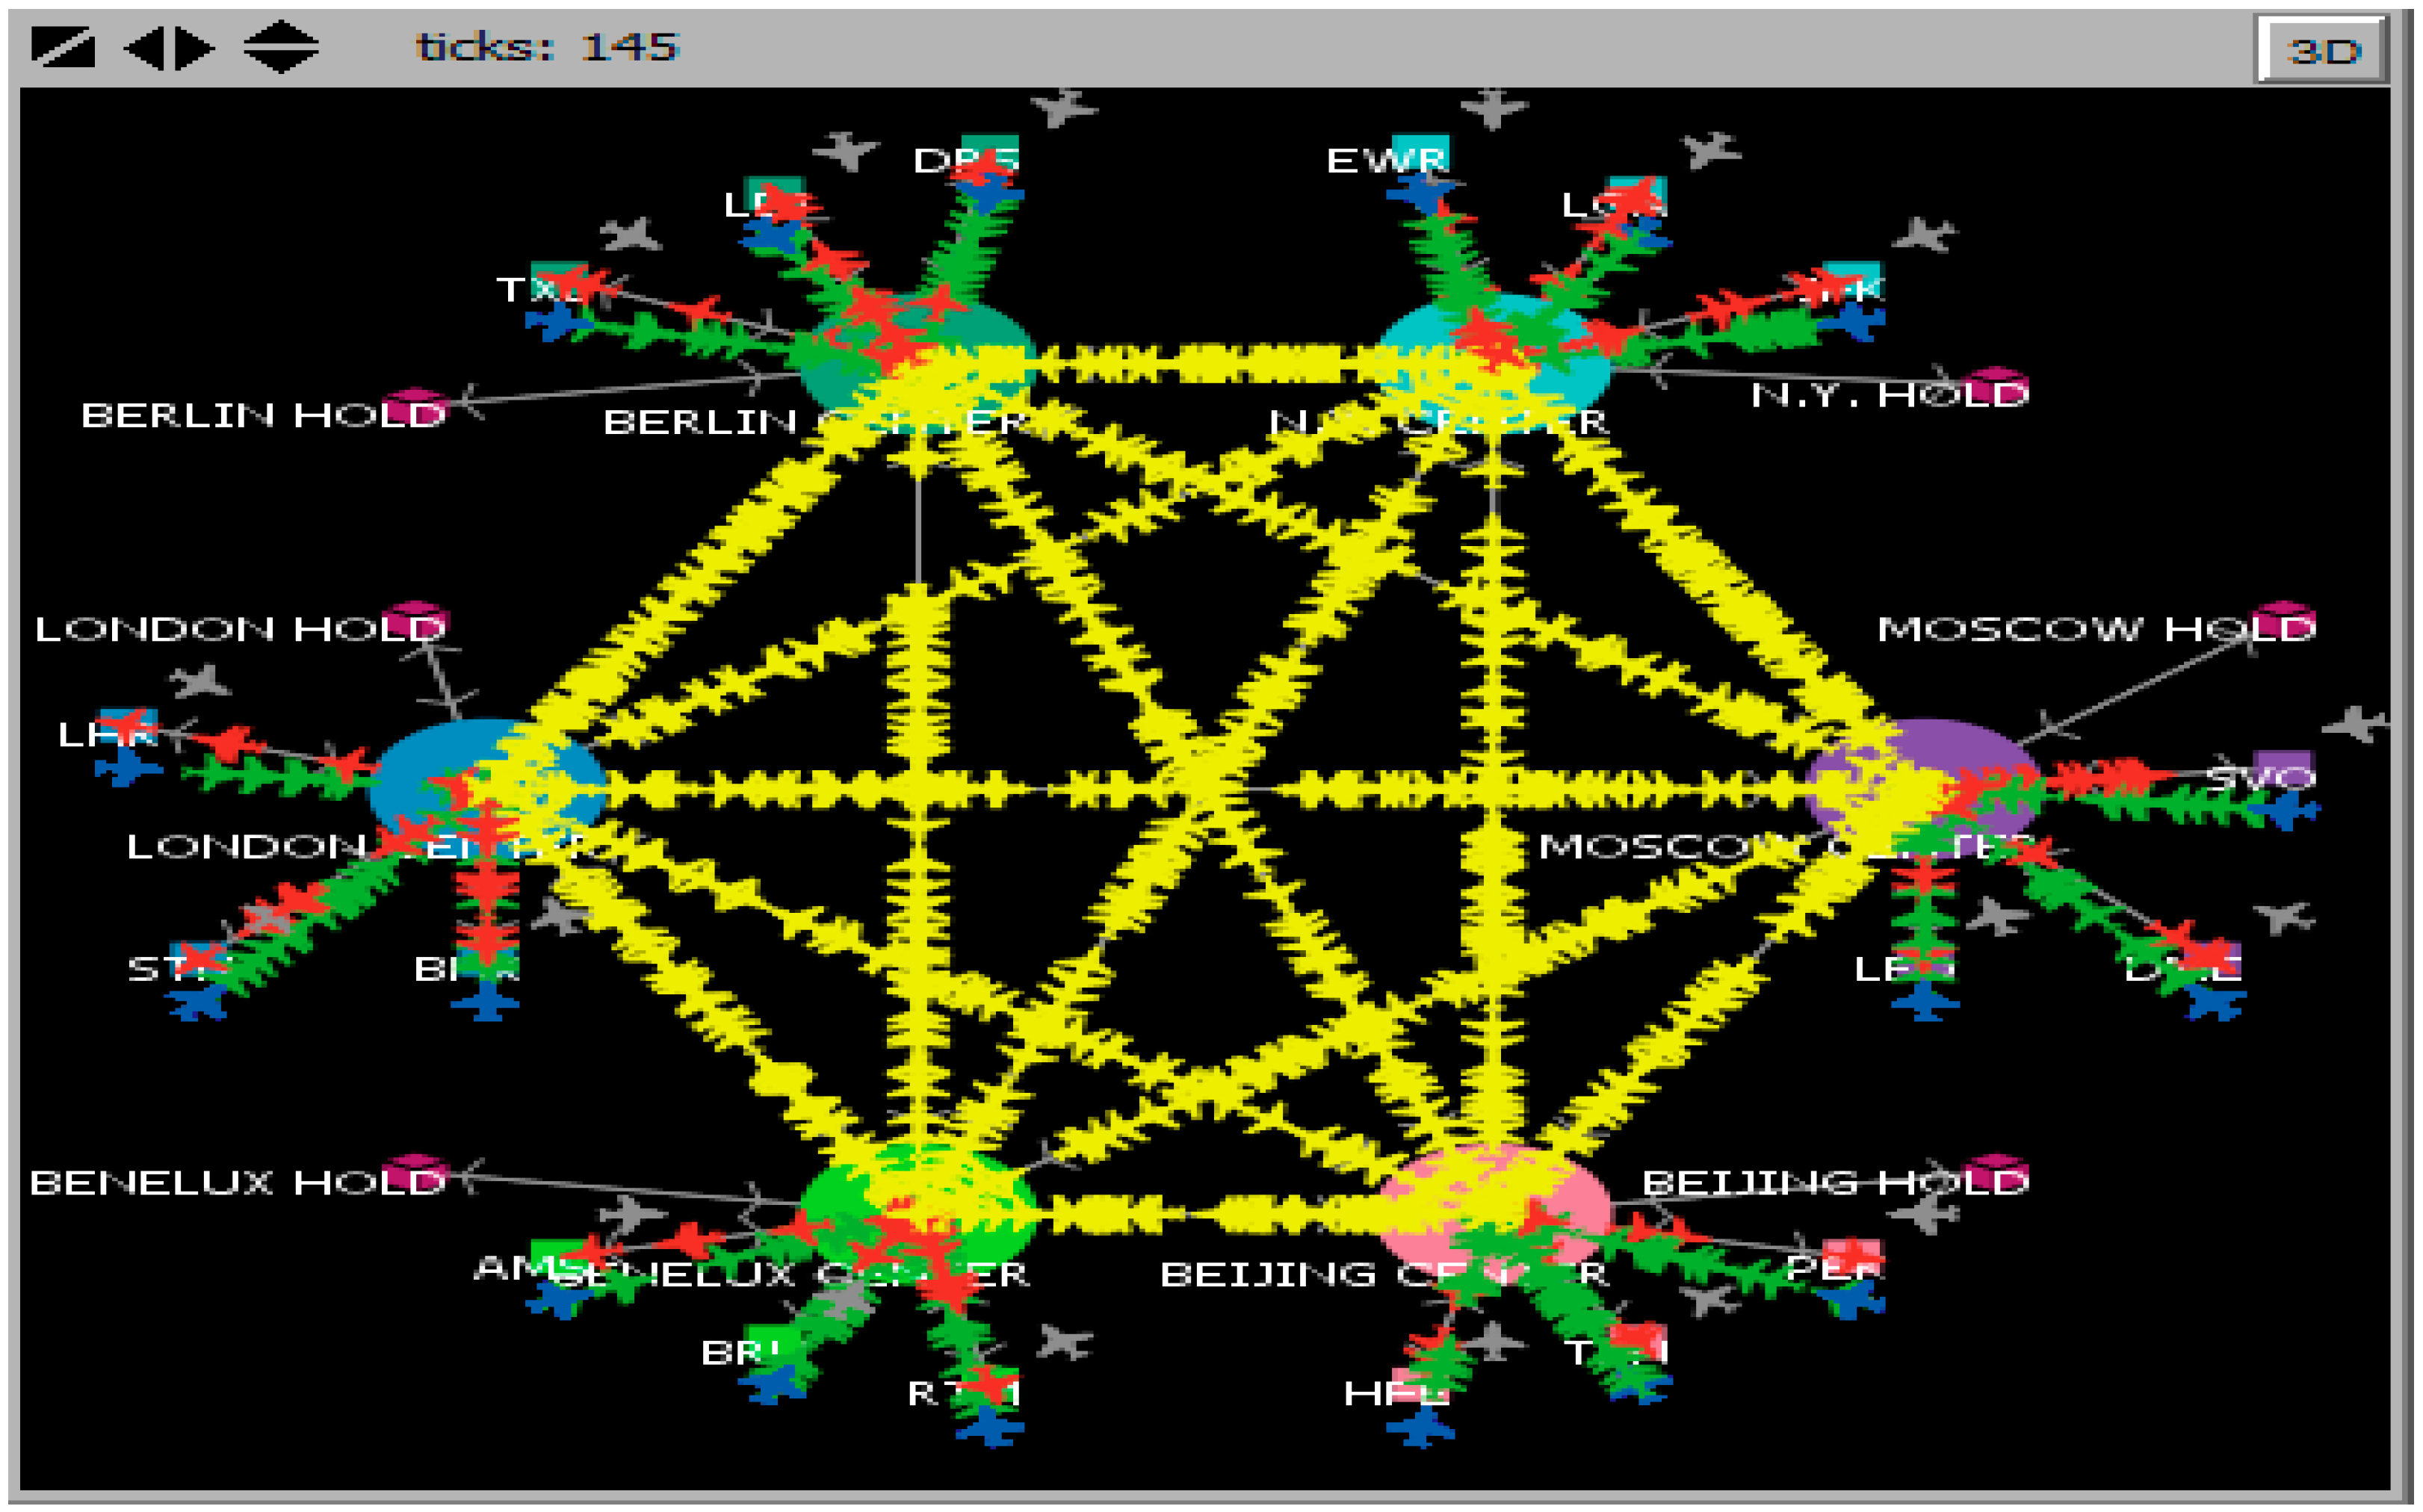
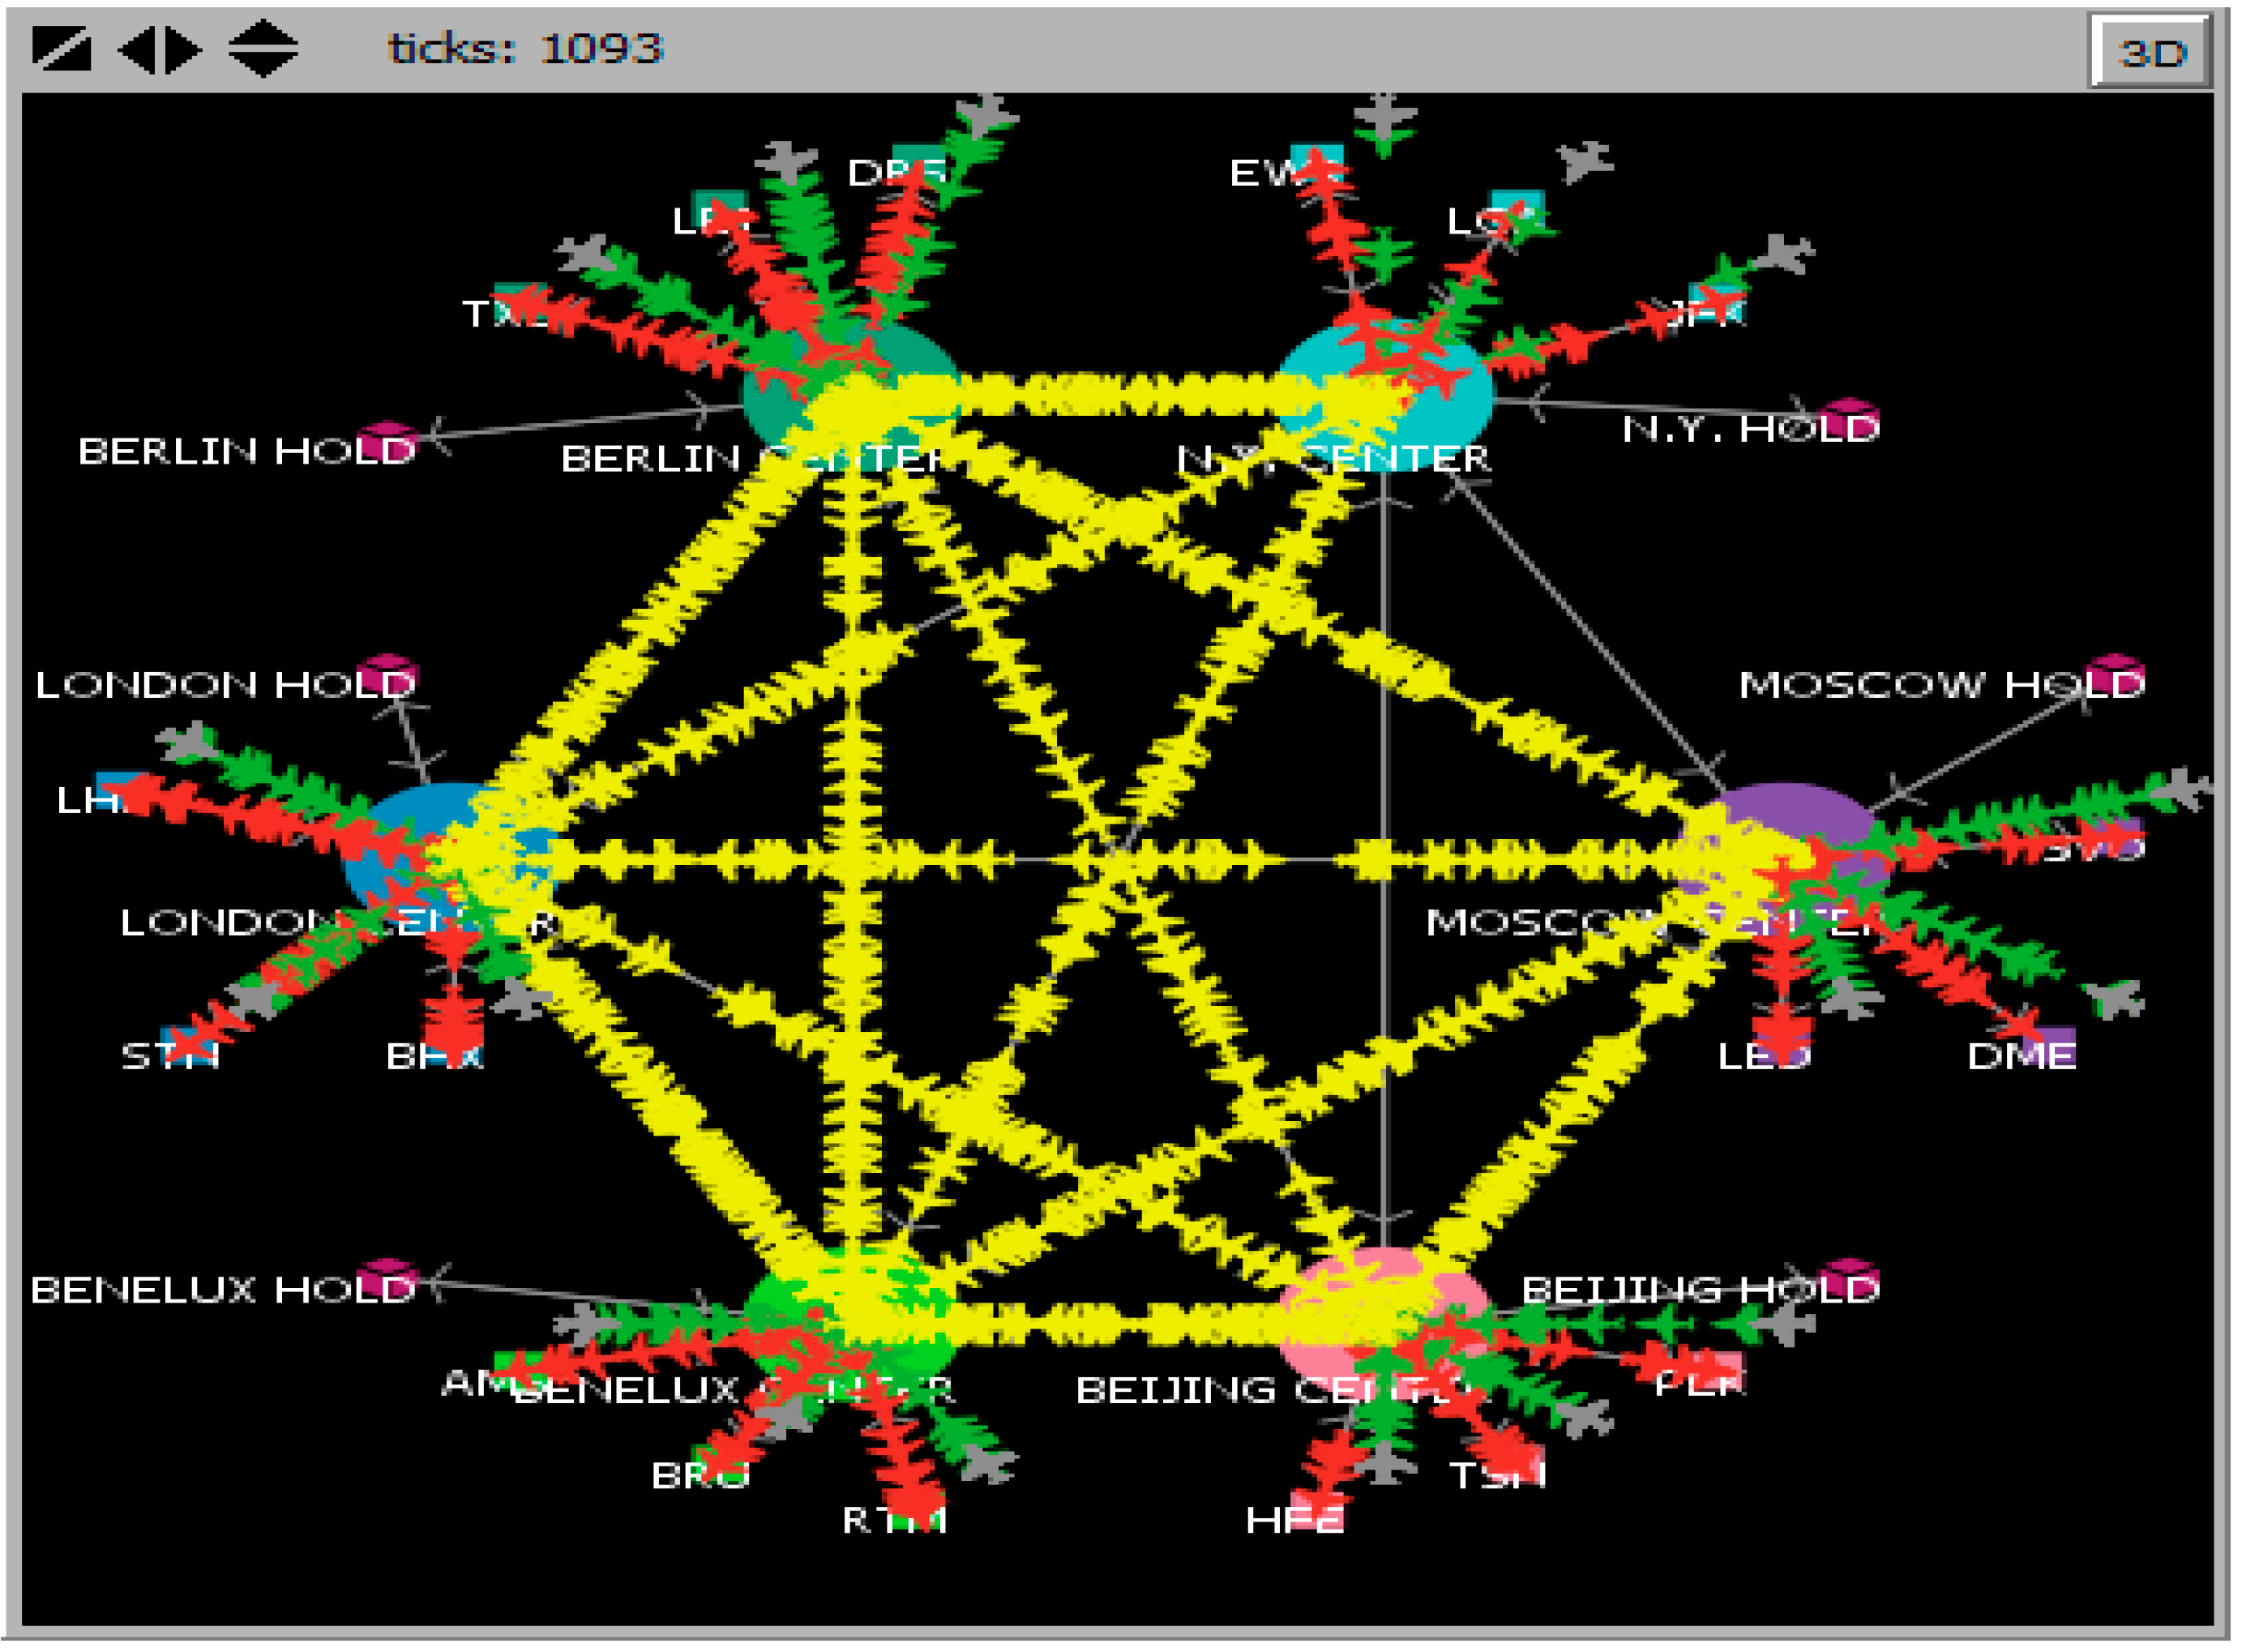
Figure 3 shows a representation of the system’s hub while the model is running with normal parameters. The simulation is very resource intensive, so the baseline capacity of the simulation differs from one instance to the next.
2.3. Assumptions
As mentioned before, the simulation works under key assumptions and abstractions which were necessitated by the limits of processing power and the complexity of the system. Regarding assumptions, key compromises were made in the interests of workability—firstly, each air traffic control systems is greatly simplified and is unified geographically; secondly, flight times and routes are decided randomly, as opposed to through market forces that would give additional complexity to the system by making airports differ in their attractiveness and usefulness; lastly, for the test, we assumed a fixed management capacity without the possibility of replenishment that would run indefinitely-absent, programmed system stressors, which is different from how the system functions in reality, resembling a cyclical pattern dependent on other functions. The system is limited by its lack of nuance in representing the flow of processing capacity, as well as a larger palette of decisions and agent states on the part of the airplane agents. However, as is presented in the next section, the results illustrate not just the importance of space assets or space phenomena in system’s functioning, but in maintaining a high functionality.
There are six tests which were conducted within the Netlogo system after it started running and had achieved a baseline functioning. Tests are run by modifying the operating parameters in real time to represent the effects of the disruptive event. The six tests provide results for the following scenarios:
An average-level solar storm is detected in time by space probes. Mitigation measures are put in place to avoid issues, but polar flights need to be canceled due to safety concerns and the lack of communications [
47]. The system functions as normal, except for the cancelling of all flights between New York, and Beijing and Moscow regions for one day.
A significant cyber-attack renders the NavStar (GPS) network inoperable. The New York region is inoperable until repairs are made. Due to Galileo’s interoperability with the Glonass system, the European regions are unaffected, as is the Moscow region. However, the Chinese Beidou Global Navigation Satellite System is incomplete, and the Beijing region is reliant on GPS services. While still operable, the region is running at reduced capacity and with reduced characteristics, to prevent accidents.
A major solar storm partially degrades GNSS and communications services, among others. Every center remains functional but is running at a reduced capacity in accordance with its in-built resilience and other measures. The US was among the most vulnerable because of the Automatic dependent surveillance—broadcast (ADS–B) system uses: 65% lower capacity, 50% extra waiting time, and 20% less speed. The European centers had the most redundant infrastructure, including ground-based amplification systems and the Eurocontrol organization; therefore, 40% capacity reduction, 30% delays, and 10% speed reduction. Moscow has NY levels of performance for one day, until the military amplification stations for GNSS start up and they reach European levels. China stops all flights for a day, until it reaches European levels of functionality.
Vesuvius erupts, in an incident like the Eyjafjallajökull eruption. Only Berlin and Moscow centers are affected. Berlin has access to the International Disaster Center (Built in 2000 to provide emergency services. It contains numerous satellites, giving it global coverage via the USA (Landsat 5 and 7, EO-1, IKONOS, GeoEye, Quickbird-2, and Worldview 1 and 2), India (Cartosat-2), ESA (Envisat), Canada (Radarsat-2), South Korea (Kompsat 2), Germania (Terra SAR X, RapidEye), France (Spot 4 and 5), and China (HJ), etc. It proved itself in 2012, during the Fukushima crisis, when Japan lost its main Earth Observation satellite, ALOS, to a spontaneous malfunction [
48].) and the Copernicus Emergency Management Services. Berlin has a 40% capacity reduction, 20% delay increase, 10% speed decrease, and 2 days’ recovery time. Due to geopolitical conflicts, Russia is under sanctions so cannot acquire external satellite services, while its own systems have been the target of a cyber-attack campaign, so it must be conservative to maintain safety margins. Moscow has a 60% capacity reduction, 40% increase in delay, and 30% decrease in speed.
Simultaneous cyber-attacks on all European centers, rendered vulnerable by the homogenization of systems and practices as part of the European Programme for Critical Infrastructure Protection. The three centers have reduced capacity, but in different measures, reflecting local conditions, training, and confidence.
After a heating up of geopolitical conflicts in the South China Sea, the US decides to unilaterally degrade the GPS signal for regional consumers. Only Beijing is affected, because of Beidou’s intermediary capacity.
3. Results
The results of the six tests are summarized in
Table 1. The values for the equilibrium points of the planes in the air are approximated, as their variance settles within a relatively narrow band. The purpose of the simulation was not to accurately model the damage, given the constraints, but to highlight the systemic impact of the risks from disruption of space systems or of the space-mediated and specific risks, using the scenarios to produce a variety of changes in the model.
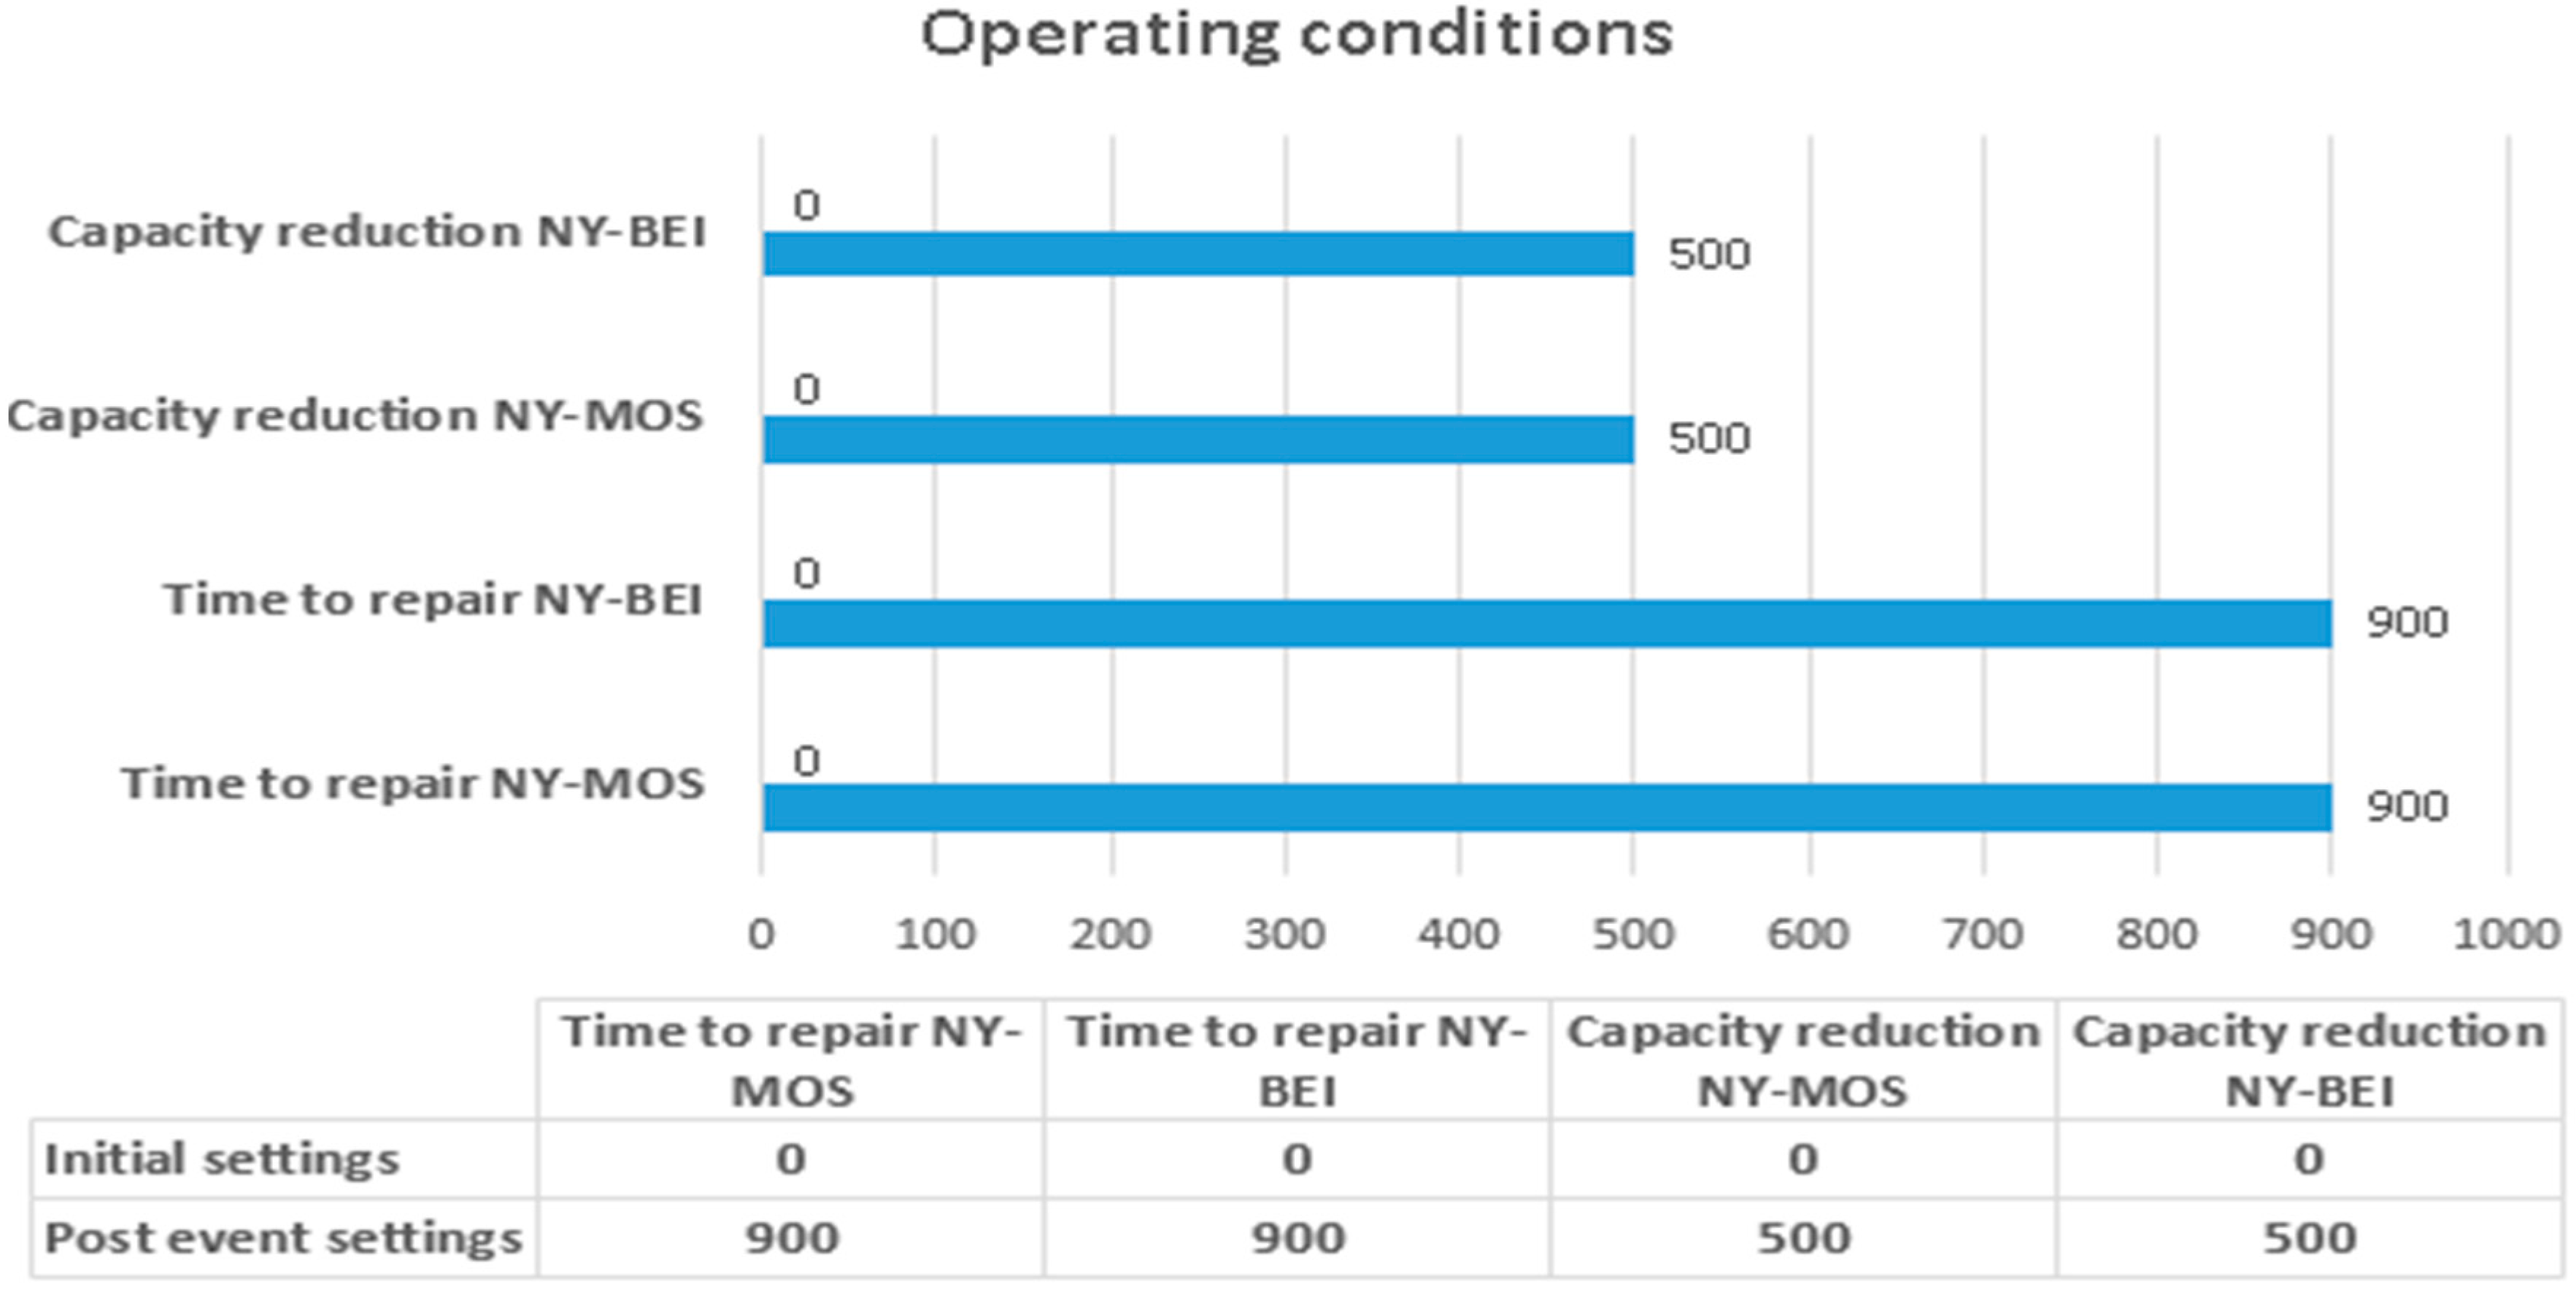
Test 1 describes a total shutdown of transport between the New York hub, and the Moscow and Beijing hubs because of the radiation effects of a solar flare, which led to the exit from the system of around 30% of the planes, as they could not be accommodated at all within the flow of the other centers. This is a straightforward issue, where the assumption is that the actual technological systems have been hardened or shielded against solar storm effects, such as geomagnetically induced currents, but the decision-makers are exercising prudence regarding the radiation effects on human beings and the loss of radio communications over polar areas, which are underserved by satellite systems.
Test 2 pointed a cyber-attack on the Navstar global navigation satellite system of the US (otherwise known, generically, as the GPS system). The control center located in the US was disrupted completely and the Chinese one was disrupted partially, while the European and Russian centers could continue their traffic between them. The test highlighted not only the vulnerability to GNSS disruption, but also the issue of geopolitics, as the scenario was built keeping in mind the various GNSS systems and access to them, with Russia having the GLONASS system; Europe having the Galileo system, which is interoperable with both GPS and GLONASS for added resilience; and China having the (at the time) incomplete Beidou system as a partial back-up that requires better margins of security for coordinating the use of air corridors. Within the simulation, 22.4% of the flights were canceled or experienced delays, but none were stranded while flying and had to exit the system entirely.
Test 3 describes a solar storm affecting avionics and various satellite systems (GNSS, weather, etc.). The various centers react differently, with variations in the lowering of the capacity of each center, along with other indicators, such as the rise in standby times for flights. The scenario justifies the different reactions with references to multiple issues—the US center is dependent on the “automatic dependent surveillance–broadcast” system, which is vulnerable to this type of disruption; the European centers benefited from having extensive pre-existing ground infrastructure for signal boosting, communications, and so on; and Russia was at the same level as the rest of the Europeans, having activated military amplification sites for GNSS signals. However, China spent the first half of the crisis period affected by a terrible air accident which led to the shutdown of all flights and then a tentative resumption of flights with the Moscow center alone, until the solar storm was over, assuming no lingering damage to space systems had occurred. A total of 62% of the flights were ultimately affected by delays or cancellations.
Test 4 emphasizes an eruption of a volcano (Vesuvius, in a nod to the Eyjafjallajökull eruption in 2010) that affected the Moscow and Berlin centers, but none of the others. The Berlin Center was able to maintain a partial flight capacity, when the physical threat of dust was not immediate, through its use of Copernicus satellite observation data and that provided under the International Charter on “Space and Major Disasters” to monitor the ash cloud and help pilots avoid it. However, the Moscow Center was more greatly affected, on account of sanctions which restricted its ability to access the systems of other countries, and system disruption stemming from cyber-attacks that began as the crisis precipitated. Almost 18% of the system’s flights were affected by this situation, until normalcy was resumed.
Test number 5 involves cyber-attacks against centers in the EU (communications, and the validity and accessibility of data from remote sensing, etc.), which the scenario posits was chosen as a target because of the EU-led homogenization of security systems, cyber standards, and other elements related to cybersecurity, creating a vulnerability in itself. The differentials in training, responsiveness and overall resilience between the different centers led to diverse outcomes in regard to drops in capacity. Overall, the entire system lost innate capacity, but the actual flow of airplanes did not result in disruptions of the kind that the model measures, such as delayed, cancelled, and detoured flights. Fewer flights simply took place, and the system settled at a lower equilibrium number of flights. The purpose of the scenario was to show how the use of space systems increases the carrying capacity of critical infrastructures. The lack of provisioning of critical space services results in decision-makers lowering the intensive use of a critical infrastructure as an adaptation to the new situation in regard to safety risks. Properly managed, this constitutes a graceful decline of system functioning and is a quality of resilient systems, until full functioning may be restored.
Test number 6 presents another geopolitical conflict affecting the functioning of the critical-infrastructure system-of-systems. In the context of the scenario, China is under pressure from sanctions due to the South China Sea tensions, and one measure taken has been to degrade its use of the GPS system, under the assumption that the Beidou system is incomplete. Europe, Russia, and the US are not affected, only China is, and only for a limited time, since this was a move for political pressure. Almost 22% of system flights are affected. The concept behind the scenario is to emphasize not only the technical risks, but also the political risks of a critical dependence on space systems under the control of another actor. Most GNSS systems operate under policies set by the military forces of the respective countries. This is the reason why the USSR began to build the GLONASS system, later completed by Russia, and why China began the Beidou system, especially in the age of smart munitions guided by GNSS systems. The main exception to this rule is the European Galileo system, whose policies forbid degrading signals to legitimate users, regardless of nationality, and the Japanese Quasi-Zenith Satellite System, which is a limited GNSS signal booster centered on Japan and its surrounding areas. Countries without any GNSS capabilities must factor the political risk into consideration, in addition to all others stemming from the critical dependence on space systems.
During test 1, the interconnections New York–Moscow and New York–Beijing, respectively, marked the results of the system, becoming a point of instability in the system by overloading the other participants.
During test 2, the number of canceled flights was almost double the number of flights with delays.
During test 5, the proportional reduction in capacities across the board led to a situation where there were no delayed, canceled, or detoured flights. However, the system lost overall capacity, which proves the reliance on space systems for the intensive exploitation of existing infrastructure, especially in transport.
The input data for test 1 were the following:
Control centers—6;
London Capacity—500;
Number of London Airports—3;
Benelux Capacity—500;
Number of Benelux Airports—3;
Berlin Capacity—500;
Number of Berlin Airports—3;
New York Capacity—500;
Number of New York Airports—3;
Moscow Capacity—500;
Number of Moscow Airports—3;
Beijing Capacity—500;
Number of Beijing Airports—3;
Maximum time in standby—50;
Speed—100;
Maximum standby capacity—500;
Time until plane leaves—300;
All these elements remained the same post event. The operating conditions before and after test 1, that were obtained after running the model, are illustrated in
Figure 4.
A visualization of test 1 using Netlogo can be seen in
Figure 5.
4. Discussion
The six tests represented various scenarios, which reflect a high number of permutations for system variables. Several aspects were revealed by the tests and the system’s response:
The effects of the partial or total disruption of space capabilities;
The regenerative, absorptive, and restorative properties of a resilient system [
49] in mitigating the effects of critical space infrastructure disruption;
The possibility of cascading disruptions within interconnected systems;
Effects are likely to be global and with high impact.
In [
49], the regenerative, absorptive, and restorative properties of a resilient system are defined as:
Absorptive capacity—the endogenous quality of a system to absorb the effects of perturbances in the environment or the system-of-systems with minimal impact on the functioning of the system. Such systems are robust and feature redundancies. An example is a petrochemical refinery which suffers a raw materials supply shock, but has enough reserves on-hand to continue processing for some time, allowing the upstream system-of-systems components time to recover, potentially avoiding any downstream issues.
Restorative capacity—the system is repaired easily and in a dynamic manner. System functioning is restored, but changes are permanent, rather than the temporary fixes and policies that may be adapted to counteract the environmental adversities. A facility may use its downtime to adopt new technologies, new processes, and new raw material inputs.
Adaptive capacity—the endogenous quality of a system to reorganize itself to maintain or recover full-functioning after the manifestation of a negative occurrence. One way in which this is achieved is through partial or full substitutability of resources and systems. A power plant may switch to different fuels and an energy consumer may switch to his own hydrocarbon fuel generators.
Simulating other types of critical infrastructure interactions would likely be amenable to measurements regarding scale of effects, from local to global levels. However, when it comes to critical space infrastructures, which are few and have a wide range of users and numerous beneficiaries, all disruptions have global effects which are likely mitigated regionally or nationally, on a case by case basis. This is because governance activities, especially in the events of crisis and emergency management, [
50] take place primarily at the level of the competent national authorities within their own jurisdictions [
9]. Therefore, considerations of the classification of CSI disruptions effects based on geographic, sectorial, and logical or informational/cybernetic criteria (in addition to the less relevant social and political criteria, as defined in [
9]), are less important for establishing the breadth of impact. Severity, however, is still an important area of research, where modeling and simulation play a significant role.
Despite the inherent flexibility of the system, it is still lacking in regard to the constraints under which it operates, where the natural ability of the system to self-organize to respond to threats by having key stakeholders coordinate to reduce the impact and increase resilience is not present unless it is assumed. This would be codified as a scenario where system stressors are introduced serially, each having an impact and then leading, through anti-fragility principles, to a certain increase in overall resilience, as opposed to the separate and discrete scenarios analyzed in this paper.
4.1. Limitations
There are a few limitations to the program, stemming in equal parts from the limitations of hardware for running the model, and the need to limit the complexity of the model to better illustrate the issues (the proof of concept) we wanted to highlight with the scenarios. The main limitation is the small number of system actors. There is a maximum of 2500 planes travelling between 18 airports with six separate control centers. The fact that there are fewer control centers than airports, which we justified by creating six regional airport groupings, is an indication of our concern with personal hardware limitations. The control centers also start off with the same coordination capacity for the planes, which is obviously unrealistic, profoundly so, as airports differ in terms of plant, organization, hardware, geography, etc. At the same time, there are obviously more airports in the regions, which would have an impact on the model, since rerouted flights could still be partially successful. It should be pointed out that air traffic management is a much more complex affair than the model makes it out to be. However, as mentioned in
Section 1.1, a study by [
21] showed that there are significant concentration effects in the global ai transport industry, with 80 key nodes identified. This suggests that the simplified relief of the model presented in this article is not such an insurmountable barrier for obtaining systemically relevant results in a future iteration using the data in [
21].
Secondly, the model also limits the number of states the actor has. A plane is either delayed or in flight, with no other intermediary states or characteristics expressing the nuances of operational issues, which would have been realistic, even if not as relevant for the points we wanted to highlight regarding systemic dependencies on space systems. There are also no intermediary states between a disrupted airport, with lowered or zero capacity, and an airport at peak operability. The airports effectively switch back to optimal operating modes after a set amount of time has passed. We know from the CIP framework literature, that disruptions can have secondary or tertiary impacts which reverberate down the line in sometimes subtle ways, by propagating through a critical-infrastructure system-of-systems. It might even be possible for an airport to never regain its optimal functioning state, through the impact of event externalities, such as the quality of life for citizens, business continuity, investor confidence, investigations by state regulators, loss of reputation, etc.
The model itself is built around binary thinking, in which an event has either taken place, with drastic consequences, or has not taken place at all. There is little room in the model for gradual declines in infrastructure capacity, which would also better highlight differences in resilience, including the capacity for graceful declines, the management of system margins, etc. We acknowledge such differences between the regions when we formulate the inputs of our scenarios, and one control center suffers a lower loss of capacity than another, and maybe a faster recovery time. A truly complex model would take into account personnel training, and other such factors, which are crucial in terms of the overall systemic resilience. Generally, adding such elements to the model would lower damages, as these are basically modifiers, and the system is prone to overestimating the impact of events; planes are written off, damages are total, etc.
There are a few elements with which the model itself could be improved, though at the cost of simulation performance, because of the exponential growth in complexity: more control centers and airports; a redefinition of the landscape to conform to the hub and spoke model, that is the actual praxis of the air transport industry; the introduction of distances and speeds as system variables; individualizing system elements; and lastly, the actors’ behavior could be modified to become more realistic.
5. Conclusions
Using the free access software Netlogo and associated resources, a model was developed on the framework of agent-based modeling, placing 18 airports in six regions on a global level, with thousands of simulated aircraft traveling between them. During the normal functioning of the system, six tests were run, thus exemplifying the relevance of space issues, and especially, space infrastructure issues, to the functioning of a global, critical-infrastructure system-of-systems. Despite the limitations and assumptions made in the building of this model, its results suggest that significant impacts would result from disruptive events, with the potential for cascading disruptions within the system, and beyond the system under analysis, and into the wider system-of-systems. Tools such as this model are useful to policy- and decision-makers, not only to protect existing critical infrastructures, but also to adequately source future risks, vulnerabilities and threats and design and build new infrastructures (whether a new airport or a distributed infrastructure chain like the current Belt and Road Initiative) with resilience in mind.
In addition to the statistically significant results of the tests, proving that the air transport infrastructure registers a critical dependence on space systems, some of which may be termed critical space infrastructures, there is another insight that emerges from these tests: the nature of the flow between critical space infrastructures and the wider system-of-systems is, at the moment, confined to the realm of data, not matter. However, in certain respects made evident by the context in which we are placed, we may posit that space systems are a critical upper component for the global critical-infrastructure system-of-systems. However, the delineation of a space system as being an asset placed beyond the arbitrary boundary between space and Earth’s atmosphere, especially with the anticipated rise of high-altitude platforms, becomes problematic. Rather, space systems, at least those in Earth’s orbit, are a natural extension of the information sphere that has encompassed the planet and could be seen not as a new critical infrastructure, as much as an extension of the data sphere into specific, space-using assets. Space systems are not just mediators of data gathering and transmission, but nodes for information necessary for systematic (self)governance. Gheorghe et al. [
51] observed that energy companies are increasingly not just administering a critical energy infrastructure for producing and transporting electricity, but also information, which is useful to consumers, markets, or regulators, in addition to the information required for managing the system itself. This was called the energy + information paradigm [
51] and it was the product of a historical shift in how the energy-critical infrastructure functioned in the wider system-of-systems. We may posit a similar model, of space + information, to describe the intricacies of the rapidly growing prominence of space systems, aided by technological developments which reduce cost barriers, increase capabilities, and increase capacities.
Despite the limitations that were detailed in
Section 4.1, the model developed by the authors is a step forward in certain key ways: firstly, in a period of increasing tool complexity and costs for modeling and simulation projects, it shows that a frugal approach can yield significant results with usefulness for policy- and decision-makers; secondly, the model was subjected to six scenarios that were tailored to specifically highlight key facets of space dependency, which represents important added value compared to the existing modeling attempts in the literature.
Ultimately, this reliance on space systems is a double-edged sword. New efficiencies and capabilities are gained, some with direct applications to the governance of other risks, vulnerabilities, and threats, but at the cost of exposure to a new spectrum of system stressors and disruptors. Governance is vital, as the trend itself is unmistakable, and that is that governance, rather than the technical and technological issues, will prove to be the greatest challenge, as it requires collective action on the part of stakeholders.


