Impact of High-Speed Rail on Cultural Tourism Development: The Experience of the Spanish Museums and Monuments

 , , and
Abstract
:1. Introduction
2. Literature Review
3. The Methodology
- DTij represents the tourist demand between “i” and “j” where “i” is destination and “j” is the origin. In this study, the yearly number of tourists who visit museums and monuments (“Visitit” variable) is considered as the indicator of its demand. Data was obtained from the following agencies: State museums and monuments: www.patrimonionacional.es and www.mcu.es; regional and municipal ownership museums and monuments: www.gencat.cat for museums in Cataluña and www.juntadeandalucia.es for museums in Andalucía; municipal ownership museums and monuments: www.madrid.org for museums in Madrid, www.barcelona.cat for museums in Barcelona, and www.jcyl.es for museums in Castilla and Leon; and private ownership museums: www.cabildocatedraldecordoba.es and www.valencia.es.
- Yj represents the incomes in the origin “j”. The average Spanish GDP per capita deduced from the Spanish National Statistics Institute (INE) is used to measure it, and is available at www.ine.es. The GDP of the rest of the main countries of origin, primarily European, has not been included in the model because a serial correlation was found between them.
- TCij is the travel cost from origin “j” to destination “i”. Its effect could not be measured as the database does not provide the country or the region of origin of tourists.
- RPij is the relative cost, that measures the likely cost of goods to tourists at the destination (such as accommodation, local transportation, food, and entertainment). The difference in the DGP per capita between the European Union (source of most of the travelers) and Spain is represented by the variable “Dif Gdp”, which provides a proxy to the perceived difference of level of prices between these originating countries and the destination.
- The currency exchange rate is represented by ERij. As Euro is the legal currency in both the destination and the majority of the origin countries, this variable was not included.
- QFi stands for the quality factors in destination “i”. The size of the population at the province of destination “POP” and the lagged variable “Visitt–1” have been considered.
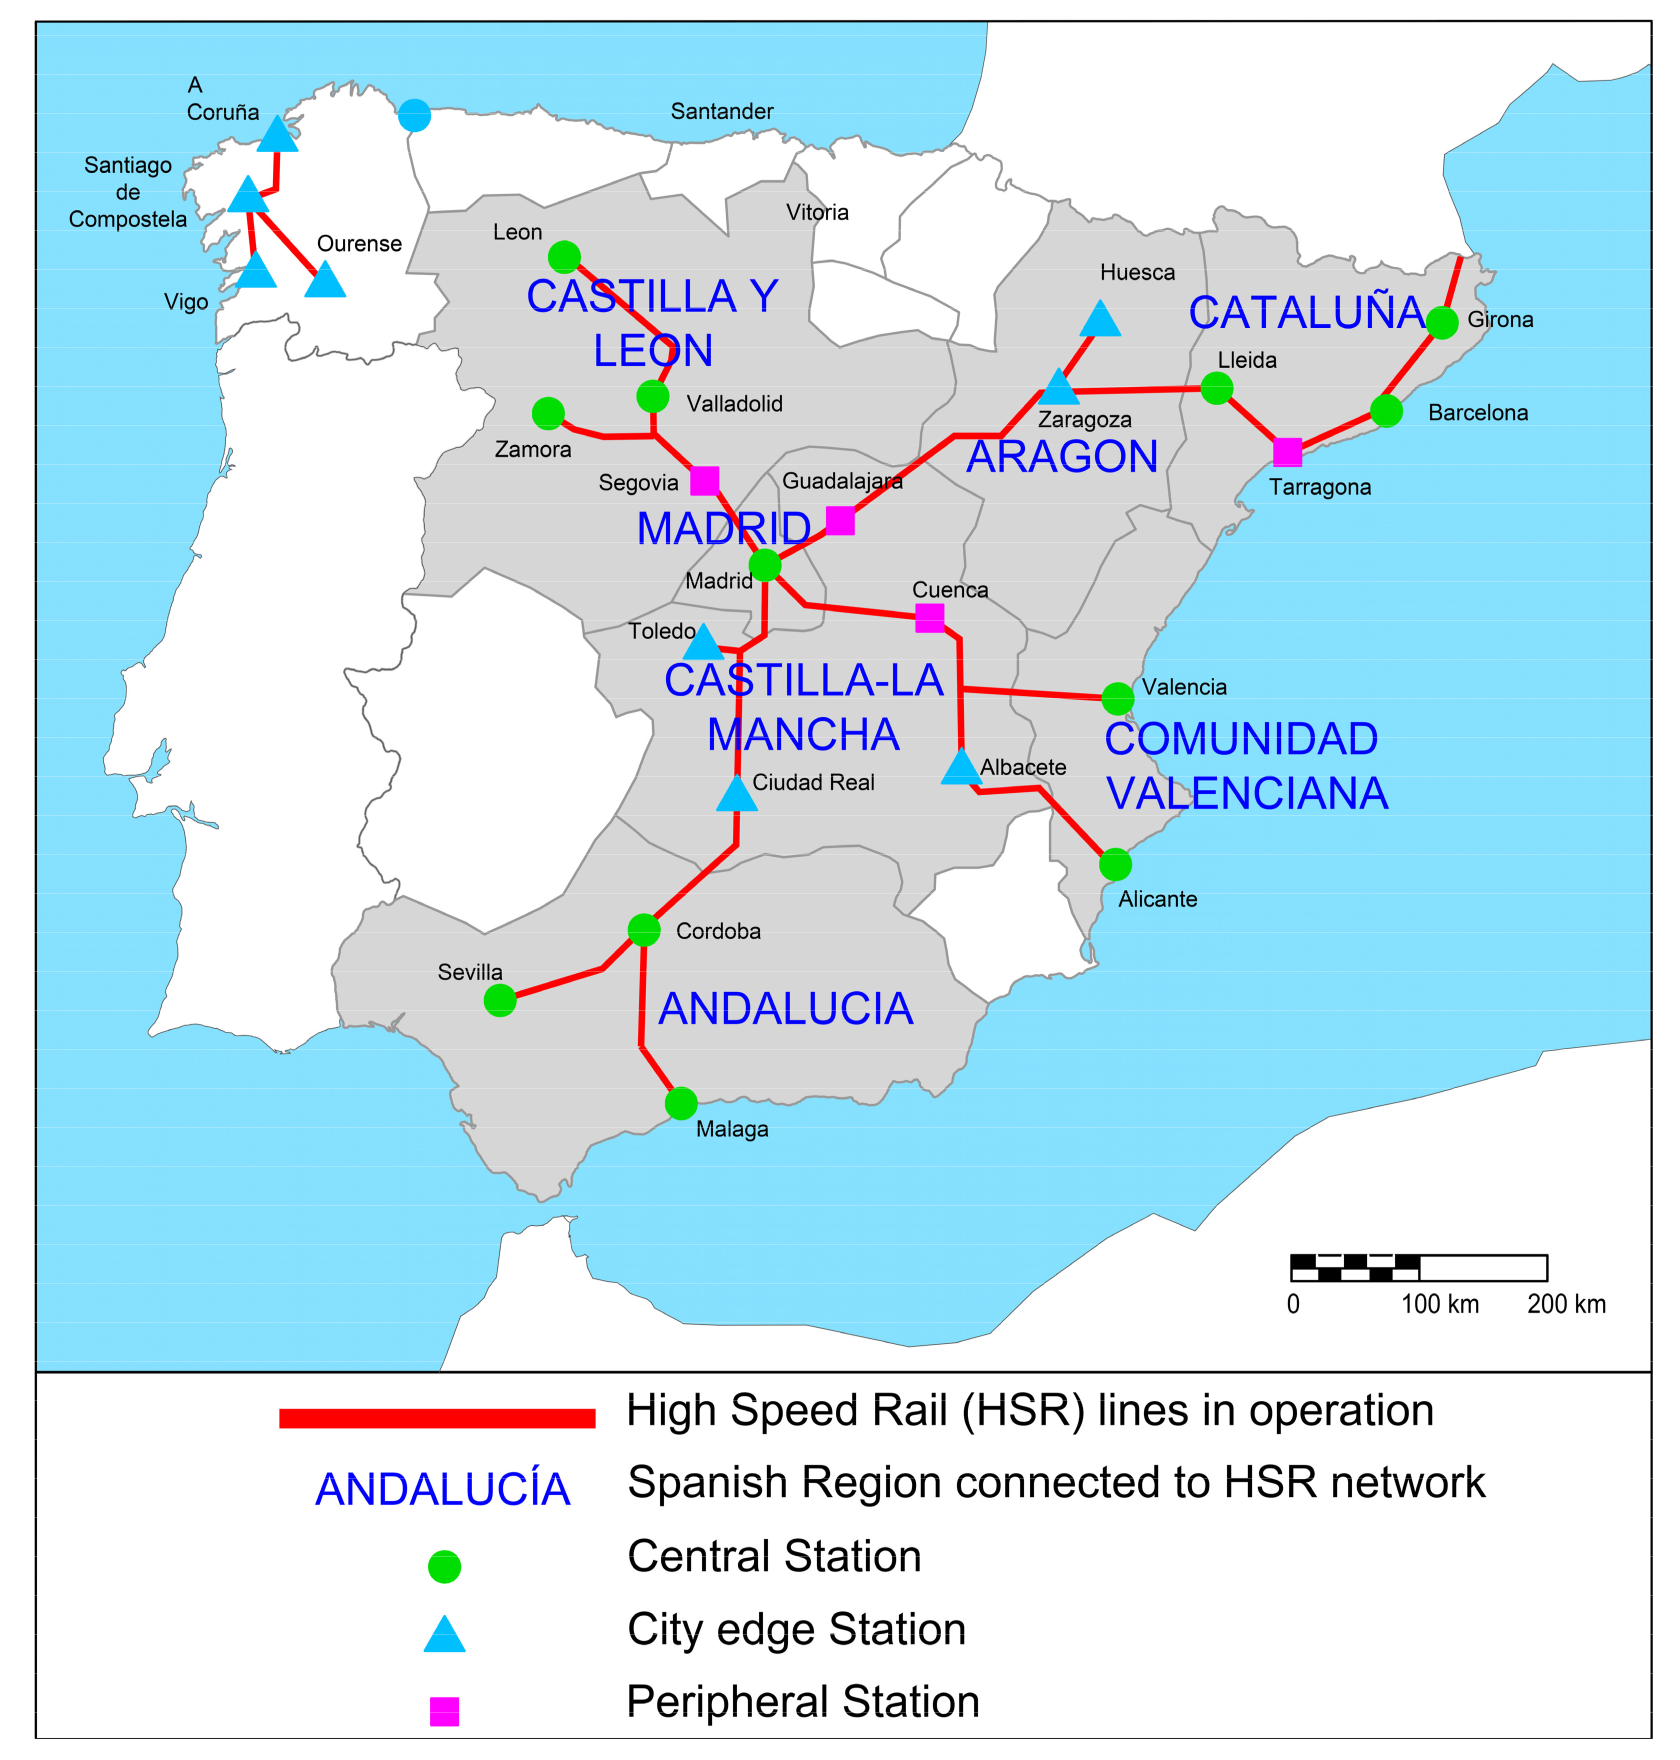
- The policy variables that have been separately considered are as follows: “Hsrt” is a dummy variable that takes a value of 1 if a High-Speed Rail is available at the province of destination, otherwise it takes a value of 0; “Centrt”, “Cedget”, and “Peripht” are dummy variables that take a value of 1 if HSR is available at the province of destination and the station location in the city is central, city edged, or peripheral, respectively; “ST Dist” are dummy variables that take a value of 0 if HSR is not available at the province of destination, otherwise it takes the value of the distance in kilometers “as the crow flies” from the HSR station to the museum considered.
4. Results
5. Conclusions
Author Contributions
Funding
Conflicts of Interest
References
- Betancor, O.; Llobet, G. Contabilidad Financiera y Social de la Alta Velocidad. Estudios Sobre la Economía Española 2015/08; Fedea: Madrid, Spain, 2015. [Google Scholar]
- Coto-Millán, P.; Inglada, V.; Rey, B. Effects of network economies in high-speed rail: The Spanish case. Ann. Reg. Sci. 2007, 41, 911–925. [Google Scholar] [CrossRef]
- Flyvbjerg, B.; Holm, M.K.S.; Buhl, S.L. How (In)accurate Are Demand Forecasts in Public Works Projects?: The Case of Transportation. J. Am. Plan. Assoc. 2005, 71, 131–146. [Google Scholar] [CrossRef] [Green Version]
- Guirao, B.; Campa, J.L. A methodology for prioritising HSR corridors: From U.S. theory to Spanish practice. J. Transp. Geogr. 2014, 35, 95–106. [Google Scholar] [CrossRef]
- Instituto Nacional de Estadística (INE). Cuenta Satélite del Turismo en España; INE: Madrid, Spain, 2018. [Google Scholar]
- Gutiérrez-Domènech, M. Dossier: El turismo, sector de futuro. In Departamento de Economía Europea, Área de Estudios y Análisis Económico; La Caixa: Valencia, Spain, 2014. [Google Scholar]
- UNWTO. Tourist Highligts, 2017 ed.; UNWTO: Madrid, Spain, 2018. [Google Scholar]
- Vizcaíno, M.L. Evolución del turismo en España. El turismo cultural. Int. J. Sci. Manag. Tour. 2015, 4, 75–95. [Google Scholar]
- Spanish Institute for Tourist Studies IET. Movimientos Turísticos de los Españoles (Familitur); 2012 Anual Report; Instituto de Turismo de España: Madrid, Spain, 2013. [Google Scholar]
- Instituto Nacional de Estadística (INE). Resident Tourism Survey; INE: Madrid, Spain, 2019. [Google Scholar]
- Spanish Culture and Sports Ministry. Cultural Culture Database (CULTURABase); Spanish Culture and Sports Ministry: Madrid, Spain, 2019.
- Spanish Institute for Tourist Studies IET. Encuesta de Movimientos Turísticos en Fronteras (Frontur); 2012 Anual Report; Instituto de Turismo de España: Madrid, Spain, 2013. [Google Scholar]
- Instituto Nacional de Estadística (INE). Encuesta de Movimientos Turísticos en Fronteras (Frontur); INE: Madrid, Spain, 2019. [Google Scholar]
- World Economic Forum. The Travel & Tourism Competitiveness. Report 2017. Paving the Way for a More Sustainable and Inclusive Future; World Economic Forum: Geneva, Italy, 2018. [Google Scholar]
- Chew, J. Transport and tourism in the year 2000. Tour. Manag. 1987, 8, 83–85. [Google Scholar] [CrossRef]
- Khadaroo, J.; Seetanah, B. Transport infrastructure and tourism development. Ann. Tour. Res. 2007, 34, 1021–1032. [Google Scholar] [CrossRef]
- Prideaux, B. The role of the transport system in destination development. Tour. Manag. 2000, 21, 53–63. [Google Scholar] [CrossRef]
- Khan, S.A.R.; Qianli, D.; SongBo, W.; Zaman, K.; Zhang, Y. Travel and tourism competitiveness index: The impact of air transportation, railways transportation, travel and transport services on international inbound and outbound tourism. J. Air Transp. Manag. 2017, 58, 125–134. [Google Scholar] [CrossRef]
- European Union. A European High-Speed Rail Network: Not a Reality but an Ineffective Partchwork; 2018 Special Report Nº19; European Union: Brussels, Belgium, 2018. [Google Scholar]
- Rugg, D. The Choice of Journey Destination: A Theoretical and Empirical Analysis. Rev. Econ. Stat. 1973, 55, 64. [Google Scholar] [CrossRef]
- Shyr, O.; Chao, C.; Huang, C. Impacts of new transportation systems on tourism behavior: The experience of high-speed rail. Int. J. Transp. Econ. 2015, 42, 89–110. [Google Scholar]
- Delaplace, M.; Pagliara, F.; Perrin, J. Does High Speed Rail services influence tourists’ choice? Some concerns from Paris and Roma and other linked cities. In Paper Presented at the 53rd Congress of the European Regional Science Association: “Regional Integration: Europe, the Mediterranean and the World Economy”; RePEc: Palermo, Italy, 2013. [Google Scholar]
- Wang, X.; Huang, S.; Zou, T.; Yan, H. Effects of the high speed rail network on China’s regional tourism development. Tour. Manag. Perspect. 2012, 1, 34–38. [Google Scholar] [CrossRef]
- Yin, P.; Pagliara, F.; Wilson, A. How Does High-Speed Rail Affect Tourism? A Case Study of the Capital Region of China. Sustainability 2019, 11, 472. [Google Scholar] [CrossRef]
- Guirao, B.; Soler, F. Impacts of the new high speed rail services on small tourist cities: The case of Toledo (Spain). WIT Trans. Ecol. Environ. 2009, 117, 465–473. [Google Scholar]
- Masson, S.; Petiot, R. Can the high speed rail reinforce tourism attractiveness? The case of the high speed rail between Perpignan (France) and Barcelona (Spain). Technovation 2009, 29, 611–617. [Google Scholar] [CrossRef]
- Bazin, S.; Beckerich, C.; Delaplace, M. Desserte ferroviaire à grande vitesse, activation des ressources spécifiques et développement du tourisme: Le cas de l’agglomération rémoise. Belgeo 2010, 1–2, 65–78. [Google Scholar] [CrossRef]
- Wang, W.-C.; Chou, L.-S.; Wu, C.-C. Impacts of new transportation technology on tourism-related industries—The Taiwan High Speed Rail. World Leis. J. 2010, 52, 14–19. [Google Scholar] [CrossRef]
- Bazin, S.; Beckerich, C.; Delaplace, M. High-Speed railway, service innovations and urban and business development. Econ. Manag. Tour. Trends Recent Dev. 2011. Universidade Luisiada Editora, Collecçao Manuais. Hal-02079165. [Google Scholar]
- Albalate, D.; Bel, G. High-Speed Rail: Lessons for Policy Makers from Experiences Abroad. Public Adm. Rev. 2012, 72, 336–349. [Google Scholar] [CrossRef]
- Chen, Z.; Haynes, K.E. Tourism Industry and High Speed Rail—Is There a Linkage: Evidence from China’s High Speed Rail Development. SSRN Electron. J. 2012. [Google Scholar] [CrossRef]
- Bazin, S.; Beckerich, C.; Delaplace, M. Desserte TGV et villes petites et moyennes. Une illustration par le cas du tourisme à Arras, Auray, Charleville-Mézières et Saverne. Les Cahiers Sci. Transp. AFITL 2013, 63, 33–61. [Google Scholar]
- Delaplace, M.; Pagliara, F.; La Pietra, A. Does high-speed rail affect destination choice for tourism purpose? Disneyland Paris and Futuroscope case studies. Belgeo 2016, 3, 1–23. [Google Scholar]
- Delaplace, M.; Pagliara, F.; Perrin, J.; Mermet, S. Can High Speed Rail Foster the Choice of Destination for Tourism Purpose? Procedia Soc. Behav. Sci. 2014, 111, 166–175. [Google Scholar] [CrossRef] [Green Version]
- Yan, Y.Q.; Ye, B.H.; Zhang, H.Q. Assessing the Impacts of the High-Speed Train on Tourism Demand in China. Tour. Econ. 2014, 20, 157–169. [Google Scholar] [CrossRef]
- Sánchez Ollero, J.L.; García Pozo, A.; Marchante Mera, A.J. Una aproximación al impacto socioeconómico de la alta velocidad ferroviaria en Andalucía. Bol. Asoc. Geogr. Esp. 2014, 64, 341–356. [Google Scholar] [CrossRef]
- Wang, D.; Qian, J.; Chen, T.; Zhao, M.; Zhang, Y. Influence of the High-Speed Rail on the Spatial Pattern of Regional Tourism—Taken Beijing-Shanghai High-Speed Rail of China as Example. Asia Pac. J. Tour. Res. 2014, 19, 890–912. [Google Scholar] [CrossRef]
- Chen, Z.; Haynes, K.E. Impact of high-speed rail on international tourism demand in China. Appl. Econ. Lett. 2015, 22, 57–60. [Google Scholar] [CrossRef]
- Pagliara, F.; La Pietra, A.; Gomez, J.; Vassallo, J.M. High Speed Rail and the tourism market: Evidence from the Madrid case study. Transp. Policy 2015, 37, 187–194. [Google Scholar] [CrossRef] [Green Version]
- Albalate, D.; Fageda, X. High speed rail and tourism: Empirical evidence from Spain. Transp. Res. Part A Policy Pract. 2016, 85, 174–185. [Google Scholar] [CrossRef] [Green Version]
- Campa, J.L.; López-Lambas, M.E.; Guirao, B. High speed rail effects on tourism: Spanish empirical evidence derived from China’s modelling experience. J. Transp. Geogr. 2016, 57, 44–54. [Google Scholar] [CrossRef]
- Guirao, B.; Campa, J. Cross Effects between High Speed Rail Lines and Tourism: Looking for Empirical Evidence Using the Spanish Case Study. Transp. Res. Procedia 2016, 14, 392–401. [Google Scholar] [CrossRef] [Green Version]
- Hiramatsu, T. Unequal regional impacts of high speed rail on the tourism industry: A simulation analysis of the effects of Kyushu Shinkansen. Transportation 2016, 45, 677–701. [Google Scholar] [CrossRef]
- Kurihara, T.; Wu, L. The Impact of High Speed Rail on Tourism Development: A Case Study of Japan. Open Transp. J. 2016, 10, 35–44. [Google Scholar] [CrossRef]
- Ortuño, A.; Bautista, D.; Fernández-Aracil, P.; Fernández, G.; Sánchez Galiano, J. HSR profile in sun and beach destinations: The case of Alicante (Spain). Open Transp. J. 2016, 10, 97–107. [Google Scholar]
- Saladié, Ò.; Clavé, S.A.; Gutiérrez, A. Measuring the influence of the Camp de Tarragona high-speed rail station on first-time and repeat tourists visiting a coastal destination. Belgeo 2016, 3. Available online: https://belgeo.revues.org/17889 (accessed on 10 May 2019).
- Wang, D.; Niu, Y.; Alan, A.L.; Chen, T.; Wang, L.; Lu, L. HSR mechanisms and effects on the spatial structure of regional tourism in China. J. Geogr. Sci. 2016, 26, 1725–1753. [Google Scholar] [CrossRef] [Green Version]
- Albalate, D.; Campos, J.; Jiménez, J.L. Tourism and high speed rail in Spain: Does the AVE increase local visitors? Ann. Tour. Res. 2017, 65, 71–82. [Google Scholar] [CrossRef] [Green Version]
- Gutiérrez, A.; Ortuño, A. High speed rail and coastal tourism: Identifying passenger profiles and travel behavior. PLoS ONE 2017, 12, e0179682. [Google Scholar] [CrossRef]
- Pagliara, F.; Mauriello, F.; Garofalo, A. Exploring the interdependences between High Speed Rail systems and tourism: Some evidence from Italy. Transp. Res. Part A Policy Pract. 2017, 106, 300–308. [Google Scholar] [CrossRef]
- Wang, D.; Niu, Y.; Sun, F.; Qian, J.; Li, F. Evolution and spatial characteristics of tourism field strength of cities linked by high-speed rail (HSR) network in China. J. Geogr. Sci. 2017, 27, 835–856. [Google Scholar] [CrossRef]
- Campa, J.L.; Arce, R.; López-Lambas, M.E.; Guirao, B. Can HSR improve the mobility of international tourists visiting Spain? Territorial evidence derived from the Spanish experience. J. Transp. Geogr. 2018, 73, 94–107. [Google Scholar] [CrossRef]
- Gao, Y.; Su, W.; Wang, K. Does high-speed rail boost tourism growth? New evidence from China. Tour. Manag. 2019, 72, 220–231. [Google Scholar] [CrossRef]
- Moyano, A.; Rivas, A.; Coronado, J.M. Business and tourism high-speed rail same-day trips: Factors influencing the efficiency of high-speed rail links for Spanish cities. Eur. Plan. Stud. 2019, 27, 533–554. [Google Scholar] [CrossRef]
- Nicolau, J.L.; Mas, F.J. The influence of distance and prices on the choice of tourist destinations: The moderating role of motivations. Tour. Manag. 2006, 27, 982–996. [Google Scholar] [CrossRef]
- Garmendia, M.; Ribalaygua, C.; Ureña, J.M. High speed rail: Implication for cities. Cities 2012, 29, S26–S31. [Google Scholar] [CrossRef]
- Albalate, D.; Bel, G.; Fageda, X. Competition and cooperation between high-speed rail and air transportation services in Europe. J. Transp. Geogr. 2015, 42, 166–174. [Google Scholar] [CrossRef]
- Lim, C. Review of international tourism demand models. Ann. Tour. Res. 1997, 24, 835–849. [Google Scholar] [CrossRef]
- Song, H.; Li, G. Tourism demand modelling and forecasting—A review of recent research. Tour. Manag. 2008, 29, 203–220. [Google Scholar] [CrossRef]
- Kim, H.; Cheng, C.-K.; O’Leary, J.T. Understanding participation patterns and trends in tourism cultural attractions. Tour. Manag. 2007, 28, 1366–1371. [Google Scholar] [CrossRef]
- Prince, D.R. Factors influencing museum visits: An empirical evaluation of audience selection. Mus. Manag. Curatorship 1990, 9, 149–168. [Google Scholar] [CrossRef]
- Bujosa, A.; Riera, A.; Pons, P.J. Sun-and-beach tourism and the importance of intra-destination movements in mature destinations. Tour. Geogr. 2015, 17, 780–794. [Google Scholar] [CrossRef]


| Spanish Region of Destination | Total Trips | Trips due to Cultural Reasons | Difference | ||
|---|---|---|---|---|---|
| Andalucía Aragón | 32,589,227 | (18.49%) | 1,699,241 | (21.90%) | (3.42%) |
| 8,087,891 | (4.59%) | 390,490 | (5.03%) | (0.45%) | |
| Asturias, Principado de | 4,813,351 | (2.73%) | 257,472 | (3.32%) | (0.59%) |
| Balears, Illes | 3,352,137 | (1.90%) | 91,128 | (1.17%) | –(0.73%) |
| Canarias | 6,267,175 | (3.56%) | 183,152 | (2.36%) | –(1.19%) |
| Cantabria | 4,627,295 | (2.62%) | 244,851 | (3.16%) | (0.53%) |
| Castilla y León | 17,518,646 | (9.94%) | 857,070 | (11.05%) | (1.11%) |
| Castilla - La Mancha | 12,872,481 | (7.30%) | 464,604 | (5.99%) | –(1.31%) |
| Cataluña | 25,227,941 | (14.31%) | 633,968 | (8.17%) | –(6.14%) |
| Comunitat Valenciana | 18,540,291 | (10.52%) | 424,389 | (5.47%) | –(5.05%) |
| Extremadura | 5,169,183 | (2.93%) | 251,863 | (3.25%) | (0.31%) |
| Galicia | 10,287,583 | (5.84%) | 537,138 | (6.92%) | (1.09%) |
| Madrid, Comunidad de | 13,478,592 | (7.65%) | 1,051,146 | (13.55%) | (5.90%) |
| Murcia, Región de | 4,177,476 | (2.37%) | 116,236 | (1.50%) | –(0.87%) |
| Navarra | 2,927,216 | (1.66%) | 111,047 | (1.43%) | –(0.23%) |
| País Vasco | 4,651,131 | (2.64%) | 349,744 | (4.51%) | (1.87%) |
| Rioja, La | 1,701,644 | (0.97%) | 89,781 | (1.16%) | (0.19%) |
| Total number of trips | 176,289,260 | (100.00%) | 7,753,320 | (4.40%) | |
| Spanish Region of Destination | 2018 | 2017 | ||
|---|---|---|---|---|
| Andalucía | 11,681,256 | (14.27%) | 11,518,262 | (14.07%) |
| Aragón | 545,530 | (0.67%) | 562,352 | (0.69%) |
| Asturias, Principado de | 299,357 | (0.37%) | 294,129 | (0.36%) |
| Balears, Illes | 13,851,598 | (16.92%) | 13,792,296 | (16.85%) |
| Canarias | 13,752,022 | (16.80%) | 14,214,222 | (17.36%) |
| Cantabria | 381,181 | (0.47%) | 414,489 | (0.51%) |
| Castilla y León | 1,374,464 | (1.68%) | 1,458,546 | (1.78%) |
| Castilla - La Mancha | 235,011 | (0.29%) | 226,221 | (0.28%) |
| Cataluña | 19,196,344 | (23.45%) | 19,118,421 | (23.35%) |
| Comunitat Valenciana | 9,206,908 | (11.25%) | 8,925,959 | (10.90%) |
| Extremadura | 468,286 | (0.57%) | 380,914 | (0.47%) |
| Galicia | 1,512,511 | (1.85%) | 1,291,086 | (1.58%) |
| Madrid, Comunidad de | 7,139,775 | (8.72%) | 6,699,785 | (8.18%) |
| Murcia, Región de | 1,134,189 | (1.39%) | 991,209 | (1.21%) |
| Navarra, Comunidad Foral de | 323,730 | (0.40%) | 333,317 | (0.41%) |
| País Vasco | 1,552,389 | (1.90%) | 1,514,765 | (1.85%) |
| Rioja, La | 142,926 | (0.17%) | 124,189 | (0.15%) |
| Total number of visitors | 82,808,413 | 81,868,522 | ||
| Authors | Country/Area | Type of Approach | Variable under Study | Findings/Conclusions |
|---|---|---|---|---|
| Guirao and Soler, 2009 [25] | Spain (Toledo) | Survey analysis | General impact on a small size city with a city edge station. | HSR frequencies and accessibility to HSR station must be reinforced to promote tourists. |
| Masson and Petiot, 2009 [26] | France and Spain. (Connection between Perpignan and Barcelona) | Ex-ante prospective analysis | Tourist demand. | Spatial competition may reinforce the agglomeration of the tourists in more developed areas (Barcelona) to the detriment of Perpignan. |
| Bazin, Beckeric, and Delaplace, 2010 [27] | France (Rheims) | Qualitative analysis | Urban and business tourism outcomes. | Only marginal profits are perceived due to the lack of reinforcement policies. |
| Wang, Chou, and Wu, 2010 [28] | Taiwan | Qualitative analysis | Tourism outcomes. | A “day visit market" has emerged because of HSR. Reduction in the days spent on visits and a simultaneous increase in the frequency of travel. Widening the tourist markets for more distant tourists. |
| Bazin, Beckerich, and Delaplace, 2011 [29] | France (Tous, Le Mans, Lille, Reims) | Qualitative analysis | Tourist impact. | HSR can valorize the city’s accessibility and image, what requires reinforcement are strategies from local actors. |
| Albalate and Bel, 2012 [30] | European and Japanese networks | Research digest | Business tourism and conferences benefit from HSR service. A reduction in the number of overnight stays, decrease in tourism expenditure, and consumption of hotel services is found. | |
| Chen and Haynes, 2012 [31] | China (27 provinces and 4 municipalities) | Econometric model | Number of total overseas tourist arrivals, numbers of foreign tourist arrivals, and tourism revenue from oversea tourist arrivals. | Significant impact on tourism outputs was found. |
| Wang, S. Huang, T. Zou, and H. Yan, 2012 [23] | China HSR network | Gravitational model | Accessibility to destinations. | Redistribution and transformation of tourist markets due to increased market competition. |
| Bazin, Beckerich, and Delaplace, 2013 [32] | France (Arras, Auray, Charleville-Mézières et Saverne) | Qualitative analysis | Increase in tourism outcomes. | Profits in small and medium size cities are low due to limited touristic attractivity and reinforcement policies. |
| Delaplace, Pagliara, Perrin, and La Pietra, 2013 [33] | France (Futuroscope and Disneyland Paris Themes Parks) | Survey approach combined with an econometric model | Impact of HSR in the choice of destination. | Direct positive impact found in the case of Disneyland, but no effect in the case of Futuroscope. |
| Delaplace, Pagliara, Perrin, and Mermet, 2014 [34] | France (Paris) and Italy (Rome) | Survey approach combined with an econometric model | Probability of choosing and revisiting the city. | Existence of HSR is not found as a main factor in the choice of either of the destinations. Unlike in Rome, French TGV does play a role in the willingness to revisit Paris. |
| Yan, Zhang, and Ye, 2014 [35] | China (three provinces along the Wuhan–Guangzhou HSR) | Econometric model | Domestic tourism receipts. | Considerable positive effects in two provinces while limited effect in the third one. Beneficial spillover effects along the HSR routes. |
| Sánchez Ollero, García Pozo, and Marchante Mera, 2014 [36] | Spain (Andalucía Region) | Qualitative analysis | Tourism outcomes. | Little or no positive impact was found. |
| Wang, Qian, Chen, Zhao, and Zhang, 2014 [37] | China (Beijing-Shanghai line) | Social network structure method | Accessibility to destinations. | An enhancement in the attraction for destinations with high standards was detected. Benefits in low popularity resource points were not so clearly detected. |
| Chen and Haynes, 2015 [38] | China | Econometric model | International tourist arrivals from 21 different countries. | Low level elasticity of new HSR implementation (0.057%), but important network effect elasticity (29%). |
| Pagliara, La Pietra, Gomez, and Vassallo, 2015 [39] | Spain (Madrid) | Survey approach and econometric model | Probability of revisiting Madrid and probability of choosing HSR for visiting cities near Madrid. | HSR does not play a role in the destination choice of Madrid, but has a great influence on the choice of visiting nearby cities. |
| Shyr, Chao, and Huang, 2015 [21] | Taiwan | Econometric model | Tourism outcomes. | Low influence of HSR on tourism. |
| Albalate and Fageda, 2016 [40] | Spain | Econometric model | Number of tourists and number of overnight stays. | No clear effect was found. |
| Campa, Lopez-Lambas, and Guirao, 2016 [41] | Spain (50 provinces) | Econometric model | Number of foreign and domestic tourists, and revenue from foreign tourists. | Low-value effects limited to foreign arrivals and tourists. |
| Guirao and Campa, 2016 [42] | Spain (7 provinces) | Econometric model | Number of domestic and foreign tourists, and number of overnight stays. | There is no direct positive impact on the destinations analyzed. |
| Hiramatsu, 2016 [43] | Japan (Kyushu’s HSR) | GCE econometric model | Number of tourist arrivals and GP of arrival of tourism goods. | Only some stations served by HSR experience an increase in the tourist arrivals, although economy of all prefectures is benefited due to general equilibrium effects. |
| Kurihara and Wu, 2016 [44] | Japan (Tohoku and Kyushu Regions) | Statistical analysis and Ordinary Least Square econometric model | Tourist arrivals. | HSR significantly increases tourist arrivals, sharper in the areas closer to stations, although the influence decays over time. |
| Ortuño, Bautista, Fernández-Aracil, Fernández, and Sánchez Galiano, 2016 [45] | Spain (Alicante) | Survey approach | Voyaging by HSR tourist profile. | 15–20% of new trips induced, especially from Madrid central node. |
| Saladié, Clavé, and Gutiérrez, 2016 [46] | Spain (Tarragona) | Survey approach | First time/Repeat tourists. | High repercussion found: Almost 25% of expenditures in the destination by first-time tourists and 12.9% by repeat tourists can be attributed to the availability of the Camp de Tarragona HSR station. |
| Wang, Wang, Chen, Lu, and Niu, 2016 [47] | Analysis of accessibility using GIS applications | Tourism outcomes. | Reinforcement of tourist attraction at the tourism nodes with a certain level of previous attractivation. Increase in the competition between destinations. | |
| Albalate, Campos, and Jimenez, 2017 [48] | Spain | Fixed effect econometric model | Number of tourists, number of nights spent at the destination, and hotel occupancy. | Minimal or even negative effects that are restricted to large cities. No overall effect detected. |
| Gutiérrez and Ortuño, 2017 [49] | Spain (Tarragona and Alicante) | Survey approach and econometric model | Tourist profile and preferences. | Different tourist profiles at the two destinations were detected. Those who visit Alicante tend to make longer stays, arrive in larger groups, and are older than those that are most likely to visit Tarragona. |
| F. Pagliara, Mauriello, and Garofalo, 2017 [50] | Italy (77 municipalities) | GEE econometric model | Number of Italian tourists and number of overnight stays. | Positive impact on the number of Italian tourists and overnight stays. A denser network intensifies this effect. |
| Wang, Niu, Sun, Wang, Qian, and Li, 2017 [51] | China | Calculation of temporal distance and field strength index of urban tourism | Accessibility to urban destinations. | Increase in general accessibility due to HSR network that benefits most regional central cities. |
| Campa, Arce, Lopez-Lambas, and Guirao, 2018 [52] | Spain (7 regions) | Econometric model | Number of foreign tourists. | No overall effect of the presence of HSR or extension of the network was detected although some positive effects on peripheral destinations that then decrease progressively in profit for inland destinations |
| Gao, Su, and Wang, 2019 [53] | China (provincial level) | Differences in differences econometrical model | Domestic revenues and arrivals. | General negative effect due to the decrease in revenues while the number of domestic tourist increases. |
| Moyano, Rivas, and Coronado, 2019 [54] | Spain (all the connected HSR network) | Calculation of efficiency index | One-day trip traveler global benefit. | Large cities in the peripheral location of the network are most favored for business connections, while intermediate cities achieve higher efficiency for tourism. |
| Yin, Pagliara, and Wilson, 2019 [24] | China (13 cities in the Capital Region) | Econometric model | Tourist flow, and attraction of destinations. | The small and end-line cities connected to core cities are the most benefited while the effect is limited for larger cities. |
| Province/Museum | Number of Obs. | Min. Year | Max. Year | Mean | Min. | Max |
|---|---|---|---|---|---|---|
| Region of Andalucia | ||||||
| Province of Cádiz | ||||||
| Museo de Cádiz | 25 | 1992 | 2016 | 73,316 | 40,712 | 118,487 |
| Province of Córdoba | ||||||
| Mezquita cathedral | 23 | 1994 | 2016 | 1,217,666 | 791,700 | 1,818,633 |
| Museo Arqueológico de Córdoba | 24 | 1993 | 2016 | 47,552 | 18,533 | 86,499 |
| Museo de Bellas Artes de Córdoba | 25 | 1992 | 2016 | 55,874 | 27,489 | 73,892 |
| Province of Granada | ||||||
| Museo de Bellas Artes de Granada | 25 | 1992 | 2016 | 154,558 | 42,141 | 325,419 |
| Museo de la Alhambra | 25 | 1992 | 2016 | 174,484 | 68,825 | 285,001 |
| Province of Sevilla | ||||||
| Museo Arqueológico de Sevilla | 25 | 1992 | 2016 | 63,507 | 45,296 | 115,028 |
| Museo Artes y Cost. Pop. de Sevilla | 25 | 1992 | 2016 | 58,835 | 21,153 | 87,826 |
| Museo de Bellas Artes de Sevilla | 25 | 1992 | 2016 | 190,300 | 22,379 | 362,951 |
| Region of Castilla la Mancha | ||||||
| Province of Toledo | ||||||
| Museo del Greco | 19 | 1999 | 2017 | 221,813 | 166,992 | 288,664 |
| Museo Sefardí | 19 | 1999 | 2017 | 294,402 | 218,868 | 375,170 |
| Region of Castilla Leon | ||||||
| Province of Valladolid | ||||||
| Real Mon. Santa Clara de Tordesillas | 3 | 2015 | 2017 | 30,150 | 26,597 | 33,424 |
| Museo Nacional de Escultura | 19 | 1999 | 2017 | 113,289 | 63,577 | 193,665 |
| Province of Segovia | ||||||
| Fuentes de La Granja | 3 | 2015 | 2017 | 87,354 | 81,665 | 95,440 |
| Palacio Real Granja de San Ildefonso | 3 | 2015 | 2017 | 187,131 | 171,499 | 204,350 |
| Region of Cataluña | ||||||
| Province of Barcelona | ||||||
| Colegiata de Sant Vicenç de Cardona | 18 | 1999 | 2016 | 30,600 | 18,947 | 40,823 |
| Fundació Antoni Tàpies | 17 | 2000 | 2016 | 71,496 | 61,385 | 92,305 |
| Fundació Joan Miró | 17 | 2000 | 2016 | 490,300 | 425,067 | 583,831 |
| Museu d’Art Contemporani de Barcelona | 17 | 2000 | 2016 | 343,703 | 192,351 | 568,469 |
| Museu de Ceràmica | 6 | 2000 | 2005 | 58,783 | 48,834 | 80,640 |
| Museu Ciències Nat. Ciutadella | 17 | 2000 | 2016 | 145,852 | 61,501 | 234,574 |
| Museu d’Història de Catalunya | 16 | 2001 | 2016 | 190,006 | 142,601 | 302,326 |
| Museu F.C.Barcelona | 14 | 2000 | 2013 | 1,352,926 | 1,156,090 | 1,626,990 |
| Museu Militar de Barcelona | 5 | 2000 | 2004 | 105,338 | 58,458 | 130,614 |
| Museu Monestir de Pedralbes | 9 | 2000 | 2008 | 59,639 | 51,536 | 64,668 |
| Museu Nacional d’Art de Catalunya | 6 | 2011 | 2016 | 634,500 | 448,525 | 820,516 |
| Museu Picasso | 17 | 2000 | 2016 | 1,048,917 | 887,958 | 1,313,086 |
| Temple Expiatori de la Sagr. Família | 4 | 2010 | 2013 | 2,982,461 | 2,317,349 | 3,233,526 |
| Province of Gerona | ||||||
| Monestir San Pere de Rodes | 18 | 1999 | 2016 | 103,775 | 91,635 | 114,161 |
| Province of Lérida | ||||||
| La Seu Vella de Lleida | 9 | 1999 | 2007 | 47,228 | 37,125 | 67,373 |
| Province of Tarragona | ||||||
| Cartoixa d’Escaladei | 13 | 2000 | 2012 | 20,011 | 17,699 | 22,290 |
| Castell de Miravet | 18 | 1999 | 2016 | 31,337 | 19,205 | 47,936 |
| Museu Nac. Arqueològic Tarrag. | 5 | 2012 | 2016 | 67,406 | 54,407 | 85,043 |
| Reial Monestir de Santes Creus | 18 | 1999 | 2016 | 74,899 | 57,266 | 88,346 |
| Region of Madrid | ||||||
| Province of Madrid | ||||||
| Arqueológico | 20 | 1988 | 2007 | 218,805 | 169,300 | 281,900 |
| Cervantes | 29 | 1988 | 2016 | 103,184 | 18,900 | 211,200 |
| De Cera | 13 | 2004 | 2016 | 290,238 | 248,300 | 341,200 |
| Del Prado | 29 | 1988 | 2016 | 2,215,041 | 1,567,200 | 3,156,700 |
| El Valle de los Caídos | 3 | 2015 | 2017 | 266,732 | 254,059 | 283,277 |
| Ermita de San Antonio de la Florida | 22 | 1995 | 2016 | 66,750 | 32,200 | 109,100 |
| Falías Reales de Aranjuez | 3 | 2015 | 2017 | 56,727 | 49,473 | 62,641 |
| Lope de Vega | 8 | 2009 | 2016 | 47,488 | 19,100 | 106,500 |
| Monasterio de las Descalzas Reales | 3 | 2015 | 2017 | 50,881 | 50,210 | 51,419 |
| Museo Casa de Cervantes | 19 | 1999 | 2017 | 15,445 | 11,330 | 26,431 |
| Museo de Altamira | 1 | 2000 | 2017 | 256,626 | 58,314 | 368,737 |
| Museo de América | 19 | 1999 | 2017 | 71,990 | 47,621 | 120,063 |
| Museo del Traje | 12 | 2006 | 2017 | 99,029 | 67,453 | 138,889 |
| Museo Nacional de Antropología | 19 | 1999 | 2017 | 45,413 | 25,175 | 81,790 |
| Museo Nac. de Artes Decorativas | 30 | 1988 | 2017 | 26,868 | 18,227 | 71,472 |
| Museo Sorolla | 19 | 1999 | 2017 | 120,805 | 19,803 | 255,051 |
| Nacional de Ciencias Naturales | 14 | 2003 | 2016 | 215,214 | 147,900 | 298,700 |
| Nacional Etnológico | 29 | 1988 | 2016 | 39,910 | 23,200 | 73,600 |
| Palacio Real de Aranjuez | 3 | 2015 | 2017 | 207,044 | 199,398 | 219,884 |
| Palacio Real Madrid | 3 | 2015 | 2017 | 1,413,899 | 1,303,496 | 1,494,245 |
| Picasso-Colección Eugenio Arias | 21 | 1996 | 2016 | 12,743 | 4,800 | 26,200 |
| Planetario | 29 | 1988 | 2016 | 171,407 | 86,700 | 260,000 |
| Real Mon San Lorenzo de El Escorial | 3 | 2015 | 2017 | 496,327 | 467,959 | 514,385 |
| Reina Sofía | 29 | 1988 | 2016 | 1,600,214 | 562,100 | 3,744,700 |
| Sorolla | 29 | 1988 | 2016 | 91,708 | 33,600 | 215,400 |
| Templo de Debod | 29 | 1988 | 2016 | 162,196 | 53,200 | 424,700 |
| Thyssen-Bornemisza | 23 | 1994 | 2016 | 760,074 | 433,600 | 1,255,300 |
| Province of Badajoz | ||||||
| Museo Nacional de Arte Romano | 19 | 1999 | 2017 | 206,191 | 188,576 | 239,798 |
| Province of Burgos | ||||||
| M. de Sta. M. Real Huelgas de Burgos | 3 | 2015 | 2017 | 64,401 | 61,421 | 67,901 |
| Province of Cáceres | ||||||
| Monasterio de San Jerónimo de Yuste | 3 | 2015 | 2017 | 96,808 | 87,143 | 103,648 |
| Province of Cantabria | ||||||
| Museo de Altamira | 18 | 2000 | 2017 | 256,626 | 58,314 | 368,737 |
| Model 1 | Complete Database | Museums in Madrid | Museums in Cataluña | Museums in Andalucia | Museums in Castilla | ||||||||||
|---|---|---|---|---|---|---|---|---|---|---|---|---|---|---|---|
| Ln visitt | Coef. | p > t | Coef. | p > t | Coef. | p > t | Coef. | p > t | Coef. | p > t | |||||
| Ln visitt–1 | 0.772 | 0.00 | **** | 0.829 | 0.00 | **** | 0.67 | 0 | **** | 0.464741 | 0.000 | **** | −0.155 | 0.33 | |
| Ln pop | 0.005 | 0.60 | −0.013 | 0.26 | −0.01 | 0.958 | 1.851769 | 0.001 | **** | 0.498 | 0.42 | ||||
| Ln gdp | 0.141 | 0.00 | **** | 0.242 | 0.00 | **** | 0.10 | 0.329 | 0.17967 | 0.164 | * | 0.106 | 0.57 | ||
| Dif gdp | 0.000 | 0.90 | 0.000 | 0.24 | 0.00 | 0.68 | −5.9E–05 | 0.098 | ** | 0.000 | 0.69 | ||||
| Hsr | 0.042 | 0.14 | * | 0.199 | 0.00 | **** | 0.01 | 0.806 | 2.773055 | 0.000 | **** | 0.049 | 0.73 | ||
| Cons | 1.290 | 0.00 | **** | −0.099 | 0.88 | 3.18 | 0.385 | −22.9803 | 0.000 | **** | 6.154 | 0.46 | |||
| F | 2.400 | 0.000 | **** | 2.100 | 0.000 | **** | 3.480 | 0 | **** | 13.07 | 0.000 | **** | 12.390 | 0.000 | **** |
| Obs | 964 | 450 | 214.000 | 208.00 | 39 | ||||||||||
| Groups | 63 | 29 | 19.000 | 9.00 | 5 | ||||||||||
| R2 | 0.947 | 0.976 | 0.983 | 0.0444 | 0.171 | ||||||||||
| Model 1 | Hub | No Hub | Same Municipality | Different Municipality | |||||||||||
| Ln Visitt | Coef. | p > t | Coef. | p > t | Coef. | p > t | Coef. | p > t | |||||||
| Ln Visitt–1 | 0.813 | 0.00 | **** | 0.551 | 0.00 | **** | 0.746 | 0.00 | **** | 0.852 | 0.00 | **** | |||
| Ln Pop | 0.004 | 0.70 | 0.666 | 0.04 | *** | 0.001 | 0.91 | 0.033 | 0.21 | ||||||
| Ln Gdp | 0.155 | 0.01 | **** | 0.084 | 0.43 | 0.207 | 0.00 | **** | −0.083 | 0.43 | |||||
| Dif Gdp | 0.000 | 0.52 | 0.000 | 0.60 | 0.000 | 0.49 | 0.000 | 0.21 | |||||||
| Hsr | 0.049 | 0.16 | * | −0.063 | 0.37 | 0.028 | 0.42 | 0.092 | 0.06 | ** | |||||
| Cons | 0.757 | 0.15 | * | −4.713 | 0.22 | 1.042 | 0.04 | *** | 2.055 | 0.03 | *** | ||||
| F | 2.130 | 0.000 | **** | 4.540 | 0.000 | **** | 3.030 | 0.000 | **** | 1.240 | 0.240 | ||||
| Obs | 672 | 292 | 749 | 215 | |||||||||||
| Groups | 45 | 18 | 45 | 18 | |||||||||||
| R2 | 0.973 | 0.705 | 0.966 | 0.962 | |||||||||||
| Model 2 | Complete Database | Museums in Madrid | Museums in Cataluña | Museums in Andalucia | Museums in Castilla | ||||||||||
|---|---|---|---|---|---|---|---|---|---|---|---|---|---|---|---|
| Ln Visitt | Coef. | p > t | Coef. | p > t | Coef. | p > t | Coef. | p > t | Coef. | p > t | |||||
| Ln Visitt–1 | 0.771 | 0.00 | **** | 0.829 | 0.00 | **** | 0.671 | 0.00 | **** | 0.465 | 0.00 | **** | −0.155 | 0.33 | |
| Ln Pop | 0.004 | 0.69 | −0.013 | 0.26 | −0.143 | 0.67 | 1.852 | 0.00 | **** | 0.498 | 0.42 | ||||
| Ln Gdp | 0.146 | 0.00 | **** | 0.242 | 0.00 | **** | 0.121 | 0.27 | 0.180 | 0.16 | * | 0.106 | 0.57 | ||
| Dif Gdp | 0.000 | 0.84 | 0.000 | 0.24 | 0.000 | 0.75 | 0.000 | 0.10 | ** | 0.000 | 0.69 | ||||
| Centr | 0.054 | 0.10 | ** | 0.199 | 0.00 | **** | 0.009 | 0.81 | 2.773 | 0.00 | **** | 0.000 | (omitted) | ||
| Cedge | 0.022 | 0.79 | 0.000 | (omitted) | 0.000 | (omitted) | 0.000 | (omitted) | 0.049 | 0.73 | |||||
| Periph | 0.0033 | 0.959 | 0.0000 | (omitted) | 0.0519 | 0.473 | 0.0000 | (omitted) | 0.0000 | (omitted) | |||||
| Cons | 1.268 | 0.005 | **** | −0.096 | 0.881 | 4.858 | 0.269 | −22.980 | 0.000 | **** | 6.165 | 0.457 | |||
| F | 2 | 0.000 | **** | 3 | 0.001 | **** | 3 | 0.000 | **** | 13 | 0.000 | **** | 13 | 0.000 | **** |
| Obs | 964.000 | 450.000 | 214.000 | 208.000 | 39.000 | ||||||||||
| Groups | 63.000 | 29.000 | 19.00 | 9.000 | 5.000 | ||||||||||
| R2 | 0.969 | 0.927 | 0.95 | 0.044 | 0.156 | ||||||||||
| Model 2 | Hub | No Hub | Same Municipality | Different Municipality | |||||||||||
| Ln Visitt | Coef. | p > t | Coef. | p > t | Coef. | p > t | Coef. | p > t | |||||||
| Ln Visitt – 1 | 0.813 | 0.00 | **** | 0.544 | 0.00 | **** | 0.746 | 0.00 | **** | 0.851 | 0.00 | **** | |||
| Ln Pop | 0.004 | 0.70 | 0.763 | 0.02 | *** | 0.001 | 0.94 | 0.030 | 0.27 | ||||||
| Ln Gdp | 0.155 | 0.01 | **** | 0.079 | 0.45 | 0.209 | 0.00 | **** | −0.070 | 0.52 | |||||
| DIF Gdp | 0.000 | 0.52 | 0.000 | 0.54 | 0.000 | 0.51 | 0.000 | 0.20 | * | ||||||
| Centr | 0.049 | 0.16 | * | 0.025 | 0.80 | 0.032 | 0.39 | 0.116 | 0.09 | ** | |||||
| Cedge | 0.000 | (omitted) | −0.086 | 0.40 | 0.002 | 0.98 | 0.000 | (omitted) | |||||||
| Periph | 0.0000 | (omitted) | −0.1222 | 0.159 | * | 0.0000 | (omitted) | 0.0713 | 0.264 | ||||||
| Cons | 0.757 | 0.158 | * | −5.959 | 0.136 | * | 1.035 | 0.040 | *** | 1.991 | 0.041 | *** | |||
| F | 2 | 0.000 | **** | 5 | 0.000 | **** | 3 | 0.000 | **** | 1 | 0.237 | ||||
| Obs | 672.000 | 292.000 | 749.000 | 215.000 | |||||||||||
| Groups | 45.000 | 18.000 | 45.000 | 18.000 | |||||||||||
| R2 | 0.973 | 0.638 | 0.966 | 0.942 | |||||||||||
| Model 3 | Complete Database | Museums in Madrid | Museums in Cataluña | Museums in Andalucia | Museums in Castilla | ||||||||||
|---|---|---|---|---|---|---|---|---|---|---|---|---|---|---|---|
| Ln Visitt | Coef. | p > t | Coef. | p > t | Coef. | p > t | Coef. | p > t | Coef. | p > t | |||||
| Ln Visitt–1 | 0.767 | 0.00 | **** | 0.827 | 0.00 | **** | 0.670 | 0.00 | **** | 0.465 | 0.00 | **** | −0.148 | 0.35 | |
| Ln Pop | 0.003 | 0.75 | −0.006 | 0.58 | −0.016 | 0.95 | 1.852 | 0.00 | **** | 0.581 | 0.32 | ||||
| Ln Gdp | 0.149 | 0.00 | **** | 0.236 | 0.00 | **** | 0.105 | 0.33 | 0.180 | 0.16 | * | 0.106 | 0.57 | ||
| DIF Gdp | 0.000 | 0.55 | 0.000 | 0.36 | 0.000 | 0.68 | 0.000 | 0.10 | ** | 0.000 | 0.67 | ||||
| ST Dist | −0.000 | 0.01 | *** | −0.000 | 0.01 | *** | −0.000 | 0.81 | −0.000 | 0.00 | **** | 0.000 | 0.83 | ||
| Cons | 1.379 | 0.00 | **** | 0.050 | 0.94 | 3.195 | 0.40 | −20.817 | 0.002 | **** | 4.979 | 0.51 | |||
| F | 2.470 | 0.000 | **** | 2.080 | 0.001 | **** | 3.480 | 12.800 | 0.000 | **** | 12.450 | 0.000 | **** | ||
| Obs | 964 | 450 | 214.000 | 208 | 39 | ||||||||||
| Groups | 63 | 29 | 19.000 | 9 | 5 | ||||||||||
| R2 | 0.969 | 0.976 | 0.983 | 0.153 | 0.148 | ||||||||||
| Model 3 | Hub | No Hub | Same Municipality | Different Municipality | |||||||||||
| Ln Visitt | Coef. | p > t | Coef. | p > t | Coef. | p > t | Coef. | p > t | |||||||
| Ln Visitt–1 | 0.8115761 | **** | 0.5630129 | **** | 0.7422611 | **** | 0.8471965 | **** | |||||||
| Ln Pop | 0.004256 | 0.667 | −0.00065 | 0.998 | −0.00041 | 0.969 | 0.027663 | 0.288 | |||||||
| Ln Gdp | 0.162 | 0.01 | **** | 0.179 | 0.10 | ** | 0.214 | 0.00 | **** | −0.076 | 0.46 | ||||
| DIF Gdp | 0.000 | 0.50 | 0.000 | 0.29 | 0.000 | 0.73 | 0.000 | 0.12 | * | ||||||
| ST Dist | −0.000 | 0.16 | * | −0.000 | 0.04 | *** | −0.000 | 0.12 | * | −0.000 | 0.01 | **** | |||
| Cons | 0.759 | 0.15 | * | 3.502 | 0.36 | 1.106 | 0.03 | *** | 2.277 | 0.02 | *** | ||||
| F | 2.130 | 0.00 | **** | 4.620 | 0.00 | **** | 3.080 | 0.00 | **** | 1.430 | 0.13 | * | |||
| Obs | 672.0000 | 292.0000 | 749.0000 | 215.0000 | |||||||||||
| Groups | 45.000 | 18.000 | 45.000 | 18.000 | |||||||||||
| R2 | 0.973 | 0.942 | 0.966 | 0.962 | |||||||||||
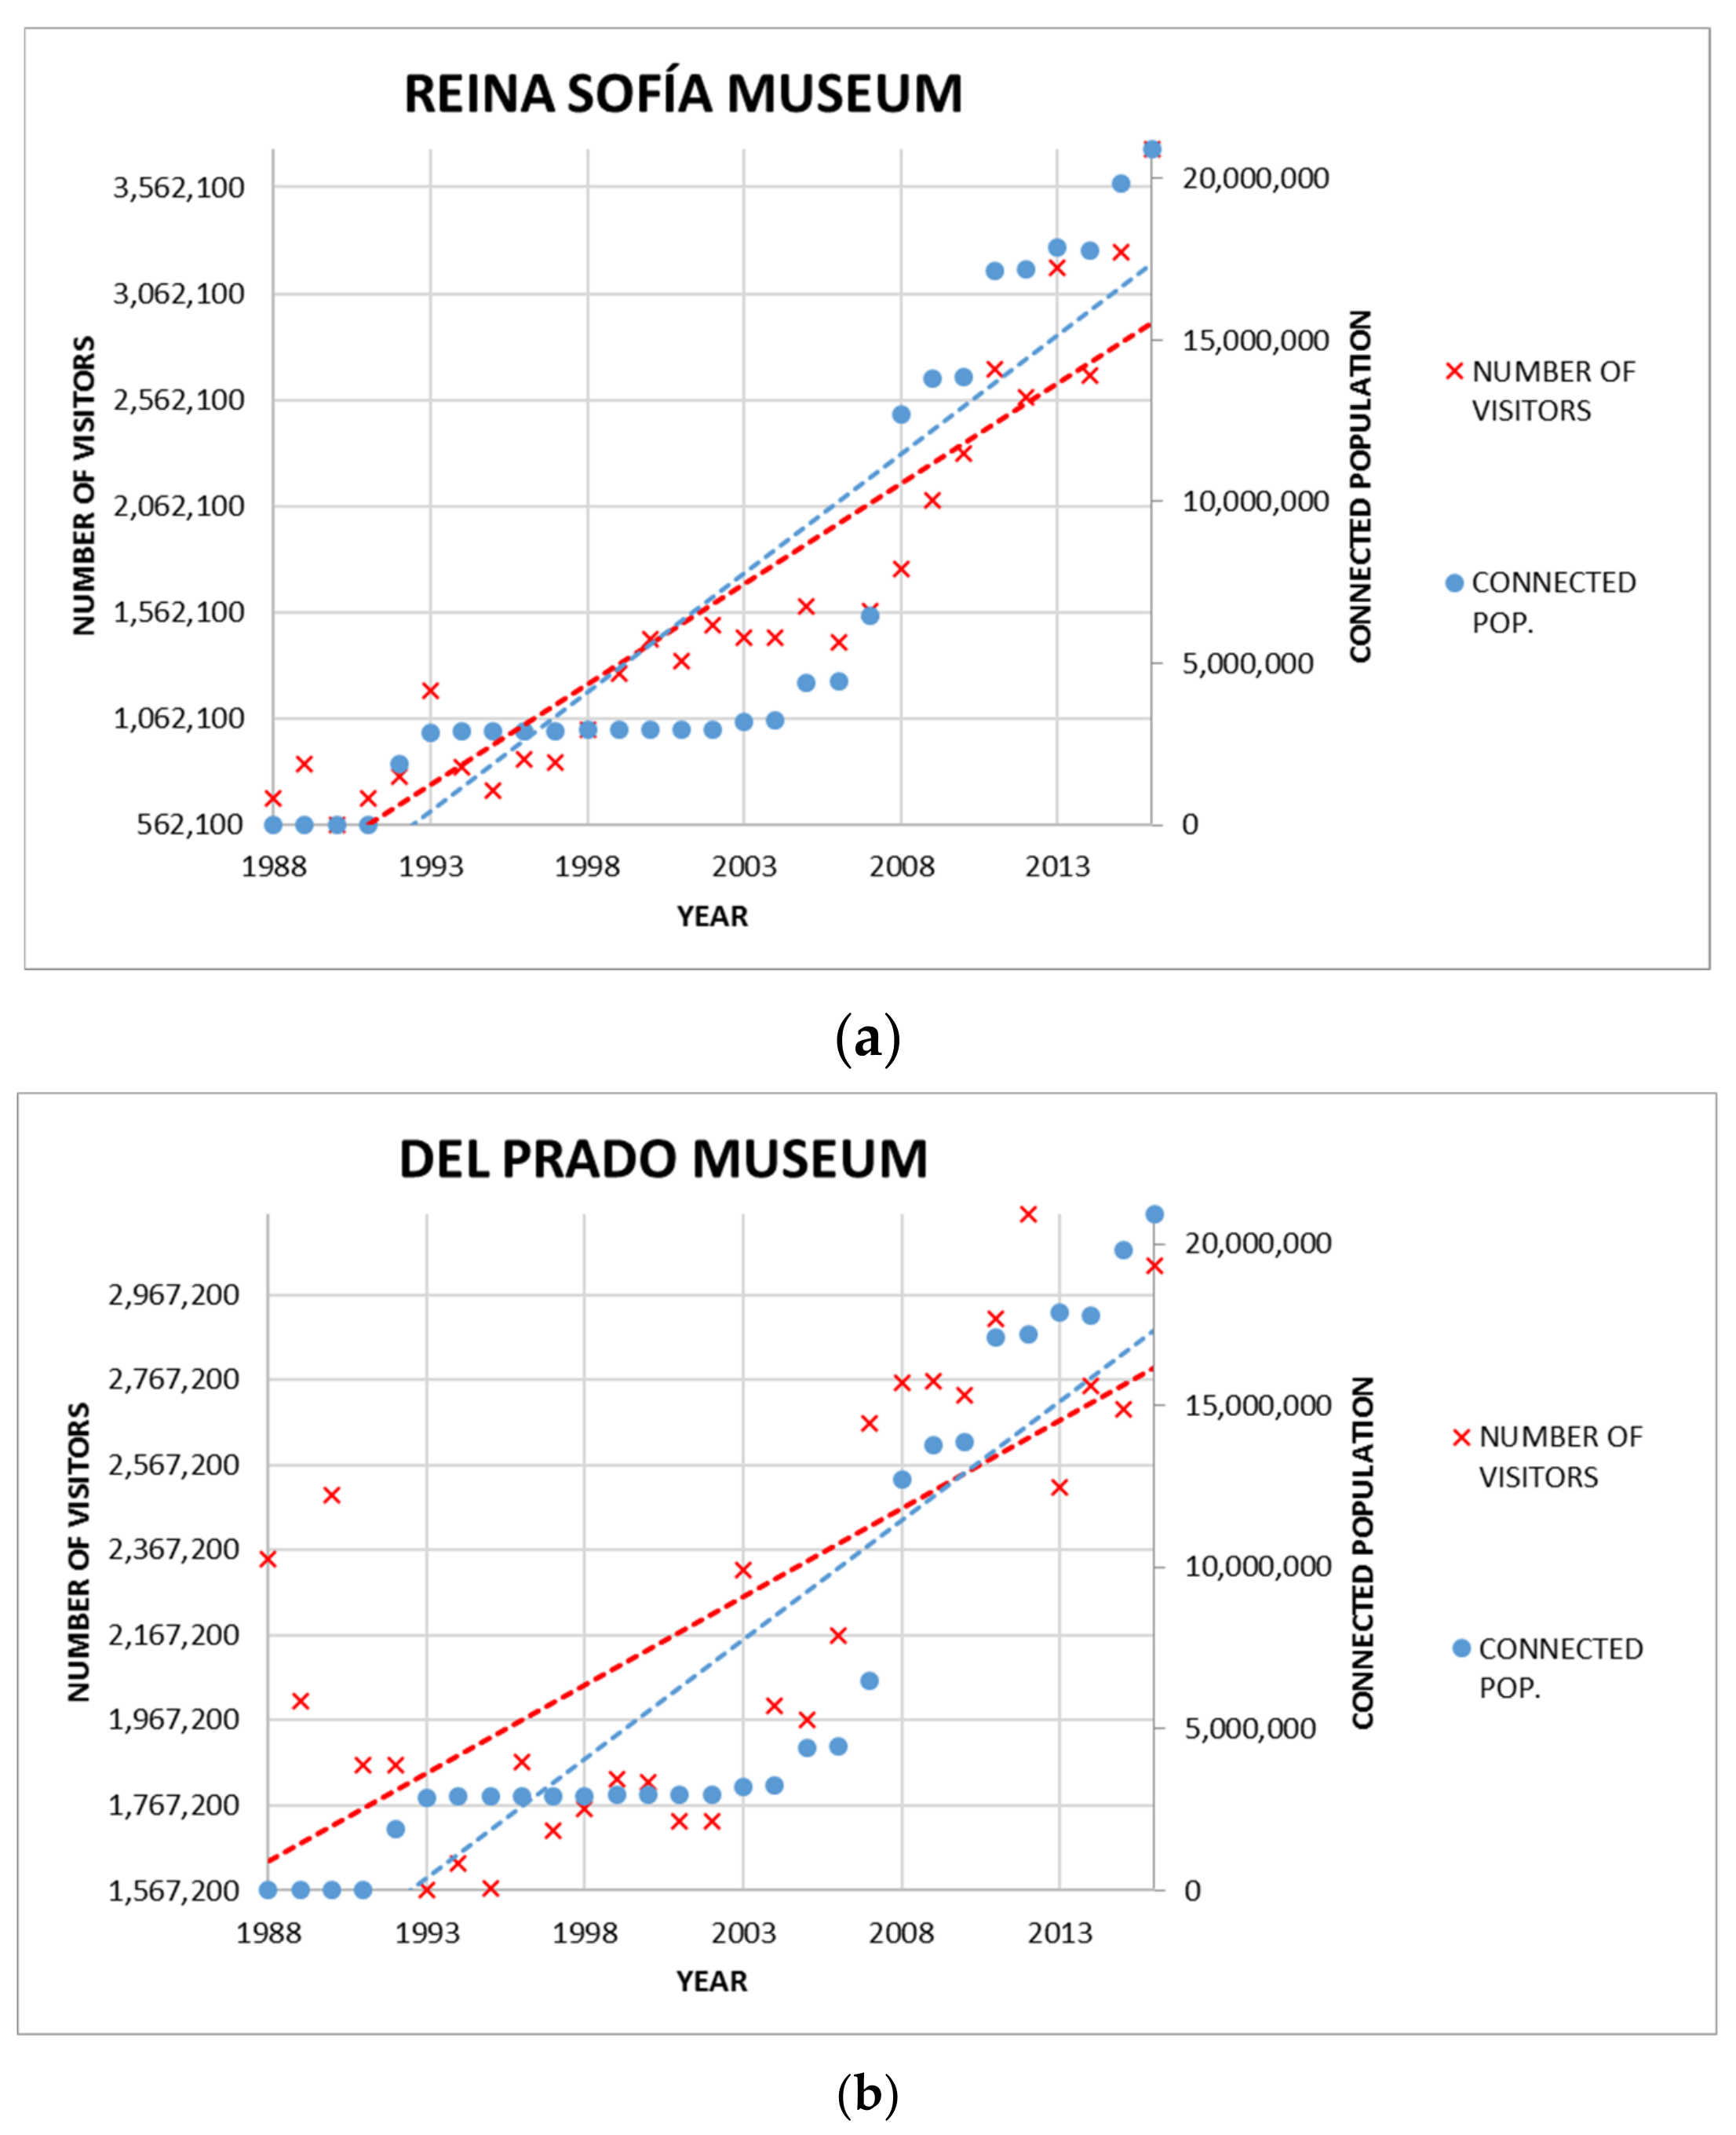
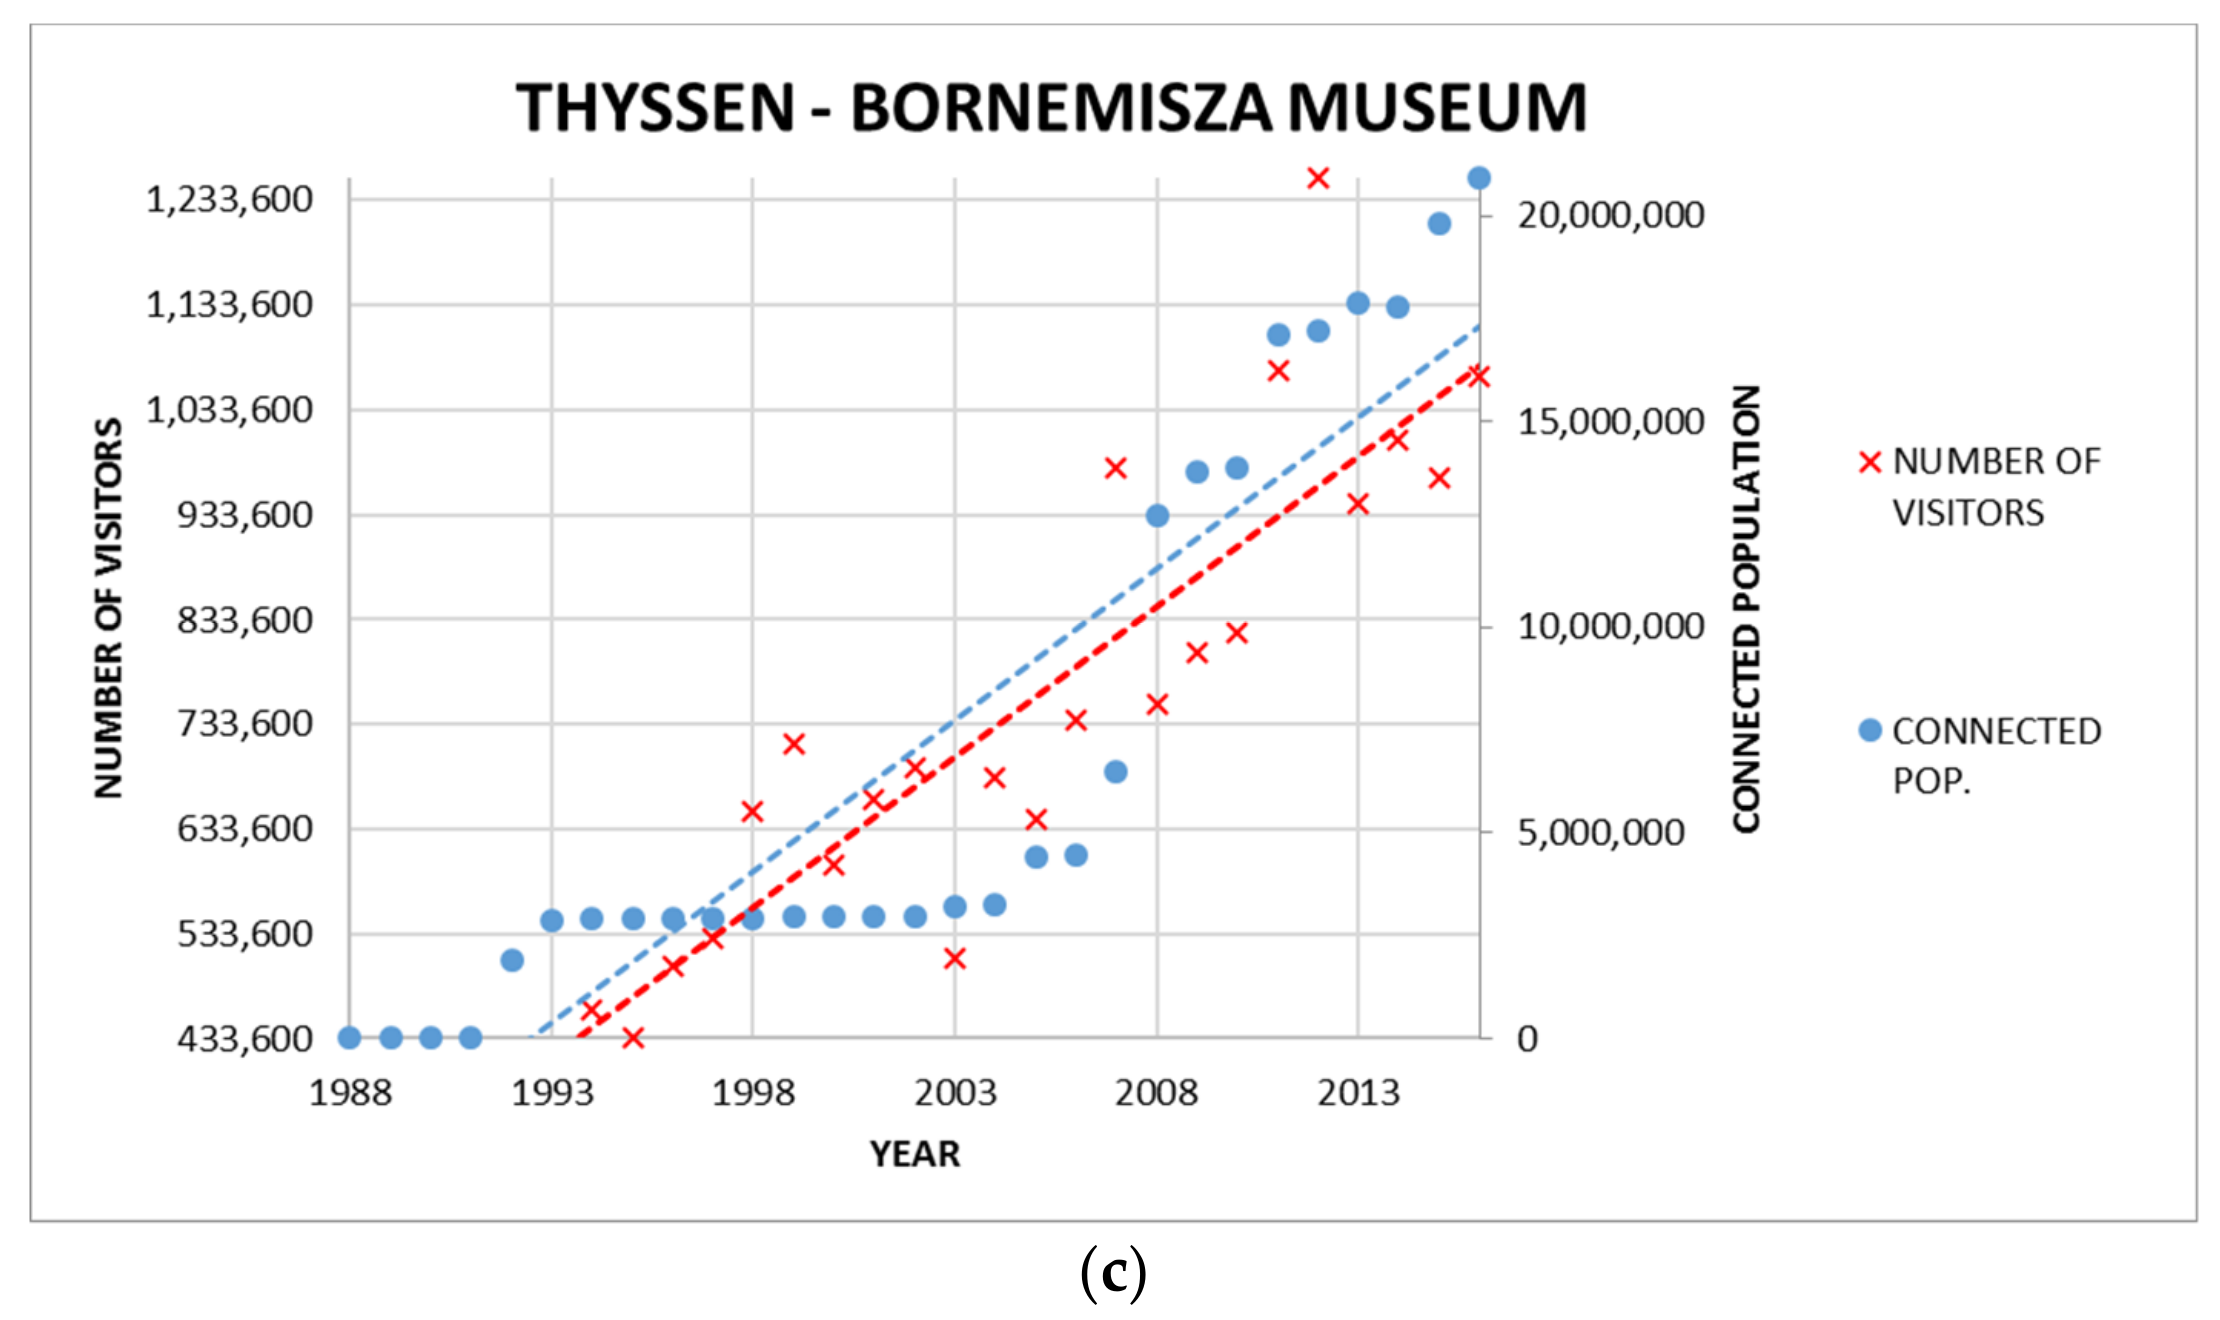
| Reina Sofia Museum | Del Prado Museum | Thyssen-Bornemisza Mus. | |||||||
|---|---|---|---|---|---|---|---|---|---|
| Dep. Var.: Ln Visitt | Coef. | p > t | Coef. | p > t | Coef. | p > t | |||
| Year | 0.046 | 0.000 | **** | –0.000 | 0.965 | 0.037 | 0.002 | **** | |
| Connected Pop. | 0.000 | 0.040 | *** | 0.000 | 0.009 | **** | 0.000 | 0.838 | |
| Const | –77.223 | 0.000 | **** | 15.046 | 0.305 | –60.050 | 0.009 | **** | |
| OBS | 29 | 29 | 23 | ||||||
| R2 | 0.9289 | 0.5865 | 0.7848 | ||||||
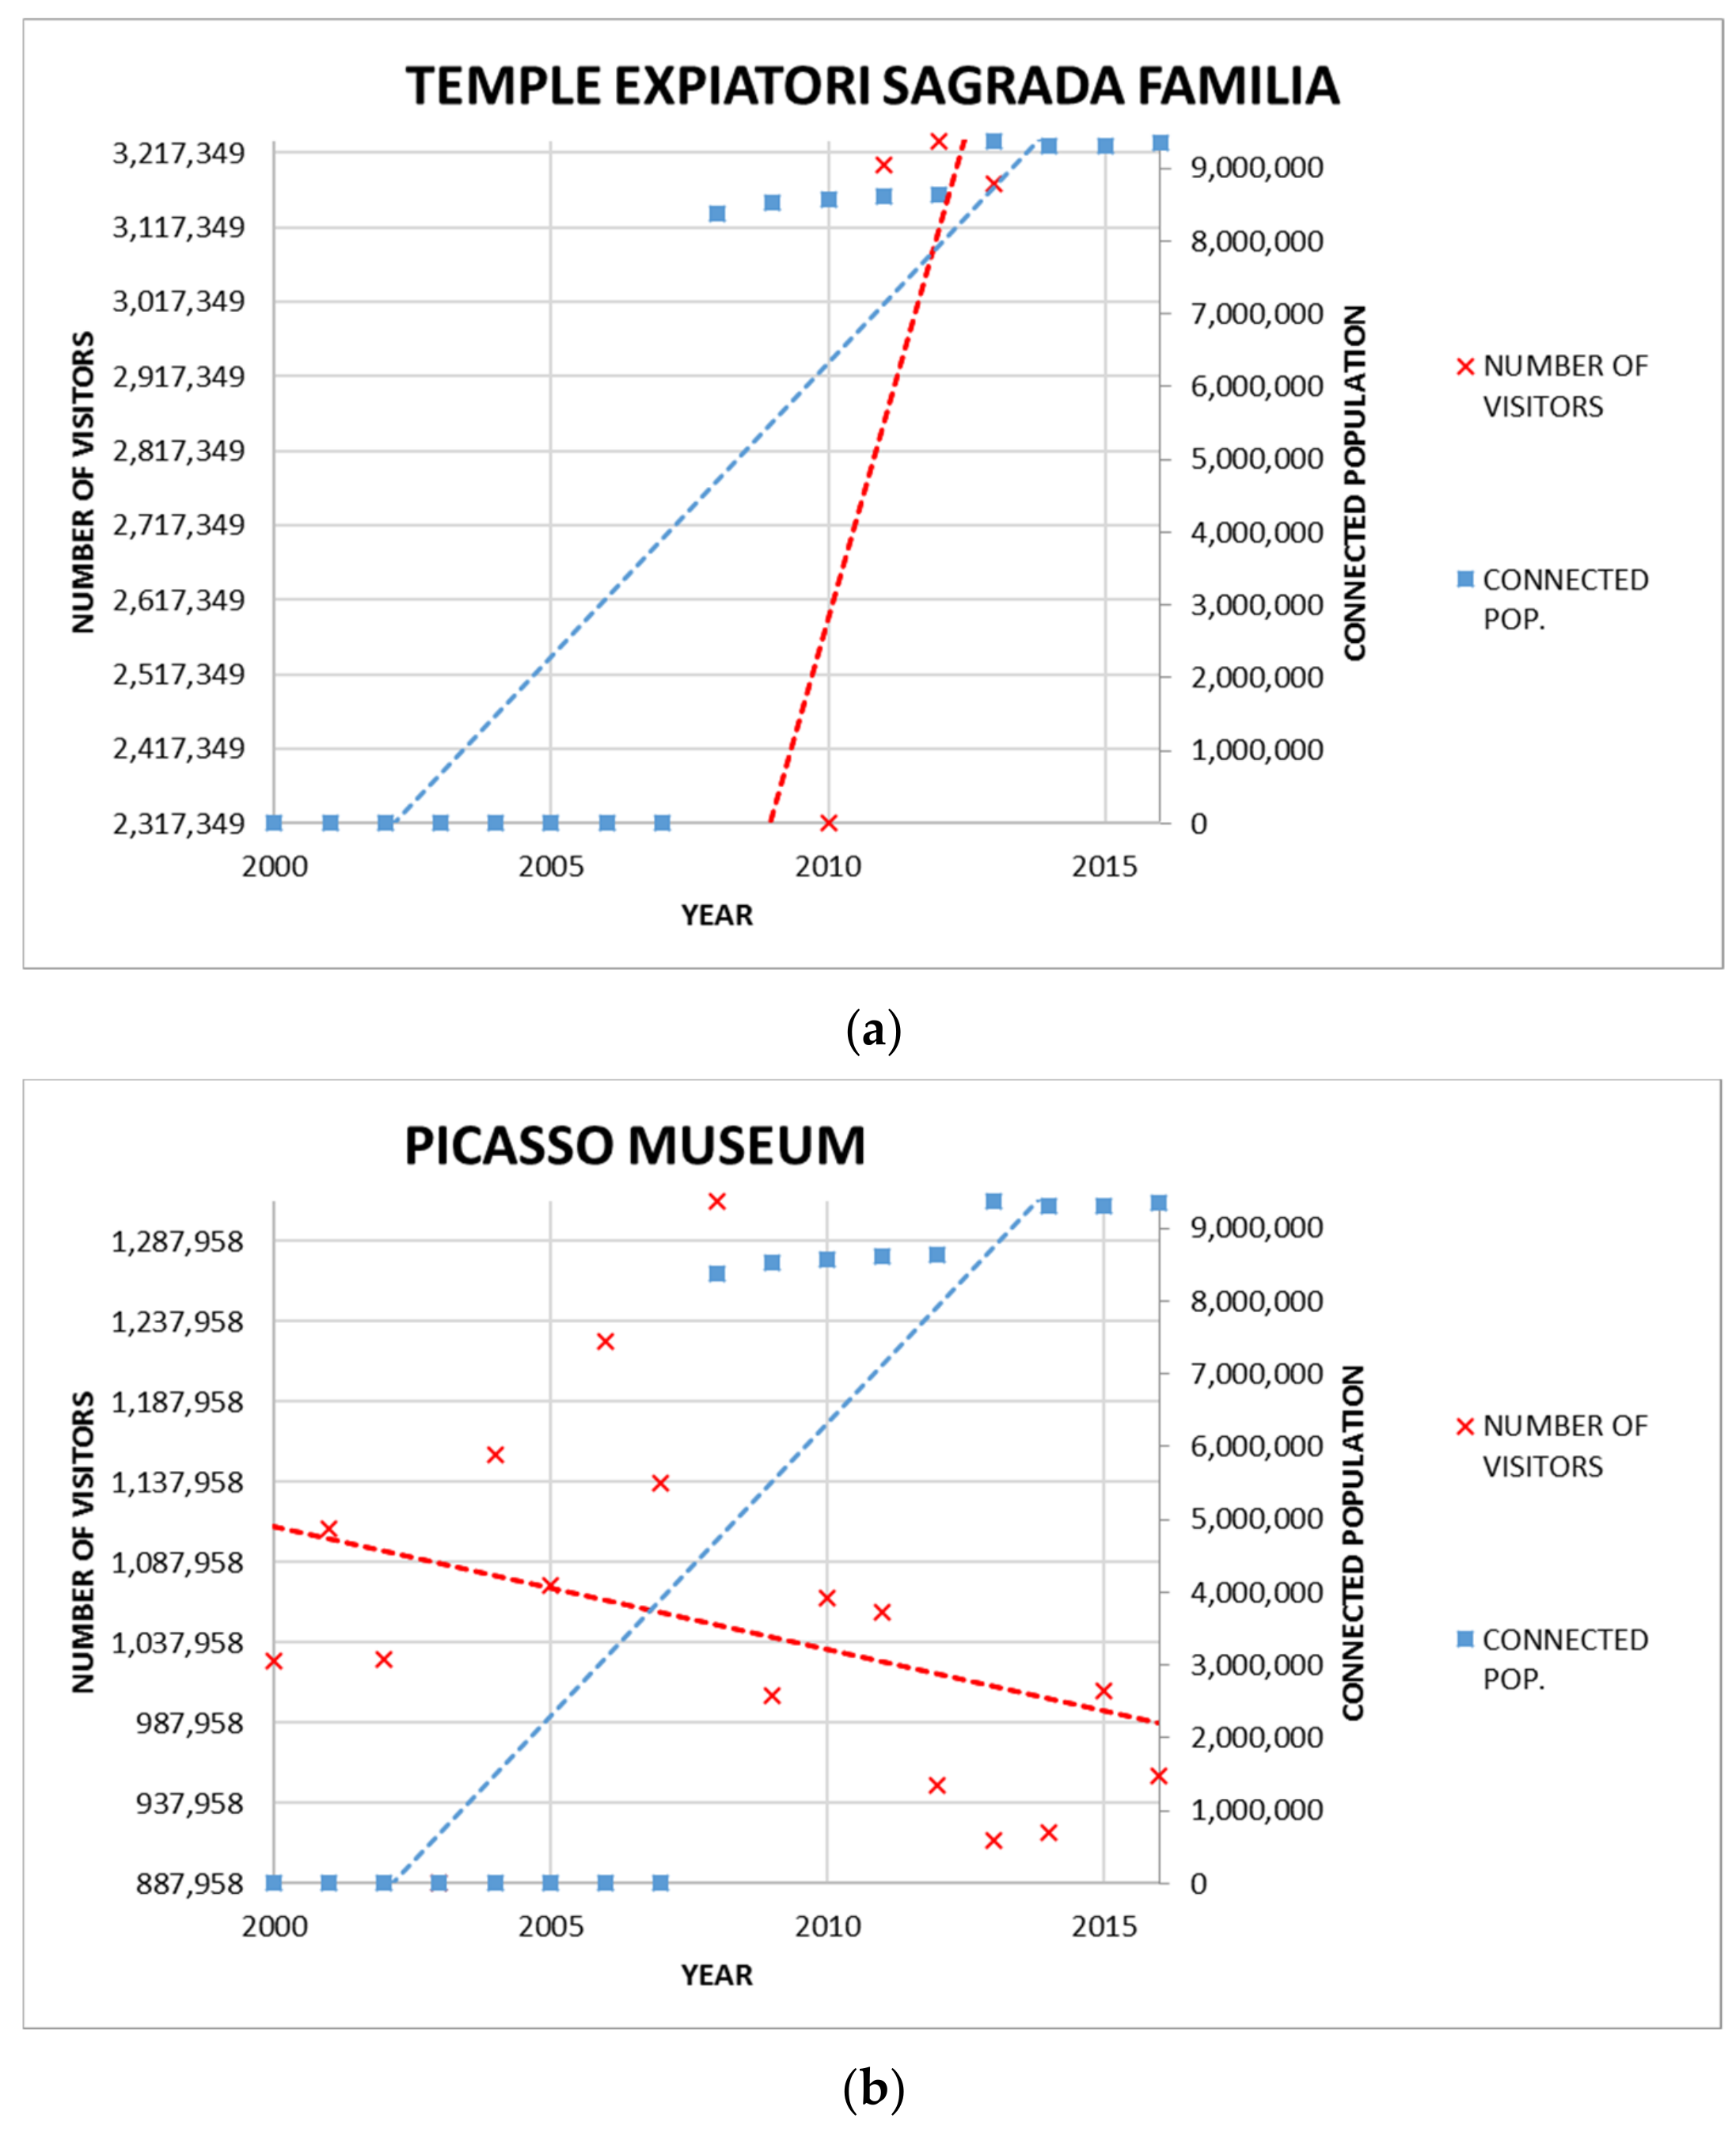
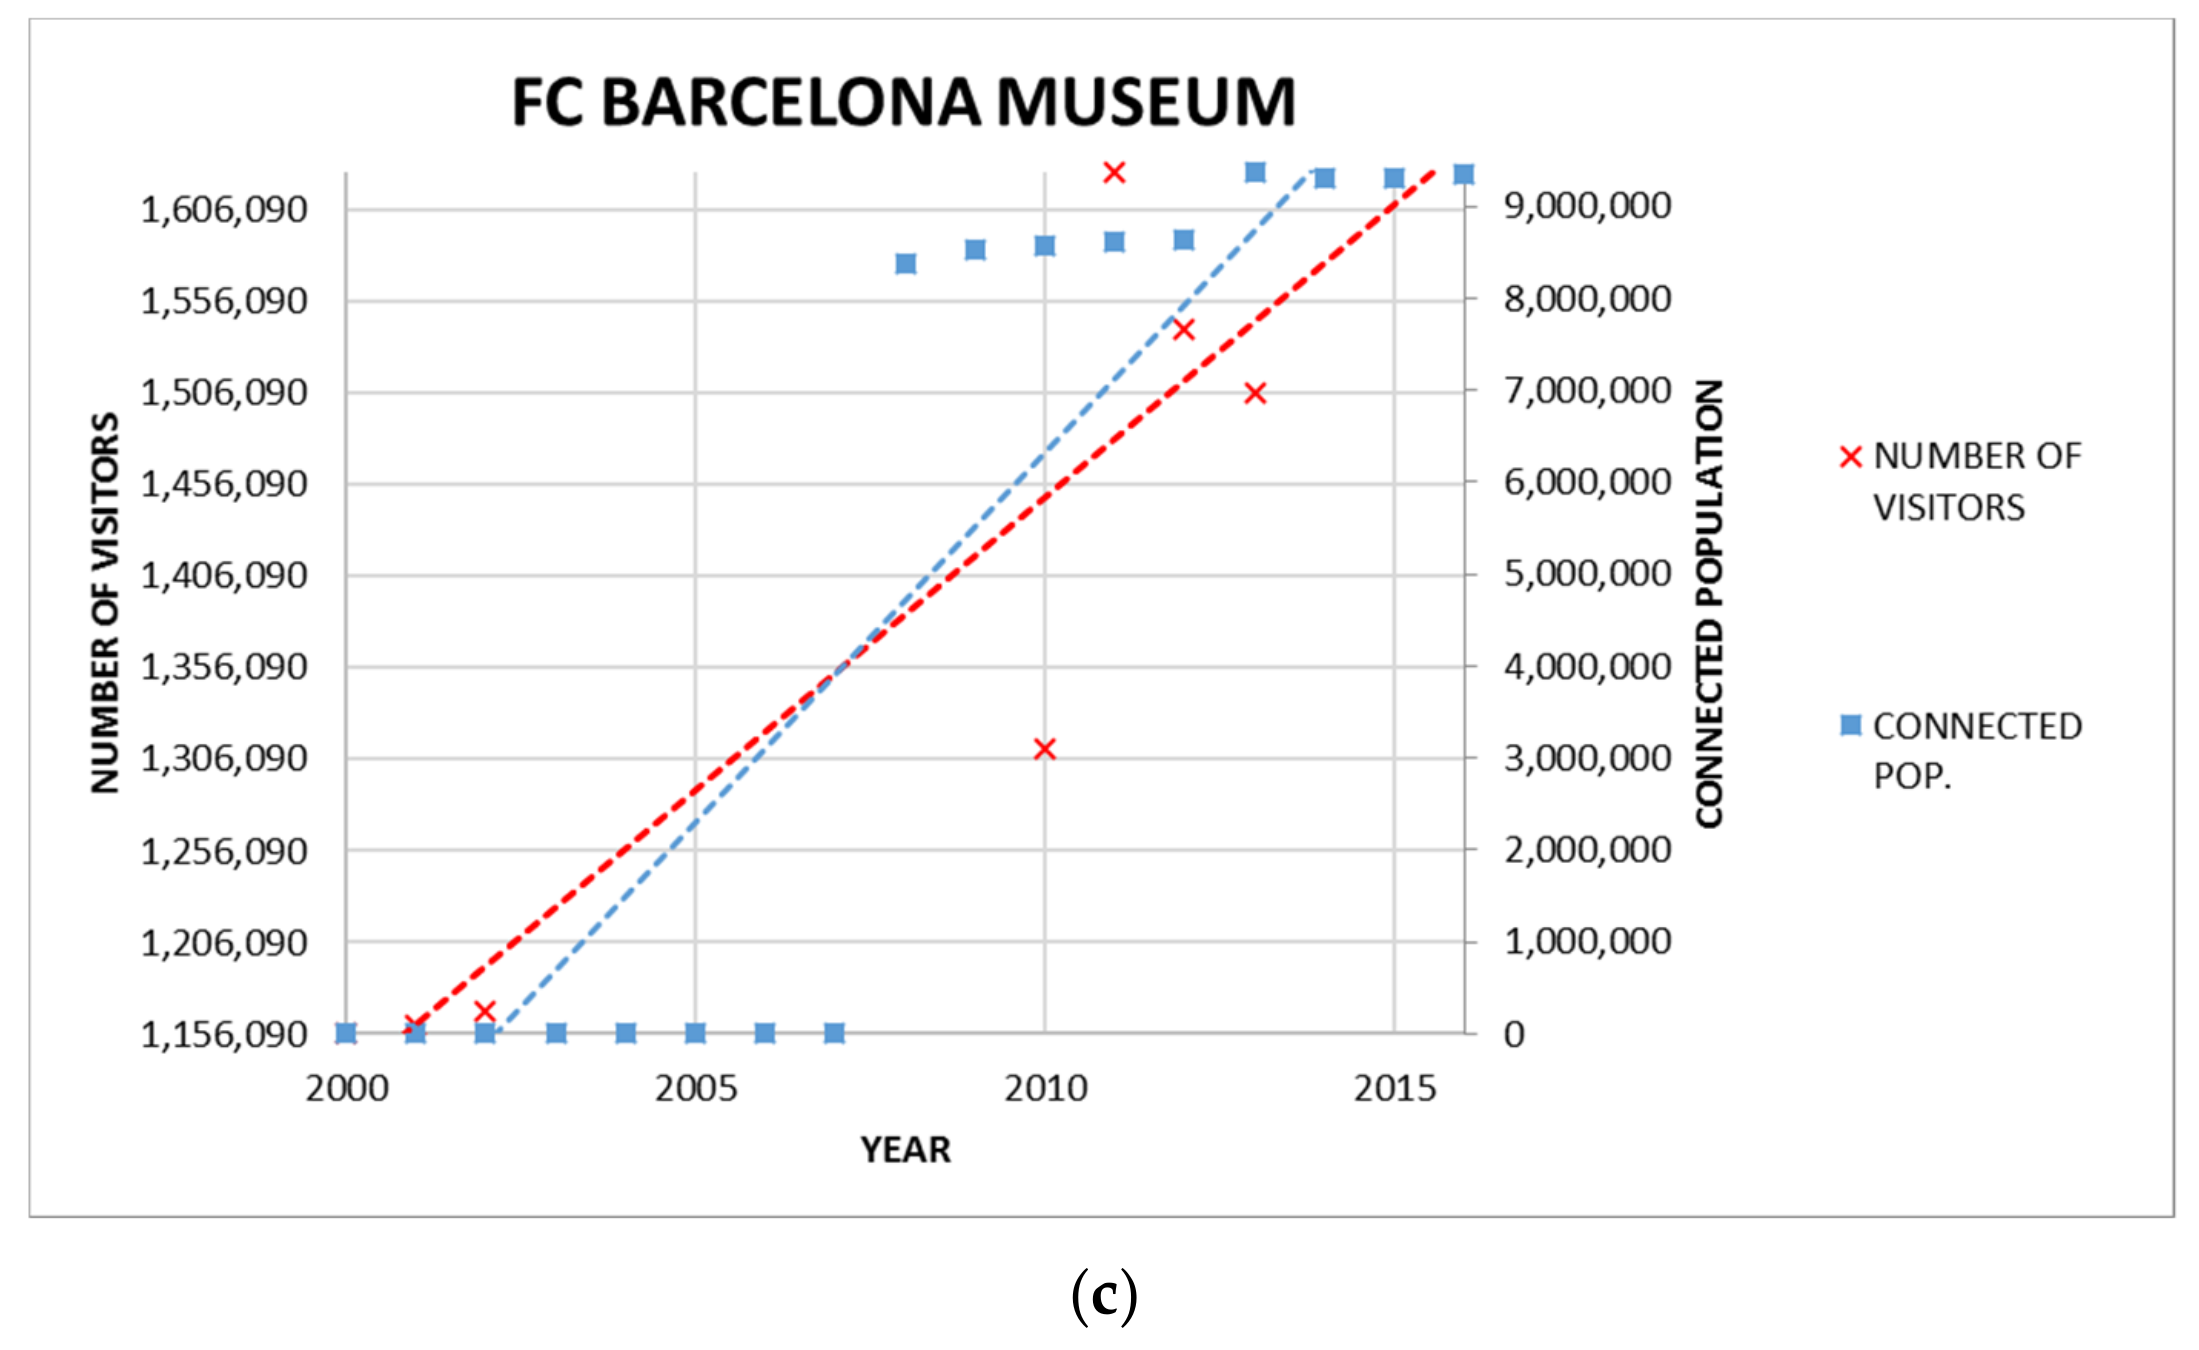
| T. Exp. Sagrada Familia | Picasso Museum | FC Barcelona Museum | Contemporary Art Museum | ||||||
|---|---|---|---|---|---|---|---|---|---|
| Dep.Var.: ln Visitt | Coef. | p > t | Coef. | p > t | Coef. | p > t | Coef. | p > t | |
| Year | 0.179 | 0.002 | **** | −0.007 | 0.321 | 0.029 | 0.365 | 0.029 | 0.310 |
| Connected Pop | −0.000 | 0.838 | −0.000 | 0.491 | −0.000 | 0.790 | −0.000 | 0.685 | |
| Const | −341.389 | 0.009 | **** | 27.685 | 0.332 | −45.683 | 0.466 | −45.683 | 0.423 |
| Obs | 4 | 17 | 17 | 17 | |||||
| R2 | 0.3878 | 0.1222 | 0.0231 | 0.0231 | |||||
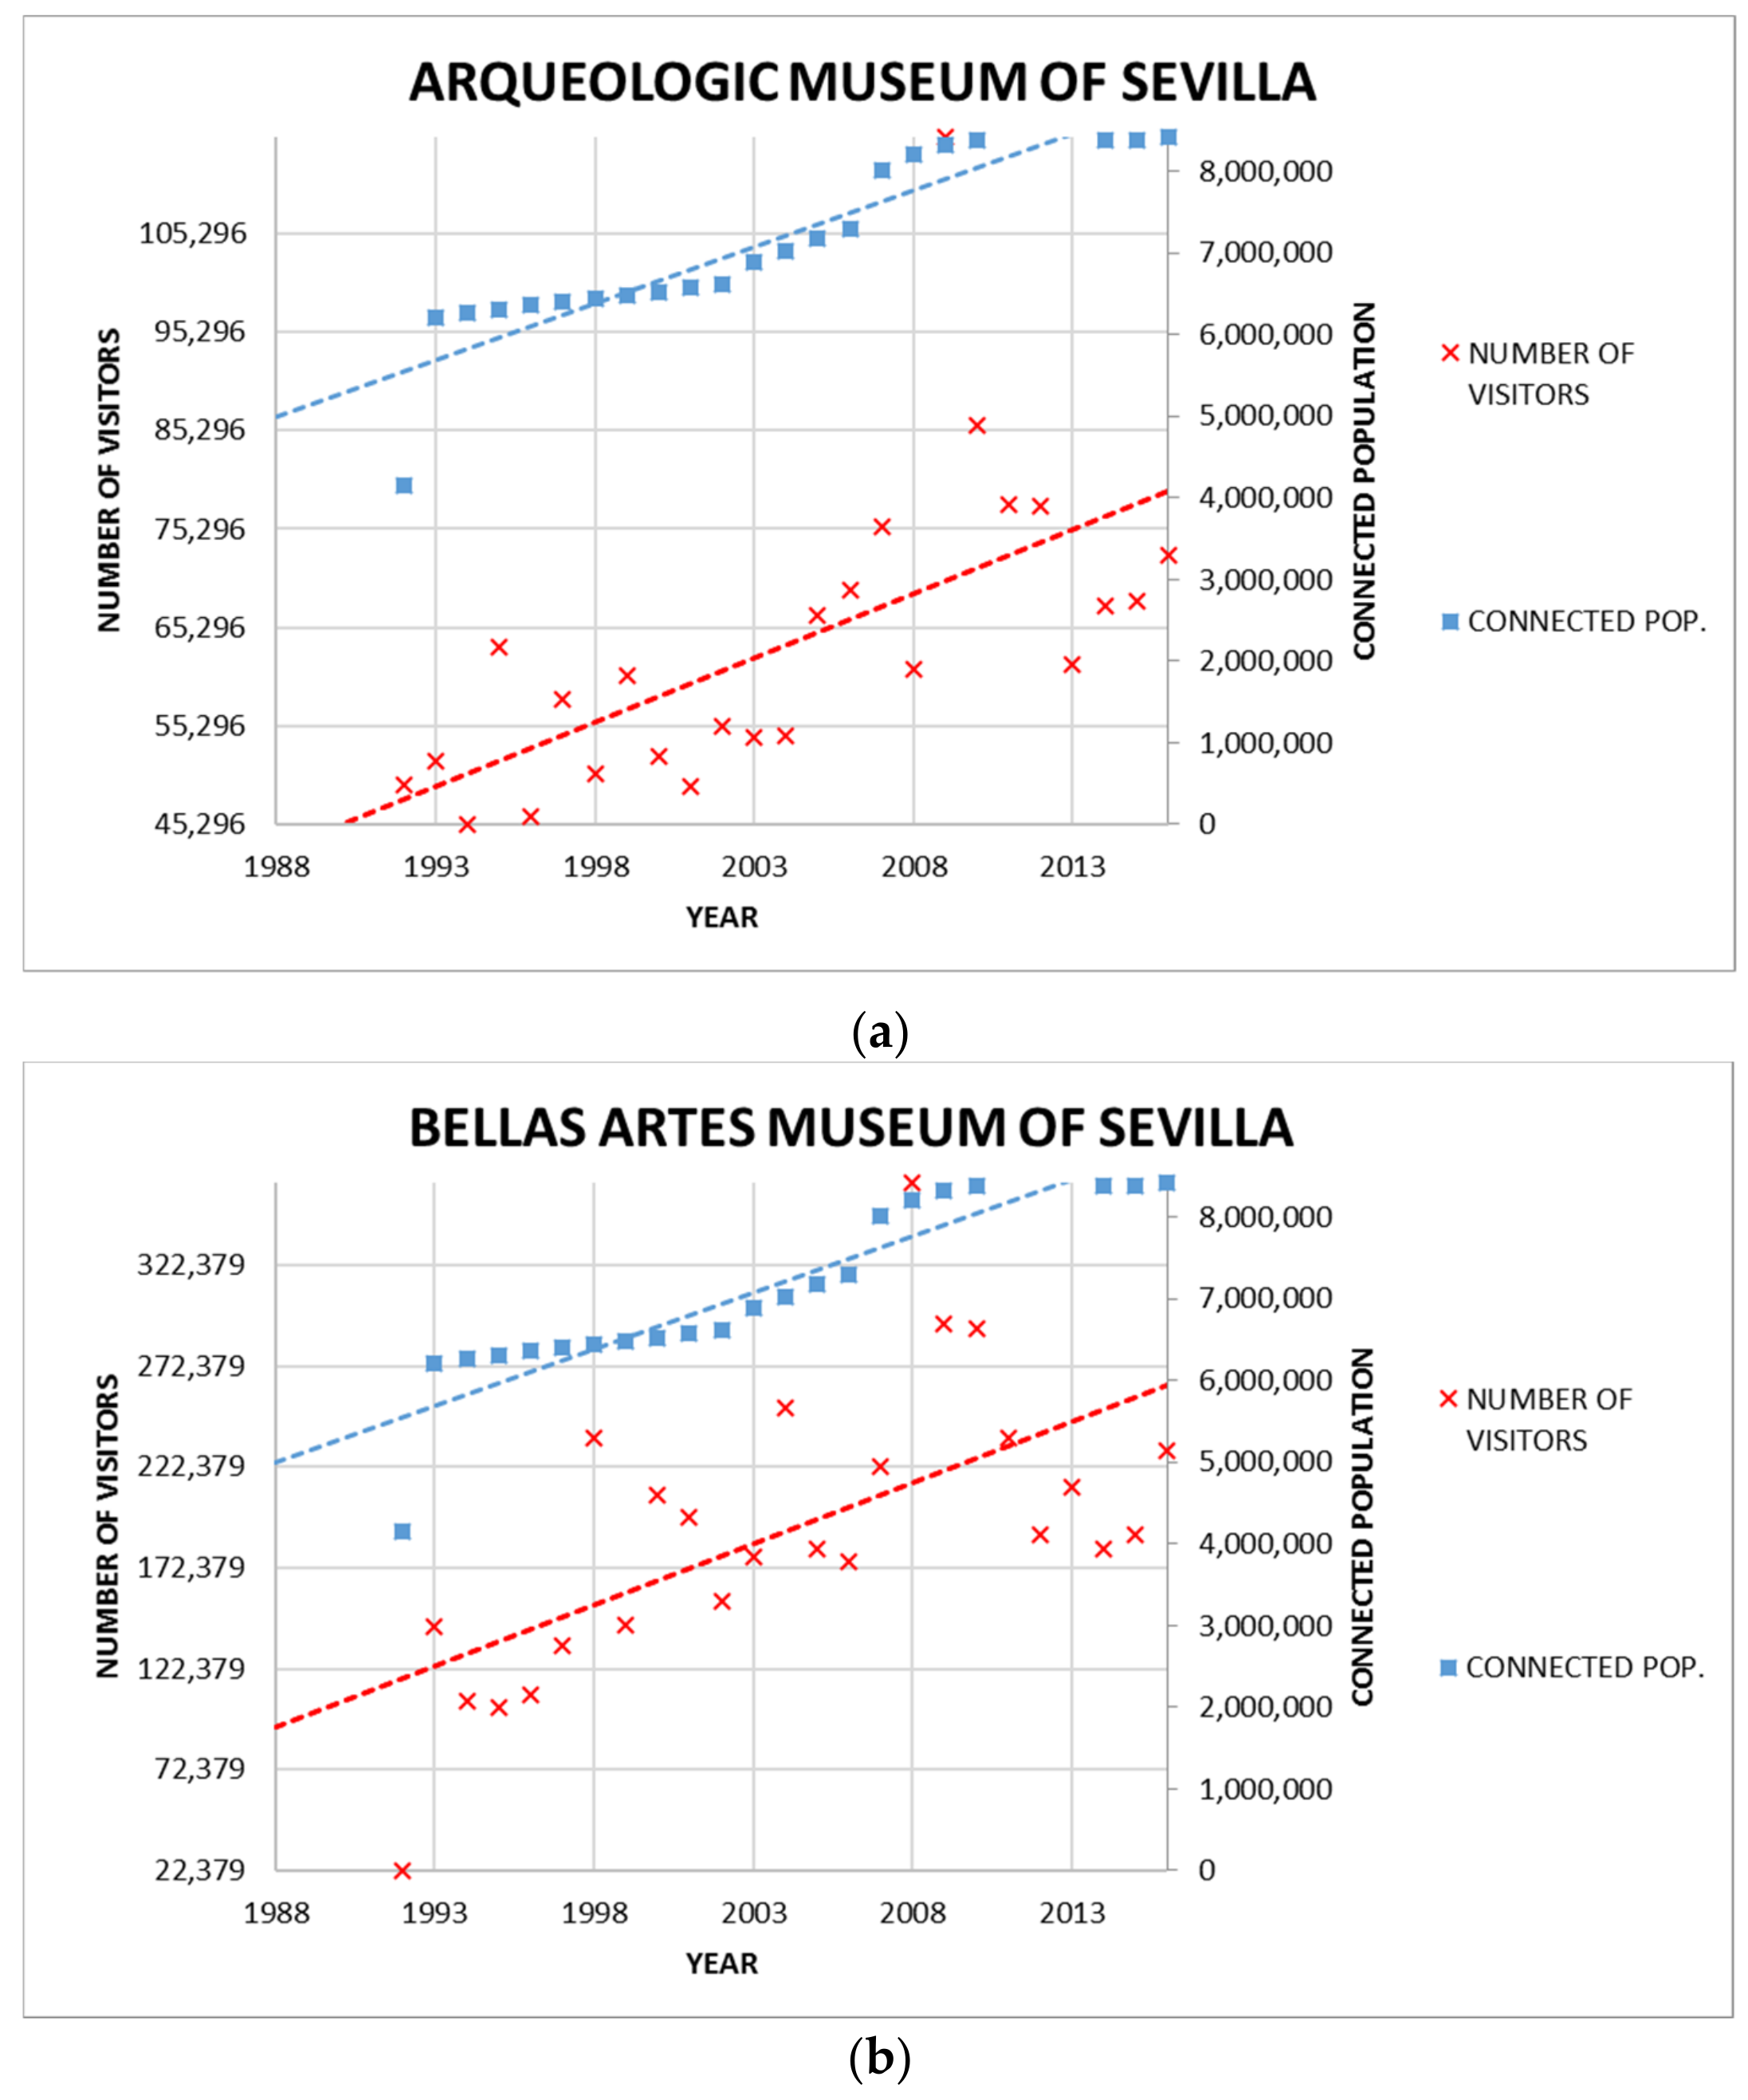
| Sev. Archaeolog Museum | Sevilla Fine Arts Museum | Cordoba Mezq. Cathedral | |||||||
|---|---|---|---|---|---|---|---|---|---|
| Dep. Var.: ln Visitt | Coef. | p > t | Coef. | p > t | Coef. | p > t | |||
| Year | 0.002 | 0.855 | −0.053 | 0.028 | *** | 0.048 | 0.000 | **** | |
| Connected Population | 0.000 | 0.098 | ** | 0.000 | 0.000 | **** | −0.000 | 0.001 | **** |
| Const | 5.840 | 0.797 | 113.466 | 0.017 | *** | −81.404 | 0.000 | **** | |
| Obs | 25 | 25 | 23 | ||||||
| R2 | 0.4989 | 0.6712 | 0.8256 | ||||||
© 2019 by the authors. Licensee MDPI, Basel, Switzerland. This article is an open access article distributed under the terms and conditions of the Creative Commons Attribution (CC BY) license (http://creativecommons.org/licenses/by/4.0/).
Share and Cite
Campa, J.L.; Pagliara, F.; López-Lambas, M.E.; Arce, R.; Guirao, B. Impact of High-Speed Rail on Cultural Tourism Development: The Experience of the Spanish Museums and Monuments. Sustainability 2019, 11, 5845. https://0-doi-org.brum.beds.ac.uk/10.3390/su11205845
Campa JL, Pagliara F, López-Lambas ME, Arce R, Guirao B. Impact of High-Speed Rail on Cultural Tourism Development: The Experience of the Spanish Museums and Monuments. Sustainability. 2019; 11(20):5845. https://0-doi-org.brum.beds.ac.uk/10.3390/su11205845
Chicago/Turabian StyleCampa, Juan Luis, Francesca Pagliara, María Eugenia López-Lambas, Rosa Arce, and Begoña Guirao. 2019. "Impact of High-Speed Rail on Cultural Tourism Development: The Experience of the Spanish Museums and Monuments" Sustainability 11, no. 20: 5845. https://0-doi-org.brum.beds.ac.uk/10.3390/su11205845