Article

Mitigation of CO2 and N2O Emission from Cabbage Fields in Korea by Optimizing Tillage Depth and N-Fertilizer Level: DNDC Model Simulation under RCP 8.5 Scenario

Department of Environmental Science and Ecological Engineering, Korea University, Seoul 02841, Korea
*
Author to whom correspondence should be addressed.
Sustainability 2019, 11(21), 6158; https://0-doi-org.brum.beds.ac.uk/10.3390/su11216158
Submission received: 19 September 2019 / Revised: 23 October 2019 / Accepted: 31 October 2019 / Published: 4 November 2019
(This article belongs to the Special Issue Global Warming, Environmental Governance and Sustainability Issues)

Abstract

:
In this study, we applied the Denitrification and Decomposition model to predict the greenhouse gas (GHGs; CO2 and N2O) emissions and cabbage yields from 8072 cabbage fields in Korea in the 2020s and 2090s. Model outputs were evaluated as a function of tillage depth (T1, T2, and T3 for 10, 20, and 30 cm) and fertilizer level (F1, F2, and F3 for 100, 200, and 400 kg N ha−1) under the Representative Concentration Pathways 8.5 climate change scenario. For both time periods, CO2 emissions increased with tillage depth, and N2O emissions were predominantly influenced by the level of applied N-fertilizers. Both cabbage yields and GHGs fluxes were highest when the T3F3 farming practice was applied. Under current conventional farming practices (T1F3), cabbage yield was projected at 64.5 t ha−1 in the 2020s, which was close in magnitude to the predicted cabbage demand. In the 2090s, the predicted cabbage supply by the same practice far exceeded the projected demand at 28.9 t ha−1. Cabbage supply and demand were balanced and GHGs emissions reduced by 19.6% in the 2090s when 94% of the total cabbage farms adopted low carbon-farming practices (e.g., reducing fertilizer level). Our results demonstrate the large potential for Korean cabbage farms to significantly contribute towards the mitigation of GHGs emissions through the adoption of low-carbon farming practices. However, in order to incentivize the shift towards sustainable farming, we advise that lower yield and potential economic losses in farmlands from adopting low-carbon practices should be appropriately compensated by institutional policy.

1. Introduction

According to the Intergovernmental Panel on Climatic Change (IPCC) [1], the global atmospheric concentration of carbon dioxide has increased from pre-industrial levels of ~280 ppm to 391 ppm in 2011 due to greenhouse gas (GHGs) emissions from the industrial, transportation, and agricultural sectors. Agricultural cropland accounts for approximately 11% of the global land area and 4.8% of the total global GHGs emissions [2,3]. In particular, upland farming is considered a significant source of carbon dioxide (CO2) and nitrous oxide (N2O) to the atmosphere and is responsible for 26% of the total GHGs emissions in Korea’s agricultural sector [4,5].
The Representative Concentration Pathways (RCP) adopted by the IPCC assumes that the continued and rapid increase of GHGs emissions will cause a projected global mean temperature rise of 1.0–3.7 °C by the late 21st century. Rising temperatures and altered precipitation patterns associated with global climate change are expected to further aggravate agricultural GHG emissions due to their influence on the carbon (C) and nitrogen (N) dynamics of cultivated soils [6,7]. It is therefore necessary to improve agriculture resilience to climate change through climate-adapted farming practices in order to minimize GHGs emissions.
A wide variety of crops, such as cereals (e.g., corn, wheat, and barley) and vegetables (e.g., cabbage and radish), are cultivated in upland fields in Korea [8]. Cabbage in particular is an essential vegetable in Korea, as it is a main ingredient of kimchi: a traditional side dish of salted and fermented vegetables [8,9]. Over the past few decades, farmers have applied agronomic practices, such as fertilization, irrigation, and tillage to improve crop yield. Tillage practices in upland farming can improve soil aeration through soil loosening, while the application of fertilizers promotes crop yield through the addition of essential elements [10,11]. The Korea Rural Development Administration (KRDA) has therefore established optimal fertilizer application and tillage depth recommendation levels for various agricultural crops. For cabbage cultivation, a standardized limit of 400 kg ha−1 of N fertilizers and a tillage depth of 10 cm are recommended.
The challenge of modern agriculture in response to climate change is to simultaneously improve crop yield and reduce GHG emissions. Managing both tillage depth and fertilizer application can influence GHG emissions due to their direct impacts on soil organic carbon (SOC) oxidation and the activity of soil denitrifying bacteria [11,12]. The majority of research to date has focused on the impacts of agronomic practices on either crop yield or GHG emissions individually under the different climate change RCP scenarios [6,7,13]. However, it is necessary to consider the simultaneous impacts of climate change on both crop production and GHG reduction to further our understanding on sustainable agriculture in response to climate change.
The denitrification and decomposition (DNDC) model is particularly advantageous, as it can estimate crop yield and GHGs (e.g., CO2 and N2O) emissions simultaneously [14]. The model can also simulate the overall impacts of various agricultural practices on model outcomes [15]. The DNDC model predicts crop yield by employing the plant growth algorithm from the Crop Environment Resource Synthesis (CERES) model, which has been validated in Korea using long-term national statistical data and field measurements [16,17]. Further, GHG emissions are assessed based on biochemical reactions of soil microorganisms in response to the immediate meteorological conditions [18].
Policies to reduce GHGs emissions are being developed and implemented worldwide. Policies such as the “Carbon Farming Initiative” of Australia and the “Grassland Ecological Incentive and Subsidy Policy” of China provide incentives to farmers through the control of agronomic practices [19]. Similarly, the Korean government plans to implement its “low-carbon farming” policy, which is a direct payment program that will provide compensation to farmers who voluntarily engage in GHG reduction through the adoption of agronomic practices [20]. The extent of GHGs reduction from participating farms should therefore be adequately assessed to determine the appropriate level of compensation for low-carbon farming practices. Arable lands in Korea are typically small in size and are distributed sporadically throughout the country [9]. According to the administrative record on agricultural products, Korea harbors 8072 cabbage farms with field sizes ranging between 0.01–94 ha. Large uncertainties would therefore arise in model predictions using large spatial scales due to inaccuracies associated with scattered and smaller-sized farmlands. It is therefore necessary to include high-resolution data to accurately predict and quantify the extent of GHG reduction achieved by adopting low-carbon practices.
In this study, we applied the DNDC model to predict both the level of GHGs emissions and crop yield in South Korean cabbage fields in response to climate change (RCP 8.5 scenario) and under different farming practices. We generated high-resolution (1 km2) weather and soil data for the model input by re-synthesizing raw data (12.5 km2) obtained from the Korea Institute of Public Administration. For farming practices, we included nine sets of input variables by combining three N-fertilizer application levels (100, 200, and 400 kg N ha−1) and three tillage depths (10, 20, and 30 cm). The Korean cabbage fields were split into 8072 1 km2 grid cells. The objectives of this study were to (i) validate the DNDC model’s capability to predict GHGs (CO2 and N2O) emissions from cabbage farms based on field measurements under different tillage depths and levels of applied N-fertilizer; (ii) simulate GHGs emissions and crop yield in Korea as a function of tillage depth and the level of fertilizer applied; and (iii) identify best cabbage farming practices to maximize cabbage production, minimize GHGs emission, and balance the future supply and demand of cabbage under the RCP 8.5 scenario.

2. Methods and Materials

2.1. Model Prediction

We applied the DNDC model (version 9.5; http://www.dndc.sr.unh.edu/) to predict the annual average cabbage yield (t ha−1 yr−1) and GHGs emissions (t CO2-eq ha−1 yr−1) in the 2020s and 2090s from Korean cabbage fields under the RCP 8.5 scenario. The DNDC model is a process-based biogeochemical model with a temporal resolution of one day and is based on the circulation of carbon and nitrogen in agricultural ecosystems [14]. Both CO2 and N2O emissions were converted to CO2-equivalents (CO2-eq) using the reported values of specific global warming potentials [1].

2.1.1. Study Sites

The geographical location and distribution of cabbage fields in South Korea are present in Figure S1a. South Korea is located between 33°09′ and 38°45′ N, and 124°54′ and 131°06′ E with a total national land area of 100,019 km2. We extracted the cabbage cultivation land cover data (1:25000 scale) from the Korea Ministry of Environment (KME) by incorporating the KRDA’s land suitability guideline for cabbage cultivation. The total cabbage field area was ~3200 km2, and cabbage farmland contributed 11.1–17.8% of the total upland area in the period of 1980–2015 [9]; the observed percentage variability is due to variability in previous year cabbage market prices.

2.1.2. Model Input Data

The model input data (i.e., climate, soil, and farming practices) are listed in Table 1. For climate data, we used the RCP 8.5 climate change scenario based on the Hadley Centre Global Environmental Model Version 3 Regional Atmosphere (HadGEM3RA) [21]. RCP 8.5 is a scenario of comparatively high greenhouse gas emissions and corresponds to the highest degree of projected climate change. We obtained daily temperature and precipitation data from 2011 to 2095 at a 1 km2 scale from the Korea Meteorological Administration (KMA, http://climate.go.kr). For soil data, we obtained initial SOC and pH from the KRDA’s soil database of approximately 365000 datapoints. Clay content and bulk density were reprocessed at a spatial resolution of 1 km2 for 377 domestic representative soil series based on a 1:25000 scale soil map.
We combined three tillage depths (10, 20, and 30 cm for T1, T2, and T3, respectively) and three N-fertilizer levels (100, 200, and 400 kg N ha−1 for F1, F2, and F3, respectively), equivalent to a total of nine farming practice input variables (e.g., T1F1, T1F2, T1F3, T2F1, T2F2, T2F3, T3F1, T3F2, and T3T3), to assess the effects of farming practices on model outcomes. We applied the KRDA method in the model simulation to include other input data such as cultivation period, timing of fertilization, and plowing, etc. For cabbage farming in Korea, a tillage depth of 10 cm (T1) and a N-fertilizer application of 400 kg N ha−1 (F3) are recommended by the KRDA. This farming practice combination (T1F3) is therefore referred to as the “conventional method” in this study.
We used the average climate and soil data from 2006 to 2015 as the model baseline for the 2016 to 2095 model-run period. We conducted the 80-year simulation from 2016 to 2095 following the 5-year 2011 to 2015 run-up. The results for each ten-year period (2016–2025 and 2086–2095) were averaged and referred to as the 2020s and 2090s, respectively.

2.1.3. Identifying Best Farming Practices to Achieve Three Scenario Goals

In this study, we aimed to identify the best farming practices (tillage depth and fertilizer level) to achieve the following scenarios: (1) minimum GHGs emissions, (2) maximum cabbage production, and (3) appropriate levels of cabbage production to balance future cabbage demand. To accomplish these goals, we ran the model by assigning one of the nine farming practices (e.g., T1F1, T1F2, T1F3, T2F1, T2F2, T2F3, T3F1, T3F2, and T3T3) to each of the 8072 grid cells until the desired goal was achieved. We began by assigning T1F3 (i.e., the conventional method) to all grid cells for comparison. We obtained model outputs for annual average cabbage yield (t ha−1 yr−1) and GHGs emissions (t CO2-eq ha−1 yr−1) for all cases.
In order to identify the scenarios of lowest national GHG emissions (scenario 1), we input low-carbon farming practices to the grid cells in which the GHG emissions from conventional practices (T1F3) were greater than the national average. To identify the scenario of highest cabbage production (scenario 2), higher-yield farming practices were applied to the grid cells in which cabbage yield were lower than the national average. For the third scenario model run, we forecasted the future cabbage demand in the 2020s and 2090s using the Korea agricultural simulation model (KASM) developed by the Korea Rural Economic Institute [22]. Demand forecasting was performed based on the analysis of past cabbage demand and trade under present market conditions. To therefore identify the scenario resulting in crop yield closest to contemporary demand, we applied low-carbon farming practices to the grid cells in which conventional farming cabbage yields were greater than the demand.

2.2. Field Measurements

2.2.1. Experimental Site and Data Collection

To verify the DNDC model prediction capabilities, we measured in-situ GHGs emissions under varied farming practices (tillage depth and fertilizer level) in a cabbage field (37°35′01″ N, 127°14′16″ E) located at the Korea University Agricultural Farm (Deokso field) in Gyeonggi Province. A combination of upper and lower limits for tillage depth (T1 and T3) and fertilizer level (F1 and F3) were selected for field validation, which therefore includes T1F1, T1F3, T3F1, and T3F3 (Table 1). We measured CO2 and N2O emissions approximately once every month from March to November 2018 (9 samples for CO2 and N2O emissions for each set). The soil properties of the Deokso field were as follows: bulk density of 1.2 ± 0.1 g cm−3, clay content of 22 ± 2.3%, initial SOC content of 3.0 ± 0.2%, and pH of 6.2 ± 0.1 (1:5 with H2O).

2.2.2. Measurements of CO2 and N2O Emissions

We conducted the one-year GHGs measurements using the closed chamber method modified from our previous work [23]. The system consists of a closed chamber and a measurement unit in which a moisture filter, direct current (DC) pump, flow meter, CO2 detector module, and data logger are sequentially connected (Figure S1b). Gas sampler ports with a cock valve were installed on top of the chamber. An opaque acrylic cylinder chamber with a volume of 25.1 L and diameter of 30 cm was anchored into the soil surface to collect gas emitted from the soil. This method detects the concentration change over time until the gas level in the chamber reaches a steady state. A DC pump (Motorbank, Korea) and an air flow meter (Dwyer, USA) were installed to maintain a constant flow rate (≅1 L min−1) of air between the chamber and the detector, thereby forming a continuous air circulation system containing GHGs.
The concentration of CO2 was directly determined using a CO2 sensor (Soha-Tech, Korea) incorporated within the measurement unit. To measure N2O, 30 mL of air was collected by syringe through the sampling port from a closed chamber. The sample was immediately transferred to pre-evacuated 12 mL vials (Labco, 839W, UK) for sample preservation during transport to the laboratory [24]. In the laboratory, the concentration of N2O was determined using a gas chromatograph (Simadzu, GC-2010, Japan) equipped with an electron capture detector. N2O peak separation was performed using a stainless-steel column packed with an 80/100 mesh Porapak Q (Agilent, CP-3800, USA). The carrier gas was N2 at a flow rate of 30 mL min−1, and the make-up gas was a mixture of 10% CO2 in N2 at 6 mL min−1. The temperatures of the oven, injector, and detector were set to 55, 100, and 340 °C, respectively [4]. The volume of sample injection was 500 μL. Over 11 min running time, N2O peak retention time was 5.8 min.
Field measurements were conducted twice on a given day (between 8:00–11:00 a.m. and between 3:00–6:00 p.m.) and the results were averaged to determine daily emissions based on the sampling protocols [24]. The flux of gas emissions (gas flux, F, mg m−2 hr−1) was calculated by Equation (1) [4]:
F = ρ · [ V A ] · [ Δ C Δ t ] · [ 273 ( T + 273 ) ] ,
where ρ is the density of gas (mg m−3), V is the volume of the chamber (m3), A is the area of the bottom of the chamber (m2), Δ C Δ t is the average rate of change in concentration (ppmV h−1), and T is the average temperature in the chamber (°C).

2.3. Statistical Analysis

We employed the coefficient of determination (r2) to validate the DNDC model performance, as shown in Equation (2) [16]:
r 2 = ( i = 1 n ( M i M ¯ ) ( P i P ¯ ) i = 1 n ( M i M ¯ ) 2 · i = 1 n ( P i P ¯ ) 2 ) 2 ,
where P i is the predicted value, M i is the measured value, i = 1, …, n is the number of measured values, and P ¯ and M ¯ are the means of the predicted and measured values, respectively. Statistical differences were determined at the significance level of p < 0.001 for between field measurements and model prediction and at p < 0.05 for between farming variables using SAS 9.4 (SAS Institute Inc., USA).

3. Results and Discussion

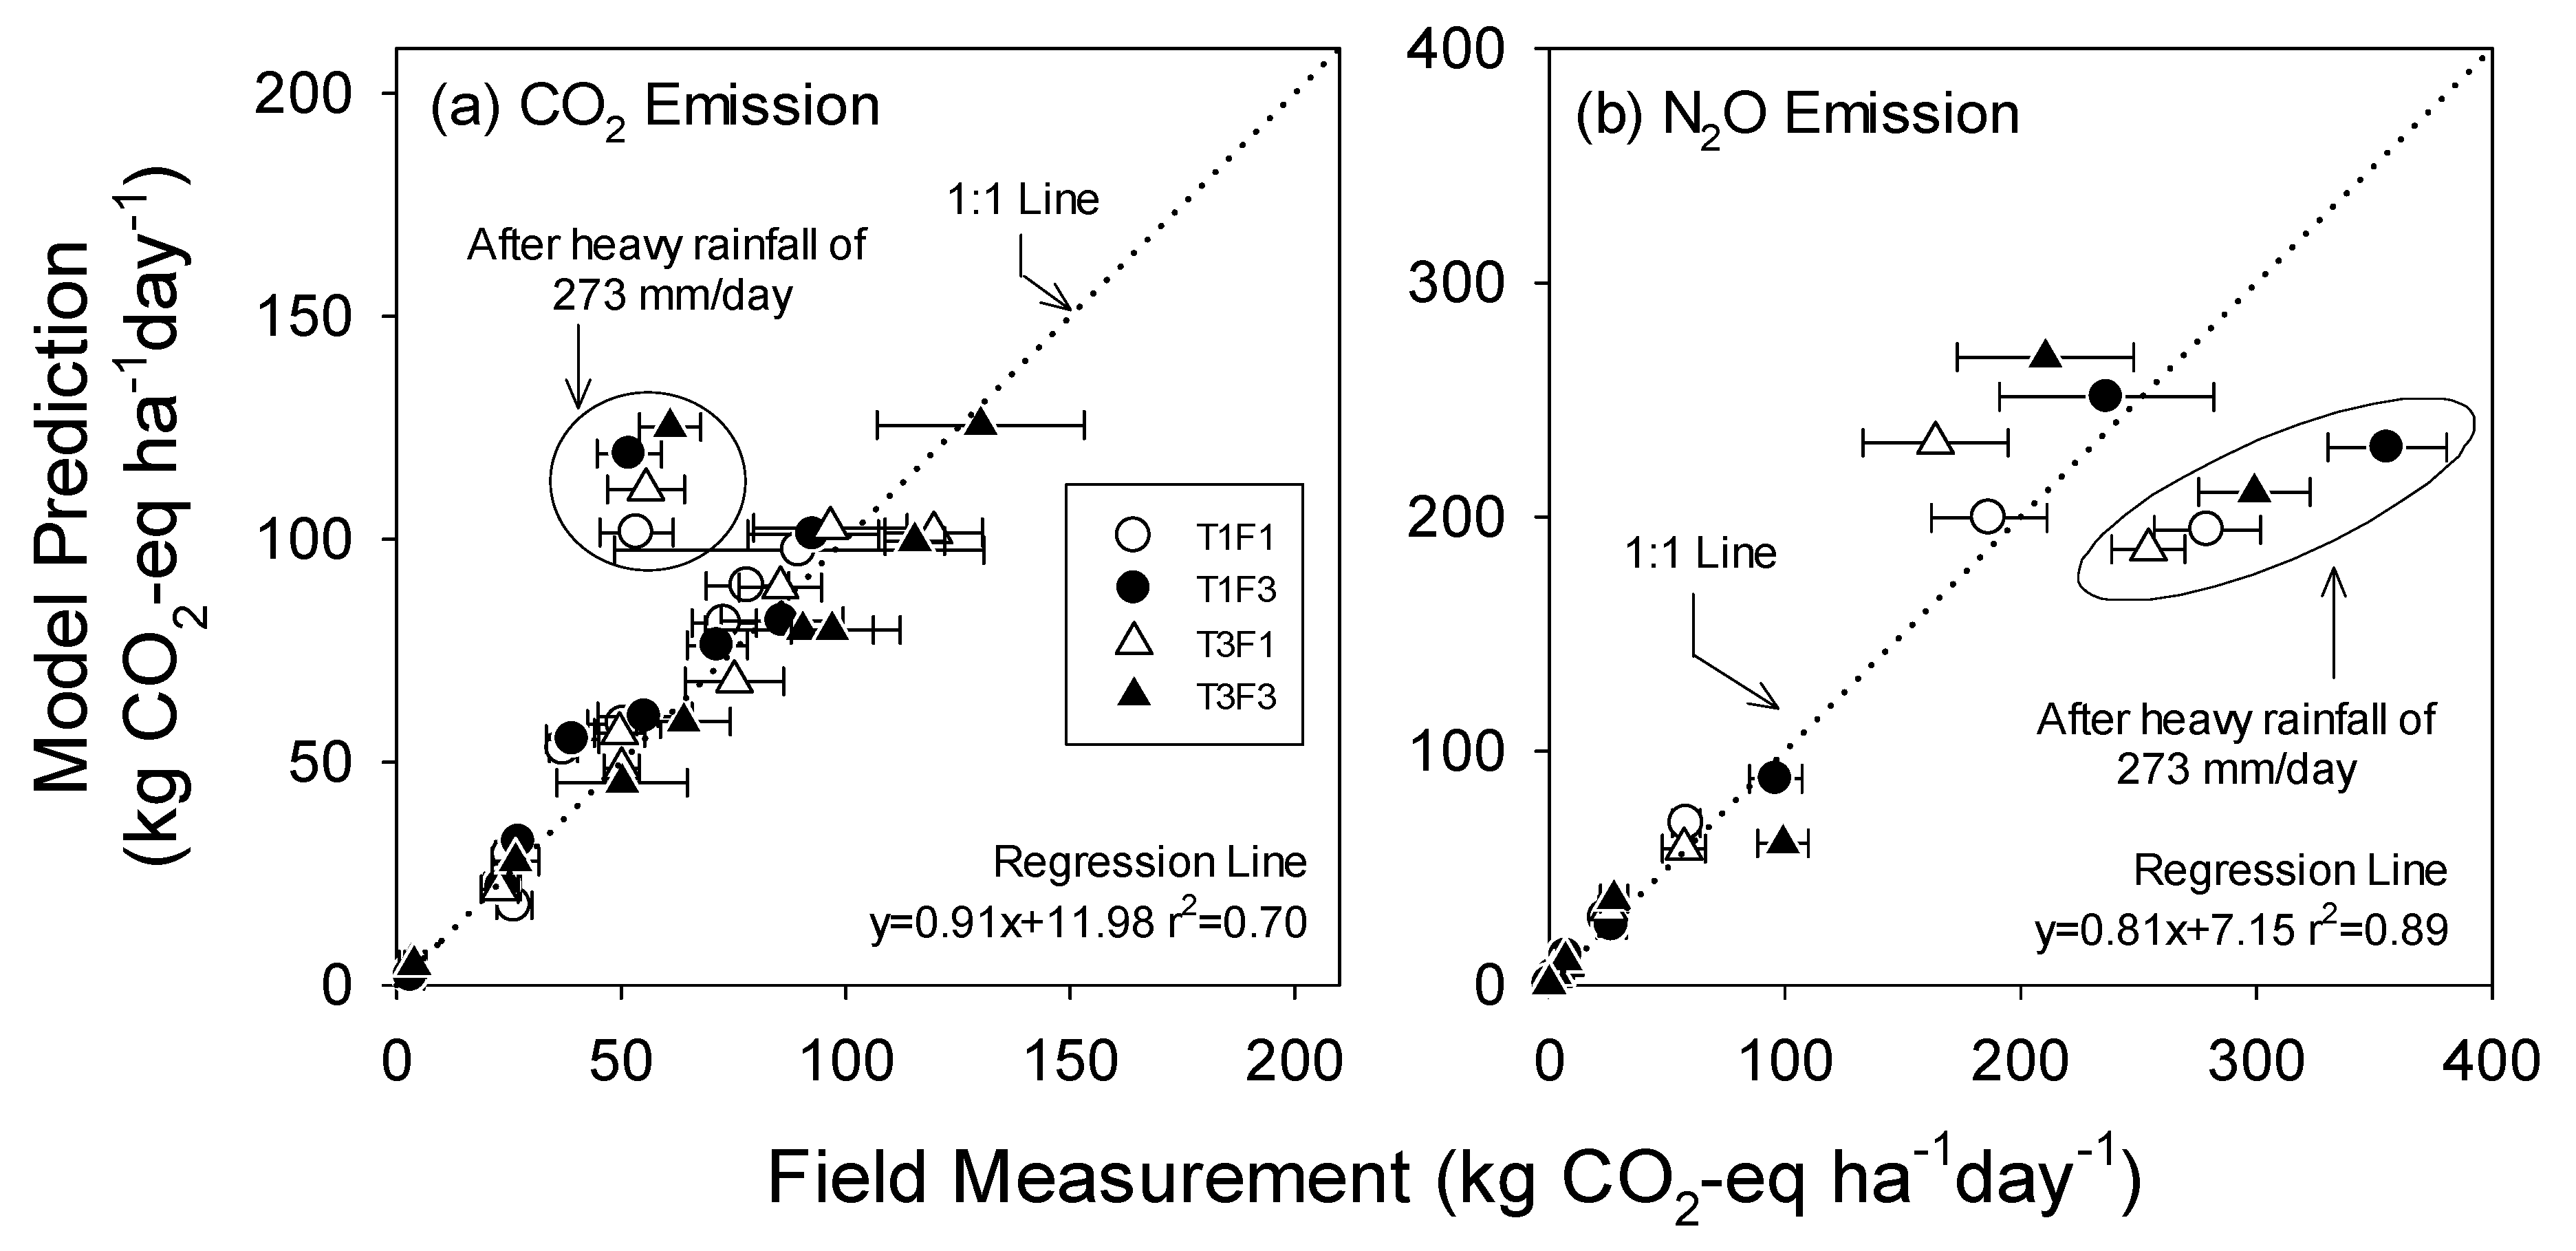
3.1. Field Verification of DNDC Model Predictions

Air temperature and the magnitude of rainfall during the field study are shown in Figure 1a. The annual mean temperature was 12.6 ± 2.4 °C and the annual precipitation was 1467 ± 185 mm. Rainfall was concentrated between June and September, representing a typical East Asian monsoon climate. Heavy rainfall (e.g., >110 mm according the criteria of Hong [25]) was recorded twice on the weeks of June 26 and August 29 at 118 mm and 279 mm, respectively. The period of cabbage cultivation recommended by the KRDA is between August 11 and October 31. Figure 1b,c compares the model GHGs outputs with selected field measurements under the T1F3 farming practice. The annual flux of CO2 and N2O from the cabbage field were 19.3 ± 0.5 t CO2-eq ha−1 yr−1 and 4.4 ± 0.6 t CO2-eq ha−1 yr−1, respectively, and the daily flux of GHGs peaked in the week of heavy rainfall. During the non-cropping season, N2O flux was negligible while emissions of CO2 continued.
Field measurements of daily CO2 and N2O emissions (n = 36 for each) under four farming practices (T1F1, T3F1, T1F3, and T3F3) are plotted with their respective model outputs in Figure 2. We determined r2 values of 0.70 (p < 0.001) for CO2 and 0.89 (p < 0.001) for N2O through linear regression analysis of the two datasets. The coefficient of determination (r2) signifies how accurately field measurements are replicated by the model prediction. The 1:1 line is represented as dotted lines. Our r2 results therefore indicate that the DNDC model can accurately predict GHGs emissions from cabbage fields under the different farming practices investigated in this study.
However, we observed an apparent deviation from the correlation in the week of heavy rainfall (Figure 2). We observed slightly higher CO2 flux estimates and lower N2O flux estimates relative to the field measurements. This deviation may be attributed to the underestimation of soil volume wetness (%). The model prediction of soil wetness is well correlated with field measurements throughout the year (Figure S2). However, during the week of heavy rainfall (e.g., August 29), the modelled soil wetness (~22%) was significantly lower than the field measurements (~33%). The model exaggeration of soil drainage will overestimate the oxygen supply for microbial degradation of soil organic matter (SOM), which in turn will overestimate soil CO2 production [26]. Conversely, the model could underestimate denitrification due to its overestimation of redox potential [11,18].

3.2. Modeling Results under Different Farming Practices

Model results for annual cabbage yield (t ha−1 yr−1) and annual GHGs emissions (t CO2-eq ha−1 yr−1) under the RCP 8.5 scenario and as a function of the nine farming practices are shown in Table 2. The results of the KRDA’s conventional farming method (i.e., T1F3; 10 cm tillage depth and 400 kg N ha−1 fertilization) are italicized. Further, we also illustrate the results of the model baseline, which assumes no climate change under conventional practices (T1F3).

3.2.1. Impacts of Farming Practices on Cabbage Yield and GHGs Emissions

Projected cabbage yield (t ha−1 yr−1) and GHGs emissions (t CO2-eq ha−1 yr−1) for the 2020s and 2090s varied widely depending on the farming practice applied. For a given fertilizer level, the predicted cabbage yield had increased with increasing tillage depth (T1 to T3). Likewise, for a given tillage depth, higher N-fertilizer application increased cabbage yield. Thus, we projected highest cabbage yields under the T3F3 farming practice for both the 2020s and 2090s as 65.8 t ha−1 yr−1 and 104.3 t ha−1 yr−1, respectively. We found the impact of N-fertilizer levels on cabbage yield to be significantly different within the range of the two farming variables (significance level of α = 0.05). For example, increasing fertilizer application (from F1 to F3) resulted in an 87.9% (30.6 t ha−1 yr−1) increase in cabbage yield for T1 in the 2020s. In contrast, increasing tillage depth (from T1 to T3) resulted in only a 44.8% increase in yield (15.6 t ha−1 yr−1) for the lowest fertilizer level (F1) in the same period. Further, tillage depth became less impactful on yield at conventional levels of N-fertilizer input (F3). For example, the projected cabbage yields for T1F3, T2F3, and T3F3 showed no statistical difference (α = 0.05) in both the 2020s and 2090s. Our results suggest that the impacts of deep tillage on cabbage production are insignificant when adequate levels of N are supplied.
Both CO2 and N2O emissions increased concurrently with increasing tillage depth and N-fertilizer levels (Table 2). The flux of CO2 was therefore highest under T3F3. Within the range of variables in this study, tillage depth had a larger influence on CO2 emissions. For example, for a given tillage depth, increasing fertilizer addition (from F1 to F3) led to a CO2 increase of ≤0.9 t CO2-eq ha−1 yr−1, while increasing tillage depth from T1F3 to T3F3 led to an increase of 1.7 t CO2-eq ha−1 yr−1 (~17%) in the 2020s. Similar CO2 emissions patterns were observed for the 2090s. However, cabbage yield remained statistically constant with increasing tillage depth under conventional levels of N-fertilizer application. Deeper tillage can promote CO2 production, as it improves air supply to heterotrophic microbes for SOM degradation [10,12].
In contrast to CO2, the flux of N2O was highest under T1F3. N2O emissions had increased with increasing N-fertilizer addition but decreased with increasing tillage depth. For example, in the 2020s, the level of N2O emissions occurred in the following order: T1F3 > T1F2 > T1F1 and T1F3 > T2F3 > T3F3. Nitrogen-fertilizers are a main source of N2O formation during the denitrification process in agricultural ecosystems [11]. In the DNDC model, urea (CO(NH2)2) application undergoes a series of biochemical reactions in soil as follows: urea → NH3 → NO3 → NO2 → NO → N2O. Each nitrogen-loss process is performed primarily by heterotrophic bacteria in anoxic environments. Thus, deep tillage practices can limit the formation of N2O due to rapid gas exchange between the soil and atmosphere.

3.2.2. Impacts of Climate Change on Cabbage Yield and GHGs Emissions

Under the RCP 8.5 climate change scenario, both cabbage yield and GHGs emissions are significantly higher in the 2090s relative to the 2020s regardless of the farming practice applied. The model projects a 28–44 t ha−1 yr−1 increase in cabbage yield from the 2020s to the 2090s depending on the farming practice applied. We observe increases of 0.2–0.6 t CO2-eq ha−1 yr−1 for CO2 emissions and 0.6–1.3 t CO2-eq ha−1 yr−1 for N2O emissions (Table 2). Further, we observed no significant difference in the outputs of the model baseline between the two time periods (α = 0.05).
According to the RCP 8.5 scenario, the model predicts the mean temperature and precipitation of the 2090s cropping season to be 23.2 °C and 281 mm, respectively, which are significantly higher than the baseline values at 18.0 °C and 242 mm, respectively. If sufficient nutrients are supplied, the physiological activity of cabbage plants are enhanced under these predicted climatic conditions, leading to increased farmland productivity [14,17]. Note that the annual cabbage yield increases with increased fertilization in the order of F3 ≥ F2 >> F1. Under conventional farming methods, cabbage yield is expected to increase by 38 t ha−1 yr−1 from the 2020s to the 2090s.
Within the range of variables considered in this study, the percentage rise in N2O is higher than the rise in CO2 between the two time periods. N2O emissions in the 2090s were 11–50% higher than the 2020s, while the rise in CO2 emissions were ≤6% higher than the 2020s. The production of CO2 and N2O from the microbial decomposition of SOM and the denitrification of N-fertilizers, respectively, are both temperature dependent processes [14]. The observed temperature increase following the RCP 8.5 projections suggests that the activity of microbial denitrification is expected to increase by 2–4 times, while the activity of microbial SOM decomposition will be less affected [27]. We would therefore expect a greater rise in N2O relative to CO2 emissions due to the different temperature dependencies of the biochemical reactions [14,18]. Previous modeling studies have also reported similar future GHGs emissions predictions of upland fields under various climate scenarios [6,7,13]. For example, CO2 was found to be the dominant cause of future temperature rise and was projected to increase by 5%–14% from the 1990s to the 2090s [6]. In agreement, another study projected an increase in Canadian N2O emissions of 9.5%–31.2% in 2071–2100 relative to baseline levels in 1971–2000 [13].

3.3. Model Results of the Best Farming Practices

The model outputs for cabbage yield and GHGs emissions optimized to best achieve the three scenario goals (i.e., minimizing GHGs, maximizing yield, and maintaining demand) in the 2020s and 2090s are presented in Table 3. For comparison, the model outputs from the conventional method (i.e., T1F3) are also shown in Table 3. Under the conventional method, cabbage yield in the 2020s is almost equal to the demand, while a cabbage yield of 33.9 t ha−1 yr−1 exceeds demand in the 2090s. Table S1 shows the optimum distribution of the nine farming practices over the 8072 cabbage fields to achieve each scenario goal.
The minimum cabbage field GHGs emission was achieved by adopting low-carbon farming practices (e.g., 75% of T1F1, 22% of T2F1, and 3% of T3F1 for the 2020s and 94% of T1F1 and 6% of T2F1 for the 2090s; Table S1). This particular distribution of farming practice would reduce GHGs emissions by 26.4% and 23.1% in the 2020s and 2090s, respectively, compared to conventional farming. However, this scenario is unrealistic, as cabbage production is projected to be lower than the forecast for demand. A smaller difference between yield and demand was observed in the 2090s relative to the 2020s, as climate change favors cabbage growth.
We achieved maximum cabbage yield through deep tillage and high fertilizer levels (e.g., 7% of T2F3 and 64% of T3F3 for the 2020s, and 52% of T2F3 and 45% of T3F3 for the 2090s; Table S1). Under this scenario, cabbage yield had exceeded demand. GHGs emissions had increased by 6.13% and 7.51% in the 2020s and 2090s, respectively, due to enhanced CO2 production caused by deep tillage practices (T2 and T3).
The balance between demand and supply must be considered in order to maintain future cabbage demand. Cabbage yield under the conventional method was predicted to be almost equal to the forecast for demand in the 2020s (64.5 t ha−1 yr−1 vs. 65.1 t ha−1 yr−1; Table 3). We achieved this goal by selectively adopting the high-yield and low-carbon farming practice on 48% of cabbage fields (Table S1). Therefore, half of the total cabbage fields retained the conventional farming practice, and its total contribution towards GHGs mitigation was negligible (1.84%). The cabbage production under conventional farming (103.4 t ha−1 yr−1) was greater than the forecast for demand (74.5 t ha−1 yr−1) in the 2090s. To balance supply and demand, we therefore adopted low fertilizer farming practices (e.g., 57% of T1F1, 6% of T2F1, 17% of T3F1, etc.; Table S1) on 94% of the cabbage fields, which resulted in a 19.6% reduction in GHGs emissions (Table 3). However, it should be noted that farmers who adopt these low-carbon farming practices (approximately 7112 fields) in place of the conventional method are likely to experience profit-loss due to a reduction in cabbage yield.
The GHGs distribution of the 8072 cabbage fields in the 2090s for each scenario are displayed in Figure 3. The GHG distribution under the conventional practice is also shown as dashed bars for comparison. The data are fairly symmetric about the mean for all cases, indicating that the emissions and yield data are normally distributed. The conventional farming dataset (plot (a)) has the highest standard deviation and therefore widest spread relative to the other scenarios. We achieved both minimum GHGs emissions (plot (b)) and a balanced cabbage demand and supply (plot (d)) by converting cabbage fields with high GHGs emissions (mostly high yields) to low emission fields (mostly low yields). We achieved maximum yield by converting low yield cabbage fields (but potentially productive by changing farming methods) to high yield fields.

3.4. Implications

Our results demonstrate that current conventional farming practices (e.g., 400 kg N ha−1 fertilization and 10 cm tillage depth) under the RCP 8.5 scenario will produce cabbage yields of 103.4 t ha−1 yr−1 in the 2090s, which is 38.8% greater than the forecast for demand (74.5 t ha−1 yr−1). The simulation results suggest that future cabbage demand can be met even when 90% of all cabbage fields adopt low-carbon farming practices. However, a disadvantage is that low-carbon farming practices may lead to a loss in profit due to a decrease in crop yield [28].
The Korean government compensates farmers who conduct low-carbon agriculture through the implementation of the Direct Payment Program for Low-Carbon Farming Practices [20]. This policy assesses both the potential benefits and income reduction as a result of choosing low-carbon farming practices over conventional methods, so that farmers are effectively compensated for their contributions towards the mitigation of GHGs emissions. The results of this study are therefore useful for the Korean government to quantify both the impacts of low-carbon practices on GHGs reduction and to mitigate against potential financial losses in the agricultural sector.

4. Conclusions

Results of this study demonstrate that the adoption of low-carbon farming practices (optimal N-fertilizer levels and tillage depth) can effectively reduce national GHGs emissions from cabbage fields without compromising future demand. The economic benefits to farmers will likely be compromised, but the government has incentives in place to account for financial losses. In Korea, farmers are incentivized to adopt low-carbon farming practices through the compensation of any resulting income loss via the government’s direct payment program. In practice, the result of this study will aid the government to (i) effectively evaluate the contribution of low-carbon practices on GHGs mitigation from cabbage fields, and (ii) quantify yield and farmer profit losses in response to the adoption of low-carbon farming practices for accurate subsidy assessments and calculations. The conceptual framework of this modeling approach can be widely adopted and applied to other similar upland cropping systems. Our results demonstrate that optimizing both fertilization and tillage depth are effective strategies towards achieving the economical and sustainable management of Korean cabbage fields in response to future climate change.

Supplementary Materials

The following are available online at https://0-www-mdpi-com.brum.beds.ac.uk/2071-1050/11/21/6158/s1, Table S1: Optimum distributions of the nine farming practices over the 8072 cabbage fields to achieve the three scenario goals under Representative Concentration Pathways 8.5 for the 2020s and 2090s, Figure S1: (a) The geographical location of South Korea and the distribution of cabbage cultivation fields across the country; and (b) the illustrative components of the CO2 and N2O flux measurement system (not to scale), Figure S2: Comparisons between the Deokso cabbage field measurements and model predictions of soil volume wetness (%) under four sets of farming practice (T1F1, T1F3, T3F1, and T3F3). The data points represent the mean of triplicates measured in a given day. The error bars represent the standard deviations. The dotted line represents the 1:1 line. Acronyms can be referred to in the Figure 2 caption.

Author Contributions

Conceptualization, J.-G.K.; Data curation, W.H. and M.P.; Formal analysis, W.H. and S.H.; Investigation, M.P.; Methodology, M.P. and K.C.; Supervision, S.H.; Writing—original draft, W.H.; Writing—review & editing, S.H.

Funding

This study was in part funded by the Korea Ministry of Environment (MOE) as “Climate Change Correspondence Program (Project No. 2014-001310008)”.

Acknowledgments

This study was in part funded by Korea University Grant.

Conflicts of Interest

The authors declare no conflict of interest.

References

  1. Intergovernmental Panel on Climate Change (IPCC). Climate Change 2013: The Physical Science Basis; Contribution of Working Group I to the Fifth Assessment Report of the IPCC: Cambridge, UK; New York, NY, USA, 2013; p. 493. [Google Scholar]
  2. Food and Agriculture Organization (FAO). FAOSTAT Database; FAO: Rome, Italy, 2012; Available online: http://fao.org/faostat/en/#home (accessed on 22 August 2019).
  3. Intergovernmental Panel on Climate Change (IPCC). Climate Change 2007: Synthesis Report; Contribution of Working Groups I to the Fourth Assessment Report of the IPCC: Geneva, Switzerland, 2007. [Google Scholar]
  4. Li, H.; Qiu, J.; Wang, L.; Tang, H.; Li, C.; Van Ranst, E. Modelling impacts of alternative farming management practices on greenhouse gas emissions from a winter wheat–maize rotation system in China. Agric. Ecosyst. Environ. 2010, 135, 24–33. [Google Scholar] [CrossRef]
  5. Greenhouse Gas Inventory and Research Center (GIR). National Greenhouse Gas Inventory Report of Korea; GIR: Seoul, Korea, 2016. (In Korean) [Google Scholar]
  6. Abdalla, M.; Kumar, S.; Jones, M.; Burke, J.; Williams, M. Testing DNDC model for simulating soil respiration and assessing the effects of climate change on the CO2 gas flux from Irish agriculture. Glob. Planet. Chang. 2011, 78, 106–115. [Google Scholar] [CrossRef]
  7. Smith, W.N.; Grant, B.B.; Desjardins, R.L.; Kroebel, R.; Li, C.; Qian, B.; Worth, D.E.; McConkey, B.G.; Drury, C.F. Assessing the effects of climate change on crop production and GHG emissions in Canada. Agric. Ecosyst. Environ. 2013, 179, 139–150. [Google Scholar] [CrossRef]
  8. Asano, K.; Yang, H.; Lee, Y.; Yoon, J. Designing optimized food intake patterns for Korean adults using linear programming (I): Analysis of data from the 2010–2014 Korea National Health and Nutrition Examination Survey. J. Nutr. Health 2018, 51, 73–86. [Google Scholar] [CrossRef]
  9. Korean Statistical Information (KOSIS). Service Cultivated Area of Food Crops; KOSIS: Daejeon, Korea, 2015. (In Korean) [Google Scholar]
  10. Forte, A.; Fiorentino, N.; Fagnano, M.; Fierro, A. Mitigation impact of minimum tillage on CO2 and N2O emissions from a Mediterranean maize cropped soil under low-water input management. Soil Tillage Res. 2017, 166, 167–178. [Google Scholar] [CrossRef]
  11. Snyder, C.S.; Bruulsema, T.W.; Jensen, T.L.; Fixen, P.E. Review of greenhouse gas emissions from crop production systems and fertilizer management effects. Agric. Ecosyst. Environ. 2009, 133, 247–266. [Google Scholar] [CrossRef]
  12. Khalil, M.I.; Rahman, M.S.; Schmidhalter, U.; Olfs, H.W. Nitrogen fertilizer-induced mineralization of soil organic C and N in six contrasting soils of Bangladesh. J. Plant. Nutr. Soil Sci. 2007, 170, 210–218. [Google Scholar] [CrossRef]
  13. He, W.; Yang, J.Y.; Drury, C.F.; Smith, W.N.; Grant, B.B.; He, P.; Qian, B.; Zhou, W.; Hoogenboom, G. Estimating the impacts of climate change on crop yields and N2O emissions for conventional and no-tillage in Southwestern Ontario, Canada. Agric. Syst. 2018, 159, 187–198. [Google Scholar] [CrossRef]
  14. Li, C.; Frolking, S.; Frolking, T.A. A model of nitrous oxide evolution from soil driven by rainfall events: 1. model structure and sensitivity. J. Geophys. Res. 1992, 97, 9759–9776. [Google Scholar] [CrossRef]
  15. Li, H.; Qiu, J.; Wang, L.; Yang, L. Advance in a terrestrial biogeochemical model-DNDC model. Acta Ecol. Sin. 2011, 31, 91–96. [Google Scholar] [CrossRef]
  16. Yun, J.I. Predicting regional rice production in South Korea using spatial data and crop-growth modeling. Agric. Syst. 2003, 77, 23–38. [Google Scholar] [CrossRef]
  17. Zhang, Y.; Li, C.; Zhou, X.; Moore, B. A simulation model linking crop growth and soil biogeochemistry for sustainable agriculture. Ecol. Modell. 2002, 151, 75–108. [Google Scholar] [CrossRef]
  18. Oertel, C.; Matschullat, J.; Zurba, K.; Zimmermann, F.; Erasmi, S. Greenhouse gas emissions from soils—A review. Chem. Erde-Geochem. 2016, 76, 327–352. [Google Scholar] [CrossRef]
  19. Zhuang, M.; Zhang, J.; Lam, S.K.; Li, H.; Wang, L. Management practices to improve economic benefit and decrease greenhouse gas intensity in a green onion-winter wheat relay intercropping system in the North China Plain. J. Clean. Prod. 2019, 208, 709–715. [Google Scholar] [CrossRef]
  20. Korea Rural Economic Institute (KREI). Introducing Direct Payment Program for Low-Carbon Farming Practices and Creating an Action Plan. Guideline; KREI: Naju, Korea, 2013. (In Korean) [Google Scholar]
  21. Hewitt, H.T.; Copsey, D.; Culverwell, I.D.; Harris, C.M.; Hill, R.S.R.; Keen, A.B.; McLaren, A.J.; Hunke, E.C. Design and implementation of the infrastructure of HadGEM3: The next-generation Met Office climate modelling system. Geosci. Model. Dev. 2011, 4, 223–253. [Google Scholar] [CrossRef]
  22. Korea Rural Economic Institute (KREI). Vision of 2030/2050 Agriculture and Rural Sector in Korea; KREI: Naju, Korea, 2010. (In Korean) [Google Scholar]
  23. Hwang, W.; Kim, C.; Cho, K.; Hyun, S. Characteristics of Emission of Greenhouse Gases (CO2 and CH4) from Rice Paddy Fields in South Korea under Climate Change Scenario (RCP-8.5) using the DNDC Model. Pedosphere 2019, in press. [Google Scholar]
  24. Parkin, T.B.; Venterea, R.T. Chapter 3. Chamber-based trace gas flux measurements. In GRACEnet Sampling Protocols; Follett, R.F., Ed.; U.S. Department of Agriculture: Washington, DC, USA, 2010; pp. 1–39. [Google Scholar]
  25. Hong, S.G. A study on the threshold values of heavy rain warning in Korea. Asia-Pac. J. Atmos. Sci. 1999, 35, 178–192. [Google Scholar]
  26. Ghezzehei, T.A.; Sulman, B.; Arnold, C.L.; Bogie, N.A.; Berhe, A.A. On the role of soil water retention characteristic on aerobic microbial respiration. Biogeosciences 2019, 16, 1187–1209. [Google Scholar] [CrossRef] [Green Version]
  27. Castaldi, S. Responses of nitrous oxide, dinitrogen and carbon dioxide production and oxygen consumption to temperature in forest and agricultural light-textured soils determined by model experiment. Biol. Fertil. Soils 2000, 32, 67–72. [Google Scholar] [CrossRef]
  28. Kragt, M.E.; Gibson, F.L.; Maseyk, F.; Wilson, K.A. Public willingness to pay for carbon farming and its co-benefits. Ecol. Econ. 2016, 126, 125–131. [Google Scholar] [CrossRef] [Green Version]
Figure 1. Climate data and greenhouse gas emissions from the Deokso cabbage field during the experimental period (2018). Daily maximum and minimum air temperatures and daily precipitation are shown in plot (a). Model simulations of CO2 and N2O emissions are shown in plots (b,c), respectively, along with the field measurement data. The timing of tillage and fertilizer addition (August 4) and the duration of cabbage farming (August 11 to October 31) are also indicated in plot (c).
Sustainability 11 06158 g001
Figure 2. Comparisons of (a) CO2 emissions and (b) N2O emissions between the field-measurements from the Deokso cabbage field and the model predictions under four sets of farming practices (T1F1, T1F3, T3F1, and T3F3); T1 and T3 denote 10 cm and 30 cm tillage depth, respectively, and F1 and F3 denote 100 kg N ha−1 and 400 kg N ha−1, respectively. Each data point represents the mean of triplicates measured in a given day. The error bars represent the standard deviations. The dotted line represents the 1:1 line.
Sustainability 11 06158 g002
Figure 3. The frequency distributions of the cabbage fields as a function of greenhouse gases (GHGs) emissions to achieve the three scenario goals under the Representative Concentration Pathways 8.5 scenario for the 2090s, including distributions for (a) conventional farming, (b) minimizing GHGs emissions, (c) maximizing cabbage yield, and (d) balancing future cabbage demand and supply. The results of the conventional farming practice (dashed white bars) are also displayed in plots (bd) for comparison.
Sustainability 11 06158 g003
Table 1. Details of the input data for the model predictions, field verification, and baseline evaluation.
Data TypeSub-TypeUnitModel PredictionField Verification f
Future Scenario dModel Baseline e
Climate aTemperature°CRCP 8.5Mean values between 2006 and 2015Administrative data for Deokso field in 2018
Precipitationcm
Farming
Practice b
Fertilizer levelkg N ha−1F1, F2, and F3F3 (conventional method)F1 and F3
Tillage depthcmT1, T2, and T3T1 (conventional method)T1 and T3
Soil cBulk densityg cm−3Administrative soil databaseAdministrative soil databaseField measurement data
Clay%
Initial SOCg kg−1
pH1:5
a. Both the Representative Concentration Pathway (RCP) 8.5 and administrative climate records were obtained from the Korea Meteorological Administration. b. Fertilizer levels F1, F2, and F3 denote 100, 200, and 400 kg N ha−1, respectively. Tillage depths T1, T2, and T3 denote 10, 20, and 30 cm, respectively. The period of cultivation was designated between August 11 and October 31 for all farming practices. c. Soil data from the Korea Rural Development Administration (KRDA) was used for model prediction. SOC is the soil organic carbon. d. The DNDC prediction was performed for the 2020s and 2090s under RCP 8.5 and as a function of the different farming practices. e. For the baseline evaluation (i.e., no future climate change), average climate data of the last 10 years (2006–2015) and the KRDA method (10 cm tillage depth and 400 kg N ha−1 fertilizer) were used as input parameters. f. Model verification was performed at the Deokso field. Soil properties were measured on-site.
Table 2. The model outputs for cabbage yield and greenhouse gas emissions from Korean cabbage fields under nine farming practices combining variations in tillage depth and levels of N-fertilizer. The model was simulated under the Representative Concentration Pathways 8.5 scenario for the 2020s and 2090s.
Model
Outcome
Cabbage Yield
(t ha−1 yr−1)
Greenhouse Gas Emission
(t CO2-eq ha−1 yr−1) d
Farming
Practice a
CO2N2O
2020s2090s2020s2090s2020s2090s
T1F134.8 ± 3.0 b67.6 ± 5.19.3 ± 0.49.9 ± 0.42.8 ± 0.43.4 ± 0.3
T1F255.2 ± 3.794.7 ± 5.49.8 ± 0.510.2 ± 0.44.3 ± 0.55.1 ± 0.4
T1F3
(Conventional farming practice)
65.4 ± 3.8103.4 ± 6.710.1 ± 0.410.4 ± 0.46.2 ± 0.66.9 ± 0.5
T2F138.7 ± 3.369.2 ± 5.110.0 ± 0.510.6 ± 0.52.4 ± 0.33.2 ± 0.3
T2F256.6 ± 3.894.5 ± 5.710.7 ± 0.511.0 ± 0.53.8 ± 0.44.8 ± 0.4
T2F364.2 ± 3.9108.6 ± 5.710.9 ± 0.611.2 ± 0.55.8 ± 0.56.7 ± 0.5
T3F150.4 ± 3.378.1 ± 5.011.3 ± 0.611.6 ± 0.52.2 ± 0.33.3 ± 0.3
T3F259.7 ± 3.594.7 ± 5.111.7 ± 0.611.9 ± 0.53.7 ± 0.45.0 ± 0.4
T3F365.8 ± 3.5104.3 ± 5.211.8 ± 0.612.1 ± 0.65.7 ± 0.57.0 ± 0.5
Baseline c
(No climate change with T1F3)
63.0 ± 3.461.2 ± 5.19.8 ± 0.59.8 ± 0.56.1 ± 0.46.1 ± 0.5
a. The results for the farming practice recommended by the Korea Rural Development Administration (KRDA) for cabbage cultivation (T1F3) is italicized. b. Values following the ± sign denote standard deviation. c. Model results assuming no climate change under the KRDA farming method (T1F3). d. N2O emissions were converted to the unit of CO2-equivalents (CO2-eq).
Table 3. Model outputs for cabbage yield and greenhouse gas (GHG) emissions when each of the three scenario goals (minimizing GHGs, maximizing yield, and maintaining demand) are achieved under the Representative Concentration Pathways 8.5 projection.
Model
Outcome
Cabbage Yield (t ha−1 yr−1)GHGs Emission (t CO2-eq ha−1 yr−1) c
Scenario Goals a 2020s
Demand Forecasting
= 65.1 ± 3.3
2090s
Demand Forecasting
= 74.5 ± 3.7
2020s2090s
Minimizing GHGs35.5 ± 0.3 b68.6 ± 0.212.0 ± 0.1 (−26.4%) d13.3 ± 0.1 (−23.1%)
Maximizing Yield68.1 ± 1.3109.2 ± 1.517.3 ± 0.4 (+6.13%)18.6 ± 0.3 (+7.51%)
Maintaining Demand65.2 ± 1.674.8 ± 2.016.0 ± 0.4 (−1.84%)13.9 ± 0.3 (−19.6%)
Conventional Method64.5 ± 3.8103.4 ± 6.716.3 ± 1.117.3 ± 0.9
a. The scenario goals were achieved by allocating one of the nine farming practices into the 8072 Korean cabbage field cells for the particular time period. Minimizing GHGs = farming practices to achieve the minimum GHG emission. Maximizing yield = farming practices to achieve the maximum cabbage yield. Maintaining demand = farming practices to balance future cabbage yield with future demand for the particular time period. Conventional method = farming practices which meet the requirements of the KRDA (10 cm tillage and 400 kg N ha−1 fertilizer). b. Values following the ± sign denote the standard deviations. c. Sum of CO2 and N2O emissions given as units of CO2-equivalents. d. Value in parentheses denotes the percentage reduction (−) or percentage increase (+) in GHGs emissions relative to the conventional method.

