A Data-Based Fault-Detection Model for Wireless Sensor Networks


1
Research Division, Shinhan A-Tec Co. Ltd., Changwon 51793, Korea
2
Department of Agricultural Engineering, National Institute of Agricultural Sciences, Jeollabuk-do 55365, Korea
3
Department of Information and Communication Engineering, Sunchon National University, Jeollanam-do 57922, Korea
*
Authors to whom correspondence should be addressed.
Sustainability 2019, 11(21), 6171; https://0-doi-org.brum.beds.ac.uk/10.3390/su11216171
Submission received: 15 October 2019
/
Revised: 30 October 2019
/
Accepted: 3 November 2019
/
Published: 5 November 2019
(This article belongs to the Special Issue Precision Agricultural Technologies for Sustainable Controlled Environment Agriculture)
Abstract
:With the expansion of smart agriculture, wireless sensor networks are being increasingly applied. These networks collect environmental information, such as temperature, humidity, and CO2 rates. However, if a faulty sensor node operates continuously in the network, unnecessary data transmission adversely impacts the network. Accordingly, a data-based fault-detection algorithm was implemented in this study to analyze data of sensor nodes and determine faults, to prevent the corresponding nodes from transmitting data; thus, minimizing damage to the network. A cloud-based “farm as a service” optimized for smart farms was implemented as an example, and resource management of sensors and actuators was provided using the oneM2M common platform. The effectiveness of the proposed fault-detection model was verified on an integrated management platform based on the Internet of Things by collecting and analyzing data. The results confirm that when a faulty sensor node is not separated from the network, unnecessary data transmission of other sensor nodes occurs due to continuous abnormal data transmission; thus, increasing energy consumption and reducing the network lifetime.
1. Introduction
In a smart farm, the growth environment of crops and livestock can be appropriately maintained and managed by remotely or automatically applying information and communications technology to greenhouses, barns, orchards, and other farming environments [1,2]. Accurate data on crop growth and environmental conditions enable smart-farm operators to check the growth environment anytime and anywhere, and specify timely instructions, thereby improving the productivity and quality of agricultural products while reducing labor and energy demands [3,4,5]. Smart farms can be implemented in various forms, from production to distribution and consumption. This establishes the convergence of information and communications technology in the value chain of agri-food to create new products, services, and process innovations, ranging from precise production and intelligent distribution to advanced management [6,7,8].
Regarding technological innovation, the Fourth Industrial Revolution can be considered as a new paradigm to create value through the convergence of artificial intelligence with data technologies such as the Internet of Things (IoT), cloud computing and storage, big data, and mobile computing and communications [9,10]. In particular, data technology combined with artificial intelligence implies hyperconnected agricultural production–distribution–consumption processes and the optimization of cyber-physical platforms, evolving into ultraprecise customized agriculture based on digital data, which is unprecedented in traditional agriculture [11,12,13].
In this study, an efficient energy management method using data-based fault detection through cloud-based “farm as a service” (FaaS) [14,15,16,17,18] is proposed. With the expanding scale of smart farms and open field cultivation, wireless sensor networks (WSNs) are being increasingly deployed in agriculture to collect environmental information, such as temperature, humidity, and CO2 rates [19,20,21]. As most wireless sensor nodes use batteries as their primary energy source, efficient energy consumption becomes essential. Furthermore, faults in sensor nodes should be mitigated to collect accurate environmental information [22,23]. If a faulty sensor node operates continuously in a network, unnecessary data transmission can undermine the network’s performance, possibly causing downtime and consequently, animal mortality and agricultural losses. Accordingly, a data-based fault detection algorithm is required to analyze sensor node data for predicting faulty nodes and preventing data transmission, thereby minimizing related damage to the WSN [24,25]. This paper presents the implementation of a data-based fault-detection model for a plum farm, a specialty crop, and reports the model application.
The proposed algorithm does not consider a WSN in a limited area, such as that in protected horticulture, but aims to improve the network efficiency in a line-of-sight environment, such as an open field. Hence, its design is more focused on monitoring than on performing environmental control, which is unfeasible in open field crops. Furthermore, the algorithm was optimized to obtain microclimate information from the foot of a mountain, where climate varies frequently compared to wide-area climate.
The remainder of this paper is organized as follows. In Section 2, the cloud-based FaaS optimized for smart farms is summarized, along with the technologies for managing IoT devices based on oneM2M, a machine-to-machine (M2M) standard. The FaaS performs resource management of sensors and actuators based on the oneM2M common platform. In Section 3, the data-based fault-detection model is introduced for the efficient energy management of the integrated management platform. In Section 4, the proposed algorithm is evaluated by collecting and analyzing data from an implemented system. In Section 5, the study is concluded, and directions for future research are provided.
2. IoT Management for FaaS
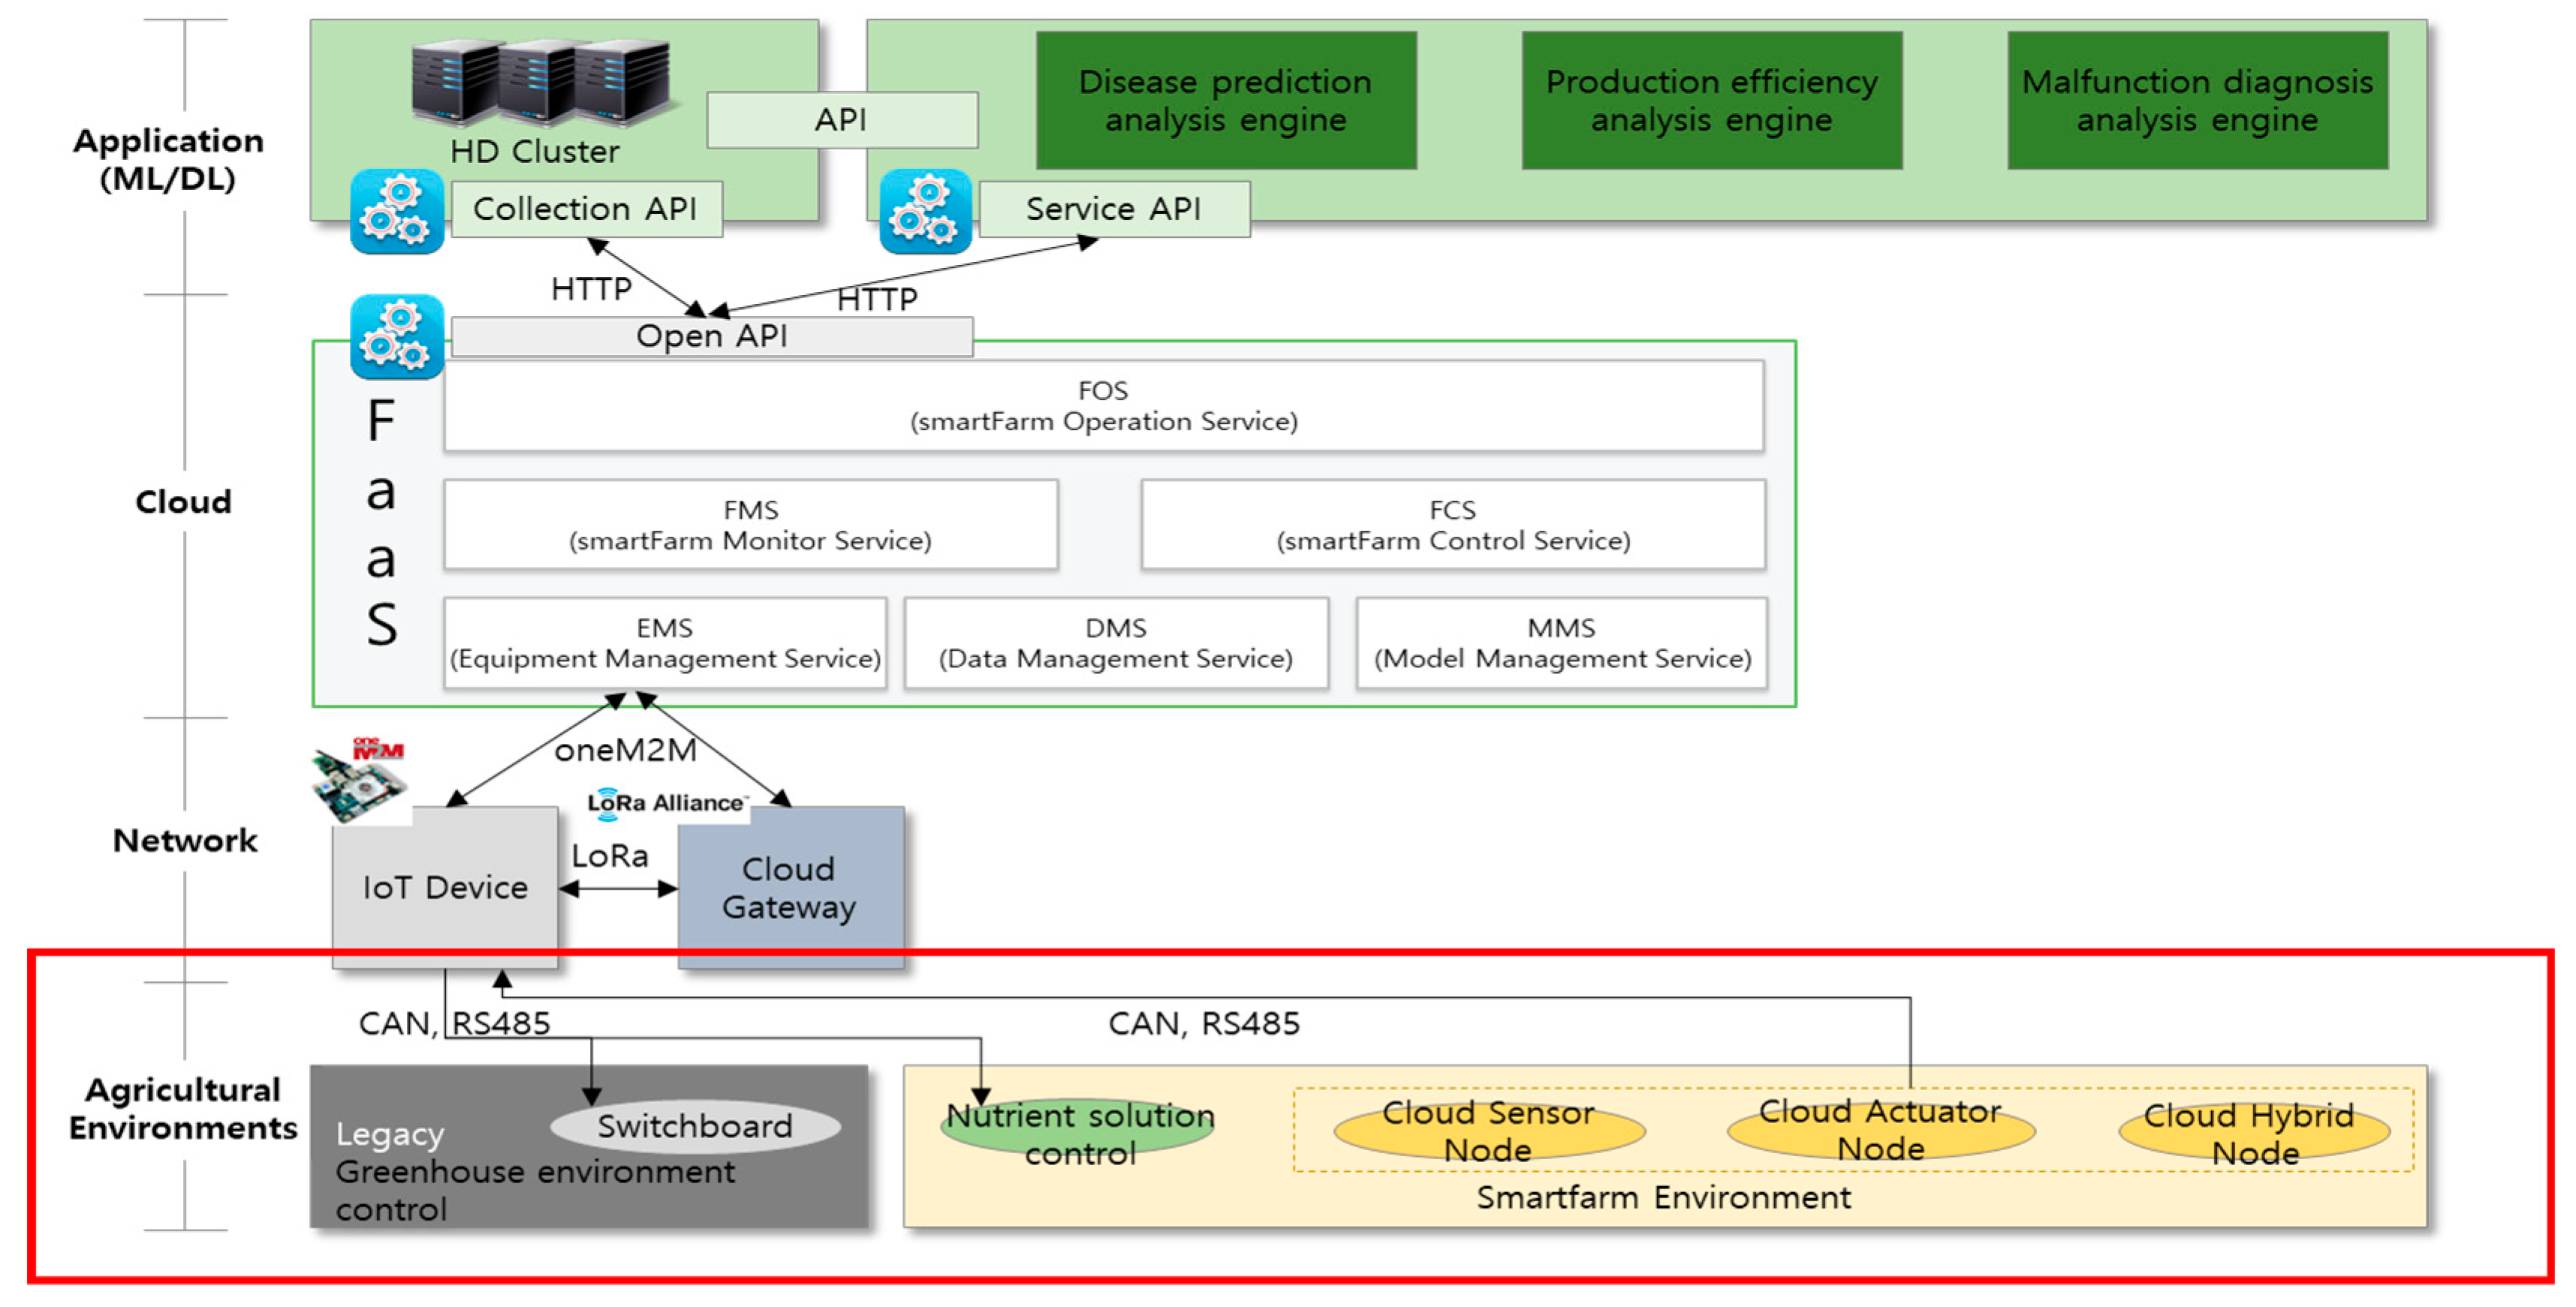
FaaS uses cloud technology with IT infrastructure resources, such as servers, storage devices, middleware, and application software through networks, as illustrated in Figure 1. Furthermore, smart farm IoT devices, such as sensors and actuator nodes are virtualized and operated.
This is similar to Fog computing, which provides a type of intercommunication between each layer and matches service quality. We also referred to an efficient structure named Fog Computing Architecture Network (FOCAN) [26,27].
In this manner, the cloud technology integrates heterogeneous smart farms containing existing farms and legacy systems operating in stand-alone and distributed architectures. In addition, low-cost farm management functions can be implemented.
The algorithm for the proposed model was developed focusing on WSN energy efficiency during the collection and processing of agricultural data (red area in Figure 1) in the FaaS system. The algorithm performance was verified through an application in open field.
2.1. Equipment Management Service
The equipment management service is a cloud platform that defines the resource management function to manage and operate a smart farm based on cloud technology (including IoT devices) and provide FaaS services.
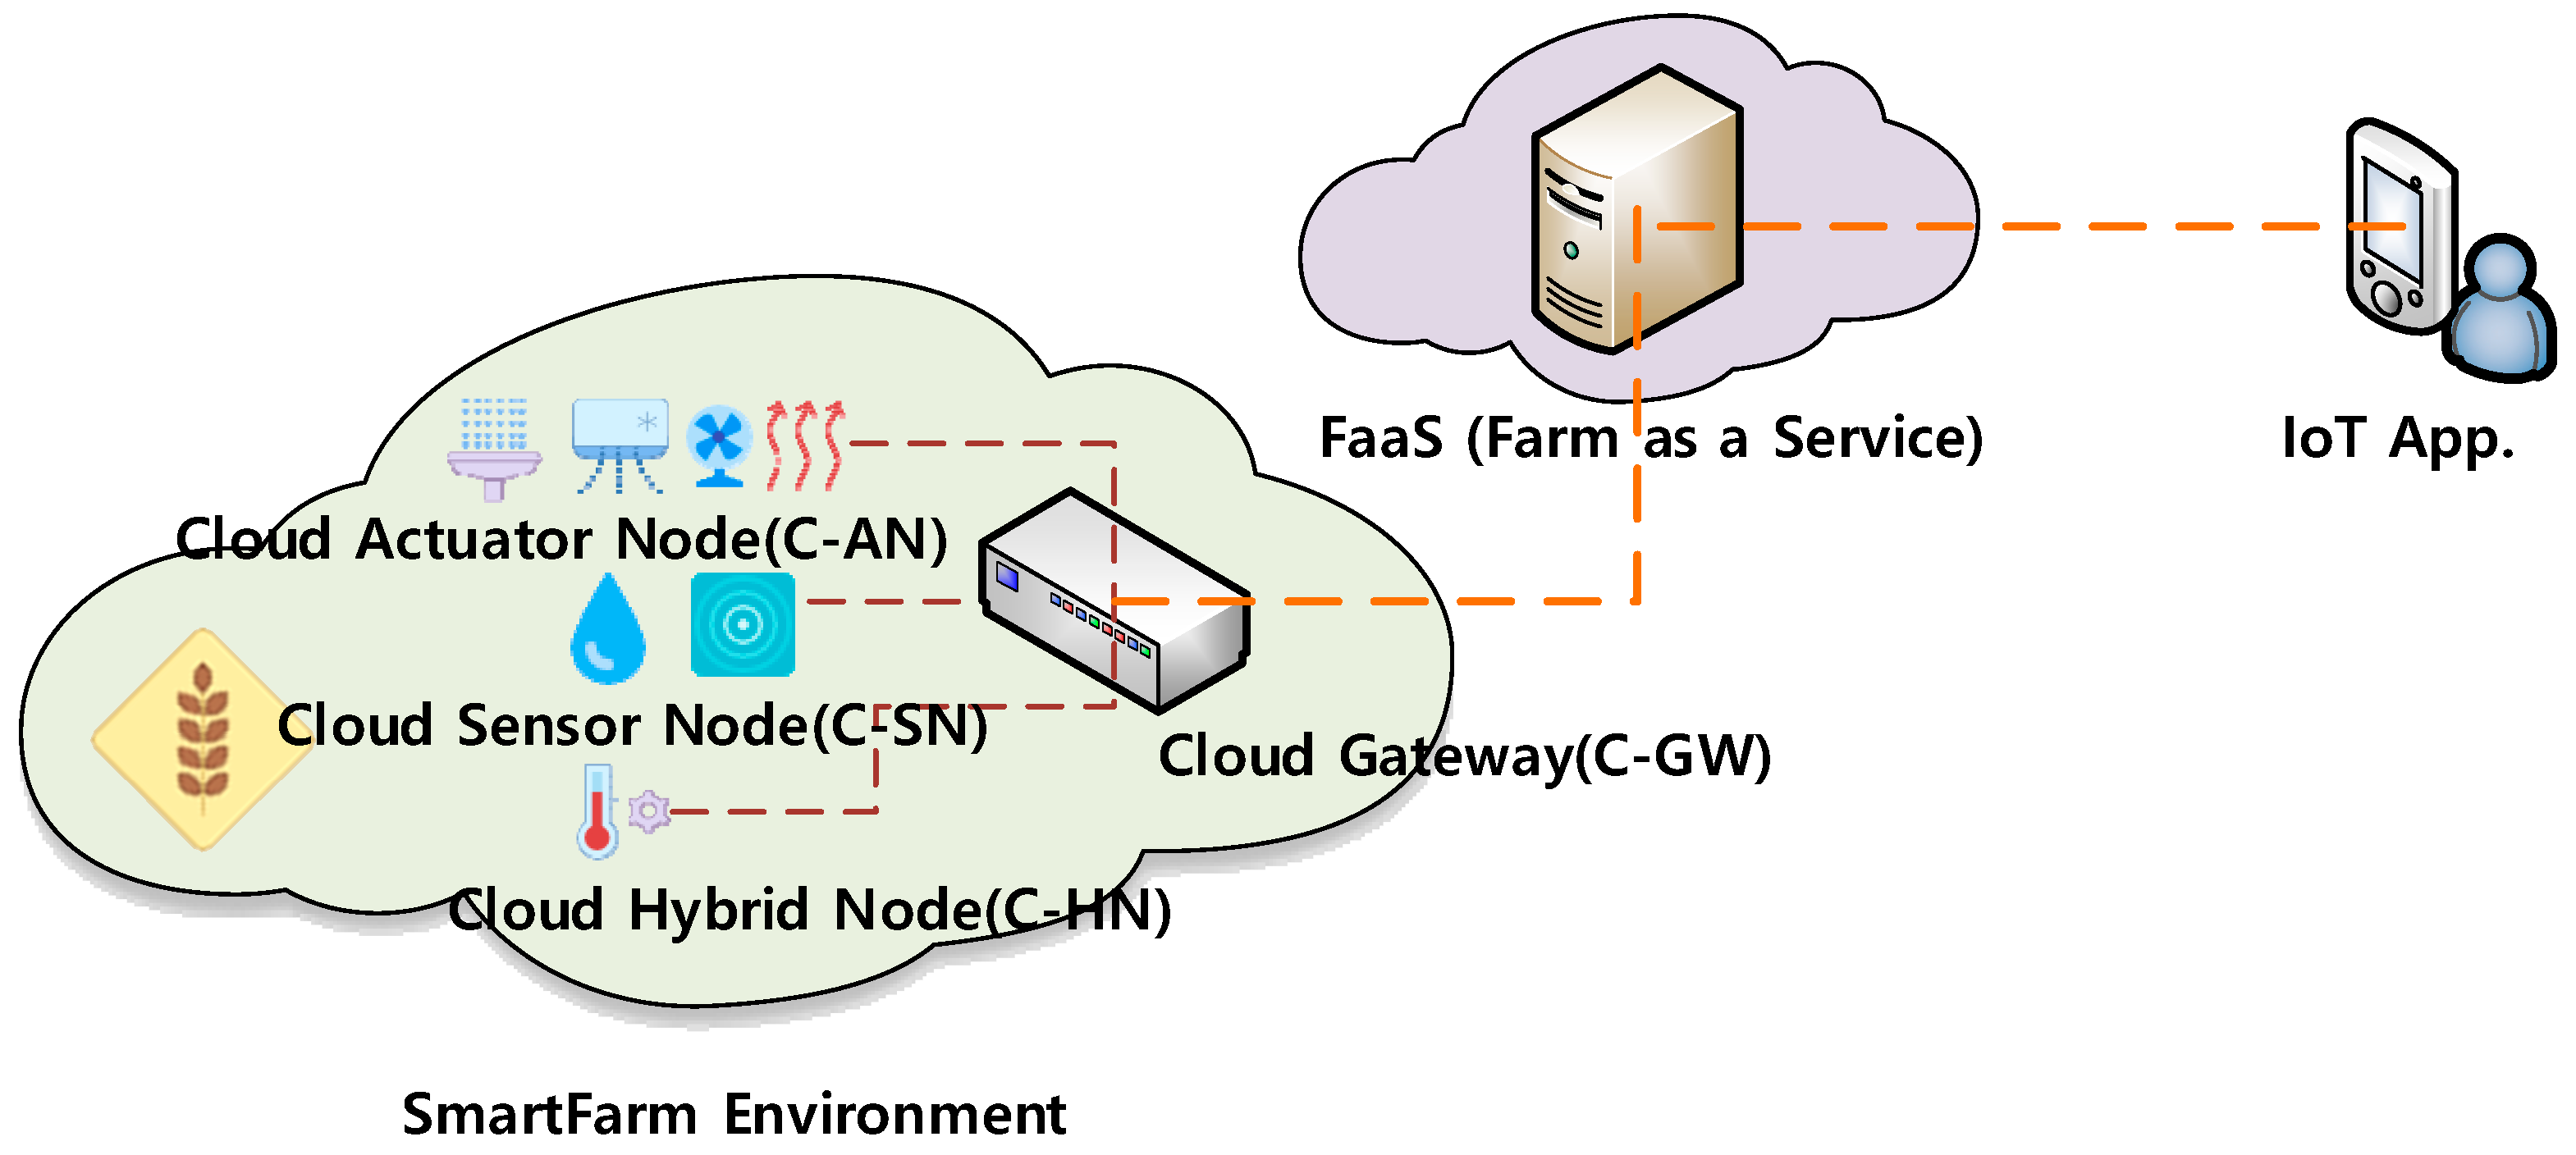
FaaS is a platform that provides smart farm services through the virtualization of farm resources, as illustrated in Figure 2. It supports operation services such as data collection, control, and management; API services for the development environment; and a variety of higher application services for tasks such as farm operation, monitoring, simple and complex control, device management, data management, and model management.
The equipment management service registers, connects, and manages devices installed in the farm, namely, the cloud sensor node (C-SN), cloud actuator node (C-AN), cloud hybrid node (C-HN), and cloud gateway (C-GW), and collects and controls sensing information and driving information from the devices. In addition, the equipment management service provides interoperability across IoT devices developed with different standards or technologies; thus, providing an application-independent common platform to support all agricultural services.
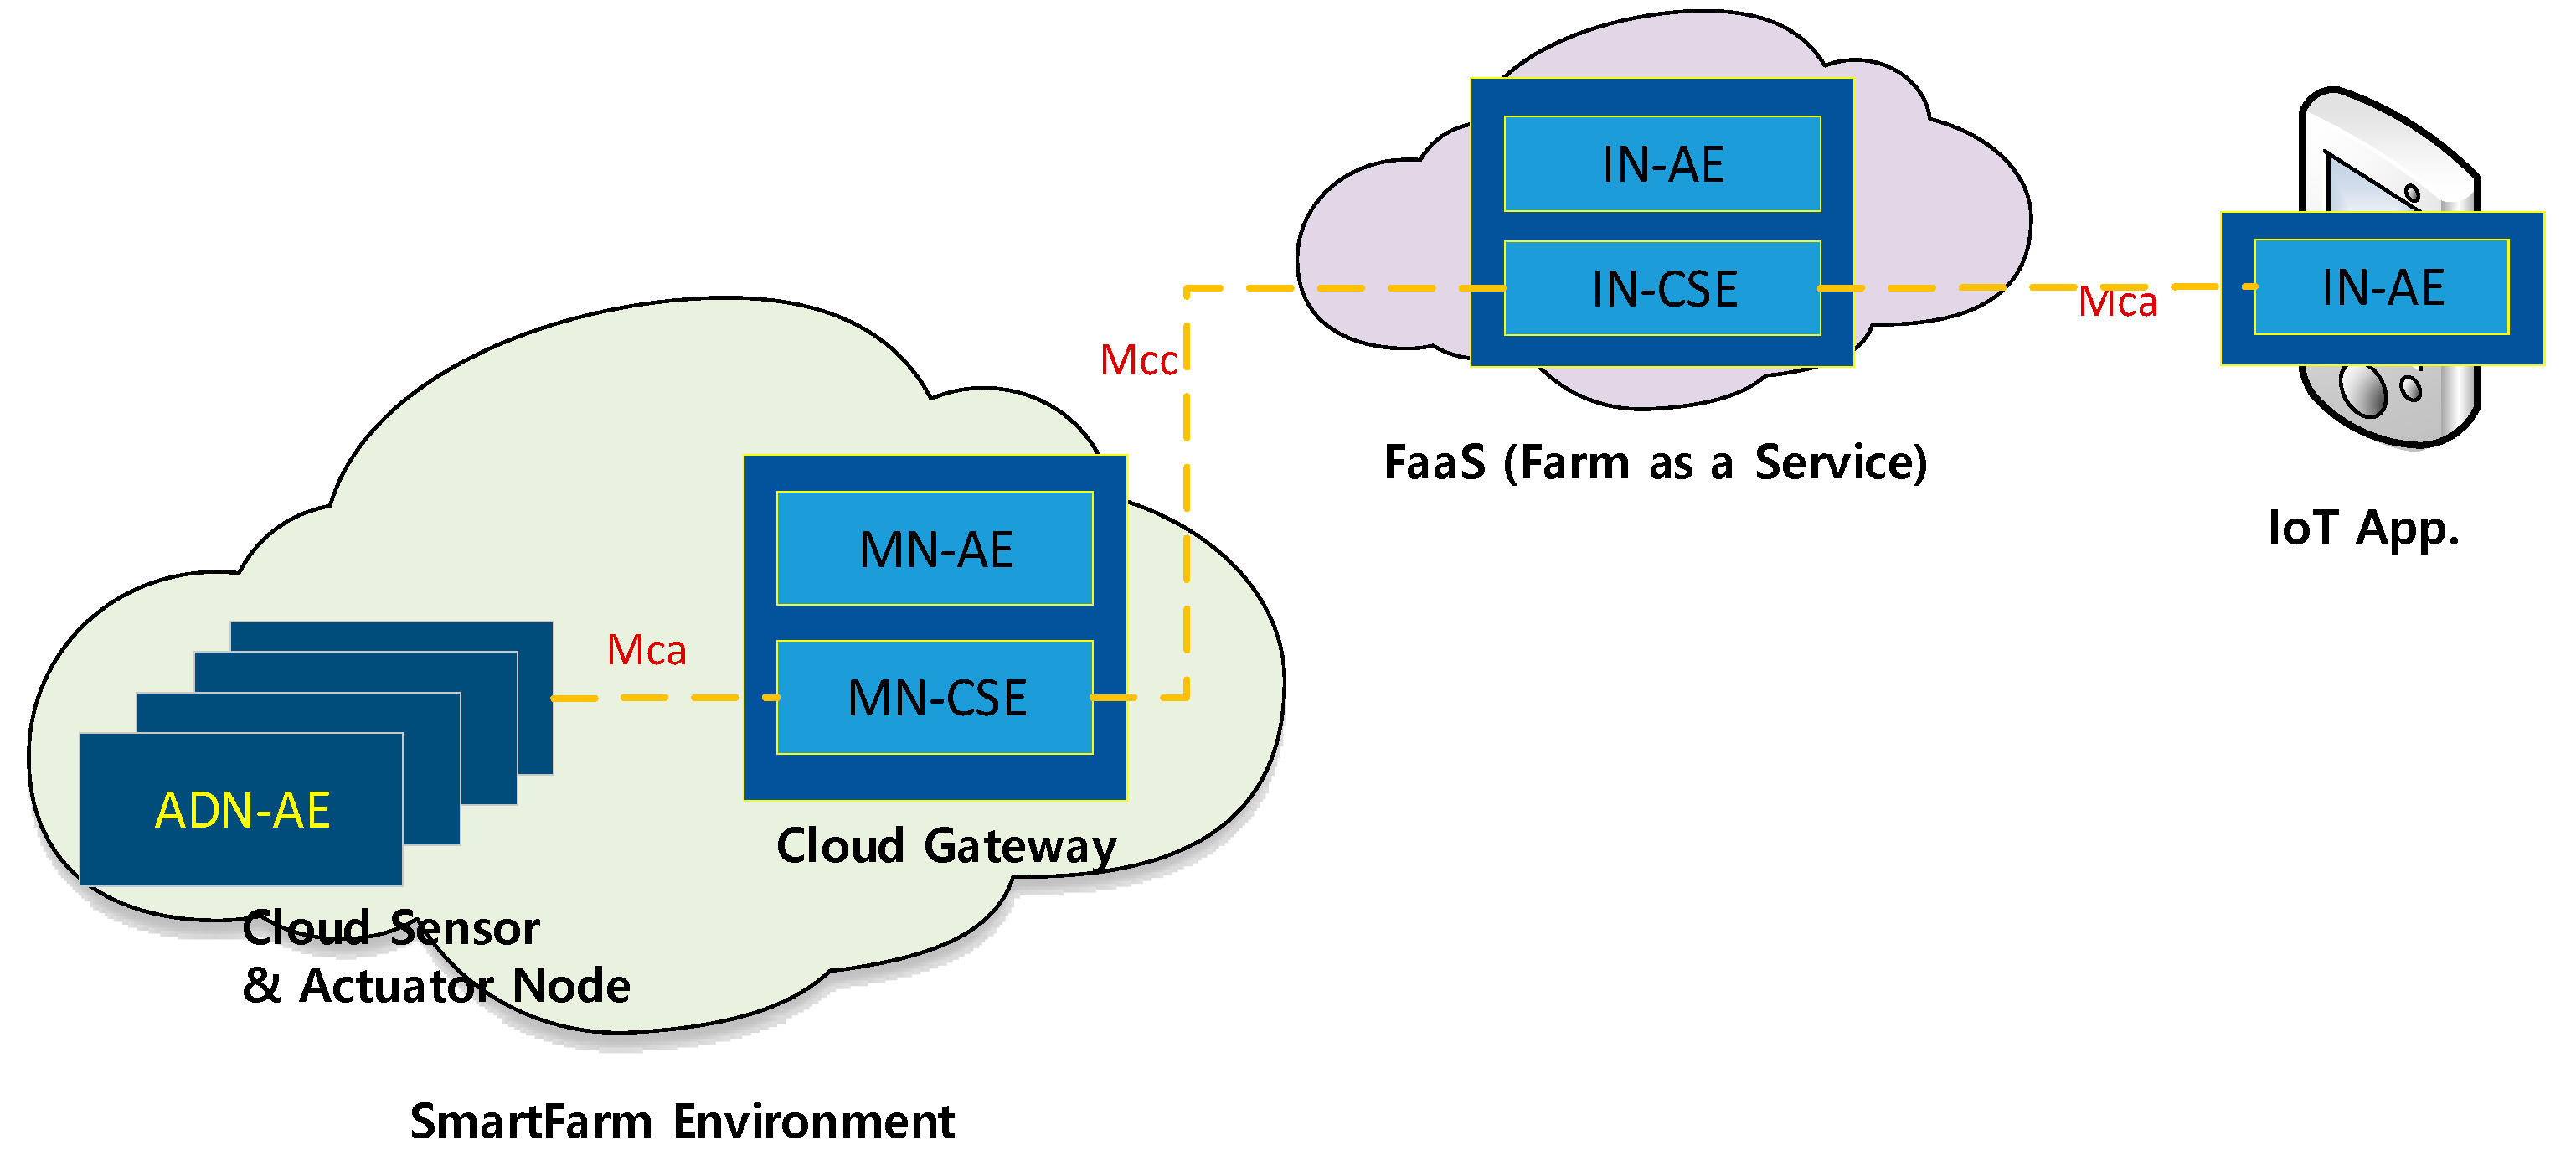
The equipment management service relies on the oneM2M common platform to enable resource management of IoT devices [28]. OneM2M is a layered M2M architecture located between the IoT application environment (M2M application layer) and the smart farm environment (M2M device layer). It represents a common service layer to provide functions to various M2M-based applications using network services. The components from the diagram shown in Figure 3 are defined as follows [29,30].
2.2. Hierarchical Structure
A WSN supporting FaaS integrates sensor nodes with modules for communication, monitoring, and processing. Each sensor node collects data, processes the data in the corresponding module, and wirelessly delivers the processed data to the user. As a WSN usually collects data from several sensor nodes, it demands long time and intensive computations during the analysis of natural environments. Hence, a research hotspot in WSNs is the maximization of sensor network lifetime by minimizing energy consumption in each sensor node. Although several studies have addressed energy efficiency for wireless communications, the inefficient energy consumption in data-based network management due to aspects such as faulty sensor nodes remains unsolved. In Section 3, fault detection in sensor nodes using statistical techniques for energy efficiency in WSNs is detailed.
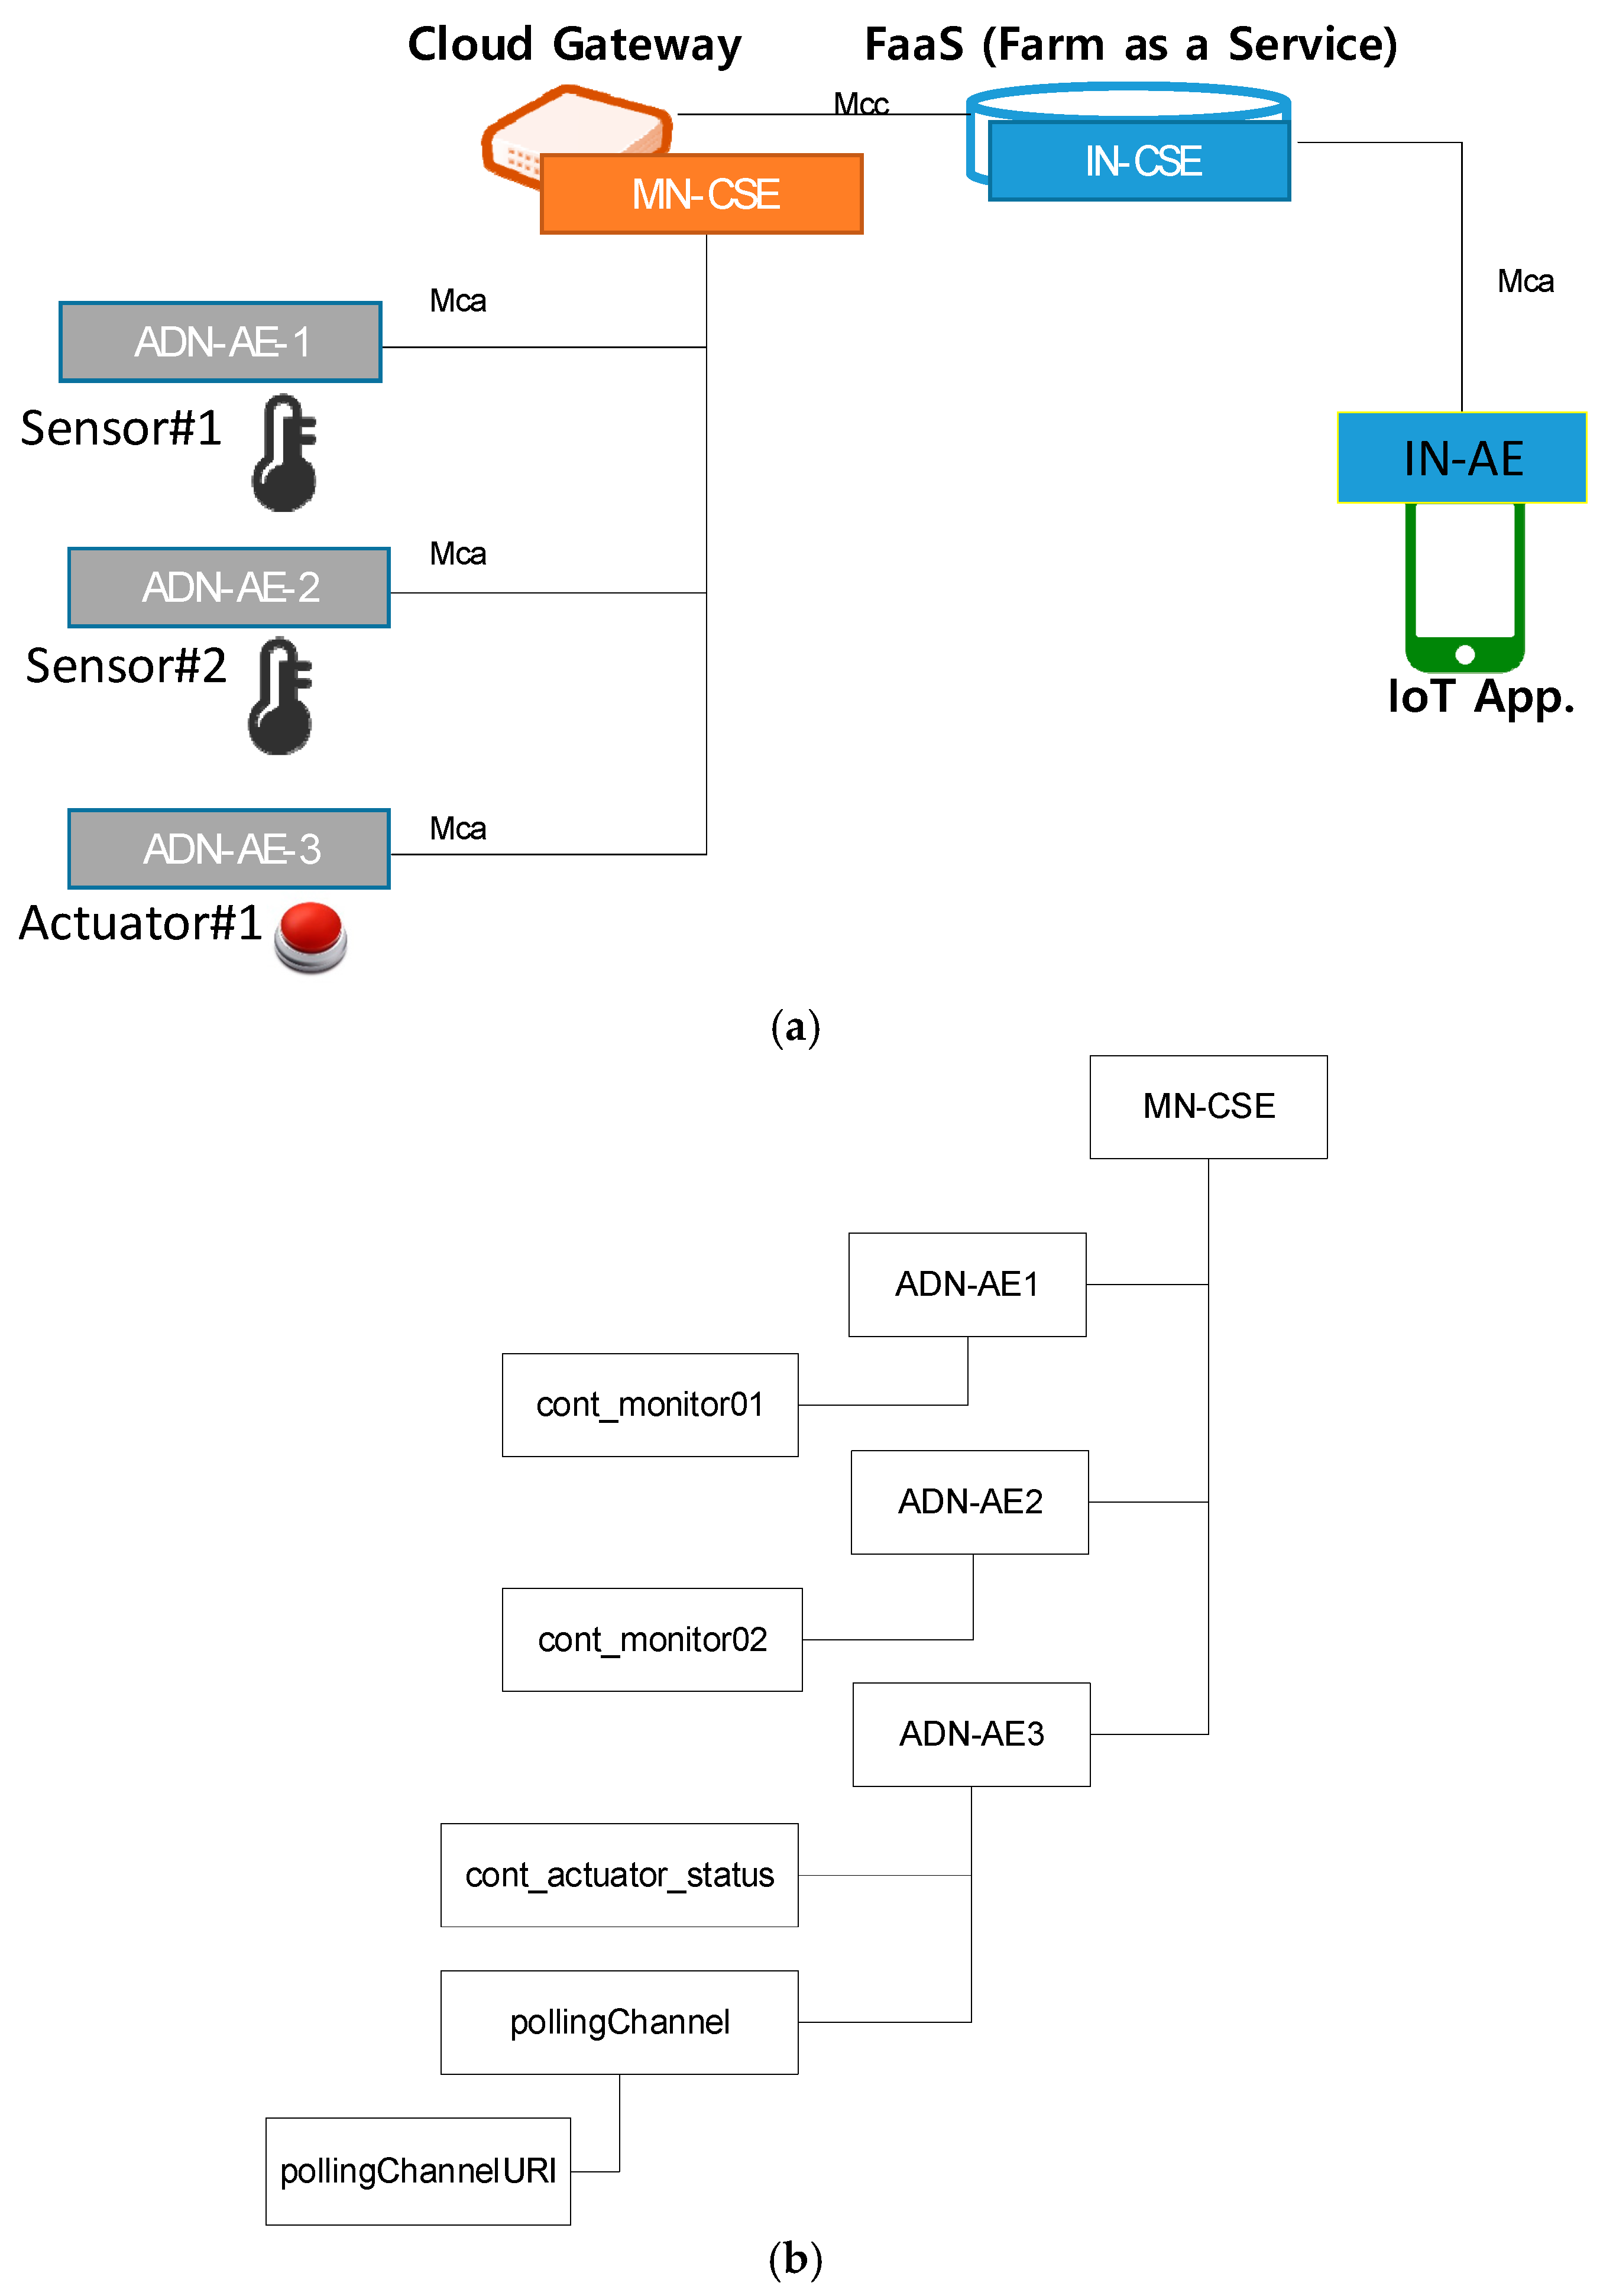
The environmental data constituting a smart farm consists of indoor and outdoor temperature, humidity, and corresponding control information. The proposed environment monitoring for FaaS has the hierarchical structure shown in Figure 4a.
In FaaS, the cloud gateway, which classifies structures such as farms and greenhouses, is located in the field and represents a logical device (including MN-CSE) for tasks, including the connection of numerous sensors and actuators. In addition, the gateway executes fault detection based on the collected information. Each CSE has a unique identifier (CSE-ID) like the AEs. The MN-CSE in Figure 4b consists of the following resources:
- ADN-AE1 (Sensor #1)
- includes a container called cont_monitor1;
- ADN-AE2 (Sensor #2)
- includes a container called cont_monitor2;
- ADN-AE3 (Actuator #1)
- includes a container called cont_actuator_status and creates a pollingChannelURI (virtual resource representing the target uniform resource identifier of the polling session) in channel pollingChannel.
3. Data-Based Fault-Detection Model
3.1. Spatiotemporal Correlation among Sensor Measurements
In a data collection area (e.g., smart farm), the air temperature has a relatively uniform spatiotemporal distribution, and thus, the sensor nodes’ measurements show a similar trend over time [31,32]. Such spatiotemporal correlations [33] in external environments occur for different variables, including temperature, humidity, and CO2 rates. In contrast, other environmental factors, such as wind direction and speed, do not exhibit clear spatiotemporal correlations due to their high variability and uncertainty.
Fault detection in sensor nodes can leverage spatiotemporal correlations. Consider m sensor nodes arranged in a data collection area. The measurement from sensor node i received at the cloud gateway at time t is denoted as D(i,t). Data collected at the previous period, D(i,t−1), can be used to determine the variation of the sensor node information as
where for sensor node i over period , which is usually random.
By spatiotemporal correlations, sensor nodes with normal data collection exhibit a similar variation λ within a certain range. To analyze the data variation among a pair of sensor nodes, the difference between their mean data variations is calculated using Equation (4). Moreover, the difference between the data variation of sensor node j and the mean data variation across the other sensor nodes is given by
where .
3.2. Fault-Detection Model
A faulty sensor node is the result of abnormal operation and is expressed by inaccurate data collection and transmission. Although the causes of faults vary, they prevent proper communication or produce transmission of corrupted data. As mentioned above, the trends of data collected across sensors should be similar due to spatiotemporal correlations. If a fault occurs at a sensor node, the data variation is substantially different from that of other sensors.
The sensor node fault detection method proposed in this paper is based on a cluster network topology with a gateway as the head node. Therefore, the gateway classifies faulty nodes through fault detection techniques, and does not process the messages transmitted from faulty nodes or transmit them to higher levels, thereby reducing unnecessary energy consumption and maintaining a stable network. In addition, if the number of faulty nodes gradually increases, and there is a problem in maintaining the network, a new cluster can be formed by merging with adjacent clusters.
The probability of multiple sensor nodes simultaneously failing in a WSN is defined as follows. In the data collection area, sensor nodes simultaneously failing at a certain period do not exceed a limit. Hence, the proposed fault-detection model considers the possibility that faults can simultaneously occur in several sensor nodes using the spatiotemporal correlations described above.
The mean data variation across sensor nodes operating normally can be calculated using Equation (3). If this variation is similar to that of each sensor node due to the spatiotemporal correlation of measurements, normal operation is assumed, whereas a fault can be inferred otherwise.
where m’ is the number of sensor nodes with normal operation in the data collection area and
is the mean data variation across these sensor nodes.
The difference between the data variation of sensor node j and the mean data variation of sensor nodes operating normally is given by
where
with being a threshold for data variation, the measurement error of sensor nodes, and the maximum allowable data variation.
The threshold of data variation should be set considering the sensors’ measurement errors. In addition, the threshold should consider the data collection period and interval, as small acquisition time imply small data variation. When the period is relatively large, the threshold should consider the maximum allowable value of adjacent variations in the collected data. Thus, Equation (5) provides a fault determination function, with f (j, t) = 0 indicating normal operation and f (j, t) = 1 indicating fault of sensor node j.
The proposed model considers the following implementation assumptions. Most sensor nodes in an area are unlikely to be simultaneously faulty, with the maximum number of simultaneously faulty sensor nodes being half of all the nodes. To verify this, fault detection is conducted in two steps. First, sensor nodes operating normally are identified, and then the remaining nodes are subject to fault detection.
3.2.1. Procedure
Statistically, data collected can be scattered from the mean according to the variance, and thereby, information can be inferred. If a dataset is collected, such as X = (x1, x2, …, xn), its variance D(x) is given by
where n is the number of datapoints.
A small variance indicates small changes, and that of the data variation per sensor node represents a trend. If a node is faulty, the data collected tends to be either large or small. Consequently, the variation of data collected with respect to the previous instant is relatively large, and the distribution of values, including the error data, grows. From n sensor nodes in a data collection area, at least k nodes should present normal operation at a given time. Using the assumption that at most half of all sensor nodes can be faulty, k is given by
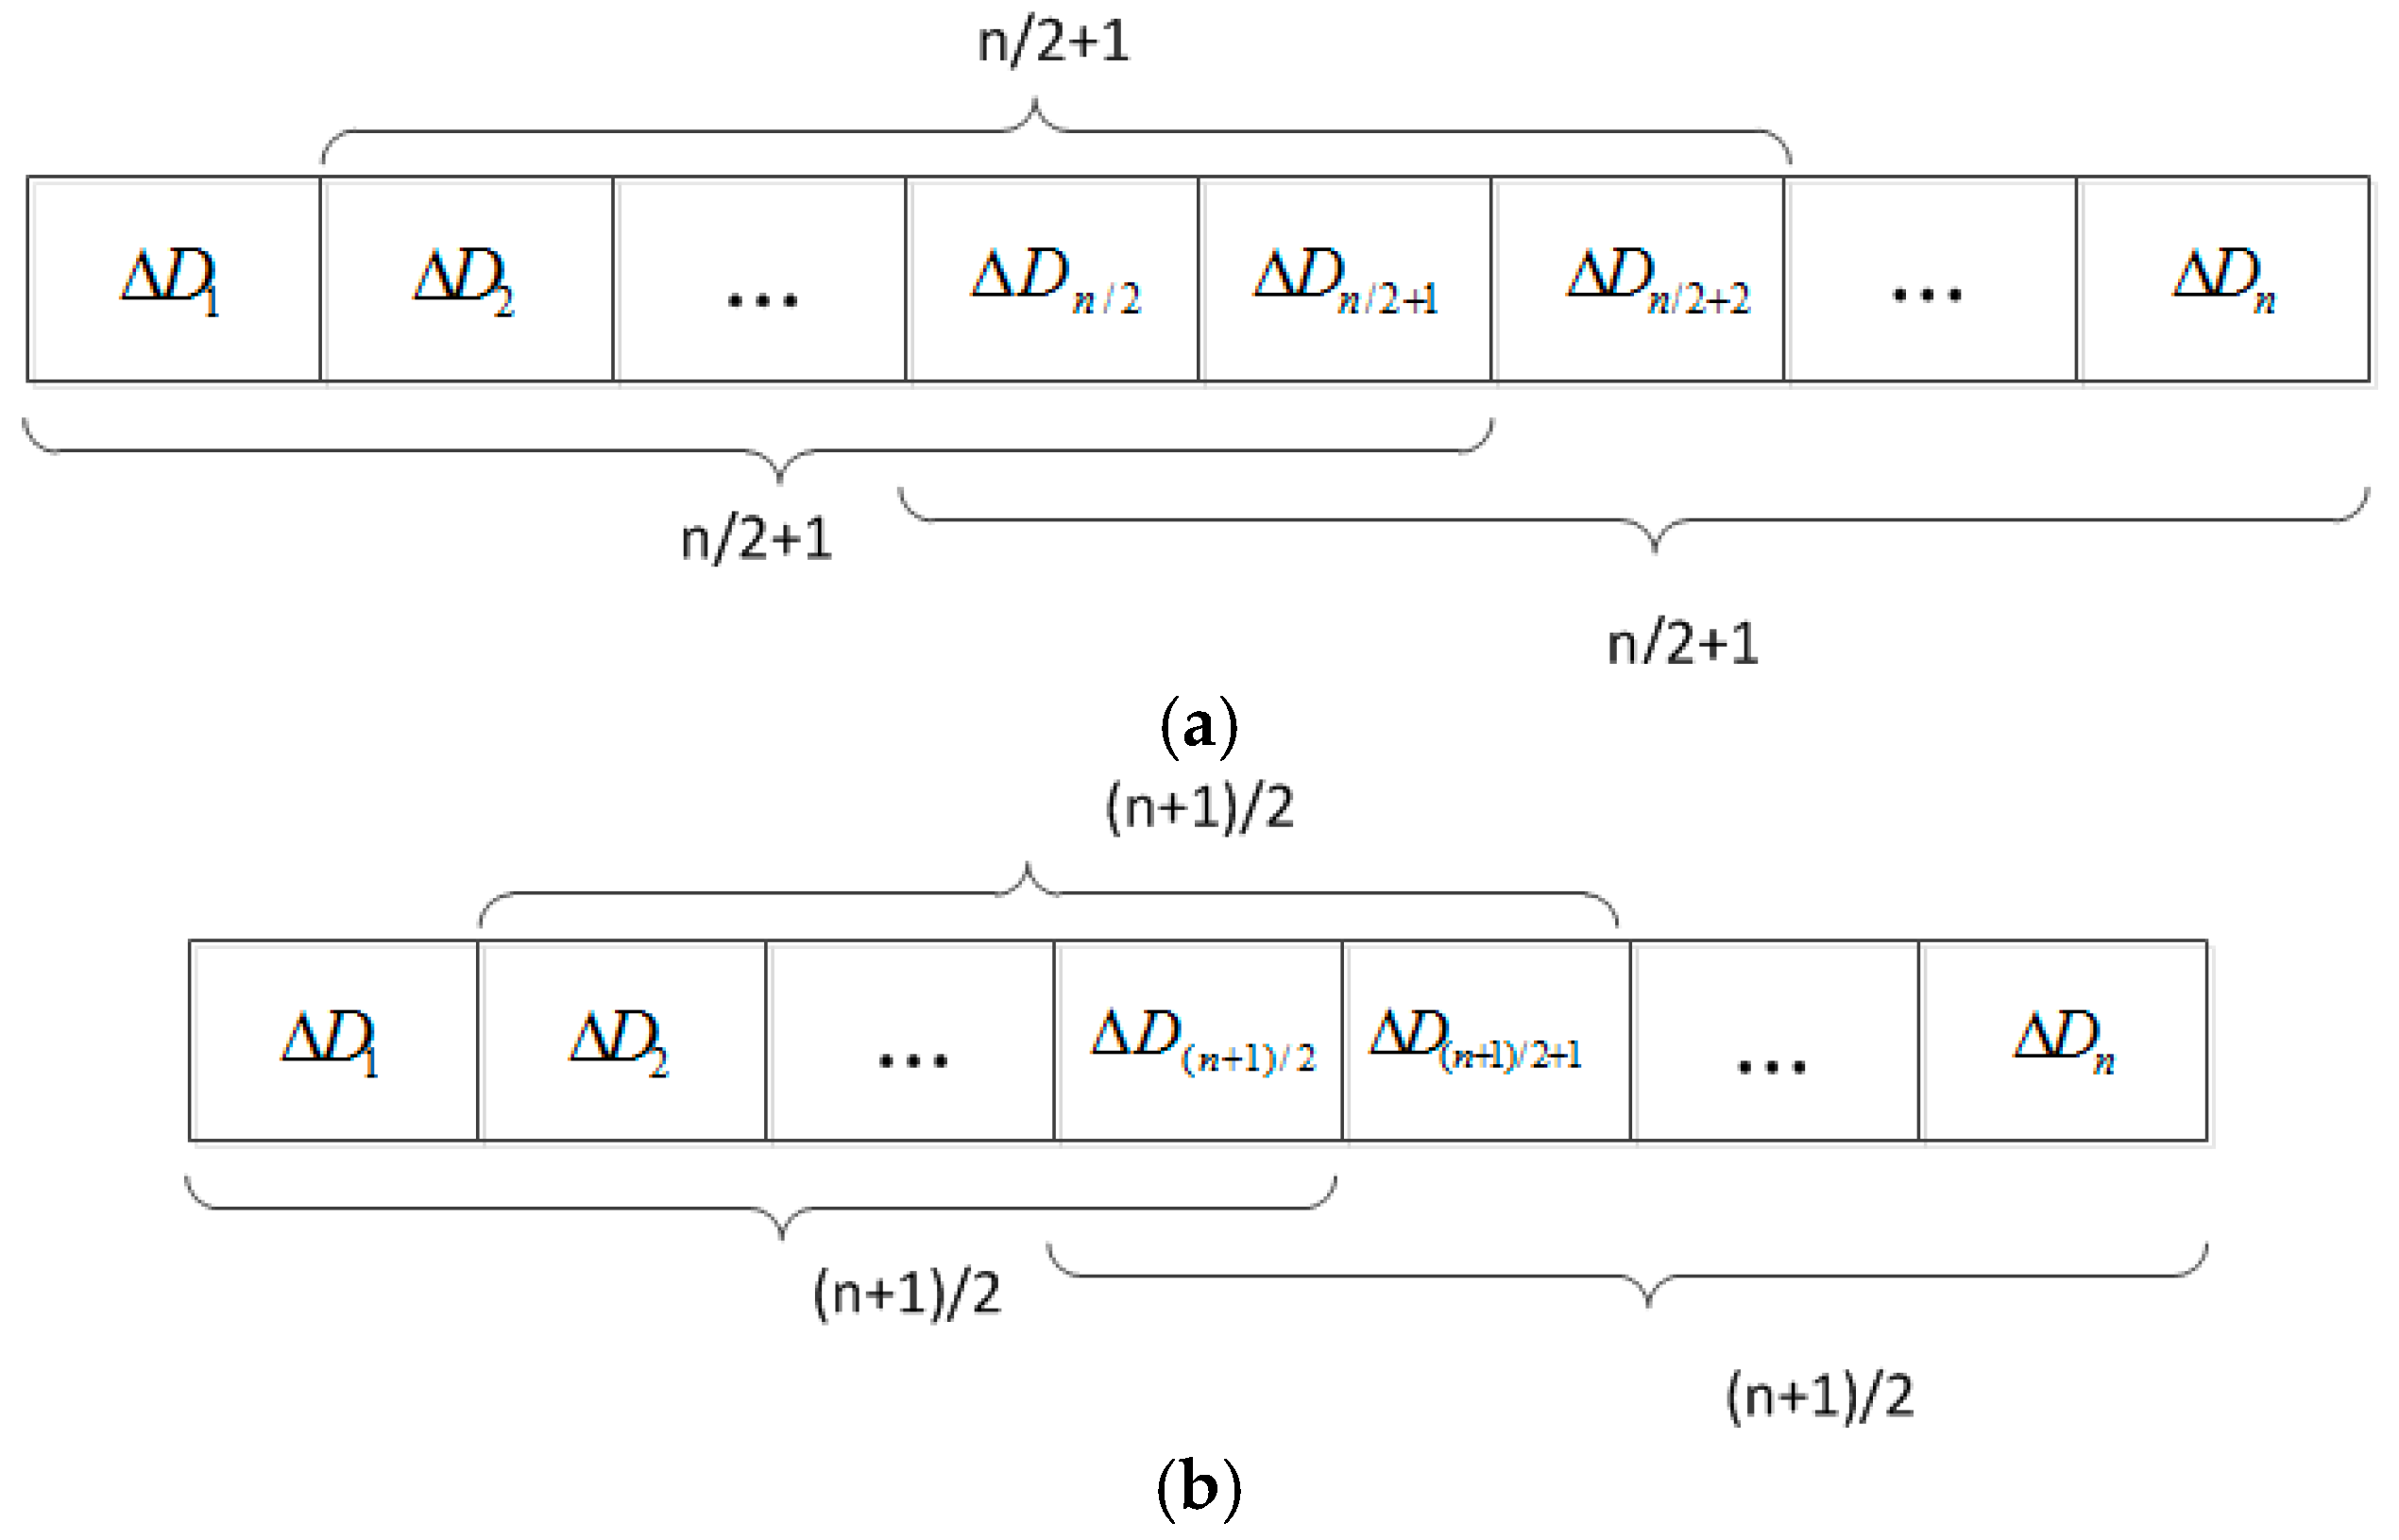
Ordering the variations of collected data from the n sensor nodes ascendingly results in ΔD1 ≤ ΔD2 ≤ ΔDn−1 ≤ ΔDn. As the variation in adjacent instants from sensor nodes with normal operation has a similar value, at least k nodes are operating normally at any time. As the variations from faulty sensor nodes are relatively large, those from the k nodes with normal operation are adjacent after ordering. Thus, the data variations of the k sensor nodes conform to datasets (ΔD1, ΔD2, …, ΔDk), (ΔD2, ΔD3, …, ΔDk+1), …, and (ΔDn−k+1, ΔDn−k+2, …, ΔDn), each comprised of k values.
As shown in Figure 5, (n − k + 1) datasets of sensor nodes with normal operation can be obtained, whose variance can be determined. As at least k sensor nodes operate normally, the dataset retrieving the smallest variance among the possible datasets is the one determining normal data variations and serves as the reference. Thus, any sensor node with similar data variation can be considered to be operating normally.
3.2.2. Algorithm
The proposed fault-detection algorithm is divided into two steps, one for classifying the sensor nodes with normal operation, and the other to determine whether a fault occurs in the sensor nodes not previously classified as operating normally.
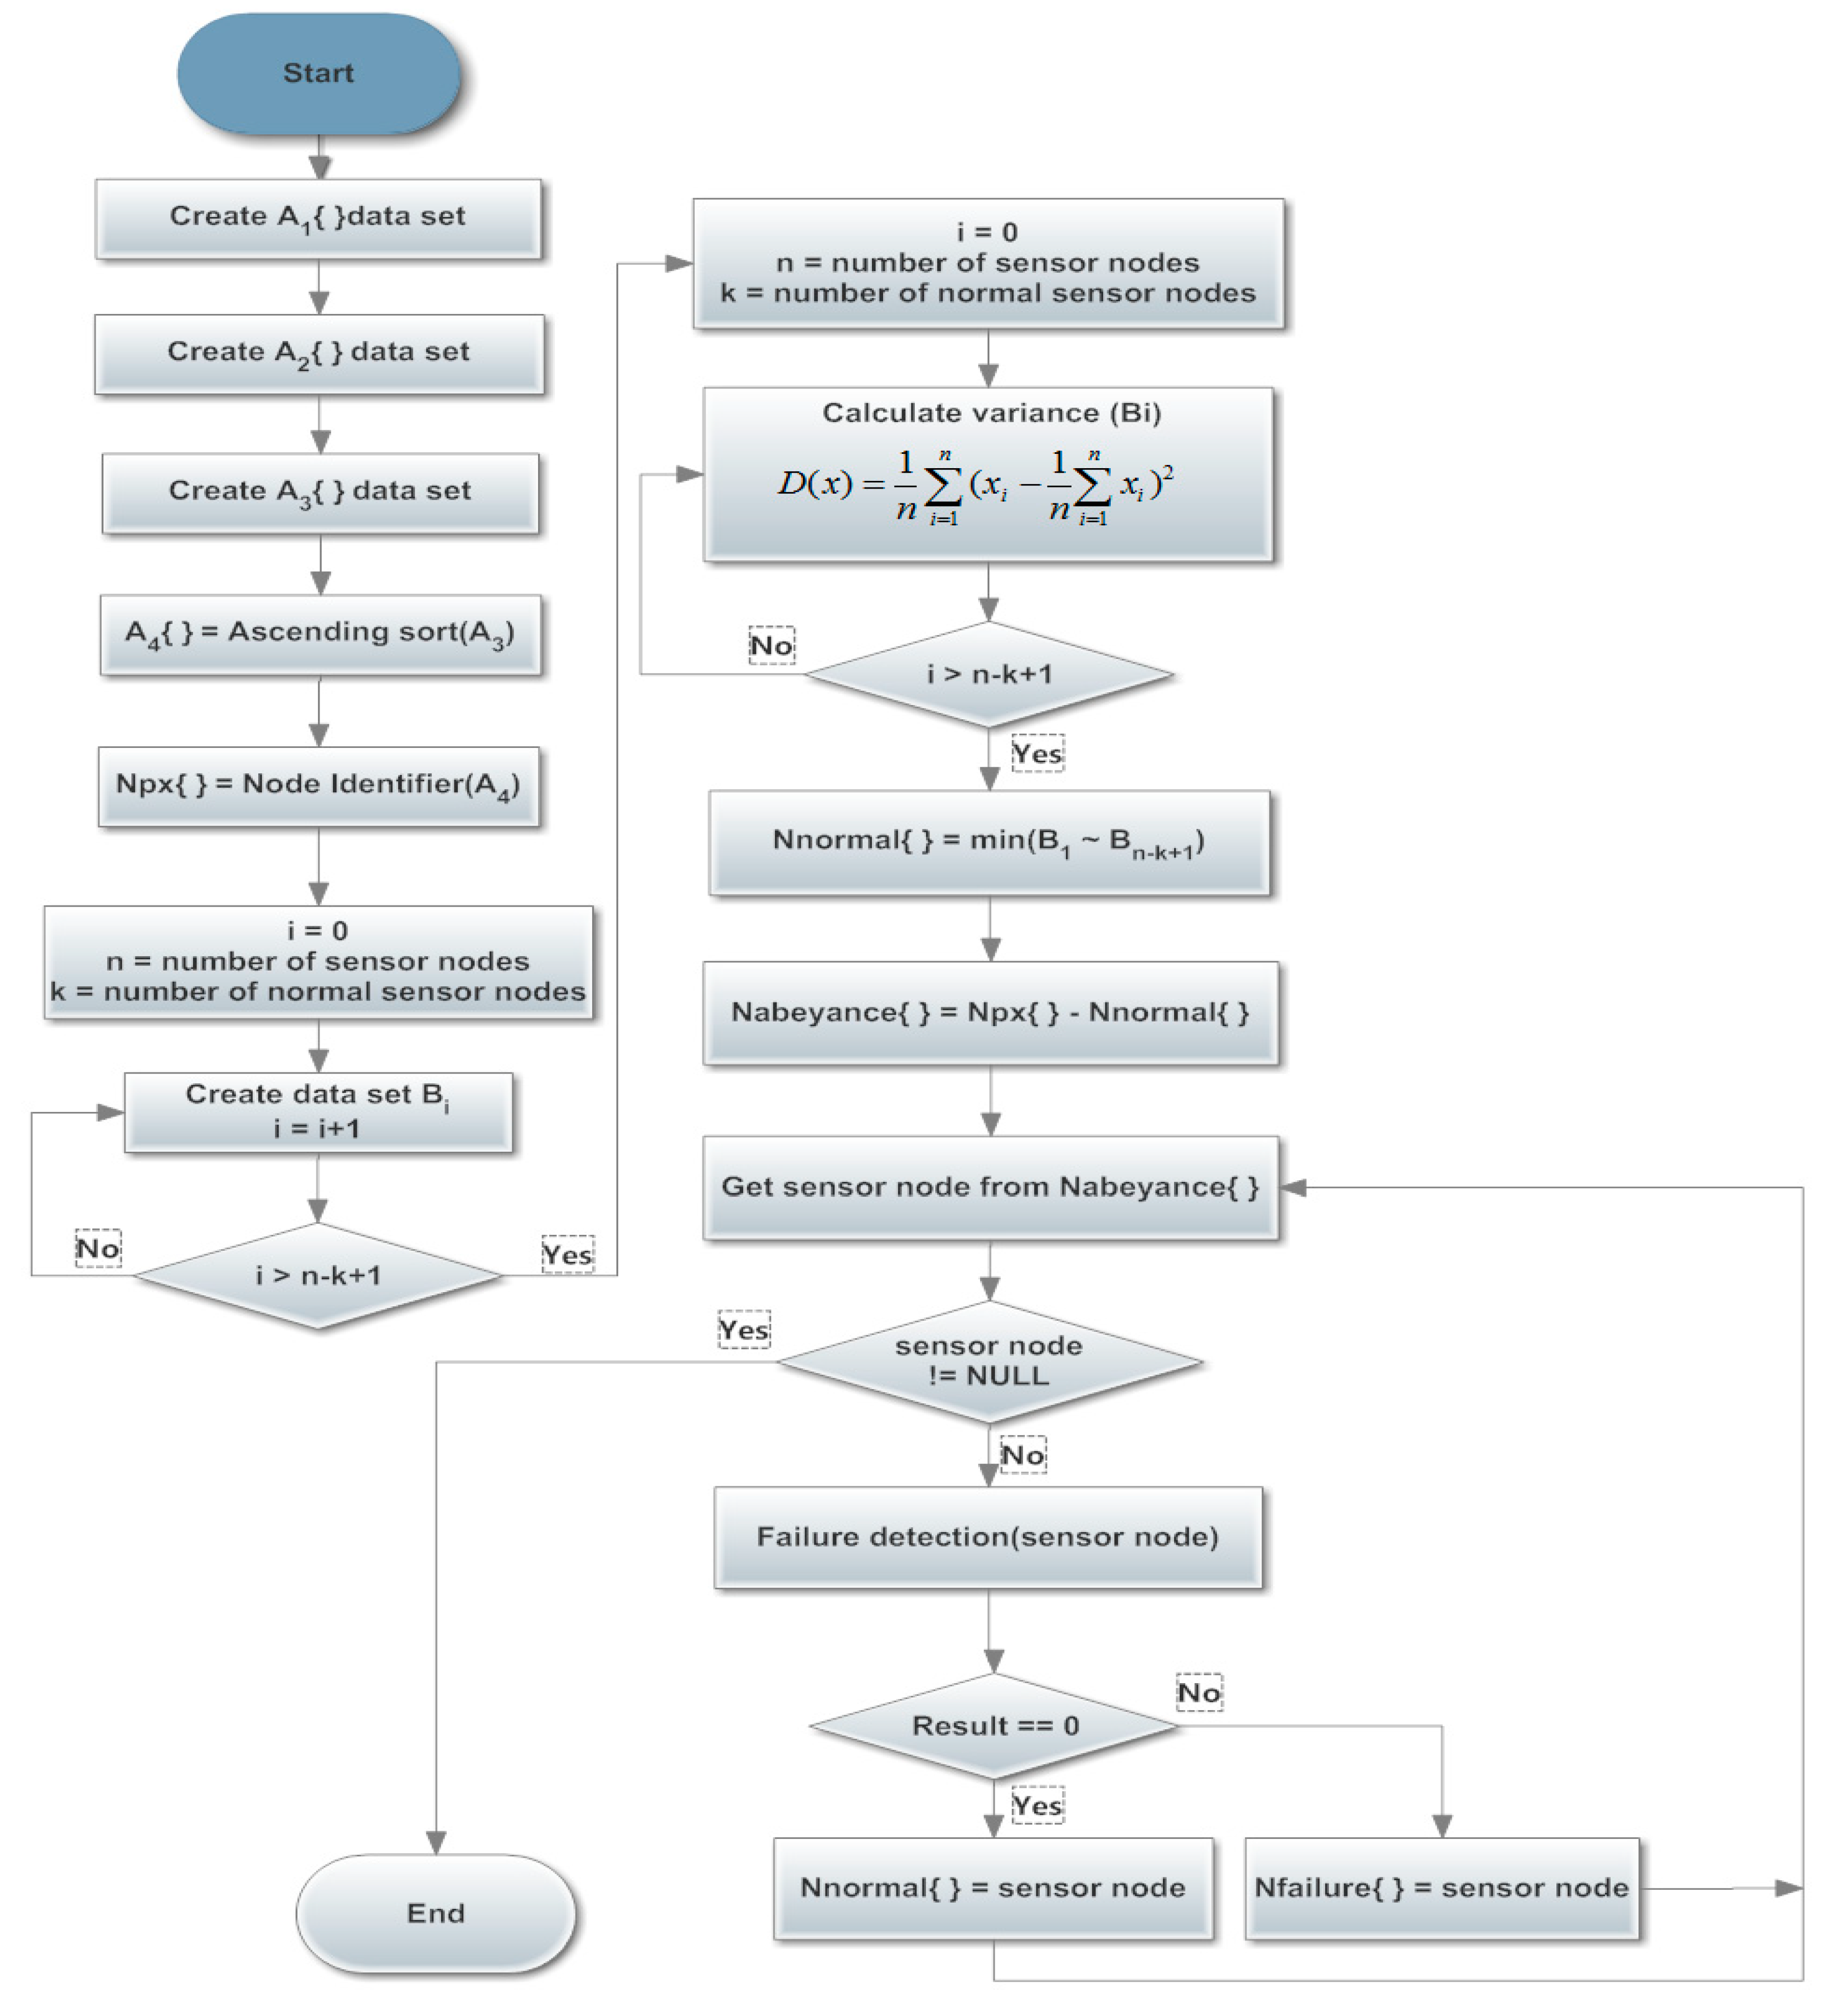
Table 1 lists the symbols employed for the fault-detection algorithm, and Figure 6 shows the algorithmic flowchart. Fault detection among sensor nodes proceeds as follows:
- (1)
- Sets of sensor node data averages received by a hub node in the previous period and data at the current period are obtained as A1 and A2, respectively. A set of the data variations between sets A1 and A2 is defined as A3.
- (2)
- Set A4 sorts the elements in A3 in ascending order, and the set of sensor node identifiers corresponding to set A4, Npx, is obtained.
- (3)
- The (n − k + 1) datasets are divided as follows starting from the first value, ΔD1, of set A4:
- (4)
- Equation (7) is used to calculate the variance for datasets B1 to Bn−k+1. The sensor node identifiers of the data set with the smallest variances are arranged in set Nnormal with reference to set Npx. The remaining sensor node identifiers are arranged in set Nabeyance.
- (5)
- The occurrence of a fault is determined for all sensor nodes belonging to set Nabeyance. The data variation is calculated, and if it is below the threshold value, the result is 0 using Equation (5). Hence, this sensor node is operating normally, and its identifier is removed from set Nabeyance and placed into set Nnormal. Otherwise, the identifier is placed into set Nfailure, indicating a faulty sensor node. This procedure is applied to every sensor node in set Nabeyance for complete fault detection.
4. Tests on IoT-Based, Specialized-Fruit-Integrated Management Platform
4.1. System Specifications and Configuration
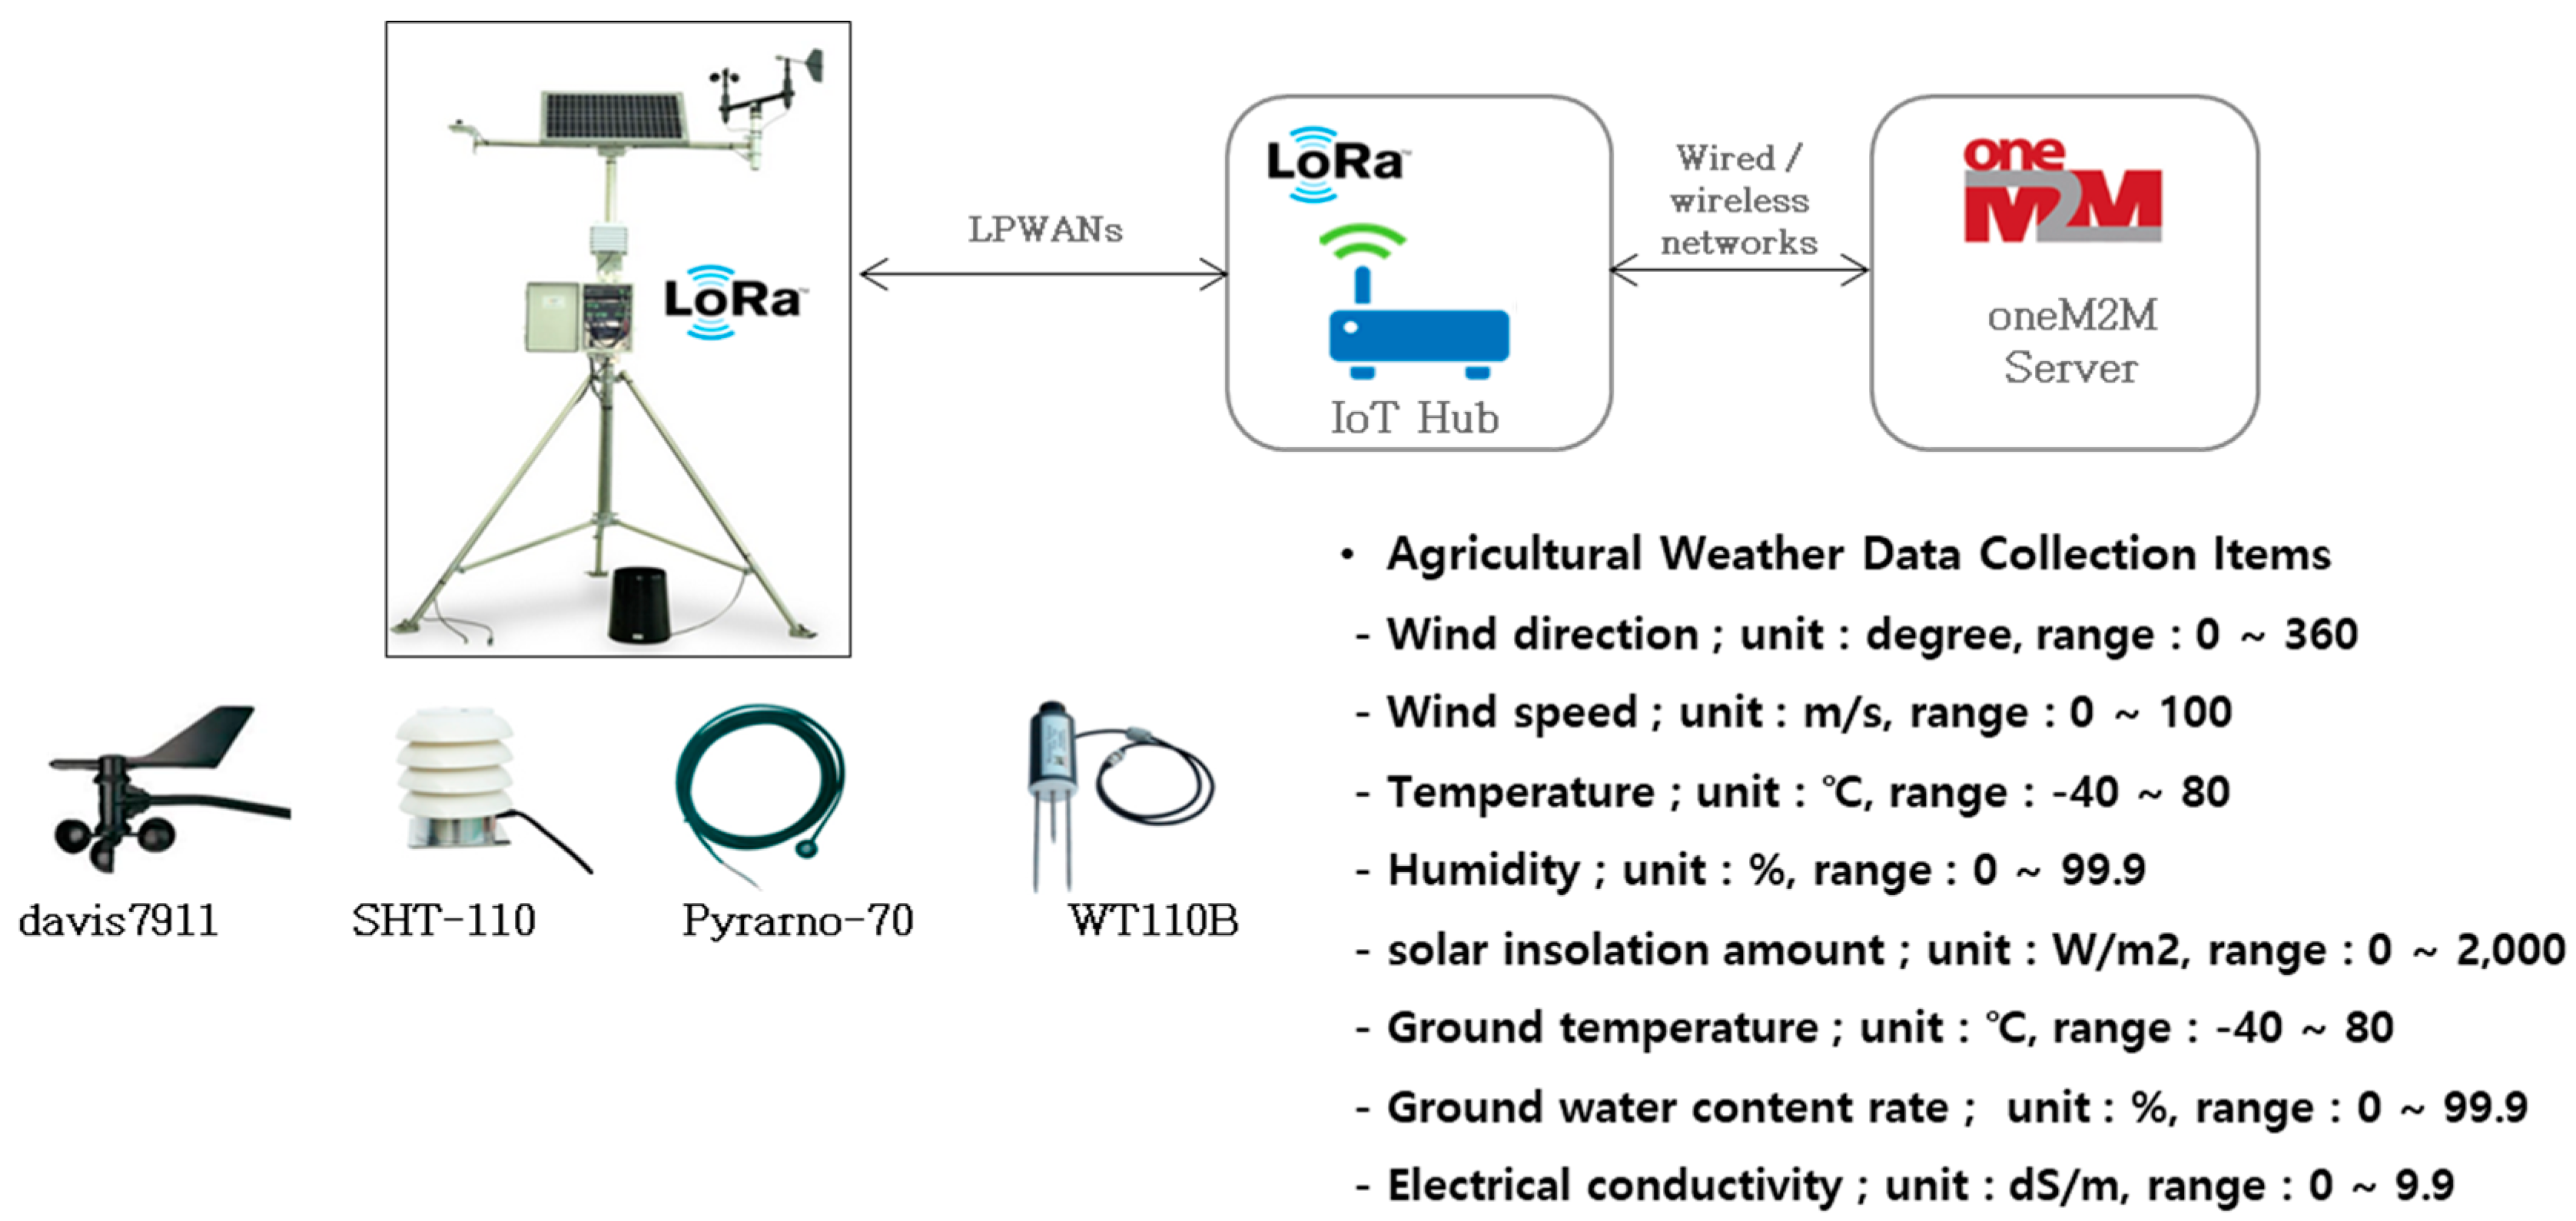
To apply the proposed algorithm, a real-time, IoT-based, specialized-fruit-integrated management platform was designed for monitoring meteorological disasters and pest outbreaks, and for performing predictions and spread prevention. Another real-time system was developed to collect regional meteorological information; agricultural environmental indexes; microenvironmental information and underground/ground environmental information in cultivation areas; and microclimate information. This implementation aimed to provide a system that notifies farmers of relevant information, monitors the growing environment of orchards, predicts pest outbreaks, and provides numerous, immediate decision support services through a visual interface in the event of meteorological disasters and pests.
To test the proposed sensor node fault detection, the IoT device management for the FaaS test environment in Section 2 was set up as shown in Figure 7, with nine sensor nodes in the environmental monitoring system. Then, abnormal data were transmitted from either one or four sensor nodes. Other specifications of the fault detection test system are listed in Table 2.
4.2. Results and Discussion
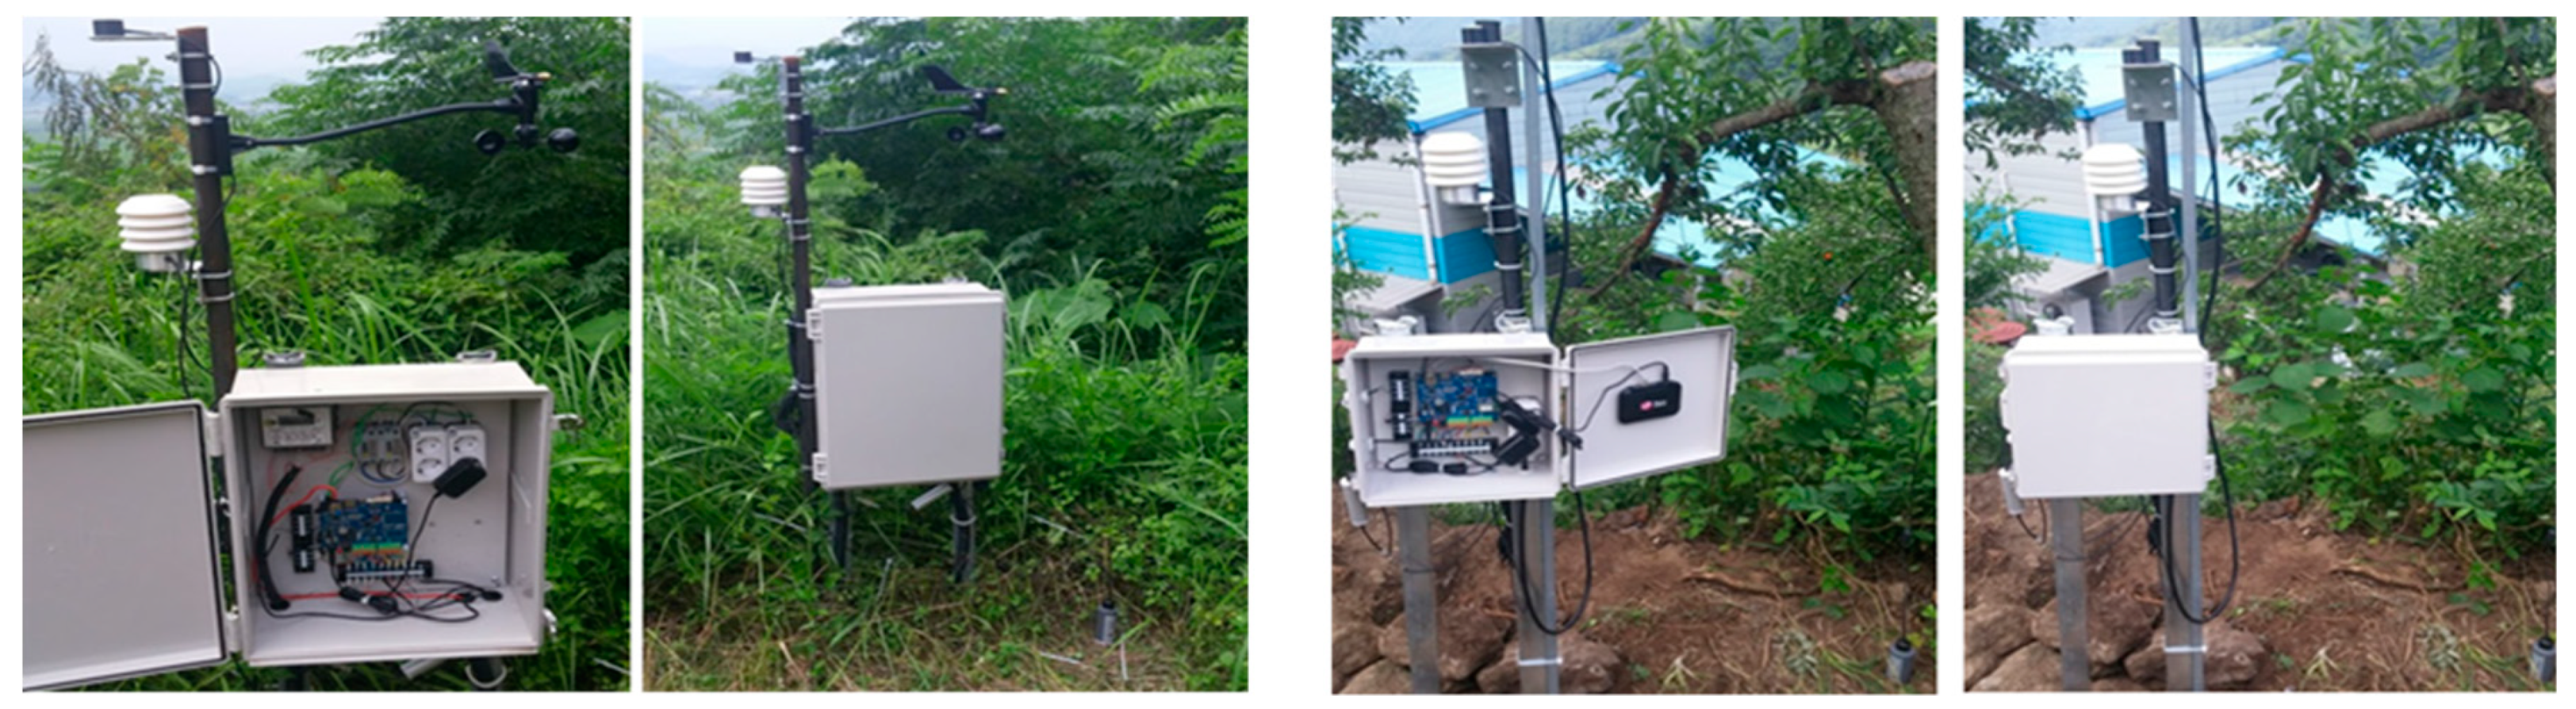
To implement the IoT-based platform, systems like that shown in Figure 8 were deployed over a South Korean plum (Prunus mume) crop in an open field. The results from 20 monitoring sites and their averages were analyzed to obtain the algorithmic evaluation results.
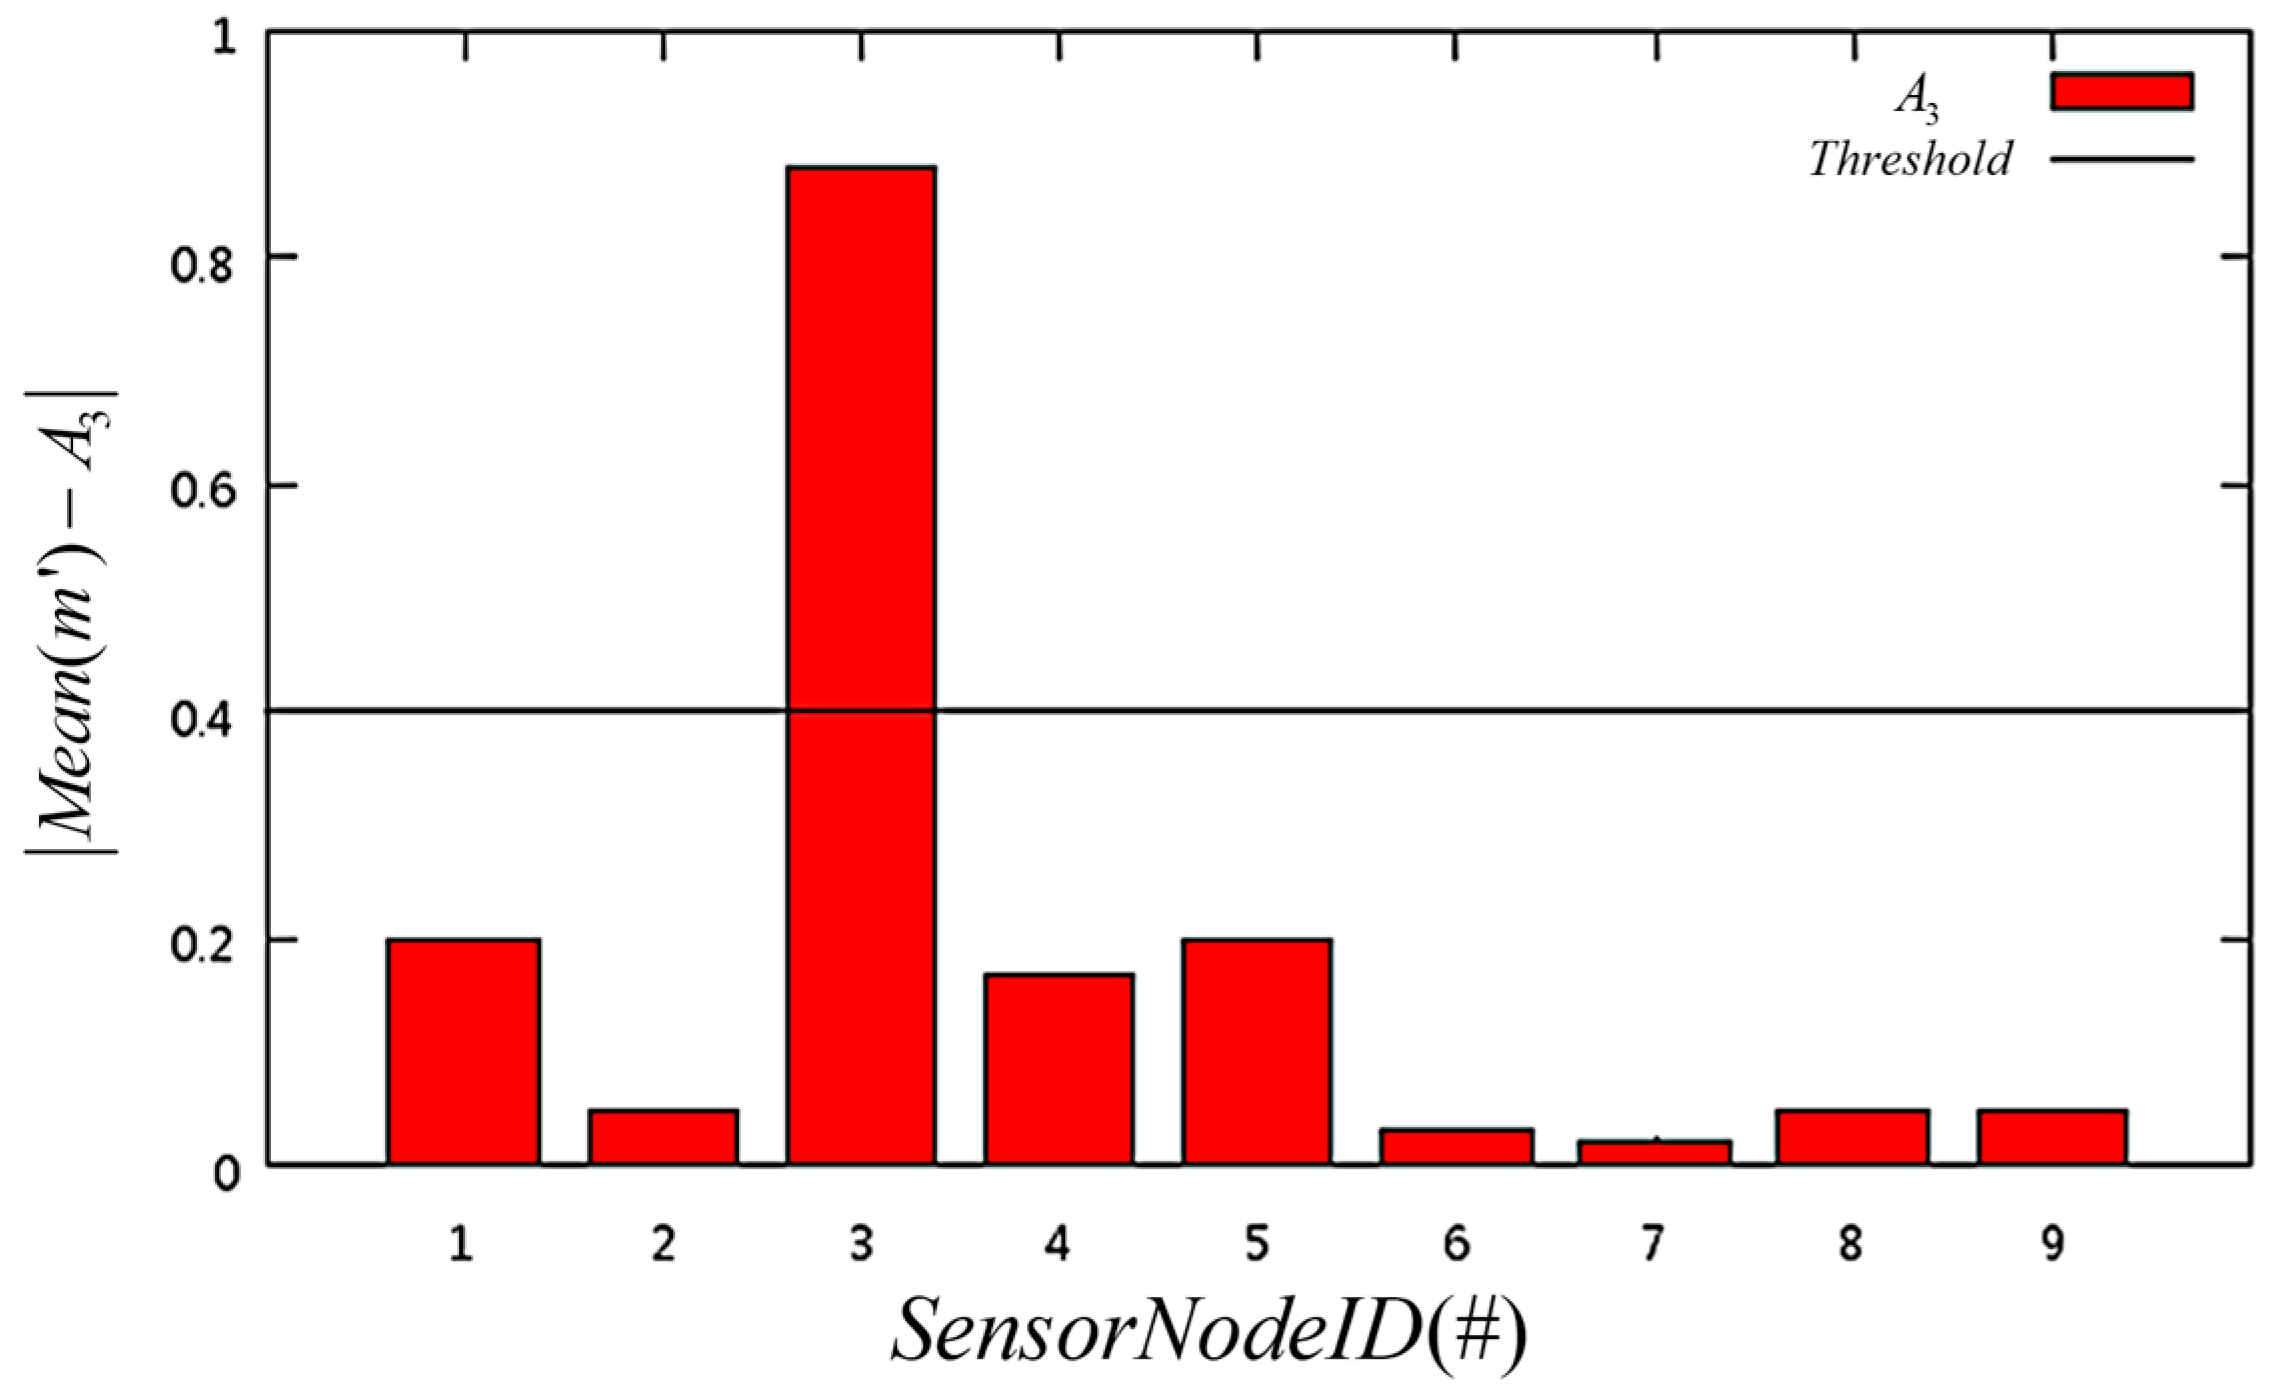
Table 3 shows that the data variation of sensor node 3 is larger than that of the other sensor nodes. By the fault-detection algorithm, the average data variation over the previous 10 periods and the collected data of the present period were compared to identify sensor nodes with normal operation. Equation (7) was used to calculate the variance of the data group comprised of five datapoints and classify the nodes with the smallest variance as operating normally. Then, Equation (5) was used to determine fault occurrence of the remaining nodes. Fault detection concluded that sensor node 3 was faulty.
In Figure 9, the threshold of the data variation (i.e., criterion for fault detection) was set to 0.4 considering the error of the temperature sensor. For sensor node 3, the difference from the average data variation (0.16) of the normally operating sensor nodes was 0.88, exceeding the threshold of 0.4 and indicating fault.
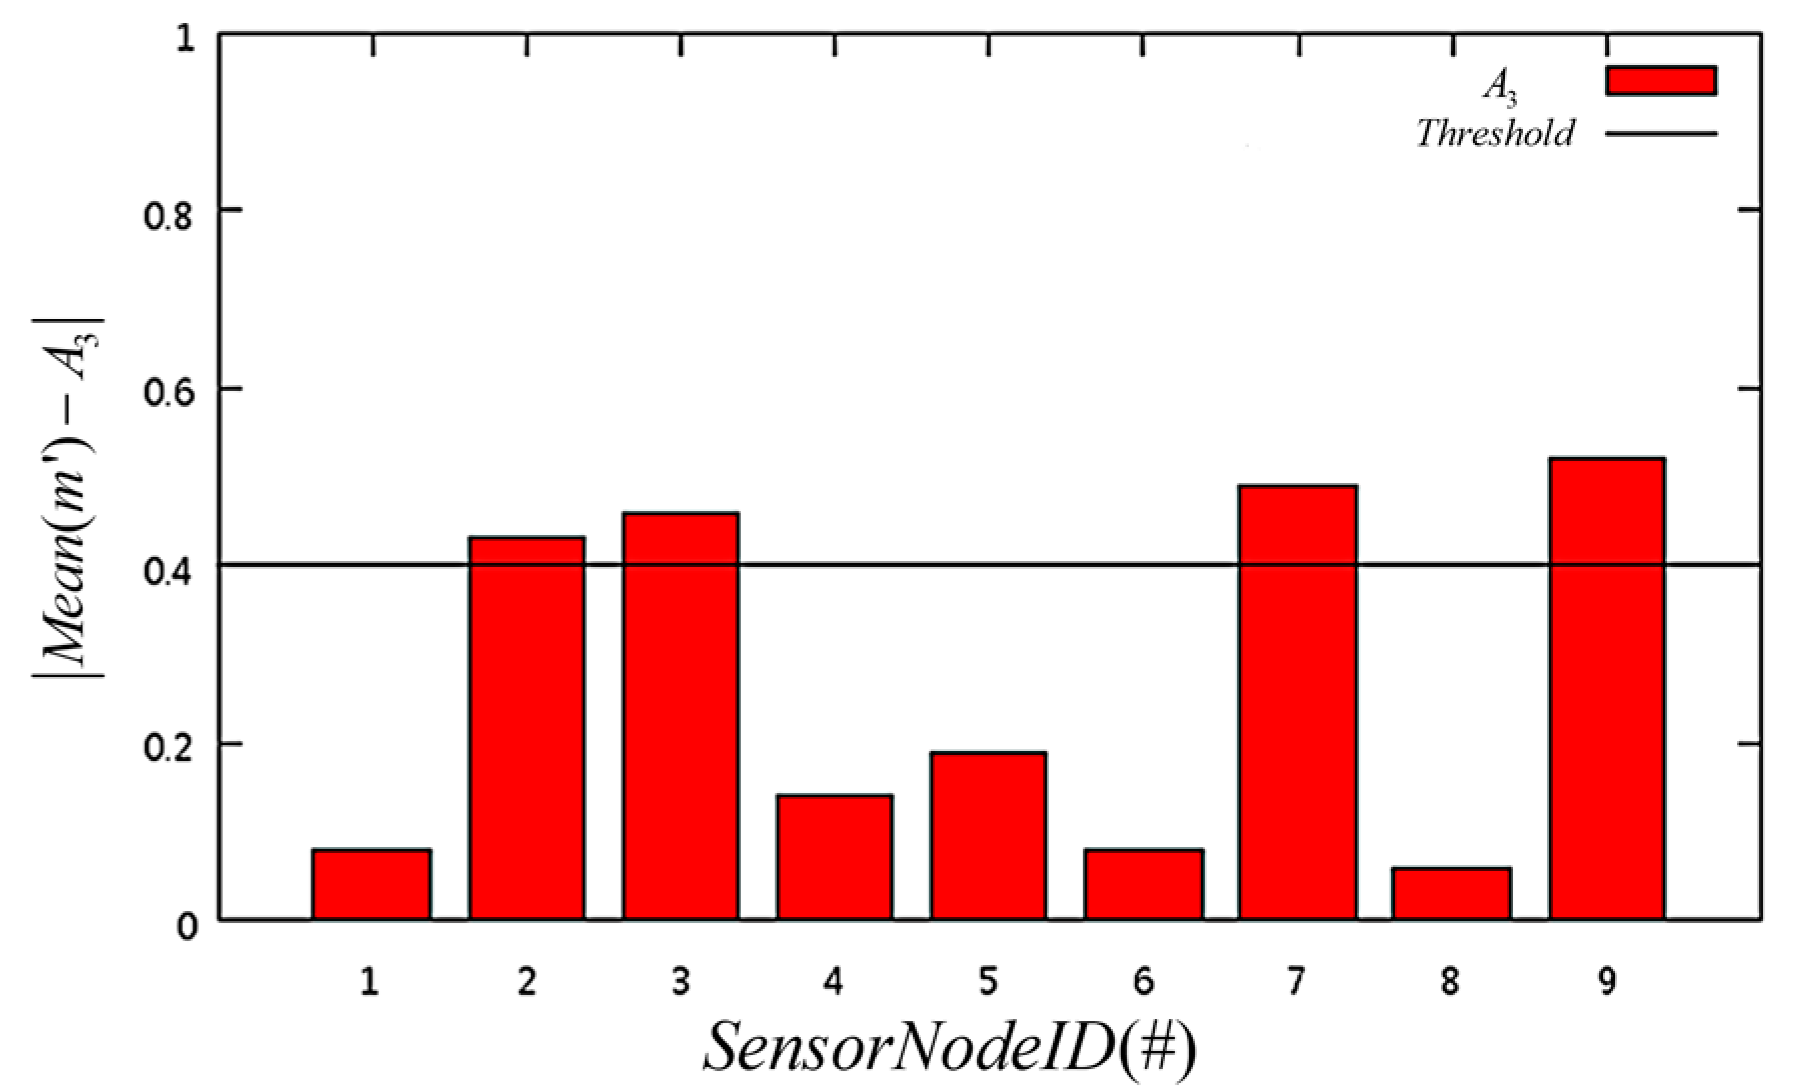
Likewise, Table 4 and Figure 10 show the fault detection results for the maximum number of faulty sensor nodes allowed in the WSN. Table 4 shows that the data variations of sensor nodes 2, 3, 7, and 9 are larger than those of the other sensor nodes; thus, being identified as faulty nodes by the fault-detection algorithm.
In Figure 10, for sensor nodes 2, 3, 7, and 9, the difference from the average data variation (0.15) of the normally operating sensor nodes exceeded the threshold of 0.4, indicating the four faulty nodes.
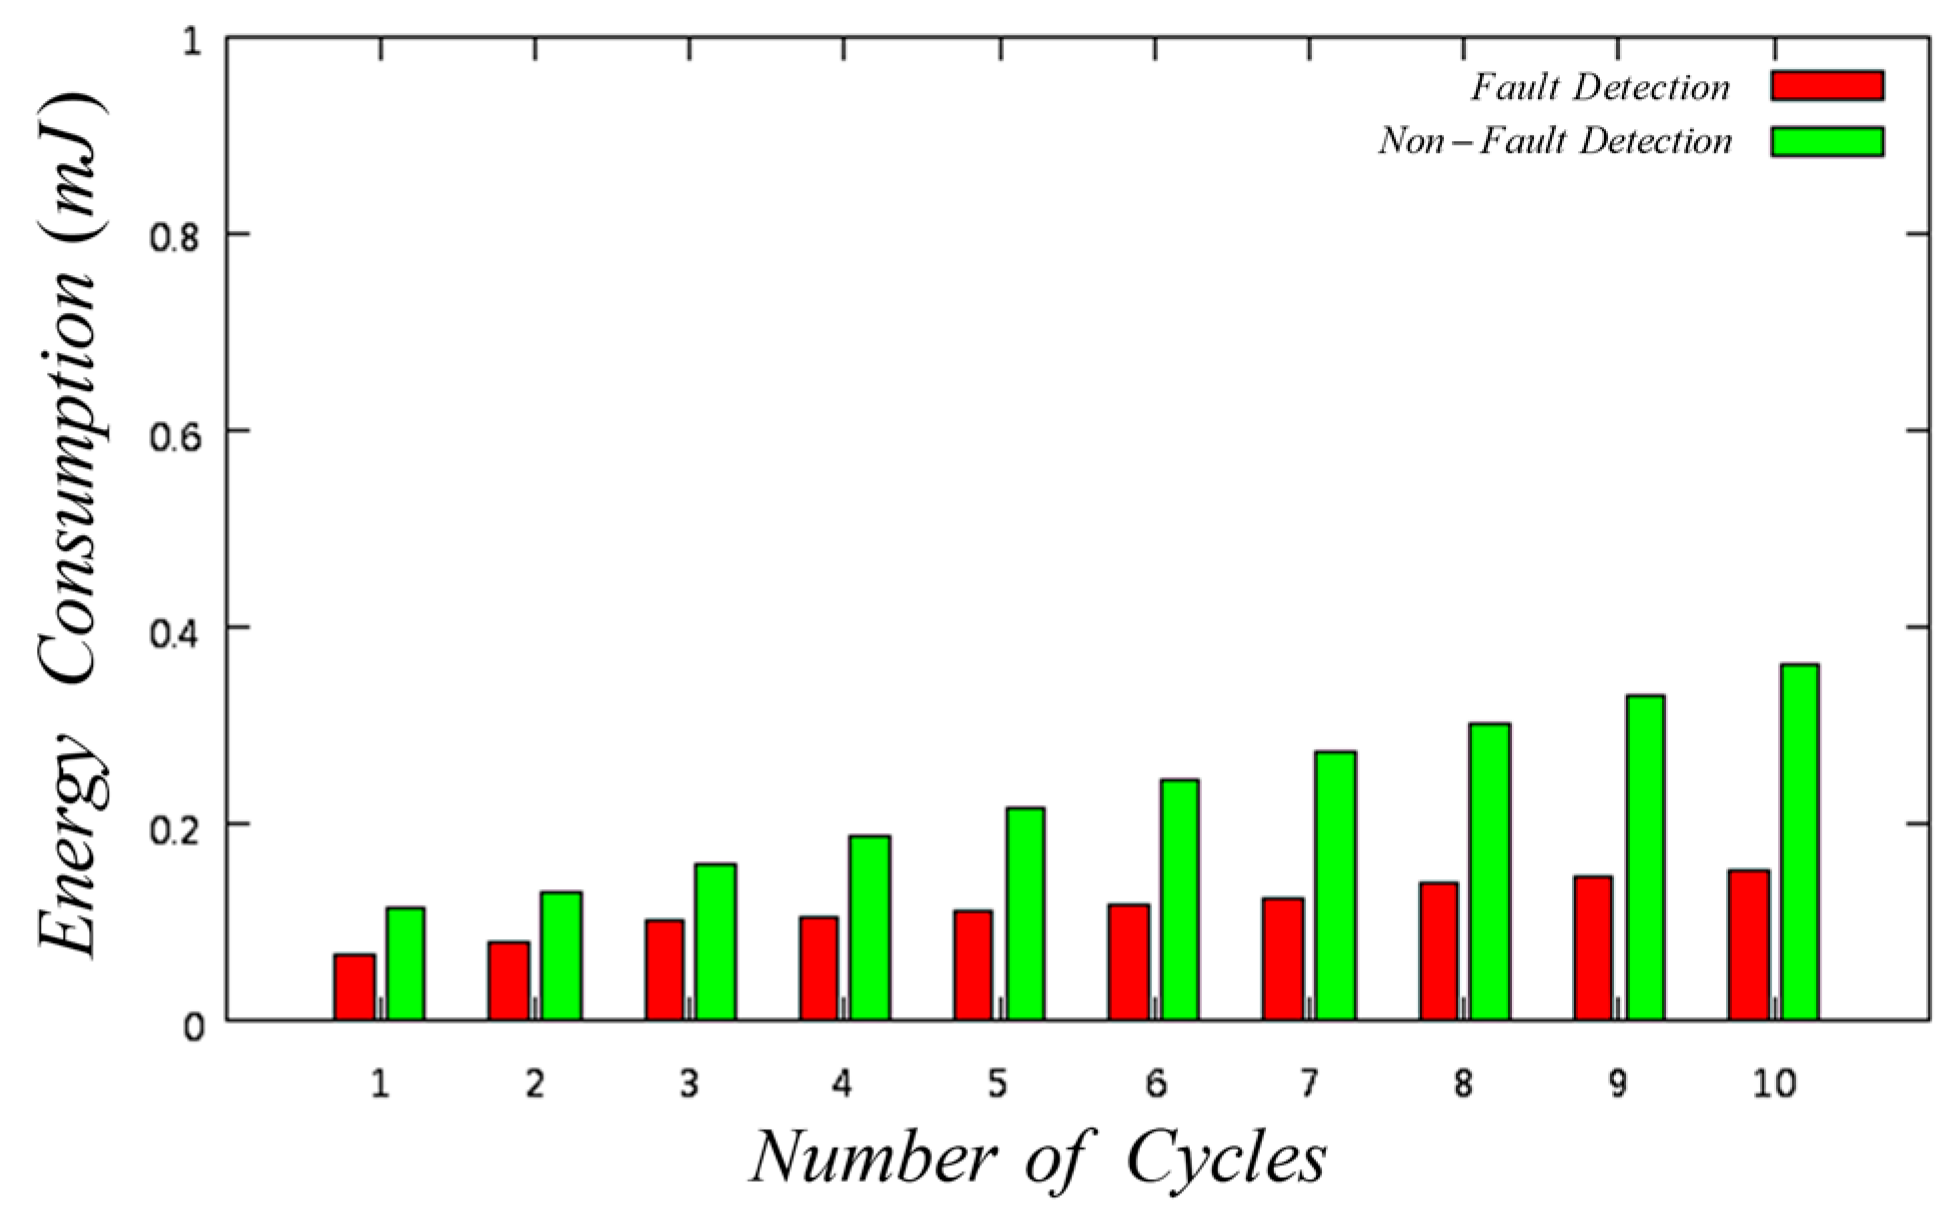
Sensor node fault detection is necessary to prevent abnormal data from being transmitted and to reduce energy consumption by disabling faulty nodes in the WSN. In Figure 11, the effect of fault detection in energy consumption over time is depicted. When a faulty sensor node is not disabled, unnecessary data transmission of other sensor nodes occurs due to continuous abnormal data transmission; thus, increasing energy consumption.
5. Conclusions
Agricultural development is increasing by means of quantification and data analysis. Hence, it is necessary to formalize, collect, manage, and analyze data based on experience and knowledge accumulated by farmers and researchers to establish smart-farm platforms. In this paper, the design and implementation of fault detection for smart-farm sensors is presented. This kind of detection is essential for the proper operation of a smart-farm platform. In farms operating modernized, large-scale greenhouses, optimal growth information management according to facilities and crops is essential.
Through the data-based fault-detection algorithm developed in this study, sensor nodes transmitting abnormal data can be detected, and their data transmission can be disabled, thereby increasing the reliability of the collected environmental data. The proposed algorithm provides accurate environmental data to users even if some faulty sensor nodes do not transmit data, provided that the normally operating nodes retrieve values within the predicted range and not exceeding an error threshold. Although the proposed algorithm enables energy efficiency in the entire WSN, data processing can be compromised by the missing data from faulty sensor nodes. Therefore, calibration for missing data is required for suitable processing. Note that no problems other than sample loss occur, even with data missing at random, as missing data values are excluded.
Besides smart farms, environmental monitoring systems are applied in areas that require high data reliability, such as firefighting and disaster prevention. Accordingly, a method for determining faulty nodes is essential for the reliable data collection in these areas. In fact, extensive damage may occur if incorrect information is provided to the user due to abnormal data retrieved by a faulty sensor node. To determine sensor node’s faults, the proposed fault-detection algorithm uses data collected during certain periods to determine a faulty behavior through statistical methods. The algorithm was implemented on a system to detect faulty sensor nodes, which were disabled from the WSN to prevent corrupted data transmission, thereby improving energy efficiency.
In future developments, a system to provide malfunction detection and notification services (e.g., deep learning-based sensing values) will be investigated by using metadata and measurements from various sensing devices, environmental information, and network status information. Prognostics and health management technologies are being actively researched, and system failures can be detected early and even predicted by real-time monitoring a system’s mechanical status. By taking appropriate preventive measures, maintenance costs can be reduced, and the safety and reliability of systems can be enhanced to prevent downtimes or even catastrophic events.
Author Contributions
Writing—original draft preparation, conceptualization, and software, J.B.; writing—review and editing, methodology, and software, M.L.; validation, project administration, and funding acquisition, C.S.
Funding
This work was supported by the Institute for Information and Communications Technology Promotion (IITP) under a grant funded by the Korean government (MSIP) (R7117-16-0154, Development of cloud-based smart bed system and FaaS technology for smart farm expansion), and IPET (Korea Institute of Planning and Evaluation for Technology in Food, Agriculture, Forestry and Fisheries) through the Advanced Production Technology Development Program, funded by MAFRA (Ministry of Agriculture, Food and Rural Affairs) (315001-5).
Conflicts of Interest
The authors declare that there are no conflicts of interest regarding the publication of this paper.
References
- O’Grady, M.J.; O’Hare, G.M. Modelling the smart farm. Inf. Process. Agric. 2017, 4, 179–187. [Google Scholar] [CrossRef]
- Lee, M.; Kim, H.; Yoe, H. Intelligent environment management system for controlled horticulture. In Proceedings of the 4th NAFOSTED Conference on Information and Computer Science, Hanoi, Vietnam, 24–25 November 2017; pp. 116–119. [Google Scholar]
- Jindarat, S.; Wuttidittachotti, P. Smart farm monitoring using Raspberry Pi and Arduino. In Proceedings of the International Conference on Computer, Communications, and Control Technology (I4CT), Kuching, Malaysia, 21–23 April 2015; pp. 284–288. [Google Scholar]
- Kaewmard, N.; Saiyod, S. Sensor data collection and irrigation control on vegetable crop using smart phone and wireless sensor networks for smart farm. In Proceedings of the IEEE Conference on Wireless Sensors (ICWiSE), Selangor, Malaysia, 26–28 October 2014; pp. 106–112. [Google Scholar]
- Culibrina, F.B.; Dadios, E.P. Smart farm using wireless sensor network for data acquisition and power control distribution. In Proceedings of the International Conference on Humanoid, Nanotechnology, Information Technology, Communication and Control, Environment and Management (HNICEM), Cebu City, Philippines, 9–12 December 2015; pp. 1–6. [Google Scholar]
- Schader, C.; Baumgart, L.; Landert, J.; Muller, A.; Ssebunya, B.; Blockeel, J.; Weisshaidinger, R.; Petrasek, R.; Mészáros, D.; Padel, S.; et al. Using the sustainability monitoring and assessment routine (SMART) for the systematic analysis of trade-offs and synergies between sustainability dimensions and themes at farm level. Sustainability 2016, 8, 274. [Google Scholar] [CrossRef]
- Trebar, M. Cold Chain and Shelf Life Prediction of Refrigerated Fish–From Farm to Table. In Cloud Infrastructures, Services, and IoT Systems for Smart Cities; Springer: Berlin, Germany, 2017; pp. 76–83. [Google Scholar]
- Wolfert, S.; Goense, D.; Sørensen, C.A.G. A future internet collaboration platform for safe and healthy food from farm to fork. In Proceedings of the Annual SRII Global Conference, San Jose, CA, USA, 23–25 April 2014; pp. 266–273. [Google Scholar]
- Skilton, M.; Hovsepian, F. The 4th Industrial Revolution: Responding to the Impact of Artificial Intelligence on Business; Springer: Berlin, Germany, 2017. [Google Scholar]
- Kodama, F. Learning Mode and Strategic Concept for the 4th Industrial Revolution. J. Open Innov. Technol. Mark. Complex. 2018, 4, 32. [Google Scholar] [CrossRef]
- Sung, J. The Fourth Industrial Revolution and Precision Agriculture. In Automation in Agriculture: Securing Food Supplies for Future Generations; Intechopen: London, UK, 2018. [Google Scholar] [CrossRef] [Green Version]
- Monteleone, S.; de Moraes, E.A.; Maia, R.F. Analysis of the variables that affect the intention to adopt Precision Agriculture for smart water management in Agriculture 4.0 context. In Proceedings of the Global IoT Summit (GIoTS), Aarhus, Denmark, 17–21 June 2019; pp. 1–6. [Google Scholar]
- Zambon, I.; Cecchini, M.; Egidi, G.; Saporito, M.G.; Colantoni, A. Revolution 4.0: Industry vs. agriculture in a future development for SMEs. Processes 2019, 7, 36. [Google Scholar] [CrossRef]
- Kim, S.; Lee, M.; Shin, C. IoT-based strawberry disease prediction system for smart farming. Sensors 2018, 18, 4051. [Google Scholar] [CrossRef] [PubMed]
- Shin, C.-S.; Lee, Y.-W.; Lee, M.-H.; Park, J.-W.; Yoe, H. Design of ubiquitous glass green houses. In 2009 Software Technologies for Future Dependable Distributed Systems; IEEE: Piscataway, NJ, USA, 2009; pp. 169–172. [Google Scholar]
- Telecommunications Technology Association. Requirements of SmartFarm Service Based on Cloud Platform, TTAK.KO-10.0937. Available online: http://www.tta.or.kr (accessed on 20 October 2019).
- Telecommunications Technology Association. Response Service Interface against Disease & Insect Pest Based on Farm Cloud, TTAK.KO-10.1005. Available online: http://www.tta.or.kr (accessed on 20 October 2019).
- Telecommunications Technology Association. Interface between Farm Cloud and Third-Party Application Service, TTAK.KO-10.1006. Available online: http://www.tta.or.kr (accessed on 20 October 2019).
- Telecommunications Technology Association. Data Transmission Protocol between Farm Cloud and Cloud Devices, TTAK.KO-10.1007. Available online: http://www.tta.or.kr (accessed on 20 October 2019).
- Lee, M.; Yoe, H. Analysis of environmental stress factors using an artificial growth system and plant fitness optimization. Biomed Res. Int. 2015, 6, 292543. [Google Scholar] [CrossRef] [PubMed]
- Lee, M.; Kim, H.; Yoe, H. ICBM-based smart farm environment management system. In Proceedings of the International Conference on Software Engineering, Artificial Intelligence, Networking and Parallel/Distributed Computing, Toyama, Japan, 8–10 July 2018; pp. 42–56. [Google Scholar]
- Rault, T.; Bouabdallah, A.; Challal, Y. Energy efficiency in wireless sensor networks: A top-down survey. Comput. Netw. 2014, 67, 104–122. [Google Scholar] [CrossRef]
- Camilo, T.; Carreto, C.; Silva, J.S.; Boavida, F. An energy-efficient ant-based routing algorithm for wireless sensor networks. In Proceedings of the International Workshop on Ant Colony Optimization and Swarm Intelligence, Brussels, Belgium, 4–7 September 2006; pp. 49–59. [Google Scholar]
- Gupta, G.; Younis, M. Fault-tolerant clustering of wireless sensor networks. In Proceedings of the IEEE Wireless Communications and Networking (WCNC), New Orleans, LA, USA, 16–20 March 2003; pp. 1579–1584. [Google Scholar]
- Ozdemir, S.; Xiao, Y. FTDA: Outlier detection-based fault-tolerant data aggregation for wireless sensor networks. Secur. Commun. Netw. 2013, 6, 702–710. [Google Scholar] [CrossRef]
- Bonomi, F.; Milito, R.; Zhu, J.; Addepalli, S. Fog computing and its role in the internet of things. In Proceedings of the first edition of the MCC workshop on Mobile cloud computing, Helsinki, Finland, 17 August 2012; pp. 13–16. [Google Scholar]
- Naranjo, P.G.V.; Pooranian, Z.; Shojafar, M.; Conti, M.; Buyya, R. FOCAN: A Fog-supported smart city network architecture for management of applications in the Internet of Everything environments. J. Parallel Distrib. Comput. 2019, 132, 274–283. [Google Scholar] [CrossRef]
- Park, H.; Kim, H.; Joo, H.; Song, J. Recent advancements in the Internet-of-Things related standards: A oneM2M perspective. Ict Express 2016, 2, 126–129. [Google Scholar] [CrossRef] [Green Version]
- Swetina, J.; Lu, G.; Jacobs, P.; Ennesser, F.; Song, J. Toward a standardized common M2M service layer platform: Introduction to oneM2M. IEEE Wirel. Commun. 2014, 21, 20–26. [Google Scholar] [CrossRef]
- Kim, J.; Choi, S.-C.; Ahn, I.-Y.; Sung, N.-M.; Yun, J. From WSN towards WoT: Open API scheme based on oneM2M platforms. Sensors 2016, 16, 1645. [Google Scholar] [CrossRef] [PubMed]
- Pham, N.D.; Le, T.D.; Park, K.; Choo, H. SCCS: Spatiotemporal clustering and compressing schemes for efficient data collection applications in WSNs. Int. J. Commun. Syst. 2010, 23, 1311–1333. [Google Scholar] [CrossRef]
- Liu, C.; Wu, K.; Pei, J. An energy-efficient data collection framework for wireless sensor networks by exploiting spatiotemporal correlation. IEEE Trans. Parallel Distrib. Syst. 2007, 18, 1010–1023. [Google Scholar] [CrossRef]
- Erwig, M.; Gu, R.H.; Schneider, M.; Vazirgiannis, M. Spatio-temporal data types: An approach to modeling and querying moving objects in databases. GeoInformatica 1999, 3, 269–296. [Google Scholar] [CrossRef]
- Matese, A.; Di Gennaro, S.; Zaldei, A.; Genesio, L.; Vaccari, F. A wireless sensor network for precision viticulture: The NAV system. Comput. Electron. Agric. 2009, 69, 51–58. [Google Scholar] [CrossRef]
- RF Sensor. SHT-110 (Humidity, Temperature), PYRARNO-70 (Solar Insolation), WT110B (Soil Moisture), Environmental Sensor. Available online: http://www.rfsensor.com (accessed on 15 October 2019).
- Sinha, R.S.; Wei, Y.; Hwang, S.-H. A survey on LPWA technology: LoRa and NB-IoT. Ict Express 2017, 3, 14–21. [Google Scholar] [CrossRef]
Figure 1.
Farm as a service (FaaS) using Internet of Things (IoT).

Figure 2.
Schematic of equipment management service.

Figure 3.
Structural design of smart farm architecture based on oneM2M common platform. Infrastructure node (IN): Logical node (usually FaaS) that represents the service infrastructure of IoT/M2M; middle node (MN): logical node (usually cloud gateway) that connects and controls IoT/M2M devices; application dedicated node (ADN): logical node with the function of sensing values and delivering them to a gateway/server without implementing common functions of oneM2M. This includes cloud sensor/actuator/hybrid nodes. Application entity (AE): logical entity that includes application function logic for providing M2M services; common service entity (CSE): rntity that provides common service functions provided in oneM2M, corresponding to middleware software.

Figure 4.
Hierarchical IoT resource structure: (a) FaaS information collection; (b) diagram of middle node-common service entity (MN-CSE) resource.
Figure 4.
Hierarchical IoT resource structure: (a) FaaS information collection; (b) diagram of middle node-common service entity (MN-CSE) resource.

Figure 5.
Sensor nodes for fault detection under (a) odd and (b) even numbers of nodes in a wireless sensor network (WSN).
Figure 5.
Sensor nodes for fault detection under (a) odd and (b) even numbers of nodes in a wireless sensor network (WSN).

Figure 6.
Proposed fault-detection algorithm for sensor nodes in a WSN.


Figure 8.
Units of IoT-based, specialized-fruit-integrated management platform.

Figure 9.
Sensor node fault detection for single node fault.

Figure 10.
Sensor node fault detection for four faulty nodes.

Figure 11.
Energy consumption comparison (single node fault).


Table 1.
Symbol definitions to describe fault detection.
| Symbol | Description |
|---|---|
| Set of average data from previous period with sensor node identifiers (includes data of up to 10 previous periods) | |
| Set of collected data during current period with sensor node identifiers | |
| Set of data variations with sensor node identifiers | |
| Set of data with values from sorted in ascending order | |
| Minimum number of sensor nodes operating normally at a given time | |
| Set of k consecutive datapoints in set | |
| Set of sensor node identifiers corresponding to entries in | |
| Set of sensor node identifiers considered to be operating normally | |
| Set of sensor node identifiers excluding normally operating nodes | |
| Set of sensor node identifiers corresponding to faulty operation |
Table 2.
Hardware specifications of IoT-based, specialized-fruit-integrated management platform.
| Component | Cloud Gateway Specification | Cloud Actuator and Sensor Node Specification |
|---|---|---|
| Microcontroller | ARM Cortex M3 16-bit timer 3EA 2-channel UART, 2-channel USART 12-bit analog-to-digital converter 3-channel internal DMA | ARM Cortex M3 16-bit timer 3EA 2-channel UART, 2-channel USART 12-bit analog-to-digital converter 3-channel internal DMA |
| Debug | J-Link interface | J-Link interface |
| Power | 24 V DC | 12 V DC |
| Sensor | − | 8 channels Support type: voltage, 0–5 V; current 4–20 mA |
| LCD | 1 channel, micro USB AB | 1 channel, SPI interface |
| Ethernet | 1 channel | − |
| Storage | 1 channel micro SD | 1 channel Micro SD |
| Zigbee Module | 2.4 GHz 802.15.4 Tx 8 dBm (boost mode) | 2.4 GHz 802.15.4 Tx 8 dBm (boost mode) |
| Zigbee Antenna | Chip antenna | Chip antenna |
| WLAN Module | − | 2.4 GHz IEEE802.11b Tx 17 dBm (Max, 11b standard) |
| WLAN Antenna | − | Chip antenna |
Table 3.
Data collected for fault detection with one faulty sensor node.
| Data | Node Identifier | ||||||||
|---|---|---|---|---|---|---|---|---|---|
| 1 | 2 | 3 | 4 | 5 | 6 | 7 | 8 | 9 | |
| 9.60 | 9.72 | 9.61 | 9.55 | 9.63 | 9.52 | 9.43 | 9.55 | 9.57 | |
| 9.96 | 9.26 | 10.66 | 9.88 | 9.26 | 9.99 | 9.61 | 9.44 | 9.36 | |
| 0.36 | 0.11 | 1.05 | 0.33 | 0.36 | 0.19 | 0.18 | 0.11 | 0.21 | |
| 0.16 | |||||||||
| 0.20 | 0.05 | 0.88 | 0.17 | 0.20 | 0.03 | 0.02 | 0.05 | 0.05 | |
Table 4.
Data collected for fault detection with four faulty sensor nodes.
| Data | Node Identifier | ||||||||
|---|---|---|---|---|---|---|---|---|---|
| 1 | 2 | 3 | 4 | 5 | 6 | 7 | 8 | 9 | |
| 9.57 | 9.52 | 9.68 | 9.63 | 9.53 | 9.41 | 9.56 | 9.52 | 9.54 | |
| 9.8 | 10.1 | 9.07 | 9.62 | 9.19 | 9.48 | 8.92 | 9.61 | 10.21 | |
| 0.23 | 0.58 | 0.61 | 0.01 | 0.34 | 0.07 | 0.64 | 0.09 | 0.67 | |
| 0.15 | |||||||||
| 0.08 | 0.43 | 0.46 | 0.14 | 0.19 | 0.08 | 0.49 | 0.06 | 0.52 | |
© 2019 by the authors. Licensee MDPI, Basel, Switzerland. This article is an open access article distributed under the terms and conditions of the Creative Commons Attribution (CC BY) license (http://creativecommons.org/licenses/by/4.0/).
Share and Cite
MDPI and ACS Style
Bae, J.; Lee, M.; Shin, C. A Data-Based Fault-Detection Model for Wireless Sensor Networks. Sustainability 2019, 11, 6171. https://0-doi-org.brum.beds.ac.uk/10.3390/su11216171
AMA Style
Bae J, Lee M, Shin C. A Data-Based Fault-Detection Model for Wireless Sensor Networks. Sustainability. 2019; 11(21):6171. https://0-doi-org.brum.beds.ac.uk/10.3390/su11216171
Chicago/Turabian StyleBae, Jangsik, Meonghun Lee, and Changsun Shin. 2019. "A Data-Based Fault-Detection Model for Wireless Sensor Networks" Sustainability 11, no. 21: 6171. https://0-doi-org.brum.beds.ac.uk/10.3390/su11216171
Note that from the first issue of 2016, this journal uses article numbers instead of page numbers. See further details here.