Article

Indicators and Assessment System for Sustainability of Municipalities: A Case Study of South Korea’s Assessment of Sustainability of Cities (ASC)

1
Department of Urban Engineering, Chungbuk National University, Cheongju 28644, Korea
2
Department of Urban & Transportation Engineering, Korea National University of Transportation, Chungju 27469, Korea
3
Urban Research Division, Korea Research Institute for Human Settlement, Sejong 30147, Korea
4
Department of Urban and Regional Development, Mokpo National University, Muan 58554, Korea
*
Author to whom correspondence should be addressed.
Sustainability 2019, 11(23), 6611; https://0-doi-org.brum.beds.ac.uk/10.3390/su11236611
Submission received: 11 October 2019 / Revised: 19 November 2019 / Accepted: 20 November 2019 / Published: 22 November 2019

Abstract

:
Sustainability assessment systems are commonly used to achieve sustainability. However, internationally agreed systems are difficult to locate. Analysis of sustainability assessment systems in various contexts can lead to creating a standardized sustainability assessment framework. Here, we reviewed the experience of the sustainability assessment system applied in Korea for sharing knowledge and providing implications for creating internationally standardized sustainability assessment frameworks. The subject of the study was the assessment of sustainability of cities (ASC, conducted annually by the Korean government) using data from the 2015 assessment and consisting of two parts: Descriptive analysis of the ASC system and analysis of the 2015 ASC assessment results. The ASC assessment unit is the low-ranked municipality, and indicators include social, economic, environmental, and institutional themes. The ASC assesses overall sustainability by incorporating mandatory and voluntary indicators, and the Korean government encourages improved sustainability through awards, diagnostic reports, and incentives. Gun was highly evaluated in social sustainability, and the southern Seoul metropolitan area and Chungcheong area were highly evaluated in economic sustainability. In environmental sustainability, metropolitan cities received high scores, while institutional theme scores were not high in any specific area. Municipalities in metropolitan cities received higher voluntary indicator scores than rural areas.

1. Introduction

1.1. Background and Purpose

Approximately 55% of the world’s population currently lives in cities, and approximately 2.5 billion people will settle in cities in the next 30 years. The proportion of the world’s urban population is expected to reach 68% by 2050 [1]. The urbanization rate has generally advanced by approximately 50%, however, with the industrialization in the 70s and 80s, many people moved to cities in Korea and the level of urbanization is currently approximately 81.5% and is expected to increase to 86.2% by 2050 [1]. However, the progress of urbanization has caused various problems, such as high house prices, traffic congestion, loss of fossil energy, environmental pollution, the cost of development and maintenance of social overhead capital, and the cost of operating education and health services [2,3,4,5].
Meanwhile, UN-Habitat II argued that new conditions are needed to achieve inclusive and people-centered sustainable development since urbanization models are not sustainable [6]. While cities function as important drivers of social and economic growth, they have been unsuccessful in dealing with emerging challenges, such as urban proliferation, congestion, air pollution, poverty, greenhouse gas emissions, or climate change. Therefore, the means to achieve urban sustainability is a very important issue in modern cities. Cities should choose the optimal tradeoff between benefits and costs induced in accumulation and should play an important role in promoting human socio-economic activities [7,8,9].
Thus, sustainability is an important value that the current generation must achieve as urbanization progresses. Bossel [10] points out that only two options are possible: Sustainability and unsustainability. The concept of sustainability began to emerge in the early 1970s and was in full swing in the 1987 Brundtland Report [11] and later in the World Summit on Sustainable Development in Rio de Janeiro, Brazil in 1992 [12]. The sustainability debate has been more specific and has been followed by the Kyoto Protocol in 1997 and the Paris Agreement in 2015.
Although specific policies can be prepared to achieve sustainability, the use of a sustainability assessment framework for sustainable development is arguably representative [12]. This is because the policy goal of sustainability becomes more concrete by establishing an evaluation system designed to achieve the goal of sustainability [13]. Over the past two decades, a variety of stakeholders, including international organizations, government organizations, non-government organizations (NGOs), local governments, businesses, and academia, have been actively discussing the sustainability assessment system [12].
However, because the concept of sustainability contains various values and is applied differently due to regional and cultural differences, it is necessary to discuss the sustainability indicator system applied in various contexts. Analysis of sustainability assessment systems in various contexts can lead to creating a standardized sustainability assessment framework. In fact, many case studies are currently being conducted on sustainability assessment indicators and assessment systems in various regions and countries [13,14,15,16].
In this context, this study critically reviewed the experience of the sustainability assessment system applied in Korea and suggests policy implications for the operation of the assessment system for sustainable development. Through this, the knowledge gained in the operation of Korea’s sustainability assessment system can be shared, with implications for creating a standardized sustainability assessment framework.

1.2. Literature Review

1.2.1. Cities and Sustainability

Sustainability or sustainable development (SD) has been discussed since the early 1970s, however, its main implementation was the Brundtland Report of the UN World Commission on Environment and Development (UN-WCED) in 1987 [11]. The term SD means development that balances the needs of current and future generations [11]. In addition, Bell and Morse [17] argued that SD should ultimately have practicality. The goal for SD to be achieved globally was subsequently declared at the Global Summit in Rio de Janeiro, Brazil in 1992 [12].
Urban sustainability can be specifically interpreted as a process of synergetic integration and interaction of economic, social, and environmental systems so that the well-being level of urban residents is not impaired [18]. Sustainability is mainly concerned with environmental sustainability in the initial debates due to the depletion of fossil fuel, environmental pollution, and global warming. However, it is insufficient to achieve sustainability only in terms of the environment, and economic and social sustainability is also important for the continued growth of civilizations. This expansion of sustainability concepts is based on the Agenda 21 Charter [19] published by the UN Commission for sustainable development and also shows similarities with Serageldin’s economic terminology of man-made, natural, social, and human capital [20]. In recent years, political or institutional elements, in addition to economic, social, and environmental factors, have often been described as four or five components [14]. In general, the social dimension is related to social fairness and equitable distribution of resources, the economic dimension is related to resource distribution and growth under economically sound principles, the environmental dimension is related to protect the environment and preserve ecosystems, and the political or institutional dimension is related to organizations achieving sustainability [13].

1.2.2. Various Approaches to Sustainability Assessment Systems

Since the concept of sustainability is abstractly defined, it is common to use a sustainability assessment framework to achieve sustainability [12]. The sustainability indicator system can consolidate the goals of sustainability-related policies as a powerful decision-making tool as well as evaluate and manage the actual status of sustainability in cities [12,13,21]. However, there are many issues in defining, selecting, measuring, and assessing or monitoring sustainability in order to develop an indicator system [6].
Nevertheless, sustainability indicators have been discussed over the past two decades in terms of the role, achievement, limitations, and uses of the indicators, led by various international organizations, research institutes, and universities [22,23]. International organizations, such as UN Development Program (UNDP), UN Environment Program (UNEP), and UN Statistics Division (UNSD), and the World Bank, Organization for Economic Cooperation and Development (OECD), and International Institute for Sustainable Development (IISD), and the International Organization for Standardization (ISO) are representative [12]. For example, the indicator system proposed by the UN Department of Economic and Social Affairs (UNDESA) consists of four dimensions: Social, economic, environmental, and institutional, and follows a widely used indicator system. Efforts to standardize evaluation indicators can be found in some of the ISO standards. The ISO standard for assessing sustainability at the city level is “ISO 37120 Indicators for city services and quality of life” [24]. This standard was meant to address the problem that existing indicator systems at the local level were often not standardized. Since then, the ISO standards have evolved over time into the “ISO 37122 Indicators for Smart Cities” [25] and “ISO 37123 Indicators for Resilient Cities” [26] standards. In addition to international organizations, individual countries employ various sustainability evaluation systems at the building, neighborhood, and urban scales. For example, in the United States, LEED-ND (Leadership in Energy and Environmental Design for Neighborhood Development), LEED for Cities and Communities, Star Community Assessment, which merged with LEED for Cities and Communities, were developed. In Japan, CASBEE for Urban Development and CASBEE for Cities are applied to such assessments, while South Korea uses the assessment of sustainability of cities (ASC). In cases of the United States and Japan, the evaluation systems started with building-scale LEED and CASBEE assessments, respectively, and the spatial scope of these assessment systems was extended to the neighborhood and urban scales [27]. In particular, the LEED-ND system was collaboratively developed by the United States Green Building Council, the Congress for the New Urbanism, and the Natural Resources Defense Council [28]. The subsequent LEED for Cities and Communities framework provides a globally consistent way to measure and communicate the performance of social, economic, and environmental conditions on a city-wide or community level [29].
The international organizations’ approaches are to standardize sustainability indicators at the local level, while the examples in the United States and Japan are project-based assessments that begin at the building level and extend to the neighborhood and urban scales. For example, in LEED-ND and LEED for Cities and Communities, sustainability is assessed during the project planning stage and progress stage, and post evaluation is performed only for projects that are used regularly by people and have a managing entity and reasonable boundaries. On the other hand, the ASC system in South Korea differs from international assessment systems in the following characteristics. The Ministry of Land, Infrastructure, and Transport (MOLIT) established this evaluation system and monitors sustainability after receiving applications from municipalities. This means that in South Korea, the same assessment system can be used to evaluate the sustainability of each municipality over time and space. This is in the same context as the approach of standardization of indicators of international organizations. On the other hand, municipality-based assessments rather than project-based assessments, as in the cases of the United States and Japan, can be used to assess sustainability with various socio-economic indicators as well as the physical environment. In addition, annual sustainability is evaluated in order to award well-performing municipalities and provide incentives, which induces the favorable policies of one municipality to spread naturally to other municipalities. As interest in sustainability grows, studies have been conducted under the subject of theoretical frameworks for indicator systems [11,12], methods for selecting sustainability indicators [30], and development of indicator system methodologies [6,13,14,15]. Sustainability indicators research tends to systematically and appropriately select sustainability indicators, apply them to regional units at various scales, assess current sustainability levels, and provide implications [31].

1.2.3. Issues Related to Sustainability Assessment Systems

There have been criticisms that the sustainability assessment system is applied to various spatial and temporal units based on various frameworks in various institutions [16] and that it measures complex social and natural phenomena through limited indicators [31]. In addition, the system has not been transformed into a decision-making process towards sustainable development [15,23,32]. Therefore, examination of the issues in terms of the unit of analysis, the characteristics, and type of indicators, standardization of indicators, data availability, indicator system development methods, and participants in relation to the sustainability indicator system, are needed.
(1) Units of analysis of the indicator system: Space and time dimensions
Discussions regarding the effective and approximate spatial units of the sustainability assessment indicator system have not converged. The spatial units of Sustainability Indicator (SI) frameworks differ from building level to regional level. SI studies initially made assessments at the building level (e.g., LEED) and then expanded to a neighborhood or city level [6]. Mascarenhas et al. [33] claimed that the goal of sustainability can be effectively achieved at the local scale but can be relatively difficult at the regional scale. However, some studies [33,34,35] emphasize that regions play important roles in planning, cooperation, and monitoring of sustainability policies because regional organizations can manage their resources more effectively through wide territorial cooperation at the regional scale. On the other hand, since most indicator systems measure status at a particular time frame in accordance with a performance-oriented approach, it is not possible to capture dynamic and constantly changing attributes [6]. This results in an assessment of absolute performance under particular circumstances, rather than an ongoing assessment of sustainability.
(2) Characteristics and type of indicators
In selecting and applying indicators, it is necessary to consider the indicator characteristics. In terms of the characteristics of indicators regarding the scale, variation, and framework, indicators should be appropriate to the meaning to be evaluated and appropriate measures should be developed. For example, the indicator should be appropriately selected whether it is qualitative or quantitative, or whether it is nominal, proportion, sequence, or interval. This is because it is difficult to interpret the status based on the measured values without understanding the indicator scale.
On the other hand, existing SIs have recently been composed of fixed sets of indicators that are not flexible [6]. Since the real world is constantly changing and the context in which cities are located also changes, it is difficult to assess sustainability with a fixed indicator system. It is, therefore, argued that flexible indicator sets should be constructed to reflect changing and time-evolving public interests [6]. There is a study as an alternative to constructing a set of SIs by dividing them into key indicators and flexible indicators [6].
Indicator frameworks are useful to handle problems related to selecting, developing, and interpreting indicators. Indicator frameworks are a conceptual structure based on sustainability principles [12]. By using an indicator framework, we can discover differences in the understanding of available data, indicator sets, and the overall human and environmental system. There are generally five main frameworks of indicator sets: Pressure-state-response (PSR) frameworks, theme-based frameworks, capital-based frameworks, integrated accounting frameworks, and Bossel’s orientor frameworks [12].
The PSRs and the theme-based frameworks are mainly used for indicator frameworks of sustainability. The PSR is the most popular indicator framework [36], and various versions of the PSR framework have already been discussed. The indicator is divided into pressure/driving force, state, and response in the PSR. Since this framework is created through causality between indicators, it is effective for evaluating policy effects.
Theme-based frameworks, on the other hand, have a flexible conceptual structure and are a way of organizing indicators according to key issues or themes related to policies [12,37]. When constructing sustainable development policies in social, environmental, economic, and institutional dimensions, this framework is one of the ways to construct indicator sets by selecting sub-themes at each level. Due to this characteristic, this is more policy-oriented than the PSR framework [12].
(3) Standardization of indicators
The issue of the standardization of indicators is related to whether the sustainability indicator sets can be applied internationally or not. The UN has played an active role in this standardization, and the Global Urban Observatory has developed capacities for countries that evaluate and compare urban indicators and evaluate urban policies [38]. For instance, the Rio+20 conference made a clear position in this debate and proposed the Global Sustainable Development Report [39]. This report proposed an integrated evaluation system by sectors. Nevertheless, Pinter et al. [40] insisted that the diversity of SD indicators has increased, and that there has been no convergence on methodologies and no general agreement on standardized options or conceptual frameworks for measuring SD [41]. The indicators sets generally did not converge because the majority of standardized indicators for sustainability were proposed by non-governmental institutions (such as universities, national research institutes, non-profit institutions) [42].
(4) Data availability
Attention should be paid to data availability in sustainability assessment systems, as it is illogical if appropriate data are not provided for each indicator. Therefore, it is considered whether the selected indicators can be easily measured, estimated, or interpreted from the available data [6]. This is also an issue with the ease of access and quality of the data, and relates to the cost-effectiveness of collecting, preprocessing data, and finally obtaining metrics, and whether it can be easily updated.
(5) Indicator system methodology and citizen participants
Approaches to developing a sustainability assessment framework are divided into top-down and bottom-up processes [43]. The top-down approach is to develop the overall structure for achieving sustainability by the experts. The evaluation system is mainly based on expert knowledge. On the contrary, the bottom-up approach is to establish an evaluation system through citizen-led participation with various stakeholders, understanding the various frameworks and sustainability evaluation system. It can provide a basis for identifying local specific problems. However, the integration of science and policy-making and stakeholder engagement have blurred the gap between the two approaches [44].

2. Materials and Methods

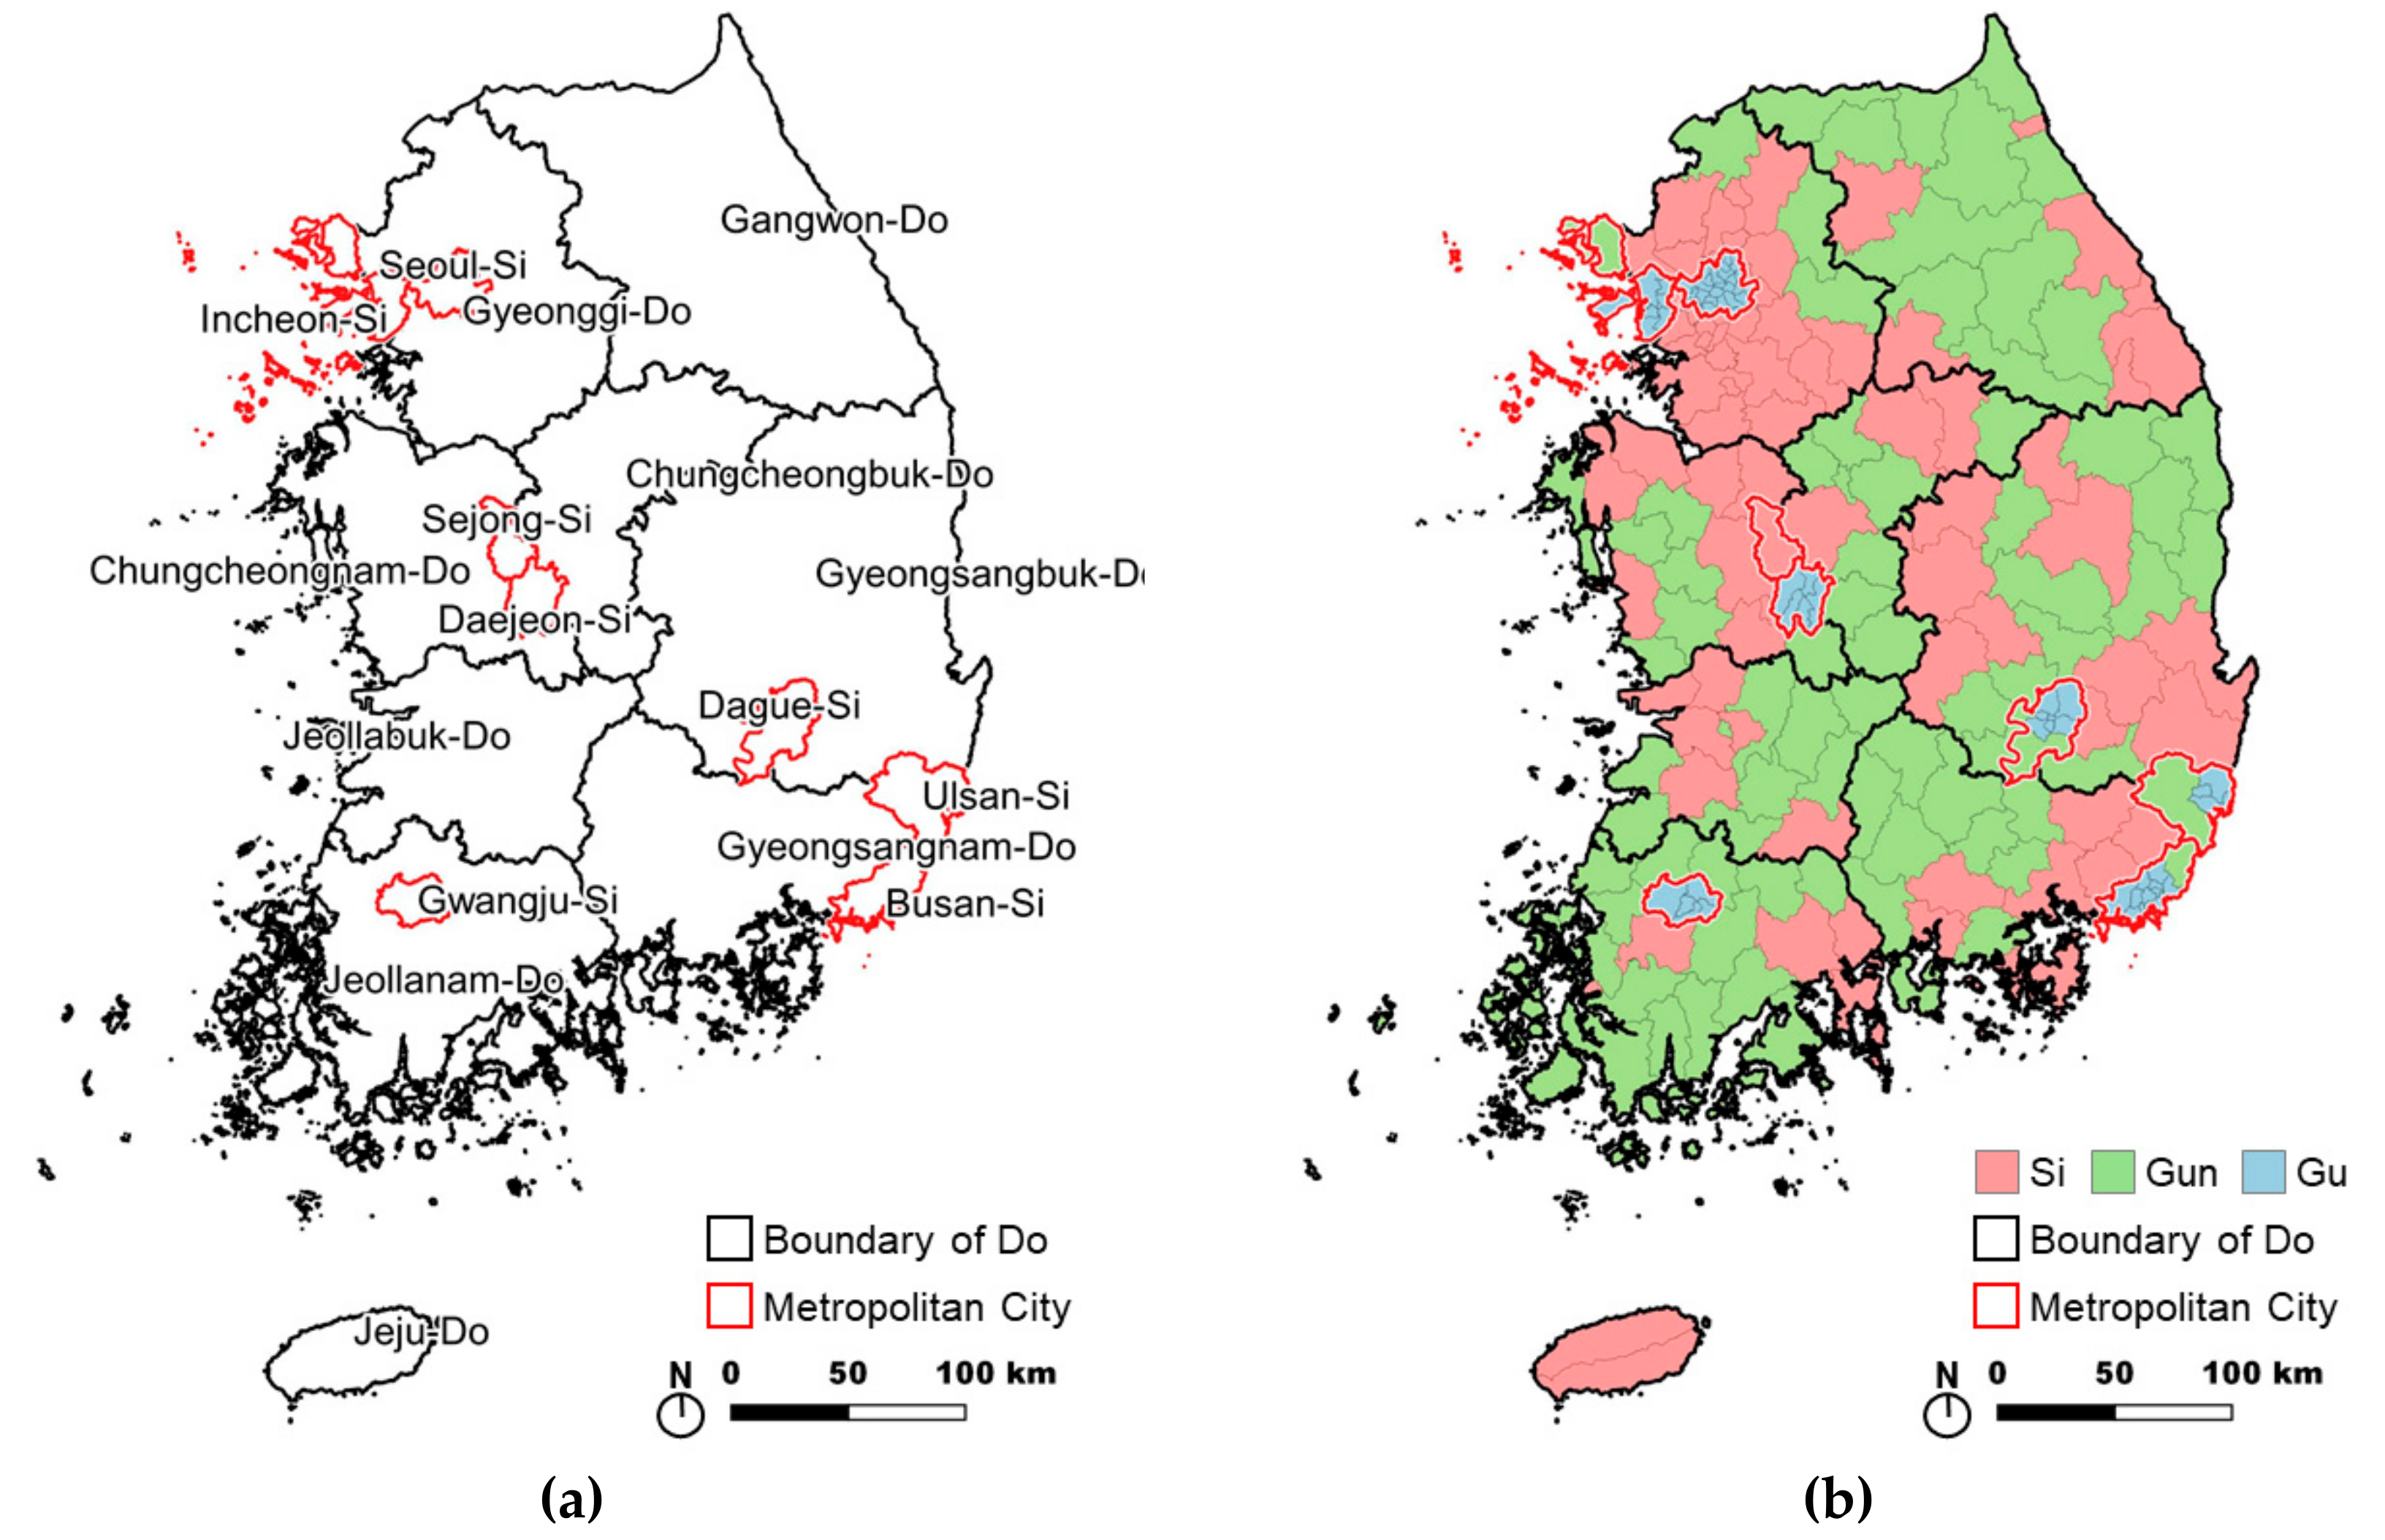
2.1. Scope of Research

The subject of this study was the “Assessment of Sustainability of Cities (ASC)” according to Article 3-2 of the National Land Planning and Utilization Act in Korea [45]. The ASC was integrated with the Korean Sustainable Cities Award in 2015. The analysis target of this study was the 2015 ASC, and hence, the time frame of the study was 2015. The spatial scope of the study was South Korea, and the unit of analysis was the low-ranked municipality (SI-GUN-GU).

2.2. Data Source

As mentioned above, the subject of this study was the ASC, which is being implemented in Korea. The authors were responsible for the integration and assessment process of the ASC in 2015 and remain involved in the ASC assessment process. Analysis data were collected during the ASC process in 2015. Although some changes or additions have been made since 2015, most indicators and the frameworks of the assessments implemented in 2015 are maintained to date. In other words, the 2015 ASC can explain Korea’s ASC system well.

2.3. Methods

The contents of this study were largely divided into two categories: Descriptive analysis of the ASC system, and analysis of the 2015 ASC assessment results. The ASC analysis was divided into assessment targets, indicators, assessment process, and use of assessment results through descriptive analysis, and the introduction and implications of the ASC system are presented. Analysis of the 2015 ASC assessment results was divided into basic indicators and voluntary indicators. The assessment results of the indicators were compared by the types of municipalities with various characteristics. Through this, implications for developing appropriate assessment units and standardized indicators were drawn.

3. Assessment System for Sustainability of Municipalities in Korea

3.1. Background and Purpose of the Assessment of Sustainability of Cities (ASC)

South Korea had a centralized planning system prior to 1995. The central government appointed mayors and county heads and managed urban planning throughout the whole country. In 1995, the local autonomy system began with the election of the head of the local government and local council members. Since then, the central government’s urban planning authority has been continuously transferred to the local governments. By 2009, the majority of the authority regarding urban planning had been transferred to local government [46]. Through this, the autonomy of local government has increased, and it is possible to establish a plan suitable for local conditions.
However, the transfer of authority to local governments has made it difficult to achieve national policy goals at the local level. Accordingly, the need for a system to induce the local government to implement the central government’s policy goals was raised [47]. Under these circumstances, the ASC was introduced in 2009 by the revision of the National Land Planning and Utilization Act. In 2014, a detailed assessment method was developed, and the ASC was implemented for the first time.
Even prior to the introduction of the ASC, there were assessment systems related to sustainability in Korea, such as national territory planning assessment (NTPA), strategic environmental impact assessment (SEIA), and environmental impact assessment (EIA). These are mainly related to environmental sustainability. The NTPA and SEIA are targeted at individual plans, and the EIA is targeted at individual projects. The main difference between the ASC and these assessments is that the subjects and units of assessment are municipalities. This is because the main purpose of the ASC is to guide local government’s policies towards improving sustainability [47].
Apart from the ASC, the Ministry of Land, Infrastructure, and Transport (MOLIT) has been operating the Korean Sustainable Cities Award (KSCA) since 2000. This award was introduced to encourage the promotion of sustainability by awarding excellent local governments and to disseminate excellent cases to other local governments [48]. Since the KSCA and the ASC have similar objectives, the MOLIT has integrated these two assessments since 2015. This study analyzed this integrated ASC.

3.2. Construction of the Assessment System

3.2.1. Target and Unit of Assessment

The ASC uses Korea’s low-ranked municipalities as units of assessment, and unlike its name, includes all municipalities that are not cities. Korea’s municipalities consist of two stages: High-ranked municipalities and low-ranked municipalities. Figure 1 Shows Korea’s municipalities. High-ranked municipalities are divided into Si (Metropolitan Cities) and Do (Province), which are a combination of urban and rural areas. Low-ranked municipalities are divided into Si (municipal cities), Gun (counties), and Gu (metropolitan city wards). Thus, when the central government has decided on a major policy direction, it is the low-ranked municipalities that actually implement and achieve it.
Sejong-Si is classified as a high-ranked municipality, however, it was included in the analysis because there was no underlying low-ranked municipality. The two Si in Jeju-Do do not elect the mayor by election. However, they were included in the assessment because they function as low-ranked municipalities. In summary, the ASC targets 229 municipalities in Korea for assessment. Among them, there are 78 Si, 82 Gun, and 69 Gu.
Si, Gun, and Gu have the same administrative hierarchy, however, their characteristics are very different. Gu is part of a metropolitan city and is mostly composed of urbanized areas. It is administratively independent but functionally a part of a large city. Si means city by name but includes both urbanized and undeveloped rural areas. Therefore, it has both urban and rural characteristics. Gun is less populated than Si, and the proportion of urbanized areas is generally low. In the process of building the ASC system, there were discussions on whether Si, Gun, and Gu should be separated and constructed as separate indicators to reflect these differences. However, the integrated assessment was decided in terms of assessing municipalities of the same hierarchy [49].

3.2.2. Construction of the Indicator System

The ASC has a theme-based indicator framework, which is more flexible than other frameworks and has the advantage of defining themes according to policy goals [12,37]. The ASC used four themes (social, economic, environmental, and institutional) presented by the UN [50]. Based on these four themes, sub-themes were selected according to the policy goal and the indicators for evaluating them were constructed.
The main characteristic of ACS indicators is that they are divided into basic indicators and voluntary indicators. All municipalities are obliged to submit basic indicators whereas municipalities can choose whether to submit voluntary indicators. This is due to the prediction that if all indicators are mandated, the workload of local governments will be excessive, and it will be difficult to build proper data. The majority of basic indicators are quantitative indicators and are composed of indicators that are relatively easy to build because of existing data. Voluntary indicators consist of both quantitative indicators and qualitative indicators. Since there is no existing data, the local government must collect and submit the data directly. Only municipalities submitting voluntary indicators can be eligible for awards and incentives, and municipalities wishing to do so will submit voluntary indicators. One of the main purposes of the ASC is to discover and disseminate excellent policies to enhance sustainability. Therefore, voluntary indicators also include indicators that carry out a qualitative assessment of policy contents. Therefore, the formation and operation of a pool of experts to assess policy contents is also an important part of the ACS system.
The composition of the indicators is shown in Table 1 and whole indicators are included in the Appendix A. All themes and sub-themes consist of basic indicators and voluntary indicators. Themes and sub-themes have remained unchanged from 2015 until 2019.
The social theme consists of sub-themes of “safety and security (SO-1)”, “social welfare (SO-2)” and “culture and leisure (SO-3)”. The SO-1 subtheme includes indicators related to disasters and safety. SO-2 consists of indicators that can confirm the level of social welfare facilities of local governments (such as education and welfare), and SO-3 is composed of indicators that can identify the level of culture and leisure facilities in the region.
The sub-themes that make up the economic theme are population (EC-1) and economy (EC-2). Currently, Korean municipalities are facing a decreasing population. Maintaining a certain population and economic size is a key factor for the economic sustainability of local governments. The EC-1 subtheme consists of indicators that can identify population growth and population structure. EC-2 consists of indicators that can identify the economic status of the region and the financial level of local governments. All voluntary indicators of economic themes consist of indicators to identify valuable policies and programs.
The environmental theme consists of indicators to measure the housing condition (EV-1), environmental protection (EV-2), and traffic service levels (EV-3). The environmental theme does not include indicators for measuring specific ecological environment levels because ecological environments are managed in other assessment systems such as EIA and SEIA described above. The majority of voluntary indicators are to discover valuable policies and programs.
The institutional theme is composed of indicators for evaluating the local government’s planning capacity (IN-2) and resident participation (IN-3). In addition, indicators are included to evaluate land-use control (IN-1) which is a major issue in Korea’s urban planning field. The IN-1 indicators are mainly related to compact land use.
The ACS allocates different points for each indicator. Basically, the higher the central government’s commitment, the higher the points. This encourages local governments to actively improve indicators of high government commitment. However, the points for each indicator were allotted only by policy considerations, without academic considerations. Therefore, we did not consider the allotted point differences of the indicators in this study.

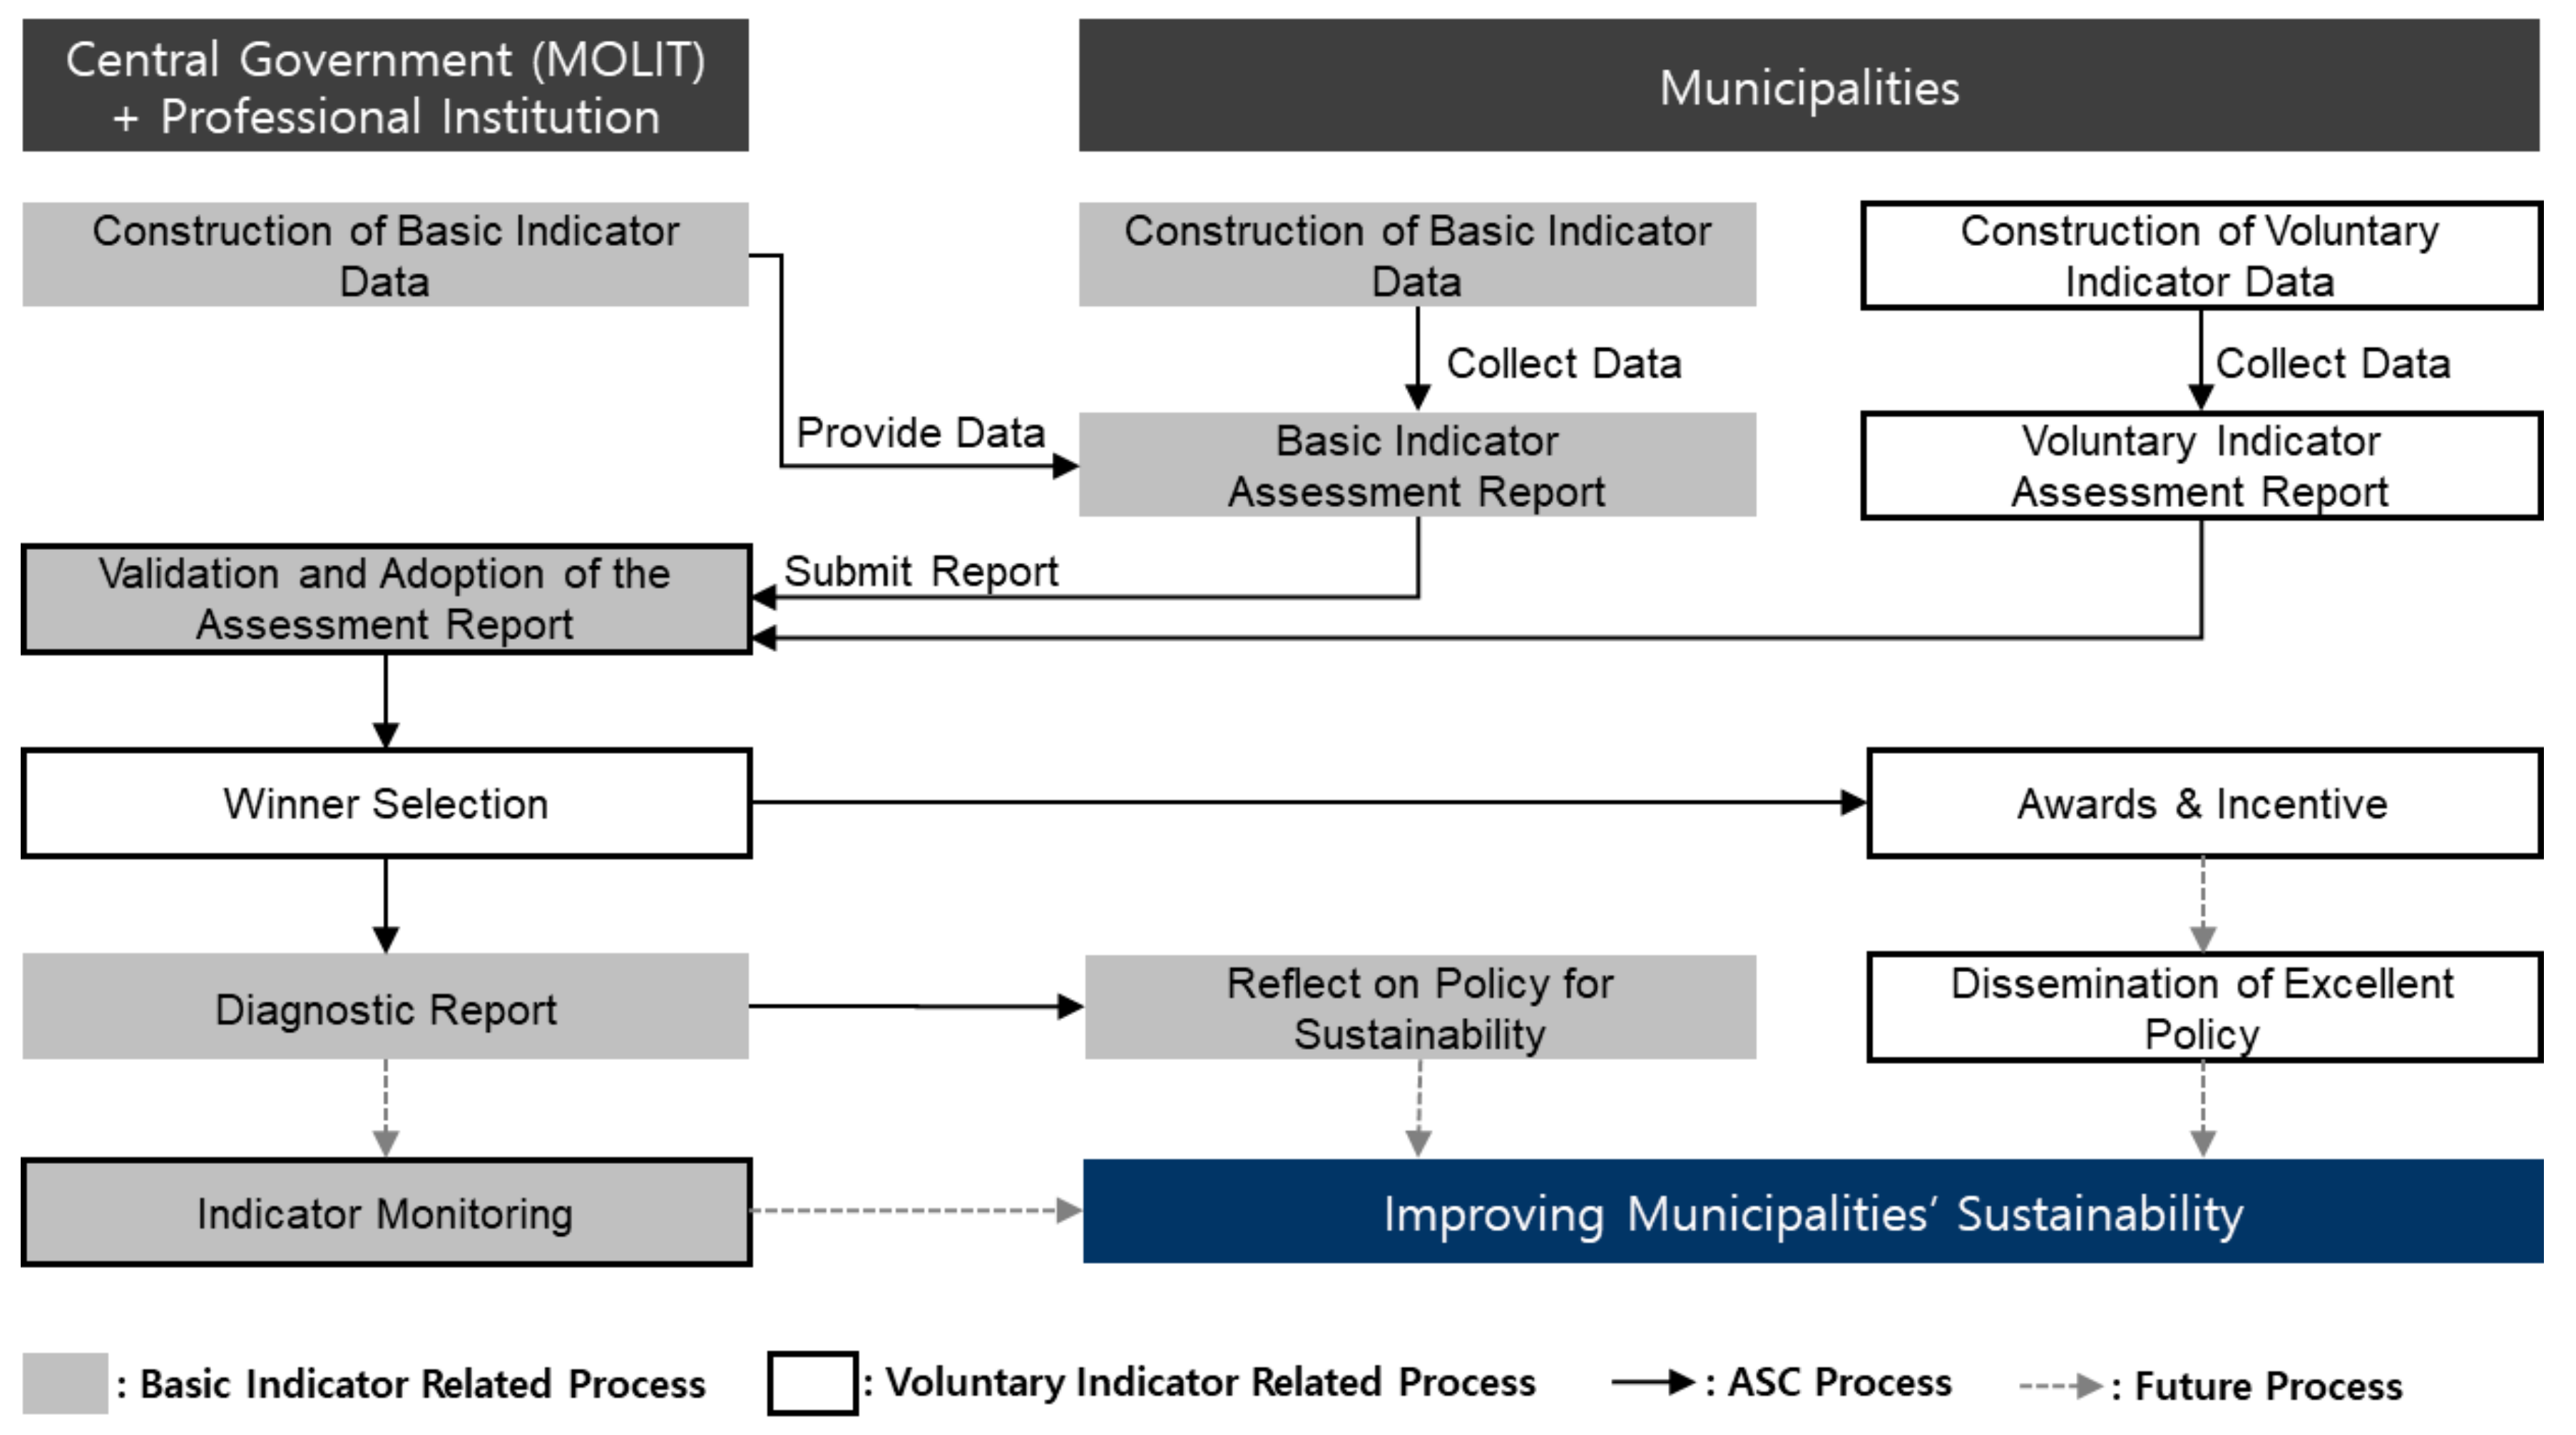
3.2.3. Assessment Process

The ASC is basically a process in which municipalities prepare and submit assessment reports for assessment by the central government. Following the assessment, the central government provides awards, incentives, and diagnostic reports to municipalities. Through this process, the ASC aims to improve municipalities’ long-term sustainability.
The ASC procedure is shown in Figure 2, in which the gray box is the process related to the basic indicator, and the black lined box is the process related to the voluntary indicator. Gray boxes with a black outline are processes that involve both indicator types. The solid arrows represent the process in the actual ASC. An important consideration in the ASC is reducing the administrative workload of local governments. Therefore, the MOLIT prepares a substantial portion of the basic indicators and provides them to local governments. After verifying this, municipalities submit the assessment report of basic indicators. In addition, municipalities wishing to receive awards or incentives must complete and submit an assessment report of voluntary indicators. The MOLIT collects the assessment reports and, if necessary, visits some local governments to assess the evidence and detailed contents of the data. Subsequently, MOLIT selects and awards the winners and provides incentives. In addition, it provides a diagnostic report on the basic indicators to encourage local governments to improve their sustainability. In all these processes, there is a limit to MOLIT’s direct management of this ASC process. Therefore, the MOLIT entrusts the ASC to professional institutions such as academic institutions and research institutions.

3.2.4. Use of Assessment Results

As mentioned above, the purpose of the ASC is to induce local governments to realize the central government’s goal of enhancing sustainability. Therefore, the MOLIT prepared a plan to utilize the assessment results in addition to monitoring. First, a diagnosis report is provided for each municipality. The MOLIT sends diagnostic reports to all municipalities according to the assessment results. The diagnostic report provides indicator values, standardized scores, and grades of the basic indicators. In addition, theme-specific diagnostic opinions and general opinions are proposed. Through this, municipalities can determine their current situation compared to other municipalities and identify the areas requiring the most effort.
The second step is to present an award. Municipalities submitting voluntary indicators can receive awards based on the assessment results. The ASC has considerable authority because it is a legal assessment by law. The award-winning municipality is therefore considered to receive a great honor, and in particular, the head of the municipality can use it as a political achievement. Therefore, efforts to improve the indicators will be made in pursuit of the award.
The third step is to provide incentives. As of 2019, the average low-ranked municipalities’ financial independence rate was 26.2% [51]. Therefore, most municipalities make great efforts to secure the central government’s financial support projects. The Enforcement Decree allows the MOLIT to provide incentives based on the ASC’s assessment results in the evaluation process of the financial support project. Therefore, local governments will make efforts to improve sustainability items in order to receive this incentive.

4. Assessment Results of the 2015 ASC

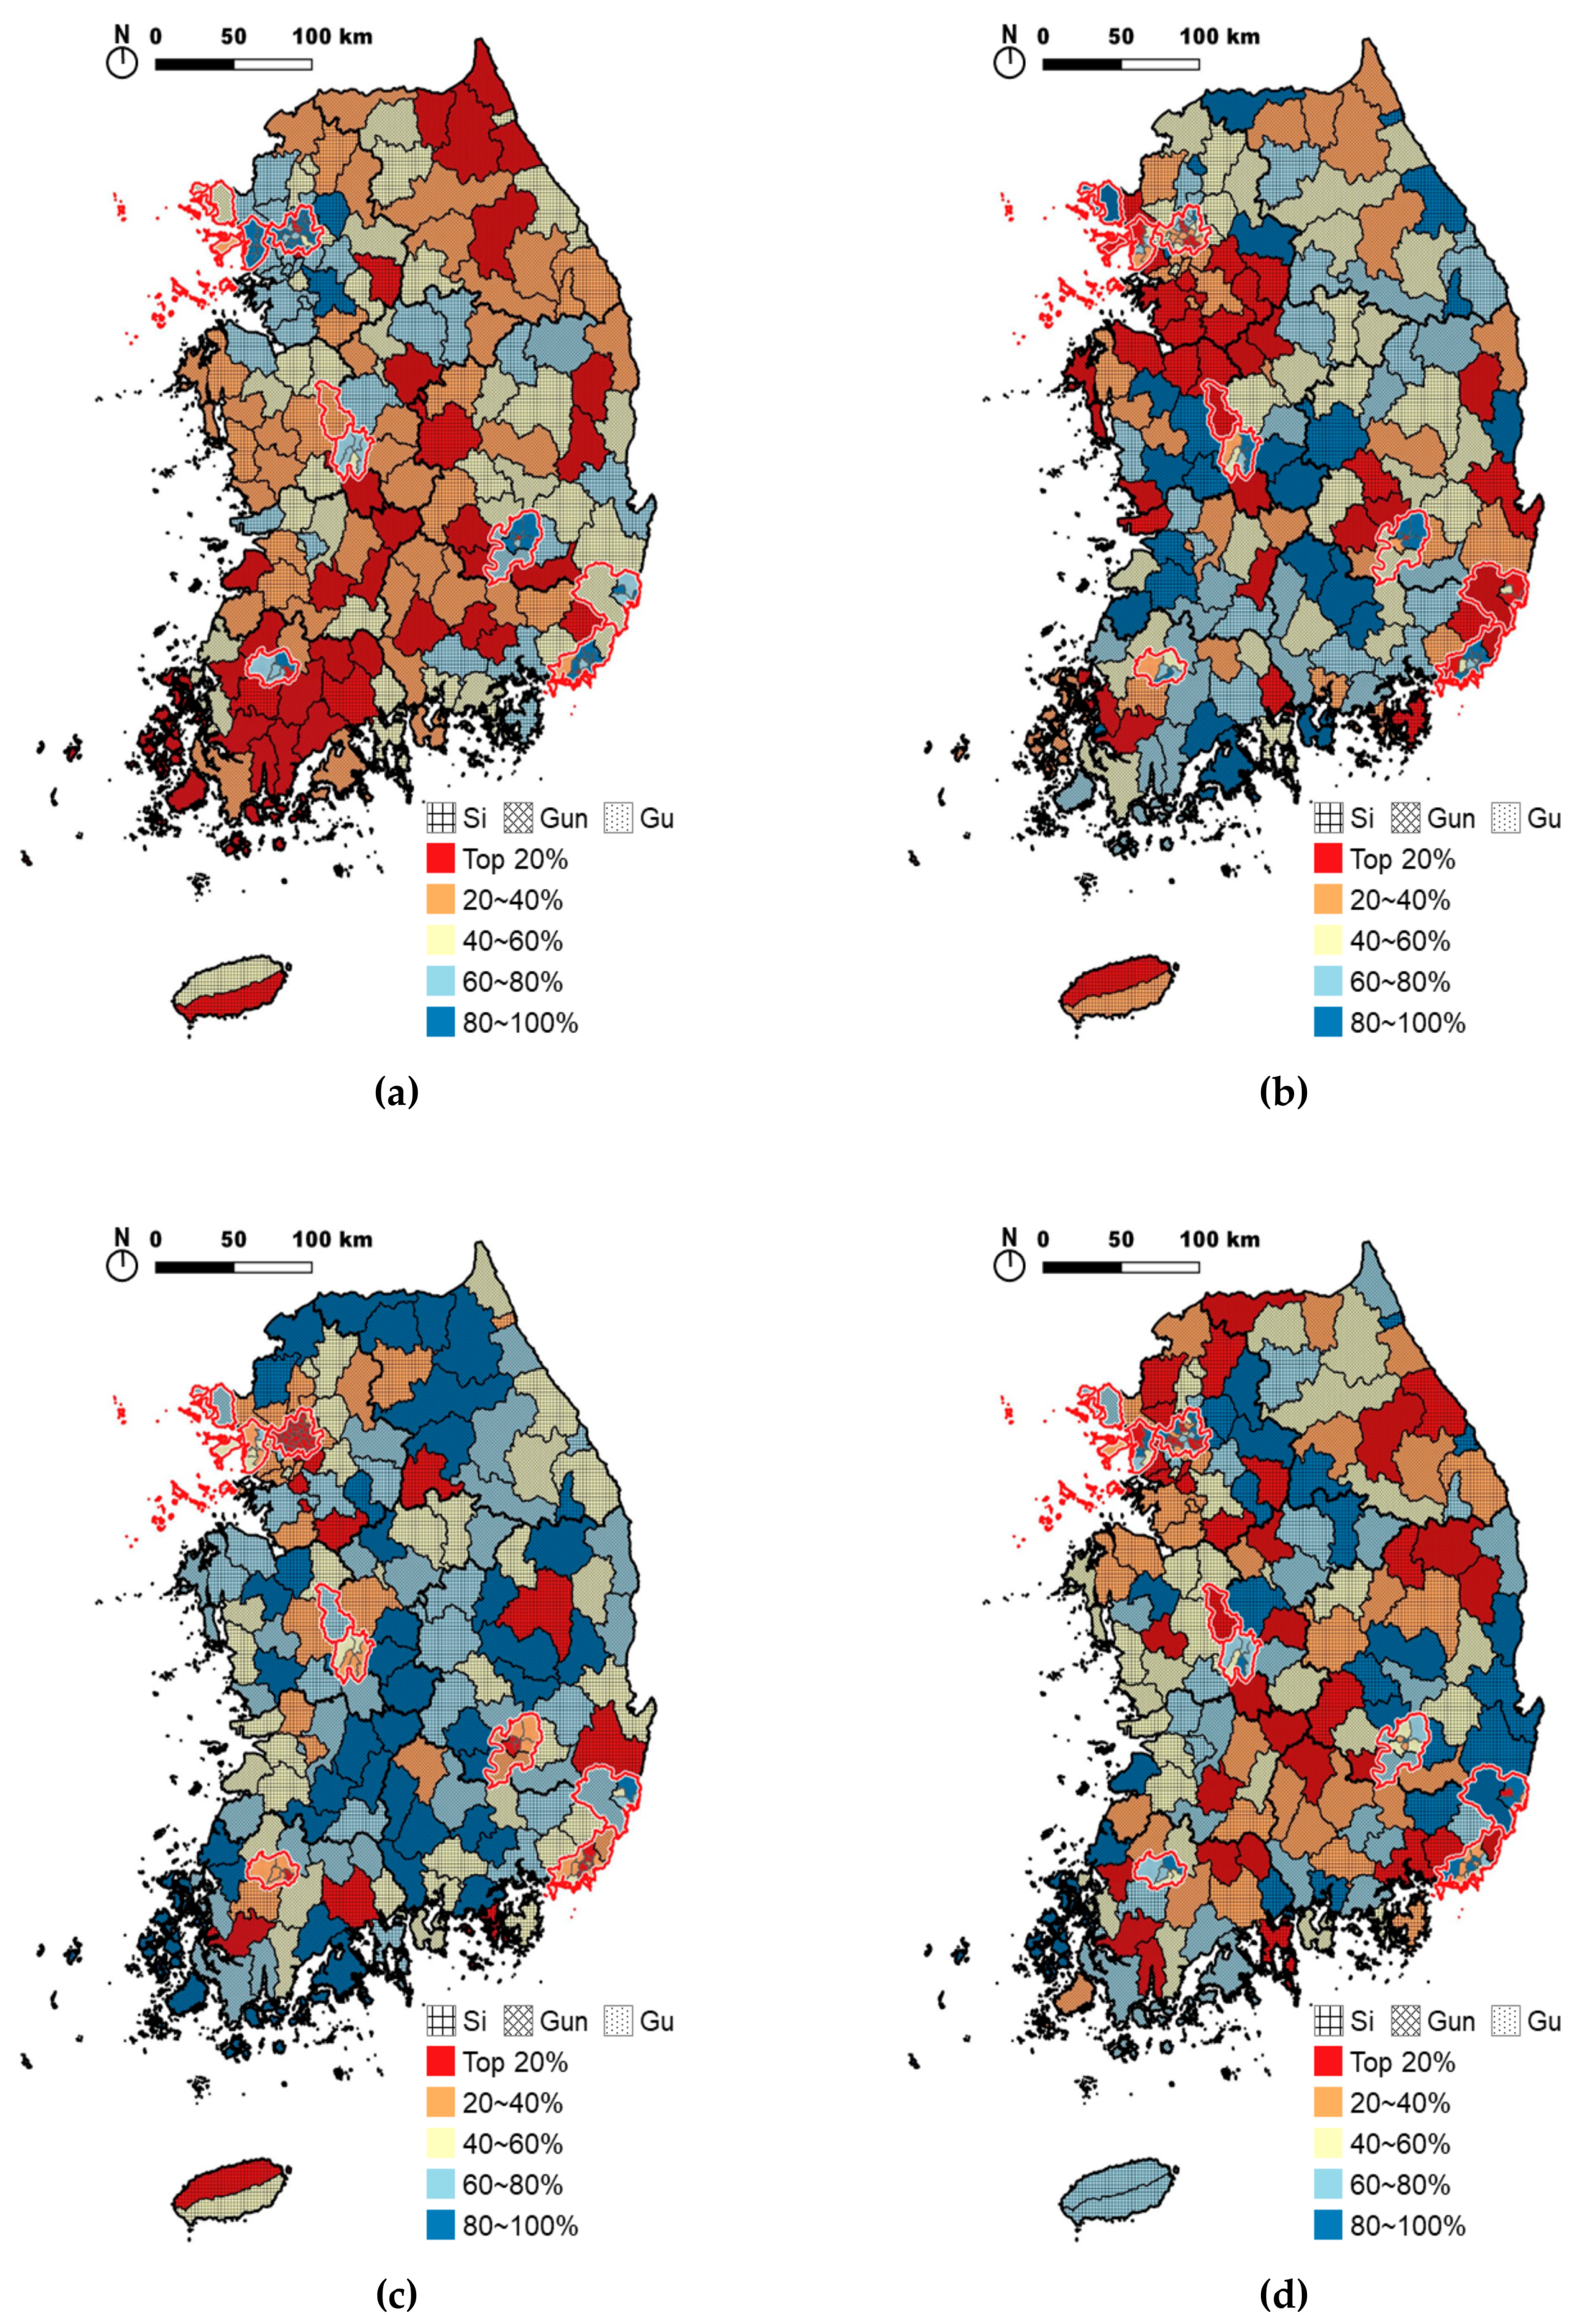
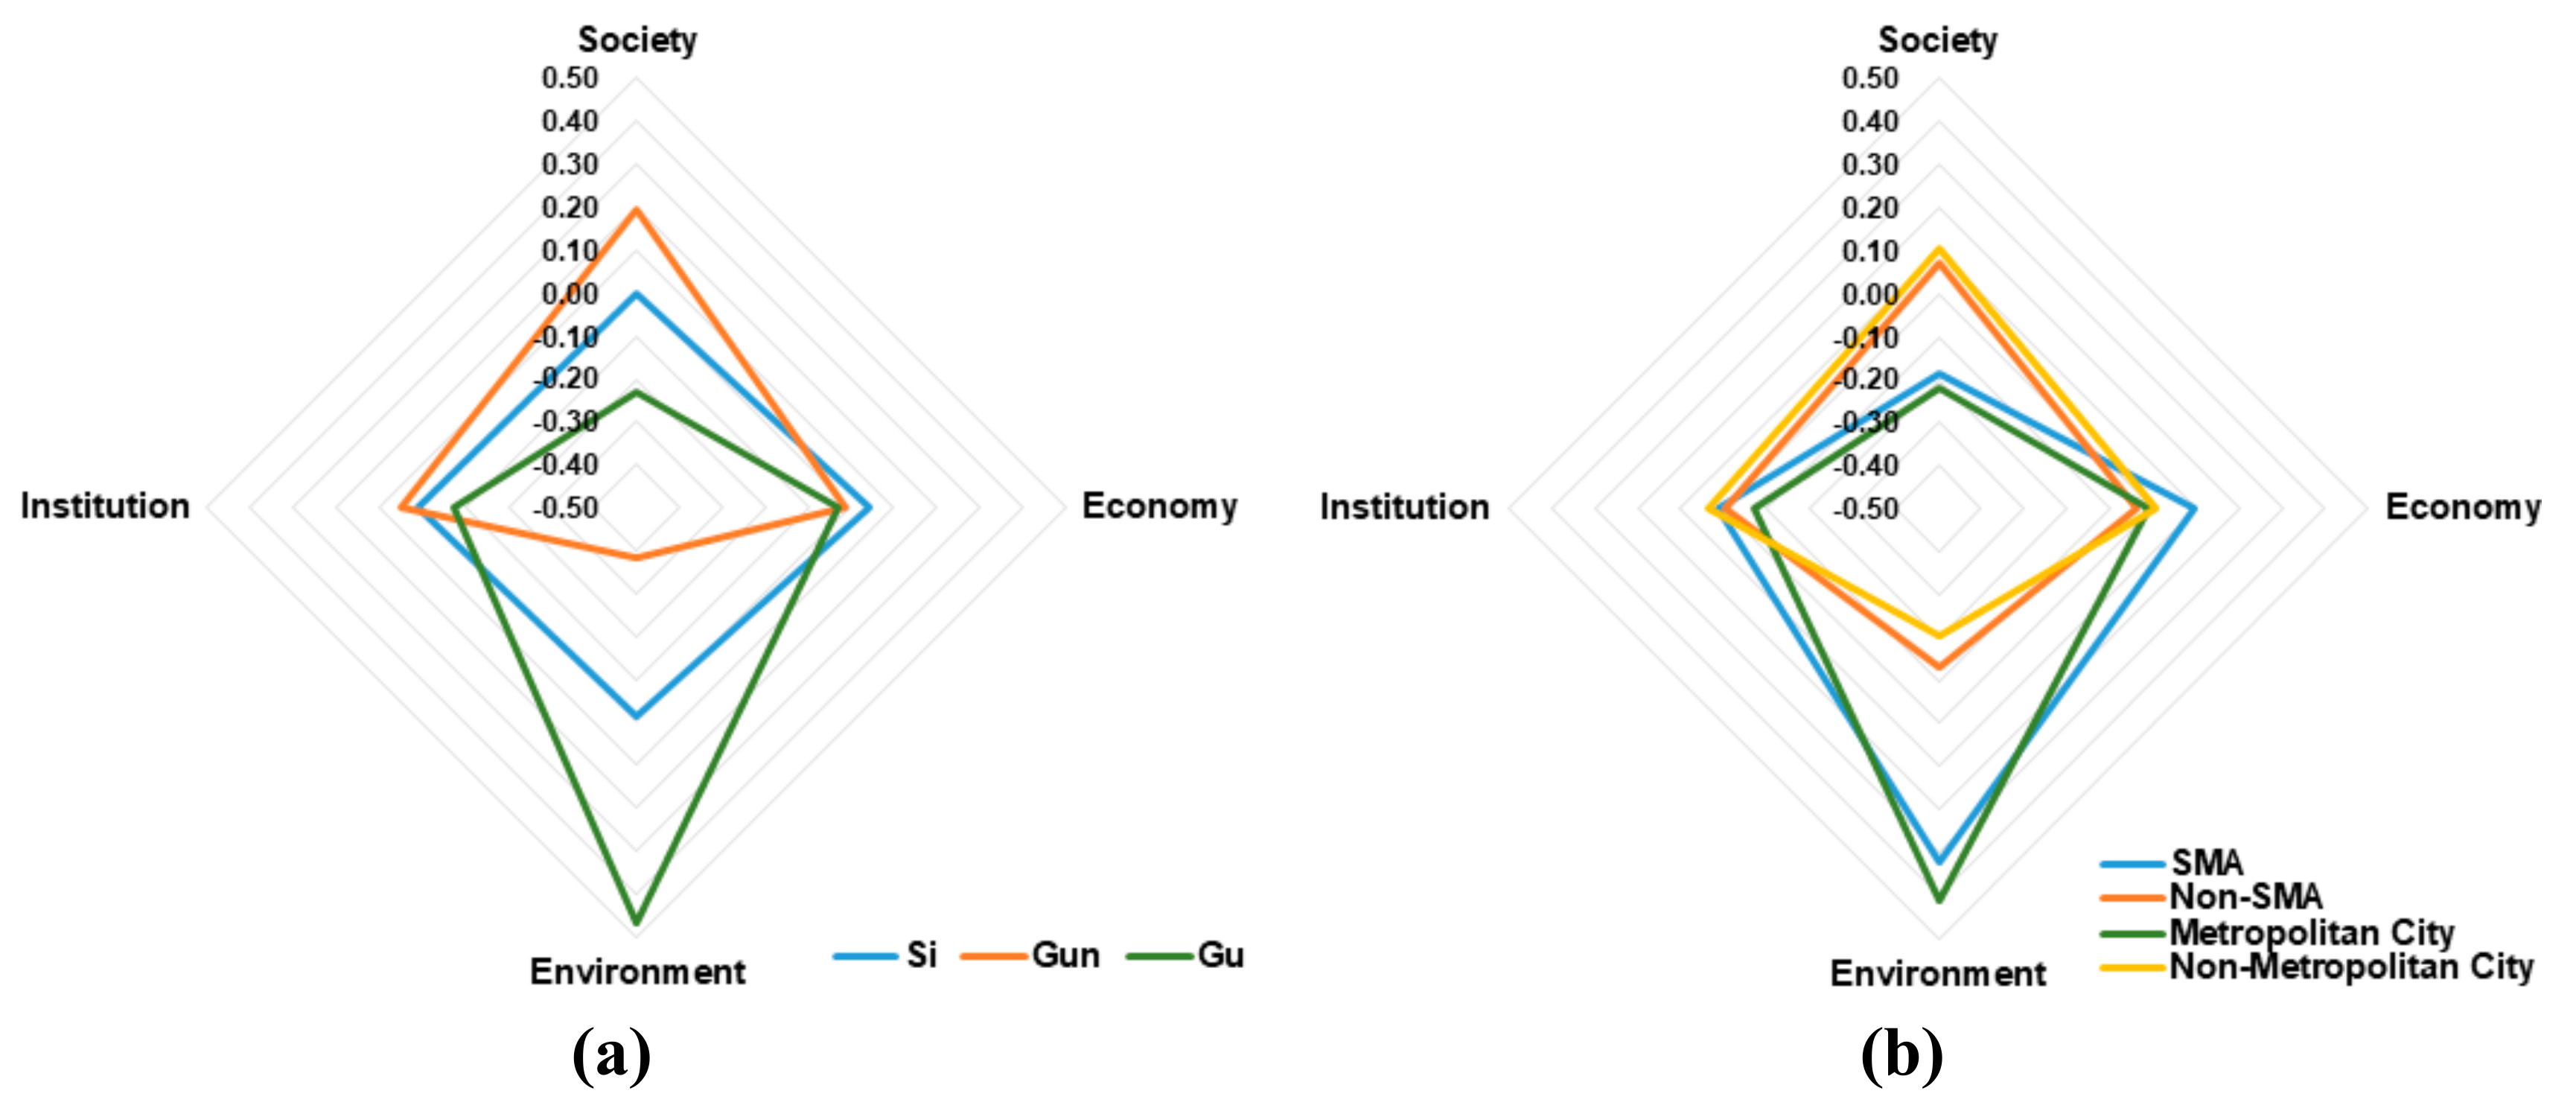
4.1. Analysis Results of Basic Indicators

To understand the relative level of municipalities and to make intensive efforts in areas where they are insufficient compared to other municipalities, the ASC conducts relative evaluations [52]. In addition, the indicators differ in units and deviations. Therefore, all indicators are converted to standardized Z-scores for analysis.
Figure 3 shows the mean Z-score of four themes divided into five classes. In the social theme, Gun that are generally known to be underdeveloped are generally highly valued because many of the social theme indicators have the form of indicators per capita. In other words, it is not because the indicator value is large but rather because the population is small.
On the other hand, most municipalities that were highly evaluated on the economic theme are concentrated in metropolitan cities, the southern part of the Seoul metropolitan area (SMA), and the northern part of the Chungcheong area. These are regions where industrial facilities have recently increased, and as a result, population and economic levels have also increased. Regions rated high on society themes received low ratings on most economic themes.
In terms of the environmental theme, municipalities in the metropolitan area received high scores. The environment theme of the ASC includes a number of indicators for evaluating the level of the residential environment and the level of public transportation, rather than the ecological environment level. In particular, the scores of large cities are high due to a large number of indicators related to transport service levels.
Compared to other themes, the institutional theme did not show regional concentration. In addition to the metropolitan areas, there are also excellent municipalities in the local small cities, which appear to be evenly distributed throughout the country.
This phenomenon can be seen more clearly in Figure 4. Figure 4a shows the mean scores of four themes in the Si, Gun, and Gu. In the figure, Si shows similar scores in four themes. Gun appears similar to Si in economic and institutional themes, but the social theme has the highest score, and the environmental theme has the lowest score. Gu in large cities have very high scores on environment theme, while those on social, economic, and institutional theme scores are lower than Si and Gun. This trend is similar in Figure 4b. The SMA and metropolitan cities show similarly high scores in the environmental theme, while the non-SMA areas and non-metropolitan areas show similarly high scores in the social theme.

4.2. Comprehensive Analysis Results Including Voluntary Indicators

A total of 87 municipalities (i.e., approximately 38% of the total 229 municipalities) submitted voluntary indicators. Figure 5 compares the scores of the total 229 municipalities with those of the 87 municipalities that submitted the voluntary indicators. As shown in Figure 5, the overall score distribution of the total 229 municipalities and the 87 voluntary municipalities was similar. However, in the case of the Gun, the score of the voluntary municipality was higher than voluntary municipalities in the environmental theme. Except for this, voluntary municipalities did not show a large difference from the total municipalities.
Figure 6 shows the basic indicator scores, voluntary indicator scores, and the total scores of 87 voluntary municipalities. As mentioned earlier, the voluntary indicator contains a number of indicators that qualitatively evaluate the superiority of policies rather than the quantitative situation of municipalities. Therefore, it was expected that municipalities with poor scores on basic indicators (which require a lot of time and money for improvement) would receive good scores through voluntary indicators. However, the result was not as expected.
According to the evaluation results of the Si, the basic indicators and the voluntary indicators generally showed similar values. However, in the environmental theme, the scores of voluntary indicators were higher than for basic indicators. Therefore, the composite score was also high.
According to the Gun assessment results, the voluntary indicator scores were lower than the scores of the basic indicator, and the total score was lower than the score of the basic indicator. Because the Gun generally has poor financial conditions compared to the Si and Gu, in the process of creating ASC indicators, they were expected to score higher on voluntary indicators than on basic indicators. However, the voluntary indicators lowered the total score.
Rather, Si and Gu have increased their total scores through voluntary indicators. Si is raising the total score through voluntary indicators in the environmental theme, and Gu is raising the total score through voluntary indicators in social and environmental themes. In other words, municipalities in large cities (which have better economic conditions) are raising their total scores through voluntary indicators more so than municipalities in rural areas.
Figure 7 reports the scores of municipalities in the SMA and non-SMA, with some expected results. Municipalities in SMA generally had lower scores on voluntary indicators than on basic indicators. On the other hand, municipalities in non-SMA had similar or higher scores on voluntary indicators than on basic indicators. It can be judged that the voluntary indicators partially alleviate the gap between the basic indicator scores of SMA and non-SMA municipalities.

5. Discussion

5.1. How Can We Induce Active Participation of Municipalities?

One of the main reasons for the introduction of the ACS is to induce policies of municipalities in the policy direction set by the central government in the face of the reduced influence of the central government on municipalities. As the influence of the central government has diminished, there are limits to forcing municipalities to submit data. In the 2015 assessment process, 22 municipalities did not even submit basic indicators. In accordance with the law, basic indicator assessment reports must be submitted, and although they have been encouraged through official letters, these municipalities did not submit assessment reports. In particular, many municipalities in large cities (such as Seoul) did not submit reports, which may be because the financial situation is good and central government support is not important. Although the ASC is an assessment made by law, there are no penalties for municipalities that reject the assessment.
There is also a limit to forcing the participation of municipalities in the absence of a separate budget and human resources, such as the establishment of legal statistics. The ASC offers several incentives, however, in reality, other incentives (except the honor of the head of municipalities) are not effective. Therefore, there is a limit to inducing active participation of municipalities. Accordingly, the MOLIT is trying to increase the indicators prepared and provided by professional institutions. Nevertheless, there are limits to the indicators that must be prepared by collecting the internal data of municipalities.
This situation is highly problematic because the availability and updateability of the data are very important in the sustainability assessment framework [6]. The fundamental way to solve this problem is to make all ASC indicators into statutory statistical indicators and to include them in the annual statistical yearbook published by municipalities. It is necessary to legislate so that human resources and budgets can be secured for this purpose.

5.2. How Can We Assess Municipalities with Different Characteristics?

As mentioned above, the municipalities in this study have the same administrative hierarchy but very different characteristics. Therefore, certain indicators may not be appropriate for some municipalities. For example, indicators related to non-urban areas management are very important indicators for compact land use and sprawl management. However, the majority of Gu does not have non-urban areas, and there is a limit to assessing these municipalities with this indicator. Therefore, there has been a continuous discussion on whether to separate Si, Gun, and Gu and to assess them separately through differentiated indicators.
This problem is linked to the problem of setting the analytical units, which has been a constant problem in sustainability assessment frameworks [6]. Environmental differences exist even in municipalities with the same administrative classification. For example, there are both highly urbanized Si, and Si with mostly rural areas. In other words, if assessment targets are to be segmented, there may be a need to classify according to environmental characteristics even within the municipality of the same category. This problem also raises the question as to whether it is possible to develop globally applicable standardized indicators. As mentioned earlier, despite the efforts of the UN [38,39], there is no consensus on standardized indicators or frameworks for assessing sustainability [40]. With the limits to reflecting differences among Korean municipalities, developing indicators that reflect global differences will be very difficult. Because of these problems, the ASC established assessment units in accordance with the administrative hierarchy.
To reflect some of the differences according to the characteristics of municipalities, in determining the award the ASC partially reflects the type of municipalities. If the first place is decided in the Si, second place is given to the municipalities with the highest score among Gu or Gun.
To reflect environmental differences, some measures to introduce geographic grid units rather than municipal units into the ASC are being discussed and partly tested [53]. At p, updating is unclear. If enough grid unit data is constructed in the future, it will be possible to divide the whole national territory into grids of a certain size and use it as an assessment unit. It is expected that grid-based assessments will overcome some of the environmental differences. However, the institutional theme will still need to be assessed by municipal administrative units.

5.3. Can We Set Appropriate Values for Indicators?

As described above, the ASC performs a relative assessment which allows municipalities to identify relatively poor indicators compared to other municipalities. There is also a practical reason, in that it is difficult to set the appropriate value for each indicator. For example, for RIR indicators, many studies show that the appropriate value is about 30%. However, it is very difficult to provide appropriate values for indicators such as population growth rate, the number of students per class, and the area of cultural facilities per capita. In particular, the ASC covers a wide range covering four themes, so presenting appropriate values for all the indicators is currently limited. Long-term efforts should be made to present appropriate values for each indicator through studies of individual countries and of individual indicators. In this process, the characteristics of the municipalities mentioned above should also be considered.

5.4. Can the ASC Assessment System be Expanded to the Global or Continental Level?

Sustainability can be achieved at a national level when all municipalities work together. However, individual municipalities are more likely to focus on their own development and growth than on national sustainability. In a situation where the authority of the central government has decreased and the authority of the local government has increased, the central government’s ability to direct the policy direction of local governments is limited. In order to overcome this situation and enhance the sustainability efforts of local governments, the Korean government introduced ASC. Similarly, global sustainability can be achieved when all countries work together. However, many countries value their own growth and development over global sustainability. Moreover, individual countries have much more autonomy and authority than municipalities, and in principle, there is no way to enforce specific policies. As a result, efforts are being made to increase global sustainability based on agreements between countries (e.g., the Kyoto Protocol in 1997, the Paris Agreement in 2015), but these efforts have many limitations. Therefore, it would be desirable to expand an assessment system similar to ASC to a global scale. In other words, international organizations such as the United Nations can carry out a system similar to the ASC to assess national sustainability and provide diagnostic reports and incentives. Such a system could be used as a tool to increase global sustainability. Alternatively, if there is an organization that can represent a region or continent, such as the European Union (EU) or Association of Southeast Asian Nations (ASEAN), a similar assessment system can enhance the sustainability of that region or continent. Of course, the adoption of such a system requires the discovery of effective incentives and financial resources at the global and regional levels. Therefore, it is important to consider ways to link financial support between countries, such as Official Development Assistance (ODA), with these assessment systems in various ways.

6. Conclusions

The purpose of this study is to review the experiences of the sustainability assessment system applied in South Korea (ASC) and suggest policy implications for operating the assessment system for sustainable development. The results analyzing the ASC system are as follows. First, the assessment unit of ASC is the low-ranked municipality. The purpose of the ASC is to induce local governments to achieve the central government’s sustainability goals. Therefore, the assessment is based on low-ranked municipalities that directly execute urban policies. Second, ASC has assessment indicators based on four themes (social, economic, environmental, and institutional) for assessing the overall sustainability of municipalities. This indicator system has been widely used since the UN proposed it in 2001 [50]. Third, the ASC consists of basic indicators submitted by all municipalities and voluntary indicators submitted only by the municipalities who want incentives. Thus, various qualitative indicators can be included in the assessment system while reducing the workload of municipalities. Fourth, the ASC provides diagnostic reports, incentives, and awards to municipalities based on the assessment results. Diagnostic reports allow each municipality to identify sustainability levels, and awards and incentives will encourage municipalities to increase their sustainability. The characteristics of the 2015 ASC assessment results are as follows. Gun was significantly evaluated in terms of social sustainability, and the southern Seoul metropolitan area, as well as Chungcheong area, were evaluated thoroughly in terms of economic sustainability. In terms of environmental sustainability, metropolitan cities received high scores, while institutional theme scores were not high in any specific area. Municipalities in metropolitan cities received higher voluntary indicator scores than rural areas.
As part of an active discussion on how to assess the sustainability of municipalities, this study introduced the experience of Korea’s ASC system and shared know-how. This contribution is meaningful in that it is a rare case of a nation’s assessment of municipalities’ sustainability, and it suggests the implications of future efforts to introduce institutionalized sustainability assessment systems.
However, this study is limited because it cannot verify whether the assessment system actually improved the sustainability of municipalities because not enough time has passed since the introduction of the ASC. Therefore, after sufficient time has passed to allow the sustainability level of municipalities to change, the impact of ASC assessment on municipalities’ sustainability can be analyzed. Another limitation of this study is that it does not address the adequacy of individual assessment indicators. This is because it focuses on the assessment system rather than the assessment indicators. In addition, during the process of establishing the ASC system, assessment indicators were determined based on policy demand rather than an academic review. Therefore, further research on the academic relevance of ASC indicators is required.

Author Contributions

Conceptualization, S.H. and I.K.; methodology, S.H. and H.K.; data curation, B.-H.L.; writing—original draft preparation, S.H. and H.K.; writing—review and editing, S.H. and H.K.; project administration, S.H., I.K. and B.-H.L.

Funding

This research received no external funding

Conflicts of Interest

The authors declare no conflict of interest.

Appendix A

Table A1. Indicators of assessment of sustainability of cities (ASC).
ThemeTypeSub-ThemeIndicatorsAssessment Methods
SocialBasic IndicatorsSafety and Security (SO-1)Amount of natural disaster damage/populationZ-score
No. of fire incidents/populationZ-score
No. of fire fighters and policemen/populationZ-score
Social Welfare (SO-2)Capacity of childcare centers/child populationZ-score
No. of students per elementary school classZ-score
No. of doctors/populationZ-score
No. of elderly facilities/elderly populationZ-score
Culture and Leisure (SO-3)Area of cultural facilities/populationZ-score
No. of books in the library/populationZ-score
Area of sports facilities/populationZ-score
Area of parks and open spaces/populationZ-score
Voluntary IndicatorsSafety and Security (SO-1)Budget related to disaster prevention/total budgetZ-score
Budget related to crime prevention/total budgetZ-score
Social Welfare (SO-2)Budget related to public health/total budgetZ-score
Budget for preparing for an aging society/total budgetZ-score
Culture and Leisure (SO-3)Best practices of urban design and landscapeQualitative Evaluation
Policies or programs related to culture and landscapeQualitative Evaluation
EconomicBasic IndicatorsPopulation (EC-1)Improvement of population growth rateZ-score
No. of newborn babies/populationZ-score
Population of 15 to 64 years old/populationZ-score
Net inflow population/populationZ-score
Economy (EC-2)Economically active population/populationZ-score
No. of enterprises/populationZ-score
Financial independence of local governmentsZ-score
Local government budget per capitaZ-score
GRDP per capitaZ-score
Decrease ratio of local governments’ debtZ-score
Voluntary IndicatorsPopulation (EC-1)Policies or programs related to population attractionQualitative Evaluation
Policies or programs related to the increase of the birth rateQualitative Evaluation
Economy (EC-2)Efforts for business attractionQualitative Evaluation
Efforts for fiscal consolidationQualitative Evaluation
EnvironmentalBasic IndicatorsHousing (EV-1)No. of rental housing/No. of householdsZ-score
Rent to income ratio (RIR)Z-score
Price to income ratio (PIR)Z-score
No. of improvement buildings/old buildingsZ-score
Environmental Protection (EV-2)Living waste recycling ratioZ-score
Water and sewerage penetration rateZ-score
Forest area reduction ratioZ-score
Transportation (EV-3)Public transportation sharesZ-score
Amount of public transportation support/populationZ-score
No. of traffic accidents/No. of carsZ-score
No. of parking lots/No. of carsZ-score
Voluntary IndicatorsHousing (EV-1)Best practices of community developmentQualitative Evaluation
Efforts to improve the quality of housing for low-income familiesQualitative Evaluation
Environmental Protection (EV-2)No. of eco-friendly building certificationZ-score
Efforts to reduce greenhouse gas emissionsQualitative Evaluation
Transportation (EV-3)Policies or programs to promote walking and cyclingQualitative Evaluation
Policies or programs for the disabledQualitative Evaluation
InstitutionalBasic IndicatorsLand Use Control (IN-1)Development permission in urbanized region/all development permitsZ-score
Area of unused land in urbanized region/area of urbanized regionZ-score
Population/target population according to urban planZ-score
Change area to developable land/area non-urbanized regionZ-score
Administrative Capacity (IN-2)Operation of Urban Planning Executive TeamScoring by Item
Rate of urban planning experts in urban planning committeeZ-score
The existence of plans and organizations to address unexecuted urban facility areaScoring by Item
Reduction of long-term unexecuted urban facility areaZ-score
Resident Participation (IN-3)No. of Residents’ application for information disclosureZ-score
No. of policy suggestions by residentsZ-score
Growth rate of budget related to resident participationZ-score
Voluntary IndicatorsLand Use Control (IN-1)Efforts to prevent reckless development in non-urbanized regionQualitative Evaluation
Efforts for urban regenerationQualitative Evaluation
Administrative Capacity (IN-2)Urban planning related education completion time/No. of public officersZ-score
Urban planning project budget raised through local government bonds/Total urban planning project budgetZ-score
Resident Participation (IN-3)No. of volunteers/populationZ-score
No. of community education eventsZ-score

References

  1. UN DESA. 2018 Revision of World Urbanization Prospects; UN DESA: New York, NY, USA, 2018. [Google Scholar]
  2. Henderson, J.V. The Sizes and Types of Cities. Am. Econ. Rev. 1974, 64, 640–656. [Google Scholar]
  3. Krugman, P. First Nature, Second Nature, and Metropolitan Location. J. Reg. Sci. 1993, 33, 129–144. [Google Scholar] [CrossRef]
  4. Saxenian, A. Regional Advantage: Culture and Competition in Silicon Valley and Route 128; Harvard Univ. Press: Cambridge, MA, USA, 2000; ISBN 978-0-674-75340-2. [Google Scholar]
  5. Segal, D. Are There Returns to Scale in City Size? Rev. Econ. Stat. 1976, 58, 339–350. [Google Scholar] [CrossRef]
  6. Lützkendorf, T.; Balouktsi, M. Assessing a Sustainable Urban Development: Typology of Indicators and Sources of Information. Procedia Environ. Sci. 2017, 38, 546–553. [Google Scholar] [CrossRef]
  7. UN-HABITAT. State of the World’s Cities 2006/2007; Earthscan: London, UK, 2006; ISBN 92-1-131811-4. [Google Scholar]
  8. UN-HABITAT. State of the World’s Cities 2008-2009: Harmonious Cities; Earthscan: London, UK, 2008; ISBN 978-1-84407-696-3. [Google Scholar]
  9. UN-HABITAT. State of the World’s Cities 2012/2013: Prosperity of Cities, 1st ed.; Routledge: New York, NY, USA, 2013; ISBN 9780415938887. [Google Scholar]
  10. Bossel, H. Indicators for Sustainable Development: Theory, Method, Applications: A Report to the Balaton Group; IISD: Winnipeg, MB, Canada, 1999. [Google Scholar]
  11. UN. Brundtland Commission. World Commission on Environment and Development. In Our Common Future; Oxford University Press: Oxford, UK, 1987. [Google Scholar]
  12. Wu, J.; Wu, T. Sustainability indicators and indices: an overview. In Handbook of Sustainability Management; World Scientific: Singapore, 2011; pp. 65–86. ISBN 978-981-4354-81-3. Available online: https://pdfs.semanticscholar.org/4ec4/165e842176b34afb5012ebd1d8cb662c5c99.pdf (accessed on 25 September 2019).
  13. Valentin, A.; Spangenberg, J.H. A guide to community sustainability indicators. Environ. Impact Assess. Rev. 2000, 20, 381–392. [Google Scholar] [CrossRef]
  14. Carvalho, S.D.; Carden, K.J.; Armitage, N.P. Application of a sustainability index for integrated urban water management in Southern African cities: Case study comparison—Maputo and Hermanus. Water SA 2009, 35, 144–151. [Google Scholar] [CrossRef]
  15. Pires, S.; Fidélis, T.; Ramos, T.B. Measuring and comparing local sustainable development through common indicators: Constraints and achievements in practice. Cities 2014, 39, 1–9. [Google Scholar] [CrossRef]
  16. Ramos, T.; Pires, S. Sustainability Assessment: The Role of Indicators. In Sustainability Assessment Tools in Higher Education Institutions; Springer: Cham, Switzerland, 2013; pp. 81–100. ISBN 978-3-319-02374-8. [Google Scholar]
  17. Bell, S.; Morse, S. Sustainability Indicators: Measuring the Immeasurable, 2nd ed.; Earthscan: London, UK, 2008; ISBN 978-1-85383-498-1. [Google Scholar]
  18. Camagni, R.; Capello, R.; Nijkamp, P. Towards sustainable city policy: an economy-environment technology nexus. Ecol. Econ. 1998, 24, 103–118. [Google Scholar] [CrossRef]
  19. UNSD. United Nations Conference on Environment & Development Rio de Janerio, Brazil, 3 to 14 June 1992 AGENDA 21; UNSD: New York, NY, USA, 1992. [Google Scholar]
  20. Serageldin, I. Sustainability and the Wealth of Nations: First Steps in an Ongoing Journey; The World Bank: Washington, DC, USA, 1996; p. 1. [Google Scholar]
  21. Waas, T.; Hugé, J.; Block, T.; Wright, T.; Benitez-Capistros, F.; Verbruggen, A. Sustainability Assessment and Indicators: Tools in a Decision-Making Strategy for Sustainable Development. Sustainability 2014, 6, 5512–5534. [Google Scholar] [CrossRef]
  22. Hezri, A.A.; Hasan, M.N. Management framework for sustainable development indicators in the State of Selangor, Malaysia. Ecol. Indic. 2004, 4, 287–304. [Google Scholar] [CrossRef]
  23. Holden, M. Urban indicators and the integrative ideals of cities. Cities 2006, 23, 170–183. [Google Scholar] [CrossRef]
  24. International Organization for Standardization ISO 37120:2018 Sustainable Cities and Communities-Indicators for City Services and Quality of Life. Available online: http://www.iso.org/cms/render/live/en/sites/isoorg/contents/data/standard/06/84/68498.html (accessed on 18 November 2019).
  25. International Organization for Standardization ISO 37122:2019 Sustainable Cities and Communities-Indicators for Smart Cities. Available online: http://www.iso.org/cms/render/live/en/sites/isoorg/contents/data/standard/06/90/69050.html (accessed on 18 November 2019).
  26. International Organization for Standardization ISO 37123 Sustainable Cities and Communities-Indicators for Resilient Cities. Available online: http://www.iso.org/cms/render/live/en/sites/isoorg/contents/data/standard/07/04/70428.html (accessed on 18 November 2019).
  27. U.S. Green Building Council (USGBC) LEED Certification for Neighborhood Development. Available online: https://new.usgbc.org/leed/rating-systems/neighborhood-development (accessed on 18 November 2019).
  28. Sharifi, A.; Murayama, A. A critical review of seven selected neighborhood sustainability assessment tools. Environ. Impact Assess. Rev. 2013, 38, 73–87. [Google Scholar] [CrossRef]
  29. U.S. Green Building Council (USGBC) Guide to LEED Certification: Cities and Communities. Available online: https://new.usgbc.org/cert-guide/cities-communities (accessed on 18 November 2019).
  30. Tran, L. An interactive method to select a set of sustainable urban development indicators. Ecol. Indic. 2016, 61, 418–427. [Google Scholar] [CrossRef]
  31. Tanguay, G.A.; Rajaonson, J.; Lefebvre, J.F.; Lanoie, P. Measuring the sustainability of cities: An analysis of the use of local indicators. Ecol. Indic. 2010, 10, 407–418. [Google Scholar] [CrossRef]
  32. Pires, S.; Fidélis, T. A proposal to explore the role of sustainability indicators in local governance contexts: The case of Palmela, Portugal. Ecol. Indic. 2012, 23, 608–615. [Google Scholar] [CrossRef]
  33. Mascarenhas, A.; Coelho, P.; Subtil, E.; Ramos, T. The role of common local indicators in regional sustainability assessment. Ecol. Indic. 2010, 10, 646–656. [Google Scholar] [CrossRef]
  34. Shearlock, C.; James, P.; Phillips, J. Regional sustainable development: are the new regional development agencies armed with the information they require? Sustain. Dev. 2000, 8, 79–88. [Google Scholar] [CrossRef]
  35. Benneworth, P.; Conroy, L.; Roberts, P. Strategic Connectivity, Sustainable Development and the New English Regional Governance. J. Environ. Plan. Manag. 2002, 45, 199–217. [Google Scholar] [CrossRef]
  36. OECD. Core Set of Indicators for Environmental Performance Reviews: A Synthesis Report by the Group on the State of the Environment; OECD: Paris, France, 1993. [Google Scholar]
  37. UNDESA Indicators of Sustainable Development: Guidelines and Methodologies, 3rd Edition. Available online: https://sustainabledevelopment.un.org/index.php?page=view&type=400&nr=107&menu=1515 (accessed on 25 July 2019).
  38. Flood, J. Urban and Housing Indicators. Urban Stud. 1997, 34, 1635–1665. [Google Scholar] [CrossRef]
  39. UN. Global Sustainable Development Report. 2013. Available online: https://sustainabledevelopment.un.org/content/documents/4607Background%20paper%20on%20review%20of%20national%20SD%20assessments.pdf (accessed on 25 July 2019).
  40. Pintér, L.; Hardi, P.; Bartelmus, P. Sustainable Development Indicators: Proposals for a Way Forward; IISD: Winnipeg, MB, Canada, 2005. [Google Scholar]
  41. Ramos, T.B.; Caeiro, S.; Melo, J.J. de Environmental indicator frameworks to design and assess environmental monitoring programs. Impact Assess. Proj. Apprais. 2004, 22, 47–62. [Google Scholar] [CrossRef]
  42. Sébastien, L.; Bauler, T. Use and influence of composite indicators for sustainable development at the EU-level. Ecol. Indic. 2013, 35, 3–12. [Google Scholar] [CrossRef]
  43. Spohn, O.M. Sustainable Development Indicators within the German Water Industry—A Case Study; Carried out at Chalmers University of Technology: Gothenburg, Swenden, 2004; Available online: https://hdl.handle.net/20.500.12380/43326 (accessed on 25 September 2019).
  44. McCool, S.F.; Stankey, G.H. Indicators of sustainability: challenges and opportunities at the interface of science and policy. Environ. Manage. 2004, 33, 294–305. [Google Scholar] [CrossRef] [PubMed]
  45. NATIONAL LAW INFORMATION CENTER | LAW SEARCH. Available online: http://law.go.kr/LSW/eng/engLsSc.do?menuId=2&section=lawNm&query=National+Land+Planning+and+Utilization+Act&x=0&y=0#liBgcolor18 (accessed on 25 September 2019).
  46. Kim, H.J.; Kim, H.S.; Kwon, I.; Moon, C.; Han, S.H. The Actual Status and the Critical Assessment on Transfer of Urban Planning Empowerment to Local Government. J. Korea Plan. Assoc. 2012, 47, 85–104. [Google Scholar] [CrossRef] [Green Version]
  47. Ministry of Land, Infrastructure and Transport. A Study on Introducing Assessment of Sustainability of Cities; MOLIT: Sejong, Korea, 2010.
  48. Ministry of Land, Infrastructure and Transport. Study on the Korean Sustainable Cities Award Reorganization; MOLIT: Sejong, Korea, 2012.
  49. Ministry of Land, Infrastructure and Transport. Evaluation and implementation of 2014 Korean Cities Awards; MOLIT: Sejong, Korea, 2014.
  50. UNDESA Indicators of Sustainable Development: Guidelines and Methodologies, 2nd Edition. Available online: https://sustainabledevelopment.un.org/index.php?page=view&type=400&nr=111&menu=1515 (accessed on 25 July 2019).
  51. Municipalities’ Financial Independence Rate. Available online: http://kosis.kr/statHtml/statHtml.do?orgId=101&tblId=DT_1YL20921&vw_cd=MT_GTITLE01&list_id=109&seqNo=&lang_mode=ko&language=kor&obj_var_id=&itm_id=&conn_path=MT_GTITLE01 (accessed on 25 September 2019).
  52. Ministry of Land, Infrastructure and Transport Public Notice of Administrative Rules. Available online: http://www.molit.go.kr/USR/I0204/m_45/dtl.jsp?gubun=&search=%EC%A7%80%EC%86%8D%EA%B0%80%EB%8A%A5%EC%84%B1&search_dept_id=&search_dept_nm=&old_search_dept_nm=&psize=10&search_regdate_s=&search_regdate_e=&srch_usr_nm=&srch_usr_num=&srch_usr_year=&srch_usr_titl=Y&srch_usr_ctnt=&lcmspage=1&idx=13334 (accessed on 25 September 2019).
  53. Ministry of Land, Infrastructure and Transport. 2018 Assessment of Sustainable of Cities and Living Infrastructure Level; MOLIT: Sejong, Korea, 2018. Available online: http://www.molit.go.kr/portal.do (accessed on 25 September 2019).
Figure 1. Municipalities of Korea: (a) High-ranked municipalities, (b) low-ranked municipalities.
Sustainability 11 06611 g001
Figure 2. Process of the assessment of sustainability of cities (ASC).
Sustainability 11 06611 g002
Figure 3. Results of basic indicators: (a) Social theme, (b) economic theme, (c) environmental theme, (d) institutional theme.
Sustainability 11 06611 g003
Figure 4. Results of basic indicators by type of municipality: (a) By Si, Gun, and Gu, (b) by Seoul metropolitan area (SMA), bon-SMA, metropolitan city, and non-metropolitan city.
Sustainability 11 06611 g004
Figure 5. Comparison of scores of basic indicators between whole municipalities and voluntary municipalities: (a) Si, (b) Gun, (c) Gu.
Sustainability 11 06611 g005
Figure 6. Comparison of scores of basic indicators and voluntary indicators: (a) Si, (b) Gun, (c) Gu.
Sustainability 11 06611 g006
Figure 7. Comparison of scores of basic indicators and voluntary indicators: (a) Seoul metropolitan area (SMA), (b) non-SMA.
Sustainability 11 06611 g007
Table 1. Indicator configuration in the assessment of sustainability of cities (ASC).
ThemeSub-ThemeNo. of Indicators
BasicVoluntary
SocialSafety and Security (SO-1)32
Social Welfare (SO-2)42
Culture and Leisure (SO-3)42
EconomicPopulation (EC-1)42
Economy (EC-2)62
EnvironmentalHousing (EV-1)42
Environmental Protection (EV-2)32
Transportation (EV-3)42
InstitutionalLand Use Control (IN-1)42
Administrative Capacity (IN-2)42
Resident Participation (IN-3)32

