Energy and Economic Analysis of Tropical Building Envelope Material in Compliance with Thailand’s Building Energy Code

1
Faculty of Engineering, Srinakharinwirot University, Bangkok 10110, Thailand
2
Faculty of Engineering, King Mongkut’s Institute of Technology Ladkrabang, Bangkok 10520, Thailand
*
Author to whom correspondence should be addressed.
Sustainability 2019, 11(23), 6872; https://0-doi-org.brum.beds.ac.uk/10.3390/su11236872
Submission received: 18 September 2019
/
Revised: 29 November 2019
/
Accepted: 29 November 2019
/
Published: 3 December 2019
(This article belongs to the Special Issue Sustainable Building Retrofit and Energy Optimization)
Abstract
:The building envelope has a direct impact on the overall energy consumption of a building. Thus, an improvement in the building envelope using energy-efficient material can yield the desired energy performance. This study is based on the materials and compositions used in building envelopes in compliance with the building energy code of Thailand. The building under study is an educational building located in Bangkok, Thailand. Both the energy and the economic aspects of retrofitted building envelopes are discussed in this study. The energy performance was evaluated by calculating the thermal transfer value and whole building energy consumption using the building energy code (BEC) software. The simulation was done under the assumption that the building envelope in the case study building was retrofitted with different materials and compositions. The study determines the feasibility of retrofitting buildings using energy-efficient material by utilizing the discounted payback period and internal rate of return (IRR) as indicators. The results show that retrofitted building envelopes in every case can reduce the whole building energy consumption. In the best envelope configuration, energy consumption can decrease by 65%. In addition, the economic potential is also high, with an IRR value of approximately 15% and a payback period of 23 less than nine years. These finding indicate that a building envelope made with energy-efficient material can achieve good results for both energy performance and economic feasibility.
1. Introduction
Energy and environmental issues have become significant challenges for the global community in the past decade with the rapid growth in economies and population in many sectors of the world, and maintaining that growth requires a large amount of energy. In addition, global warming and climate change caused by the release of greenhouse gases from the usage of fossil fuels also threaten populations living in vulnerable areas. Thus, many governments and international organizations have set a goal to reduce the usage of energy, the majority of which comes from fossil fuels. One of the sectors that have the potential to reduce the consumption of energy and improve energy efficiency is the building sector that has rapidly developed as a result of a significant expansion of urban areas. According to data from the International Energy Agency (IEA) [1] and the US Energy Information Administration [2], the energy consumed by a building is dominated by its heating, ventilation, and air-conditioning (HVAC) systems, followed by the lighting system and other equipment. The thermal energy from the environment is one of the factors that impact the energy used by the HVAC system when providing comfort for the occupants. The ambient heat from the exterior can pass through the building envelope and increase the thermal load for the HVAC system, which directly results in an increase in the overall energy consumption of the building [3]. Hence, improving the energy efficiency of building envelopes can potentially save energy in the building sector.
This trend is also occurring in Thailand, which is shifting from an agricultural to an industrialized society andexperiencing a mass movement of people into the cities. The energy consumed by buildings in both the residential and the commercial sectors has been rising significantly. The government of Thailand, through the Department of Alternative Energy Development and Efficiency (DEDE), Ministry of Energy, has laid out an energy efficiency plan that aims to decrease the energy intensity (EI) by 30% (30,000 ktoe) in 2030 from the business as usual (BAU) case at 151,000 ktoe to 121,000 ktoe [4]. To achieve this target, the government passed the Energy Conservation Promotion Act in 1992 [5]. In this Act, the building energy code has been developed and approved by the cabinet in 2009 in order to enforce the energy standard to the new construction and retrofitted building. The building energy code of Thailand is applied to newly constructed or retrofitted buildings with a total area exceeding 2000 m2. The six aspects of buildings that the standard enforces are the building envelope, lighting system, air-conditioning system, hot water generating system, renewable energy utilization, and whole-building performance [6].
In terms of the building envelope, the impact on the whole building energy consumption comes from the heat that is transferred from the outside environment to the interior of the building. This thermal energy has a direct impact on the energy usage of the HVAC system, especially in a tropical climate such as the climate in Thailand, which has a high average temperature throughout the year. The average temperature in the Bangkok metropolitan area is highest at 30.2 °C in April, and the lowest at 25.6 °C in December. [7]. The environment temperature also depends on the time of the day. Thus, the building energy code standard has roughly grouped buildings into three categories that are subject to different sets of standard values depending on the normal operating hours and occupant behaviours. Offices and educational institutions have average operating hours from 8:00 to 16:00. Department stores and conference centres have average operating hours from 10:00 to 22:00. Finally, hotels, hospitals, and apartments operate for the entire day. The standards for the overall thermal transfer value (OTTV) and roof thermal transfer value (RTTV) for different categories of buildings are presented in Table 1.
This study is aimed at determining the optimal material and its composition for a building envelope in terms of both energy and cost. The energy performance of the material and its composition in the building envelope is evaluated by using building energy code (BEC) software to simulate the building’s thermal transfer and whole-building energy consumption in comparison with Thailand’s building energy code as a reference. From the economic perspective, the study evaluates the feasibility of applying energy-efficient materials and optimal compositions by using financial metrics that reference Thailand’s economic data. The paper is divided into five sections as follows. Section 1 discusses the background and objective of the study. The literature review and related research in the field is discussed in Section 2. The description of the building, thermal transfer calculation, and detail of the case study are presented in Section 3. Section 4 discusses the results from the BEC software in terms of energy. The economic perspective is presented in Section 5. Finally, Section 6 presents the conclusion and discussion of the findings of the study.
2. Literature Review
The research based on better energy-efficient building envelopes plays a crucial role in reducing the amount of energy consumed by buildings. The factors that affect the thermal properties of a material, especially thermal conductivity, must be considered to correctly determine the energy performance of the materials [8]. The mathematical models, calculations, and the testing of thermal properties of a material are required to correctly calculate the thermal transfer value through the building envelope. To evaluate the thermal performance of the material, the hot box, which consists of high- and low-temperature chambers divided by the envelope material is used; it accurately determines the thermal transmittance under both steady-state and dynamic conditions [9]. The opaque material used to construct walls and roofs has many different thermal properties depending on composition [10]. Thus, it is up to the architect and the engineer to select the suitable building envelope for each building. The insulator also has a significant impact on heat transfer. A study [11] reveals that fiberglass insulators lower thermal conductivity and are suitable for the interior of building envelopes. An air gap layer in the wall or roof composition is another way to improve the thermal transfer instead of using an insulator. Even though the thermal properties of the air layer are lower than those of a fiberglass insulator, an air gap reduces the thermal transfer value with a lower cost [12]. Newer technologies for insulators are being continuously developed; for example, dynamic insulation, which is a newer type of insulator that can further reduce the thermal transfer compared to a conventional insulator, was also tested and verified under different climates [13,14]. Another study on a new insulator technology proposed the switchable insulation system that uses an electrical or magnetic field for changing the layer of insulation to achieve the desired heat transfer level [15]. Windows are another part of a building envelope that has a significant impact on energy performance. Thus, newer technologies in transparent material has been developed and implemented in building envelopes, such as vacuum glazing [16], evacuated glazing [17], and transparent insulation [18]. These new technologies not only reduce the heat gain but also provide the desired visible daylight to a building. The architecture of the building skin also affects the energy consumption because shading on the envelope can also reduce the heat that enters the building [19]. Despite the level of reduction achieved from using suitable building skin designs, they are not applicable to the retrofitted building envelope; however, it is still another way to reduce energy consumption.
The effects of retrofitted building envelopes have been presented in various studies with different perspectives [20,21,22,23,24,25,26]. Studies based on the effects of building envelope parameters such as building dimensions, building locations, external walls, external roofs, and shading devices in tropical climates have revealed diverse optimal envelope compositions that can provide thermal comfort to the occupant [20]. The newer technologies also affect the performance; a higher energy efficiency can be achieved. However, the higher cost for new technology also poses a negative effect on the feasibility of investment [21]. The building envelope has an impact on occupant behaviour and comfort. The occupant behaviour pattern can be affected by some of the retrofitted materials such as types of glass used on the window. It is also an uncertain parameter that affects thermal loads in buildings [22,23]. A lifecycle analysis was conducted on each building envelope material, and adaptation assessment from a technologies point of view in different countries, which revealed the level of implementation and maturity of some technologies in building envelopes [24]. From the environmental perspective, suitable materials can lower environmental impacts from energy usage by 20–30%, the global warming impact by 40%, and acidification potential by 50–75% [25]. From the economic point of view, the cost of investment and the desired thermal characteristics of the retrofitted building envelope need to be at an optimal point for the project to be attractive for investment [26].
Many studies have discussed the potential of retrofitting building envelopes in conjunction with local limitations such as climate, local policy, and occupant behaviour by using case studies in their specific locations [27,28,29,30,31]. In a case study from Egypt, a retrofitted educational building demonstrated that a simple retrofitting strategy on a building envelope can reduce the average energy consumption up to 33% even though the building is located in a hot climate [27]. In reference [28], a case study in Italy illustrated the effect of building envelope mass on thermal transmittance. In addition, it also illustrated the correlation between the climate of each location and energy consumption. A case study in India examined the energy efficiency of every system in an office building located in different climates. It showed the correlation between building envelopes and the energy consumption of HVAC systems that result from a reduction in heat transfer in buildings through high-efficiency material and external shading [29]. Another case study in Spain also evaluated the retrofitting of building envelopes and showed a reduction in residential building energy consumption by 12% [30]. Reference [31] presented an evaluation of the energy-saving and economic feasibility of different retrofitting strategies for all aspects of building envelopes (wall, window, and roof) using actual school buildings in Jordan. That study also presented recommendations for suitable retrofitting strategies in hot climates that can achieve a 54% energy reduction and a payback period of 5.5 years. All these case studies illustrate the potential of the retrofitted building envelope in various aspects. From the literature review discussed above, it can be seen that a retrofitted building envelope using energy-efficient materials can significantly improve energy efficiency. However, many studies lack a combined perspective of both energy and economics—the energy performance of materials used in the building envelope, and the cost—which directly influence building owners to invest in energy-efficient materials for building envelopes.
3. Thermal Calculation and Case Study
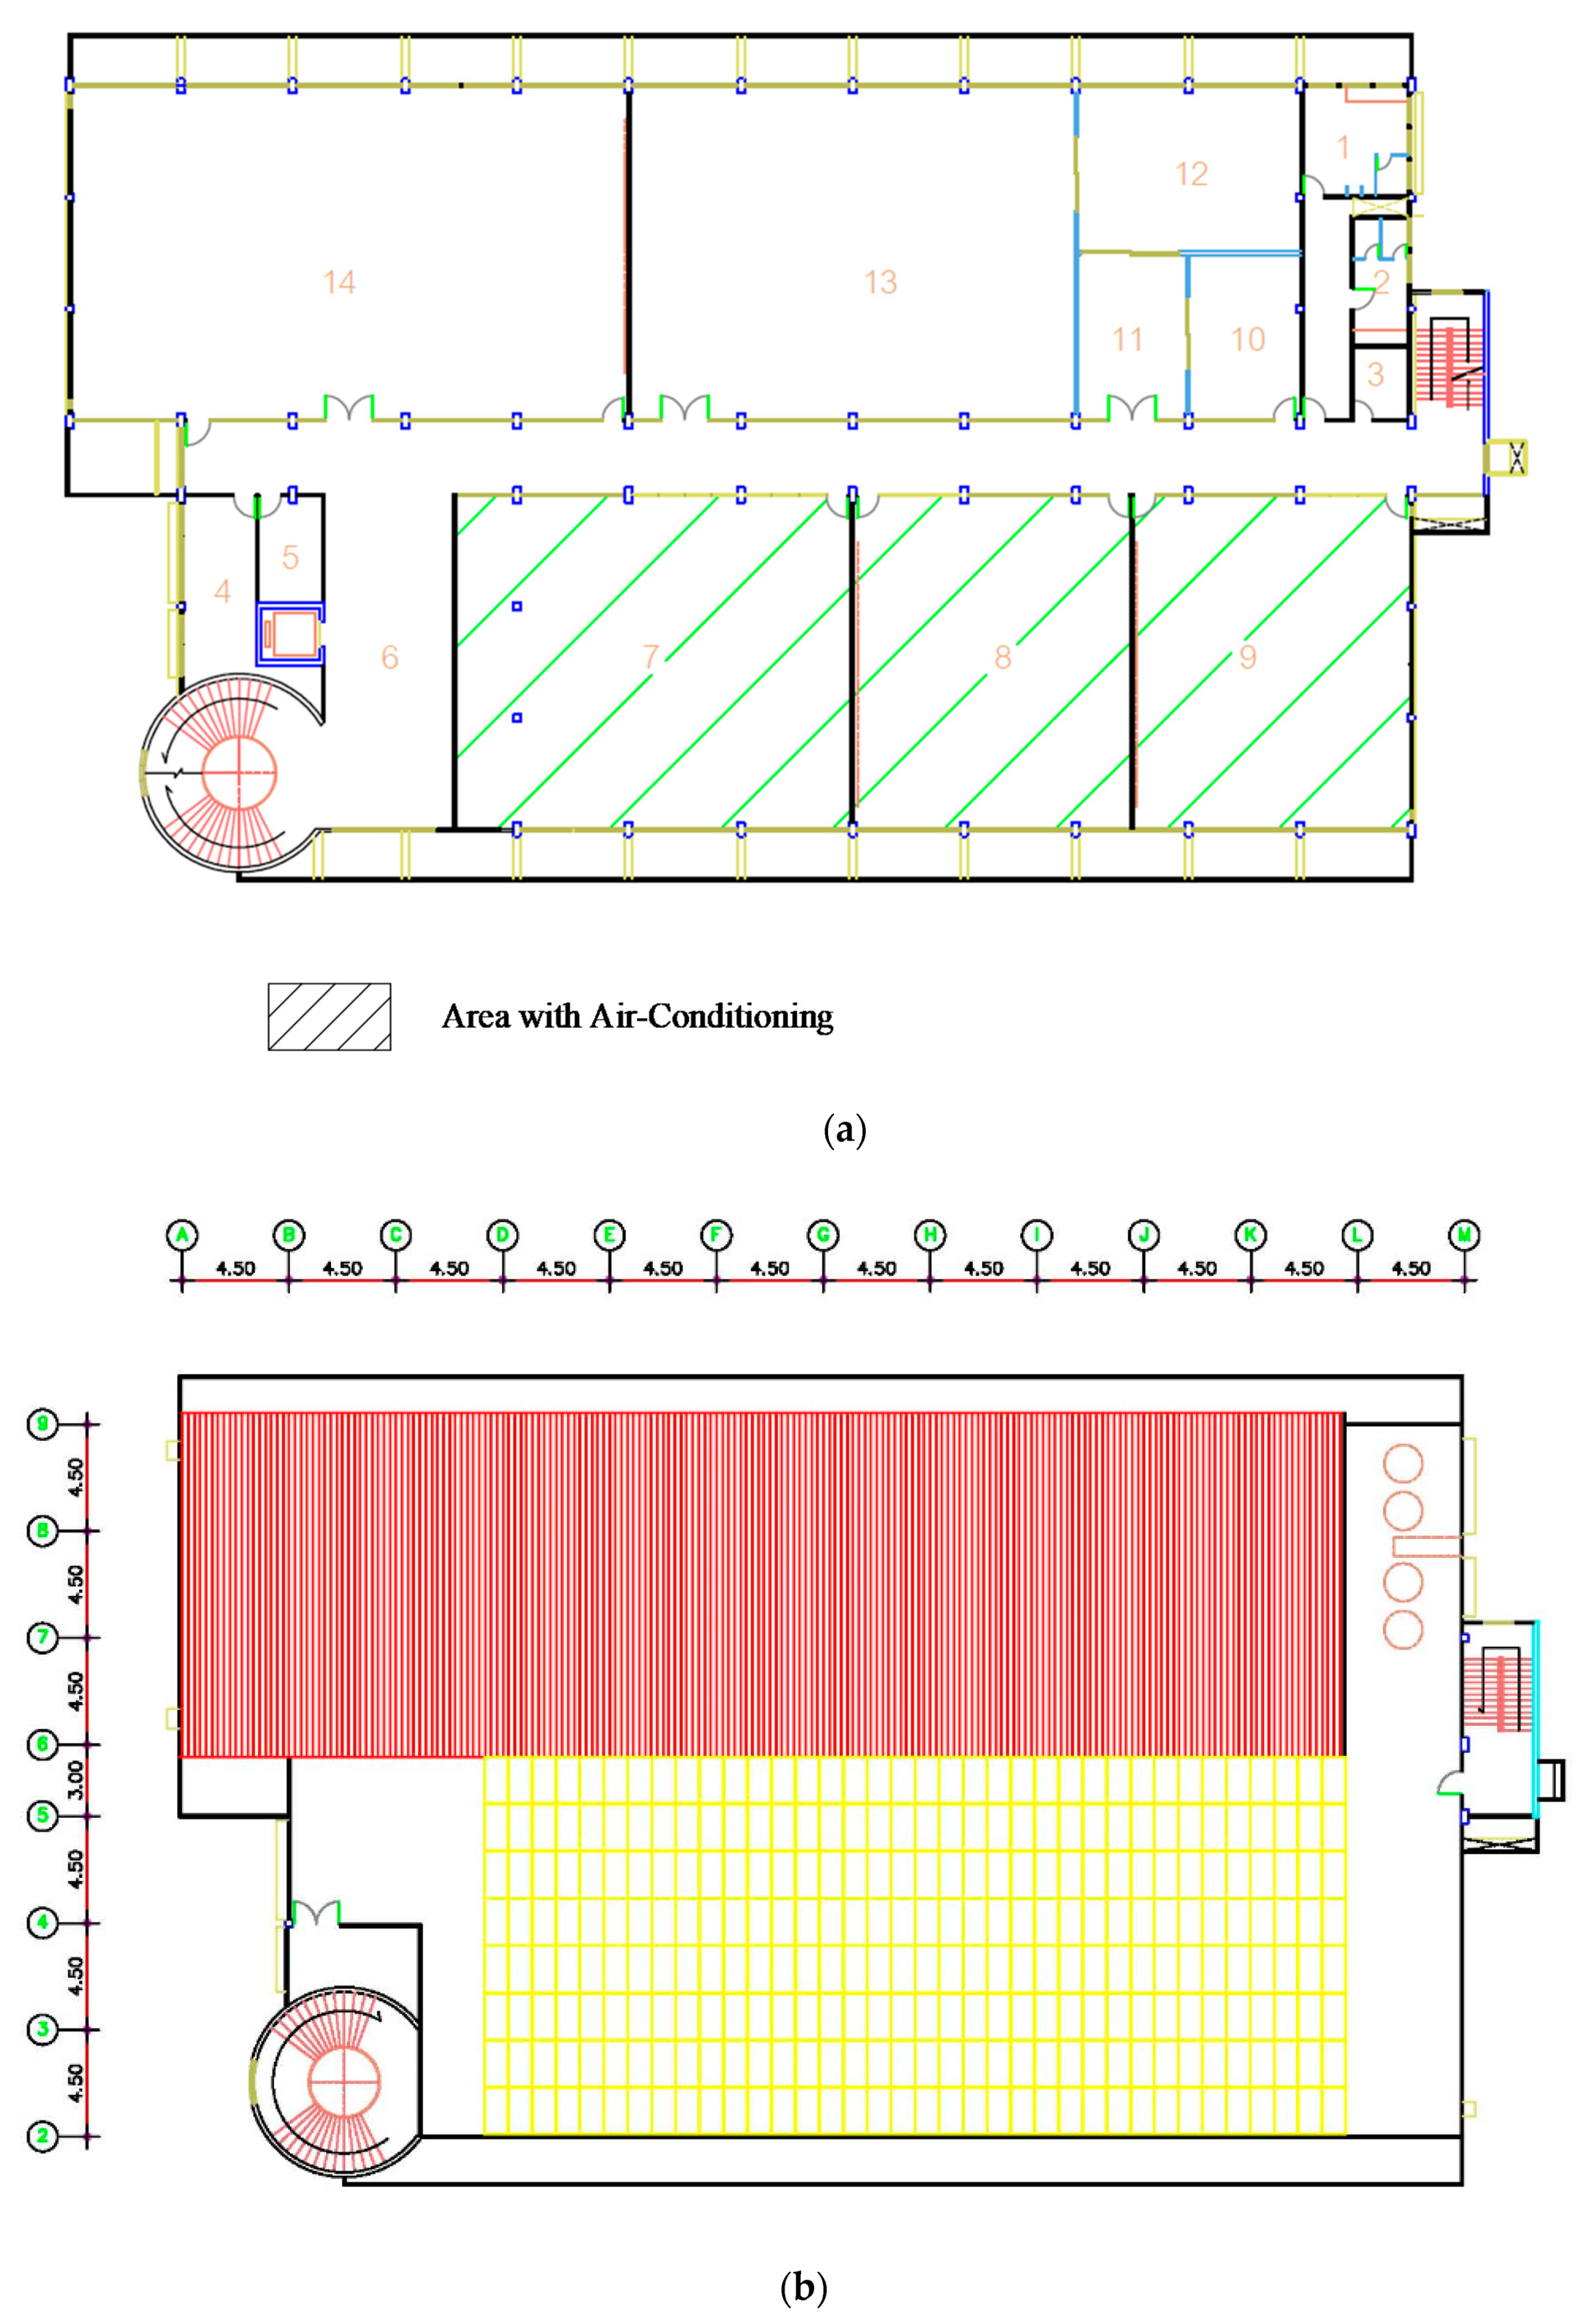
The building used as a case study is a four-storey building in King Mongkut’s Institute of Technology Ladkrabang located in Bangkok, Thailand. It is an old mixed-use building with lecture rooms, offices, and laboratories, which was evaluated using the education/office building type according to the BEC. The case study building has a total floor area of 6302.12 m2, which is larger than the standard criterion of 2000 m2. The overall exterior of the building is shown in Figure 1, and the floor plan and the roof are shown in Figure 2a,b, respectively. In Figure 2a, the floor plan of the case study building has a similar layout from the first to the fourth floor with some different in minor configuration of the room section. Every room from the first to the third floor has installed air-conditioning. While the fourth floor, the room section in the floor plan without highlighted is not install air-conditioning system. The roof of the building is flat reinforced concrete with a total area of 907.28 m2. The section with the triangle roof is not included in the calculations because the area under that section does not have an air-conditioning system and is not subject to evaluation according to the energy building code. The reason for ignoring this section (a roof connected to a room without air conditioning) in the evaluation is because there is less impact from the thermal transfer on the energy usage in the air condition system and whole building energy consumption. The total area of the building envelope that has an effect on the OTTV/RTTV (the envelope that is connected to air-conditioned areas) in each direction is summarized in Table 2. In addition, the shading coefficient is also not considered in this study because the objective of this study is to evaluate the performance of the material and its composition for which the simulation is conducted to maximize the OTTV/RTTV.
3.1. Thermal Transfer Calculation
The building energy code has set the standard calculation method for OTTV and RTTV of buildings with air-conditioning systems [32]. The OTTV of one side of the wall can be calculated by using Equation (1). The overall OTTV of the building is calculated by using a weighted arithmetic mean of all the sides of the building as shown in Equation (2).
where
- = Overall thermal transfer value of the building (W/m2);
- = Overall thermal transfer value of the considered side (W/m2);
- = Heat transfer coefficient of the opaque wall (W/m2·°C);
- = Window to wall ratio of the considered side;
- = Differential value of the equivalent temperature (°C);
- = Heat transfer coefficient of the transparent wall or window (W/ m2·°C);
- = Differential temperature between the interior and exterior of the building (°C);
- = Solar heat gain coefficient;
- = Shading coefficient;
- = Effective solar radiation (W/m2);
- = Area in each section of the wall (m2).
RTTV is also calculated using similar formulas with the window to wall ratio changing into skylight to roof ratio and the heat transfer coefficient changing to roof composition as shown in Equation (3). For a building with various roof types using different materials and composition, the total RTTV value can be calculated using an equation similar to that for the OTTV as shown in Equation (4).
where
- = Roof thermal transfer value of the building (W/m2);
- = Roof thermal transfer value of the considered side (W/m2);
- = Heat transfer coefficient of the opaque roof (W/m2·°C);
- = Skylight to roof ratio;
- = Heat transfer coefficient of the transparent roof or skylight (W/m2·°C);
- = Area of the wall on the considered side (m2).
The heat transfer coefficient value (U-value) for the building envelope is the inverse of the total heat resistance value of the material that can be calculated by Equation (5). The heat resistance value of each material is calculated by Equation (6) using only the material thickness and thermal conductivity coefficient. In the case of a building envelope consisting of different layers of materials, the total thermal resistance in each section of the building can be calculated by using Equation (7). The standard also considers the heat resistance of the air around the wall on both the inside and outside of the building for which this standard and software will be using set values of 0.12 m2·k/W for the interior and 0.044 m2·k/W for the exterior.
where
- = Heat resistance of the material (m2·k/W);
- = Total heat resistance the composition (m2·k/W);
- = Heat resistance of the air film for the inside wall = 0.12 m2·k/W;
- = Heat resistance of the air film for the outside wall = 0.044 m2·k/W;
- = Thickness of the considered material (m);
- = Thermal conductivity coefficient of the considered material (W/m2·K).
These equations play an important role in calculating the thermal transfer values for materials in the evaluation of building envelopes that has a direct impact on the whole building’s energy consumption according to Thailand’s building energy code and the BEC software.
3.2. Opaque Material
The opaque materials used to construct the walls and roof of the case study building and their thermal properties are summarized in Table 3. The case study building originally included only autoclaved aerated concrete and concrete plaster for the walls. For the roof, reinforced concrete and gypsum plates were used. The opaque materials that are used in the building in both the original and retrofitted forms are commercially available in Thailand. Retrofitting changes the composition of the current material with the addition of an air gap and insulator. The air gap acts as an insulator for the heat transfer from the environment to the building interior. The thermal resistivity of the air gap or air gap resistance depends on the thickness of air gap, surface radiation, and location of the air gap (roof or wall), and these values are summarized in Table 4. According to Thailand’s building energy code, air gap resistance is defined for a thickness of 0–100 mm. If the thickness is greater than 100 mm, the standard recommends using an air gap resistor with a thickness of 100 mm. Air gaps (wall and roof) are classified into two types depending on the surface radiation level. A high surface radiation level corresponds with a composition that does not have an insulator, thereby resulting in a large amount of heat radiating through the air gap. A low surface radiation level corresponds with a composition that has an insulator installed between the wall and air gap, which reduces the amount of heat radiating through the air gap.
The detailed diagram, composition, and opaque materials used for the walls in the case study building are summarize in Table 5. The building currently uses autoclaved aerated concrete and concrete plaster on both sides of the wall. The colour of the wall for both the original and retrofitted cases is white to better reflect the heat from sunlight. For the retrofitted case, the composition and material are arranged into four catalogues from types A to D. Type A is similar to the base case in terms of the autoclaved aerated concrete thickness and has added gypsum plates and air gaps installed on the inner side of the wall to reduce heat from the environment being transferred directly into the building. This results in a significantly reduced U-value. In addition, the overall wall thickness composition is increased compared to the base case. A type B wall consists of two sets of autoclaved aerated concrete half as thick as that in the base case with an air gap in the centre and concrete plaster on both sides of the wall. The change from gypsum board to autoclaved aerated concrete caused a small rise in the U-value from the concrete’s own thermal properties. A type C wall has a similar wall thickness to type A with gypsum plates, but instead of an air gap, the void is filled with a fiberglass insulator. The insulator can efficiently suppress heat from the environment, so the U-values are less than that in the previous case. A type D wall has the same structure as that of type C wall with an additional air gap between the fiberglass insulator and autoclaved aerated concrete. This wall type has the best U-value because the fiberglass insulator and air gap act as double heat resistors, thereby reducing the heat passing from the environment through the opaque wall.
Details of the configuration, composition, and material of the roof used in the case study building is summarized in Table 6. The building has a flat reinforced concrete roof with gypsum plates and an air gap on the interior and only has the air gap as an insulator, thereby yielding a high U-value in comparison to those of other roof types. The compositions of the retrofitted roof are described as roof A and roof B, and they have a similar material and composition compared to the base case with the addition of fiberglass insulation installed above the gypsum plates. Roof A and roof B differ from each other in the thickness of the fiberglass insulation—it is 5 cm in the case of roof A and 10 cm in the case of roof B. The U-values of the two retrofitted roof types show that the fiberglass insulator has the ability to suppress the heat that passes through the roof into the interior of the building; thus, both have better U-values than the base case. This U-value also depends on the thickness of the material as seen in case of roof A and roof B values.
3.3. Transparent Material
The factors that impact the thermal transfer value for transparent material are the heat transfer coefficient value (U-value) and the solar heat gain coefficient (SHGC). Thus, the thermal properties of transparent material and its composition, summarized in Table 7, illustrate these two factors. It also shows a diagram of the window used in both the base case and retrofitted case. The currently used transparent material for the windows in the case study building is a 6 mm clear single monolithic float glass. The retrofitted conditions are divided into four types from A through D. Window type A has a single monolithic float glass similar to that in the base case with an ocean green colour, and it has the same U-value as that of the base case but a lower SHGC value. Window B has a single monolithic heat reflective glass with a reflective coating that has the ability to reflect a large amount of solar heat and prevent it from entering the building interior, thereby reducing both the U-value and the SHGC value. Window C is double-glazed with a clear float glass on the inside, and an air gap and ocean green float glass on the outside. The air gap between the window panes acts as an insulator for the environmental heat, thereby resulting in significant reductions in the U-value and SHGC value. Window D is also double-glazed with a silver heat reflective glass on the inside, and an air gap and low emittance (low-e) coating on an ocean green float glass on the outside. The low-e coating is a microscopically thin layer deposited on a window to suppress radiant heat transfer, thereby reducing heat flow through the window. This type of window has a lower U-value and SHGC value compared to that of other window types. In this study, the window frame is not taken into consideration due to the frame having less U-value compare to transparent material, and the small percentage of the area compared to other components. For the case study to consider the worst case, the window frame is ignored, and the window consists of full-plate glass.
4. Energy Performance
The energy performance of the building envelope is evaluated using BEC software in compliance with Thailand’s building energy code. BEC software is the program capable of simulating the various aspect of the building. BEC can evaluate building envelope by using thermal transfer value, lighting system, air-conditioning system, hot water system, and renewable energy. The software will automatically calculate the whole building energy consumption when modelling the building. The BEC software simulation ability to accurately simulates the energy in the building has been validated by comparing the result with the energy audit from the actual building [33,34]. The average temperature on the case study location (Bangkok metropolitan area) is highest at 30.2 °C and lowest at 25.6 °C with cooling degree-hours (CDH) around 7615 [35]. The detailed material and composition of the walls, windows, and roof type under consideration in both the base case and retrofitted case in this simulation is discussed in a previous section. The boundary conditions for building envelope simulation on the case study location (Bangkok metropolitan area) for the environment temperature is 30.2 °C, and the interior temperature is 25.0 °C. These values have been set automatically by the software according to the locations and types of the building. The parameter under consideration are the OTTV value, RTTV value, and whole building energy consumption. Other systems such lighting, air-conditioning, and hot water systems are the same as in the currently used building and were not retrofitted in this study. The whole building energy consumption of the reference building for the building energy code is calculated according to the optimal energy usage per floor area and building type as dictated by the standard.
4.1. Overall Thermal Transfer Value
The results from the simulation using the case study building with the base case roof section in terms of OTTV with various wall and window types and different materials and composition are summarized in Table 8. From the table, the base case OTTV value is approximately 130 W/m2, which is much higher than the building energy code standard allowance of 50 W/m2 for an educational institution. This is a direct result of the base case building not having any insulation in the building envelope in either the walls or windows; thus, the heat from the environment enters the interior of the building.
Type A wall significantly reduces the OTTV compared to the base case due to the air gap that acts as an insulator between the autoclaved aerated concrete and gypsum plates. However, OTTV of type B wall is slightly higher than that of type A wall because the thermal conductivity of autoclaved aerated concrete is higher that of gypsum plates. When a wall insulator is installed in wall types C and D, the OTTVs are further reduced to approximately 73 W/m2 from the addition of the fiberglass insulator in type C and the fiberglass insulator with an air gap in type D. This shows that the retrofitted wall is still not enough to reduce the OTTV to the standard value due to the majority of solar heat that still passes through the windows to the interior of the building; thus, the retrofitted window case must be considered. Window A uses ocean green float glass and has a similar U-value to that of the clear float glass in base case but less SHGC can reduce the OTTV to 30 W/m2. The heat-reflective glass in window B also reduces the OTTV by increasing its ability to reflect direct solar heat. The double-glazed window in windows C and D has a better OTTV compared to that of the previous transparent material. The double-glazed window has an air gap installed between the two window panes that acts as an insulator to suppress the heat from the environment. The additional low-e coating in window D limits the radiant thermal energy emitted through the window; thus, it has the best OTTV in the case study at 31.445 W/m2.
The whole-building energy consumption for the retrofitted building with different wall and window types compared to the reference building is illustrated in Figure 3. The whole building energy consumption of the reference building is approximately 480,000 kWh per year (blue straight line). The base case whole building energy consumption (red straight line with x marker) is approximately 1,160,000 kWh per year, which is much higher than the standard allowance. Wall type A (orange dotted line with circle marker) and wall type B (green dashed line with square marker) have a similar whole-building energy consumption at approximately 920,000 kWh per year. For the last two wall types with insulators in the composition, wall C (black dashed line with diamond marker) and wall D (purple dashed line with triangle marker) have a similar whole-building energy consumption at 800,000 kWh per year on base case window, but a type D wall can reduce its value to the standard level.
These results indicate that retrofitting the building envelope by changing the wall and window types to more thermally efficient ones can reduce whole-building energy consumption per year in a similar trend to the OTTV. The retrofitted case with window D and wall D types is the only case in which the whole building energy consumption is less than the reference value from the building energy code. However, the OTTVs of window C/wall type D and window D/wall type D are within the standard allowance. This stems from the fact that only retrofitting the windows and walls to reduce the OTTV to the standard value cannot guarantee that the whole-building energy will also be reduced within the standard.
4.2. Roof Thermal Transfer Value
The energy evaluation for the roof material and composition is done using the RTTV and the whole building energy consumption. The results from different retrofitted roofs in terms of RTTV are illustrated in Figure 4a. The base case roof, which consists of reinforced concrete and gypsum plates with an air gap that acts as an insulator, has an RTTV of 15.712 W/m2, which is higher than the standard allowance at 15 W/m2 for educational institutions. Roof A with the addition of a fiberglass insulator above the gypsum plates can reduce the RTTV to within the standard at 6.363 W/m2. This is achieved by the fiberglass insulator and the air gap that act as a double heat resistance which further reduce the heat from the environment entering the building interior. For roof B, which increases the thickness of the fiberglass insulator compared to roof A, it can be seen that the RTTV value can be reduced to half of the previous case at 3.993 W/m2.
The result in terms of the whole-building energy consumption for different types of building envelopes compared to the standard reference building is shown in Figure 4b. The correlation between roof type and whole building energy consumption is illustrated in the figure using a case study that fixed the material and composition of the walls and windows to wall type D and window D, which has the whole building energy consumption within the standard value at approximately 437,000 kWh per year. Roof types A and B that have fiberglass insulators can reduce the whole building energy consumption to lower than the standard allowance at approximately 410,000 kWh per year and 404,000 kWh per year, respectively. However, the decrease in energy when changing the material thickness may not be optimal in the economic aspect. The results reveal that only an air gap as an insulator might not achieve the desired RTTV level. The fiberglass insulator installed into the roof composition contributed to the reduction in heat transfer from the environment through the roof and into the building interior, which can impact the energy usage of air-conditioning systems and the whole building energy consumption.
5. Economic Analysis
The economic analysis of the material and its composition using the building envelope is conducted by using two economic metrics—internal rate of return (IRR) and discounted payback period (DPP)—to determine the feasibility of the case study. This study references Thailand’s economic data from the Bank of Thailand (BOT), the material and labour costs from the Comptroller General’s Department (CGD), and electricity tariffs from the Metropolitan Electricity Authority (MEA), which are used in the economic indicator.
5.1. Economic Indicators
Economic indicators were used to evaluate the feasibility of the retrofitted building envelope to find the optimal material and composition in terms of both energy and economics. The simple payback period (PP) can be used as a simple indicator for the project; however, it does not consider the time value of the money, and it may not reflect the actual cash flow of the project and may lead to a false conclusion. Thus, the DPP, which is the time period required by the cumulative discounted cash flows to return the initial investment, is used. The DPP can be calculated using Equation (8) to find the discounted cash flow and using Equation (9) to find the time period to return the investment [36].
where
- = Rate of interest to determine the present value of the future cash flow;
- = Period to which the cash inflow relates;
- = Last period with a negative discounted cumulative cash flow;
- = Absolute value of the discounted cumulative cash flow at the end of period A;
- = Discounted cash flow during the period after A.
The net present value (NPV) is the value of a future cash flow over the projected lifespan with the assumption that money in the present has more value than money in the future owing to factors such as inflation. This indicator can be used to indicate the profitability of the project. A positive NPV means that the project in the present value exceeds the cost, which indicates that it is feasible to invest with a return exceeding the anticipated amount. The NPV can be calculated using Equation (10) [37].
where
- = Net cash inflow during the period t;
- = Total initial investment costs;
- = The number of time periods;
- = Discounted rate.
The IRR is another indicator that is used to estimate the profitability of potential investments. It is the discount rate that makes the present value of all expected future cash flows equal to zero. This means that the discounted rate that causes the NPV, which is the difference between the present value cash inflow and outflow, is zero. This indicator can be calculated by solving Equation (11) [38].
These three economic indicators (DPP, NPV, and IRR) are the main indexes used in this study to determine the feasibility of the retrofitted building envelope of the case study building with more energy-efficient material.
5.2. Building Envelope Cost
The costs of material and labour for the retrofitted building envelope are summarized in Table 9. The cost data are retrieved from the Comptroller General’s Department (CGD), Ministry of Finance [39]. The table only presents the material and labour costs for the walls, roof, and windows. However, the other aspects that might incur costs such as the building structure, testing engineering, required machines on site, and transportation of manpower and material are not considered. In addition, the demolition expenditure for the old building envelope is not included in the calculation. The study assumes that both the base case and retrofitted case have similar expenditures in those regards. Thus, it does not have an impact on the feasibility of the project. From the data, the reinforced concrete has a higher material and labour cost owing to its composition, which has a steel reinforcement linked with the structural pole and beam of the building. For the transparent material, the better the energy efficiency provided, the higher the cost will become because double glazing has a material cost that is approximately three times higher for the non-low-e coating and seven times higher for the low-e coating compared to that of the single float glass.
The total cost of the material composition for the retrofitted roof and wall sections is presented in Table 10. The calculation of the building envelope cost is corelated to the wall, window and roof type discussed in the energy performance section. From the table, type B wall has the highest cost owing to its composition of a double layer of autoclaved aerated concrete that has a much higher manpower cost compared to that in the single layer case or in the case when gypsum plates are used. The cost per unit of wall types C and D is twice as much of the other case because of the high cost of the fiberglass insulator, and the air gap does not impact the labour or material cost. Roofs A and B have similar labour costs, even though the thickness of the material is different, because the time and manpower needed to install these two types of insulators are the same.
5.3. Economic Result
The results of the economic aspect of retrofitting the building envelope are presented using three economic indicators (DPP, NPV, and IRR) to evaluate the feasibility of the project. The electricity cost in terms of time of use (TOU) tariff is 4.3297 baht per kWh or 0.14 USD per kWh [40]. The interest rate used to calculate the present value in this study is 1.75% according to a forecast of the Bank of Thailand [37]. The maintenance factor for the building envelope, which also includes the deterioration rate of building material, is set to 0.8% per year in this study.
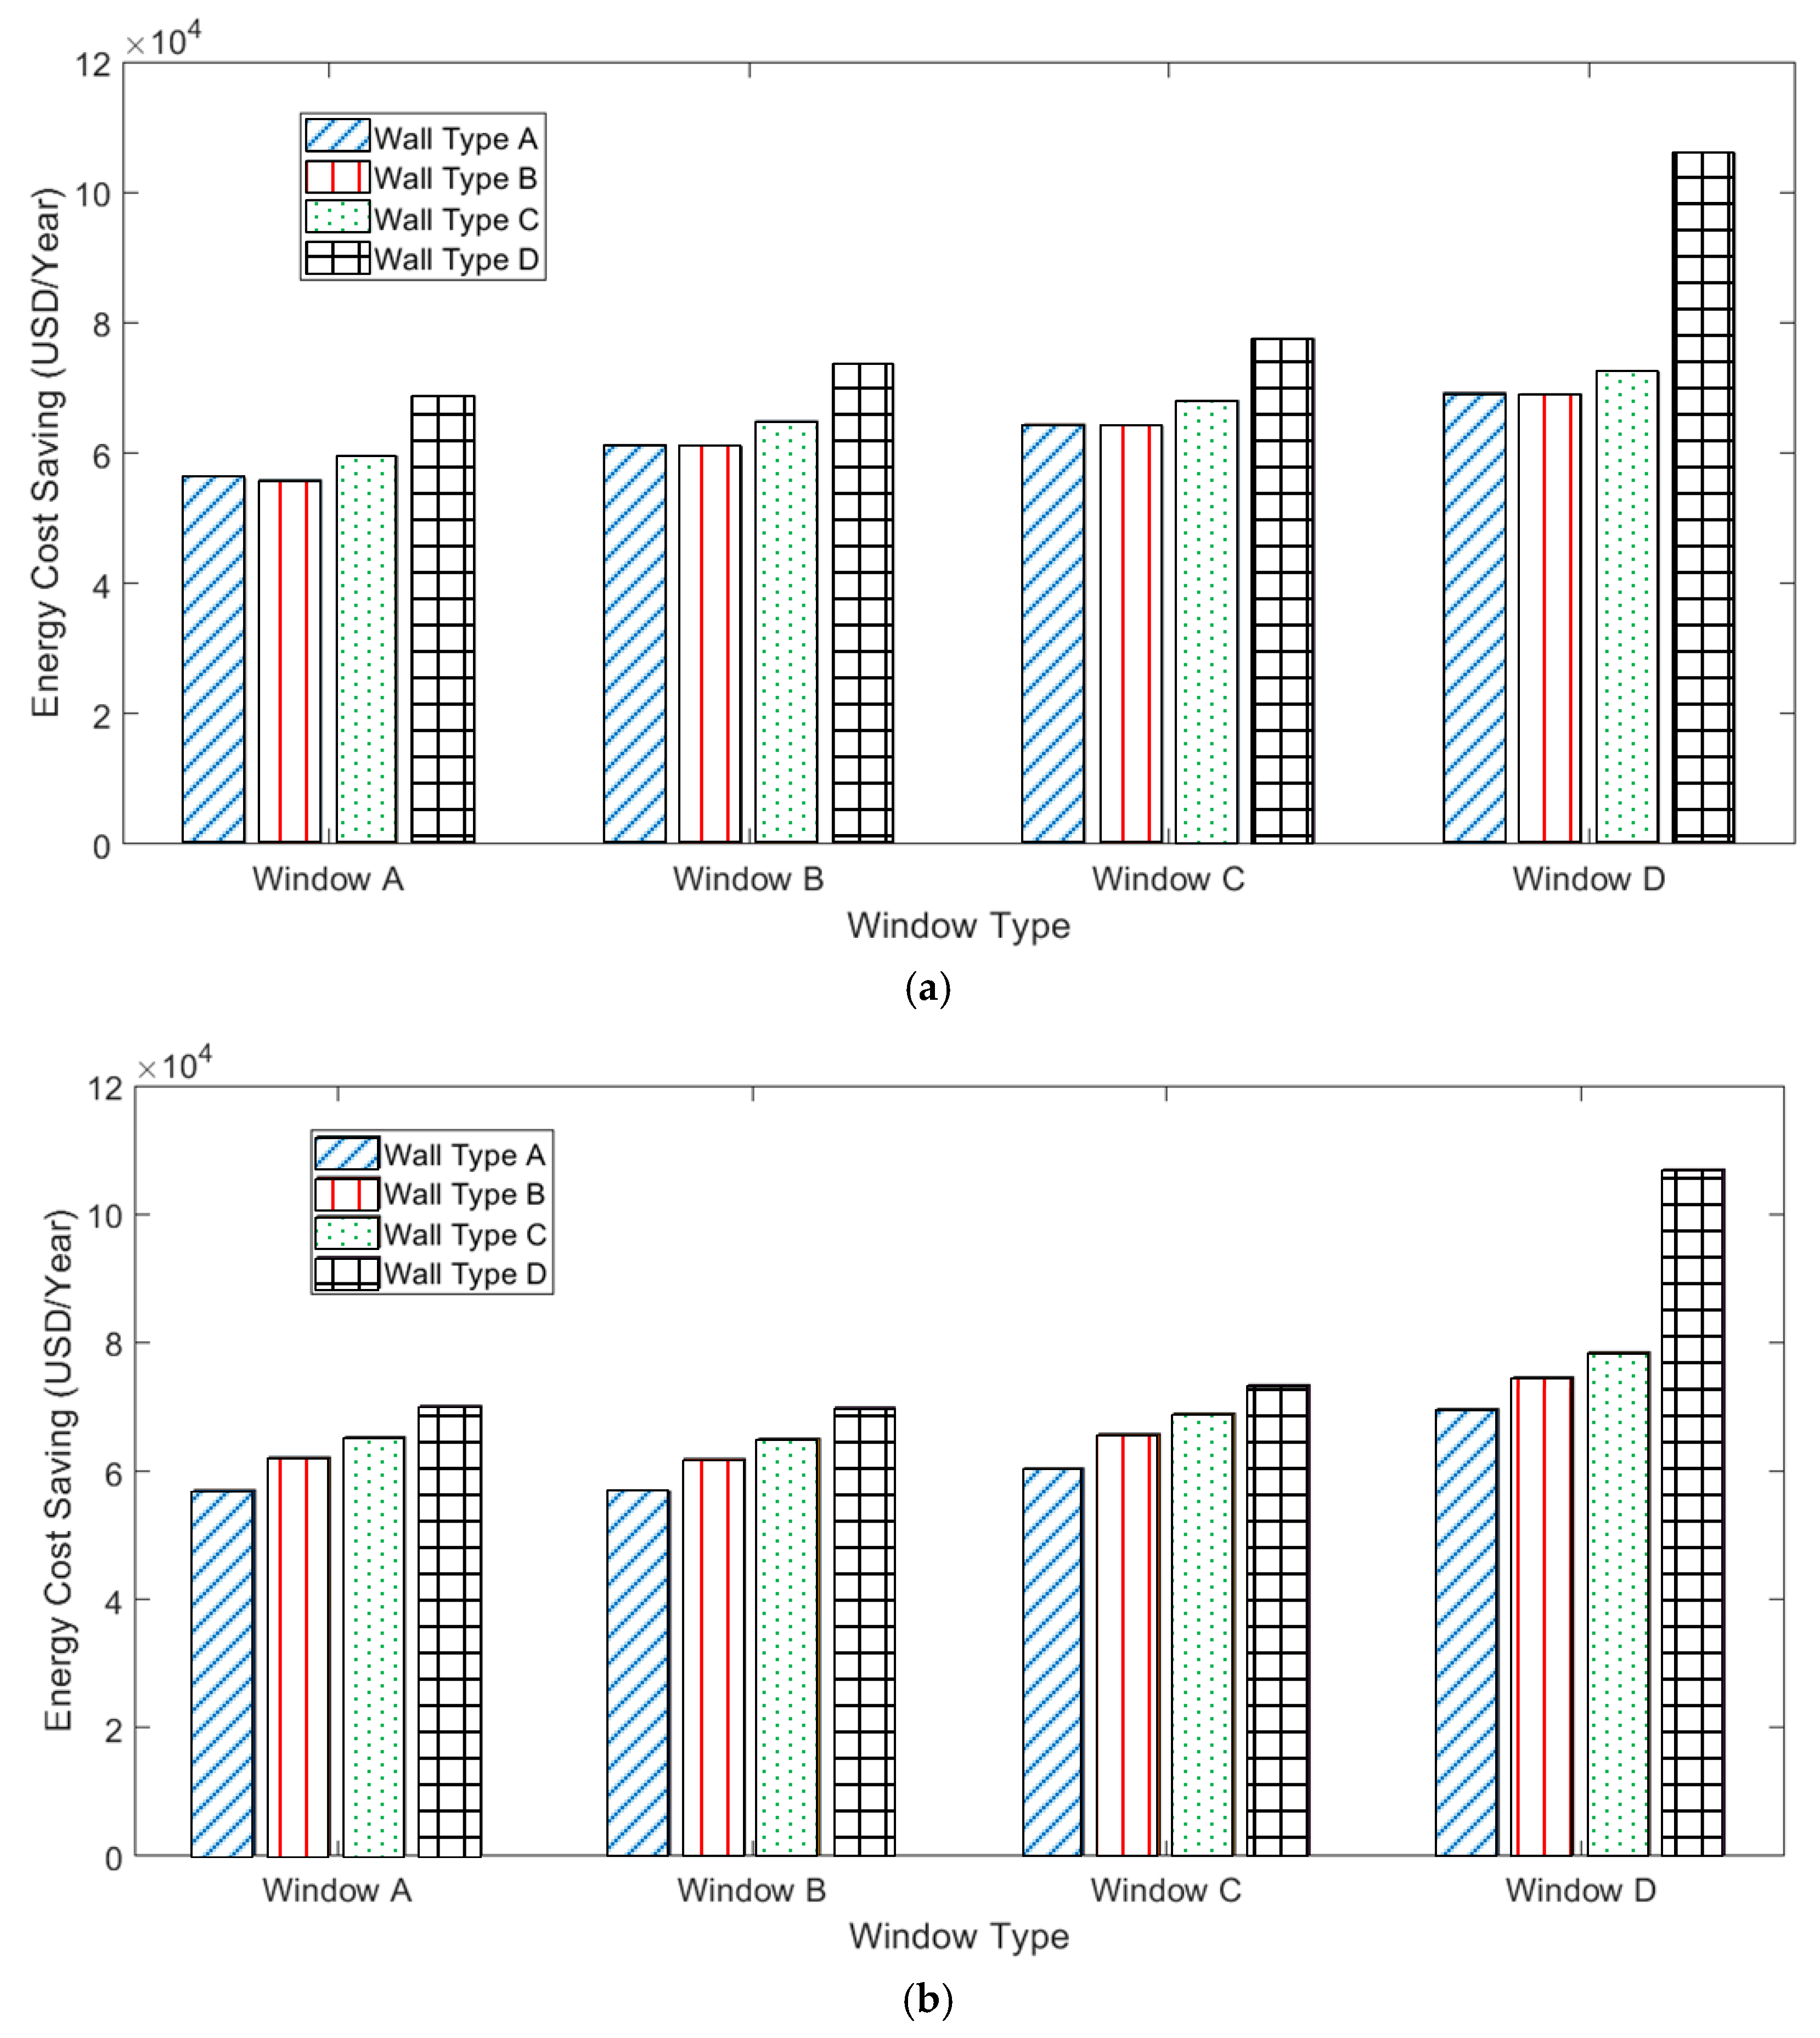
The results from the retrofitted building envelope in terms of saving electricity costs using different wall and window types is illustrated in Figure 5a for the case of roof type A and in Figure 5b for the case of roof type B. Figure 5a shows the electrical energy cost saving by retrofitting the building envelope using roof type A with different wall and window types compared to the base case building. This trend is similar to that of the OTTV and whole-building energy consumption discussed in previous sections in which the cost saving is much higher with a higher efficiency of building materials. Wall type D (fiberglass insulator and air gap) and window D (double-glazed window with low-e coating) can reduce the electricity cost to approximately 105,000 USD per year. In Figure 5b for roof type B, a similar trend can be observed with wall type D and window type D exhibiting the highest energy saving potential. However, the amount of money saved for roof type B is slightly higher than that for roof type A owing to the additional thickness in the fiberglass insulator.
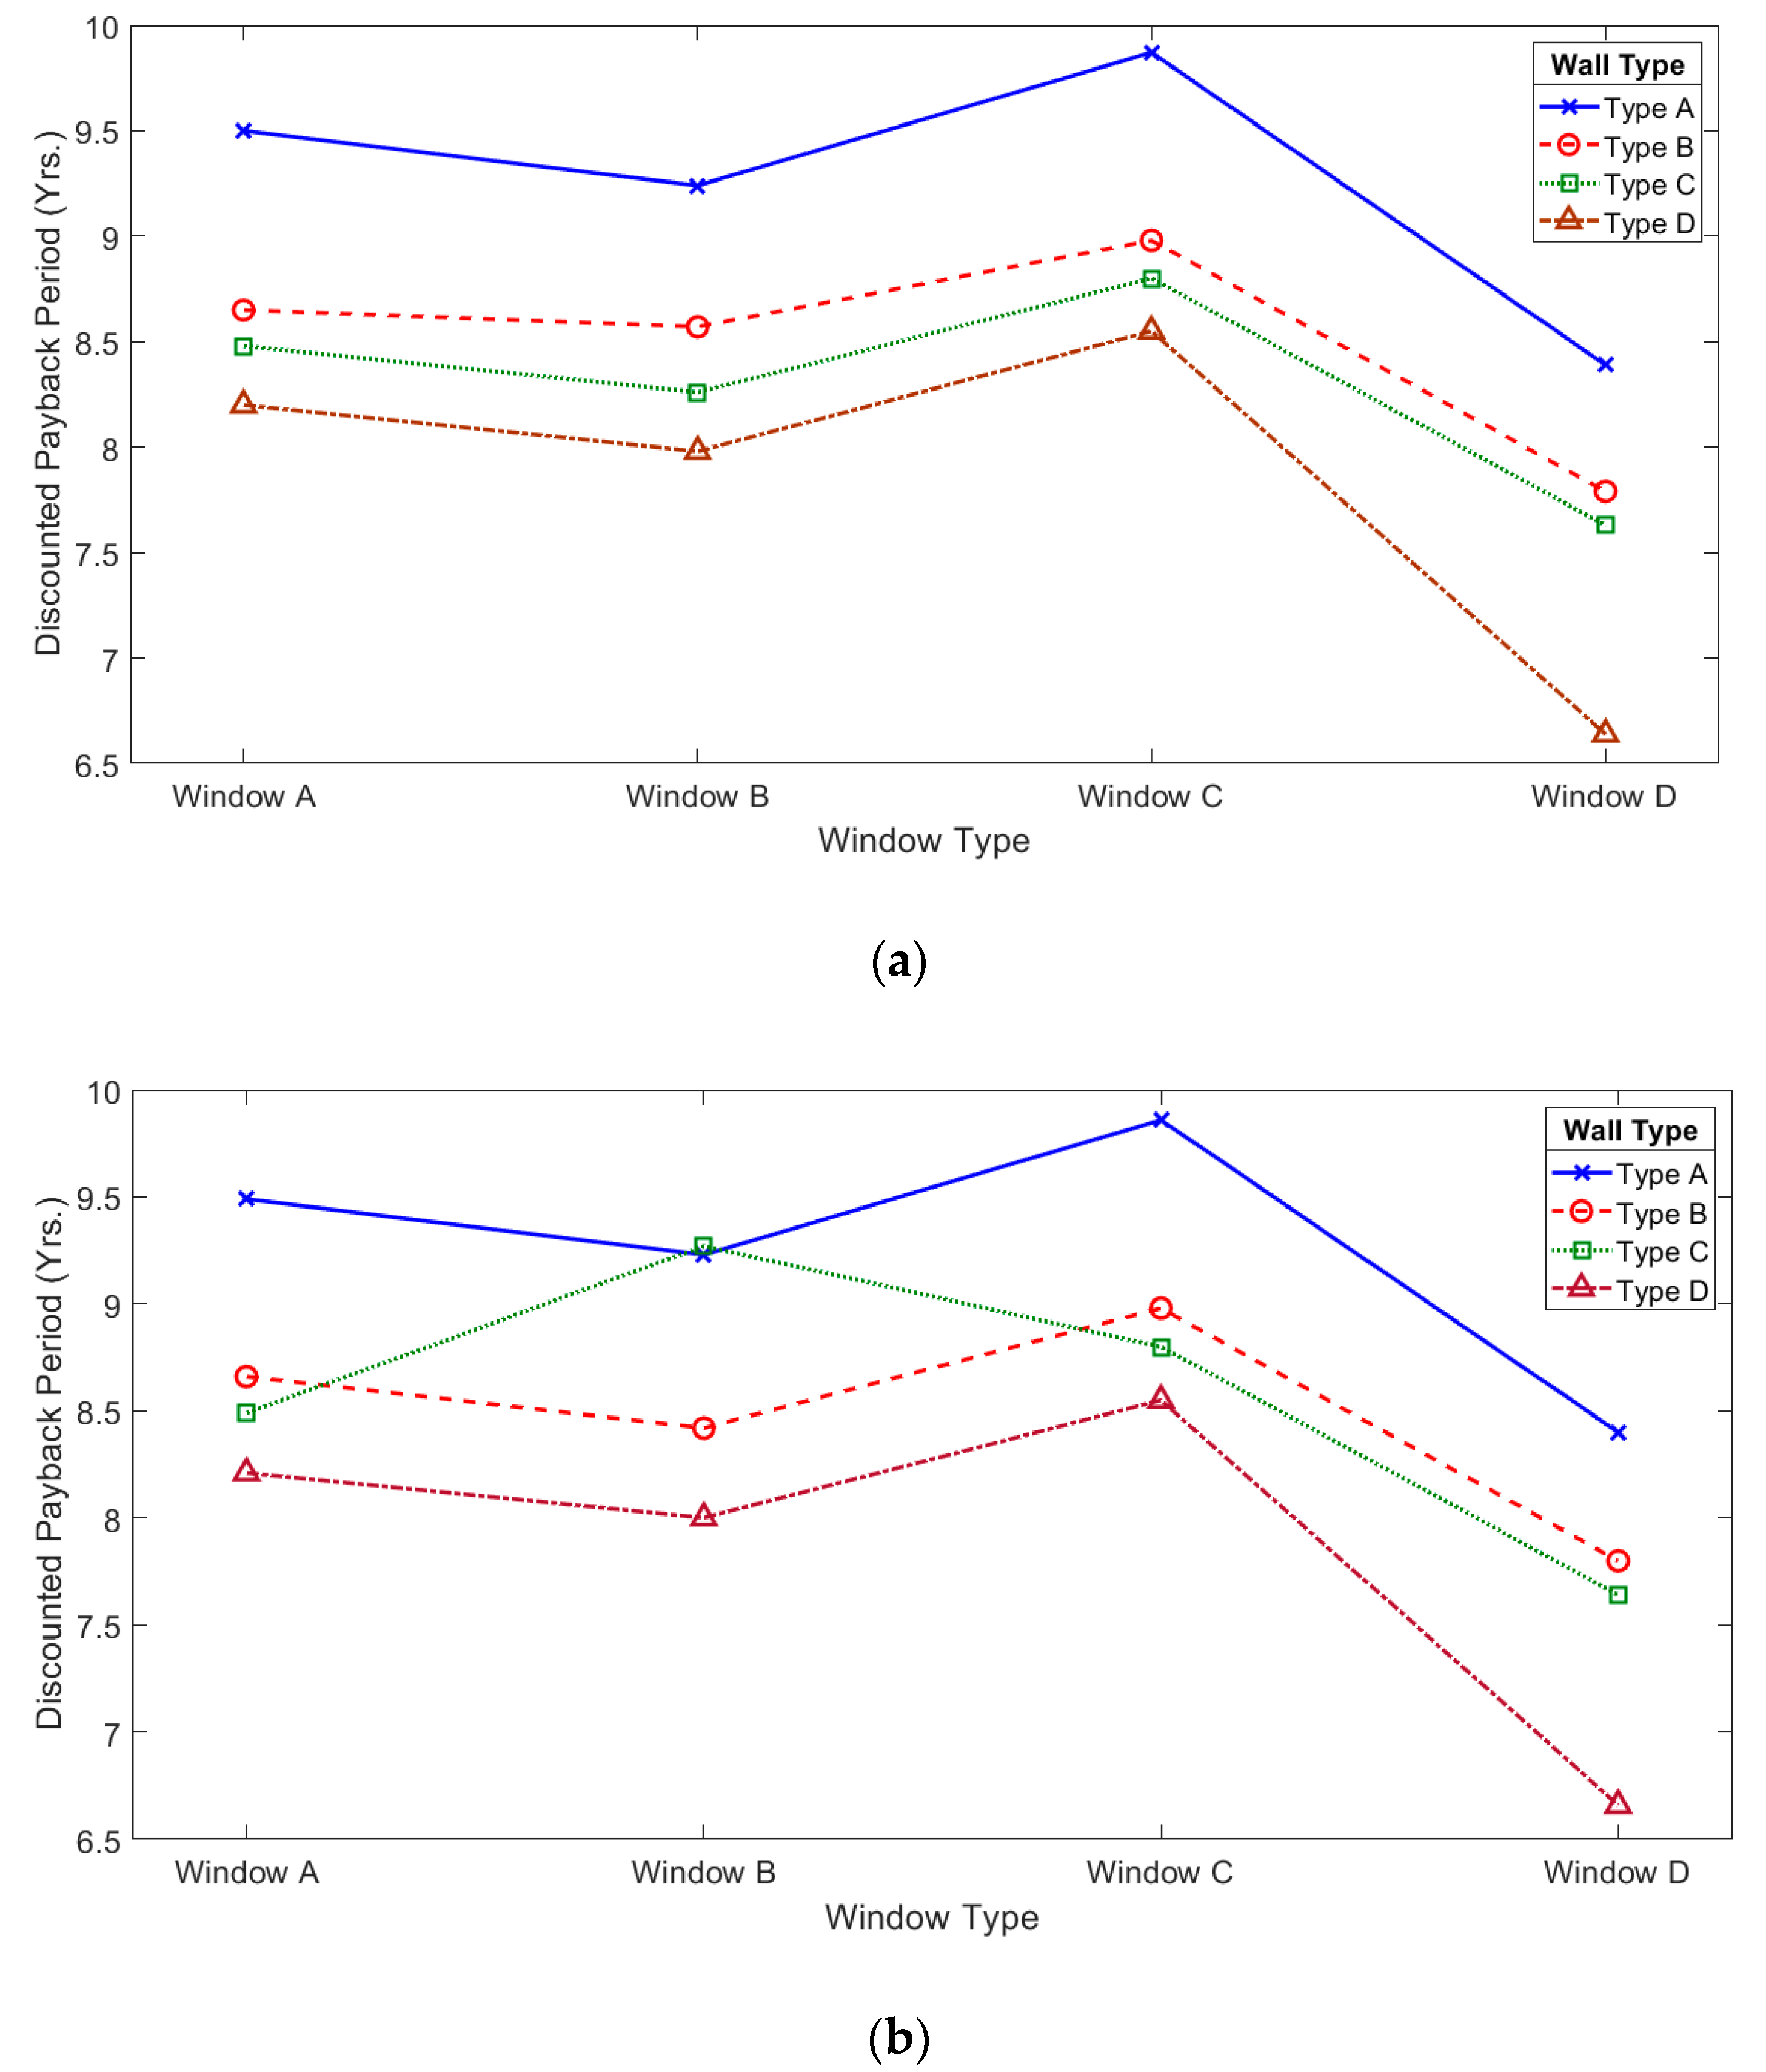
In terms of the economic indicators used to determine the feasibility of the project, the discounted payback periods (DPPs) of the retrofitted building envelope with different wall and window types are summarized in Figure 6.
The finding reveals that the paybacks do not follow a single trend similar to the energy performance. A window retrofitting can achieve a faster return of investment with a higher efficiency window. The high cost of the double-glazed window and low-e coating window does not affect the payback period because of the amount of energy savings. For the retrofitted wall, including an air gap reduces the payback period as seen in wall type B. Wall type C has the longest payback period even though it has a fiberglass insulator and a better energy performance. This is because the price of the fiberglass insulator is very high in comparison with the amount of energy cost that can be reduced. Type D wall has the best payback period even though the fiberglass insulator is present in its composition. The reason is that the combination of the air gap and fiberglass insulator reduces the energy consumption to the lowest level, which has a direct impact on the electricity cost. In the case of the retrofitted roof, the discounted payback period for the different wall and window cases with roof type A are not different compared to those with roof type B. The reason is that roof type B only slightly increases the thickness of the fiberglass insulator above the gypsum plates, which has a higher material price but does not have a significant impact in terms of the economic parameters.
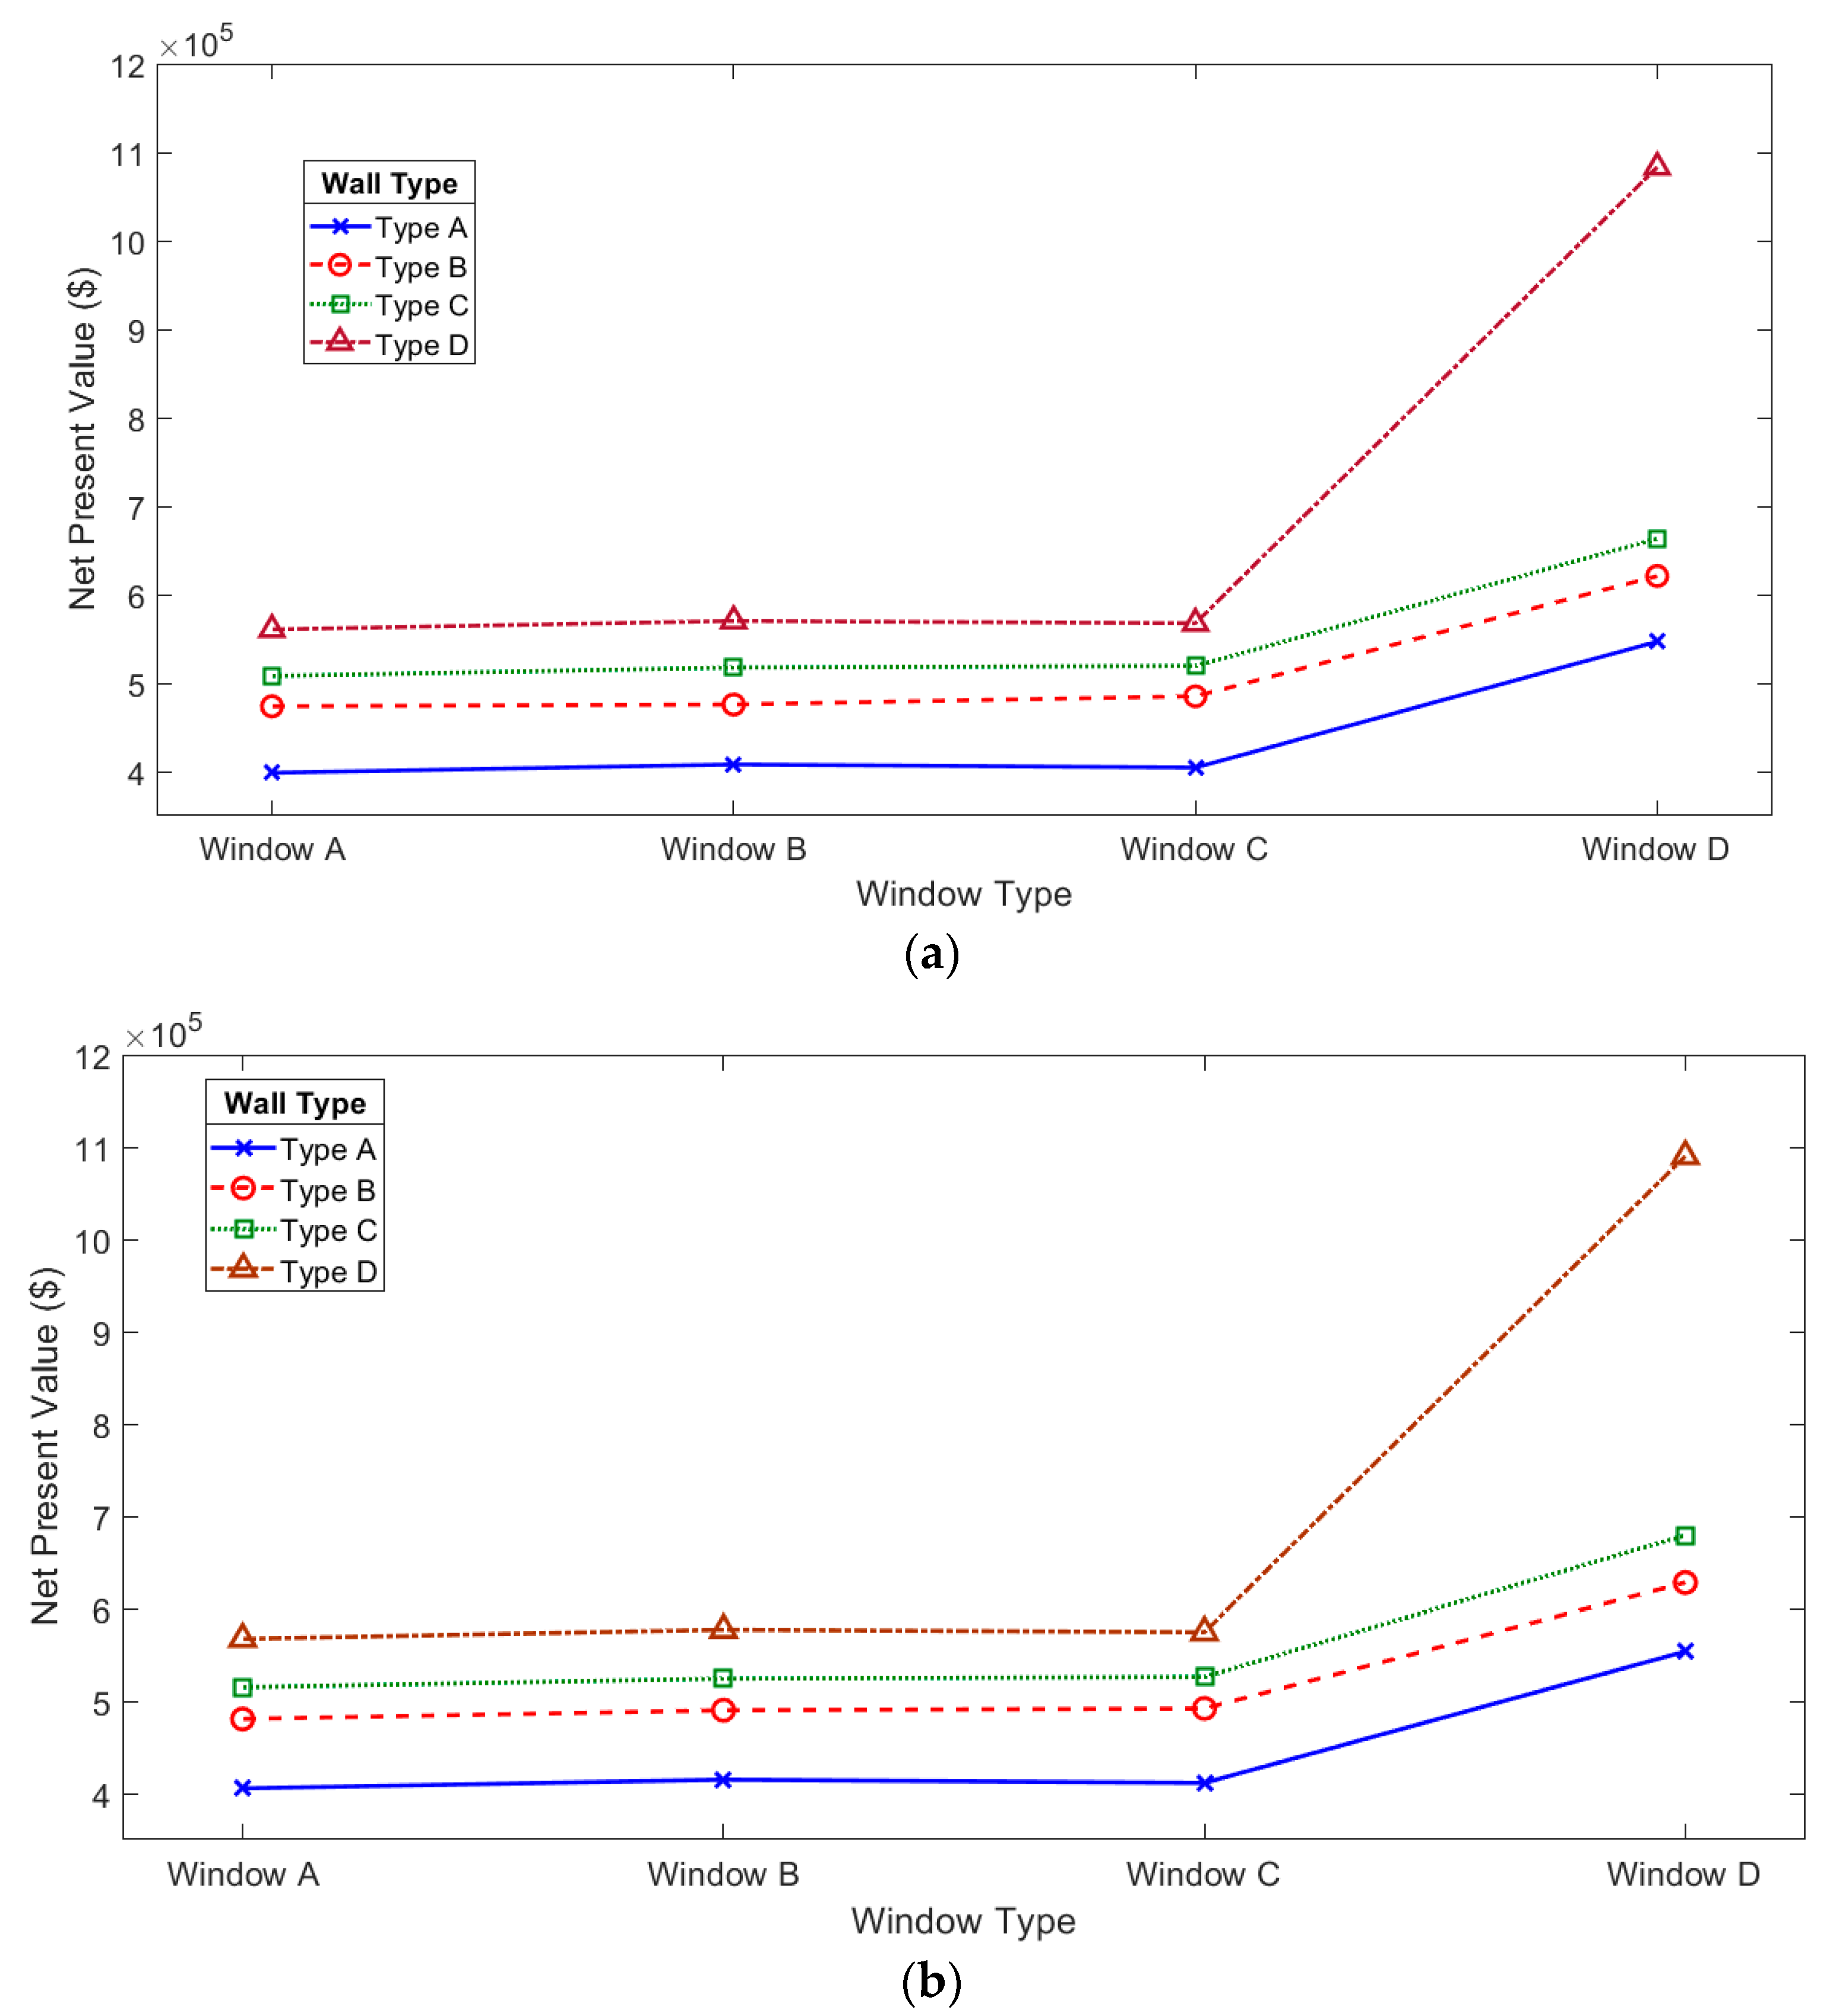
The NPV for the building envelope is shown in Figure 7a for roof type A and Figure 7b for roof type B. These figures reveal that the net present value from the project has a similar trend as the energy performance of the material. Wall type A has the lowest NPV due to the low-energy-efficient material used in the building envelope. This value increases as the wall type is retrofitted with higher energy-efficient materials. However, window types A, B and C show an approximately similar NPV, whereas window D with a double-glazed window see a significant rise in the NPV. Roof type B shows a similar trend to roof type A with a slightly higher NPV due to the higher cash flow gain from increasing the energy saving potential.
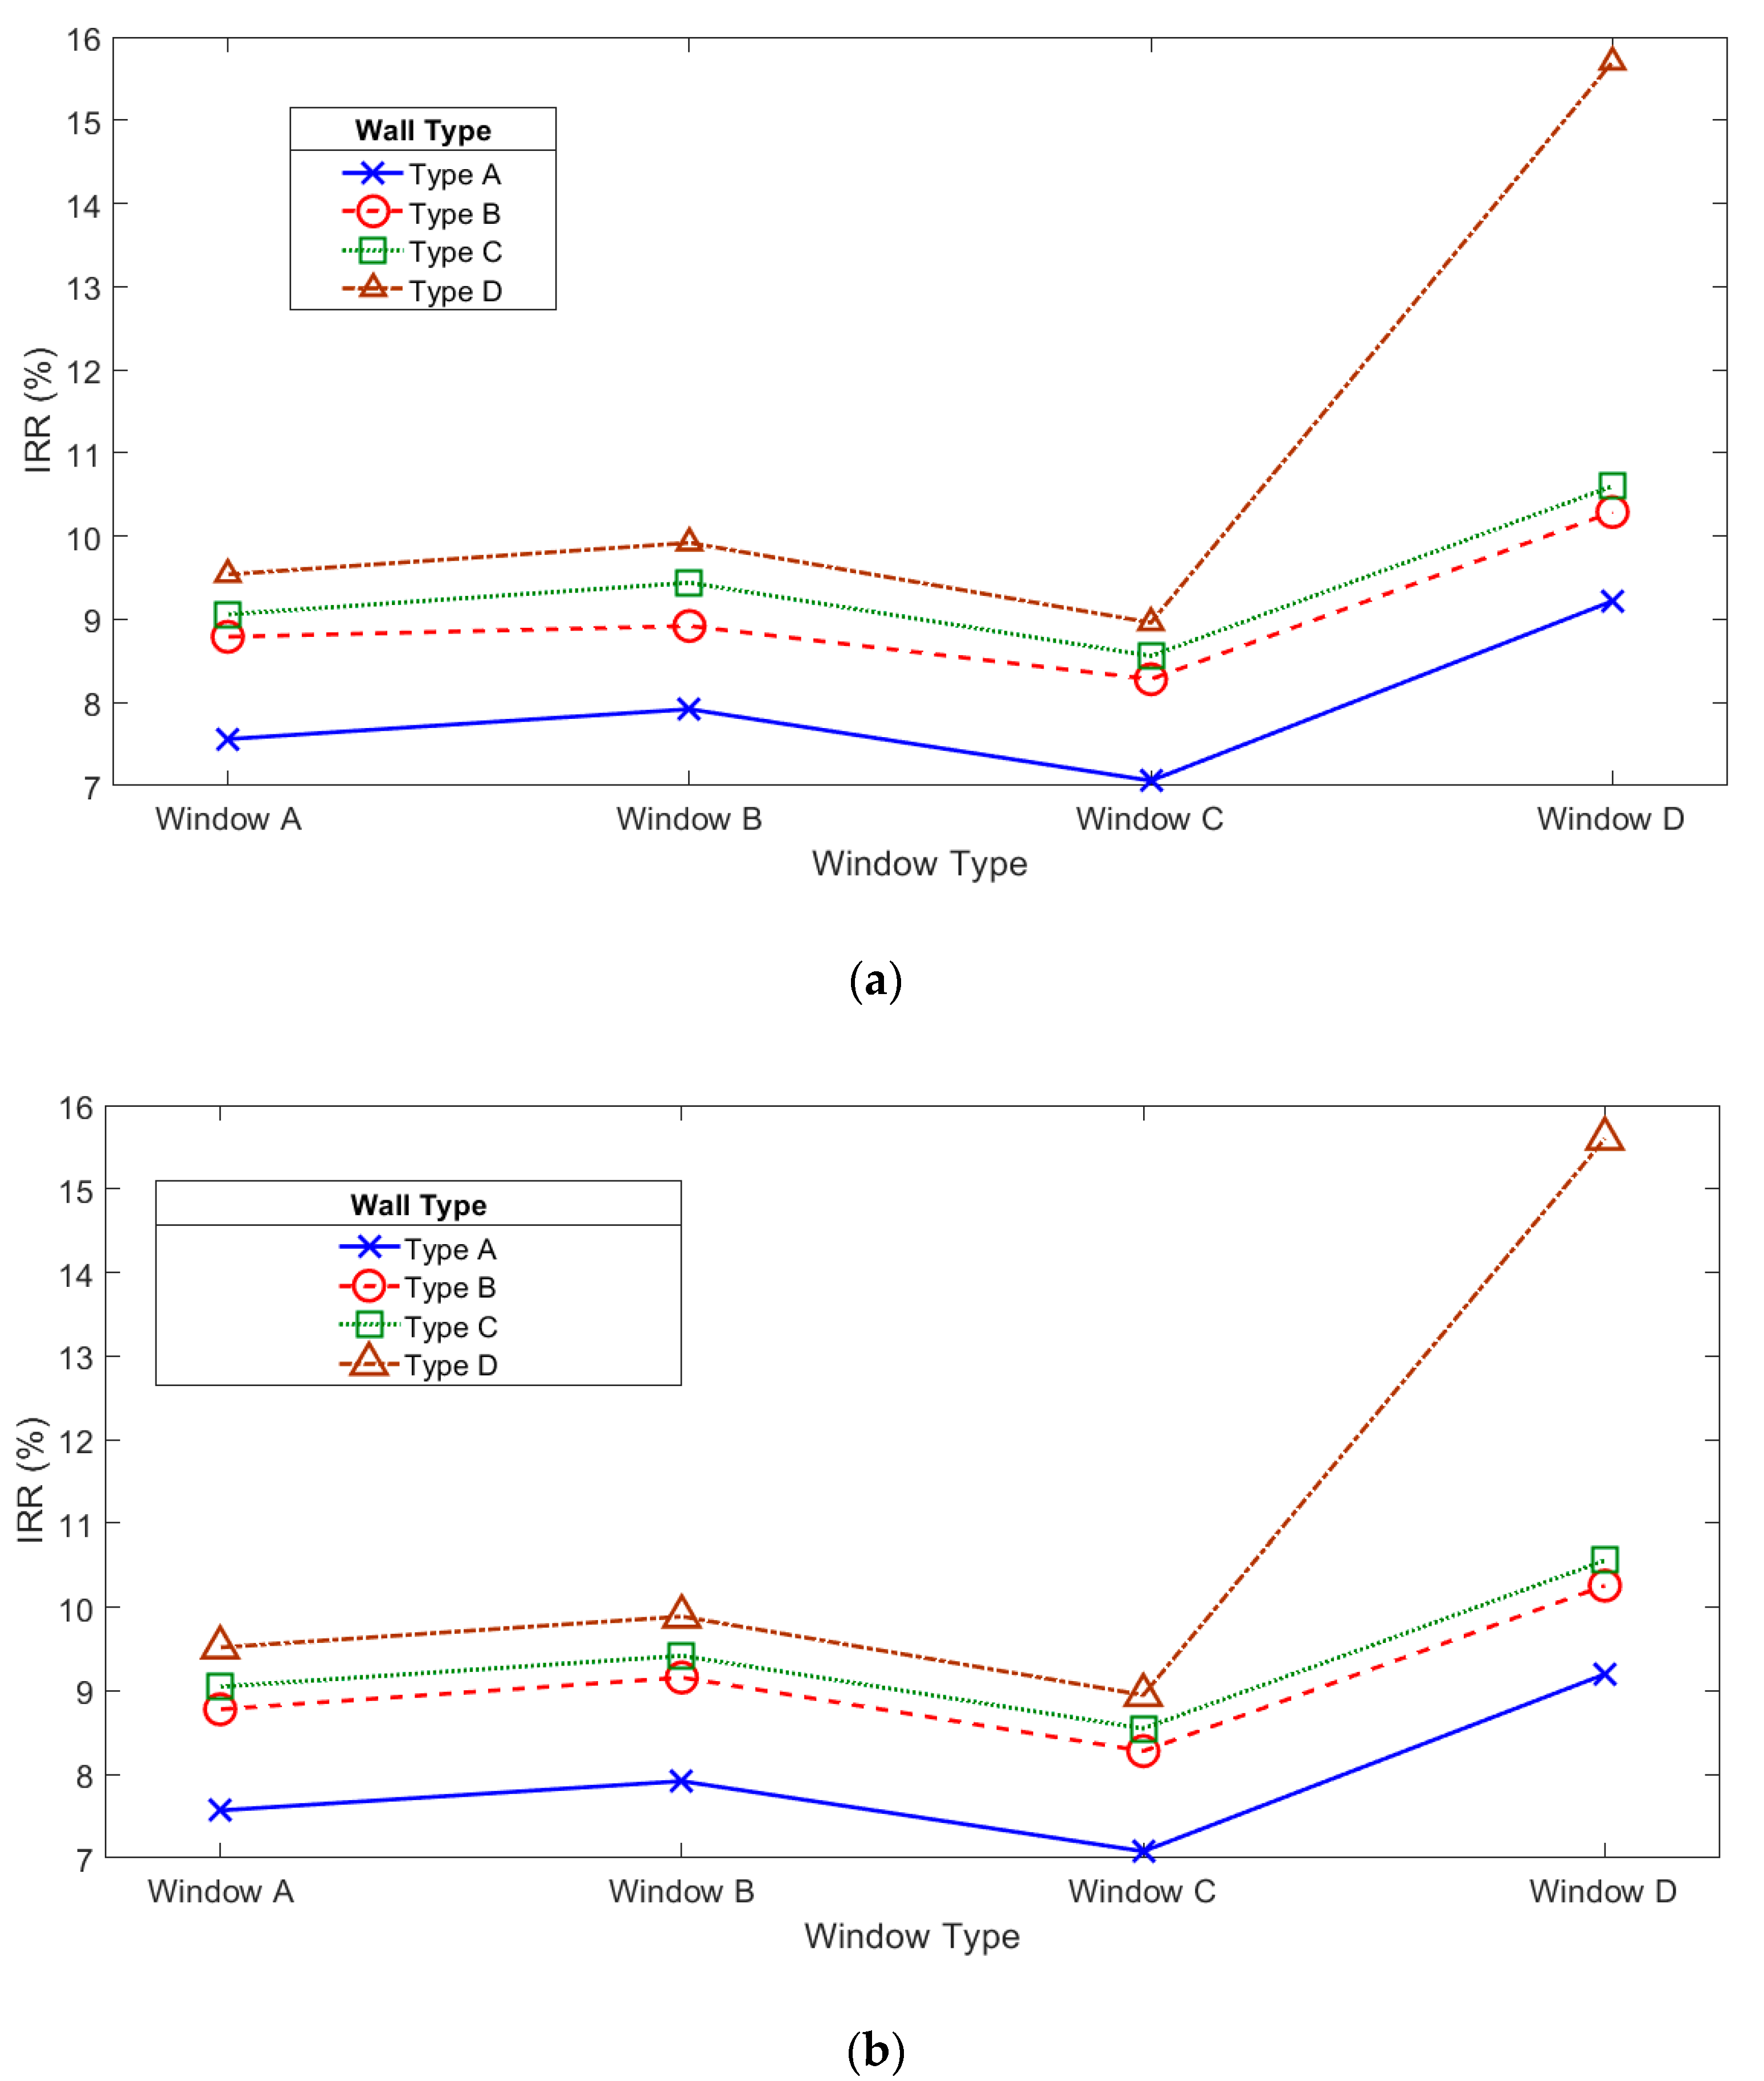
The IRR for the retrofitted case study building envelope using different wall and window types are illustrated in Figure 8a for roof type A and Figure 8b for roof type B. The trend of IRR is similar to that of the discounted payback period and energy performance except in the case of retrofitted wall C with different window types. The IRR value of the retrofitted wall type C is higher than that of types A and B, which contrasts with the discounted payback period data. This indicates that for type C wall, even though the initial investment return is slower, the cost and energy saving potentials are much more feasible than that for wall types A and B. The highest IRR value is for the retrofitted building envelope with window type D and wall type D, which has an IRR value of approximately 15.70%. The IRR value for roof type B is lower than that for roof type A due to the additional thickness of fiberglass insulator that causes the extra material cost. However, it provides less return in terms of energy cost saving compared to the investment that must be made.
From the economic evaluation using economic indicators (DPP, NPV, and IRR), it can be seen that even though using the highest energy-efficient material and composition for the walls and windows (wall type D and window type D) will increase the initial investment cost, the building retrofitted with an energy-efficient envelope can return the investment in less than 10years, with the highest IRR of approximately 15%. Hence, the newly constructed building or retrofitted building envelope must use the highest energy-efficient material and composition to maximize the energy saving potential with a profitable investment.
6. Conclusions
This study presents the energy and economical perspective of a retrofitted building envelope in comparison with Thailand’s building energy code. In the energy aspect, the OTTV, RTTV, and whole-building energy consumption have been used as performance indicators in compliance with Thailand’s building energy code. The results showed that a retrofitted building envelope with energy-efficient material and composition can significantly reduce the energy consumption of the building. The OTTV of the building envelope with an insulator and air gap in the wall composition and double-gazed windows with a low-e coating can be reduced to 31.45 W/m2, which is lower than the standard allowance level of 50 W/m2 for educational institutions. The installation of a fiberglass insulator above the gypsum plates on the roof can reduce the RTTV to 6.3 W/m2 and 4 W/m2 with a double insulator thickness, which is lower than the standard allowance of 15 W/ m2 for educational institutions. The whole building energy consumption of the best retrofitted case is 65% lower than the energy consumption in a standard reference building. In the economical aspect, the DPP, NPV, and IRR values are used to evaluate the feasibility of investing in a building envelope retrofitting project. The results reveal that a building envelope retrofitted with highly efficient material can reduce energy cost, which has a direct impact on the DPP, NPV, and IRR values and the feasibility of the project. The average return of investment is approximately 6–9 years with an IRR value exceeding 7% in most cases, depending on the specification of the materials used in the building envelope. The economic indicator also implied that type A wall and window A must be avoided, even though they have a low initial investment, because their low energy efficiency causes a long-term high energy cost. Better energy-efficient materials such as the fiberglass insulator or double-gazed windows with low-e coating used in type D wall and window D is recommended. Despite having a high material cost, the energy saving potential can provide an attractive feasibility to invest with long-term profitability.
Author Contributions
Conceptualization, P.C.; Formal analysis, P.C. and A.N.; Funding acquisition, P.C.; Investigation, A.N.; Methodology, A.N.; Project administration, P.C.; Resources, A.N.; Writing—original draft, A.N.; Writing—review and editing, P.C.
Funding
This research was funded by Srinakharinwirot University Research fund, Thailand.
Acknowledgments
The authors wish to gratefully acknowledge financial support for this research from the Srinakharinwirot University Research fund, Thailand.
Conflicts of Interest
The authors declare no conflict of interest.
References
- International Energy Agency. Technology Roadmap—Energy Efficient Building Envelopes; International Energy Agency: Paris, France, 2013. [Google Scholar]
- Commercial Buildings Energy Consumption Survey: Energy Usage Summary. 2012. Available online: https://www.eia.gov/consumption/commercial/reports/2012/energyusage/index.php (accessed on 15 July 2019).
- Pérez-Lombard, L.; Ortiz, J.; Pout, C. A review on buildings energy consumption information. Energy Build. 2008, 40, 394–398. [Google Scholar] [CrossRef]
- Ministry of Energy. 20-Year Energy Efficiency Development Plan (2011–2030); Ministry of Energy: Bangkok, Thailand, 2011. [Google Scholar]
- Government Gazette. Energy Conservation Promotion Act, B.E. 2535. 1992, Volume 1. Part 33, 2 April 1992. Available online: https://www.eppo.go.th/images/law/ENG/nation2 (accessed on 17 July 2019).
- Chirarattananon, S.; Chaiwiwatworakul, P.; Hien, V.D.; Rakkwamsuk, P.; Kubaha, K. Assessment of energy savings from the revised building energy code of Thailand. Energy 2010, 35, 1741–1753. [Google Scholar] [CrossRef]
- Climate-Data.org, Bangkok Climate. Available online: https://en.climate-data.org/asia/thailand/bangkok/bangkok-6313/ (accessed on 15 November 2019).
- Pezeshki, Z.; Soleimani, A.; Darabi, A.; Mazinani, S.M. Thermal transport in: Building materials. Constr. Build. Mater. 2018, 181, 238–252. [Google Scholar] [CrossRef]
- Trgala, K.; Pavelek, M.; Wimmer, R. Energy performance of five different building envelope structures using a modified Guarded Hot Box apparatus—Comparative analysis. Energy Build. 2019, 195, 116–125. [Google Scholar] [CrossRef]
- Balaji, N.C.; Mani, M.; Reddy, B.V.V. Dynamic thermal performance of conventional and alternative building wall envelopes. J. Build. Eng. 2019, 21, 373–395. [Google Scholar] [CrossRef]
- Cao, X.; Liu, J.; Cao, X.; Li, Q.; Hu, E.; Fan, F. Study of the thermal insulation properties of the glass fiber board used for interior building envelope. Energy Build. 2015, 107, 49–58. [Google Scholar] [CrossRef]
- Zhang, T.; Yang, H. Heat transfer pattern judgment and thermal performance enhancement of insulation air layers in building envelopes. Appl. Energy 2019, 250, 834–845. [Google Scholar] [CrossRef]
- Favoino, F.; Jin, Q.; Overend, M. Design and control optimisation of adaptive insulation systems for office buildings. Part 1: Adaptive technologies and simulation framework. Energy 2017, 127, 301–309. [Google Scholar] [CrossRef]
- Jin, Q.; Favoino, F.; Overend, M. Design and control optimisation of adaptive insulation systems for office buildings. Part 2: A parametric study for a temperate climate. Energy 2017, 127, 634–649. [Google Scholar] [CrossRef]
- Cui, H.; Overend, M. A review of heat transfer characteristics of switchable insulation technologies for thermally adaptive building envelopes. Energy Build. 2019, 199, 427–444. [Google Scholar] [CrossRef]
- Cuce, E.; Cuce, P.M. Vacuum glazing for highly insulating windows: Recent developments and future prospects. Renew. Sustain. Energy Rev. 2016, 54, 1345–1357. [Google Scholar] [CrossRef]
- Fang, Y.; Arya, F. Evacuated glazing with tempered glass. Sol. Energy 2019, 183, 240–247. [Google Scholar] [CrossRef]
- Sun, Y.; Wilson, R.; Wu, Y. A Review of Transparent Insulation Material (TIM) for building energy saving and daylight comfort. Appl. Energy 2018, 226, 713–729. [Google Scholar] [CrossRef]
- Shahin, H.S.M. Adaptive building envelopes of multistory buildings as an example of high performance building skins. Alex. Eng. J. 2019, 58, 345–352. [Google Scholar] [CrossRef]
- Mirrahimi, S.; Mohamed, M.F.; Haw, L.C.; Lukman, N.; Ibrahim, N.; Yusoff, W.F.M.; Aflaki, A. The effect of building envelope on the thermal comfort and energy saving for high-rise buildings in hot–humid climate. Renew. Sustain. Energy Rev. 2016, 53, 1508–1519. [Google Scholar] [CrossRef]
- Khalil, A.A.; Fikry, M.; Abdeaal, W. High technology or low technology for buildings envelopes in residential buildings in Egypt. Alex. Eng. J. 2018, 57, 3779–3792. [Google Scholar] [CrossRef]
- Yousefi, F.; Gholipour, Y.; Yan, W. A study of the impact of occupant behaviors on energy performance of building envelopes using occupants’ data. Energy Build. 2017, 148, 182–198. [Google Scholar] [CrossRef]
- Belazi, W.; Ouldboukhitine, S.E.; Chateauneuf, A.; Bouchair, A. Uncertainty analysis of occupant behavior and building envelope materials in office building performance simulation. J. Build. Eng. 2018, 19, 434–448. [Google Scholar] [CrossRef]
- Aslani, A.; Bakhtiar, A.; Akbarzadeh, M.H. Energy-efficiency technologies in the building envelope: Life cycle and adaptation assessment. J. Build. Eng. 2019, 21, 55–63. [Google Scholar] [CrossRef]
- Zigart, M.; Lukman, R.K.; Premrov, M.; Leskovar, V.Z. Environmental impact assessment of building envelope components for low-rise buildings. Energy 2018, 163, 501–512. [Google Scholar] [CrossRef]
- Výskala, M. Investment Costs of the Building Envelope Reconstructions. J. Built Environ. 2014, 2, 17–25. [Google Scholar] [CrossRef] [Green Version]
- Darwish, I.E.; Gomaa, M. Retrofitting strategy for building envelopes to achieve energy efficiency. Alex. Eng. J. 2017, 56, 579–589. [Google Scholar] [CrossRef] [Green Version]
- Rodrigues, E.; Fernandes, S.; Gaspar, A.R.; Gomes, A.; Costa, J.J. Thermal transmittance effect on energy consumption of Mediterranean buildings with different thermal mass. Appl. Energy 2019, 252, 1134–1137. [Google Scholar] [CrossRef]
- Bano, F.; Sehgal, V. Evaluation of energy-efficient design strategies: Comparison of the thermal performance of energy-efficient office buildings in composite climate, India. Sol. Energy 2018, 176, 506–519. [Google Scholar] [CrossRef]
- Modrego, N.C.; Modrego, M.G. Energy retrofit of an existing affordable building envelope in Spain, case study. Sustain. Cities Soc. 2019, 44, 395–405. [Google Scholar] [CrossRef]
- Ali, H.; Hashlamun, R. Envelope retrofitting strategies for public school buildings in Jordan. J. Build. Eng. 2019, 25, 1008–1019. [Google Scholar] [CrossRef]
- Tummu, P.; Chirarattananon, S.; Hien, V.D.; Chaiwiwatworakul, P.; Rakkwamsuk, P. Formulation of an OTTV for walls of bedroom in Thailand. Appl. Therm. Eng. 2017, 113, 334–344. [Google Scholar] [CrossRef]
- Chirarattananon, S.; Limmeechokchai, B. A new building energy-efficiency law in Thailand: Impact on new buildings. Energy 1994, 19, 269–278. [Google Scholar] [CrossRef]
- Chirarattananon, S.; Taveekun, J. An OTTV-based energy estimation model for commercial buildings in Thailand. Energy Build. 2004, 36, 680–689. [Google Scholar] [CrossRef]
- Assawamartbunlue, K. An Investigation of Cooling and Heating Degree-Hours in Thailand. J. Clean Energy Technol. 2013, 1, 87–90. [Google Scholar] [CrossRef] [Green Version]
- Goel, S. Capital Budgeting Appraisal Methods. In Capital Budgeting, 1st ed.; Business Expert Press, LLC.: New York, NY, USA, 2015; pp. 63–88. [Google Scholar]
- Peterson, P.P.; Fabozzi, F.J. Net Present Value Technique. In Capital Budgeting: Theory and Practice; John Wiley & Sons, Inc.: New York, NY, USA, 2002; pp. 72–78. [Google Scholar]
- Comptroller General’s Department. Material and Labour Cost for Fiscal Year 2562 B.E; Comptroller General’s Department: Bangkok, Thailand, 2018. [Google Scholar]
- Electricity Tariffs Large General Service. Available online: https://www.mea.or.th/en/profile/109/114 (accessed on 15 July 2019).
- Interest Rates in Financial Market (2005-Present). Available online: https://www.bot.or.th/App/BTWS_STAT/statistics/BOTWEBSTAT.aspx?reportID=223&language=ENG (accessed on 15 July 2019).
Figure 1.
Case study building.

Figure 2.
The plan of case study building. (a) Floor plan, (b) Roof plan.

Figure 3.
Whole building energy consumption for the case study building envelope using the base case roof.
Figure 3.
Whole building energy consumption for the case study building envelope using the base case roof.

Figure 4.
Energy performance of the case study building envelope using different types of roofs. (a) Roof thermal transfer value (RTTV); (b) Whole building energy consumption.
Figure 4.
Energy performance of the case study building envelope using different types of roofs. (a) Roof thermal transfer value (RTTV); (b) Whole building energy consumption.

Figure 5.
Electricity cost savings for different retrofits with different roof types. (a) Roof type A; (b) Roof type B.
Figure 5.
Electricity cost savings for different retrofits with different roof types. (a) Roof type A; (b) Roof type B.

Figure 6.
Discounted payback period for retrofitted envelopes. (a) Roof type A; (b) Roof type B.

Figure 7.
Net present value (USD) for the retrofitted envelope. (a) Roof type A; (b) Roof type B.

Figure 8.
Internal rate of return for the retrofitted envelope. (a) Roof type A; (b) Roof type B.


Table 1.
Standard values of energy efficiency in building envelopes.
| Building Type | OTTV (watt/sq. mm.) | RTTV (watt/sq. mm.) |
|---|---|---|
| Office and Educational Institution | ≤50 | ≤15 |
| Department Store, Conference Centre | ≤40 | ≤12 |
| Hotel, Hospital and Apartment | ≤30 | ≤10 |
Table 2.
The total area of the walls, windows, and roof of the case study building.
| Envelope Direction | Type | Area (m2) | Window-to-Wall Ratio |
|---|---|---|---|
| South | Wall | 724.73 | 0.29 |
| Window | 279.28 | ||
| North | Wall | 608.59 | 0.01 |
| Window | 48.04 | ||
| West | Wall | 807.09 | 0.28 |
| Window | 310.71 | ||
| East | Wall | 421.23 | 0.09 |
| Window | 78.23 | ||
| Roof | 907.28 | - | |
Table 3.
The thermal properties of the opaque materials used in the case study building envelope.
| Material | Thermal Conductivity (W/m·K) | Density (kg/m3) | Specific Heat (kJ/kg·K) |
|---|---|---|---|
| Concrete plaster | 0.72 | 1860 | 0.84 |
| Autoclaved aerated concrete | 0.476 | 1280 | 0.84 |
| Gypsum plates | 0.282 | 800 | 1.09 |
| Fiberglass insulation | 0.033 | 32 | 0.96 |
| Reinforced concrete | 1.442 | 2400 | 0.92 |
Table 4.
The thermal properties of air gaps.
| Types | Thickness (m) | Air Gap Resistance (m2·C/W) | |
|---|---|---|---|
| Air gap (wall) | High radiation level | 0.1 | 0.16 |
| Low radiation level | 0.1 | 0.606 | |
| Air gap (roof) | High radiation level | 0.1 | 0.174 |
| Low radiation level | 0.1 | 1.423 |
Table 5.
Composition of the opaque materials used for the wall.
| Diagram | Detail | Thickness (m) | U-Value (W/m2·K) | Total Thickness (m) | |
|---|---|---|---|---|---|
| Base case |  | Concrete plaster | 0.01 | 1.634 | 0.22 |
| Autoclaved aerated concrete | 0.2 | ||||
| Concrete plaster | 0.01 | ||||
| Type A |  | Gypsum plates | 0.015 | 0.99 | 0.325 |
| Air gap | 0.1 | ||||
| Autoclaved aerated concrete | 0.2 | ||||
| Concrete plaster | 0.01 | ||||
| Type B |  | Concrete plaster | 0.01 | 1.03 | 0.32 |
| Autoclaved aerated concrete | 0.1 | ||||
| Air gap | 0.1 | ||||
| Autoclaved aerated concrete | 0.1 | ||||
| Concrete plaster | 0.01 | ||||
| Type C |  | Gypsum plates | 0.015 | 0.462 | 0.325 |
| Fiberglass insulation | 0.1 | ||||
| Autoclaved aerated concrete | 0.2 | ||||
| Concrete plaster | 0.01 | ||||
| Type D |  | Gypsum plates | 0.015 | 0.396 | 0.425 |
| Fiberglass insulation | 0.1 | ||||
| Air gap | 0.1 | ||||
| Autoclaved aerated concrete | 0.2 | ||||
| Concrete plaster | 0.01 |
Table 6.
Composition of the opaque materials used for the roof.
| Diagram | Detail | Thickness (m) | U-Value (W/m2·K) | Total Thickness (m) | |
|---|---|---|---|---|---|
| Base case |  | Reinforced concrete | 0.15 | 1.368 | 0.265 |
| Air gap | 0.1 | ||||
| Gypsum plates | 0.015 | ||||
| Roof A |  | Reinforced concrete | 0.15 | 0.445 | 0.315 |
| Air gap | 0.1 | ||||
| Fiberglass insulation | 0.05 | ||||
| Gypsum plates | 0.015 | ||||
| Roof B |  | Reinforced concrete | 0.15 | 0.266 | 0.365 |
| Air gap | 0.1 | ||||
| Fiberglass insulation | 0.1 | ||||
| Gypsum plates | 0.015 |
Table 7.
Thermal properties of the transparent material used in the case study building envelope.
| Material | Composition | Thickness (m) | U-Value (W/m2·K) | SHGC | |
|---|---|---|---|---|---|
| Base case | Clear float glass |  | 0.06 | 5.74 | 0.82 |
| Window A | Ocean green float glass |  | 0.06 | 5.74 | 0.6 |
| Window B | Heat reflective glass |  | 0.06 | 5.16 | 0.54 |
| Window C | Clear float glass and tinted ocean green float glass for outer glass |  | 0.06-0.06-0.06 * | 3.47 | 0.5 |
| Window D | Clear colour single silver low-e coat on ocean green |  | 0.06-0.06-0.06 * | 2.73 | 0.4 |
* Thickness value of double paned glass consists of outer glass-air gap-inner glass.
Table 8.
Overall thermal transfer value (OTTV) values of the case study building envelope.
| OTTV (W/m2) | Base Case | Window A | Window B | Window C | Window D |
|---|---|---|---|---|---|
| Base case | 130.459 | 101.456 | 93.546 | 88.273 | 75.09 |
| Type A | 92.210 | 71.987 | 66.471 | 62.794 | 57.559 |
| Type B | 92.499 | 72.275 | 66.759 | 63.082 | 57.825 |
| Type C | 73.504 | 68.358 | 62.447 | 58.770 | 53.846 |
| Type D | 72.947 | 58.011 | 52.577 | 48.324 | 31.445 |
Table 9.
Labour and material cost for building envelope material.
| Material Name | Cost per Unit (USD/m2) * | Labour Cost per Unit (USD/m2) * | Total Cost (USD/m2) * |
|---|---|---|---|
| Autoclaved aerated concrete (20 cm) | 12.47 | 2.60 | 15.07 |
| Autoclaved aerated concrete (10 cm) | 6.23 | 1.87 | 8.10 |
| Concrete plaster | 4.00 | 2.67 | 6.67 |
| Reinforced concrete | 326.27 | 67.10 | 393.37 |
| Gypsum plates | 10.63 | 2.50 | 13.13 |
| Fiberglass insulator (5 mm) | 8.33 | 0.83 | 9.16 |
| Fiberglass insulator (10 mm) | 16.67 | 0.83 | 17.50 |
| Clear float glass | 6.45 | 0.37 | 6.82 |
| Ocean green float glass | 7.53 | 0.37 | 7.90 |
| Heat reflective glass | 8.60 | 0.37 | 8.97 |
| Clear float glass and tinted ocean green float glass for outer glass | 28.20 | 4.00 | 32.20 |
| Clear colour single silver low-e coat on ocean green | 56.00 | 4.00 | 60.00 |
* The exchange rate is 30 bath per 1 USD.
Table 10.
Labour and material cost for the wall and roof section composition.
| Retrofitted Case | Cost per Unit (USD/m2) * | Labour Cost per Unit (USD/m2) * | Total Cost (USD/m2) * |
|---|---|---|---|
| Wall | |||
| Base case | 20.47 | 7.94 | 28.41 |
| Type A | 27.10 | 7.77 | 34.87 |
| Type B | 20.46 | 9.08 | 29.54 |
| Type C | 43.77 | 8.6 | 52.37 |
| Type D | 43.77 | 8.6 | 52.37 |
| Roof | |||
| Base case | 336.90 | 69.6 | 406.50 |
| Roof A | 345.23 | 70.43 | 415.66 |
| Roof B | 353.57 | 70.43 | 424.00 |
* The exchange rate is 30 bath per 1 USD.
© 2019 by the authors. Licensee MDPI, Basel, Switzerland. This article is an open access article distributed under the terms and conditions of the Creative Commons Attribution (CC BY) license (http://creativecommons.org/licenses/by/4.0/).
Share and Cite
MDPI and ACS Style
Chiradeja, P.; Ngaopitakkul, A. Energy and Economic Analysis of Tropical Building Envelope Material in Compliance with Thailand’s Building Energy Code. Sustainability 2019, 11, 6872. https://0-doi-org.brum.beds.ac.uk/10.3390/su11236872
AMA Style
Chiradeja P, Ngaopitakkul A. Energy and Economic Analysis of Tropical Building Envelope Material in Compliance with Thailand’s Building Energy Code. Sustainability. 2019; 11(23):6872. https://0-doi-org.brum.beds.ac.uk/10.3390/su11236872
Chicago/Turabian StyleChiradeja, Pathomthat, and Atthapol Ngaopitakkul. 2019. "Energy and Economic Analysis of Tropical Building Envelope Material in Compliance with Thailand’s Building Energy Code" Sustainability 11, no. 23: 6872. https://0-doi-org.brum.beds.ac.uk/10.3390/su11236872
Note that from the first issue of 2016, this journal uses article numbers instead of page numbers. See further details here.