Size-Segregated Particulate Matter in a Selected Sports Facility in Poland


1
Safety Engineering Institute, The Main School of Fire Service, Slowackiego Street, 52/54, 01629 Warsaw, Poland
2
Internal Security Institute, The Main School of Fire Service, Slowackiego Street, 52/54, 01629 Warsaw, Poland
*
Author to whom correspondence should be addressed.
Sustainability 2019, 11(24), 6911; https://0-doi-org.brum.beds.ac.uk/10.3390/su11246911
Submission received: 10 October 2019
/
Revised: 29 November 2019
/
Accepted: 2 December 2019
/
Published: 4 December 2019
(This article belongs to the Special Issue Green Technologies in Air Treatment)
Abstract
:The aims of this study were to determine the concentration of particulate matter, analyze the percentage share of four particulate matter subfractions (PM1, PM2.5, PM4, PM10) in TSP (total mass of particulate matter (PM)) in a typical Polish sports hall at different day periods during heating and non-heating seasons, and compare the average daily doses of respirable dust (PM4) for three groups of the sports hall users (pupils, teachers, and athletes). Gravimetric measurements of PM4 and TSP concentrations and optical measurements of the concentrations of five PM fractions (PM1, PM2.5, PM4, PM10, PM100) were conducted for 8 h a day, simultaneously inside and outside the hall, for 20 days each in summer and winter. During training, PM mass was concentrated mainly in coarse particles (PM2.5–100) (summer—55%, winter—35%). Without activity, the main part of PM mass was from fine particles (PM2.5, summer—59%, winter—75%). In summer, PM inside the hall originated mainly from internal sources. In winter, the fine PM concentration was affected by outdoor sources. The daily doses of PM4 for different groups of sports hall users indicate that the health exposure of sports practitioners to PM may be greater than for non-practitioners staying in the same conditions.
1. Introduction
Physical activity is an important factor that affects the quality of life. Systematic movement, such as running, walking, or cycling, undoubtedly brings health benefits [1,2]. Supporters of an active lifestyle, especially those who are residents of large cities, want to avoid polluted urban air usually choose to exercise outside of the city or in fitness centers, gyms, sports halls, and so on. However, they are not aware that the quality of air inside the training room is often worse than outside (i.e., in an atmospheric environment) [3,4].
The health impact of airborne particulate matter (PM) on the users of sports facilities can be multidirectional. The scientific findings of Rundell, Cutrufello, and their team have shown that exposure to PM can cause problems with gas exchange in the lungs and decreases the body’s efficiency by 3–5%. In the case of a high-ranking competition, this may affect their final result [5,6]. Similar research was carried out by Cakmak and his team [7]. Significant relationships between the concentration of some air pollutants (including PM) and blood pressure, heart rate, and lung function were found. In general, increased concentrations of pollutants altered these parameters and, thus, reduced the physical performance of the body. Results of epidemiological studies indicate that both short-term and long-term exposure to high concentrations of PM increases the risks of respiratory, circulatory, and nervous systems diseases [8,9]. People practicing sports under conditions of high PM concentrations are particularly exposed to inflammation of the lower respiratory tract and the accompanying increase of fibrinogen concentration in the blood [10]. Moreover, most of the air reaches the body directly through the mouth during intensive training, which bypasses the natural filtration mechanisms in the upper parts of the respiratory system (nose) where the majority of inhaled PM particles with diameters above 2 μm are retained [11]. The oxygen consumption of the body increases almost three times during physical activity. Therefore, the process of lung ventilation increases. After the start of training, a 2–3-fold increase in lung minute ventilation (VE) and deepening of the breath occurs [12,13]. If the oxygen demand is even higher, the breathing frequency increases (sometimes even 10-fold). Increased breathing means that not only fine (in general, meaning smaller than approx. 2 μm) but also larger particles are transferred into deeper regions of the respiratory tract (i.e., the tracheobronchial or pulmonary parts) [13,14,15]. In people who regularly train, increased breathing intensity occurs not only during training because the oxygen demand in people practicing sports is higher than that in the average person. Due to the above, in people who regularly train, the minute tidal volume is higher in relation to the minute tidal volume of people who do not train. This means that in all conditions, exercising persons will be exposed to more PM, PM-bound substances, and other pollutants than people who do not practice a sport regularly [12,16].
The field studies carried out in this work consisted of simultaneously determining the PM concentration inside the chosen sports facility and in its external environment. The concentrations of PM4 and TSP (total suspended particles) were determined using the gravimetric (reference) method. Concentration of four subfractions—PM1, PM2.5, PM4, and PM10 (i.e., particles with an aerodynamic diameter (da) of not more than 1, 2.5, 4, and 10 μm, respectively) and TSP (total suspended particles, i.e., particles with an aerodynamic diameter (da) of not more than 100 µm) were determined using automatic method. The obtained results were used to:
- determine the differences in the concentrations of PM and the origin of PM inside and outside the sports facility at different times of the day and year,
- determine the differences in size composition of the total mass of PM inside and outside the sports facility,
- examine the possibility of using the results of automatic PM measurements for air quality monitoring in sports facilities and reference the results of concentration measurements for two PM fractions using the automatic method to the standard (reference–gravimetric) method, and
- designate and analyze the daily doses of respirable dust for three groups of people—pupils, physical education teachers, and athletes—who use this type of sports premises.
This is the first work in which the concentrations and selected properties of PM were recognized in a closed sports facility, taking into account the short-term and long-term variability of these parameters and the variability of parameters from the external surroundings of the facility.
2. Materials and Methods
2.1. Sampling Sites
The sports hall (OSiR Targówek) in Warsaw, Poland, was chosen to carry out the concentration measurements of size-segregated particulate matter (Figure 1). It is a two-story, multifunctional facility that allows training in many sports, such as handball, basketball, football, volleyball, table tennis. On the ground floor are a sports hall with a parquet floor (measuring 44 m × 24 m) and washrooms. On the upper floor is an auditorium for 200 persons and offices. Only natural ventilation is used in the building. During working days, the hall is used by students from the neighboring school, and in the afternoons and weekends, the hall is used for training and inter-school competitions [17]. The hall is open from morning (6.00) to evening (22.00), Monday to Sunday, and is systematically frequented by children, adolescents, and adults. The sports hall is located in the Targówek district (52°16′19 N, 21°02′42 E) (Figure 1), which is characterized by low-rise buildings, high traffic (4 streets with a traffic density 27,000–170,000 vehicles/24 h within a radius 1000 m [18]), and developed industrial activities (up to 4 km of heating plants and production of cosmetics and hygiene products).
Measurements were carried out simultaneously inside and outside of the hall in two planned measurement campaigns: 20 consecutive working days during the non-heating period (i.e., in the warm season from May–June 2017) and 20 consecutive working days in the heating season (i.e., in the cold season from October–November 2017).
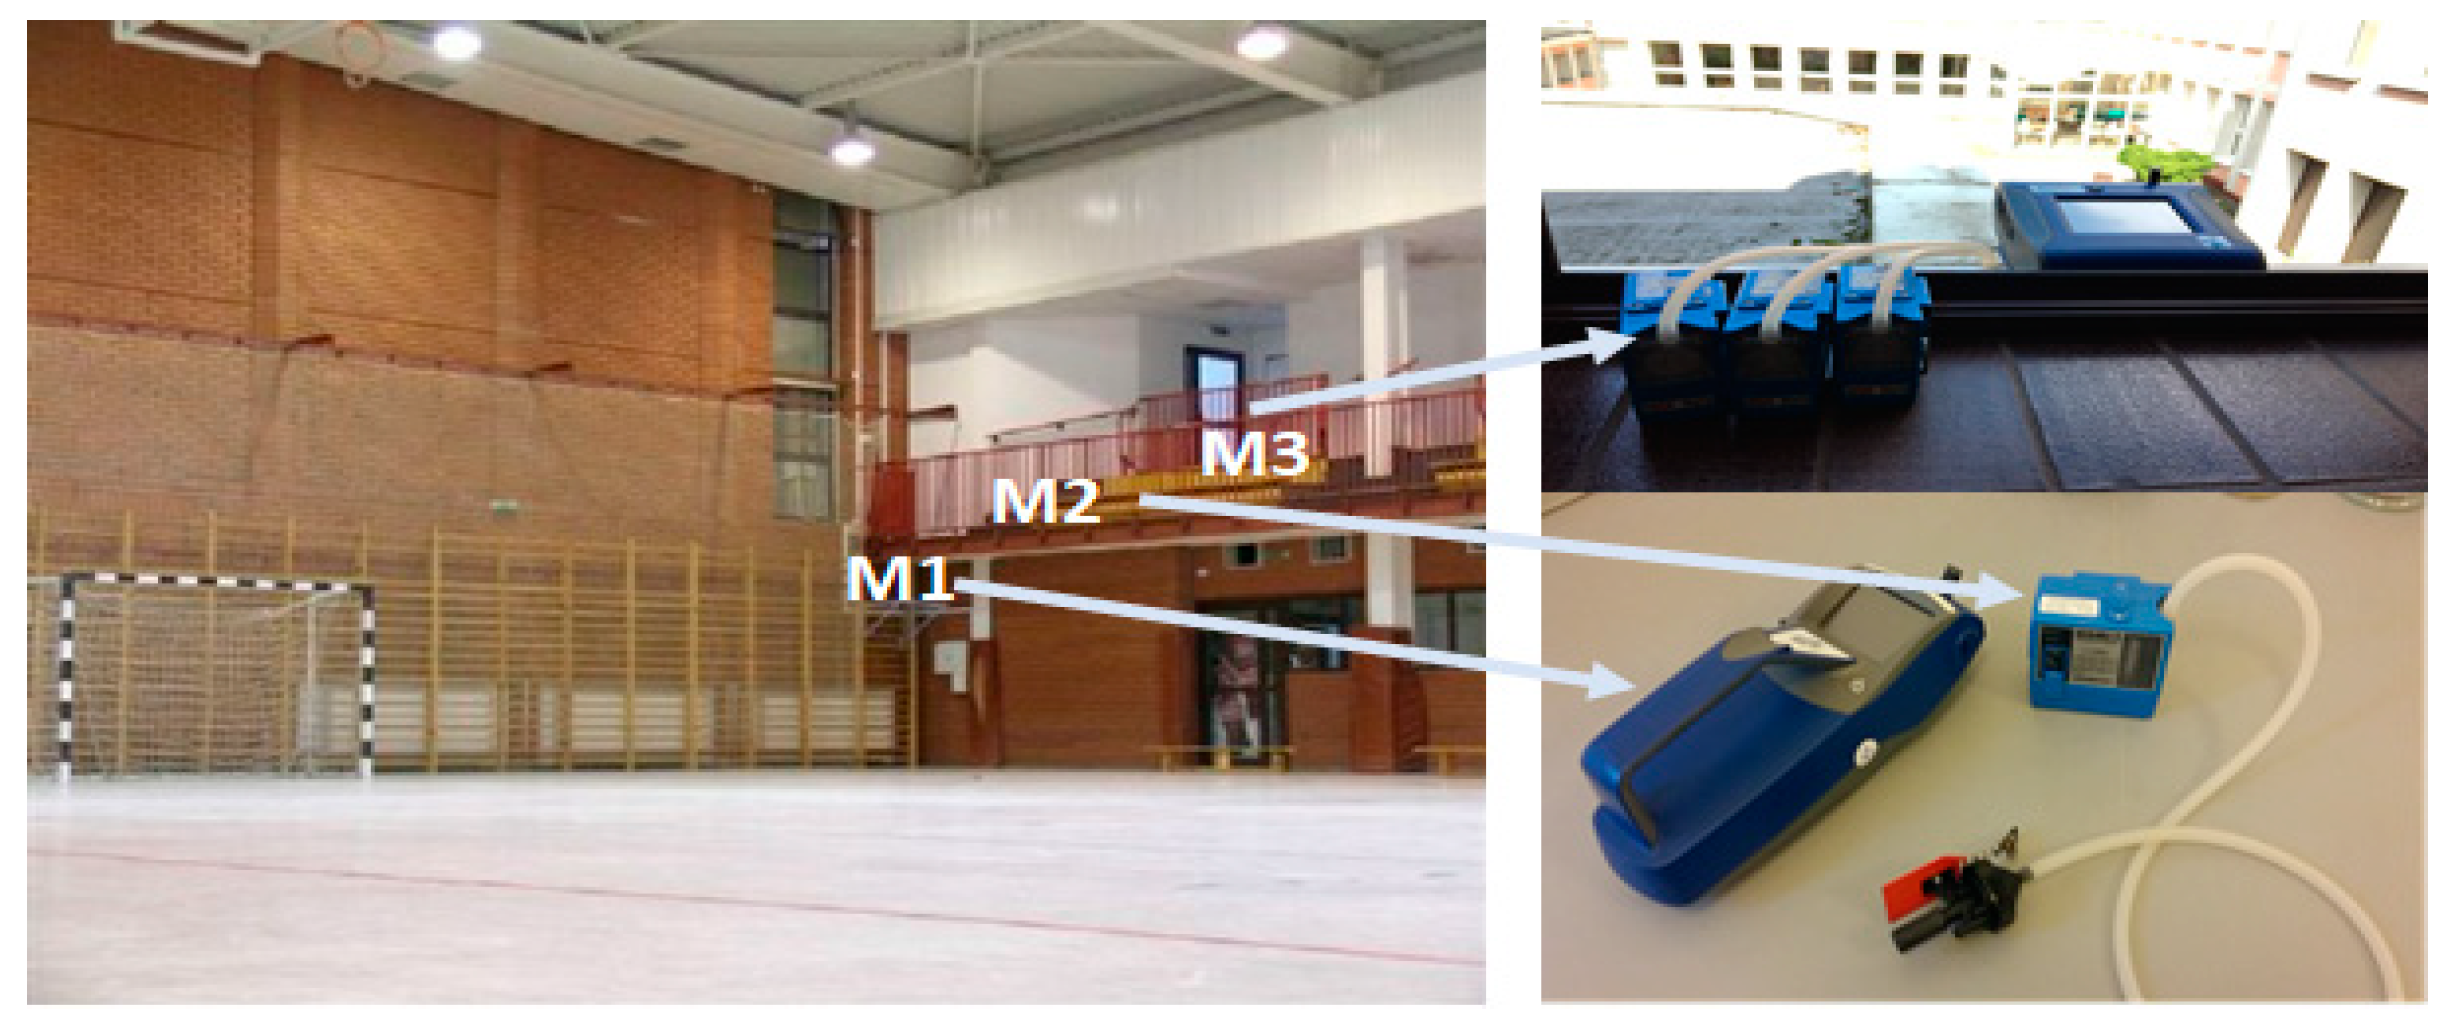
Inside the hall, dust samples were taken at about 1.5 m above the floor, not closer than 2 m to the training people, each time at the same place. Aspirators were placed in such a way that the hanging heads had about 1 m of free space. The optical dust meter was attached to the nearest ladder, and measurements were also carried out at a 1.5 m height with 1 m free space around the device. Outside, the measuring equipment was set on an external windowsill 3 m from the ground surface on the west side of the building on the windowsill closest to the devices, which were set inside the hall (Figure 2).
2.2. Sampling Methods
Indoor and outdoor PM concentration measurements were performed using both the manual (PM4 and TSP) and the automatic method (PM1, PM2.5, PM4, PM10, and TSP (interchangeably referred to as PM100)). Every day of each measurement campaign, the measurement time was 8 h (8.00–16.00). For gravimetric analysis of PM4 and TSP concentrations, dust samples were collected using GilAir 3 aspirators (certified in accordance with PN-EN 1232:2002 standard) and two types of heads, a cyclone for the respirable fraction and a head for collecting total suspended particles [19,20]. The dust of both fractions were collected on glass filters (GF2-025, ø 25 mm, CAT no GF2-025, CHMLAB Group), which were conditioned and weighed in appropriate conditions before the start of the tests. The fiber filters were conditioned in the weighing room (air humidity 45 ± 5%, air temperature 20 ± 2 °C) for 48 h before each weighing. To determine the filter mass, a microbalance weight (MYA 5.3 Y.F, RADWAG, Radom, Poland, resolution of 1 μg) was used. The filters with PM4 and TSP samples were subjected to the same conditioning and weighing procedures. PM concentration was calculated as the ratio of the dust mass on the measurement filter to the volume of filtered air. The total volume of air that passed through the filter, necessary to determine the dust concentration, was read from the electronic time meter of the individual aspirators used for the tests. For the automatic method, a DustTrak 8534 DRX was used inside the sports hall, and a DustTrak 8533 DRX was used outside. These are two identical measurement instruments, calibrated with the same kind of dust (Arizona Road Dust) [21,22]. DustTrak measures allow for simultaneous real-time mass concentration measurements of particulate matter with aerodynamic diameters of 0.1–100 µm in the range of 0.001–150 mg/m3. The accuracy of the sampler is 5%. Aerosol being measured is drawn into the optical chamber in a continuous stream using a pump at a total flow rate of 3 letters/min. 90° laser light shines on the collected air sample. Particles present in the air cause the dispersion and thus the weakening of the luminous flux. Then the light attenuation by PM particles is received by a photodiode. Each particle has an electric pulse proportional to its size. The built-in detector reads the number of particles belonging to individual fractions, calculates them by the appropriate density and amount of airflow. One-minute measurements were carried out, and their results were then averaged for 1 h, the average 8-h measurement was the arithmetic mean of 8 averaged results for each hour of measurements for a particular day. The samplers were calibrated immediately before the measurements (DustTrak 8534 DRX 7 March 2017, DustTrak 8533DRX 13 February 2017) using a standardized dust sample (Arizona Dust, TSI). Zero calibration was performed using a high-efficiency particle air (HEPA) filter before each measurement. Moreover, equivalence tests were carried out between both devices one week before measurements. The tests consisted of simultaneous 8-h measurement of PM mass concentration inside and outside the sports hall in heating and non-heating season. The measurement results were averaged every 3 min. Tests have shown the consistency of results (r = 0.88). Similar tests were carried out for DustTrak and the gravimetric method. The tests were based on Guide to the demonstration of equivalence of ambient air monitoring methods [23] and other studies where DustTrak was used [24,25,26]. Five 8-h simultaneous measurements of PM4 and TSP concentrations were carried out using the optical and gravimetric methods inside and outside the hall, in summer and winter season. Equivalence tests showed that the differences between the concentrations measured by the filter-weight and optical method were less than 25%. The ratio of the averages of the 40-h (5 days) concentrations between the manual and automatic method was then used as the calibration factor for the real-time measurements inside and outside the hall in the summer and winter season (Table 1).
2.3. Results Analysis
Based on 8-h PM concentrations of all fractions (for the gravimetric method—one result from each measurement/day, for the automatic measurements—each day it is the result of averaging 8 results of 1-h concentrations), average (with standard deviation from the mean), minimum, and maximum concentrations in both measurement periods (heating and non-heating) and the central concentration sets (median) were determined.
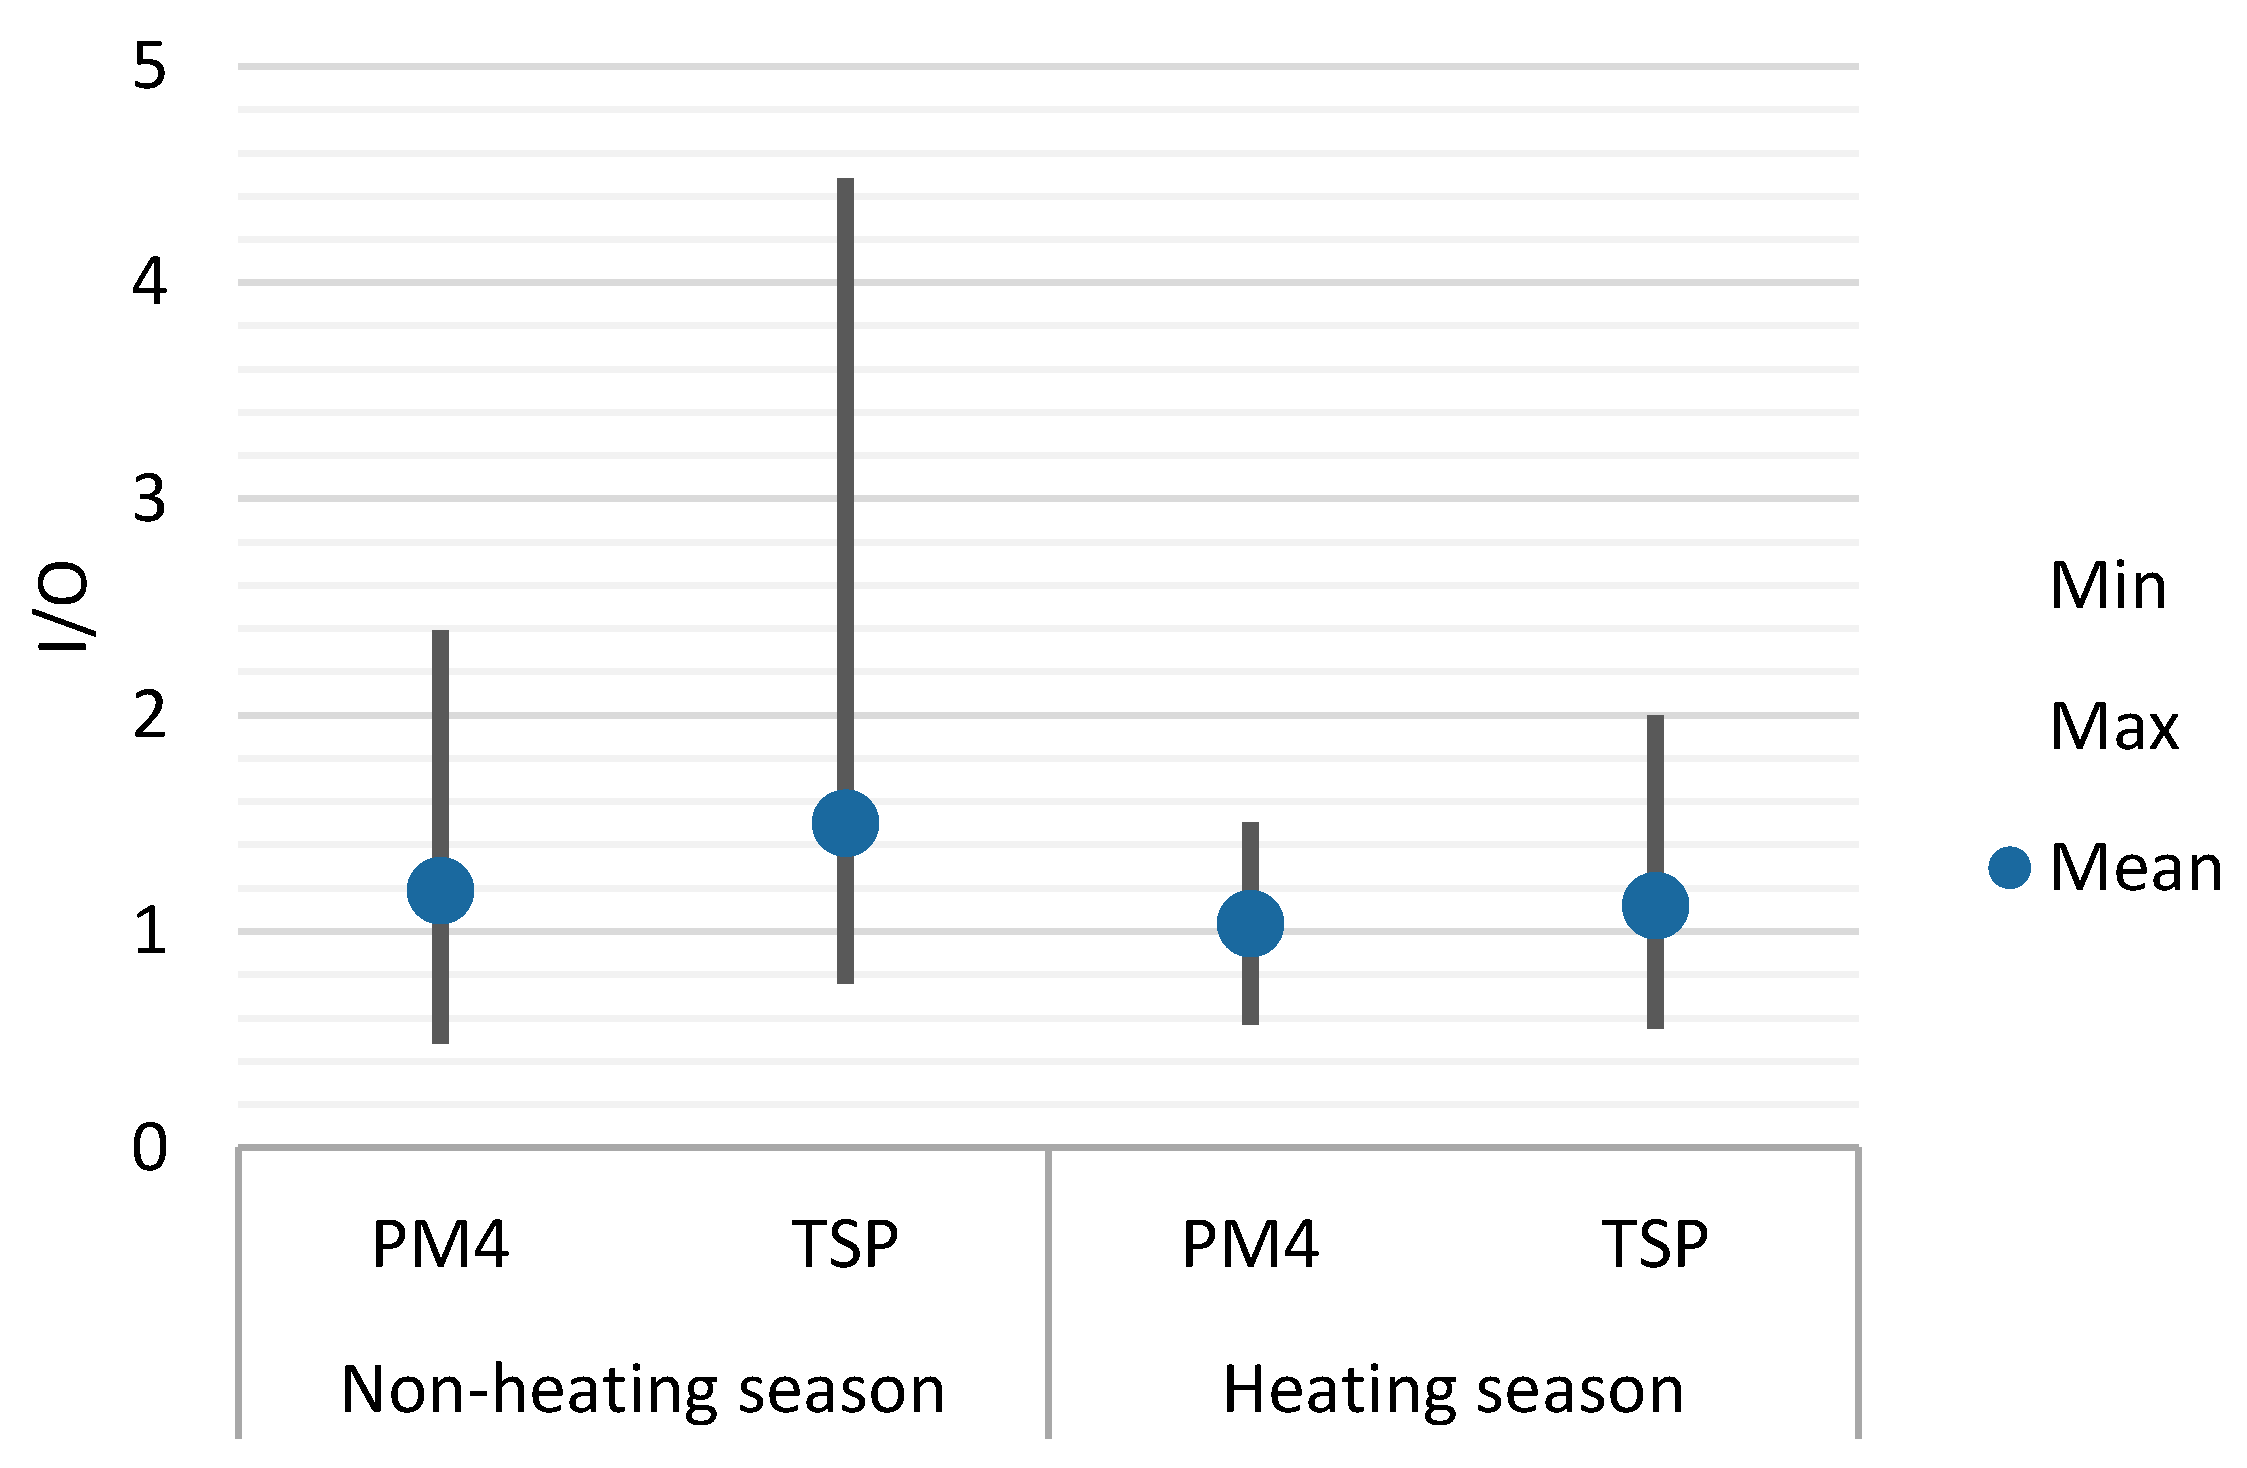
Based on 8-h concentrations of PM4 and TSP measured inside and outside the hall by the gravimetric method, the average, minimum, and maximum indoor/outdoor (I/O) ratios for heating and non-heating periods were determined. Moreover, based on 1-h and 8-h concentrations of the 5 PM fractions measured by the automatic method, the percentage share of individual PM fractions in the total mass of PM at different times of the day was analyzed.
For three groups of users of the sports hall—physical education teachers, pupils (children/teenagers), and athletes (the people most often attending sports classes in the hall)—the average daily doses of respirable dust (PM4) were calculated in accordance with the US EPA deterministic approach [27]. The calculations assume that teachers/trainers use the hall for 8 h a day, 5 days a week, pupils use the hall twice a week, each time for about 1 h, and athletes use the hall for 6 h a day, 5 days a week. It is assumed that physical education teachers, who remained in the hall, do not perform physical activity. The inhalation rate (InhR) of this exposure group was determined based on US EPA data [28,29] (Table 1). In the case of pupils and athletes, the increased intensity of breathing associated with physical exercise and the increased inhalation rate (InhR) were assumed (Table 2) [4,13,30,31,32]. The average daily doses were calculated as the sum of the daily dose inhaled during the time spent in the sports hall and the dose inhaled during the rest of the day. Due to the lack of information on PM concentrations in places where students, teachers, and athletes spend time after classes in the sports hall, the average PM4 concentrations outside were used for the calculations.
The following formulas were used for calculations:
where D is the average daily dose of respirable dust (µg/day), di is the average daily dose of respirable dust inhaled in the i-th environment (stay in the hall or remaining time), C is the average concentration of PM4 in the measurement period (heating or non-heating) based on gravimetric 8-h concentration measurements of PM4 (µg/m3), InhR is inhalation factor (m3/day), EF is the frequency of exposure (day), ED is exposure duration (day), and AT is the averaging time (day).
All calculations were made using the EXCEL spreadsheet and Analysis ToolPack from Microsoft Office 2016.
3. Results and Discussion
The statistical parameters of PM determined by the gravimetric (M) and automatic (A) methods in both sampling periods are presented in Table 3. In general, higher mean concentrations for almost all fractions of PM both inside the hall and in the ambient air were recorded in the winter (heating season) than in the summer (non-heating season). The average percentage increases of PM concentrations (obtained by gravimetric method) in the winter compared to the PM concentrations recorded in the summer were approx. 46% for PM4 and 54% for TSP inside the OSiR hall, and approx. 72% for PM4 and 69% for TSP outside the hall. The results of the gravimetric method inside and outside the hall in the summer season are similar to those recorded at the nearest Regional Environmental Protection Inspectorate (REPI) station (approx. 2 km from the hall in a straight line). In the winter season, the average PM2.5 and PM4 concentrations are comparable inside the hall and at the station. Probably the concentration of PM4 inside and outside the hall was mainly determined by PM2.5 particles in this season. TSP concentrations inside and outside the hall were almost twice as high as PM10 concentrations at the REPI station. It indicates an increase of dust concentrations with particle diameters greater than 10 µm in the building and its surroundings in the winter season probably due to the dominance of low-rise buildings with individual home-furnaces in the vicinity of the hall. The is surrounded by a park, hospital and block buildings. Due to the different measuring techniques used by the REPI station and author (different fractions measured), the comparison is approximate. For almost all fractions both inside and outside the hall, the difference between 8-h minimum and maximum concentrations, and thus the standard deviations, were higher in the summer than the winter. This may result from the occurrence of air humidity, which was clearly lower in the summer than in the winter. The humidity inside and outside the hall was, on average, 38% and 45% in summer and 52% and 64% in winter, respectively. In the conditions of lower humidity in the summer, it was easier to observe the phenomenon of resuspension [33] (i.e. picking up dust settled on the surfaces), especially inside the hall, during the exercises performed by its users. For automatic measurements, the mean was twice the median. For gravimetric measurements, the difference was smaller (17% in the non-heating season, 2% in heating season). The mean was overestimated by the maximum concentrations recorded (e.g., at the moment dynamic exercise was performed in close proximity to the devices). The median is, therefore, a better representative measure for automatic measurements. In the case of gravimetric measurements, the mean and median are close and both values are reliable.
The coefficients of the linear correlation between the 8-h concentrations of PM4 and TSP measured simultaneously with the automatic and gravimetric method inside the sports hall (r = <0.04–0.42>), despite the application of calibration factor, indicated a weak, linear relationship between the concentrations determined by two different methods. This discrepancy was influenced by differences between the PM properties (density, reflectivity, size, shape, and chemical composition) of dust used for calibration of automatic devices (Arizona dust) and tested dust. For example, the chemical composition determines the ability to reflect laser light through the surface of PM particles [34,35]. Due to the significantly higher content of elemental carbon in the dust occurring in Europe or in Polish areas [36,37,38], the albedo of the tested PM was lower than the albedo of the calibration dust. This can cause an overstatement of the results of the optical method compared to the gravimetric method [34,35]. The differences in the density of the tested PM and Arizona dust may cause the weight of each of the identified particles in the automatic meter to be overestimated or underestimated compared to the real weight (i.e., the weight determined gravimetrically). In PM measurements using optical methods, the influence of air humidity on the obtained results cannot be omitted. These results, in the case of high humidity, may be overstated, as fine drops of water vapour are identified by optical devices as PM particles [39]. The problem of optical meters to overestimate results was also highlighted in several other publications [24,39,40,41,42,43,44,45]. Due to the apparent overstatement of results by the optical method, for further analysis (I/O ratios, daily doses), mean concentrations obtained by the gravimetric method were used.
The average I/O ratios presented in Figure 3 could thus be used to predict that the summer concentration of PM inside the hall could come mainly from internal sources (I/O > 1), for example, physical activity and picking up dust from the floor and different surfaces during movement, using dusty sports accessories (medical balls, balls for the halter, mattresses), the direct connection between the hall and the school, student movement in the corridor adjacent to the hall, cleaning the hall, and so on [20,46]. Nevertheless, external sources cannot be excluded because coarse dust (da > 2.5 µm) present in the hall could also arise as a result of the formation of large agglomerates composed of fine particles (da ≤ 2.5 µm). These small particles may have come from internal but also external sources, which, according to the description of sampling sites, there were a lot of around the hall. At a distance of not more than 1000 m are the main streets of the district, including national express road S8 and the Grota-Roweckiego bridge, one of the main bridges in Warsaw with high traffic (170,000 vehicles/day) [18]. Moreover, plant dusting, the abrasion of road elements, vehicles, traffic emissions, and work related to subway construction may constitute the sources of PM circulating the sports hall and indirectly in the indoor air [34,35,36]. PM coming from atmospheric air probably penetrates the building through window and door slots. The migration of fine particles between the interior and the hall’s surroundings is facilitated by the fact that the building has windows on all sides.
In winter average I/O ratios are close to 1 (Figure 3). For this period, I/O ratios were lower, both for PM4 and TSP, than in the summer period. As was mentioned in the description of sampling sites, Targówek is one of the districts of Warsaw, in which low housing, mostly from the 1970s, constitutes a significant percentage of the total housing development. Thousands of these buildings are not connected to the central heating network [17,47]. Accordingly, in the heating season, emission from hard coal, wood, and sometimes trash burning in old tenement houses and single-family houses is the main source of fine PM and its precursors both inside and outside the hall.
The differences in concentration readings by the automatic method compared to the gravimetric (reference) method should not disqualify it as equipment for testing the variability of PM concentrations in closed sports facilities in different timeframes.
The possibility to determine concentrations of PM with the high spatial and temporal resolutions provided by DustTrak enabled the identification of potential sources of PM emission and the factors affecting concentrations in sports hall OSiR Targowek.
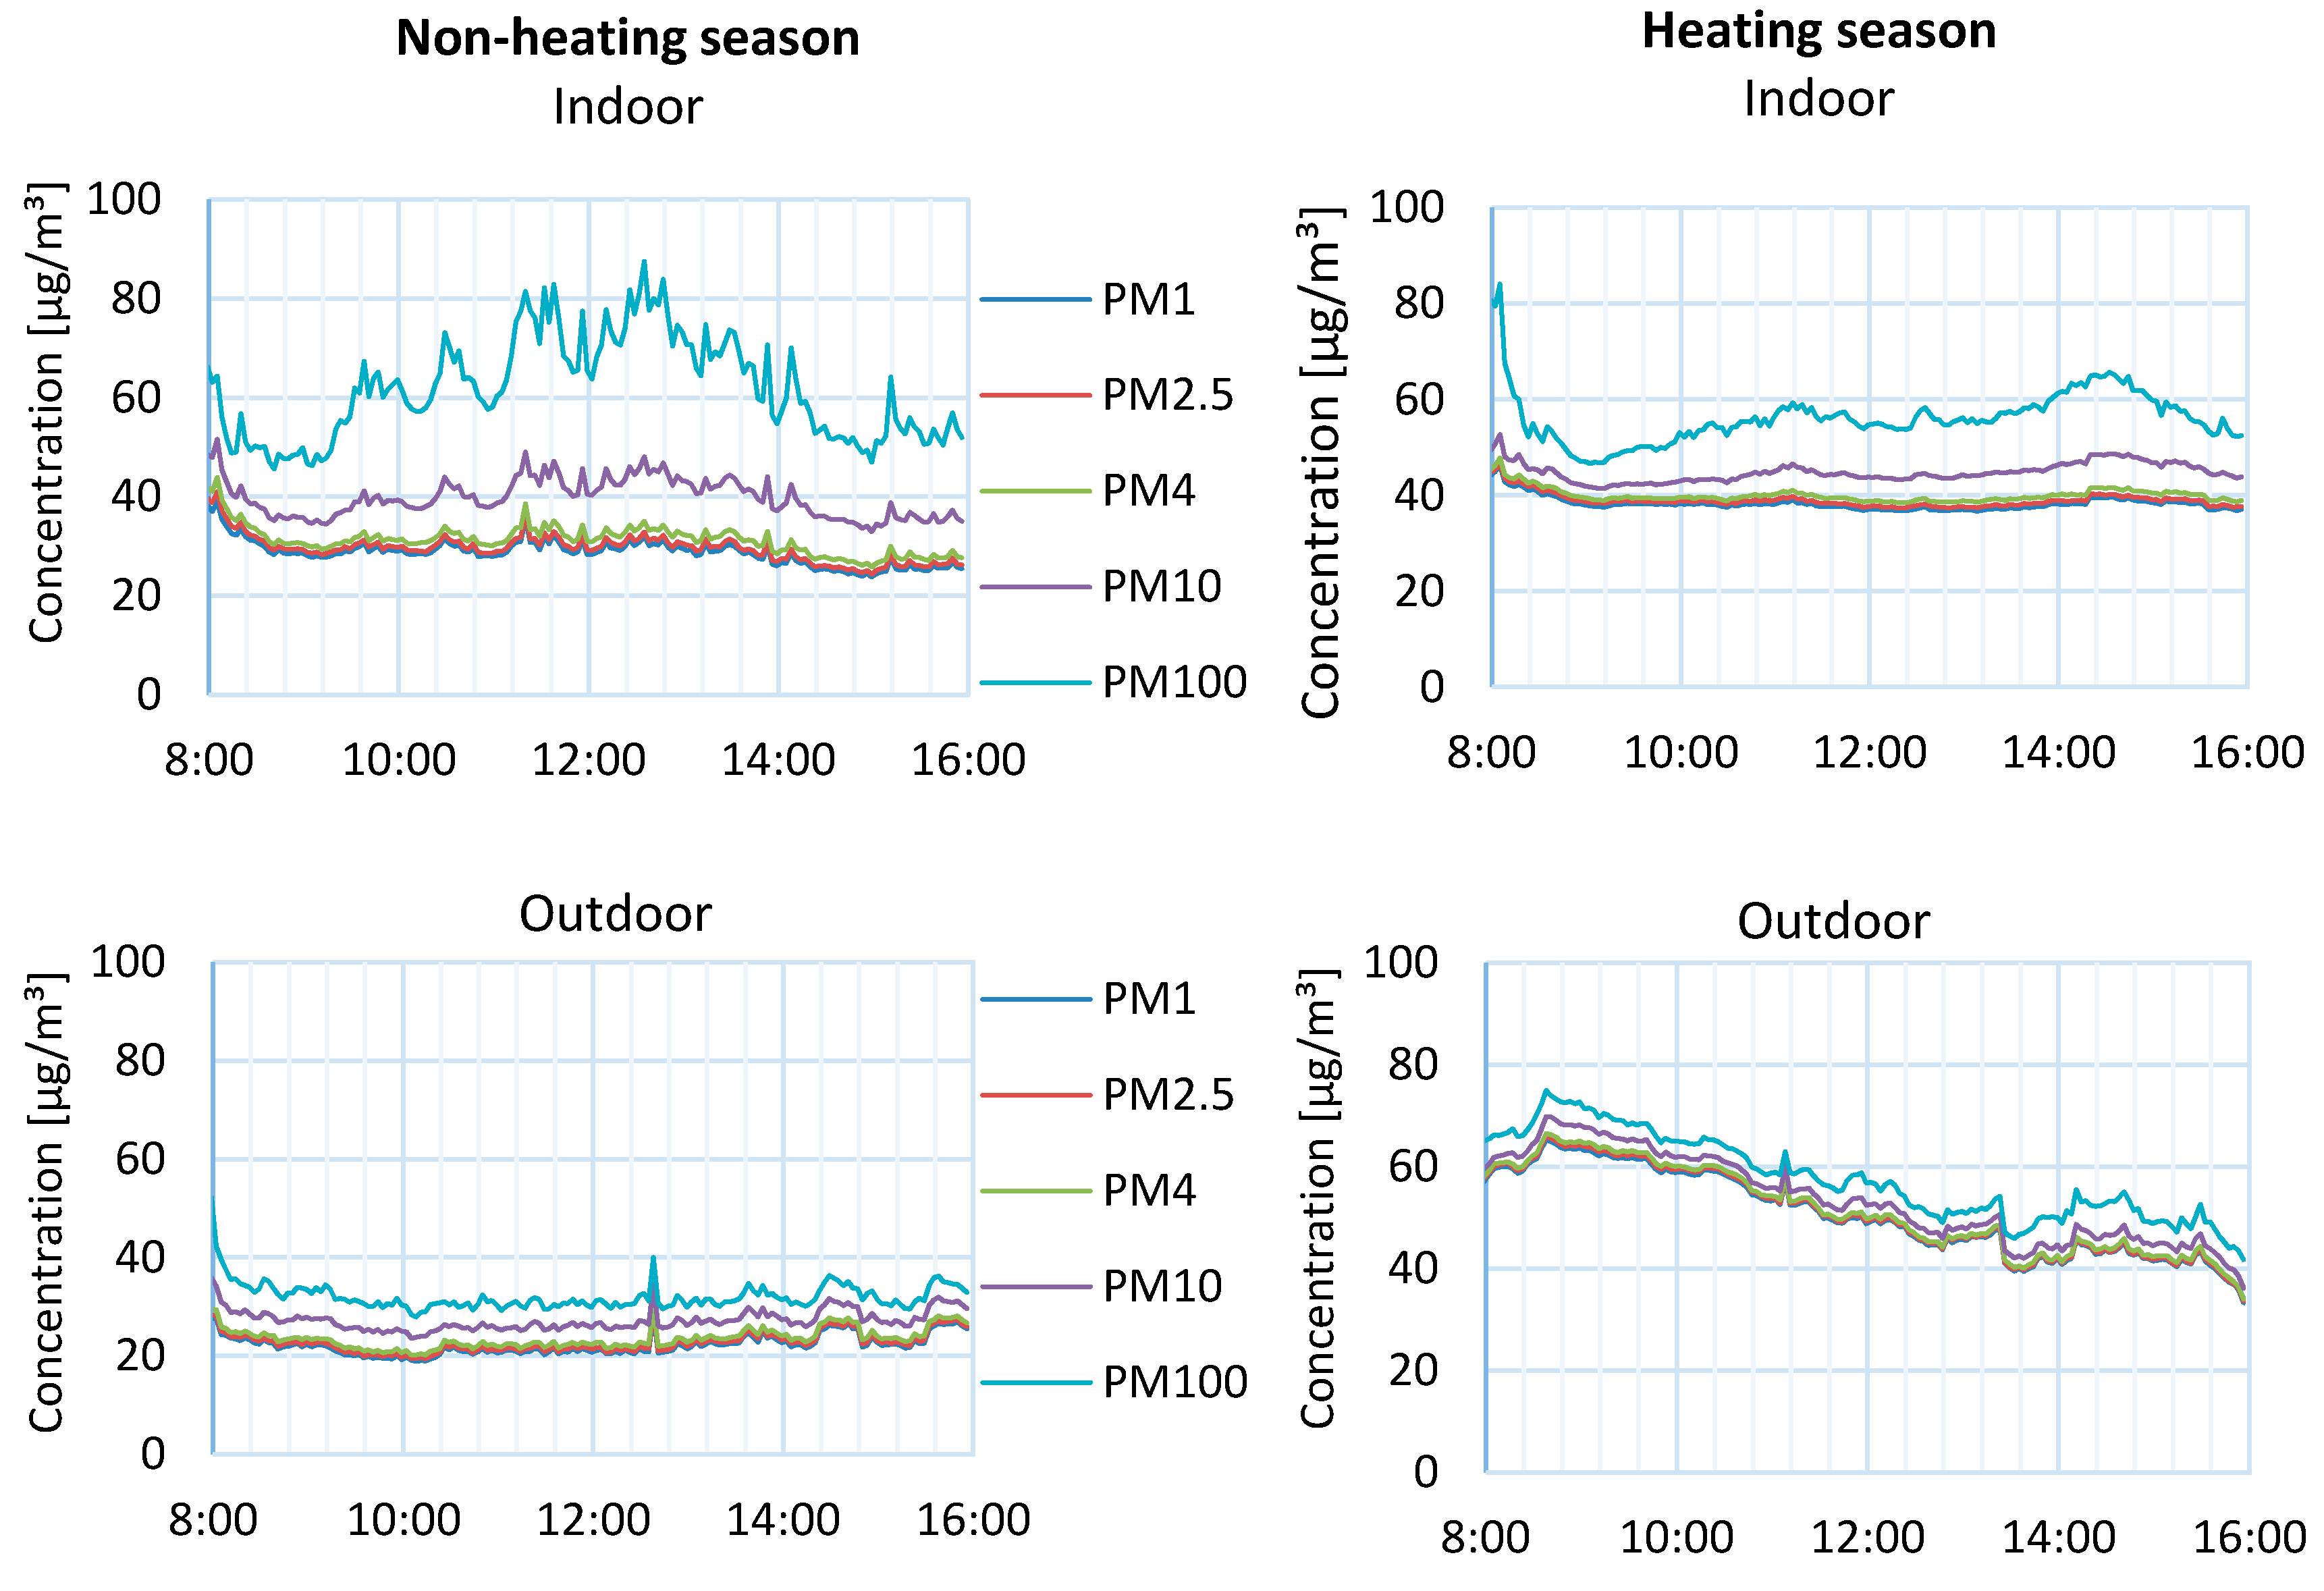
The average hourly concentrations of PM1, PM2.5, PM4, PM10, and PM100 (obtained using the automatic method) in both measurement periods recorded inside the hall were characterized by a greater variability than outside (Figure 4). Inside the hall, the changes in concentrations during the day between 8 am and 4 pm were more pronounced in summer than in winter, while the outdoor measurements in winter differed more clearly than in the summer. Both in the summer and winter inside the hall, the concentration of coarse PM (the fraction of particles larger than 10 μm) was especially characterized by high variability within the 8-h measuring period. Differences in concentrations of particles with da in the range 10–100 µm contributed to the fact that the hourly variability of TSP concentrations inside the sports hall was huge in both periods (Figure 4). This also indicates the presence of an internal source of coarse PM. In analyzing the class schedule in the hall, it can be noticed that jumps in PM100 concentrations at individual hours occurred when classes took place and depended on the number of people using the room and the way (kind of exercises) of using it (Figure 4). Throughout the day, the number of people using the room varied. In the morning (7–8 am) and afternoon (3–4 pm), the number of people was 0, while at 3 pm the facility was cleaned daily. In the afternoon hours (11 am–1 pm) from Monday to Friday, 24–48 people used the hall at the same time. The average 1-h concentrations of PM1, PM2.5, PM4, and PM10 fractions did not change during the day as clearly as PM100 concentrations. This may mean a different origin for these fractions than for the PM100 fraction (e.g. external sources), from which the emission was relatively constant during the day. It is also possible that changes in the 1-h concentrations of fine particles, and those caused by internal sources of fine PM, were simply less noticeable within 24 h due to the lower mass of particles with aerodynamic diameters ≤ 10 µm compared to the larger ones. The 1-h concentrations of all examined fractions of PM also changed in the measurement periods in atmospheric air (Figure 4). However, these changes were more or less the same for all factions. Outside in the heating season, the highest concentrations of PM fractions were noticed in the morning hours (8–11). This was probably due to the intensive heating of the rooms at night [48,49,50,51]. The second increase in hourly PM concentrations was observed in the hours of 4–6 pm, which is the time when, after returning home from work, people intensify heating again and often burn wood in fireplaces [48,49,50,51]. However, in this work, the measurements were carried out daily up to 4 pm, therefore, this fact was not recorded.
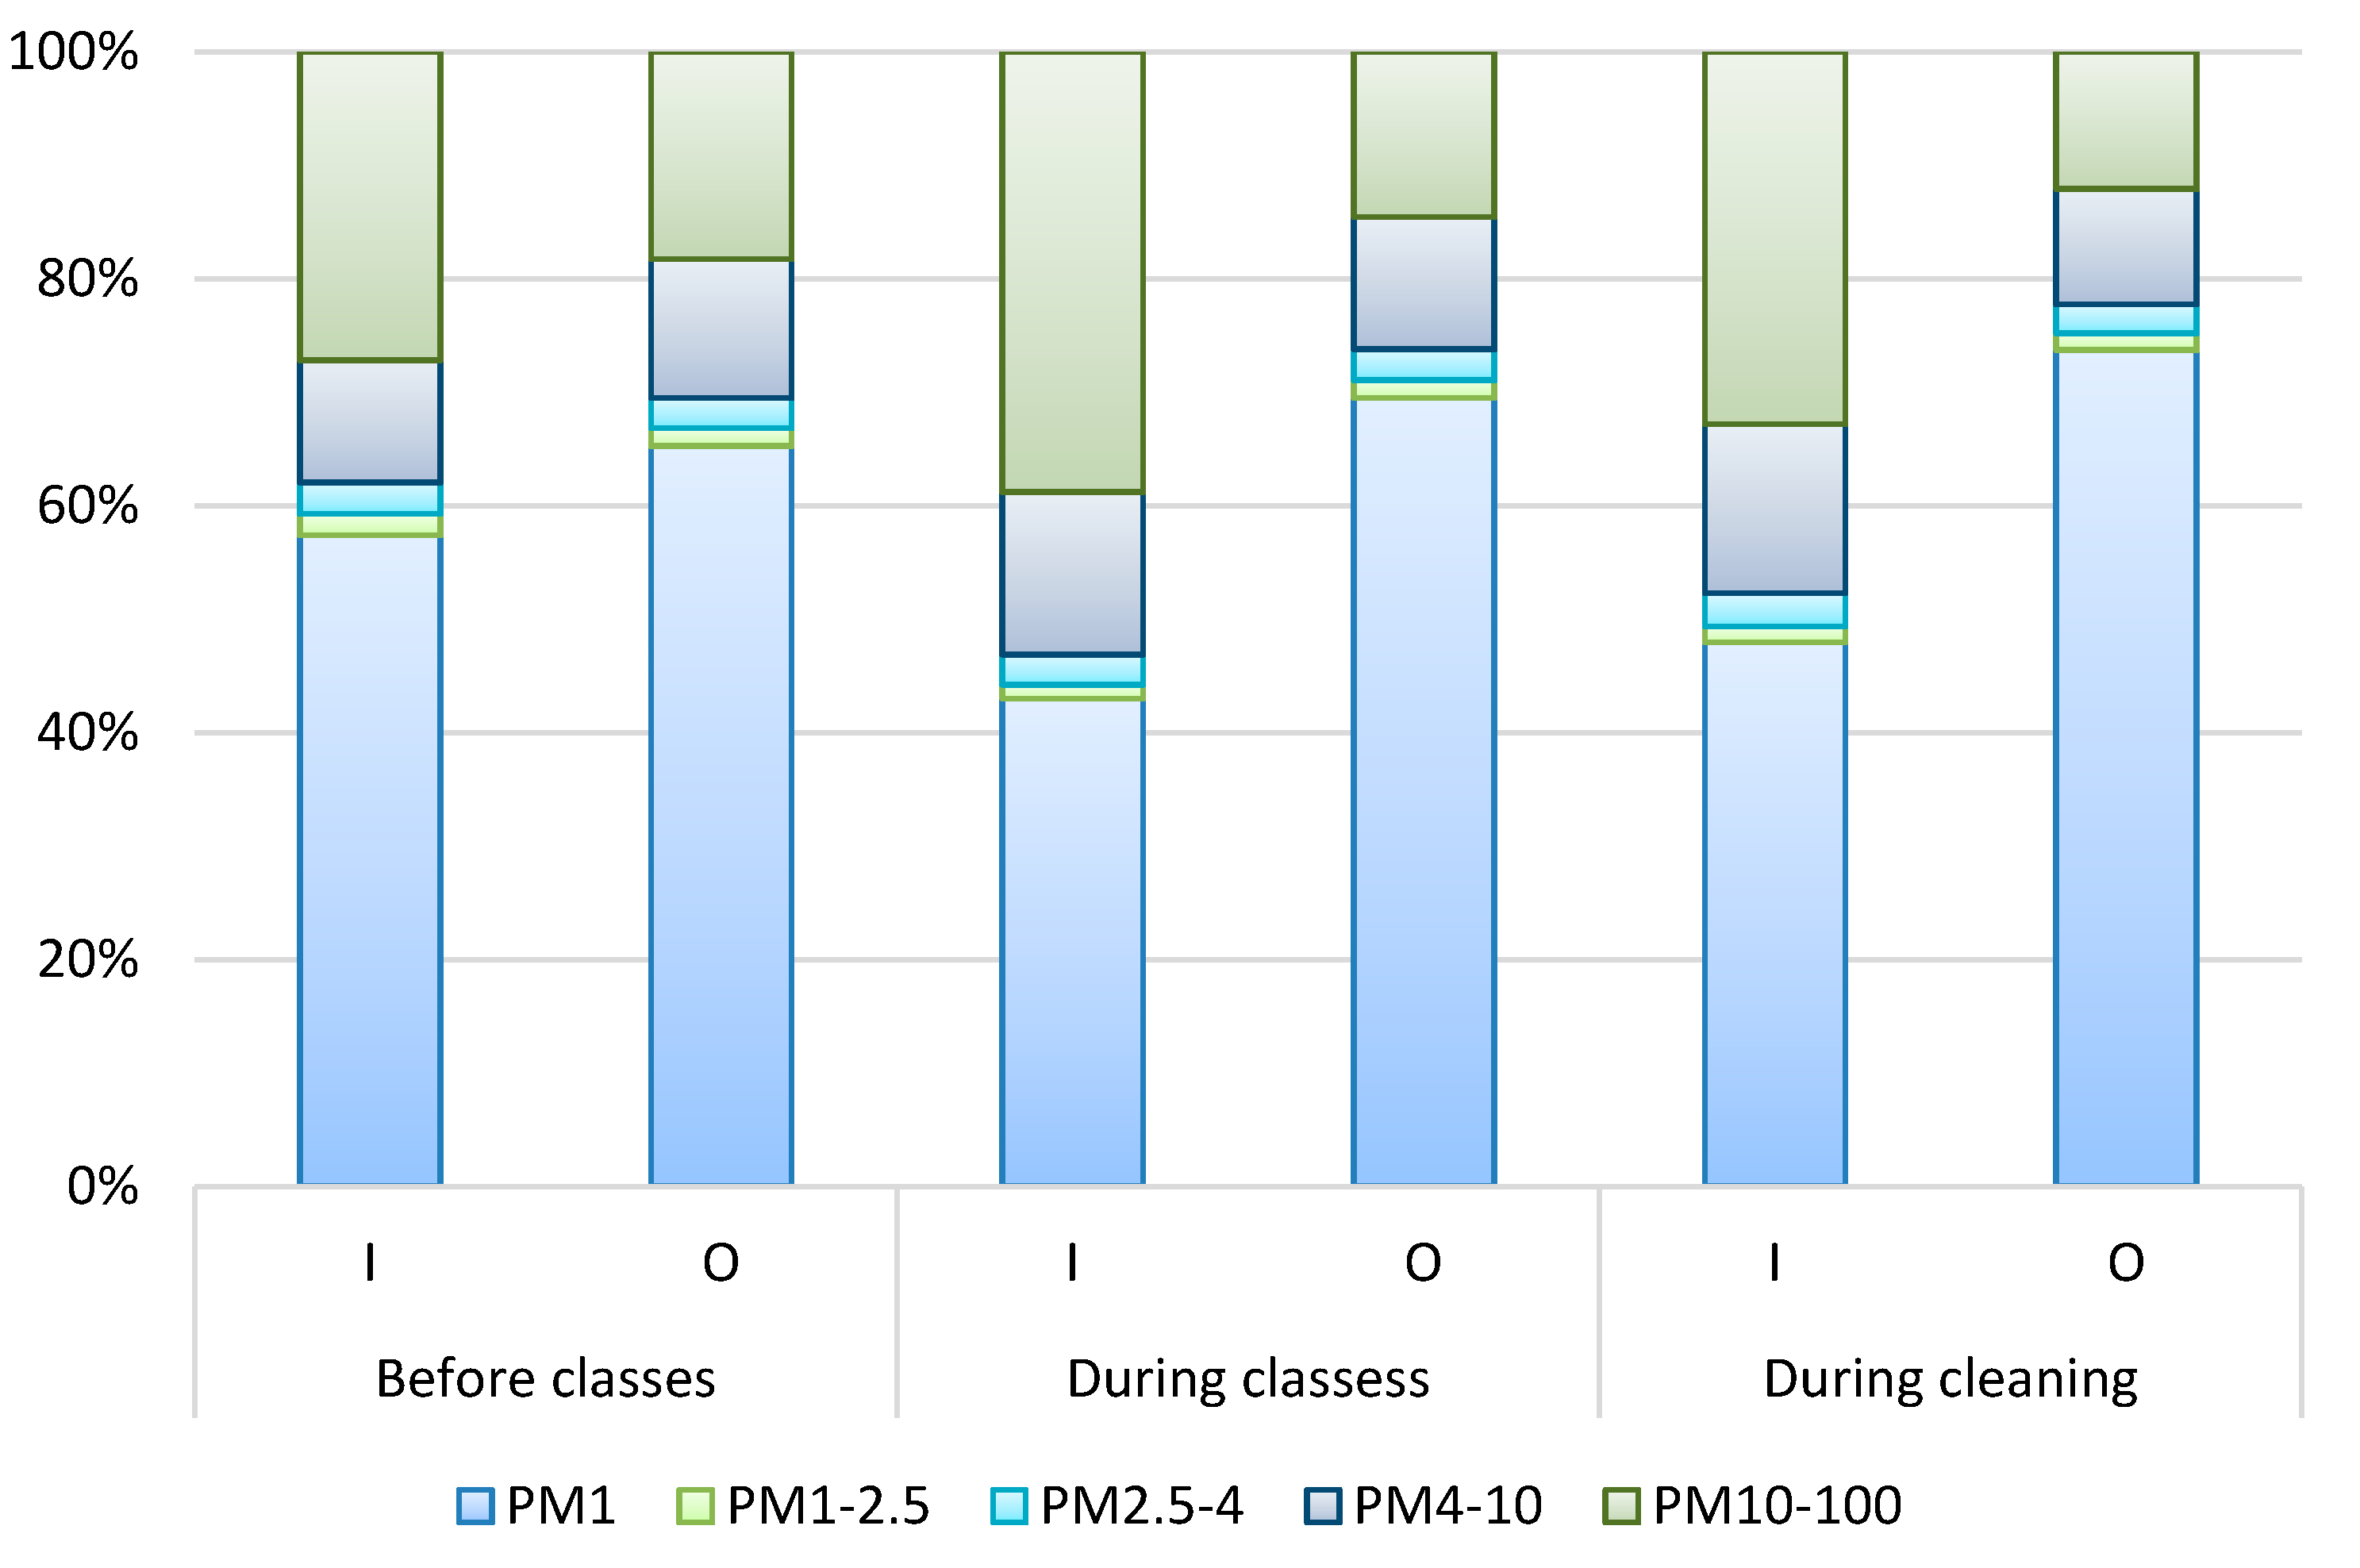
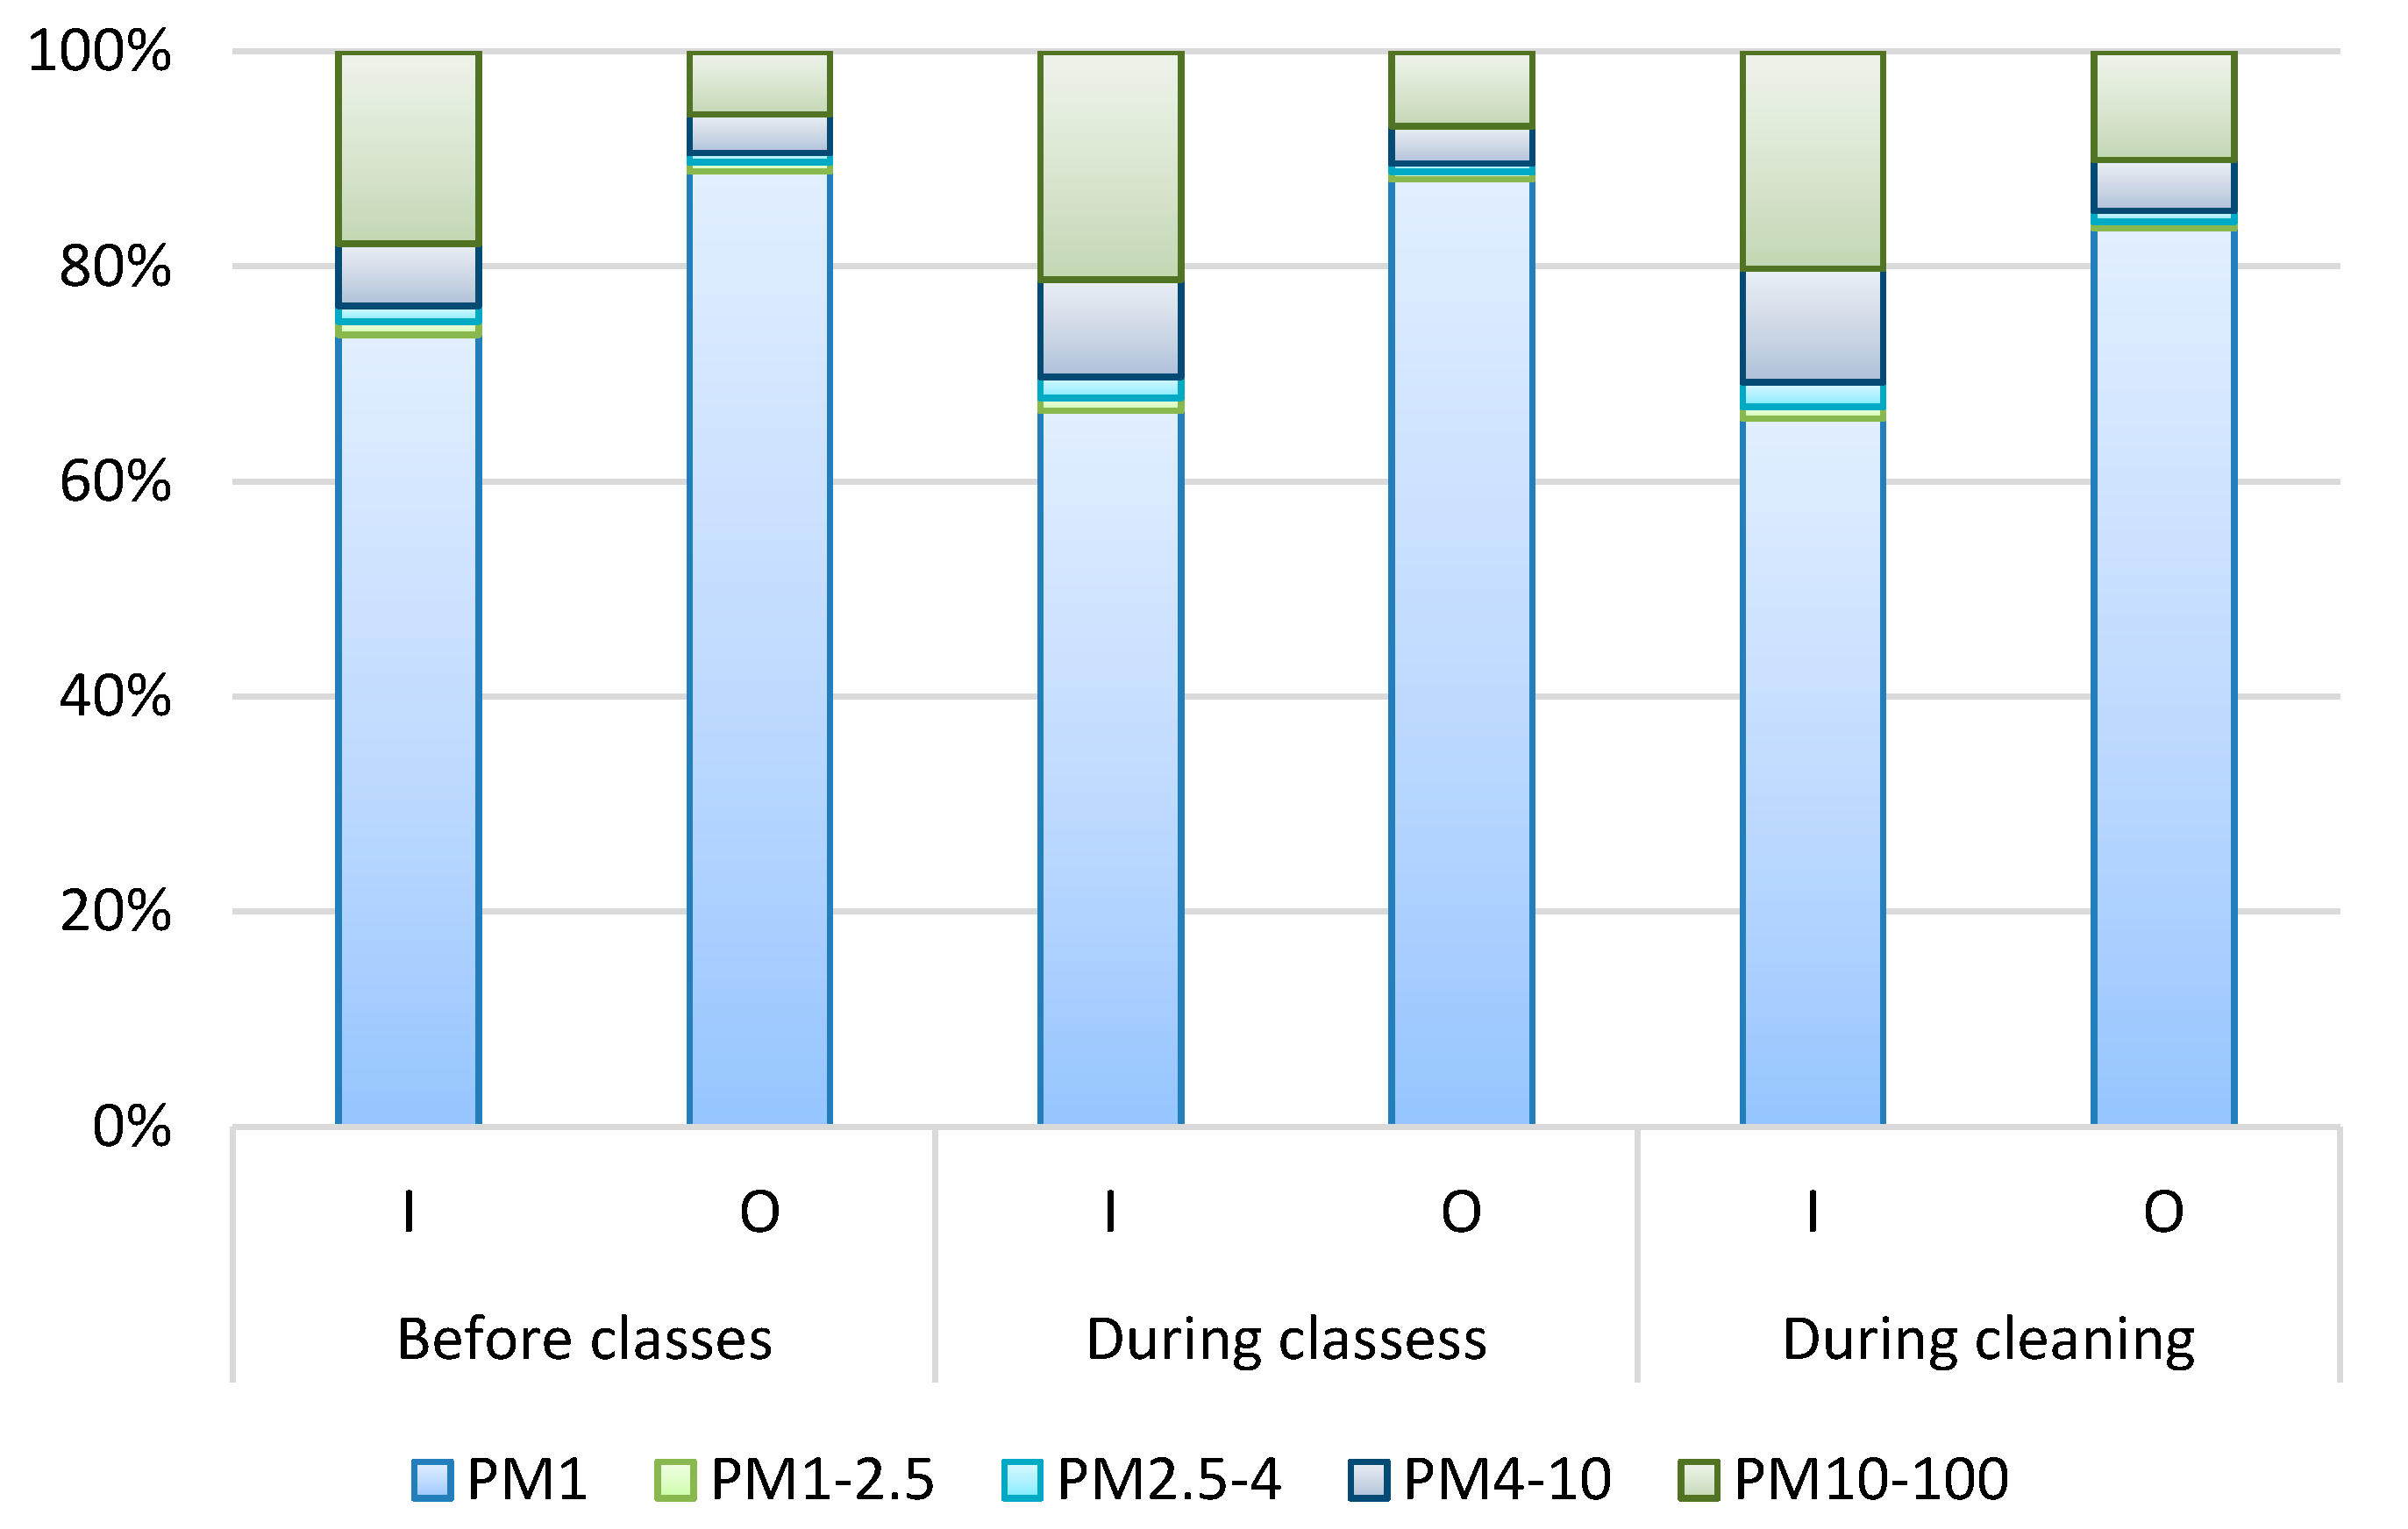
In order to visualize the changes occurring in PM, the percentage shares with respect to the aerodynamic diameter of particles in total mass of PM were calculated as averages for summer and winter separately for different time intervals, including the period of inactivity in the room (8.00–9.50), the period in which the largest number of people were practicing sports (10.00–14.30), and the period of cleaning the building (14.30–16.00). Analogous calculations were made for atmospheric (outdoor) PM at the same time intervals (Figure 5 and Figure 6).
In the time interval 8.00–9.50, the majority of PM mass (more than 50% in both seasons) was accumulated in particles with a diameter in the range 0.1–2.5 μm, both in the indoor and outdoor air. During classes (10.00–14.30), the percentage contribution of coarse particles in the total PM mass was more visible than in the first period, especially in the non-heating season. However, during the heating season, the coarse particles (PM2.5–100) represent on average 35% of the total PM mass and this share was 1.5 times higher than that in the period when no one exercised in the room (8.00–9.50) (Figure 6).
During hall cleaning (14.30–16.00), the percentage share of coarse particles in total PM mass was higher than that in the mornings. On average, it was 51% in the summer and 33% in the winter. The phenomenon of a larger percentage share of coarse particles in total PM mass during classes and cleaning activities than that observed in the morning hours (8.00–9.50) was related to resuspension of dust collected on the floor and various elements of equipment of the hall. The results may indicate that, in winter, the PM concentration inside the hall is determined by the quality of outdoor air. This was particularly pronounced for the first period (8.00–9.50), when the percentage shares of individual PM fractions in the total mass of PM inside and outside the hall were almost identical, and when there were no activities in the hall that could be an additional/external source of PM. To analyze mass size distribution and determine distribution characteristics, i.e. mass median aerodynamic diameter and geometric standard deviation, a device with the ability to measure the concentration of a larger number of fractions is needed.
The 8-h average indoor PM4 concentration in the sports hall allowed us to calculate the average daily doses of respirable dust for the three groups of users: exercising children, physical education teachers, and athletes (Figure 7). The higher health exposure resulting from inhalation of respirable dust is concerning for athletes who increase the frequency and depth of their breathing during exercise. In relation to PM concentrations in individual seasons (Table 3), the daily doses in summer may be higher inside the hall than outside, in winter—conversely.
If the daily doses are converted into bodyweight, which for children (pupils) is 50.6 kg, for adults (teachers, athletes) 71.6 kg [27], then the highest daily dose per kg body weight applies to children (6.7 µg/kg per day in the heating season, 2.0 µg/kg per day in the non-heating season). For athletes it is 6.6 µg/kg per day in the heating season, 1.8 µg/kg per day in the non-heating season, for physical education teachers—5.3 µg/kg per day in the heating season, 1.6 µg/kg per day in the non-heating season.
The modelling carried out is very simplified because it was assumed that teachers did not exercise during or outside work, and varying concentrations were not assumed throughout the day. Moreover, the calculations included only respirable dust that penetrates deeply into the body, even reaching the alveoli. During the activity, which is accompanied by resuspension of settled dust, mainly coarse particles, and deepening of breath, exercisers can inhale not only respirable dust but also coarse PM particles. The calculated doses can, therefore, be even higher.
A comparison of the obtained results with the results of similar studies conducted around the world shows that daily respirable dust absorbed by athletes during their use of the hall is similar to those calculated, for example, for people living in areas heavily polluted by PM, such as urbanized and industrial areas of southern Poland [52,53], the center of Beijing [54], or Shanghai [55]. However, no special cases of PM exposure were considered here (e.g., vulnerable groups who suffer from asthma or other chronic respiratory or cardiovascular diseases. In these people, rapid jumps in the concentration of both fine and coarse PM inside the hall during physical activities can be more dangerous and have worse health consequences. Among others, Brown and Chalupa’s research [56,57] shows that dust deposition in respiratory increases during exercise, and for people with asthma and chronic obstructive lung disease, the severity of airway obstruction is increased compared to healthy subjects.
4. Conclusions
The conducted research identified several major problems affecting the quality of air in closed sports facilities. One problem includes resuspension of dust settled on the floor and equipment caused by the movement of the exercisers. Factors determining the intensity of this phenomenon are the type of discipline practiced, the dynamics of the exercises performed, and the number of people exercising at the same time. Resuspension of settled PM causes a significant increase in the concentration of coarse PM in the indoor air of a sports facility, as well as a transient increase in the concentration of fine particles in the hall air, which combine and form larger agglomerates. This results in a larger share of coarse PM in the dust mass inside the sports facility than that of fine PM.
Another problem related to the quality of indoor air in a closed sports facility is its location. In some periods or time intervals, atmospheric air determines the concentration of fine PM inside the facility. Therefore, regardless of the activities carried out in the hall, indoor air can be heavily contaminated with a fine PM if the surroundings are characterized by a high concentration of PM. It is important to carefully select the location of new sports facilities and choose the construction site of closed sports facilities not only depending on technical and economic conditions but, above all, on aero-sanitary conditions. In existing facilities located in heavily polluted areas, upgrading or replacing the ventilation and installing air cleaners or filters should be considered.
The exposure of people practicing sports in sports facilities may be greater than those at rest in the same conditions. This results from the change in breathing that accompanies exercise. This signals the need to ensure adequate air quality in sports facilities and further research in this area. However, to clearly determine the direction and intensity of the impact of dynamic changes in PM concentration inside a sports facility on the inhalation exposure for people using these facilities, a specific scenario appropriate for a given person/group of people should be considered, especially for sensitive groups (people with asthma and other respiratory diseases, the elderly, children, and pregnant women). The presented results signal the necessity of continuation and expand research on the problem of air pollution in sports facilities. Particularly more advanced study is needed to properly predict the health effects of PM inhalation in sports facilities, e.g. based on concentrations of PM-bound elements and polycyclic aromatic hydrocarbons. Research can also be continued in the field of long-term analysis of physical properties and ventilation efficiency in sports facilities.
Author Contributions
Conceptualization, K.B. and W.R.-K.; methodology, W.R.-K.; software, K.B.; validation, K.B., W.R.-K. and A.B.; formal analysis, K.B.; investigation, K.B.; resources, K.B.; data curation, K.B.; writing—original draft preparation, K.B.; writing—review and editing, W.R.-K.; visualization, A.B.; supervision, W.R.-K.; project administration, K.B.; funding acquisition, K.B.
Funding
This research received no external funding.
Acknowledgments
The authors would like to acknowledge the Ministry of Science and Higher Education for their financial support as part of the statutory works Nos. S/E/422/8/16/17.
Conflicts of Interest
The authors declare no conflicts of interest.
References
- Frank, L.D.; Engelke, P.O. The Built Environment and Human Activity Patterns: Exploring the Impacts of Urban Form on Public Health. J. Plan. Lit. 2001, 16, 202–218. [Google Scholar] [CrossRef]
- Warburton, D.; Nicol, C.; Bredin, S. Health benefits of physical activity: The evidence. Can. Med. Assoc. J. 2006, 174, 801–809. [Google Scholar] [CrossRef] [PubMed] [Green Version]
- Alves, C.A.; Calvo, A.I.; Castro, A.; Fraile, R.; Evtyugina, M.; Bate-Epey, E.F. Air Quality in Sports Venues with Distinct Characteristics. Int. J. Environ. Chem. Ecol. Geol. Geophys. Eng. 2013, 7, 298–302. [Google Scholar] [CrossRef]
- Andrade, A.; Dominski, F.H.; Coimbra, D.R. Scientific production on indoor air quality of environments used forphysical exercise and sports practice: Bibliometric analysis. J. Environ. Manag. 2017, 196, 188–200. [Google Scholar] [CrossRef]
- Rundell, K.W.; Caviston, R. Ultrafine and fine Particulate Matter inhalation decreases exercise performance in healthy subjects. J. Strength Cond. Res. 2008, 22, 2–5. [Google Scholar] [CrossRef]
- Cutrufello, P.T.; Smoliga, J.M.; Rundell, K.W. Small things make a big difference: Particulate matter and exercise. Sports Med. 2012, 42, 1041–1058. [Google Scholar] [CrossRef]
- Cakmak, S.; Dales, R.; Leech, J.; Liu, L. The influence of air pollution on cardiovascular and pulmonary function and exercise capacity: Canadian Health Measures Survey (CHMS). Environ. Res. 2011, 111, 1309–1312. [Google Scholar] [CrossRef]
- Pope, C.A.; Burnett, R.T.; Thurston, G.D.; Thun, M.J.; Calle, E.E.; Krewski, D.; Godleski, J.J. Cardiovascular Mortality and Long-Term Exposure to Particulate Air Pollution Epidemiological Evidence of General Pathophysiological Pathways of Disease. Circulation 2004, 6, 71–77. [Google Scholar] [CrossRef] [Green Version]
- Kampa, M.; Castanas, E. Human health effects of air pollution. Environ. Pollut. 2008, 151, 362–367. [Google Scholar] [CrossRef]
- Daigle, C.C.; Chalupa, D.C.; Gibb, F.R.; Morrow, P.E.; Oberdörster, G.; Utell, M.J.; Frampton, M.W. Ultrafine particle deposition in humans during rest and exercise. Inhal. Toxicol. 2003, 15, 539–552. [Google Scholar] [CrossRef]
- Carlisle, A.J.; Sharp, N.C.C. Exercise and outdoor ambient air pollution. Br. J. Sports Med. 2001, 35, 214–222. [Google Scholar] [CrossRef] [PubMed]
- Castro, A.; Calvo, A.I.; Alves, C.; Alonso-Blanco, E.; Coz, E.; Marques, L.; Nunes, T.; Fernández-Guisuraga, J.M.; Fraile, R. Indoor aerosol size distributions in a gymnasium. Sci. Total Environ. 2015, 524, 178–186. [Google Scholar] [CrossRef] [PubMed]
- Sracic, M.K. Modeled regional airway deposition of inhaled particles in athletes at exertion. J. Aerosol Sci. 2016, 99, 54–63. [Google Scholar] [CrossRef]
- Lippi, G.; Guidi, G.C.; Maffulli, N. Air Pollution and Sports Performance in Beijing. Int. J. Sports Med. 2008, 29, 696–698. [Google Scholar] [CrossRef] [PubMed] [Green Version]
- Abelsohn, A.; Stieb, D.M. Health effects of outdoor air pollution. Approach to counseling patients using the Air Quality Health Index. Can. Fam. Physician 2011, 57, 881–887. [Google Scholar] [PubMed]
- Phalen, R.F. Inhalation Studies: Foundations and Techniques, 2nd ed.; Informa Healthcare: New York, NY, USA, 2009; pp. 57–58. [Google Scholar]
- Kuskowska, K.; Rogula-Kozłowska, W.; Rogula-Kopiec, W. Particulate matter and polycyclic aromatic hydrocarbons in a selected athletic hall: Ambient concentrations, origin and effects on human health. E3S Web Conf. 2018, 28. [Google Scholar] [CrossRef] [Green Version]
- Administration of Cities Roads. Available online: https://zdm.waw.pl/dzialania/badania-i-analizy/analiza-ruchu-na-drogach/ (accessed on 7 October 2019).
- Polish Committee for Standardization. PN-EN 12341:2014-07, Atmospheric Air—Standard Gravimetric Measuring Method for Determination of Mass Concentrations of PM10 or PM2.5 Fractions of Particulate Matter; Polish Standardization Committee: Warsaw, Poland, 2014. [Google Scholar]
- Polish Committee for Standardization. PN-EN12341:2014, Air Quality—Determination of PM10 Fraction of Particulate Matter; Polish Standardization Committee: Warsaw, Poland, 2014. [Google Scholar]
- Fromme, H.; Twardella, D.; Dietrich, S.; Heitmann, D.; Schierl, R.; Liebl, B.; Rüden, H. Particulate matter in the indoor air of classrooms—Exploratory results from Munich and surrounding area. Atmos. Environ. 2007, 41, 854–866. [Google Scholar] [CrossRef]
- Alves, C.A.; Calvo, A.I.; Castro, A.; Fraile, R.; Evtyugina, M.; Bate-Epey, E.F. Indoor Air Quality in Two University Sports Facilities. Aerosol Air Qual. Res. 2013, 13, 1723–1730. [Google Scholar] [CrossRef] [Green Version]
- EC Working Group. Guide to the Demonstration of Equivalence of Ambient Air Monitoring Methods; EC Working Group on Guidance for the Demonstration of Equivalence; Office for Official Publications of the European Communities: Ispra, Italy, 2008. [Google Scholar]
- Gębicki, J.; Szymańska, K. Comparison of Tests for Equivalence of Methods for Measuring PM10 Dust in Ambient Air. Pol. J. Environ. Stud. 2011, 20, 1465–1472. [Google Scholar]
- Gębicki, J.; Szymańska, K. Comparative field test for measurement of PM10 dust in atmospheric air using gravimetric (reference) method and b-absorption method (Eberline FH 62-1). Atmos. Environ. 2012, 54, 18–24. [Google Scholar] [CrossRef]
- Tzu-Chi Chang, L.; Leys, J.; Heidenreich, S.; Koen, T. Determining aerosol type using a multichannel DustTrak DRX. J. Aerosol Sci. 2018, 126, 68–84. [Google Scholar] [CrossRef]
- US EPA. Exposure Factors Handbook; U.S. Environmental Protection Agency: Washington, DC, USA, 2011.
- US EPA. Risk Assessment Guidance for Superfund Volume I Human Health Evaluation Manual; U.S. Environmental Protection Agency: Washington, DC, USA, 2011.
- US EPA. Risk Assessment Guidance for Superfund Volume I: Human Health Evaluation Manual. (Part F, Supplemental Guidance for Inhalation Risk Assessment); U.S. Environmental Protection Agency: Washington, DC, USA, 2009.
- Naranjo, J.; Centeno, R.; Galiano, D.; Beaus, M. A nomogram for assesment of breathingpatterns during treadmill exercise. Br. J. Sports Med. 2005, 39, 80–83. [Google Scholar] [CrossRef] [PubMed] [Green Version]
- Bezemer, G. Particle Deposition Clearance from Respiratory Tract; Institute for Risk Assessment Sciences: Utrecht, The Netherlands, 2009.
- Guo, G.; Song, B.; Xia, D.; Yang, Z.; Wang, F. Metals and metalloids in PM10 in Nandan County, Guangxi, China, and the health risks posed. Environ. Geochem. Health 2018, 40, 2071–2086. [Google Scholar] [CrossRef] [PubMed]
- Thatcher, T.L.; Layton, D. Deposition, Resuspension, and Penetration of Particles within a Residence. Atmos. Environ. 1995, 29, 1487–1497. [Google Scholar] [CrossRef]
- Cohen, Y. Volatile Organic Compoundsin the Environment: A Multimedia Perspective. In Volatile Organic Compounds in the Environment; ASTM International: West Conshohocken, PA, USA, 1996; pp. 7–32. [Google Scholar]
- Putaud, J.P.; Raes, F.; Van Dingenen, R.; Brüggemann, E.; Facchini, M.C.; Decesari, S.; Fuzzi, S.; Gehrig, R.; Hüglin, C.; Laj, P.; et al. A european aerosol phenomenology—2: Chemical characteristics of particulate matter at kerbside, urban, rural and background sites in Europe. Atmos. Environ. 2004, 38, 2579–2595. [Google Scholar] [CrossRef]
- Rogula-Kozłowska, W.; Klejnowski, K.; Rogula-Kopiec, P.; Ośródka, L.; Krajny, E.; Błaszczak, B.; Mathews, B. Spatial and seasonal variability of the mass concentration and chemical composition of PM2.5 in Poland. Air Qual. Atmos. Health 2014, 7, 41–58. [Google Scholar] [CrossRef] [Green Version]
- Rogula-Kozłowska, W. Size-segregated urban particulate matter: Mass closure, chemical composition, and primary and secondary matter content. Air Qual. Atmos. Health 2016, 9, 533–550. [Google Scholar] [CrossRef] [Green Version]
- Majewski, G.; Rogula-Kozłowska, W.; Rozbicka, K.; Rogula-Kopiec, P.; Mathews, B.; Brandyk, A. Concentration, chemical composition and origin of PM1: Results from the first long-term measurement campaign in Warsaw (Poland). Aerosol Air Qual. Res. 2018, 18, 636–654. [Google Scholar] [CrossRef]
- Rivas, I.; Mazaheri, M.; Viana, M.; Moreno, T.; Clifford, S.; He, C.; Bischof, O.F.; Martins, V.; Reche, C.; Alastuey, A.; et al. Identification of technical problems affecting performance of DustTrak DRX aerosol monitors. Sci. Total Environ. 2017, 15, 849–855. [Google Scholar] [CrossRef] [Green Version]
- Chung, A.; Chang, D.P.; Kleeman, M.J.; Perry, K.D.; Cahill, T.A.; Dutcher, D.; McDougall, E.M.; Stroud, K. Comparison of real-time instruments used to monitor airborne particulate matter. J. Air Waste Manag. Assoc. 2001, 51, 109–120. [Google Scholar] [CrossRef]
- Yanosky, J.D.; Williams, P.L.; MacIntosh, D.L. A comparison of two direct-reading aerosol monitors with the federal reference method for PM2.5 in indoor air. Atmos. Eviron. 2002, 36, 107–113. [Google Scholar] [CrossRef]
- Kingham, S.; Durand, M.; Aberkane, T.; Harrison, J.; Wilson, J.G.; Epton, M. Winter comparison of TEOM, MiniVol and DustTrak PM10 monitors in a woodsmoke environment. Atmos. Environ. 2006, 40, 338–347. [Google Scholar] [CrossRef]
- Zhu, J.; Smith, T.J.; Davis, M.E.; Levy, J.I.; Herrick, R.; Jiang, H. Comparing gravimetric and real-time sampling of PM2.5 concentrations inside truck cabins. J. Occup. Environ. Hyg. 2011, 8, 662–672. [Google Scholar] [CrossRef] [PubMed] [Green Version]
- Winkel, A.; Llorens Rubio, J.; Huis in’t Veld, J.W.H.; Vonk, J.A.; Ogink, N.W.M. Equivalence testing of filter-based, beta-attenuation, TEOM, and light-scattering devices for measurement of PM10 concentration in animal houses. J. Aerosol Sci. 2015, 80, 11–26. [Google Scholar] [CrossRef]
- Wang, Z.; Calderón, L.; Patton, A.P.; Sorensen Allacci, M.; Senick, J.; Wener, R.; Andrews, C.J.; Mainelis, G. Comparison of Real-Time Instruments and Gravimetric Method When Measuring Particulate Matter in a Residential Building. J. Air Waste Manag. Assoc. 2016, 66, 1109–1120. [Google Scholar] [CrossRef]
- Hajian, M.; Mohaghegh, S. Indoor Air Pollution in Exercise Centers. Int. J. Med. Toxicol. Forensic Med. 2015, 5, 22–31. [Google Scholar]
- The Office of the Capital City of Warsaw. Available online: www.um.warszawa.pl (accessed on 7 October 2019).
- Reizer, M.; Juda-Rezler, K. Explaining the high PM10 concentrations observed in Polish urban areas. Air Qual. Atmos. Health 2016, 9, 517–531. [Google Scholar] [CrossRef]
- Chlebowska-Styś, A.; Sówka, I.; Kobus, D.; Pachurka, Ł. Analysis of concentrations trends and origins of PM10 in selected European cities. E3S Web Conf. 2017, 17. [Google Scholar] [CrossRef] [Green Version]
- Klejnowski, K.; Krasa, A.; Rogula-Kozłowska, W.; Błaszczak, B. Number size distribution of ambient particles in a typical urban site: The first Polish assessment based on long-term (9 months) measurements. Sci. World J. 2013, 27. [Google Scholar] [CrossRef]
- Rogula-Kozłowska, W.; Majewski, G.; Czechowski, O. The size distribution and origin of elements bound to ambient particles: A case study of a Polish urban area. Environ. Monit. Assess. 2015, 187, 240. [Google Scholar] [CrossRef] [Green Version]
- Zwoździak, A.; Gini, M.I.; Samek, L.; Rogula-Kozłowska, W.; Sówka, I.; Eleftheriadis, K. Implications of the aerosol size distribution modal structure of trace and major elements on human exposure, inhaled dose and relevance to the PM2.5 and PM10 metrics in a European pollution hotspot urban area. J. Aerosol Sci. 2017, 103, 38–52. [Google Scholar] [CrossRef]
- Widziewicz, K.; Rogula-Kozłowska, W. Urban environment as a factor modulating metals deposition in the respiratory track and associated cancer risk. Atmos. Pollut. Res. 2017, 9, 399–410. [Google Scholar] [CrossRef]
- Li, X.; Yan, C.; Patterson, R.F.; Zhu, Y.; Yao, X.; Zhu, Y.; Ma, S.; Qiu, X.; Zhu, T.; Zheng, M. Modeled deposition of fine particles in human airway in Beijing, China. Atmos. Environ. 2016, 124, 387–395. [Google Scholar] [CrossRef]
- Guo, M.; Lyu, Y.; Xu, T.; Yao, B.; Song, W.; Li, M.; Yang, X.; Cheng, T.; Li, X. Particle size distribution and respiratory deposition estimates of airborne perfluoroalkyl acids during the haze period in the megacity of Shanghai. Environ. Pollut. 2018, 234, 9–19. [Google Scholar] [CrossRef] [PubMed]
- Brown, J.S.; Zeman, K.L.; Bennett, W.D. Ultrafine particledeposition and clearance in the healthy and obstructedlung. Am. J. Respir. Crit. Care Med. 2002, 166, 1240–1247. [Google Scholar] [CrossRef] [Green Version]
- Chalupa, D.C.; Morrow, P.E.; Oberdörster, G.; Utell, M.J.; Frampton, M.W. Ultrafine Particle Deposition in Subjects with Asthma. Environ. Health Perspect. 2004, 112, 879–882. [Google Scholar] [CrossRef] [Green Version]
Figure 1.
Location of sampling place.

Figure 2.
Measuring points and devices.

Figure 3.
Ranges and average values of I/O ratios in the two measurement seasons for the enclosed sports hall in Warsaw. Presented values are calculated based on the results obtained using the manual method (M).
Figure 3.
Ranges and average values of I/O ratios in the two measurement seasons for the enclosed sports hall in Warsaw. Presented values are calculated based on the results obtained using the manual method (M).

Figure 4.
The average hourly distribution of PM concentrations (μg/m3) inside and outside the hall averaged separately for the non-heating and heating seasons. Presented values are calculated based on results obtained using the automatic method (A).
Figure 4.
The average hourly distribution of PM concentrations (μg/m3) inside and outside the hall averaged separately for the non-heating and heating seasons. Presented values are calculated based on results obtained using the automatic method (A).

Figure 5.
Average percentage shares of individual particulate matter fractions in the total mass of particulate matter inside and outside the sports hall in the time preceding classes in the room (i.e., 08.00–09.50), during classes (i.e., 10.00–14.30), and during hall cleaning after sports activities (i.e., 14.30–16.00) averaged for the non-heating season. These values were calculated based on results obtained using the automatic method (A).

Figure 6.
Average percentage shares of individual particulate matter fractions in the total mass of particulate matter inside and outside the sports hall in the time preceding classes in the room (i.e., 08.00–09.50), during classes (i.e., 10.00–14.30), and during hall cleaning after sports activities (i.e., 14.30–16.00) averaged for the heating season. These values were calculated based on results obtained using the automatic method (A).

Figure 7.
The average daily doses of respirable dust (PM4) [µg/day] calculated for different groups of sports hall users in heating and non-heating seasons. These values were calculated based on results obtained using the manual method (M).
Figure 7.
The average daily doses of respirable dust (PM4) [µg/day] calculated for different groups of sports hall users in heating and non-heating seasons. These values were calculated based on results obtained using the manual method (M).


Table 1.
Calibration factors (CF) determined based on equivalence tests.
| Season | Photometer | Indoor | Outdoor | ||||||
|---|---|---|---|---|---|---|---|---|---|
| PM4 | TSP | PM4 | TSP | ||||||
| p | CF | p | CF | p | CF | p | CF | ||
| Summer | DustTrak 8534 | 0.00011 | 0.16 | 0.00164 | 0.21 | 0.00021 | 0.18 | 0.00031 | 0.24 |
| DustTrak 8533 | 0.00085 | 0.18 | 0.00171 | 0.22 | 0.00044 | 0.19 | 0.00042 | 0.25 | |
| Winter | DustTrak 8534 | 0.00198 | 0.19 | 0.00014 | 0.19 | 0.0064 | 0.23 | 0.00144 | 0.25 |
| DustTrak 8533 | 0.00199 | 0.20 | 0.00018 | 0.20 | 0.0068 | 0.24 | 0.00197 | 0.25 | |
p—statistical significance.
Table 2.
Values of coefficients assumed for estimating the lifetime doses of respirable dust (PM4) inhaled while using the sports hall for two groups of users.
Table 2.
Values of coefficients assumed for estimating the lifetime doses of respirable dust (PM4) inhaled while using the sports hall for two groups of users.
| Parameter | Pupils (≤18 Years Old) | Teachers/Trainers (>18 Years Old) | Athletes (>18 Years Old) | Source |
|---|---|---|---|---|
| InhR [m3/day] | 7.63 (7.94*) | 15.2 | 15.2 (19.0*) | [29] |
| Daily exposition (h) | 1 | 8 | 6 | - |
InhR is an inhalation factor; * increased inhalation due to physical activity [13].
Table 3.
Descriptive statistics of a series of 8-h concentrations of PM1, PM2.5, PM4, PM10, and TSP (µg/m3) determined in the sports hall (I) and its external surroundings (O) in the summer (non-heating) and winter (heating) seasons.
Table 3.
Descriptive statistics of a series of 8-h concentrations of PM1, PM2.5, PM4, PM10, and TSP (µg/m3) determined in the sports hall (I) and its external surroundings (O) in the summer (non-heating) and winter (heating) seasons.
| Statistical Parameter | Place of Measurements | Non-Heating Season | Heating Season | ||||||||||||||||
|---|---|---|---|---|---|---|---|---|---|---|---|---|---|---|---|---|---|---|---|
| PM1 | PM2.5 | PM4 | PM10 | TSP | REPI a | PM1 | PM2.5 | PM4 | PM10 | TSP | REPI a | ||||||||
| A | M | A | M | P2.5 | PM10 | A | M | A | M | P2.5 | PM10 | ||||||||
| Mean [µg/m3] | I | *29** | *30** | *31** | *18** | *40 | *62 | *24** | 17 | 23 | *38** | *39** | *40** | *33** | *45 | 56 | 52** | 31 | 29 |
| O | *22** | *23** | *24** | *13** | *27** | *32** | *17** | *52** | *52** | *53** | *48** | *55** | 59** | 54** | |||||
| Minimum [µg/m3] | I | 8 | 8 | 9 | 11 | 11 | 13 | 15 | 11 | 13 | 9 | 9 | 9 | 28 | 10 | 10 | 37 | 8 | 6 |
| O | 3 | 3 | 3 | 10 | 4 | 6 | 12 | 5 | 5 | 5 | 22 | 6 | 6 | 27 | |||||
| Maximum [µg/m3] | I | 172 | 174 | 179 | 29 | 217 | 379 | 54 | 26 | 39 | 142 | 143 | 146 | 40 | 171 | 500 | 68 | 62 | 76 |
| O | 169 | 174 | 174 | 29 | 179 | 190 | 31 | 164 | 164 | 165 | 51 | 168 | 174 | 74 | |||||
| Median [µg/m3] | I | 13 | 13 | 14 | 15 | 19 | 39 | 20 | 17 | 22 | 16 | 16 | 16 | 33 | 18 | 29 | 53 | 30 | 28 |
| O | 14 | 14 | 15 | 13 | 15 | 17 | 15 | 34 | 34 | 34 | 33 | 35 | 36 | 50 | |||||
| Standard deviation | I | 12.8 | 13.3 | 14.2 | 4.8 | 18.8 | 38.9 | 10.1 | 3.4 | 6.8 | 14.0 | 13.9 | 13.8 | 3.3 | 13.9 | 19.9 | 11.4 | 14.5 | 14.8 |
| O | 14.3 | 14.4 | 14.6 | 4.9 | 15.4 | 17.1 | 5.6 | 34.0 | 34.2 | 34.3 | 9.1 | 34.9 | 36.4 | 14.0 | |||||
I (indoor) indicates measurements inside the sports hall; O (outdoor) indicates measurements outside the sports hall; A indicates results obtained by automatic methods; M indicates results obtained by manual methods; * indoor and outdoor concentrations are statistically different; ** PM fractions whose indoor or outdoor concentrations in non-heating season are statistically different from those in heating season (both according to Mann-Whitney U test, p < 0.05); a Arithmetic means calculated for measurements periods based on 1-h concentrations measured by Regional Environmental Protection Inspectorate at Warsaw-Targówek station (PM2.5—manual; PM10—automatic station). Descriptive statistics were calculated for 20 days of 8-h measurements conducted separately in the summer and winter. The measurements were carried out using PM concentration readings every 1 s and averaging every 3 min. Three-minute data were averaged first to one hour, then hourly data were averaged for each measurement day (8-h average); 20 daily data were averaged in each measurement period. The measurements were carried out on: May 18, 19, 22, 23, 24, 25, 26, 29, 30, 31, June 05, 06, 07, 08, 09, 12, 13, 14, 19, and 21 (summer); and October 16, 17, 23, 24, 25, 26, 27, 30, 31, November 03, 06, 07, 08, 09, 10, 13, 14, 16, 17, and 20 (winter).
© 2019 by the authors. Licensee MDPI, Basel, Switzerland. This article is an open access article distributed under the terms and conditions of the Creative Commons Attribution (CC BY) license (http://creativecommons.org/licenses/by/4.0/).
Share and Cite
MDPI and ACS Style
Bralewska, K.; Rogula-Kozłowska, W.; Bralewski, A. Size-Segregated Particulate Matter in a Selected Sports Facility in Poland. Sustainability 2019, 11, 6911. https://0-doi-org.brum.beds.ac.uk/10.3390/su11246911
AMA Style
Bralewska K, Rogula-Kozłowska W, Bralewski A. Size-Segregated Particulate Matter in a Selected Sports Facility in Poland. Sustainability. 2019; 11(24):6911. https://0-doi-org.brum.beds.ac.uk/10.3390/su11246911
Chicago/Turabian StyleBralewska, Karolina, Wioletta Rogula-Kozłowska, and Adrian Bralewski. 2019. "Size-Segregated Particulate Matter in a Selected Sports Facility in Poland" Sustainability 11, no. 24: 6911. https://0-doi-org.brum.beds.ac.uk/10.3390/su11246911
Note that from the first issue of 2016, this journal uses article numbers instead of page numbers. See further details here.