Article

Targeting Remediation Dredging by Ecological Risk Assessment of Heavy Metals in Lake Sediment: A Case Study of Shitang Lake, China

1
Key Laboratory of Integrated Regulation and Resource Development on Shallow Lakes, Ministry of Education, College of Environment, Hohai University, Nanjing 210098, China
2
National Key Laboratory of Water Environmental Simulation and Pollution Control, South China Institute of Environmental Sciences, Ministry of Ecology and Environment, Guangzhou 510530, China
*
Authors to whom correspondence should be addressed.
Sustainability 2019, 11(24), 7251; https://0-doi-org.brum.beds.ac.uk/10.3390/su11247251
Submission received: 25 October 2019 / Revised: 7 December 2019 / Accepted: 9 December 2019 / Published: 17 December 2019

Abstract

:
Understanding the spatial distribution and pollution characteristics of heavy metals in lake sediment is crucial for studying deposition and migration processes, assessing lake conditions, and determining the extent of remediation dredging. The present work is a case study of heavy metal pollution in Shitang Lake in Anhui province, China. Heavy metal concentrations were determined in sediment at locations across the lake to a depth of 100 cm, and pollution levels were assessed on the basis of the Geoaccumulation Index (Igeo) and Potential Ecological Risk Index (RI). Hg and Cd were the predominant heavy metals in the sediment, and the Igeo and RI indicated high pollution levels in the northern and southern zones of the lake. These findings can be used to guide the prioritization of dredging operations.

1. Introduction

Shallow lakes are a significant part of wetland ecosystems. They provide a habitat for birds and serve important functions in flood control, water supply, aquaculture, fishing, and recreation. Additionally, these lakes play a vital role in population and industrial centers [1]. However, increasing industrial wastewater and domestic sewage are deteriorating water quality, degrading the ecosystem, and causing eutrophication and other problems [2,3,4]. The anthropogenic impact on the lake waters include a significant heavy metal load which easily accumulates in lake sediment and are sources of sustained pollution. These potentially hazardous elements can represent a threat for the safety of water supply since they can be remobilized by changes in environmental conditions (redox potential, pH, dissolved oxygen, and water temperature) [5,6]. Therefore, it is essential to study the horizontal and vertical distribution and pollution characteristics of heavy metals in sediment and analyze the impact on water quality, which is of great guiding significance for reasonably determining the extent of sediment dredging and ensuring the safety of lake water sources. The Geoaccumulation Index (Igeo) and Potential Ecological Risk Index (RI) are widely used to evaluate the pollution and ecological risk level of heavy metals in soil and lake sediment environments [7,8,9]. In this research, Shitang Lake in China was chosen as a case study in an attempt to assess heavy metals in lake sediment by means of the Igeo and RI methods and determine the dredging extent. This study intends to provide guidelines for the remediation policy of these lakes, particularly for the lake sediment dredging. However, the results include some uncertainty due to limitations in the assessment method.

2. Materials and Methods

2.1. Study Area

Shitang Lake, situated at the north bank of the Yangtze River in Anqing City, Anhui province, China, is a small shallow lake with an area of about 14 km2, mean water depth of 1.52 m, and a maximum water depth of 2.5 m. Water exchange in Shitang Lake mainly depends on surface runoff and lake surface precipitation, and the mean annual water level is 12.11 m with a water depth of 1.52 m. Shitang Lake is a grass-type lake (a lake whose ecological conditions have not been destroyed, with a large number of cultivated aquatic vascular plants) and its water quality was good in the 1980s [10]. However, in recent decades, large amounts of nutrients and heavy metals have been discharged into the lake and have accumulated in bottom sediments. Influenced by the expanding aquaculture area and increasing domestic wastewater effluent, the aquatic vegetation has sharply decreased, and eutrophication has gradually increased.

2.2. Sampling Sites and Sample Collection

Twenty-seven sampling locations across Shitang Lake were selected according to morphology, river reach, hydrodynamics, and sources of pollution. The distribution of sampling locations is shown in Figure 1, in which R denotes the sites near the river estuary, and L denotes the sites in the lake. Samples were collected in August 2017 by the use of a columnar sediment sampler. Columnar sediment samples were collected at L4 and L9 sites, whereas only surface sediments were collected at the other sampling locations. L4 and L9 are near the main urban area and the columnar samples of these two sites were relatively complete, so they were chosen for the analysis of concentration and RI with depth. Columnar samples were divided into eight layers corresponding to different depth intervals: 20–30 cm, 30–40 cm, 40–50 cm, 50–60 cm, 60–70 cm, 70–80 cm, 80–90 cm, and 90–100 cm. All samples were placed in self-sealing polyethylene bags and stored at 0 °C.

2.3. Sample Processing and Analysis

Each sediment sample was freeze-dried, ground with a mortar, and passed through a 100-mesh sieve. Then, 1 g of the pro-processed sediment sample was digested with HClO4-HNO3-HF, and concentrations of Zn, Pb, Cu, As, Ni, Cd, and Cr in the extracts were determined using an atomic absorption spectrophotometer (Agilent 7700X ICP-MS, Santa Clara, CA, USA). The concentrations of Hg in the extracts were determined using a Hydra-c type automatic mercury analyzer (LEEMAN LABS INC, Mason, OH, USA). All chemical analyses and control experiments were conducted in duplicate to ensure the accuracy of the heavy metal sample analyses, and the standard deviations were all within 10%.

2.4. Methods

2.4.1. Geoaccumulation Index

The Geoaccumulation Index (Igeo) was introduced by Muller at the University of Heidelberg, Germany [11]. Igeo is a concise representation of the level of heavy metal pollution and considers anthropogenic pollution factors, environmental geochemical background values, and factors that may cause a change in background values. The formula is as follows:
I g e o = log 2 ω i / k ω n i
where I g e o denotes the Igeo, ω i denotes the mass fraction of heavy metal i in sediment, mg/kg, ω n i denotes geochemical background values of heavy metal i in sedimentary rocks, mg/kg (in this study, the environmental background values of heavy metals in the soils of Anhui province were used), and k is a constant that accounts for the variation in background values that may be caused by digenesis, and its value is usually 1.5. Table 1 shows the seven classification levels of heavy metal pollution in sediment, with the levels defined by the values of I g e o [12]. Table 2 provides a reference for the environmental background values of heavy metals in Anhui province [13].

2.4.2. Potential Ecological Risk Index

The potential ecological risk index considers the toxicity of heavy metals, the sensitivity of the assessment area to heavy metal pollution, and the difference in the regional background values of heavy metals. This index can comprehensively reflect the potential ecological impact of heavy metals in sediment [14]. The formula is as follows:
C f i = ω i / ω n i
E r i = T r i · C f i
R I = i = 1 m E r i
where C f i denotes the pollution index of heavy metal i, and E r i denotes the potential ecological risk index of heavy metal i. T r i denotes the toxicity response coefficient of heavy metal i, and it indicates the toxicity level of heavy metal i and the sensitivity of organisms to heavy metal i, the T r i values for Hg, Zn, Pb, Cu, As, Ni, Cd, and Cr are 40, 1, 5, 5, 10, 5, 30, and 2, respectively. R I denotes the sum of the potential ecological risk index of m heavy metals. Table 3 provides the potential ecological risk index of each heavy metal ( E r i ), the comprehensive potential ecological Risk Index ( R I ), and the potential ecological risk level classification.

2.4.3. The Inverse Distance Weighted Method

The Inverse Distance Weighted (IDW) interpolation method is based on the principle of the extent of similarity: if two objects are closer together, then their properties are more similar. Conversely, if the objects are farther, then their properties are less similar. The method uses the distance between the interpolation points and the sample point as a weighted average, and the closer the sample point, the greater is the weight given to the sample point. The general formula of IDW is as follows:
Z S 0 = i = 1 N λ i Z S i
where Z S 0 is the prediction value in S 0 , N is the number of samples around the predicted points to be used in the prediction calculation process,   λ i is the weight of each sample used in the prediction calculation process, and Z S i is the measured value obtained at i.

3. Results

3.1. Heavy Metal Concentration in the Surface Layer of Sediment

Table 4 presents descriptive statistics of heavy metal concentrations in the surface layer of bed sediment in Shitang Lake. Zn shows the highest concentrations, with a range of 52.3–149.0 mg/kg and a mean of about 98.9 mg/kg. On the contrary, Hg shows the lowest concentrations, with a minimum of 0.032 mg/kg, a maximum of 0.294 mg/kg, and a mean value of 0.110 mg/kg. According to the published literature [13], the background values for Hg, As, Pb, Cu, Zn, Ni, Cr, and Cd are 0.033, 9, 26.6, 20.4, 62, 29.8, 66.5, and 0.097 mg/kg, respectively. They are generally lower than the measured values. The coefficient of variation of each heavy metal fluctuates from 24.4% to 60.6%, with Hg having the highest and Cu having the lowest.

3.2. The Geoaccumulation Index and Potential Ecological Risk Index of Heavy Metals in the Surface Layer of Sediment

3.2.1. The Geoaccumulation Index and Ecological Risk Level of Single Elements

The Igeo and RI values for each heavy metal in the surface sediment are shown in Figure 2. The Igeo values of As, Pb, Cu, Zn, Ni, and Cr are all below 1, meaning that sediments are unpolluted with regards to these elements. The Igeo values of Hg and Cd are higher than 1, indicating that they reach the risk level. The RI values of As, Pb, Cu, Zn, Ni, and Cr are all below 40, which reveals their low levels. The RI of Hg varies from less than 40 to greater than 320, denoting risk level from low to high. The mean ecological risk level of Hg is higher. The RI levels of Cd range from low to higher, and the mean ecological risk level is moderate. Both Igeo and RI show that Hg and Cd are predominant among the eight heavy metals measured.

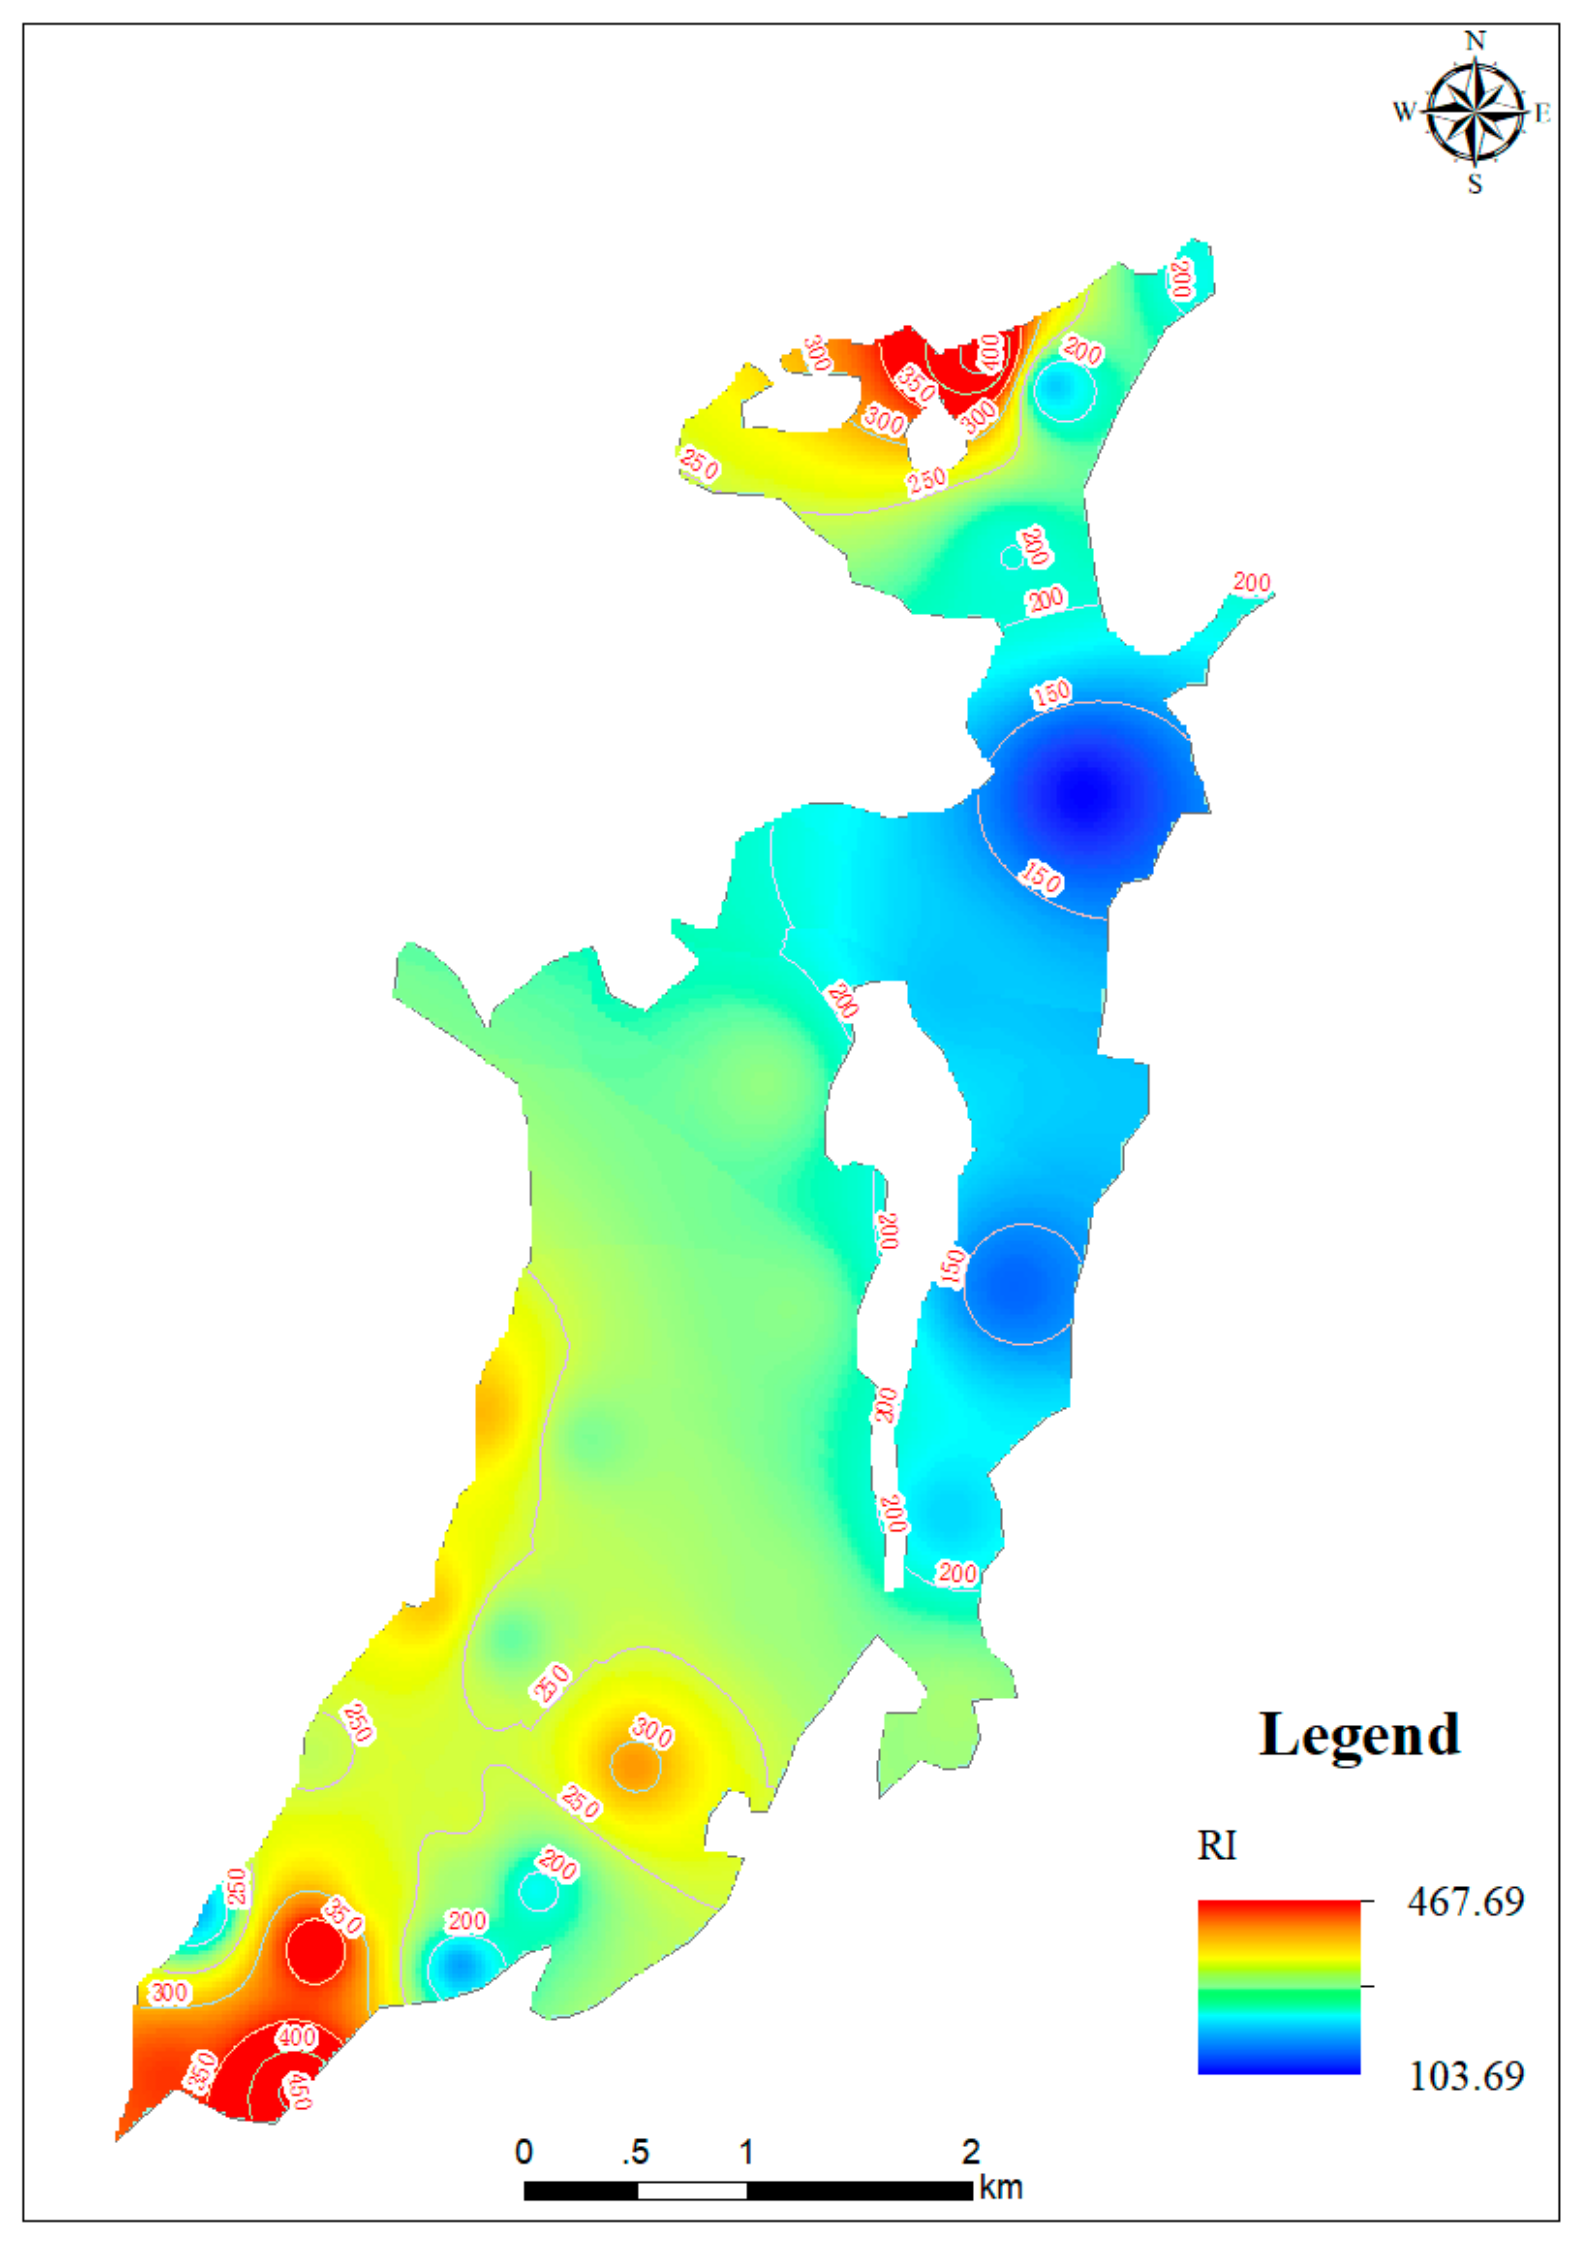
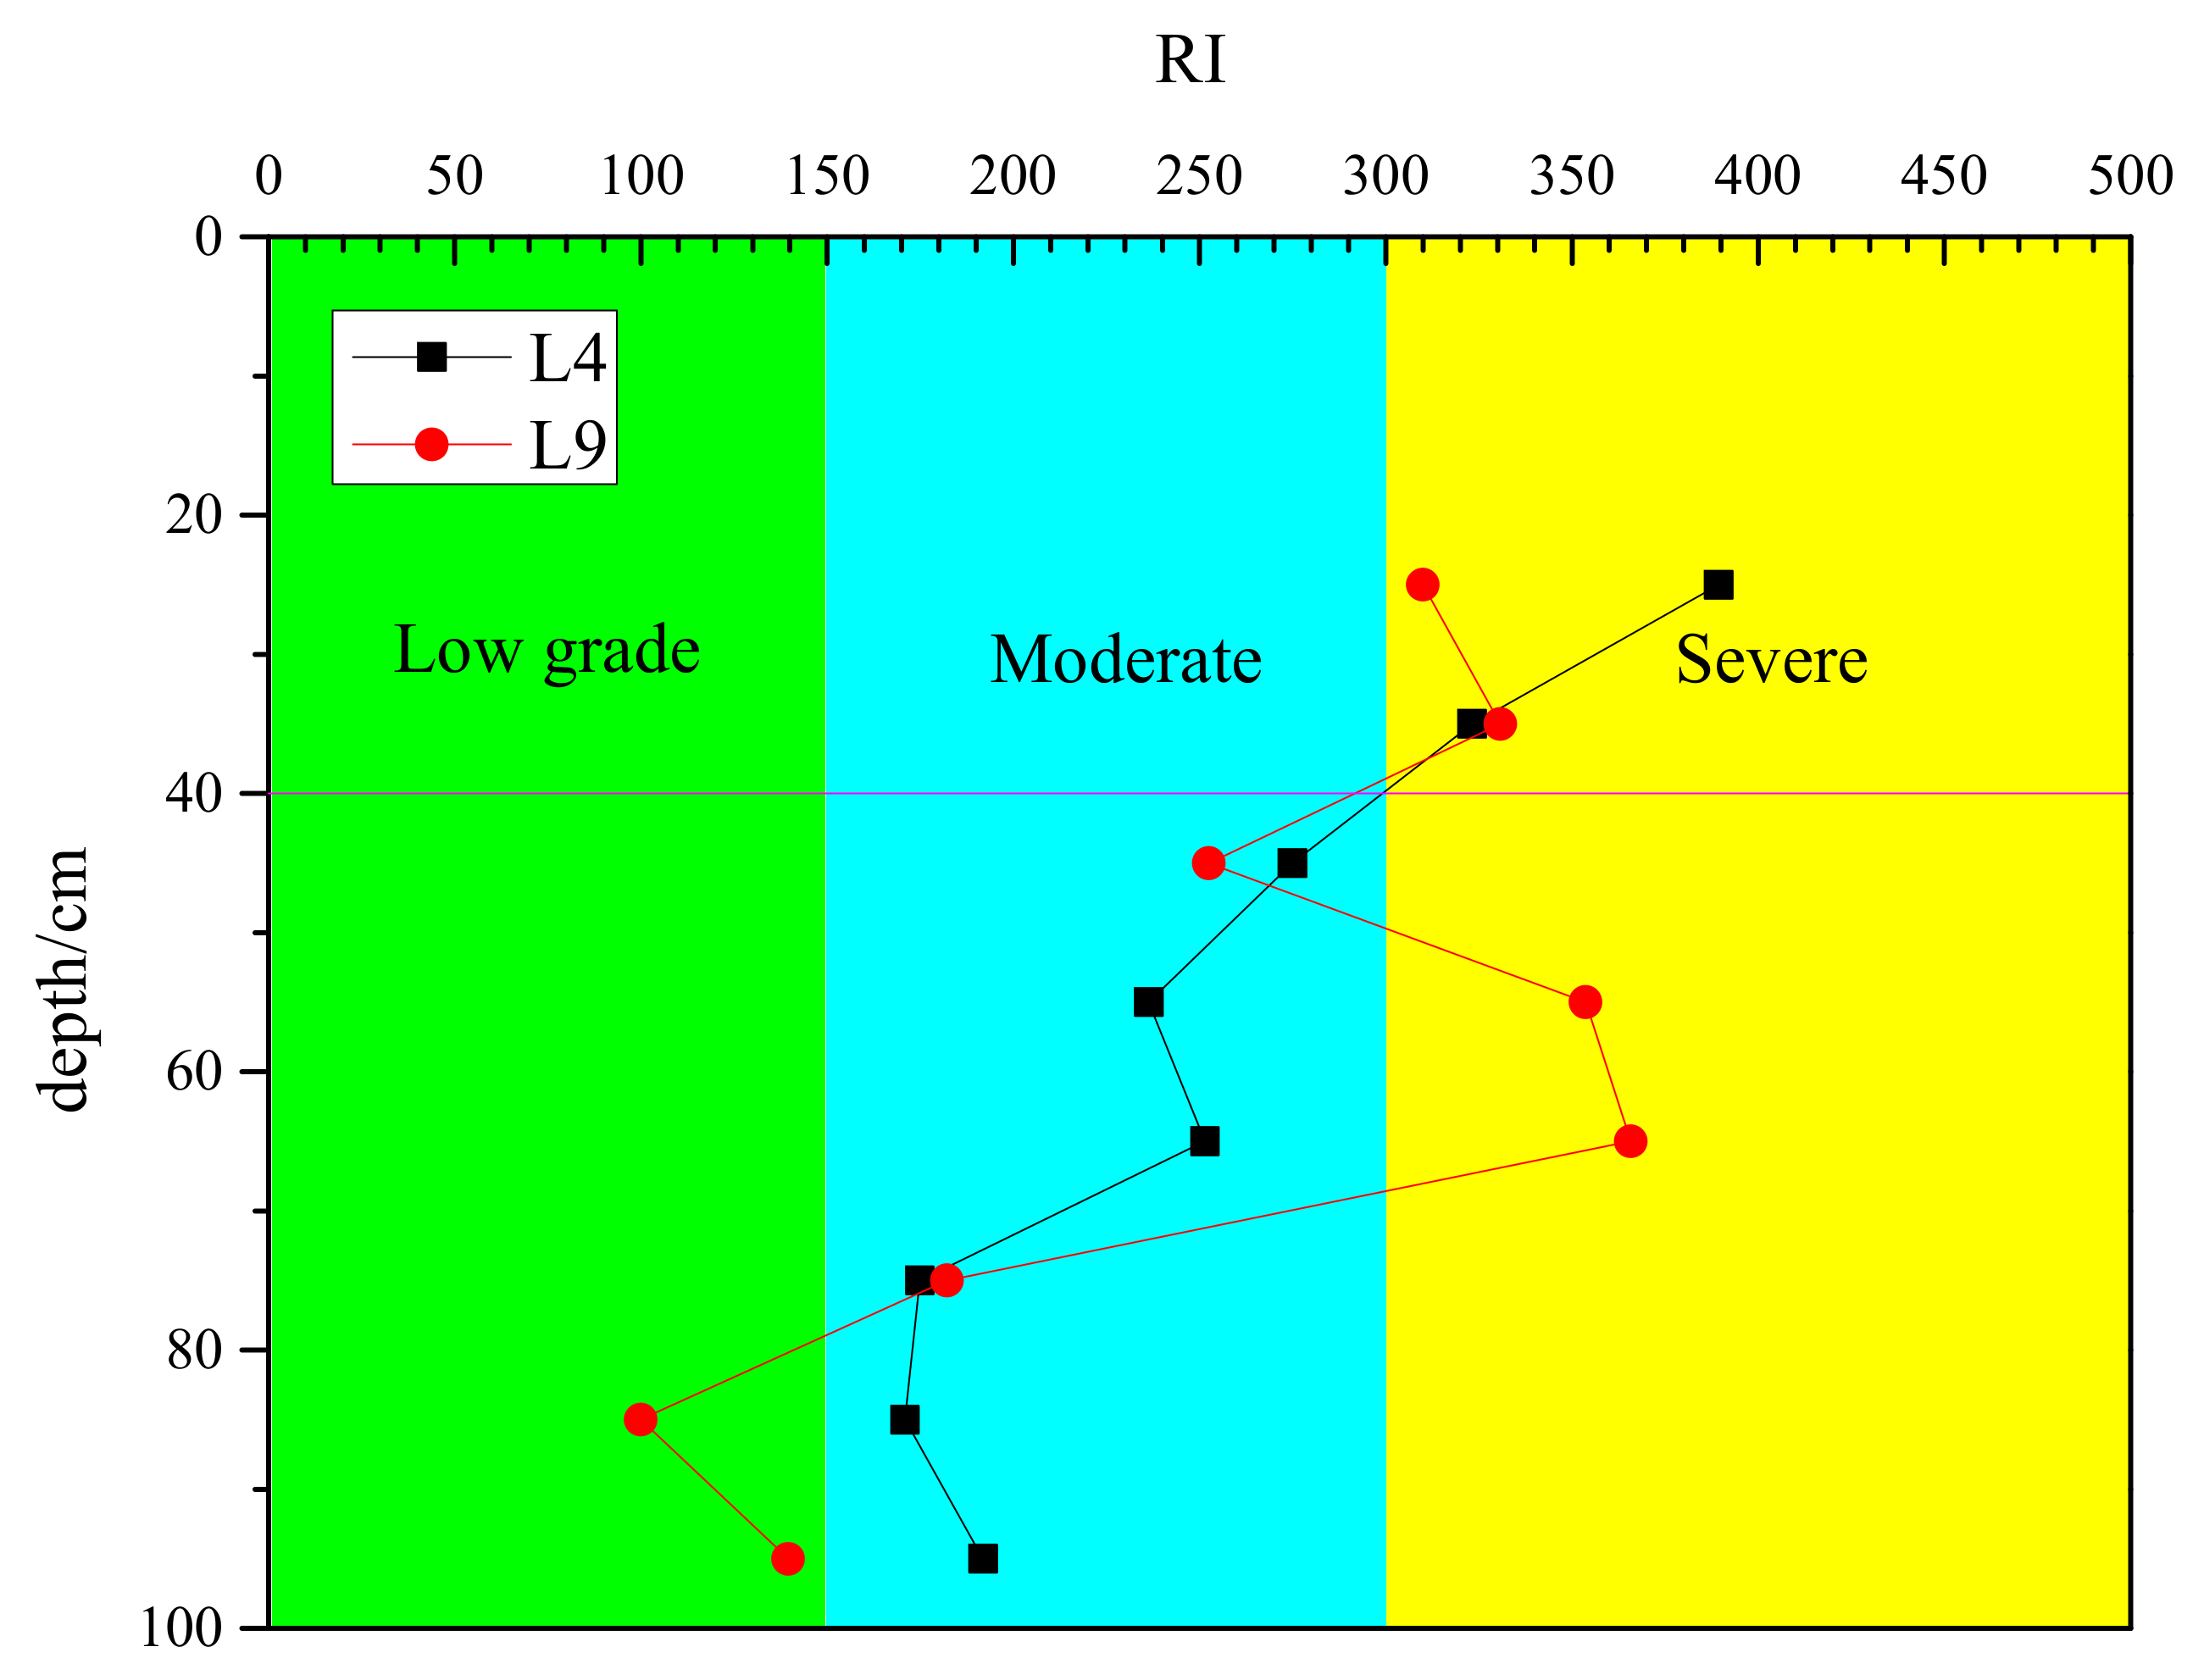
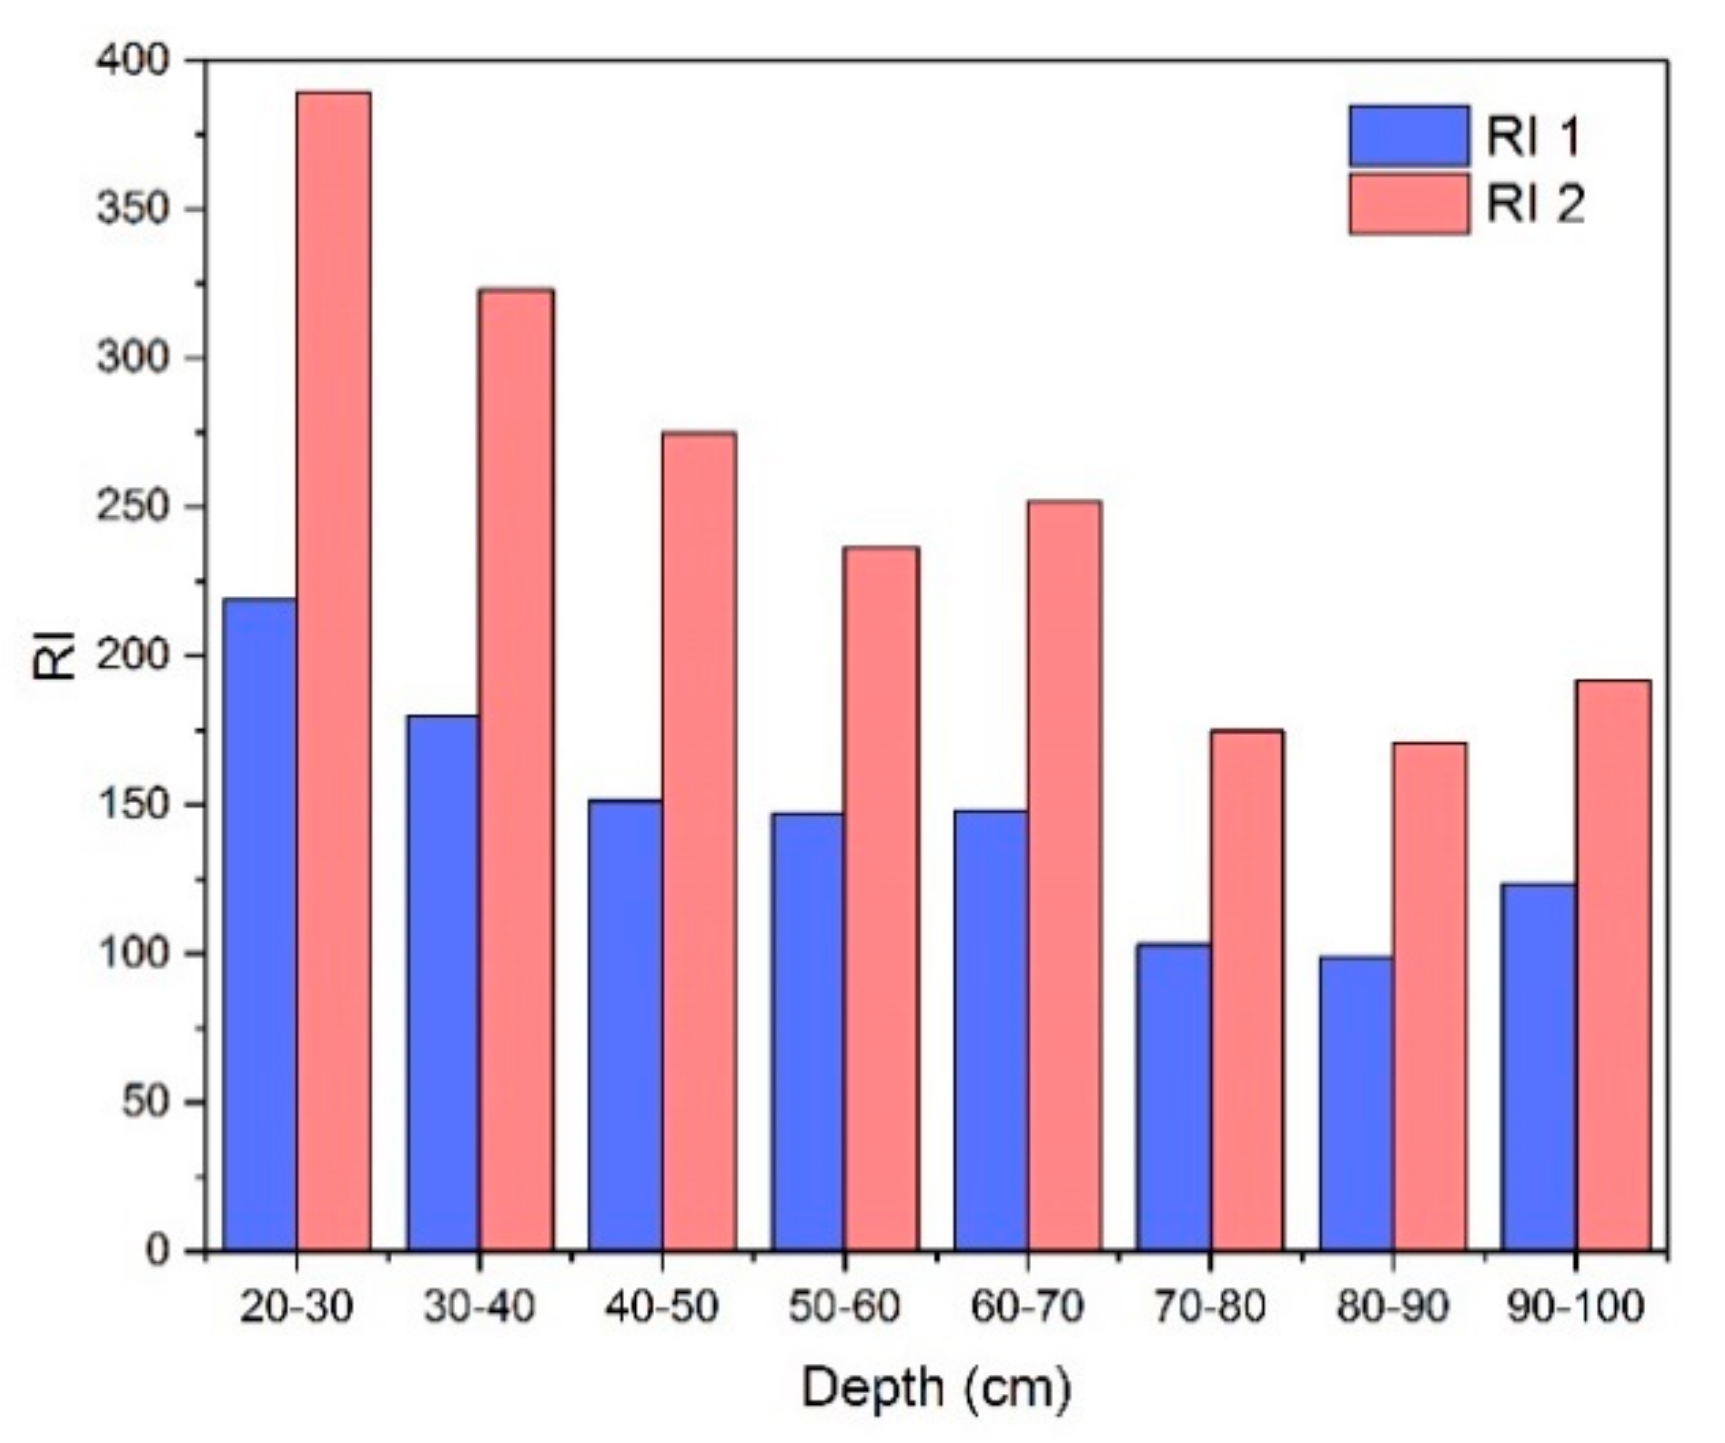
3.2.2. General Ecological Risk Level

The RI of heavy metals in the surface layer of sediment at each sampling site was calculated and interpolated to the entirety of Shitang Lake by the IDW method. The spatial distribution of the RI of heavy metals and contours with intervals of about 50 are shown in Figure 3. An RI value of heavy metals higher than 300, which represents the level of severe ecological risk, was found in the northern and southern areas of this lake.
The contents of Hg, As, Pb, Cu, Zn, Ni, Cr, and Cd in eight depth layers at the two sampling sites (L4 and L9) were determined. The RI values of heavy metals at different depths were calculated and are shown in Figure 4. Besides, the vertical concentration of heavy metals at sampling sites of L4 and L9 can be seen in Table 5 and Table 6. It is evident that the RI gradually decreases with increasing depth. At L4 and L9, the RI values exceed 300 at depths less than 40 cm, meaning these sites are at the level of severe ecological risk at these depths. At L9, RI is below 300 at a depth between 40 and 50 cm and at a depth greater than 70 cm. The results suggest that the severe ecological risk level component of the sediment is mostly within the top 40 cm and is the most important to dredge.

4. Discussion

Heavy metals in aquatic ecosystems have increased significantly due to increasing industrial wastewater inputs. Previous study results have indicated that the overall concentration of heavy metals in sediment decreases with depth [15]. The vertical concentration profiles of heavy metals in lake sediment generally show that the maximum concentration is in the surface sediment, although higher concentrations at greater depths are observed for L9 (Figure 4). The transportation of water and sediment plays an essential role in the distribution of heavy metals in lake sediments. Fine-grained sediment, which mainly deposits in surface lake sediment, is closely associated with heavy metal content. Because clay has a large specific surface area and pore volume, it can adsorb more heavy metals, which is one of the reasons for the high concentration of heavy metals in surface sediments [16]. Since during the resuspension and transportation process, particles with small sizes deposit in the surface sediment. Higher concentrations near the surface are most likely due to retention by mineral and sedimentary organic matter. However, as shown in Figure 4, as depth in L9 increases from 40 cm to 70 cm, the concentration of heavy metals increases, which indicates that bioturbation can transport secondary substances to deeper layers in sediments. Some benthic organisms in sediments absorb surface sediments and carry them to the bottom sediments [17]. As a result of the metabolism of these benthic organisms, the concentrations of heavy metals increase in the bottom sediments.
The mean contents of each heavy metal in several other lakes in China are shown in Table 7. The data in the last row are the average values for Shitang Lake, and they are generally lower than those for the other lakes. The Igeo and RI of heavy metals at each sampling site are high, especially those of Hg and Cd. However, the mean contents of Hg and Cd in Shitang Lake do not exceed those of other lakes in China, including Chaohu Lake, which is near the study region and has a lower RI [18] because the selected background values of heavy metal contents are quite different. A comparison of the RI values derived from different background values in this study indicates that using regional background values in Anhui province results in an RI that is 41% higher than the RI calculated using the concentration of heavy metals at the maximum depth (Figure 5). It is difficult to acquire standard background values of heavy metal contents because the spatial difference in heavy metal content is influenced by many factors, especially the geomorphic diversity of river basins. This means the results have a large degree of uncertainty that is induced by the selection of background values. Therefore, uncertainty analysis is needed for a comprehensive ecological risk assessment. The RI values are high for heavy metals in sediments in the northern and southern zones of Shitang Lake, which are areas with concentrated human activity. Areas in which RI exceeds 300 are at the severe level and should be a priority for dredging. Generally, RI gradually decreases with increasing depth. The depth of 40 cm can be used as a threshold value for sediment dredging in Shitang Lake. This depth is the lake sediment layer that is full of nutrients which are easily released by sediment resuspension and play a key role in lake eutrophication [19,20].

5. Conclusions

The geoaccumulation index (Igeo) and the potential ecological risk index indicate that heavy metal pollution is high in the sediment of Shitang Lake, and Hg and Cd are the most serious polluting elements, considering comparative background levels. The most heavily polluted area is in the south of Shitang Lake at a depth of about 0.4 m. These findings can be used to support government decision making about sediment dredging. Ecological risk assessment (RI) of heavy metals, both laterally and with depth, is more useful than the Igeo because the RI is sensitive to the background values and toxicity levels of the metals. Uncertainty and sensitivity analyses of this parameter and studies on the accumulation and transportation of heavy metals in sediment need to be carried out in the future.

Author Contributions

Conceptualization, W.W. and Z.F., methodology, Z.F., formal analysis, W.W. and Z.F., investigation Z.F., S.L. and Z.W.; data curation, Z.W.; writing—original draft preparation, Z.F.; writing review and editing, W.W. and C.T.; supervision, Y.L. and F.Z.; project administration, Y.L.; funding acquisition, Y.L.

Funding

This research was funded by the Fundamental Research Funds for the Central Universities (No. 2017B20514) and PAPD, Chinese National Science Foundation (51809102, 51579071), Key-Area Research and Development Program of Guangdong Province (2019B110205003).

Acknowledgments

We thank all the authors who contribute to this article.

Conflicts of Interest

The authors declare no conflict of interest.

References

  1. Mäler, K.; Xepapadeas, A.; De Zeeuw, A. The economics of shallow lakes. Environ. Resour. Econ. 2003, 26, 603–624. [Google Scholar] [CrossRef]
  2. Vardanyan, L.G.; Ingole, B.S. Studies on heavy metal accumulation in aquatic macrophytes from Sevan (Armenia) and Carambolim (India) lake systems. Environ. Int. 2006, 32, 208–218. [Google Scholar] [CrossRef] [PubMed]
  3. Xu, H.; Paerl, H.W.; Qin, B.; Zhu, G.; Hall, N.S.; Wu, Y. Determining critical nutrient thresholds needed to control harmful cyanobacterial blooms in eutrophic Lake Taihu, China. Environ. Sci. Technol. 2014, 49, 1051–1059. [Google Scholar] [CrossRef] [PubMed]
  4. Ye, H.; Yang, H.; Han, N.; Huang, C.; Huang, T.; Li, G.; Yuan, X.; Wang, H. Risk Assessment Based on Nitrogen and Phosphorus Forms in Watershed Sediments: A Case Study of the Upper Reaches of the Minjiang Watershed. Sustainability 2019, 11, 5565. [Google Scholar] [CrossRef] [Green Version]
  5. Moalla, S.; Awadallah, R.M.; Rashed, M.N.; Soltan, M.E. Distribution and chemical fractionation of some heavy metals in bottom sediments of Lake Nasser. Hydrobiologia 1997, 364, 31–40. [Google Scholar] [CrossRef]
  6. Wojciechowska, E.; Nawrot, N.; Walkusz-Miotk, J.; Matej-Łukowicz, K.; Pazdro, K. Heavy metals in sediments of urban streams: Contamination and health risk assessment of influencing factors. Sustainability 2019, 11, 563. [Google Scholar] [CrossRef] [Green Version]
  7. Varol, M. Assessment of heavy metal contamination in sediments of the Tigris River (Turkey) using pollution indices and multivariate statistical techniques. J. Hazard. Mater. 2011, 195, 355–364. [Google Scholar] [CrossRef]
  8. Yin, H.; Gao, Y.; Fan, C. Distribution, sources and ecological risk assessment of heavy metals in surface sediments from Lake Taihu, China. Environ. Res. Lett. 2011, 6, 44012. [Google Scholar] [CrossRef]
  9. Zhang, C.; Yang, Y.; Li, W.; Zhang, C.; Zhang, R.; Mei, Y.; Liao, X.; Liu, Y. Spatial distribution and ecological risk assessment of trace metals in urban soils in Wuhan, central China. Environ. Monit. Assess. 2015, 187, 556. [Google Scholar] [CrossRef]
  10. Wang Sumin, D.H.C.K. China Lakes Record; Science Press Ltd.: Beijing, China, 1998; pp. 975–1001. [Google Scholar]
  11. Muller, G. Index of geoaccumulation in sediments of the Rhine River. Geojournal 1969, 2, 108–118. [Google Scholar]
  12. Muller, G. Schwermettalle in den sedimenten des Rheins-Veranderungen seit 1971. Umschau Wissensch Tech. 1979, 79, 778–783. [Google Scholar]
  13. Bureau, N.E.P. The Background Value of Soil Elements in China; China Environmental Science Press: Beijing, China, 1990; pp. 975–1001. [Google Scholar]
  14. Hakanson, L. An ecological risk index for aquatic pollution control. A sedimentological approach. Water Res. 1980, 14, 975–1001. [Google Scholar] [CrossRef]
  15. Xu, Y.; Wu, Y.; Han, J.; Li, P. The current status of heavy metal in lake sediments from China: Pollution and ecological risk assessment. Ecol. Evol. 2017, 7, 5454–5466. [Google Scholar] [CrossRef]
  16. Chen, Y.M.; Gao, J.; Yuan, Y.Q.; Ma, J.; Yu, S. Relationship between heavy metal contents and clay mineral properties in surface sediments: Implications for metal pollution assessment. Cont. Shelf Res. 2016, 124, 125–133. [Google Scholar] [CrossRef]
  17. Chen, X.; Andersen, T.J.; Morono, Y.; Inagaki, F.; Jørgensen, B.B.; Lever, M.A. Bioturbation as a key driver behind the dominance of Bacteria over Archaea in near-surface sediment. Sci. Rep. 2017, 7, 2400. [Google Scholar] [CrossRef]
  18. Shi, Z.F.; Jiang, X.; Yang, S.W.; Jin, X.C.; Cheng, J.M. The spatial and temporal variation characteristics and potential ecological risk assessment of heavy metal pollution in surface sediments of Chaohu. J. Agro Environ. Sci. 2010, 29, 948–954. [Google Scholar]
  19. He, H.; Kang, Y.; Liu, Z. Nitrogen inputs enhance phytoplankton growth during sediment resuspension events: A mesocosm study. Hydrobiologia 2015, 744, 297–305. [Google Scholar] [CrossRef]
  20. Luo, L.C.; Qin, B.Q.; Zhu, G.W. Sediment distribution and the maximum resuspension depth with disturbance in Lake Taihu. J. Sediment Res. 2004, 1, 9–13. (In Chinese) [Google Scholar]
  21. Yuan, Z.; Taoran, S.; Yan, Z.; Tao, Y. Spatial distribution and risk assessment of heavy metals in sediments from a hypertrophic plateau lake Dianchi, China. Environ. Monit. Assess. 2014, 186, 1219–1234. [Google Scholar] [CrossRef]
  22. Hu, C.; Deng, Z.; Xie, Y.; Chen, X.S.; Li, F. The risk assessment of sediment heavy metal pollution in the East Dongting Lake Wetland. J. Chem. 2015, 2015, 835487. [Google Scholar] [CrossRef] [Green Version]
  23. Wan, L.; Xu, L.; Fu, Y. Contamination and risk assessment of heavy metals in lake bed sediment of a large lake scenic area in China. Int. J. Environ. Res. Public Health 2016, 13, 741. [Google Scholar] [CrossRef] [Green Version]
Figure 1. Map of Shitang Lake and distribution of sampling sites (R denotes the sites near the river estuary, and L denotes the sites in the lake).
Sustainability 11 07251 g001
Figure 2. The Igeo and potential ecological risk index of each heavy metal in the surface layer of sediment.
Sustainability 11 07251 g002
Figure 3. Spatial distribution of the potential ecological risk index of heavy metals.
Sustainability 11 07251 g003
Figure 4. The distribution of the potential ecological risk indexes of heavy metals in the vertical profile.
Sustainability 11 07251 g004
Figure 5. The potential ecological risk indexes of heavy metals using different background values: RI 1 is based on the concentration of heavy metals at the maximum depth, and RI 2 is based on regional background values in Anhui province.
Sustainability 11 07251 g005
Table 1. Pollution level classification of heavy metals in sediment.
I g e o LevelPollution Level
00Practically unpolluted
>0 to 11Unpolluted to moderately polluted
>1 to 22Moderately polluted
>2 to 33Moderately to heavily polluted
>3 to 44Heavily polluted
>4 to 55Heavily to extremely polluted
>56Extremely polluted
Table 2. Environmental background values (mg/kg) of heavy metals in Anhui Province.
StatisticHgAsPbCuZnNiCrCd
Min0.0080.711.17.816.93.5160.020
Max0.0339.026.620.4281.629.866.50.097
Mean0.10789.51143144.662.061.11310.344
Std0.02053.385.377.0121.099.9220.720.0612
Table 3. The risk level of a single element (Er) and multiple elements (RI).
E r i Ecological Risk Level of a Single Element R I Level of General
Ecological Risk
<40Low<150Low grade
40 to <80Moderate150 to <300Moderate
80 to <160Higher300 to <600Severe
160 to <320High≥600Serious
≥320Serious
Table 4. Concentration (mg/kg) of heavy metals in the surface layer of sediment.
StatisticHgAsPbCuZnNiCrCd
Min0.0326.037.914.752.313.717.00.113
Max0.29417.1043.040.9149.048.398.50.484
Mean0.11010.6229.528.298.932.465.40.250
CV (%)60.633.628.424.426.329.531.636.6
Std0.0673.578.46.926.09.620.70.092
Table 5. The vertical concentration of heavy metals (mg/kg) at L4.
Index20–30 cm30–40 cm40–50 cm50–60 cm60–70 cm70–80 cm80–90 cm90–100 cm
Hg0.210.180.160.120.130.090.090.09
As10.107.126.908.236.374.713.789.90
Pb31.6029.1025.5028.0027.5022.3024.1025.10
Cu28.4025.9021.2030.0029.0020.0018.0020.80
Zn97.5076.1069.2078.9074.2058.6055.3060.50
Ni42.4041.6036.0046.5044.6020.9022.8024.00
Cr67.1055.7049.1060.0053.4035.8031.8035.20
Cd0.320.260.170.200.210.160.150.17
Table 6. The vertical concentration of heavy metals (mg/kg) at L9.
Index20–30 cm30–40 cm40–50 cm50–60 cm60–70 cm70–80 cm80–90 cm90–100 cm
Hg0.150.190.130.200.200.070.030.05
As8.939.278.2110.9013.307.153.497.86
Pb26.1027.6027.1027.8029.5029.6031.1023.90
Cu28.1029.4024.4033.8037.0026.9014.3021.20
Zn82.8080.1070.2089.9091.8077.6042.6058.60
Ni48.2044.9051.2059.6059.8023.8011.2021.80
Cr61.8064.0043.8072.2078.0072.6041.5052.80
Cd0.320.230.210.250.270.240.150.20
Table 7. Heavy metal concentrations (mg/kg) in the sediment of Shitang Lake compared with those of other lakes in China.
NameHgAsPbCuZnNiCrCdCited References
Taihu Lake0.1113.551.836.7--56.20.94Yin et al., 2011 [8]
Chaohu Lake0.12-25.0323.47153.9927.4551.26-Shi et al., 2010 [18]
Dianchi Lake--126.71122.39201.37117.5988.041.20Yuan et al., 2014 [21]
Dongting Lake--41.70--46.36108.431.71Hu et al., 2015 [22]
Songhuahu--38.2949.4492.6946.7790.73-Wan et al., 2016 [23]
110 lakes in China0.2431.53538.511040810.78Xu et al., 2017 [15]
Shitang Lake0.1110.6229.528.298.932.465.40.25-

