1. Introduction
Hosting, maintaining, and distributing visitors is a key aspect for managers of overcrowded public spaces. During the second half of the 20th century, a previously unknown problem started to affect historic centres: tourism growth gradually began to convert itself into a threat, leading to aggressive urbanistic interventions, and a gradual loss of identity. This paper refers to the historic centre as the primary inhabited settlement of a town or city that forms part of the broader UNESCO definition of historic urban areas [
1,
2]. These areas are defined by a confined space which has undergone few interventions, is of recognizable origin, and is inhabited and alive in its cultural nucleus. The UNWTO has recently reaffirmed that cultural tourism is a major component of international tourism consumption, accounting for over 39% of all tourist arrivals [
3]. At the same time, unplanned peripheral districts—mostly strip development in the form of residential neighbourhoods along the main access routes—have emphasized the need to conserve historic centres as the unique repositories of both the material and the immaterial heritage value of our cities.
The context of cultural heritage preservation has changed over the years. It began with a need for material protection that then evolved later on into a need to protect unique historic heritage. Wider criteria for safeguarding built heritage were later upgraded to site protection and, more recently, to safeguarding heritage assets and the historic landscape. Nowadays any strategy to safeguard a cultural heritage site not only comprises the protection of its integrity, but also the protection of a location and its characteristics, its surroundings, and its immaterial values, as well as local customs and habits that give it a unique identity. Accordingly, local, regional, national, and international administrations have all recognized and taken action over the management of historic centres. Quito Old Town was first listed as a UNESCO World Heritage site in 1978 [
4]; since then, numerous historic centres have successfully joined the list. Listing has brought a change in the perceptions of tourism managers towards the conservation of historic centres and has at times produced unexpectedly higher visitor flows.
Mass tourism can be considered a new habit, insofar as large crowds of tourists from other countries can threaten the very uniqueness of heritage sites. As heritage tourists usually pursue a unique visit, crowded places directly affect the visitor experience, turning sustainable tourism into a considerable challenge [
5].
It is here where tourism management links up with the safeguarding of historic centres: their sustainable management not only involves the conservation of built heritage, but it also addresses the effects that changes in visitor behaviour can bring to socioeconomic and cultural aspects of the site. Sustainable management in that context therefore refers to the need for a holistic approach, based on the integration of morphological, socioeconomic, and cultural factors [
5].
An extensive and massive tourist presence may damage the outstanding tangible and intangible cultural values of heritage sites. Overtourism therefore needs to be managed in a way that will facilitate conviviality and bring economic dynamism to tourist sites. This aim will meet the Triple Bottom Line sustainability strategy (assuring social, environmental, and long-run economic sustainability) where the relationships between social connectedness (coexistence between tourists and inhabitants) and organizational sustainability (managing tourism for economic dynamism) need to be tackled [
6].
Tourism managers, when considering forms of cultural tourism that will enhance rather than threaten local heritage, could always consider the aspects that residents are prepared to reveal about themselves, rather than what tourists might wish to see in the community [
7]. The conservation of heritage sites should therefore comprise the launch of a sustainable tourism strategy and the first step will inevitably be to understand the presence of tourists in historic centres and their movements.
Nowadays, surrounded by the IoT, both the emission and the reception of real-time data on our movements, our likes, and our patterns of consumption are quite feasible; data-mining of big data and Information and communications technologies (ICT) can act as valuable sources of information. The digital revolution and ICTs offer new management models both to city and to urban managers alike, which has led to better interaction with crosscutting and multi-sectorial disciplines. ICTs clearly have the potential to improve the management of heritage sites.
As previously mentioned, the often uncontrolled growth of tourist visits to historic centres is actually a critical issue all around the world. For example, social media and television have been observed to prompt sudden hordes of visitors and even to lead them on to a certain heritage site. Dubrovnik is a reference site in that respect, ever since its appearance in the film and television series, Game of Thrones, that prompted the arrival en masse of tourists to the city [
8]. In 2018, UNESCO voiced warnings that the World Heritage status of the city was at risk because of the surge in tourist numbers. Yet Dubrovnik is no isolated case, as the same TV series has prompted tourism growth of around 3% in San Juan de Gaztelugatxe, in Bizkaia; and the natural landscapes of New Zealand are another well-known case, since tourism in the country has grown by approximately 50% since the release of The Lord of the Rings trilogy [
9].
Sites that open their doors to uncontrolled numbers of tourist visits can have immense opportunities, if visits are motivated by cultural aspects, natural surroundings, and knowledge of the heritage itself [
10]; thus, the management of such tourism is only effective when the local heritage and the social needs of the inhabitants are still intact. The challenge is how to manage the right number of tourists; obtaining the mostly economic benefits of their presence, while enabling the local community to maintain its privacy, traditions, history, and social cohesion. In that sense, one of the five objectives of UNESCO’s World Heritage and Sustainable Tourism Programme, WH+ST 2013–2015 [
11] is to: “Provide World Heritage stakeholders with the capacity and the tools to manage tourism efficiently, responsibly and sustainably based on the local context and needs”.
Cities need to adapt infrastructures, facilities, and attractions to visitor profiles and interests, to ensure a positive experience and, simultaneously, to ensure sustainability and habitability, and to safeguard cultural values. Knowledge of tourist behaviour patterns gives tourism managers the keys to adapt the offer of cultural and tourism services to the visitors, their demands, and the characteristics of the built environment. Intelligent tourism management is a matter of analysing the behaviour of people who visit the historical environments of cities by extracting accurate yet anonymous information that will improve the visitor experience, conserve the site, and facilitate a responsive atmosphere.
The solution proposed here and developed within the Smart Heritage City (SHCITY) Interreg Sudoe project [
12] focuses on safeguarding overcrowded public spaces. The purpose of the research is to demonstrate how the use of new technologies to monitor visitor flows contributes to an informed management and a better organisation of the cultural offer. It addresses sustainable public sector management of urban-based tourism, by monitoring the behavioural patterns of inhabitants and visitors. The project has developed a cloud platform that facilitates the collection, processing, and management of data on pedestrians. The information is collected through deployment of sensors and data are processed through a series of quantitative indicators, which have the objective of assessing the timing of visitors and of identifying potential risk factors related both to overtourism and to the absence of visitors to historic centres. On the one hand, the information provides heritage site managers with evidence-based methods for computer-based decision-making, to move towards sustainable management of tourism. On the other hand, it offers tourists the opportunity to adapt their visit by communicating relevant information, and it offers tools to enhance conviviality between tourists and inhabitants and therefore a high liveability rating within the historic centre. Working towards acceptable levels of liveability and conviviality will ensure the long-term sustainability of touristic activities at the site, assisting the survival of the heritage site in the future, and, finally, generating income while maintaining environmentally responsible behaviour at credible levels [
6].
2. Materials and Methods
2.1. Related Work
The definition of urban strategies for heritage sites that host tourists is firstly dependent on sustainable and methodical management of its visitors. Global tendencies in the digital transformation of the tourism sector, applicable to city centre management, are the smart touristic cities [
13] and particularly the integration of IoT and the use of tourist data [
14]. The aim is therefore to develop through smart tourist destinations “an innovative space, accessible for all, established on a cutting-edge technology infrastructure which guarantees sustainable development of the land, facilitates the interaction and integration of the visitor with the surroundings and increases the quality of their experience in the destination, as well as the quality of life of residents” [
15].
Managing historic centres requires smartification of visitor management systems. It means the use not only of technological developments for statistical site management (Wi-Fi, apps, QR codes, geo-localization, video mapping, augmented reality, etc.), but real-time data processing tracking the mobility of both inhabitants and visitors. It also means using tools to monitor pedestrian flows and to better understand their movement patterns. There is a gap in tourist flow data processing, between macro-scale analyses and micro-scale counting of visitors.
The above-mentioned smartification is negotiated in different ways. With the aim of promoting innovative tourism strategies, the CHRISTA Interreg Europe project [
16], for example, provided a good practice repository for sustainable and responsible tourism at heritage sites. The European INNPACTO project called Tourism of Things [
17] also approached the issue and aimed to create a smart city model for heritage sites via the utilization of intelligent infrastructures and management platforms capable of gathering data from tourists and providing them with new services.
Countries and regions are also implementing smart management strategies for historic centres. There are, for example, several innovative Indian heritage city initiatives that seek to modernize and to smarten up their cultural heritage-based initiatives [
18]. The Smart Destinations España project opted for the replicability of its management strategies and policies as a central objective in the conceptualization of smart touristic cities [
15]. The city of Donostia-San Sebastian is developing a recognized project called SmartKalea [
19], which has the aim of transforming the city into a smart city with a special focus on city centre management and the effects of tourism on daily life [
20]. There are other community engagement initiatives such as the Smart City App Hack project [
21], which engages with citizens and tourists so that they can design the solutions, providing them with capabilities to develop technological tools for coordinating inhabitancy and for the improvement of the visits.
There are several possibilities for monitoring and controlling occupancy levels and the flow of people in cities. Usually, various types of video cameras are employed for that purpose: regular vision, thermal vision, and stereoscopic cameras [
22,
23]. These sorts of optical systems usually rely on enter–exit counts to supply information in real time. Recently, approaches that bypass video networks have been developed. These new approaches make use of existing or new wireless communication networks, such as Wi-Fi, Bluetooth, and mobile networks, counting the number of connected devices in a given area. These data streams provide continuous information on an urban location and temporal activity patterns without recording images [
24].
All these surveillance-related and overcrowding-monitoring applications have advanced greatly with the recent development of the Internet of Things (IoT). They are expected to continue improving and to add impetus to smart and connected cities over the following years, thanks to the benefits of the 5G networks and the application of machine learning and big data techniques [
25].
The use of geographic information systems (GIS) also facilitates the analysis and representation of the spatial distribution of pedestrian numbers and flows in different areas of the environments [
26]. 3-D geospatial visualization eases the interpretation of geographic information by the user. The use of existing data sources and in-place data gathering has taken the project a step beyond traditional ways of conserving and managing cultural heritage.
2.2. Methodological Framework
Unbalanced patterns of visitor movements and poor visitor flow management figure among the threats to cultural tourism. There is a risk of overcrowding in one place and empty places at another, lessening the enjoyment of both inhabitants and tourists, which can detract from the long-term sustainability of the sites. In cities with a high influx of tourists visiting for cultural motives, visitors will often follow pre-established routes, which will add to social, cultural, and particularly economic inequality around heritage sites in the same area. On the one hand, a better understanding of those patterns will help managers to overcome such situations, by promoting less well-known sites, and by distributing and diversifying cultural routes according to the main flows, maximum comfort levels, and occupancy levels based on time slots, weekly patterns, and seasonality. On the other hand, if tourists are informed of occupancy levels, waiting times, and alternatives, there is a greater likelihood that they will change their initial plans for a better experience of the city. If both strategies are addressed, then the visit experience can be substantially improved and positive coexistence between citizens and tourists can be achieved, promoting the overall destination image and its social, cultural, and economic sustainability. A circular tourism strategy must be adopted, in which the impacts on well-being will simultaneously be of value (from a circular perspective) both to residents and to tourists [
27], and thereby offer new effective models to city managers for sustainable management of cultural-led tourism [
28] in historic centres that will bring with it multidimensional benefits.
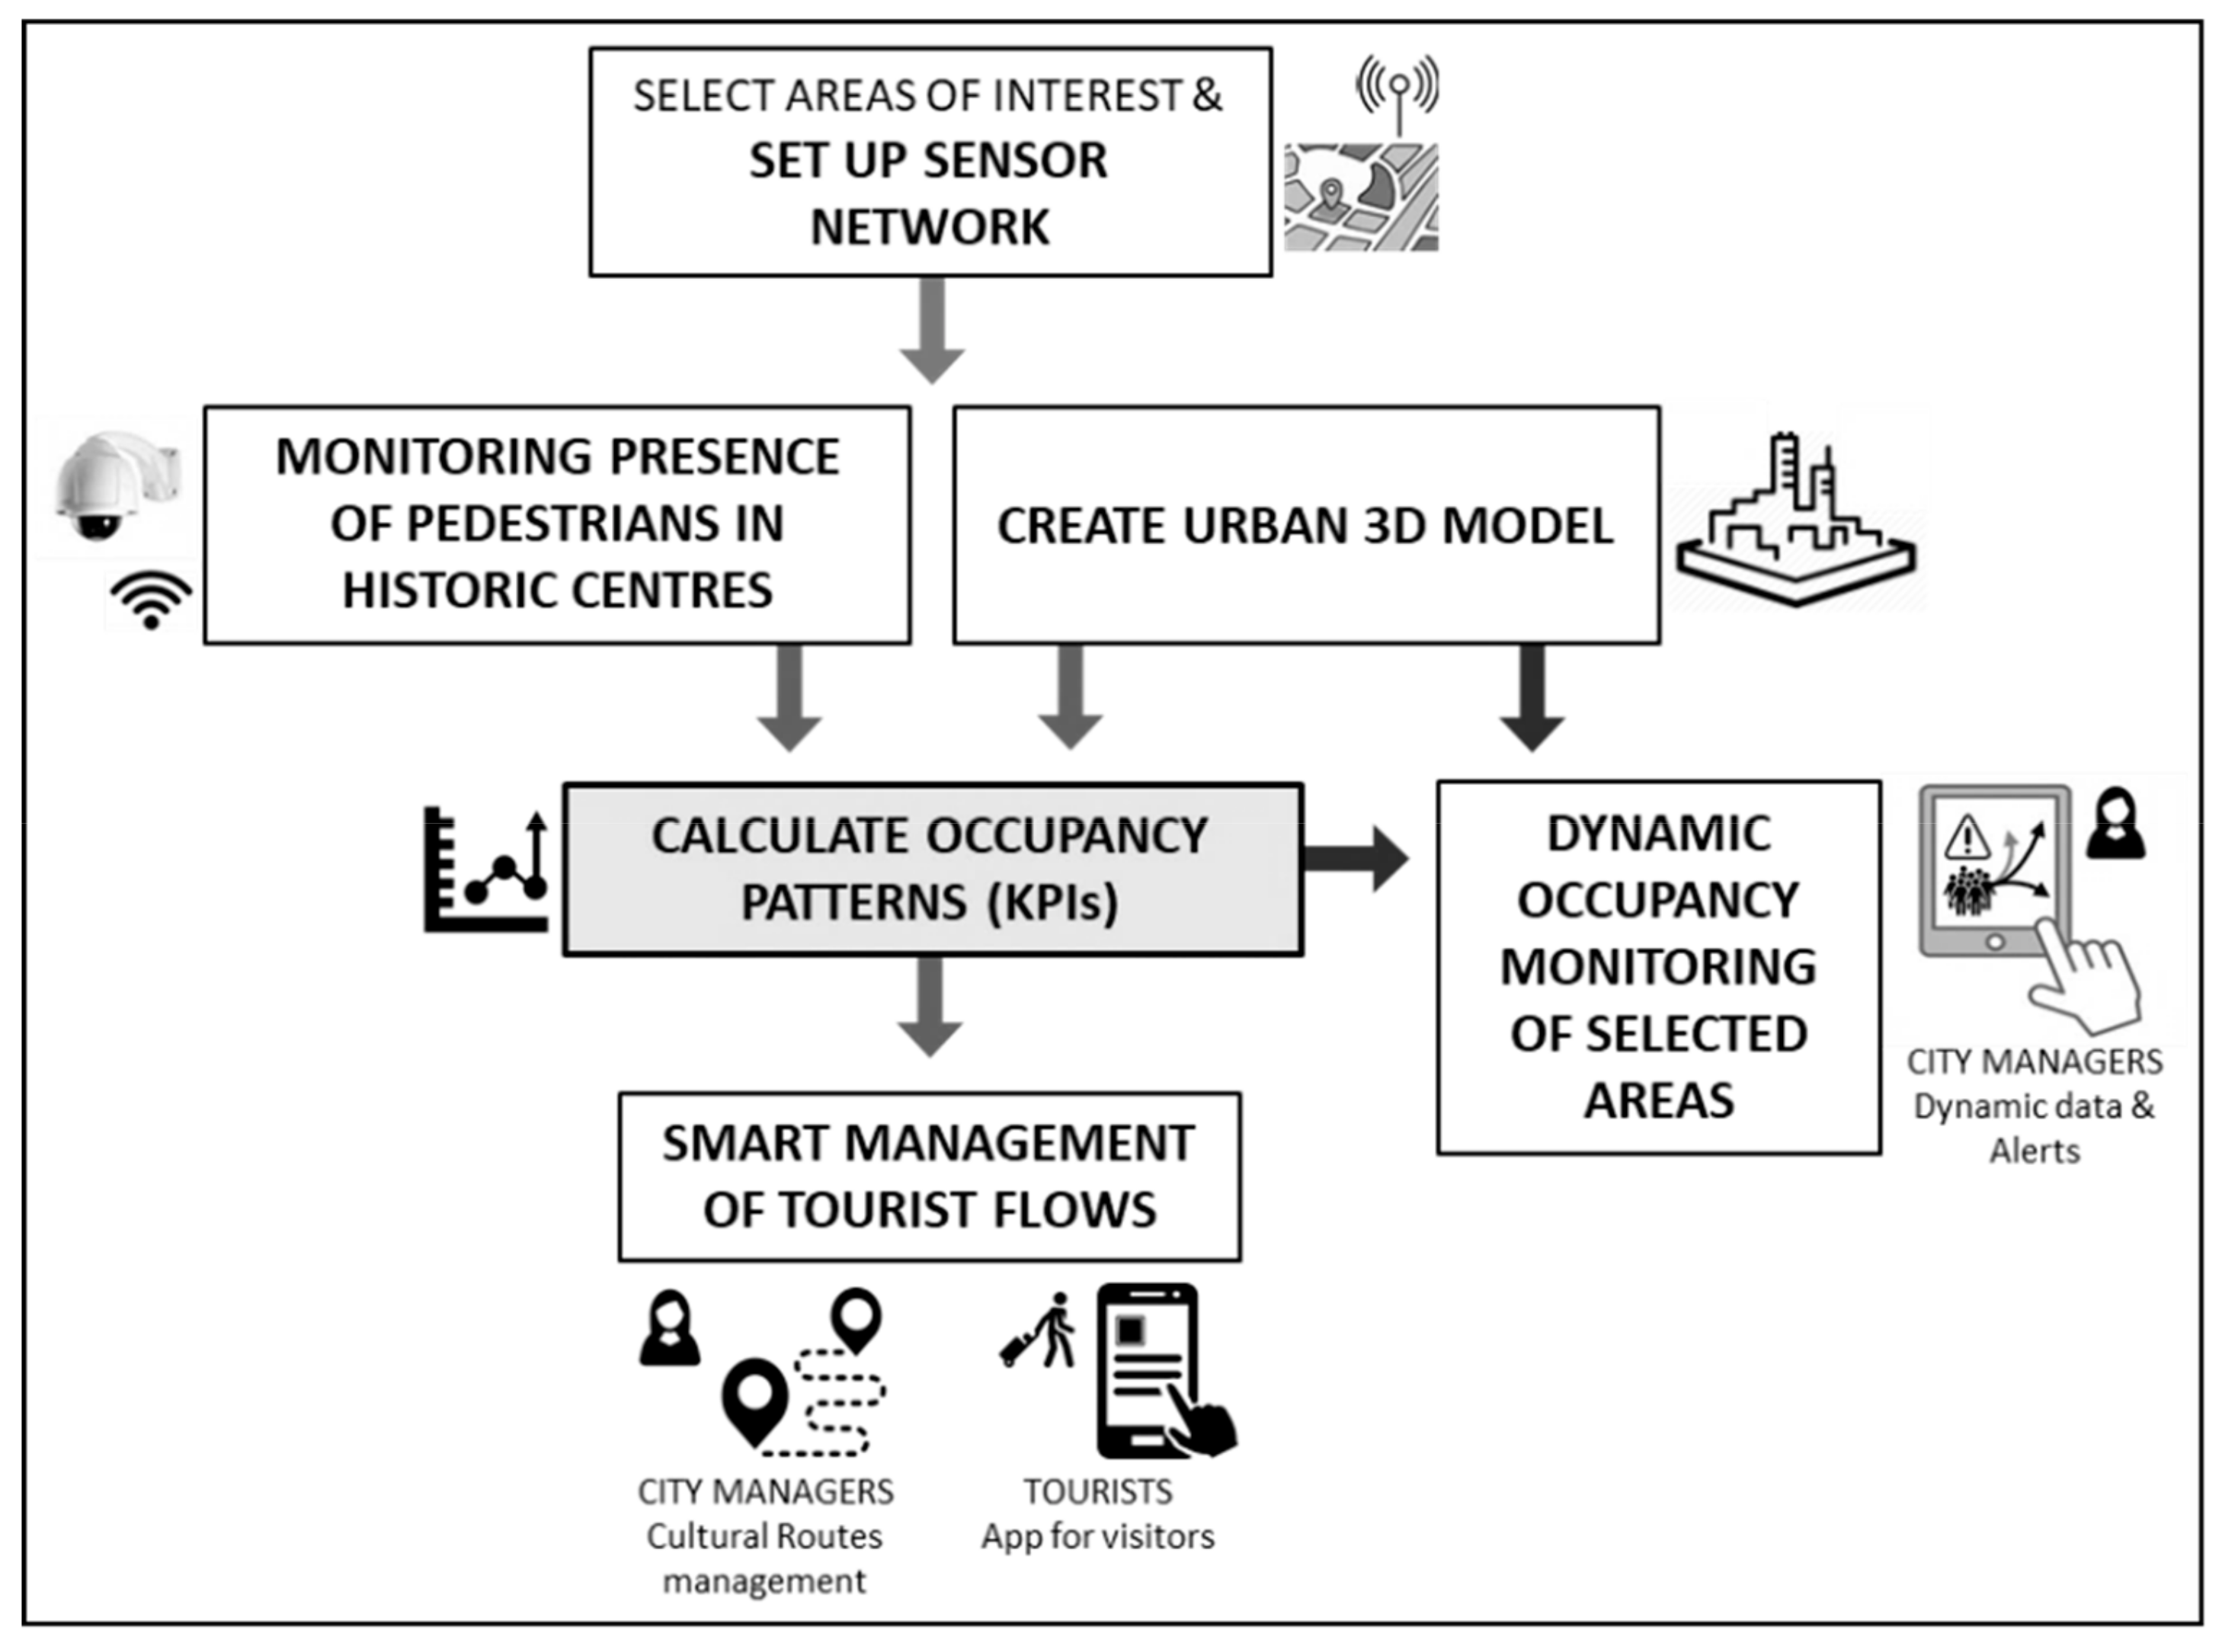
Figure 1 shows the main steps of the methodological approach reported in this paper for tourist-flow management in the historic centre of Ávila. As a first step, the study areas to be analysed must be identified and the sensor network required for monitoring purposes must be designed. As each historic centre has its own characteristics, site-specific deployment of the equipment will be required around the locations of the main attractions, their access points, heavily transited streets, and other urban morphology. In the next step, the sensor network must be deployed. A deep understanding of visitor flows can be gained with the information collected by a monitoring system. Pedestrian movements can be monitored via a data-collection sensor grid, based on a counting camera network and interactive panels. The strategic location of this equipment is a critical point, as once correctly installed it will calculate the number of people at a precise location and point in time. The monitoring system will provide general behaviour patterns, such as the presence or the absence of people at key places, tendencies between different periods/hours of the day or weekdays and weekend or direction flows. Data collected through cameras will therefore be converted into information on the number of people passing through a specific area or building and itineraries followed, while data collected from the panels will relate to the interests of the person interacting with them (interest in specific sites, number of panel users, etc.).
In parallel to the deployment of the monitoring system, there is a need to collect information for the definition of both the geometric and the structural properties of the urban environment of the selected study areas. Following this methodology, it was proposed to structure the information in an urban 3-D model that collects the urban characteristics of the built environment at different scales, including geometric properties such as areas and altitudes, and attributes such as inhabitants or use of urban units. The 3-D model will be used for the calculation of occupancy patterns and for displaying the monitoring results to city managers.
The next step of the methodology will be to identify and to calculate the key performance indicators (KPIs); tourism flows need to be understood, as they will be the basis for a wide-ranging management strategy that will bring positive outcomes for the local economy aiming to achieve sustainable circular tourism. A set of KPIs will be identified to organize the data that are collected and to provide useful information to end users for tourism management. The following indicators were considered to be of relevance:
Occupation level: reports the level of occupation of a street, a public space, or a building with respect to a maximum carrying capacity defined in terms of comfort thresholds and visitor routines at each specific space. Building occupation levels and vehicular traffic are also monitored in the historic centre.
Most-visited sites: ranking of the most-visited public spaces (or buildings) compared to their maximum occupational level and in relation to the other areas.
Percentage of pedestrians at each site: the total number of pedestrians, and the share of people visiting a given site.
Sites with most interest: compiled from the register of entries on the interactive panels.
Interest of each site: the total number of pulsations on the points of interest of the panel, and the number of real visits to those sites.
The presence of pedestrians in each of the public spaces can be analysed according to hourly, monthly, and seasonal distributions (see
Figure 2). Visitor flows between each area under study can be calculated from data on the pedestrian presence in each of the zones under analysis. The data can also be used to generate rankings of interest and to determine which zones have received most visits and to generate future projections. The use of the panel can also be monitored to generate valuable data on the consultations for each zone, which makes it possible to correlate panel use with the number of visitors at each point of interest, whether a building or a zone of the city.
Having established the KPIs, the next step will be to define the smart rules of the management system. The solution described in this paper can offer information for managers via a Web platform and for users via a phone app. The information can be presented in different (hourly, monthly, or seasonal) time frames, and the system will notify the relevant managers when an alarm is generated, warning of excessive numbers of people in a specific place. The Web platform designed for the managers can perform several data analysis tasks to relate patterns with similar days in the past, considering festivities and special days that will prevent overcrowding before it occurs.
Data collected in that way will support city managers with the implementation of strategies such as promoting events in less-crowded areas and on special occasions. The aim will be to change tourist behaviour and economic tendencies (moving towards circular tourism) by promoting alternative routes around the historic centre. Another means of diversifying tourism flows and promoting less visited sites will be through the mobile app. The app can provide tourists with recommendations for alternative cultural routes and sites, and information on occupancy levels and waiting times. It can also relay suggested alternatives to app users, avoiding overcrowding of certain places at a certain time (enhancing the liveability of the site), thereby addressing the effects of unbalanced tourism, all of which will contribute to sustainable impact on the local economy (diversifying economic activity in the city). Likewise, ensuring the conviviality of visitors and local inhabitants will, in the future, contribute to socially and culturally sustainable strategies.
2.3. System Description
2.3.1. System Architecture
The methodological framework described in the previous section has been implemented on a technological platform. The platform described in this paper is a partial implementation of the technological solution developed within the Smart Heritage City project. The main objective of the SHCITY project is to develop a technological solution aimed at improving the management of historical urban areas, helping with their maintenance, conservation, energy saving, tourist use, and decision-making.
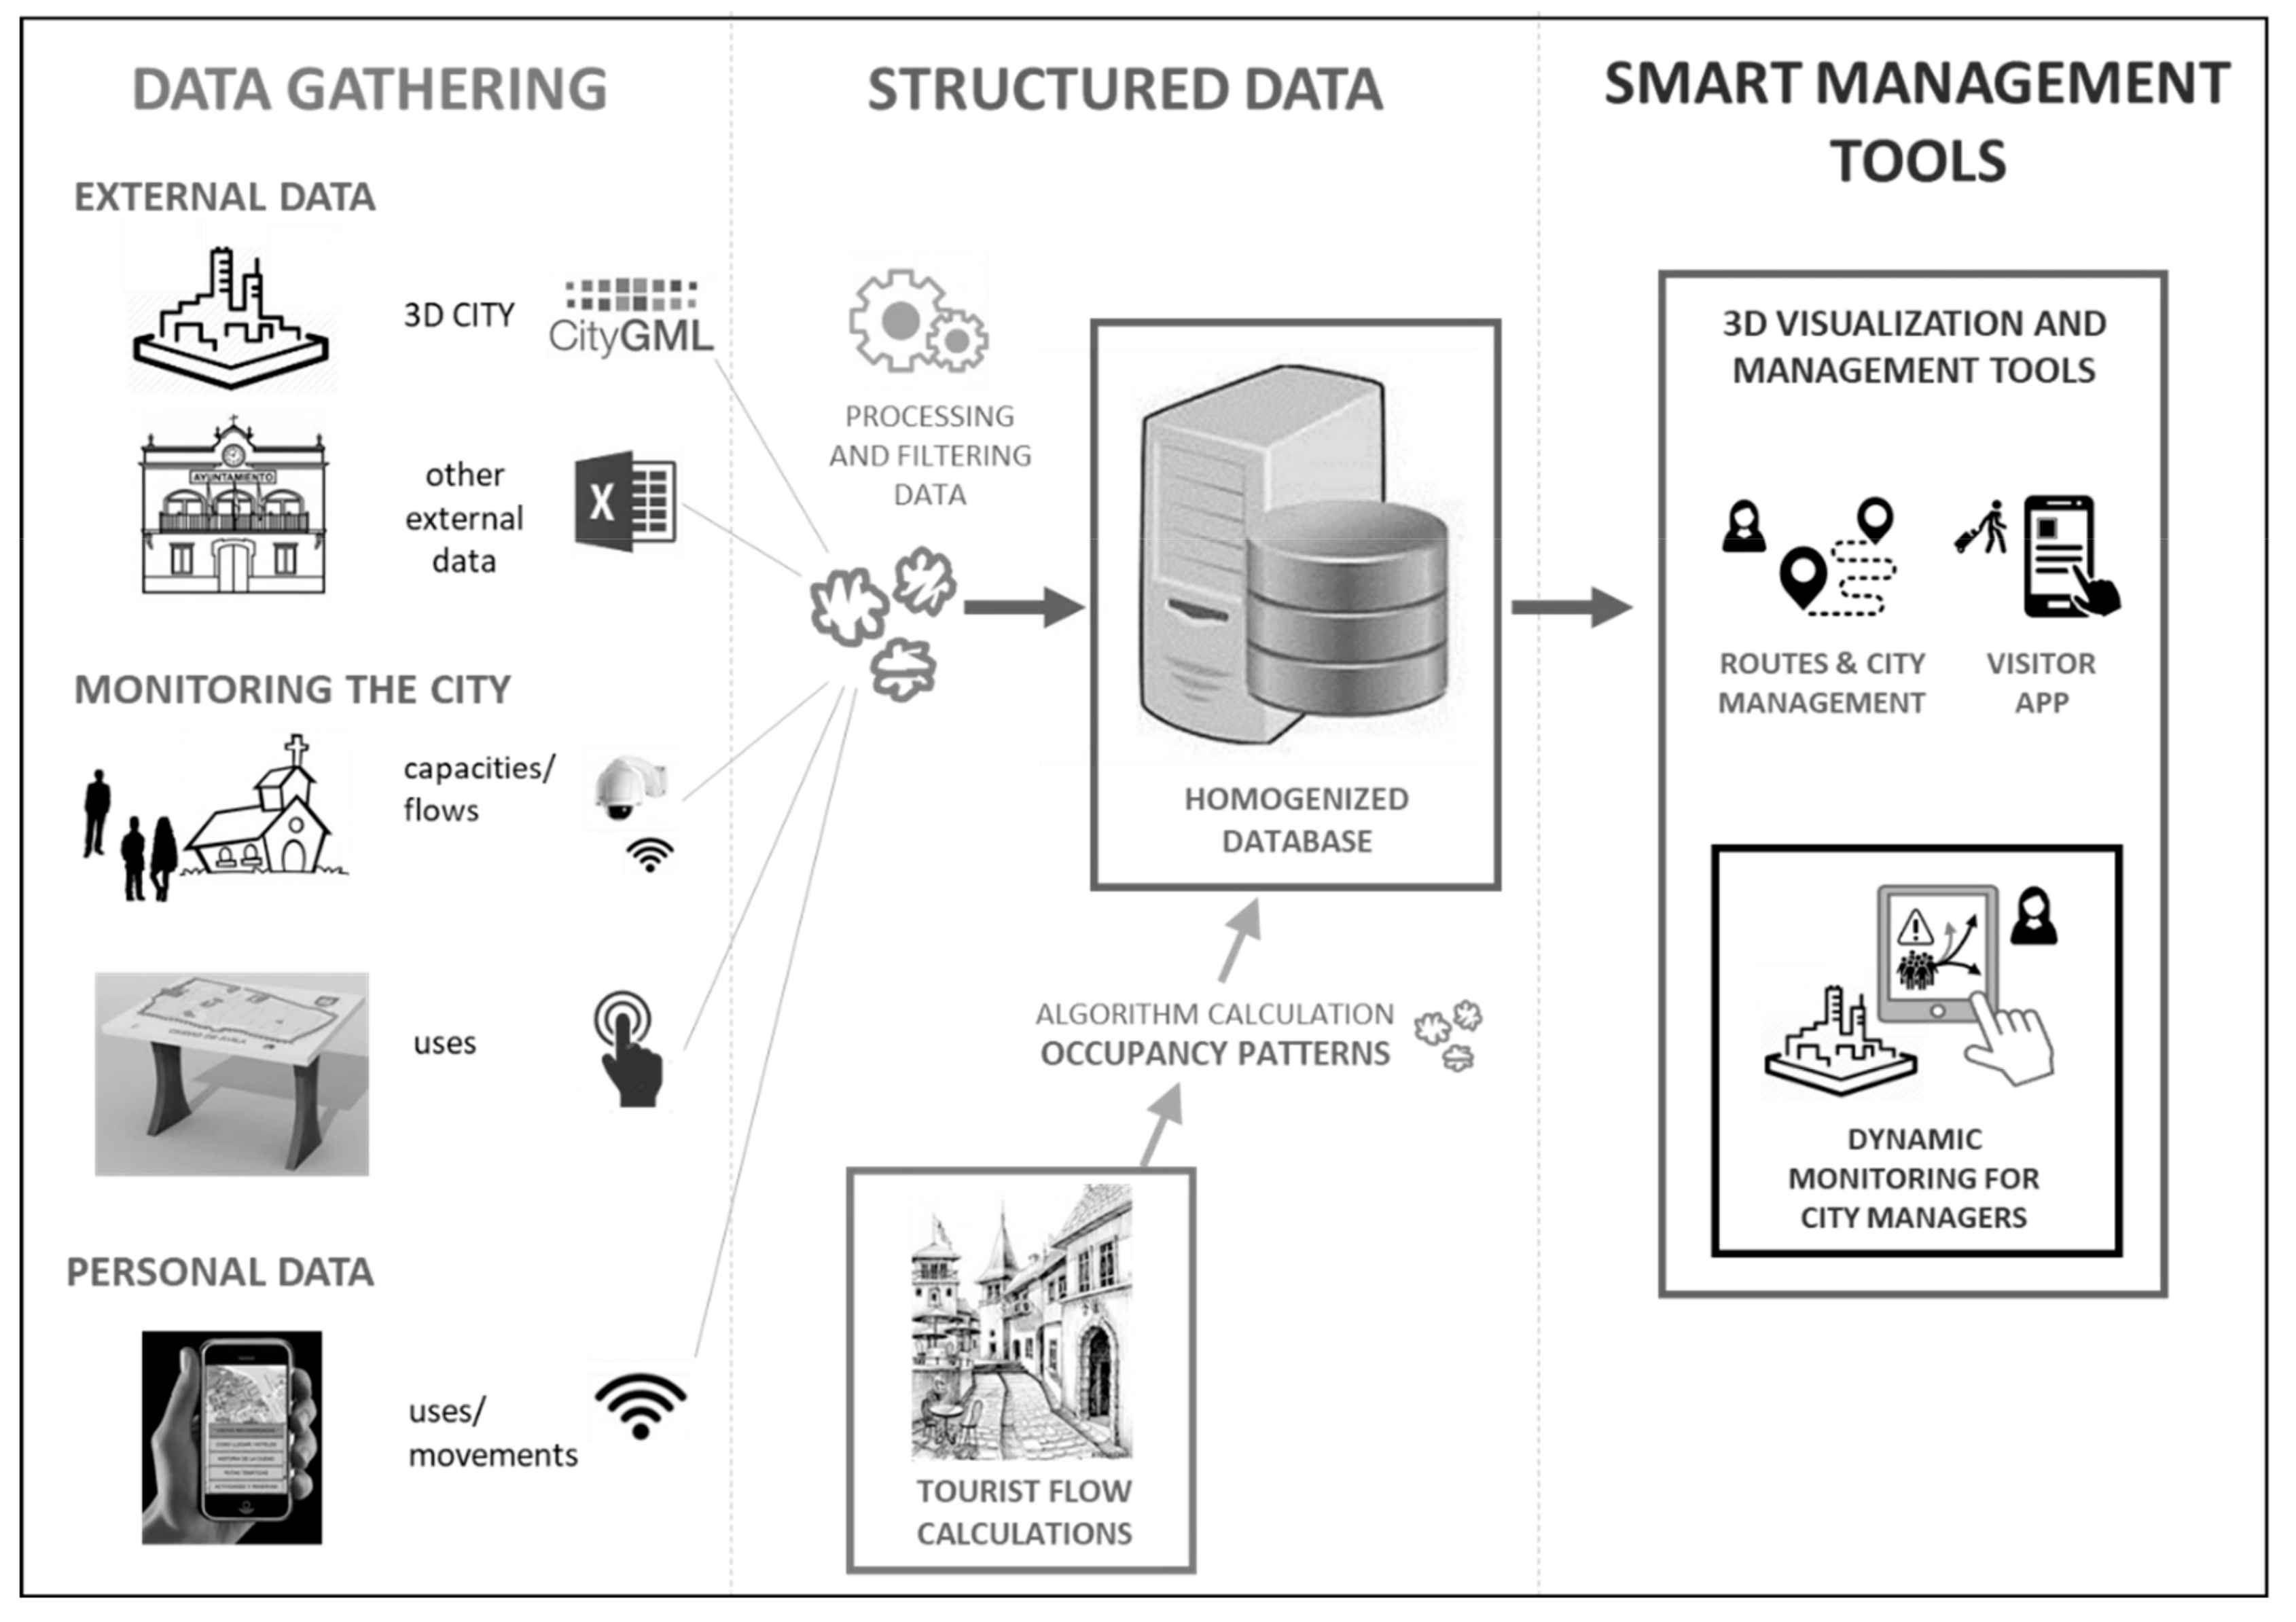
Figure 3, below, shows the general scheme of the SHCITY system from a functional perspective. The data cloud represents the physical data storage and data processing infrastructure. It will receive inputs from the sensor network, data from the 3-D model of the city, external data from other entities (including through the tourist app from tourists), and the data provided by expert knowledge (including data provided by the manager through the Web platform). As a system output, all the information will be for the two applications created in the SHCITY project (tourist app and Web platform).
One of the purposes of the SHCITY project is the management of tourist use of historic urban environments. In this paper, the main components of the system for improving tourist management will be described. The main components of the SHCITY platform of relevance to tourist management are described below in
Figure 4.
The system consists of three main elements: data collected from different sources, appropriately analysed and structured information, and decision-making tools. Different types of data are obtained from various sources and time frames (from static to real-time data). The data sources for tourist management in the system are:
3-D city model: provides structural information on the environment. Parameters such as dimensions and capacity of urban spaces are derived from the model.
People-counting cameras: gather data on the entry and exit rates at strategic points.
Interactive panels: offer data of interest to the visitor at key touristic points.
Other external management data such as event scheduling will also be considered. All the necessary data were correctly structured in the database, and then processed to calculate the indicators on occupancy levels at the different interest points and with user interaction with the panels, directly linked to the interests of the visitors. Associative and sequence analysis algorithms were implemented in order to perform the calculations, to obtain knowledge on regular occupancy levels, and to fix common occupancy values in the monitored zones for various time frames.
Finally, the resulting information was presented to users through two applications. The first is an application for managers of the historic centre where occupancy levels and visitor flows are monitored in the urban environment. The second is a mobile application for tourists offering alternatives for visiting the historic environment. This application functions on both Android and iOS mobile devices, to provide the user with constantly updated information.
2.3.2. Data Sources
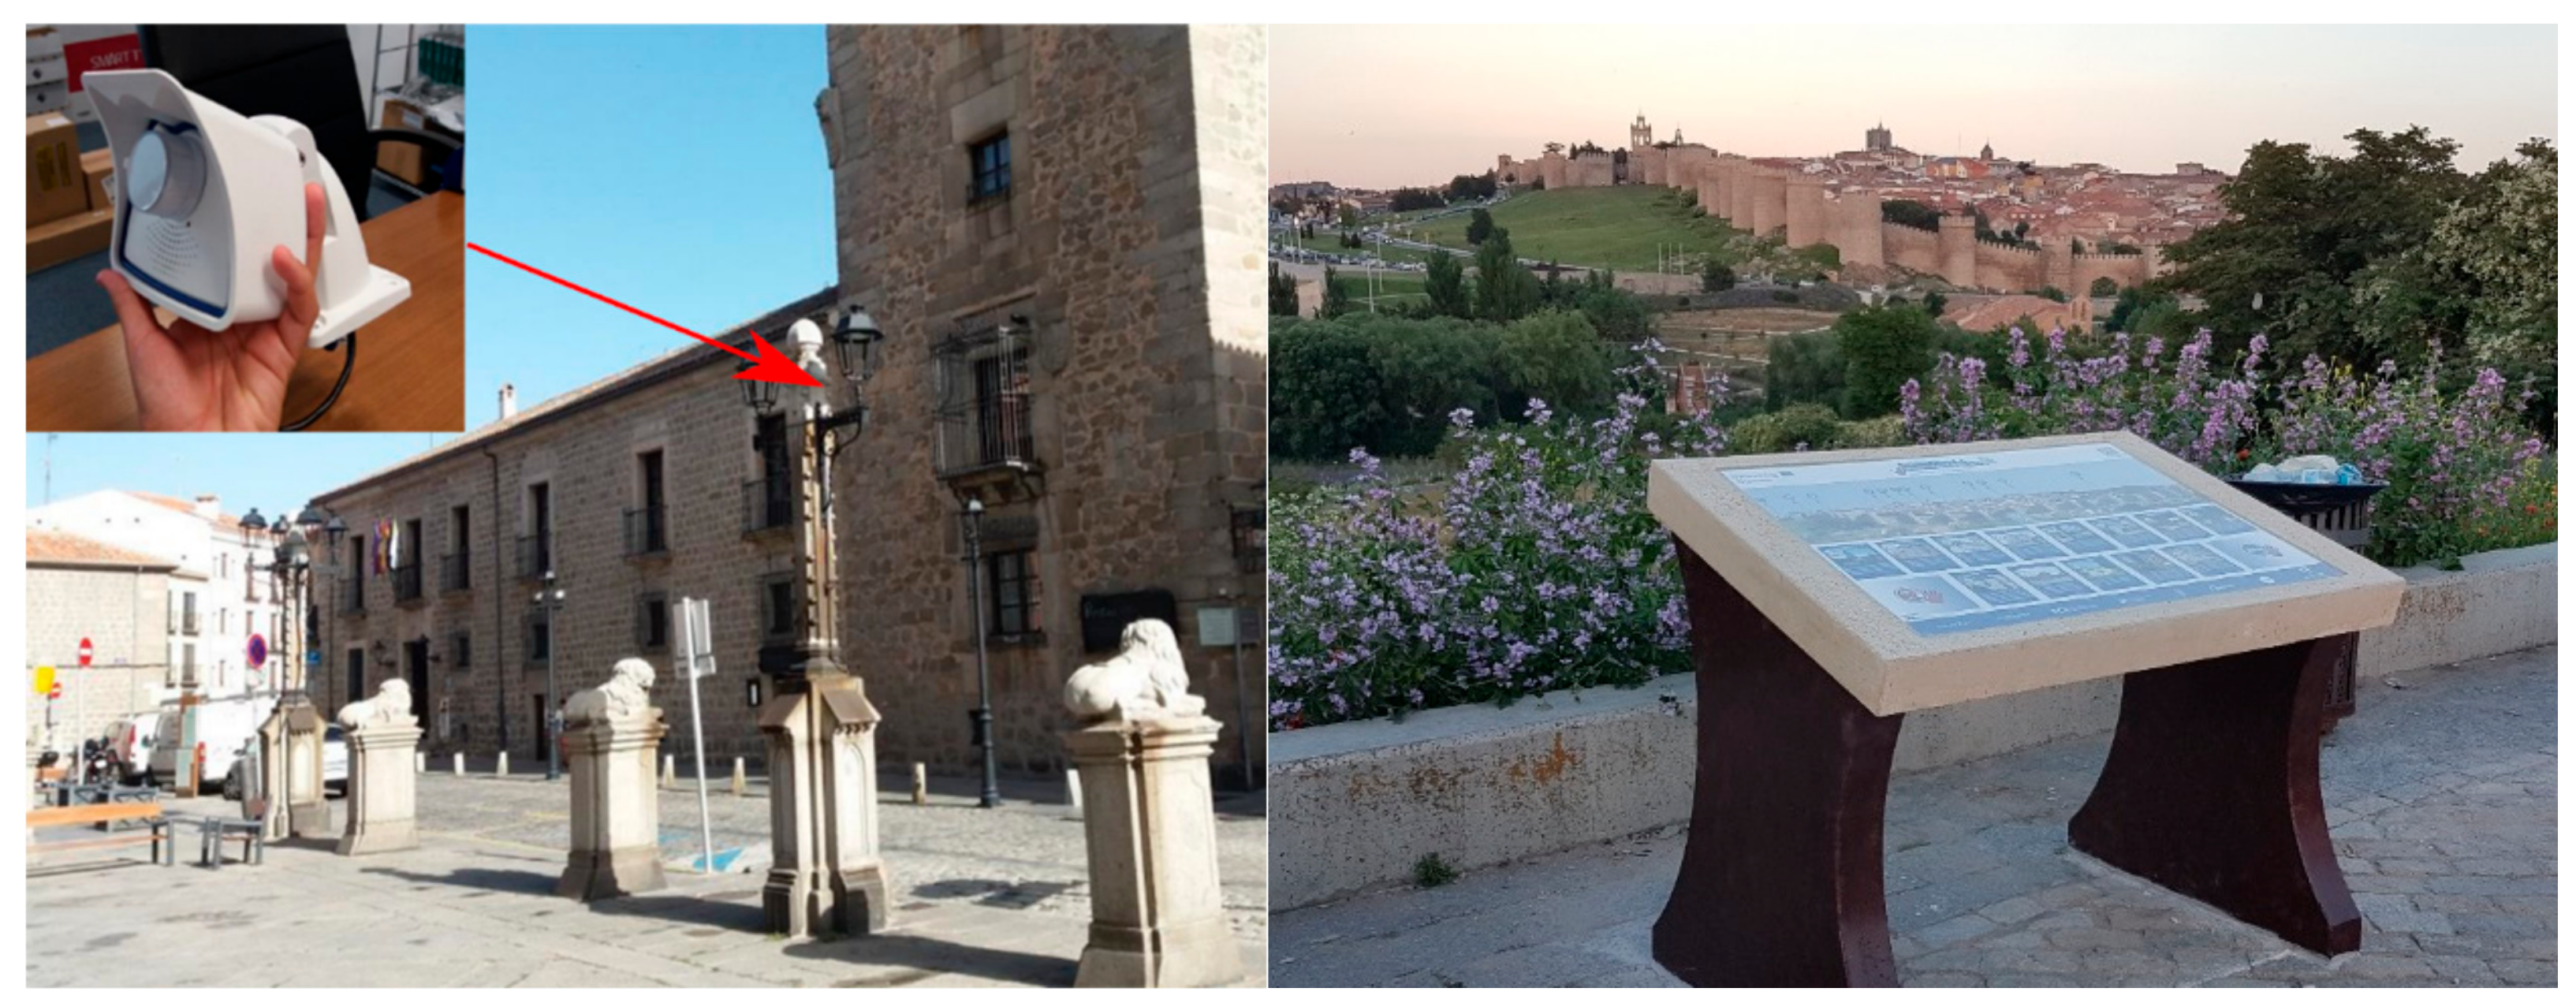
A sensor network was installed consisting of vision cameras (
Figure 5, Left). Likewise, two innovative tourist information panels were also installed to provide relevant information to users, while recording user interactions with the panel and their preferences (
Figure 5, Right).
IP cameras—model Mobotix M25-IK08 IP66 6 Mpx—were installed to monitor pedestrian flows. The cameras were powered over the Ethernet (POE) and transmitted data via a 4G wireless communication network to an FTP server. By placing the cameras in strategic positions, the system can measure the flow of people in motion, not only recording the number of pedestrians, but also directions and transit times.
WoodTalk Tourist Information Panels have 4G communication and transmit all the data collected the previous day at midnight. They provide information on the historic buildings and areas of greatest interest to visitors, languages used, and the number of people using the panel. The weatherproof panels are IP 66-rated and are automatically turned off at night to avoid any disturbance to local residents. The WoodTalk panel has a dual function: providing interesting information to visitors and collecting information from users.
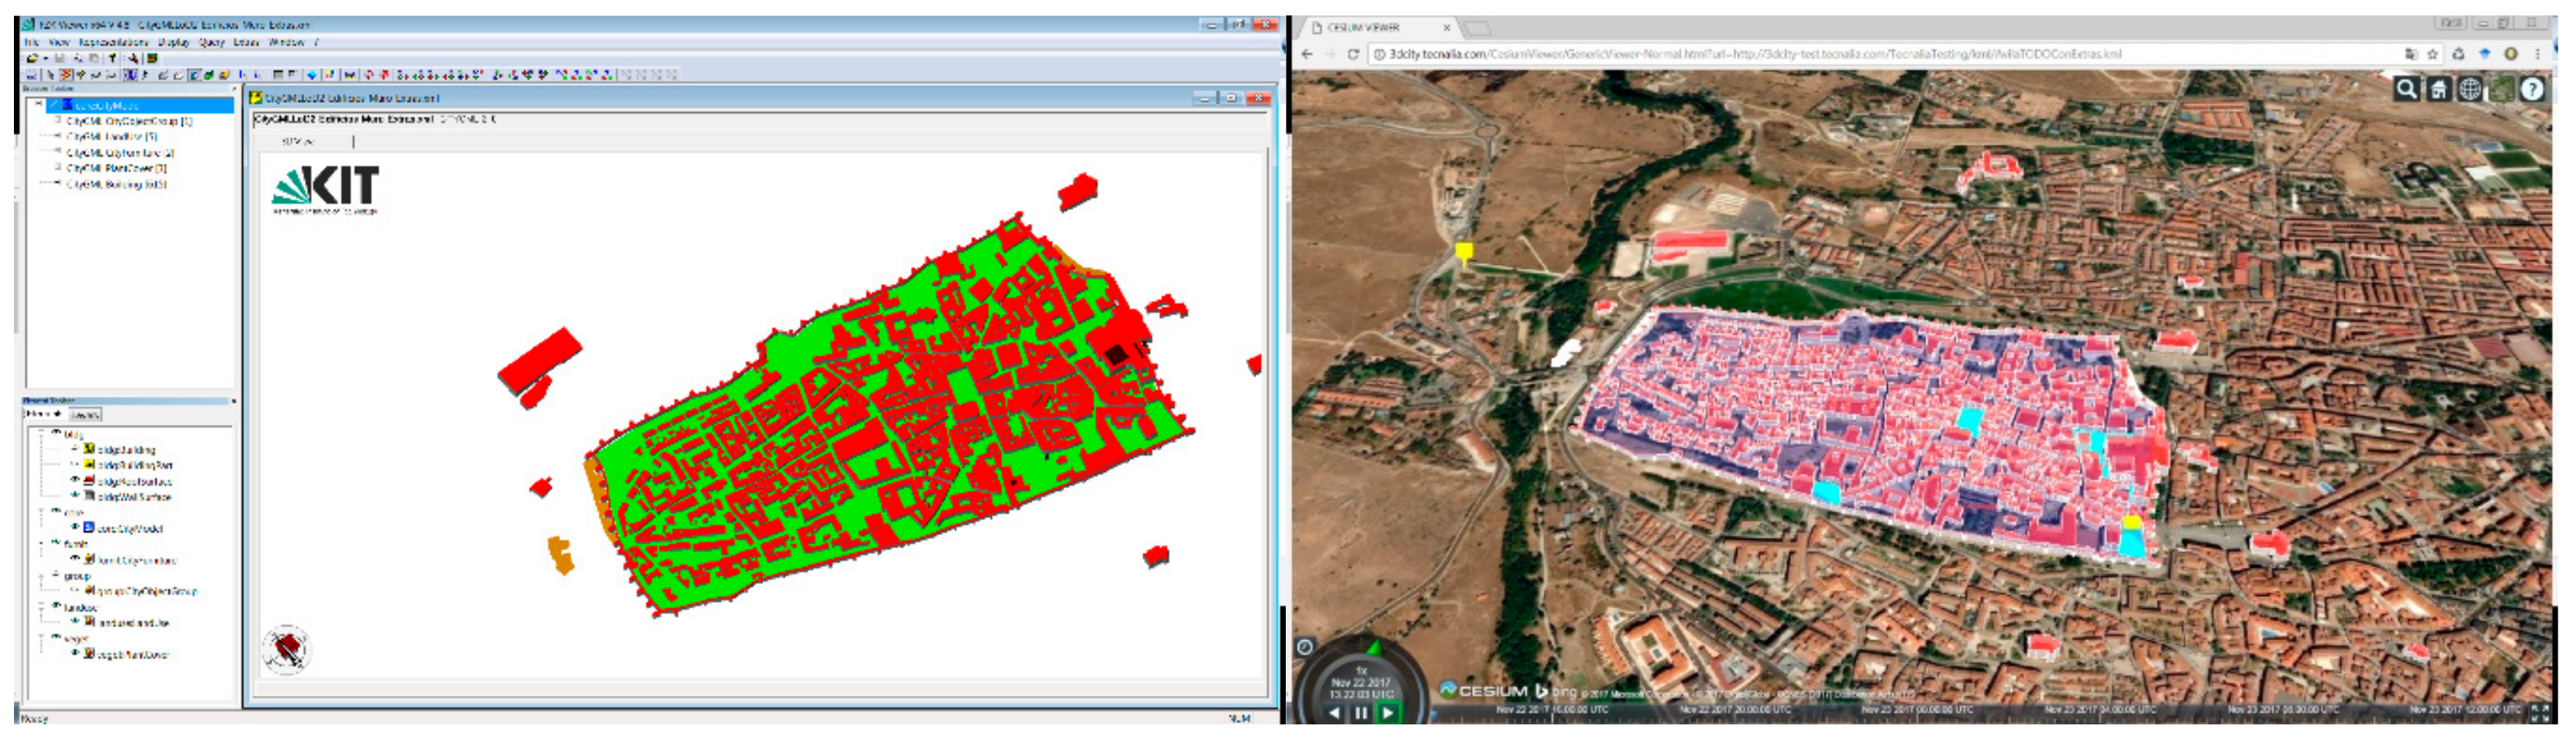
The 3-D city model defines the structural information of the historic urban environment. It represents the urban components of the historic centre and is based on the CityGML standard, which incorporates geometric information and alphanumeric properties in a single coherently related model. The 3-D city model is also used to store the results (indicators) of the touristic flow calculations. It supports generation, storage, and georeferenced visualization of the indicators generated on the Web platform for the city managers.
Data from the physical world introduce a degree of uncertainty and a lack of reliability into the processes. If making decisions in a data-based process associated with uncertainty, it would make sense to associate each event with an information quality value. In simple cases, the value could be associated with a threshold. It is essential to capture, process, and express information in a modelled language and the syntax and semantics of the threshold values need to be standardized.
2.3.3. Calculation of Touristic Occupancy Patterns
Once the main areas of interest have been defined, which will depend on the specific characteristics of any one historic centre, the methodology for the calculation of the baseline can be established, with the objective of providing useful information to urban planners. In this study, several indicators were created, some of which, such as occupancy levels, were directly related to visitor movements and flows, while others, such as the interest ranking, needed to be interrelated with other indicators.
As a first step the maximum carrying capacity for the selected areas of interest was calculated, considering the positive tourist experience approach. Normally, the maximum carrying capacity is calculated for security reasons and will yield the maximum number of people that a site can accommodate, in accordance with fixed parameters on individual space and safe evacuation requirements. Nevertheless, this value is far from comparable to the positive site experience of a visitor, thus the number of people considered for an enjoyable visit should be far less. The comfort aspect has been widely studied for private and/or enclosed public spaces; it has been established at around 4 m
2/inh [
29] for archaeological sites, where walking through narrow alleyways was considered, as well as the optimum heritage perception criteria for visitors. It has also been studied in open public spaces, such as parks and beaches, as up to 10 m
2/inh [
30], where there is no heritage perception need that would limit the carrying capacity. However, defining the carrying capacity of visitors is especially complicated when considering public spaces where the privacy of inhabitants has also to be respected, as there is no clear definition of clear boundaries that also overlap with crucial heritage protection criteria. According to urban planning criteria, an ideal area for public spaces around historic centres should cover at least 5 m
2/inh. [
31]. Considering the above and the previously mentioned studies, an area of 6 m
2 per visitor was estimated to be a reasonable value for touristic enjoyment of public spaces around historic centres.
The monitoring system based on counting cameras, can monitor the occupancy levels of any particular site both in relation to the aforementioned maximum carrying capacity and in relation to specific time frames of days, weeks, and months. Monitoring activities were recorded over one year, in order to define the regular patterns and arrive at a baseline. Having collected the data, they were then processed and analysed, and recurrent behaviours were identified. Normalised levels of occupancy could then be defined, on the basis of different time frames: hourly (six time slots during week days and five during weekends), daily, weekly, and monthly, as well as festive occasions and events. By comparing the data from each site, this information was also used to generate a ranking of the most visited sites, as well as the percentage of visitors at each site with respect to the total number of visitors and inhabitants. On the one hand, the correlation between the occupancy level and the maximum carrying capacity yielded significant inputs for city managers. They were used to identify the overcrowded sites and the key time frames, in either hours or days, enabling strategies oriented towards the dislocation or postponement of high-influx activities. On the other hand, knowledge of the most visited sites and visitor percentages were used to improve touristic routes, thereby facilitating access to less-visited sites and offering alternatives during periods of overcrowding.
Data collected through the tourist information panels provided general information on the main interests of tourists, based on the total number of interactions with the panel at each site. The correlation between the interest shown in each site and the real visits calculated with the cameras can help to identify overcrowded sites and accessibility related problems.
The information was relayed to a management platform where the indicators are displayed on a dashboard that combines 2-D and 3-D visualisations. The dashboard is mainly directed at city managers and urban planners and has the objective of offering dynamic data in a user-friendly way, notices and alerts when an indicator exceeds a pre-established baseline. The same data can be used to develop the tourist app. This app provides all the information on sites of interest and touristic routes and helps to plan personalised circuits according to time frames, preferences, and interests, as well as providing feedback on the hourly/daily visiting trends.
2.4. Case Study Implementation
2.4.1. Case Study Description
The pedestrian monitoring system was successfully installed in Ávila, a medium-size historic centre located in central Spain. It is an archetypal medieval walled city, with well-preserved walls, towers, and doorways that fully encircle it. The walls with 87 towers and 9 arched doorways surround a rectangular shaped area of 33 hectares. Its origins predate the Roman and Visigothic eras, and since those times the historic centre has been damaged and has undergone a number of interventions. Repairs over the past two centuries have maintained its main original characteristics. Surrounded by its defensive ramparts, Ávila is a very suitable site for the study where the movement of pedestrians through previously identified doorways, streets, passageways, and in public spaces can be easily monitored.
2.4.2. 3-D City Model
The model represents the urban units monitored within the project. The following table (
Table 1) shows the list of units defined in the urban 3-D model and the number of entities for each unit, related with the CityGML objects and the level of detail (LoD) used for the representation of each component.
The data sources used for the generation of the 3-D urban model of the historic centre of Ávila were:
National Public Land Registry [
32]: includes the 2-D geometry of the buildings, as well as useful information such as date of construction, use, number of dwellings, and floor area.
National Geographic Information Centre [
33] (CNIG): provides digital elevation and terrain models (DSM and DTM) used for the calculation of the heights of the buildings.
The geometries of the other urban units that are not buildings, the delimitation of the study area, and the panel locations all had to be manually entered. The 3-D model (
Figure 6) was projected in two well-known formats for 3-D modelling of urban environments: CityGML and KML.
The model included the attributes required for the calculation of occupation patterns and indicators defined in the methodology. Likewise, the indicators associated with each of the urban elements defined in the model and for each of the areas of the project were included as generic attributes. The relevant properties and the indicators of the model for visitor-flow management in the historic centre of Ávila are detailed below (
Table 2).
2.4.3. Sensor Network
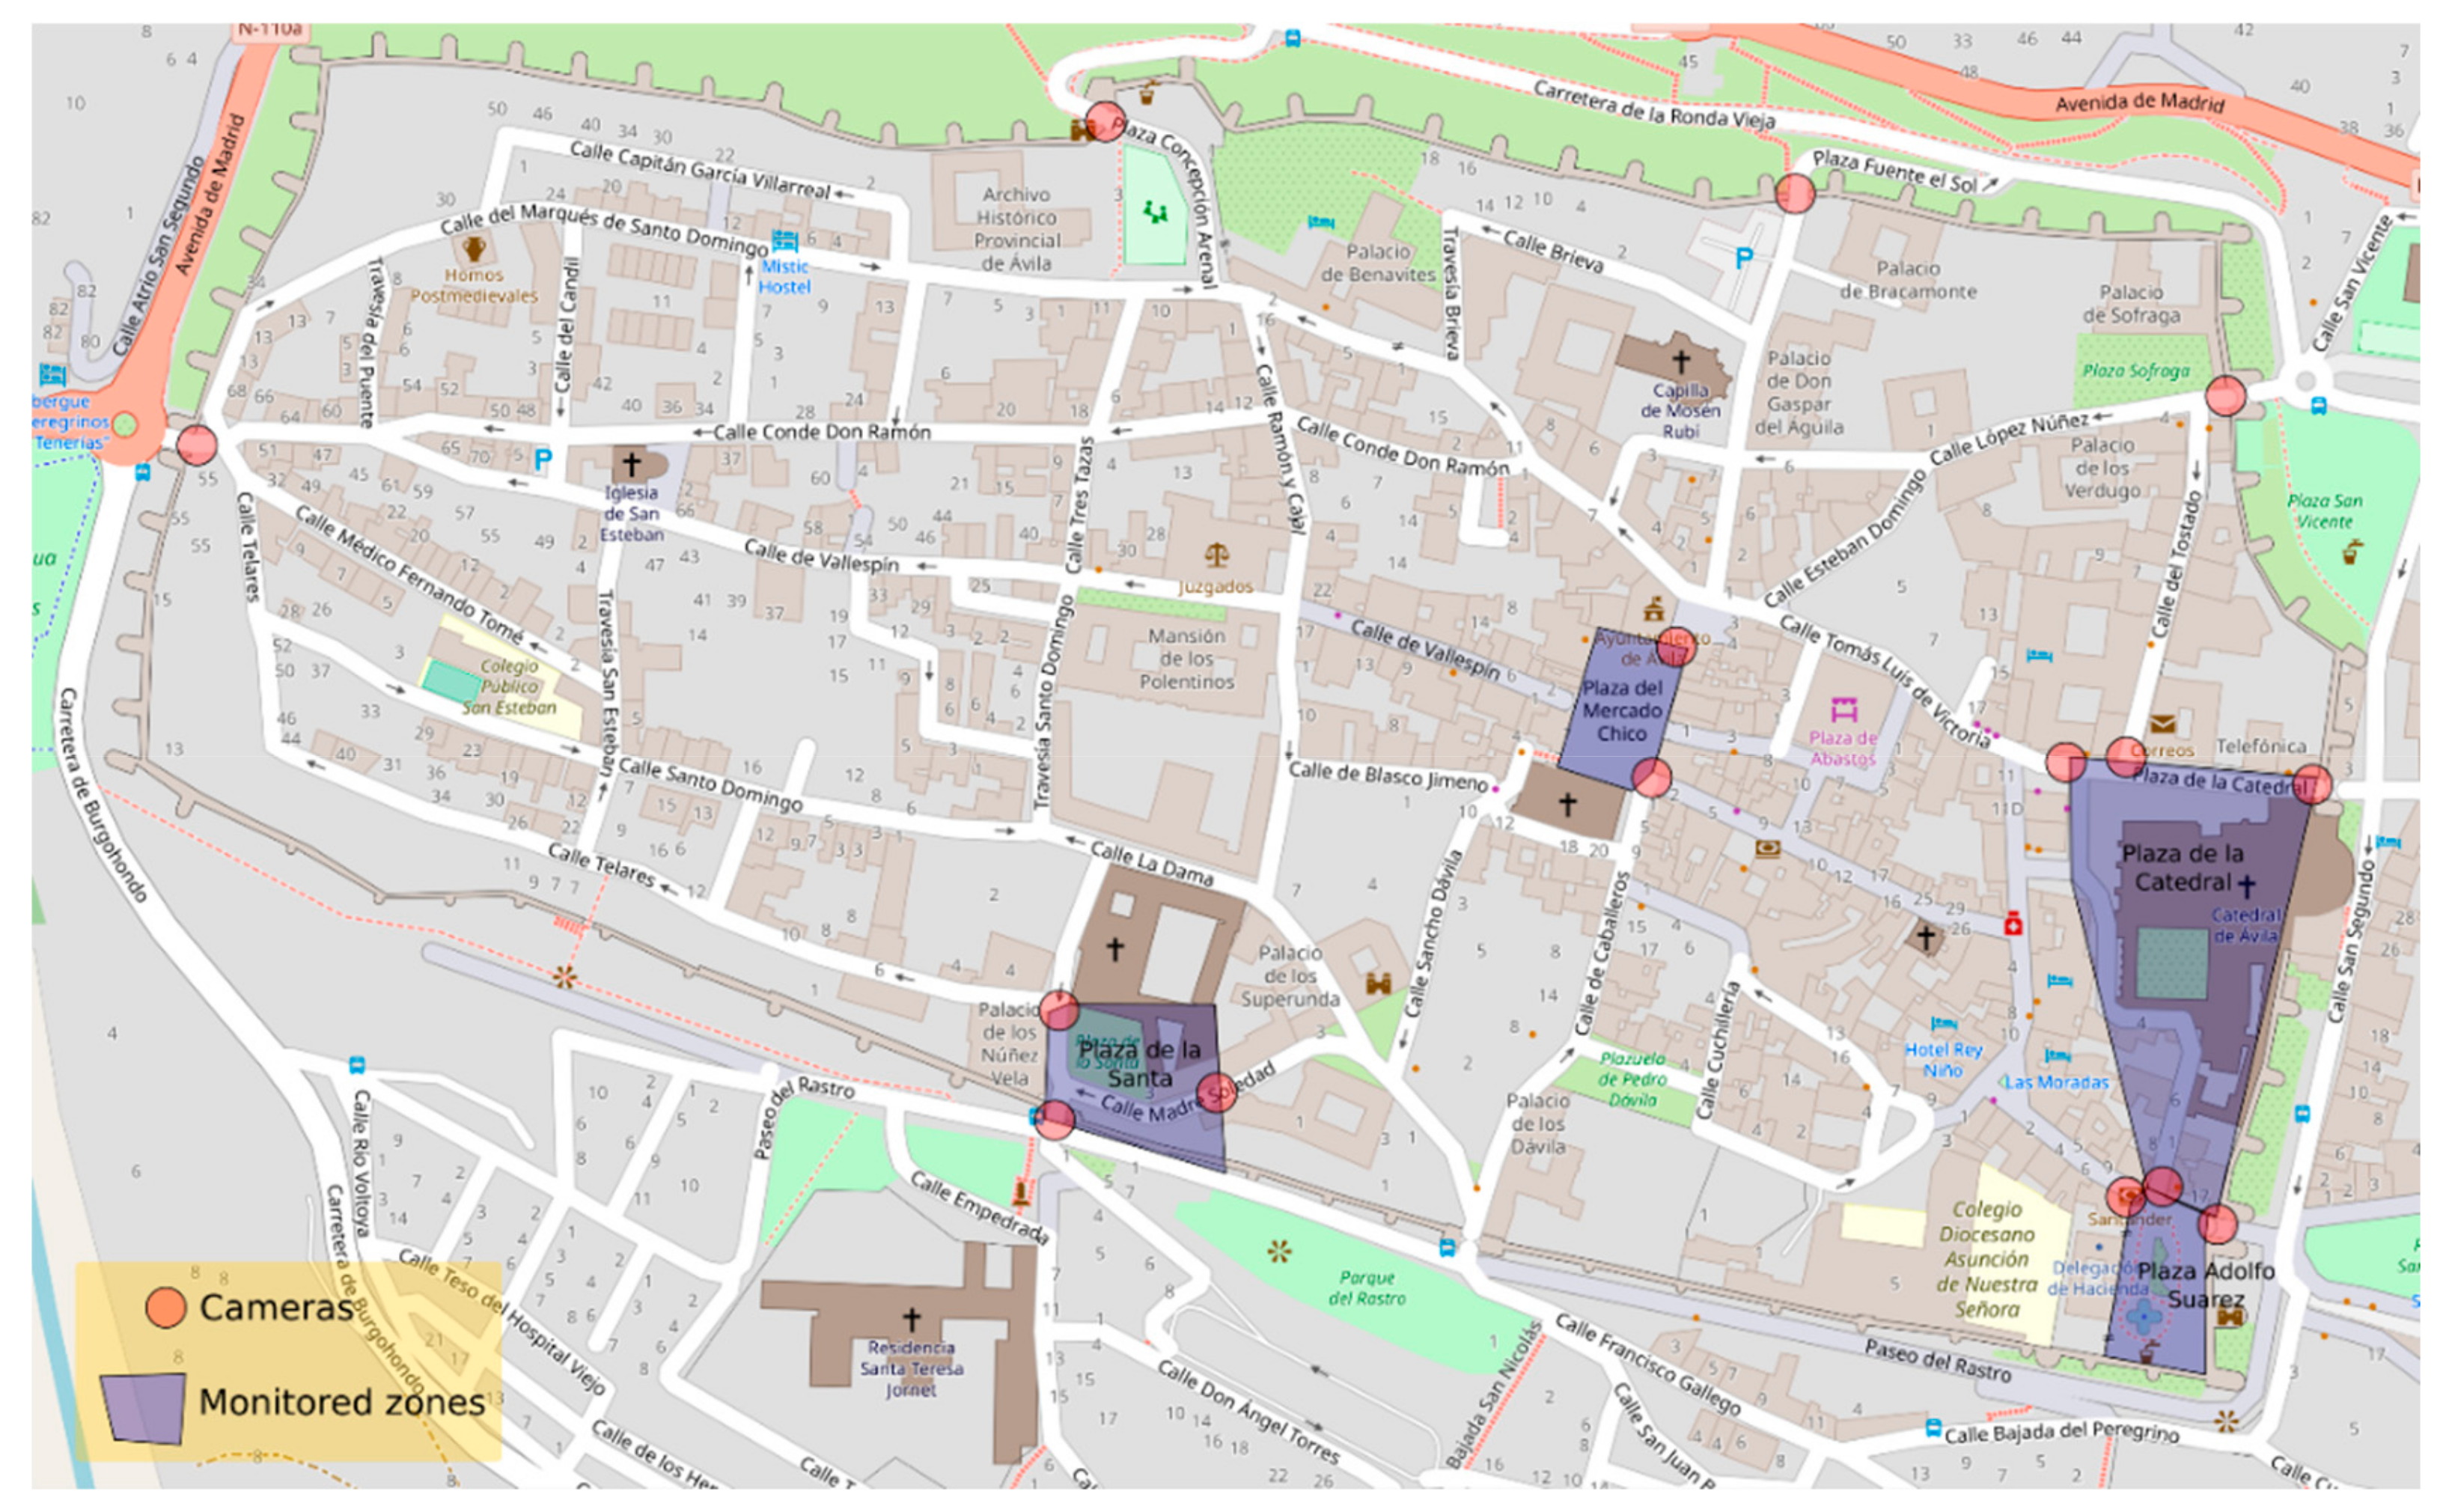
The historic centre of Ávila has a network of 15 pedestrian monitoring cameras that are represented in
Figure 7, the main characteristics of which have previously been described, and 2 tourist information panels. IP people-counting cameras are installed at different points for the detection of movement and pedestrian flows between areas. The data were used to generate a general overview of visitor flows between five key areas of interest (Mercado Chico, Plaza de la Catedral, Plaza Adolfo Suarez, Plaza de la Santa, and the historic centre of Ávila as a whole) at different times throughout the year. Cameras were installed to monitor defined areas or polygons, in order to track the number of people entering and leaving each space and to relate them to the total number of people in the old town, calculated by monitoring the entry and exit points of the walled city.
2.4.4. Tourist Flow Monitoring
In the use case presented in this paper, people-counting cameras, which can count the number of people in a predefined space at any given point in time, recorded the number of people passing by in each direction every 15 min. Entry and exits points were analysed to determine whether the flows through each area followed similar patterns, both with the aim of facilitating decision-making processes for urban planners and defining new touristic routes to avoid unbalanced tourism at the site.
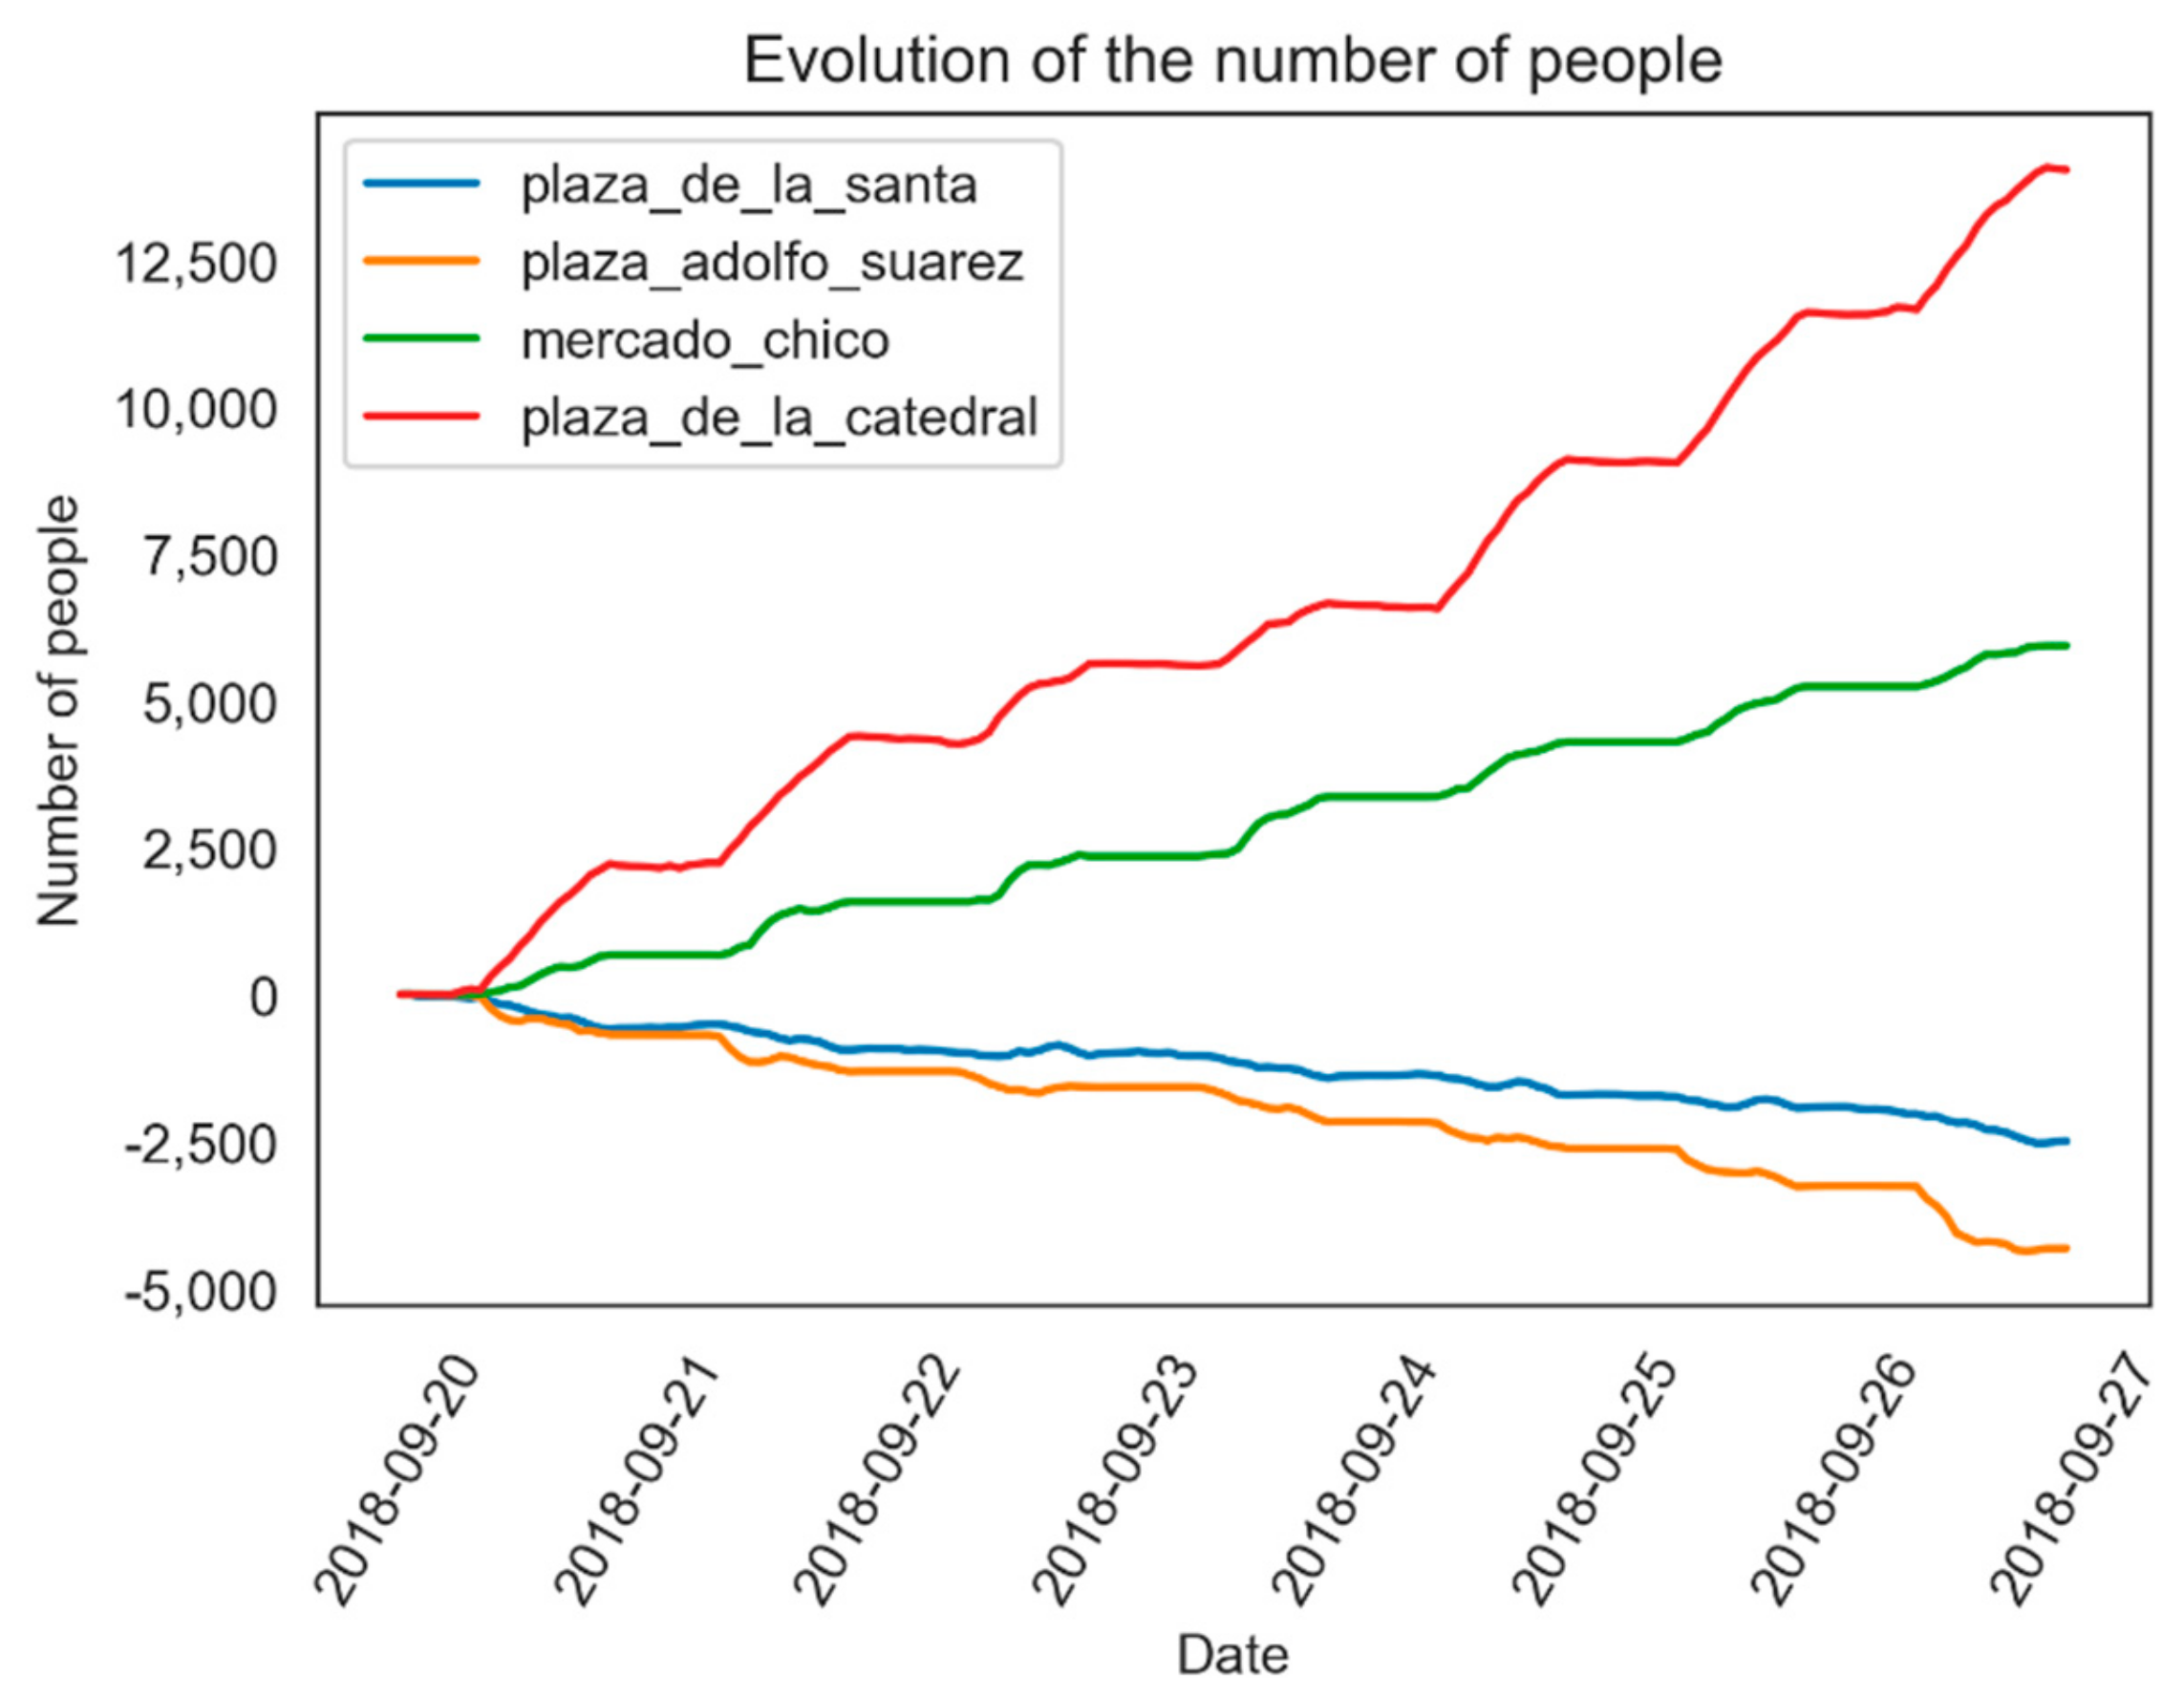
The first objective was to use the enter–exit counts, to assess the number of people in each key area at any given point in time, although it was later abandoned due to counting errors. As shown in
Figure 8, the numbers of people in the different areas, according to entry and exit counts, were inconsistent, seriously impairing any calculation of the results. The counting discrepancies were unrelated to the camera counting method itself, but to massive and compact groups of visitors and external meteorological parameters that inevitably affected the total head counts.
The head counts increase linearly, although periods with different levels of activity can also be observed (see plaza_de_la_catedral in
Figure 8). In view of such behaviour, total head counts were abandoned, and only one of the directions measured by the cameras was considered, which provided reliable knowledge on activity levels in a given area.
Meteorological and atmospheric conditions also had direct effects on the counting system. The system was rendered inoperative by several continuous days of snowfall when, as may be seen from
Figure 9, snowflakes were counted ad infinitum.
Mass events and significant activities in the historic centre were in general very useful for the data analysis process and, on occasion, represented the starting point of threshold definitions.
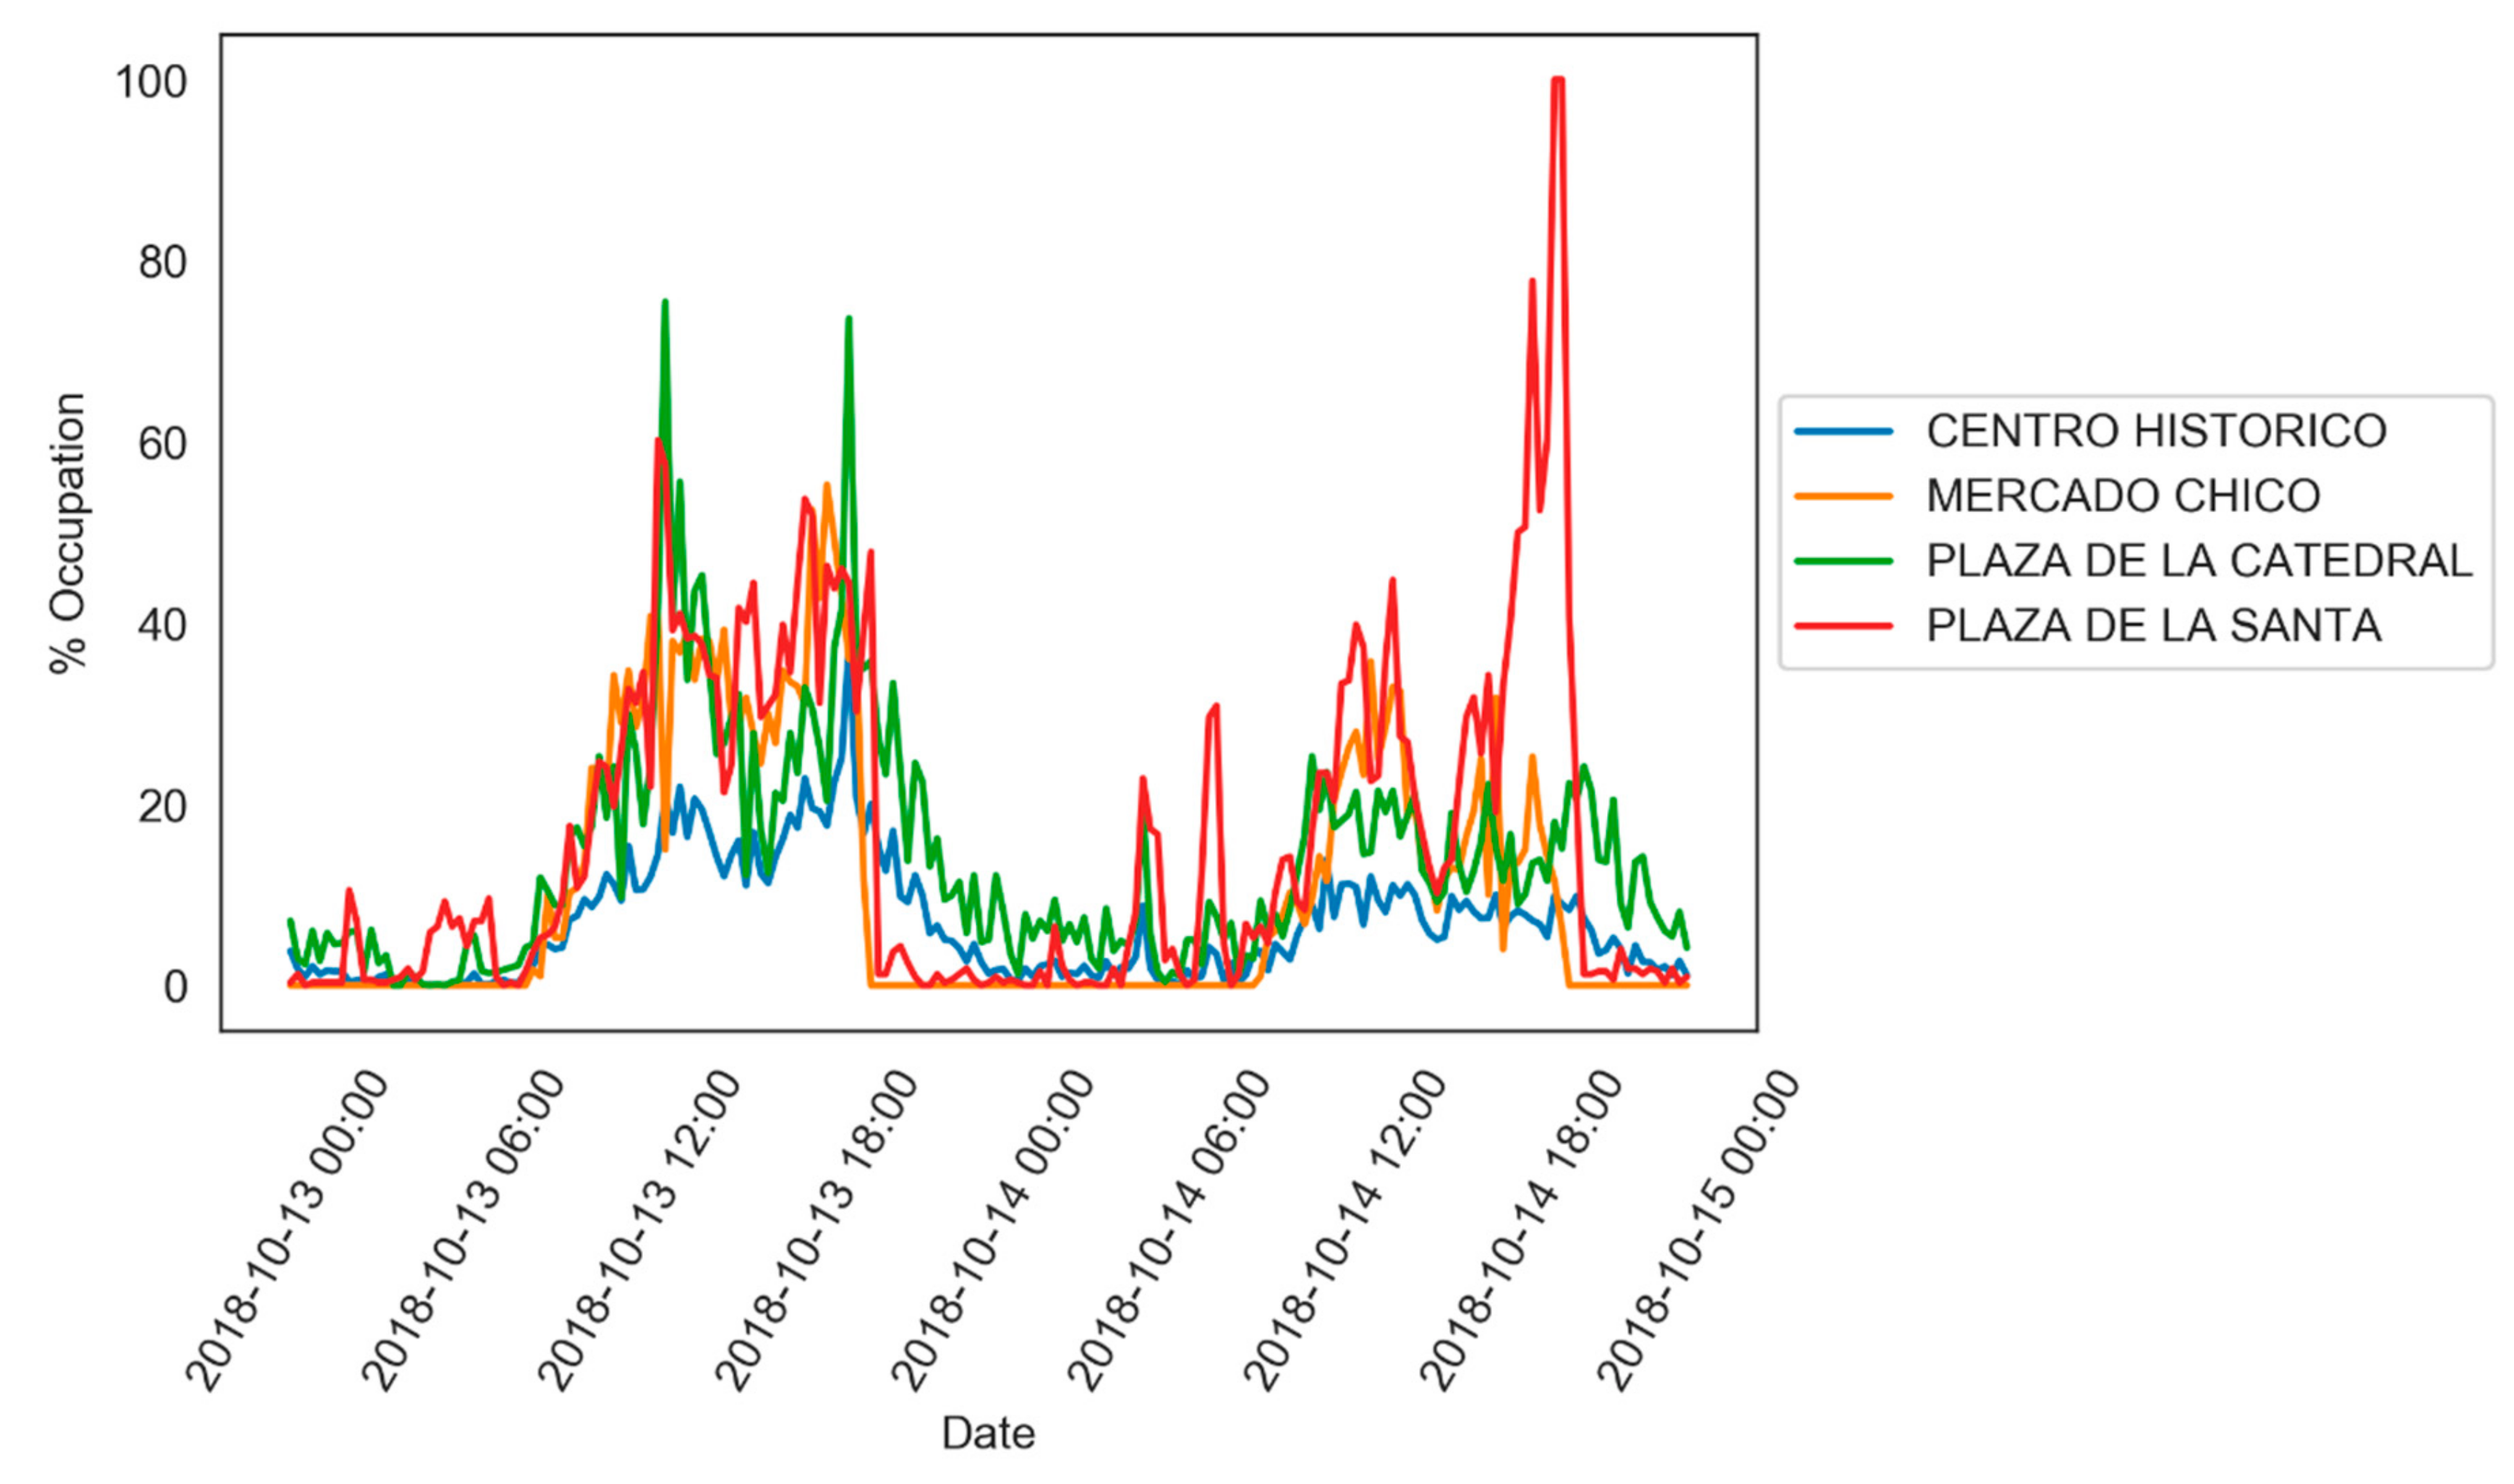
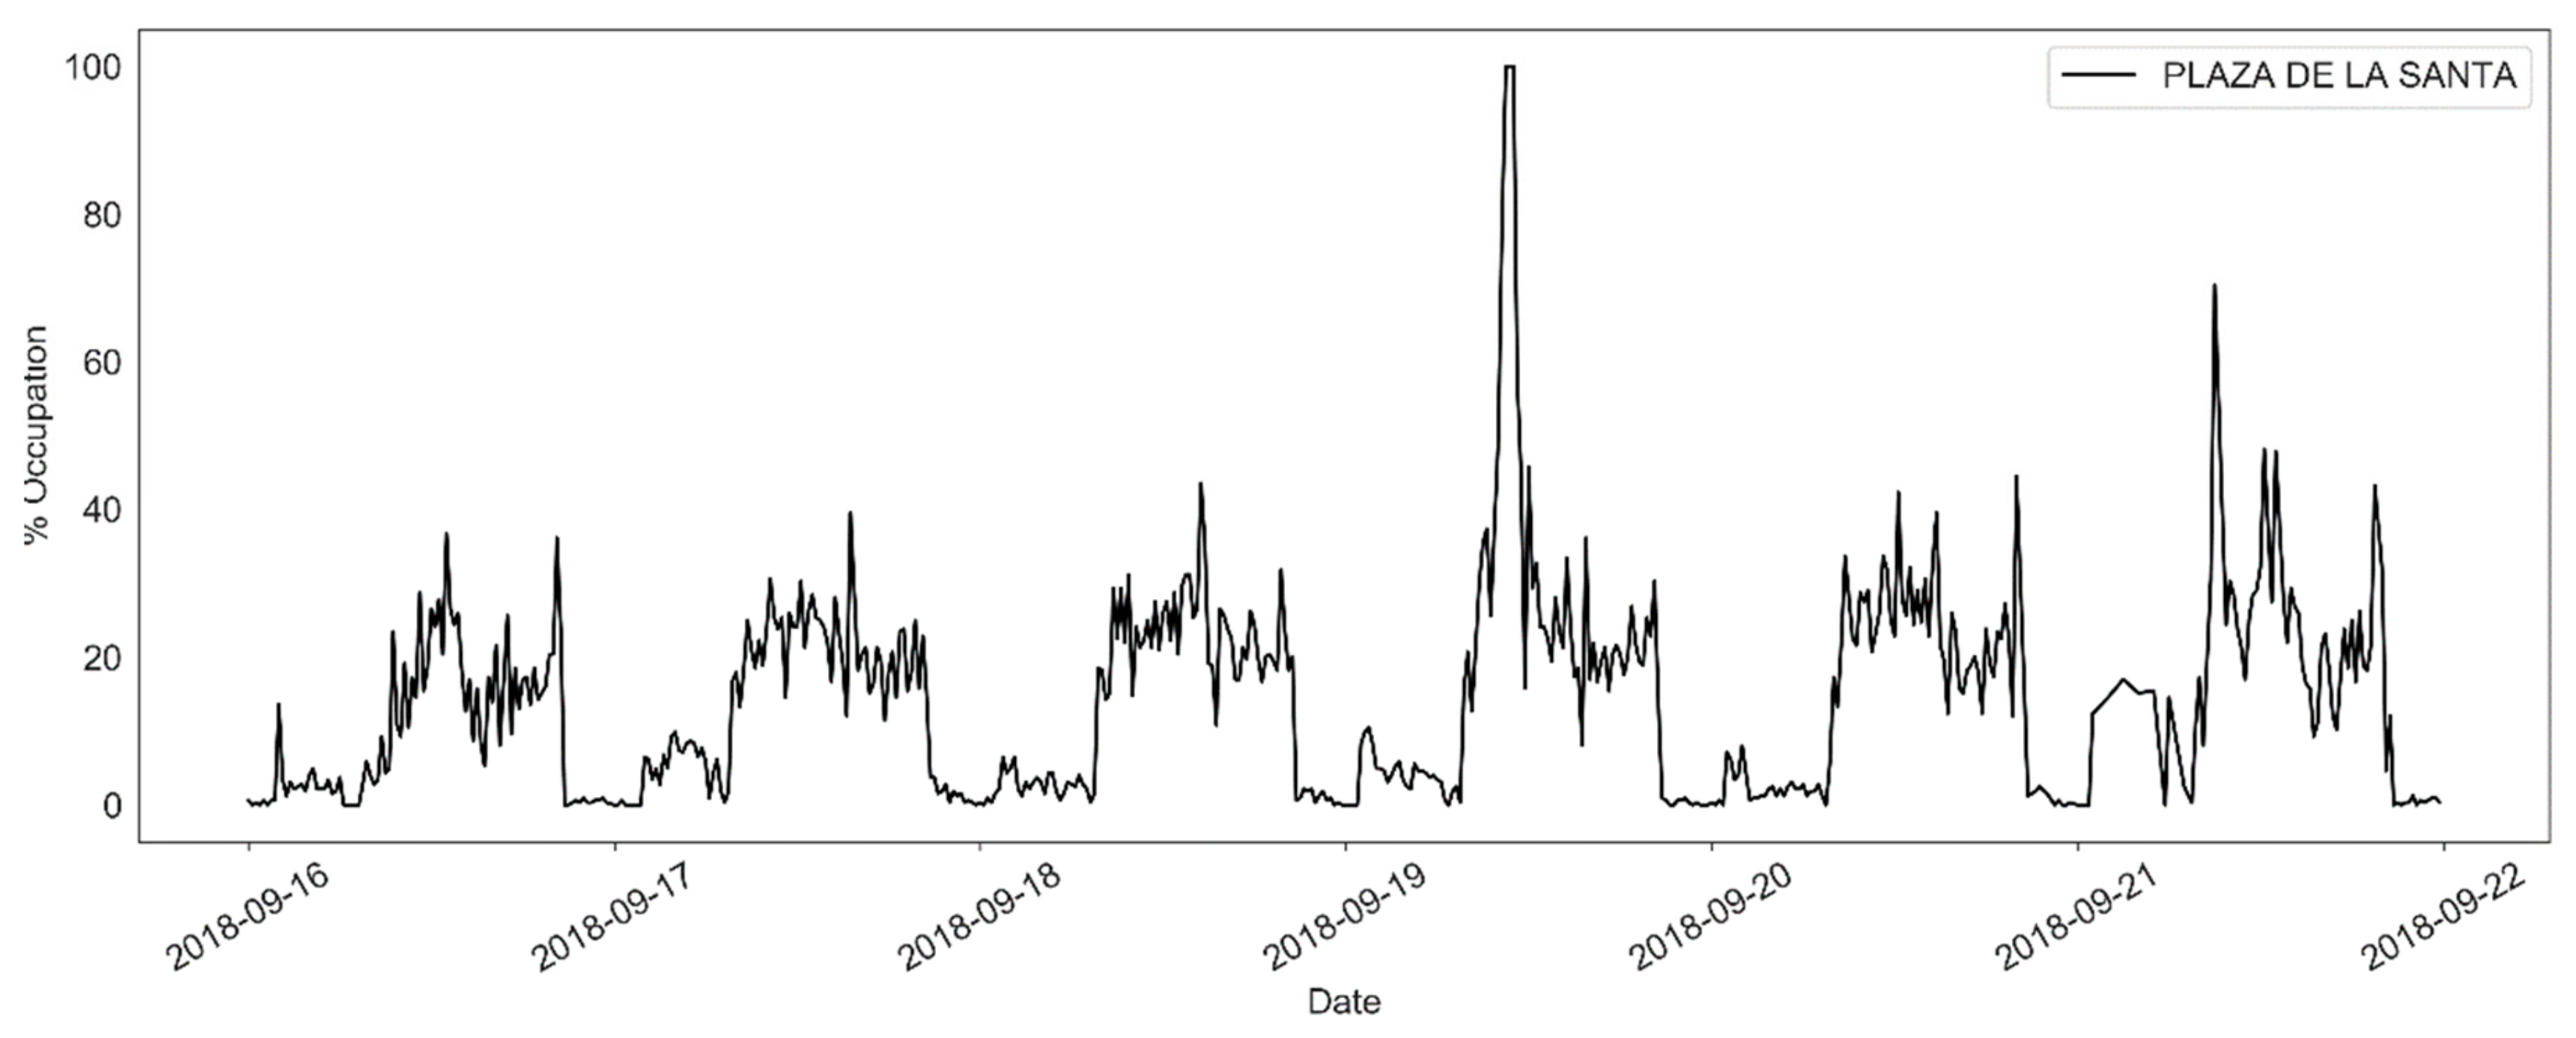
Figure 10 depicts pedestrian activity on two special occasions. In 2018, the festivities in honour of Saint Teresa of Ávila took place between 5 and 15 October, and the saint was honoured with a floral tribute that had been scheduled to take place on 13 October at 19:00 pm. The event was however postponed due to weather conditions until the following day. The system detected a sudden fall in activity around the Plaza de la Santa on 13 October 2018 when the ceremony had been scheduled and high levels of activity on 14 October as the religious ceremony finally went ahead.
That day was very relevant for the data analysis process. The Plaza de la Santa area was so crowded that an ordinary tourist unaware of the religious celebration might have appreciated cultural alternatives to enjoy the visit. The event validated the theoretical maximum carrying capacity of the area that had previously been estimated (
Section 2.3.3.) at 324 persons (100% pedestrian presence), calculated by dividing the carrying capacity per visitor (6 m
2) into the total area (1945 m
2). At its peak, the number of people (visitors and inhabitants) present in the area (430 on 14 October at 19:15 pm) exceeded (by precisely 134%) the theoretical maximum carrying capacity for touristic enjoyment of this public space.
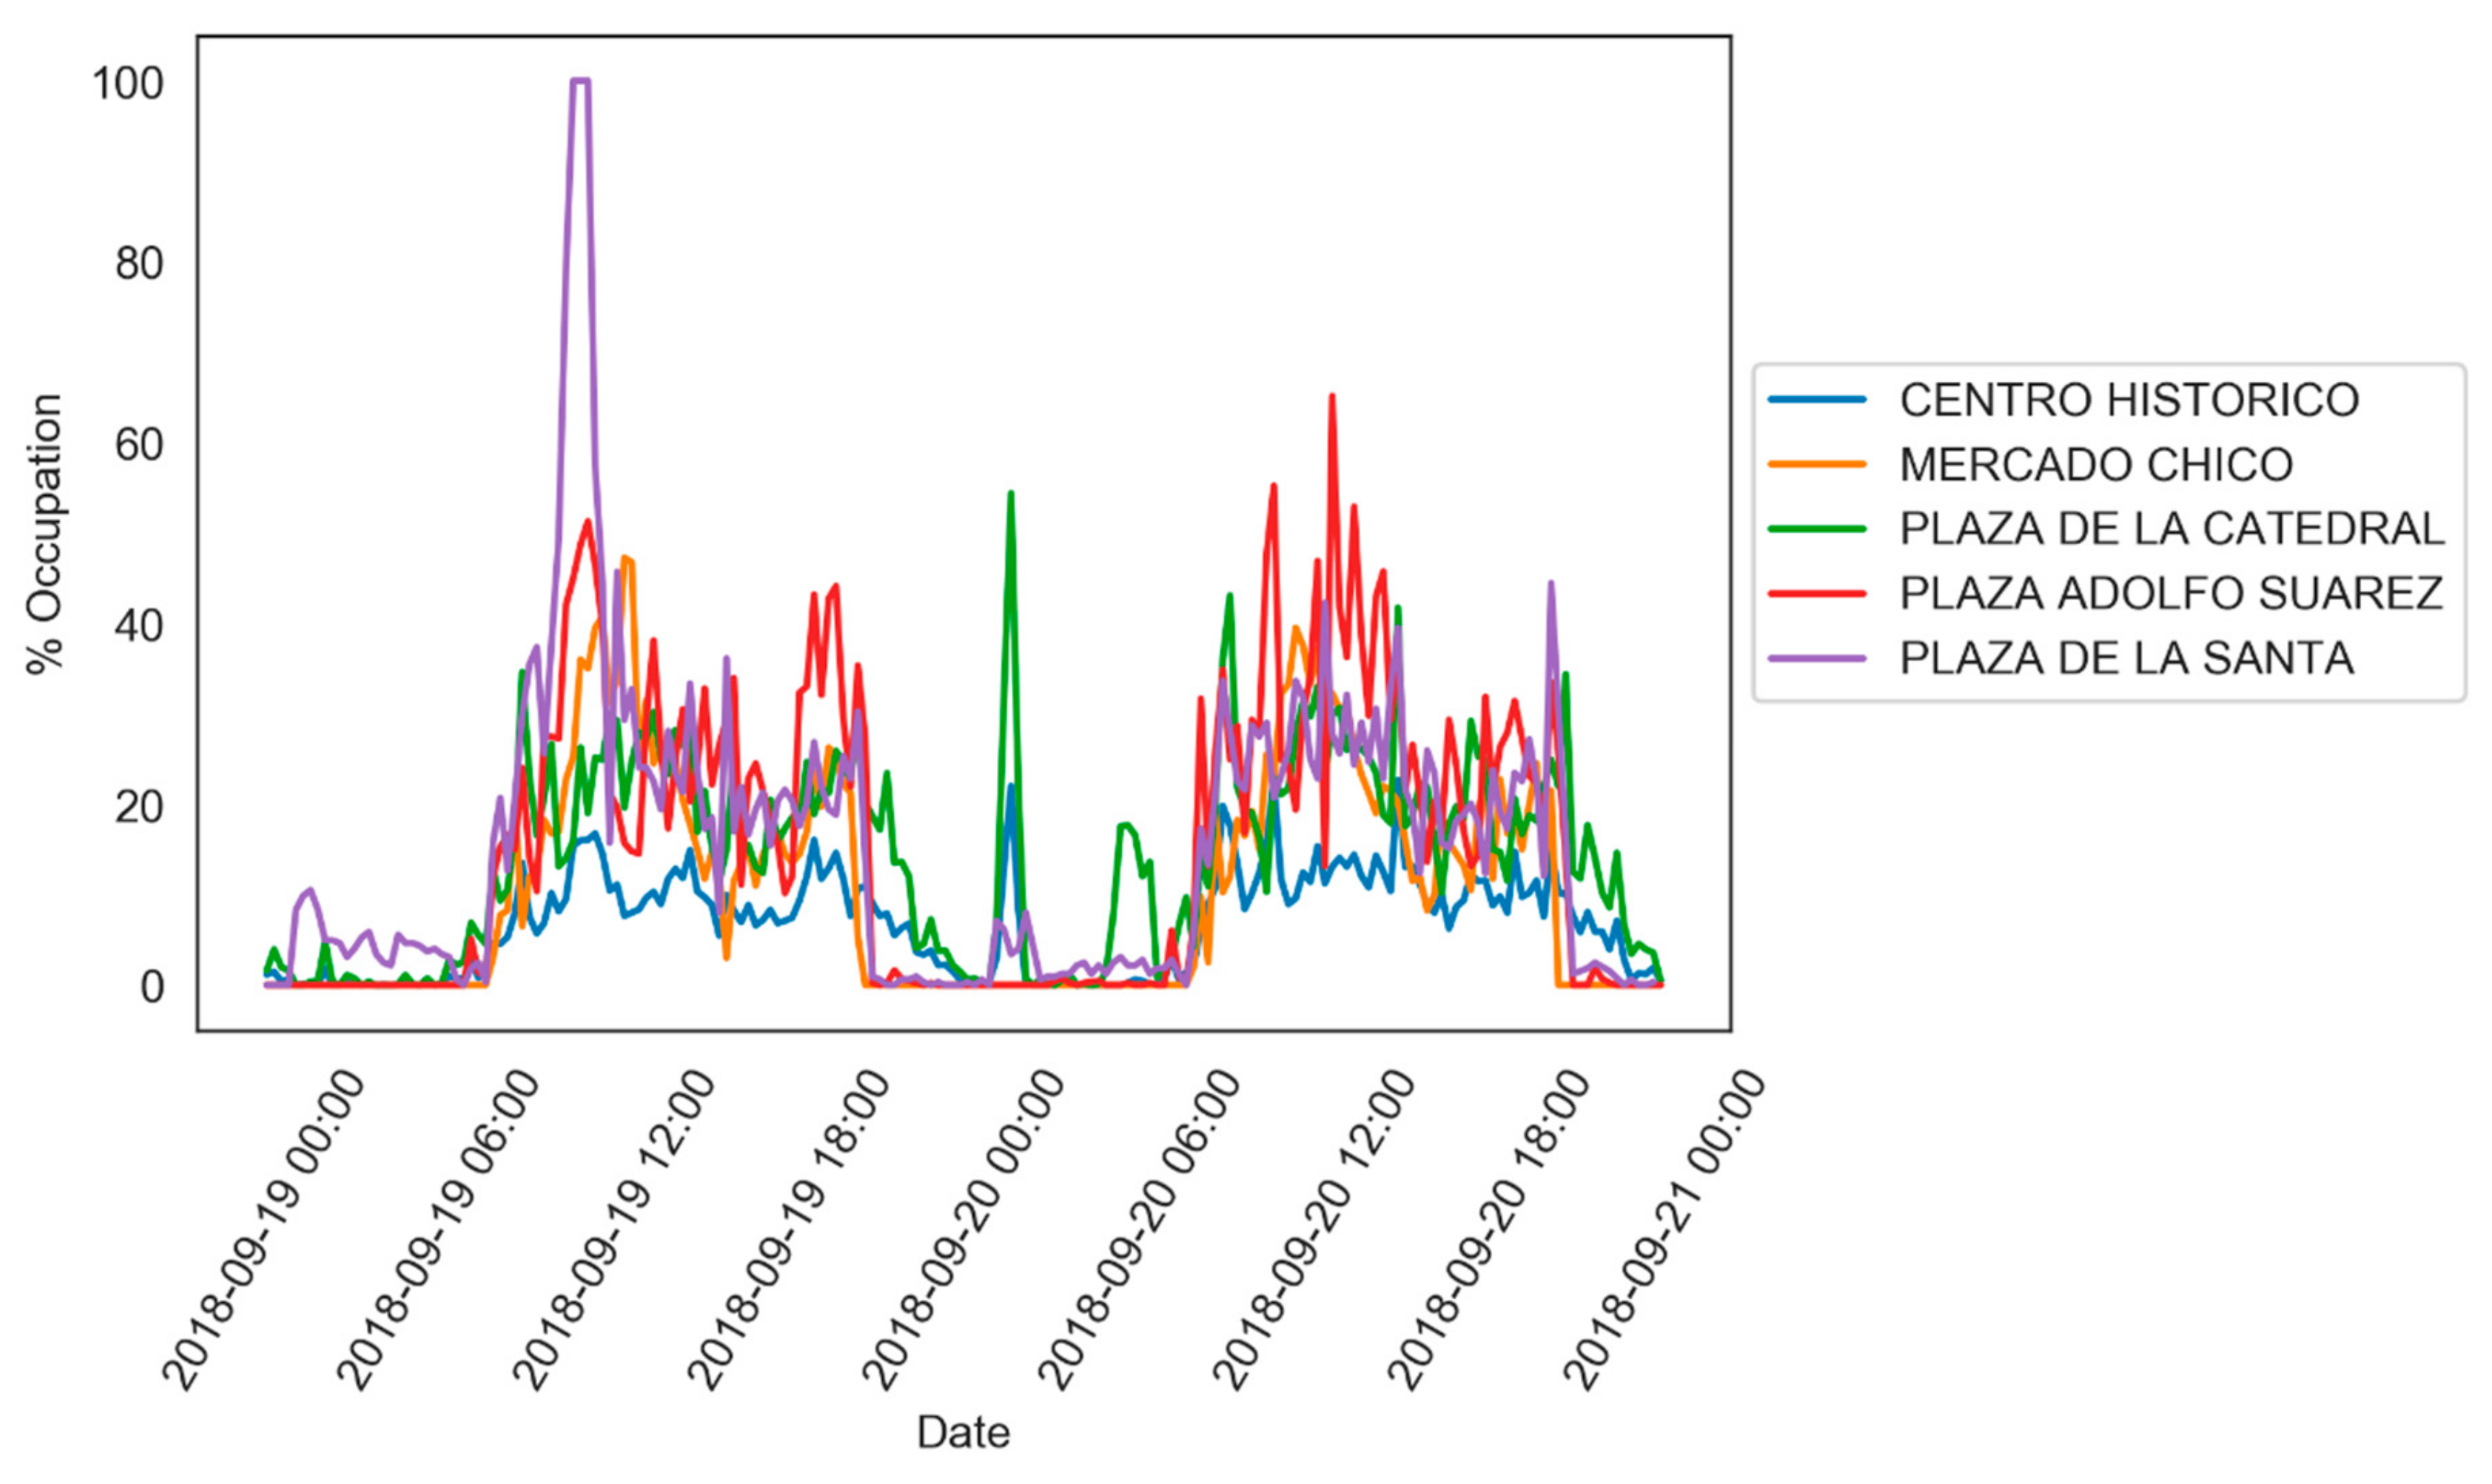
Another large-scale event had taken place on 19 September: a visit from the King of Spain to the historic centre of Ávila that attracted large crowds. Once the maximum carrying capacity of the Plaza de la Santa had been defined following the religious celebration of October 2018, reference to the previous data on the royal visit of 19 September was sufficient to corroborate the maximum carrying capacity for other areas, especially the Plaza de la Catedral, as may be seen from
Figure 11 and
Figure 12.
Having defined the above-mentioned thresholds, whenever abnormal behavioural patterns were observed alerts could be established. If the carrying capacity exceeded a threshold of 80%, an initial warning was generated and if successively repeated an alert was issued by the system. Also, if the carrying capacity reached 100%, an alert indicating visitor overcrowding was forwarded to city managers.
The next step was to define the periods during which the system would generate different alerts. Alerts are understood to be useful whenever there is a likelihood of reaching or exceeding a maximum threshold. However, an alert because of the presence of large numbers at midnight should, for obvious reasons, differ from an alert at midday during a local festival, hence the need to define different periods. Periods for the different hours of the day (night, morning, midday, afternoon), periods for working or non-working days (weekdays, weekends, and holidays), and periods relating to the season of the year. The same process for defining the maximum carrying capacity was used for all periods. The alerts at night, when nearly no people would (normally) be present in public spaces, were therefore differentiated from midday alerts, when visitor numbers were expected to be high, which would also help city managers with safety issues.
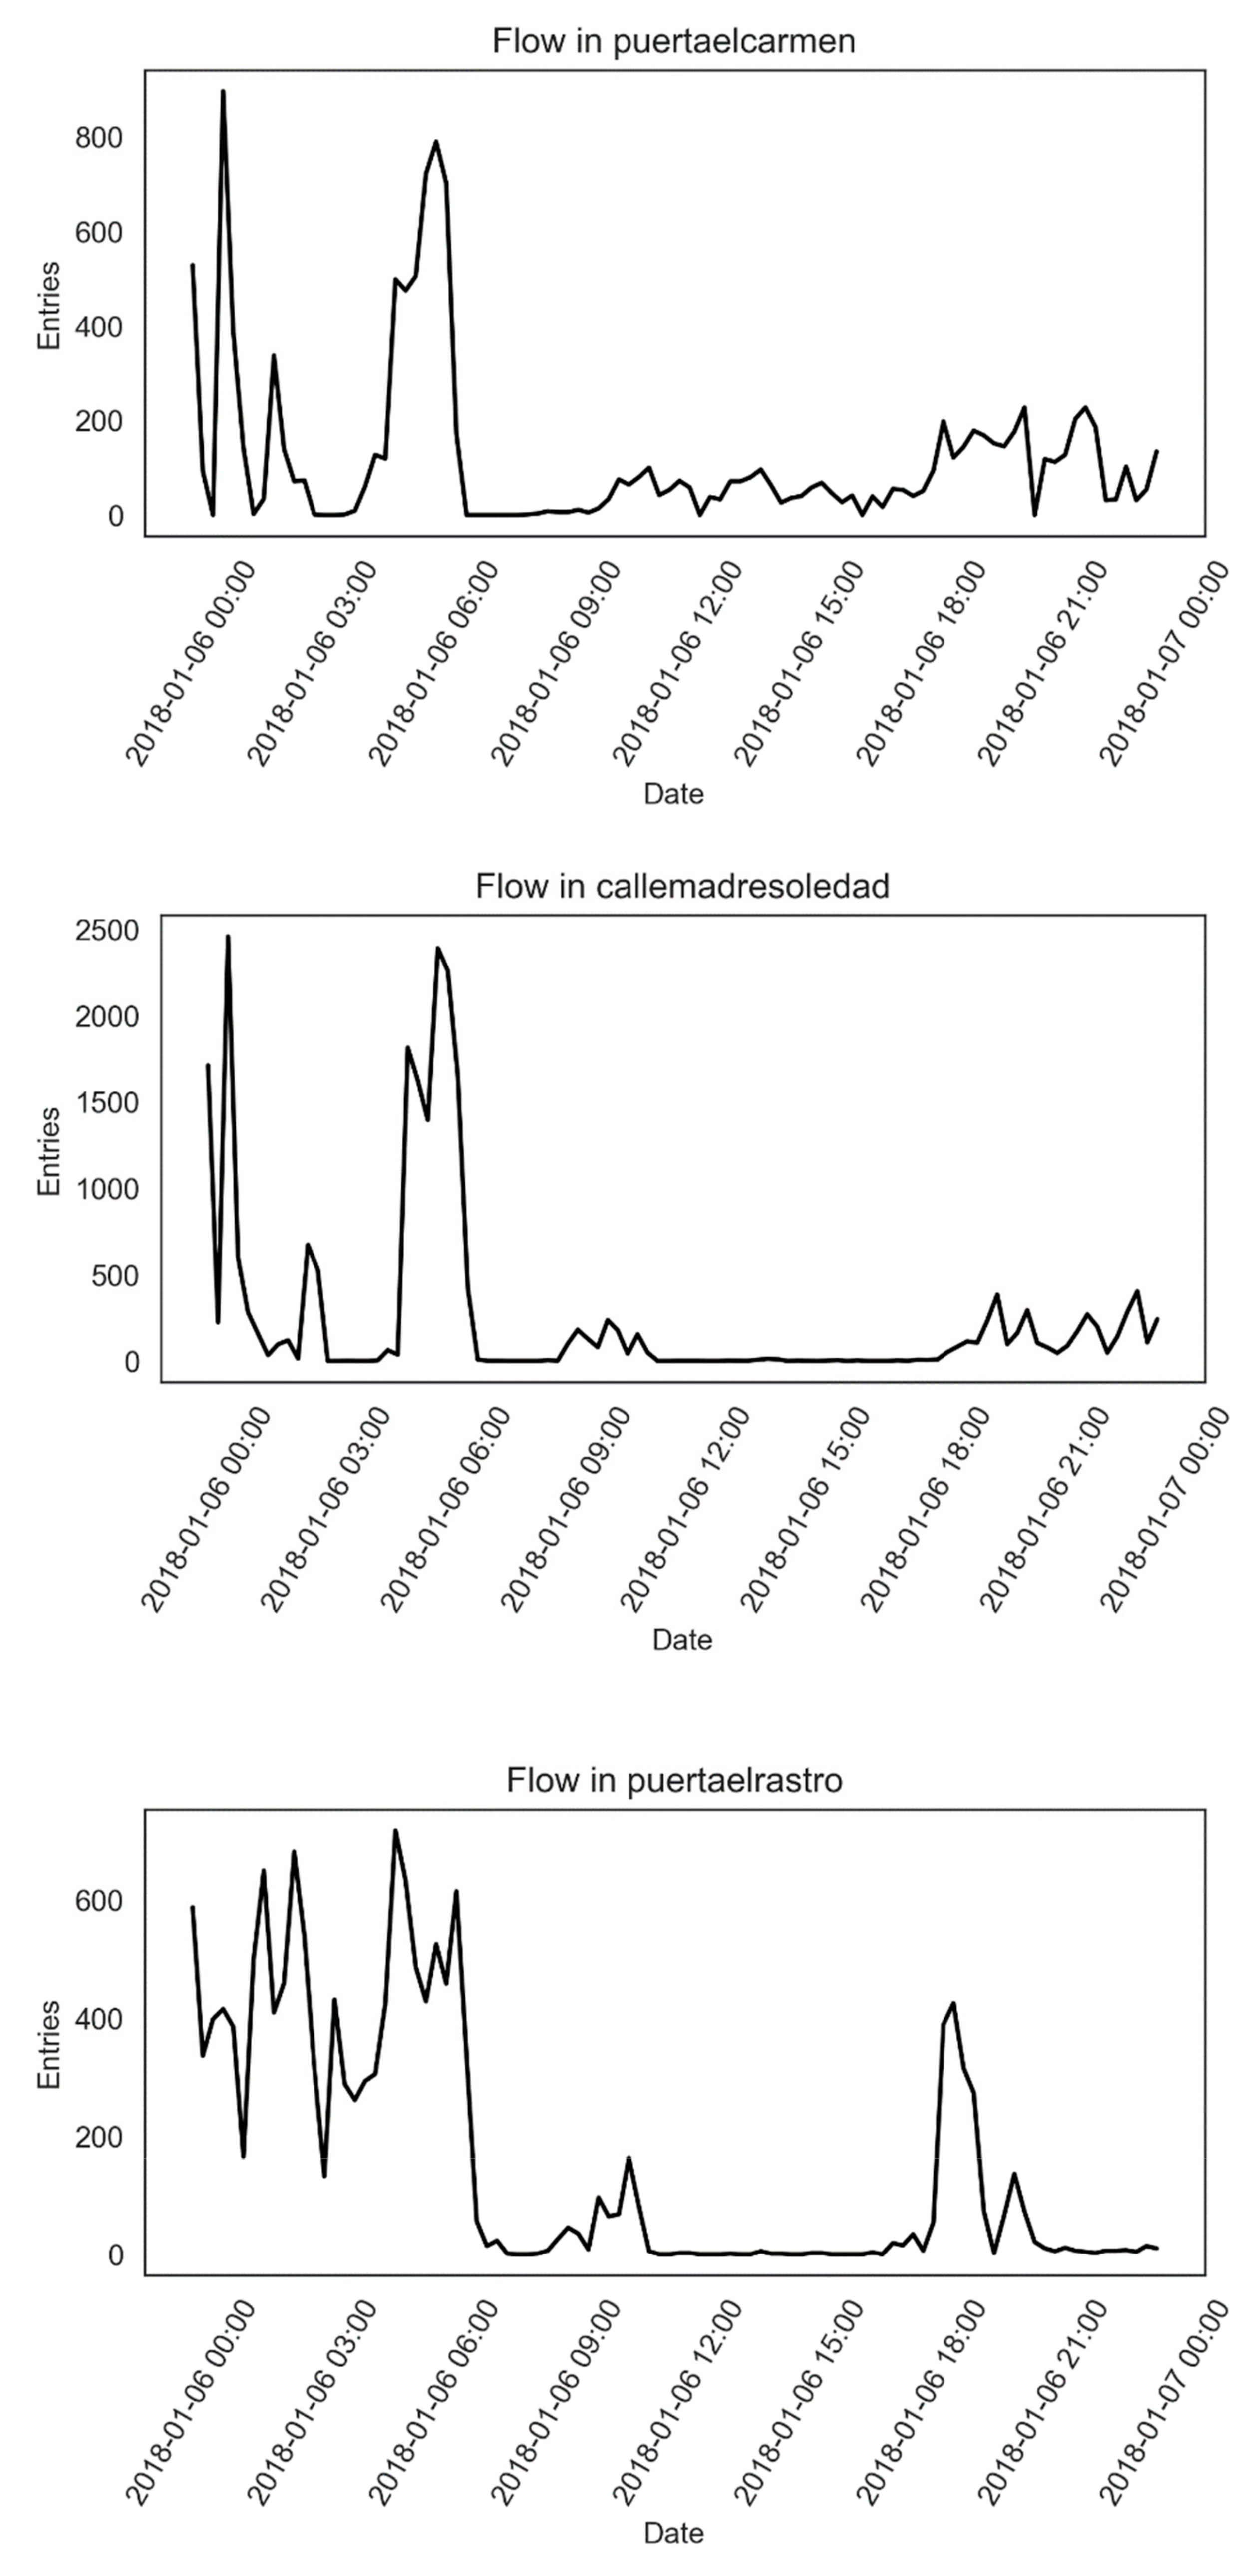
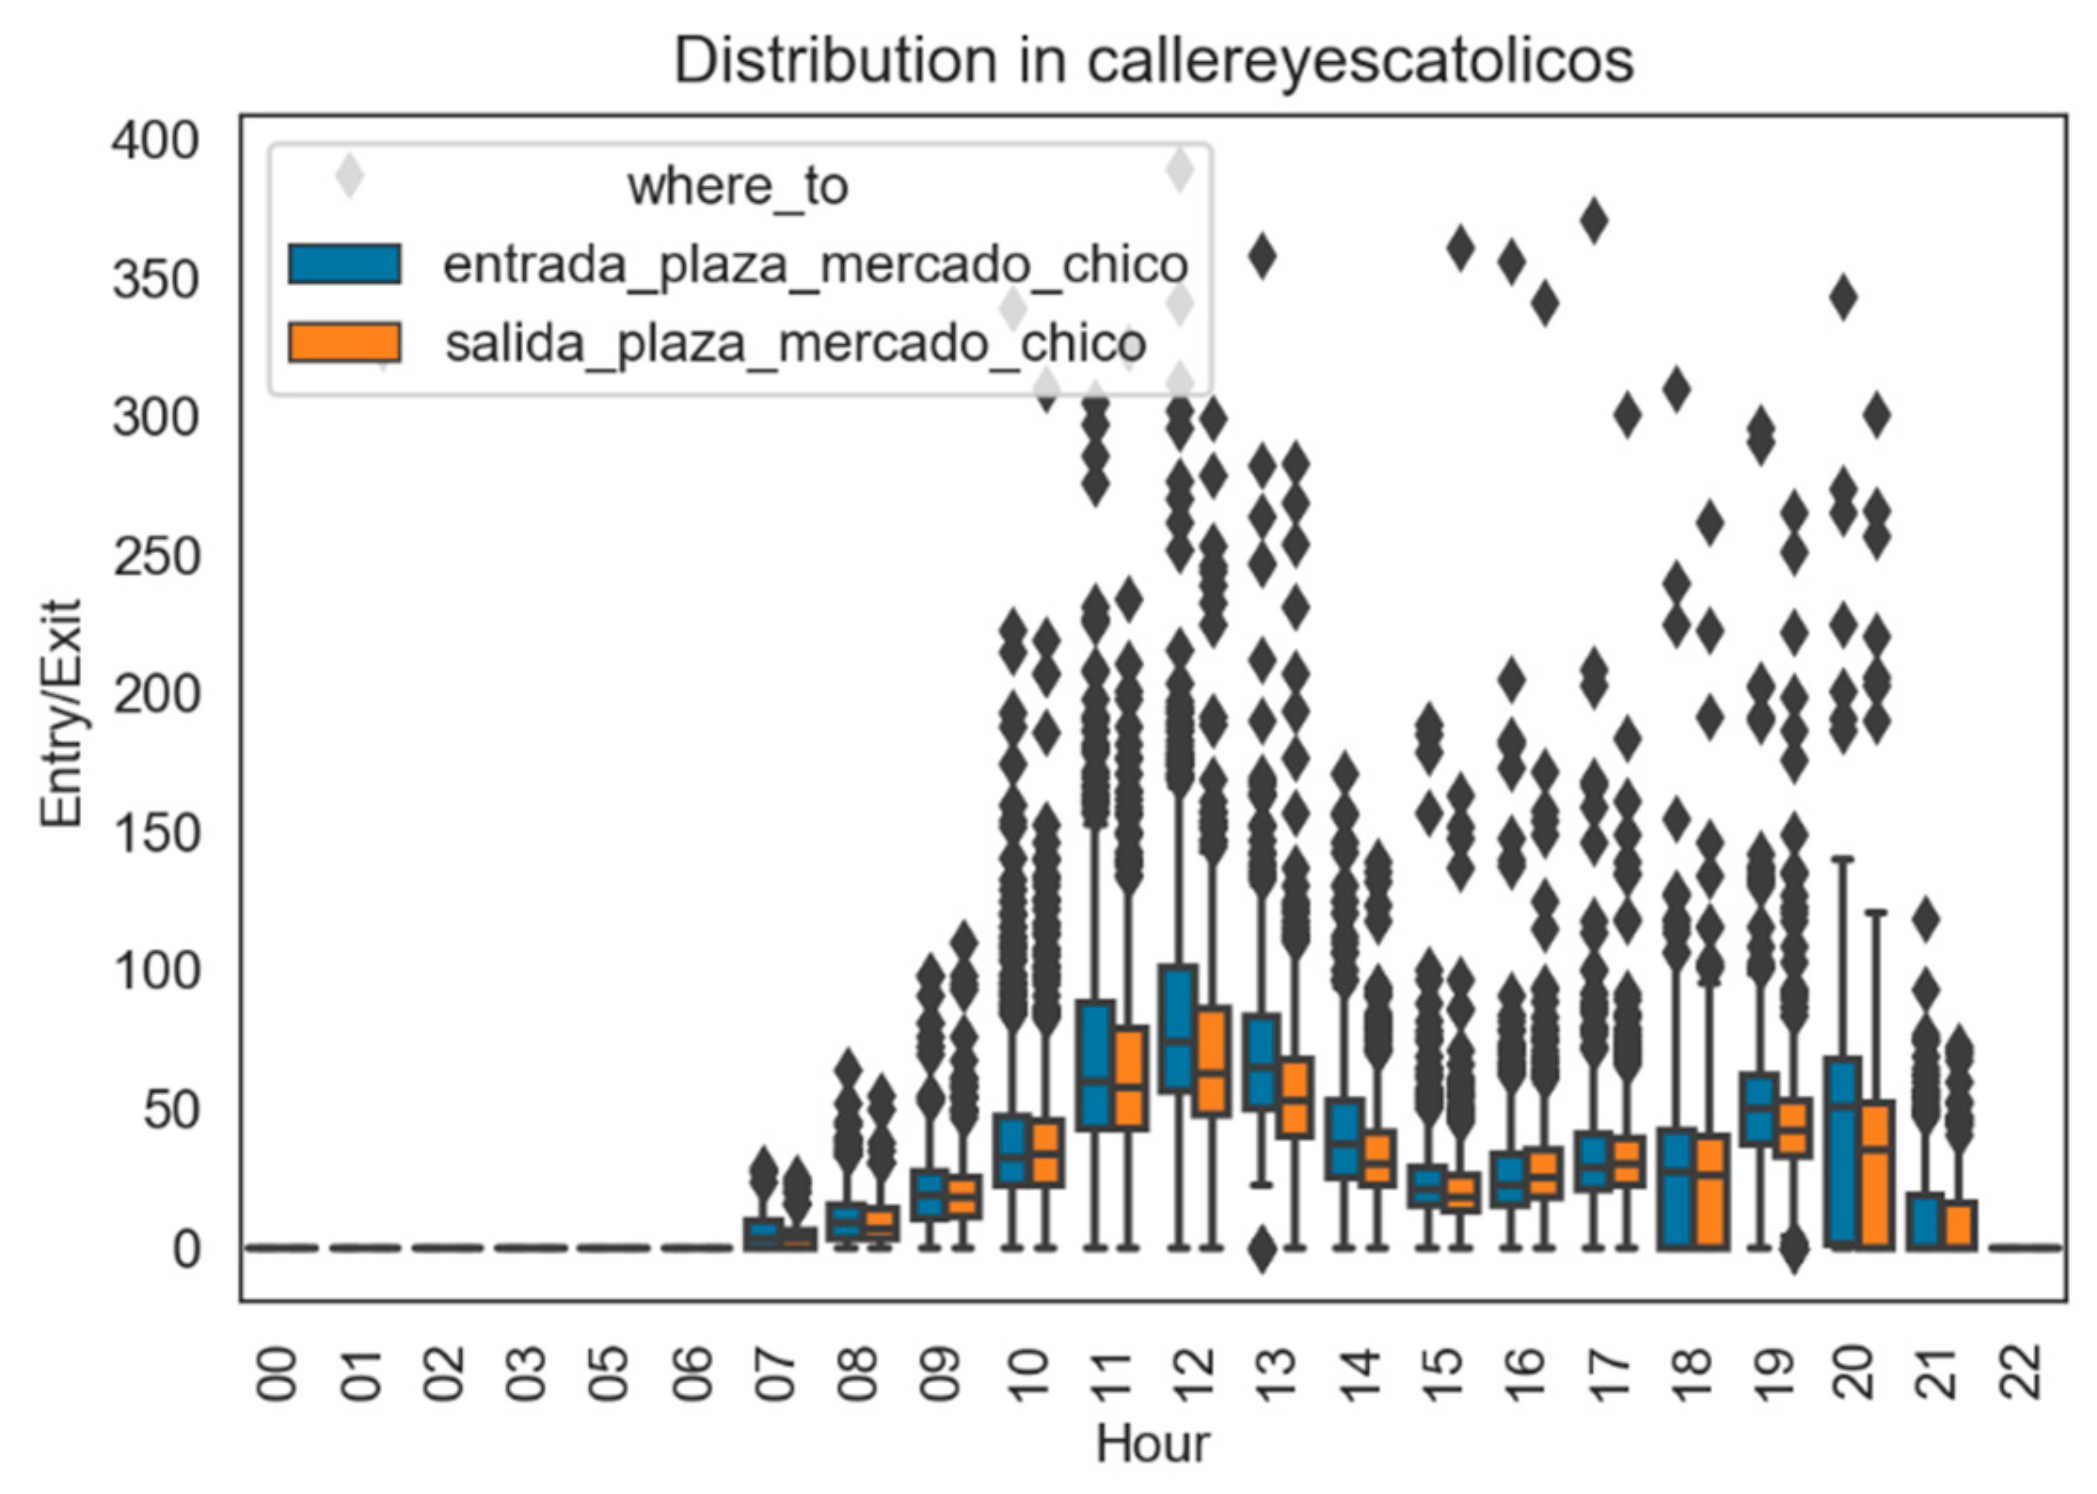
Figure 13 shows the average distribution of entry–exit points to and from the Street or Calle Alemania throughout the monitoring period; as can be seen, the period with most activity was around midday. Both early morning and afternoon activity can be easily identified, both influenced by work flows. The same distribution is identified in another entry-exit point, the Calle Reyes Católicos (see
Figure 14). Segmentation thereby helped identify local tendencies and routine workflows and their differentiation from tourist flows. A maximum pedestrian presence was defined for each of those periods, which, whenever exceeded, will generate an alert for the relevant city managers.
2.4.5. Panel Usage and Interest in the Selected Areas
The other important data source for monitoring purposes was from the smart information panels. The panels display different digital touches relating to interest points and contain Passive Infrared Sensors (PIR) to activate the panel. They can also monitor the number of people passing by the panel, whether or not they make use of it. The panels upload a data file containing a time-stamped entry for each PIR and each interaction with the panel, which can be analysed to determine the periods of most frequent use.
The data recorded by the panels is useful insofar as real visits to the interest points can be identified to develop strategies that encourage visits to alternative interest points, by promoting visits to those sites via different strategies. The data can also be used to determine the days on which the panels are most frequently consulted, providing valuable information for the development of tourism-related strategies, to increase visits on specific days by programming special events.
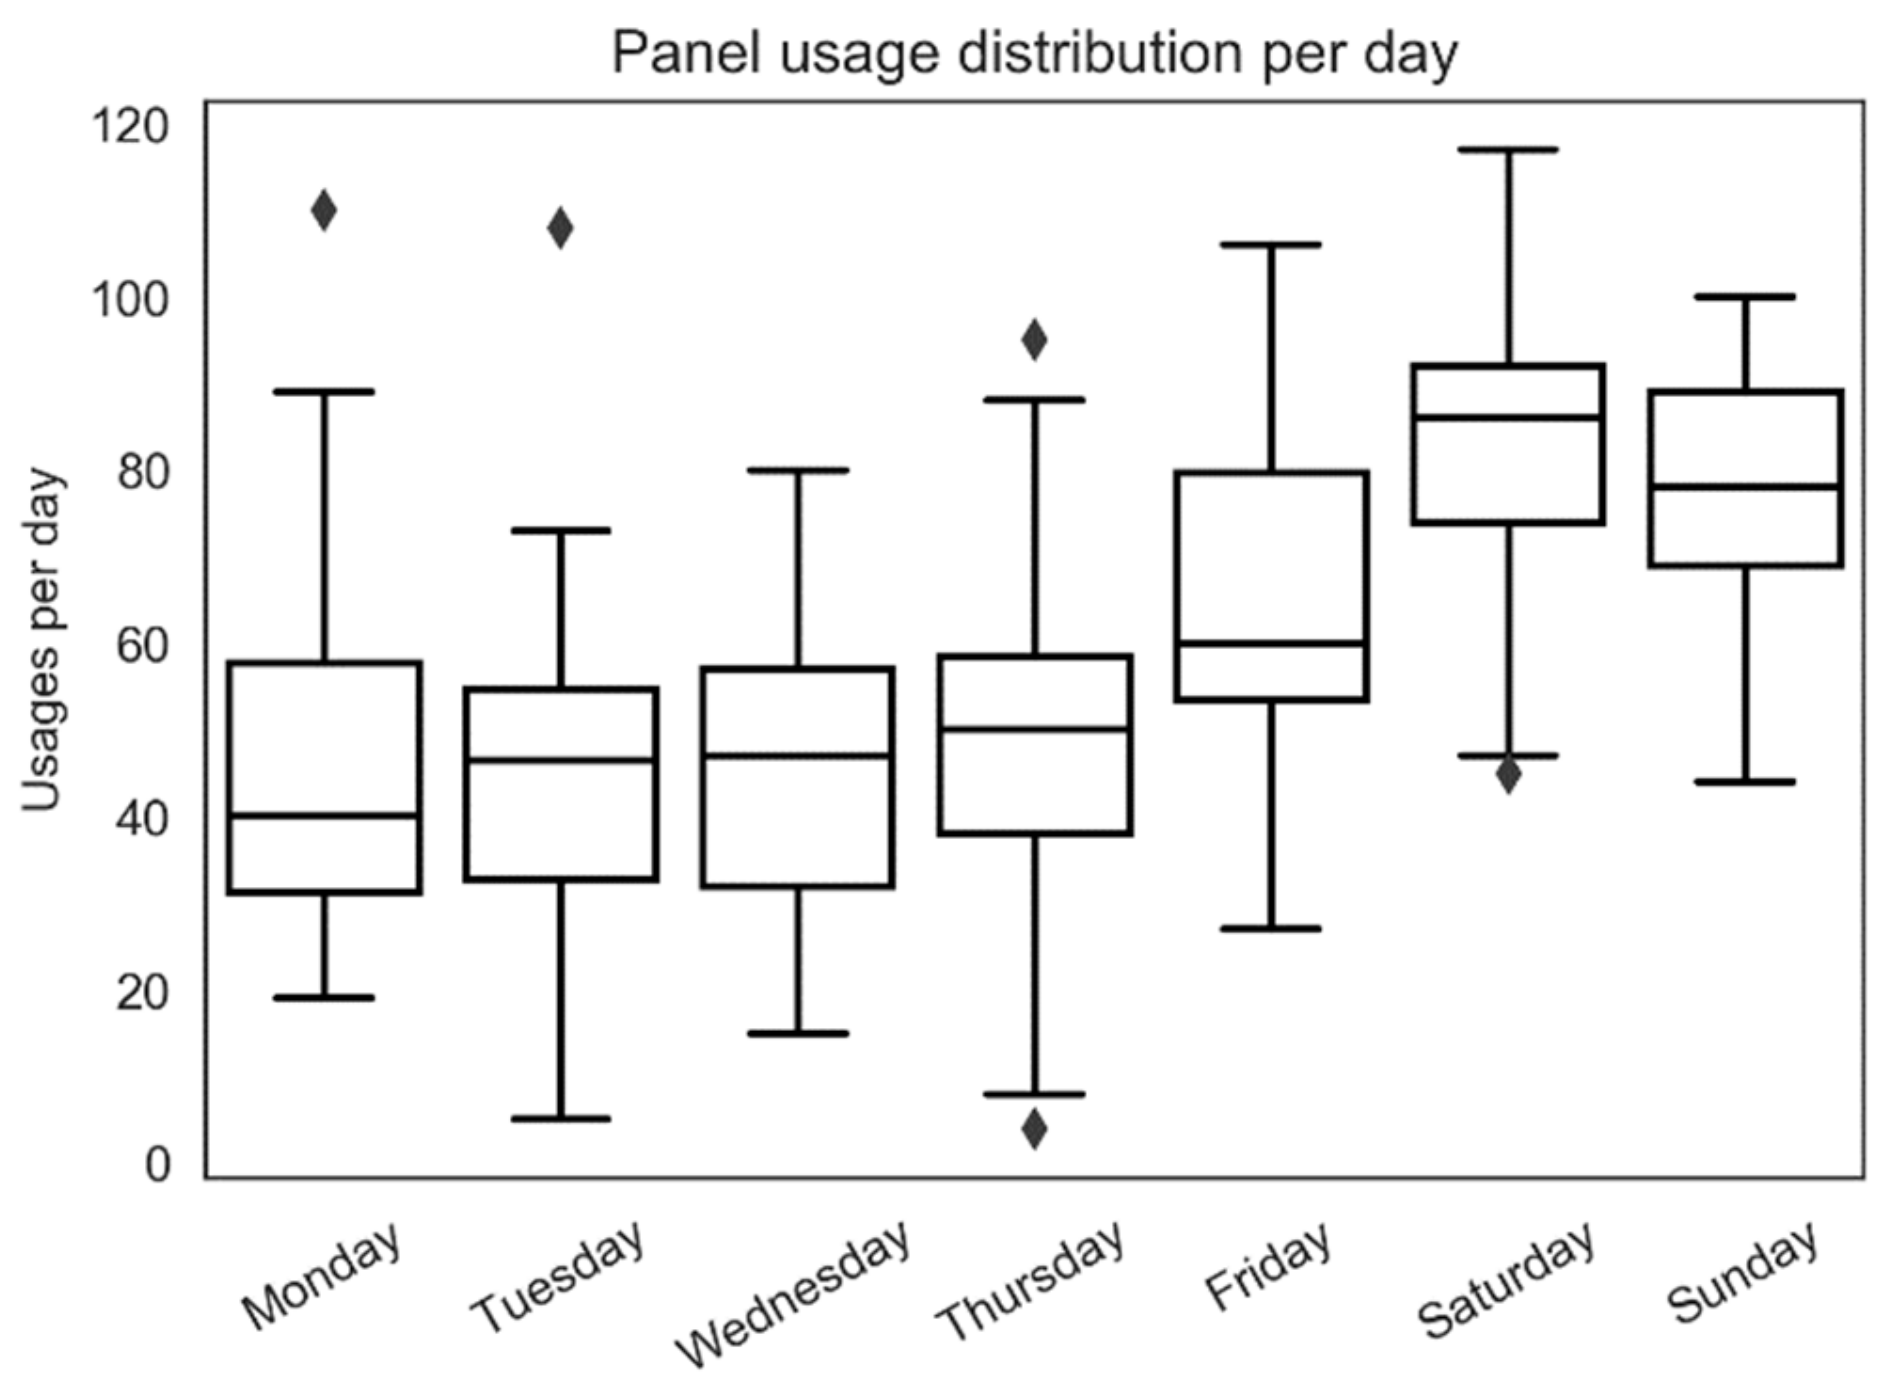
The daily usage of the panels is analysed in
Figure 15; the panels were clearly used with greater frequency on Saturday and Sunday, while Fridays also showed slightly greater usage when compared with the very similar frequency of use on other working days.
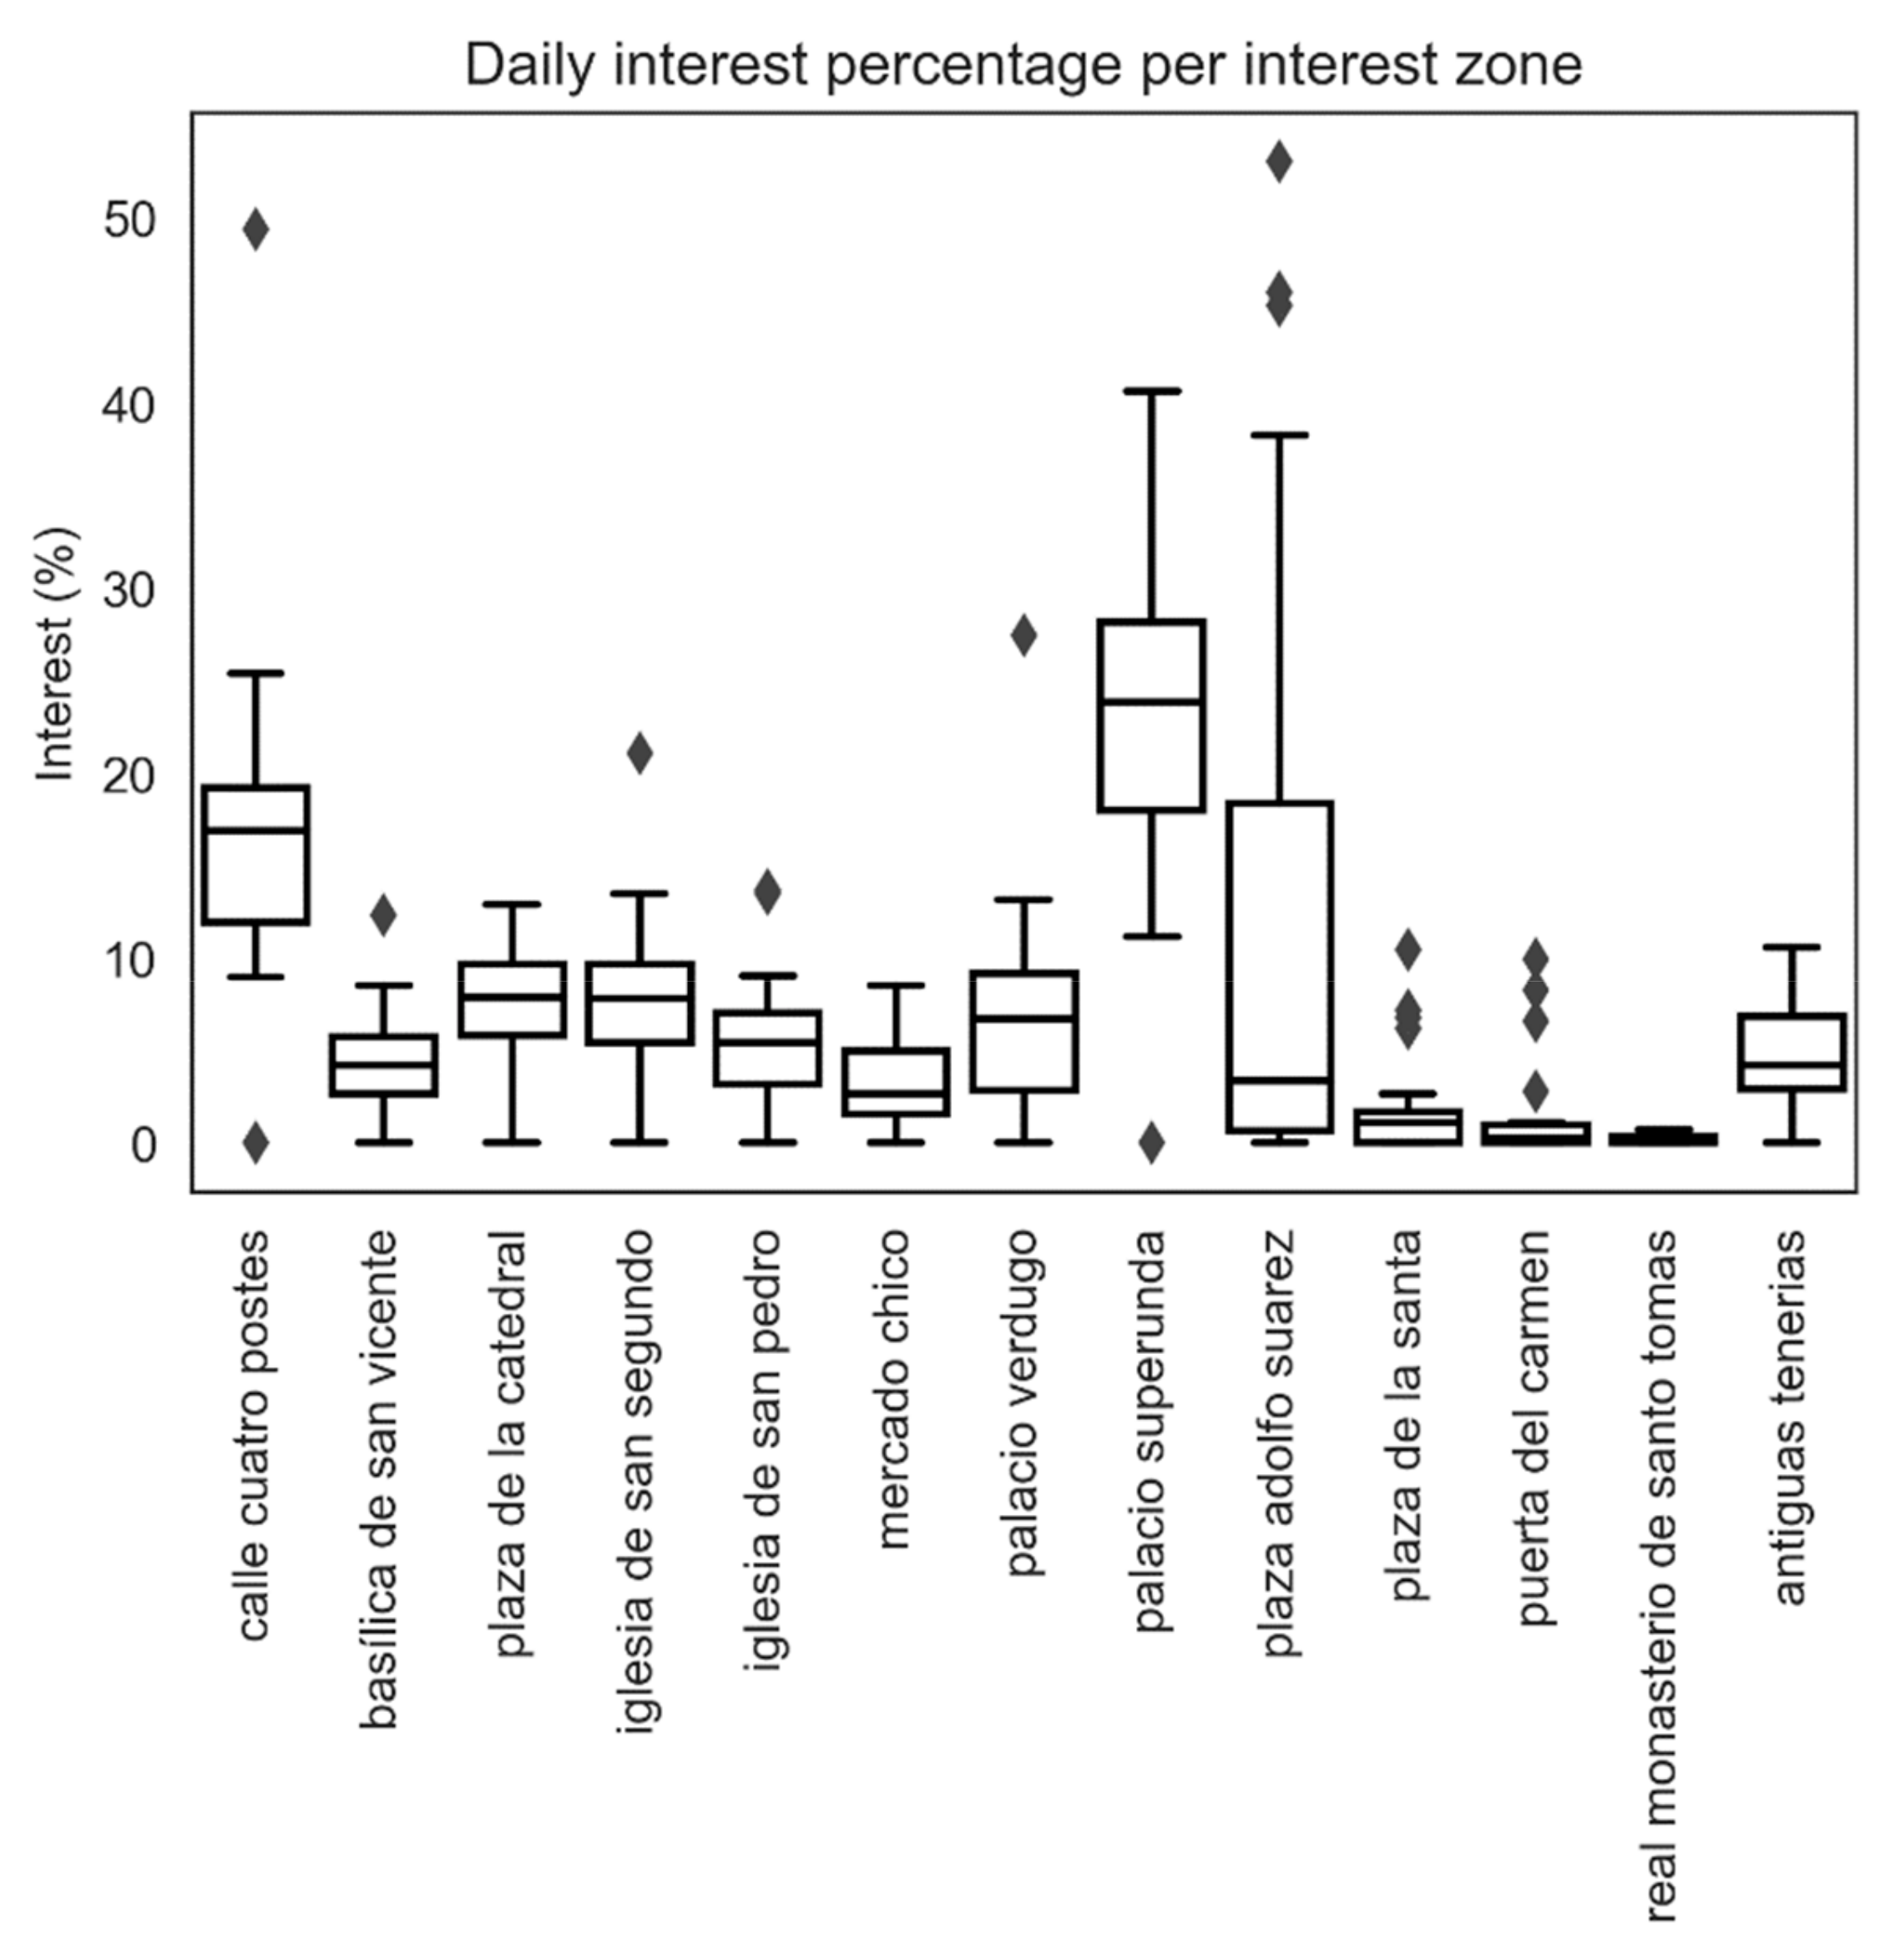
The analysis of the smart panel touch points revealed that visitors consulted the interest point close to the location of the panel.
Figure 16 shows the distribution of the consultations. The most frequently consulted interest points were the Palacio Superunda, Calle Cuatro Postes, and Plaza Adolfo Suarez; the two last-mentioned places were also the locations of the smart panels. The other less frequently consulted interest points had similar percentage levels of interest.
2.4.6. Smart Tourism Management
Management of Cultural Routes
All the areas were particularized, defining proper alerts according to specific flow patterns (see
Figure 17) in accordance with each defined time period. In that way, it was possible to develop the final step of the methodology: the need to avoid mass visits and overcrowding in some public spaces that would leave others underused. The Plaza de la Catedral area, for example was often overcrowded with visitors, while the Plaza de la Santa was only crowded whenever a special event took place.
Strategies were therefore developed for the city managers to avoid overcrowding. Several visitor routes to avoid overcrowding were therefore defined with city managers, especially focusing on encouraging visits to less frequently visited areas. Urbanistic interventions were planned to either close or to open special and temporary passageways and information on public display panels and the app encouraged visitors to explore the less frequently visited areas.
Application for Dynamic Occupancy Monitoring
The results of both the monitoring and the analysis of occupancy patterns and the KPIs were processed by the system previously described in
Section 2.3.3. The results provided information to tourism managers for medium/long-term planning and for taking more immediate decisions on identifying trends and for relaying alerts on unexpected behaviour.
The intelligent tourism management application for city managers is a web platform that displays the KPIs defined for the units of the urban 3-D model. The 3-D model was deployed on a geospatial database with access to information through standard Web services (WFS). The KML format was used for geometric visualization through the Web viewer. The viewer is based on the open-source Cesium WebGL library.
This viewer collects the information on the urban units and the indicators calculated for the different areas of the project. The indicators collected aggregated results on an annual and monthly basis and uploaded the data to the project database.
The application provides a GIS-based 3-D visualization of the urban environment and displays colour-coded comparisons of visitor numbers to the selected areas or monuments. It also provides information on the KPI values compared to the occupancy patterns corresponding to the selected time frame, for each of the selected site values.
In the following figure (
Figure 18), we can see the areas and the monuments of the historic centre of Ávila that are colour-coded by the annual average of daily visitor numbers. In addition, a graph is presented for one selected area (Mercado Chico area) that indicates the occupancy pattern over the past 12 months.
3. Results and Discussion
3.1. Manager Platform Application
As previously outlined, intelligent support tools are now available to city managers for short-term, mid-term, and long-term planning within the historic centre. Use of real near-time data and historic data on visitor flows facilitates short-term urban and architectonic measures, such as activating barriers, bollards, and traffic lights, accompanied by other measures in the built environment that will guide visitors to alternative sites. It can also be used to direct local law enforcement bodies to a certain place to investigate events. Long-term interventions could consist of improving the attractions of certain less-visited areas, developing new attractions, and defining visitor routes in accordance with relevant needs and other factors.
Ávila city managers and policy makers are now more aware of the visitor flows in its historic centre throughout the year. It has been clearly stated that overtourism particularly happens in some of the analysed public spaces, in certain periods of the year and in certain hours of the weekends. They are now using this data to provide additional cultural attractors for visitors in other areas of the walled city (west) and outside of it, with the aim of obtaining a more sustainable touristic activity in the historic centre.
3.2. Tourist App
At the same time, visitors will have an innovative application available to them when visiting the city. It will have the potential to improve the quality of their visit. Their perception of the built environment will be heightened through their use of the smartphone application, their visits will be more evenly spread out across the city and adapted to special needs and expectations.
3.3. Discussion and Replicability
This research has focused on providing a method and tools to manage tourist influxes in an effective and sustainable manner. It has also revealed conclusions on how to obtain data on visitor movements. The use of people-counting cameras has validated the theoretical calculations of the maximum capacity of urban areas in order to define comfort thresholds Alternative data sources might be applicable, as the study has particularly identified some difficulties with the selected data-collection technologies such as: expensive installation and infrastructural needs, difficulties obtaining permits, problems associated with personal data protection or inhabitant awareness, as well as certain challenges in the counting method itself, like counting errors due to meteorological aspects (e.g., snowfall) or due to massive or compact groups of visitors. Among the last points, economic aspects and the need for data-driven infrastructure are crucial aspects that call for changes to the data-gathering process. The large volumes of data available nowadays mean that the system is replicable, even though the data might not be gathered using the above-mentioned monitoring system. The intelligent data-processing methodology could rely on visitor-flow data from other information sources to be replicable in other historic centres. City managers can obtain data from several sources, among which are: on-site monitoring via GPS, digital panels, and other dynamic systems, mobile phone positioning (through telephone companies, through Wi-Fi networks, through Bluetooth), Google, etc.
The methodology that has been described is very useful for historic centres, which normally have very well-defined architectonic and urban layouts and limited entry points, few public squares, and very significative attractions for cultural visitors. The indicators and occupancy patterns can be easily adapted to other similar historic centres as well as larger historic urban areas. A replicator city would need a people-counting system, such as the one developed for Ávila, that monitors all public areas, all their main entrances, and their interconnecting routes. All entry points to the whole area should in any event be monitored. The methodology is therefore suitable for well-defined historic centres and could be also adaptable to other morphologically diverse or less confined historic urban areas, once the visitor-tracking techniques have been modified as recommended earlier. Additionally, the methodology could be replicated at locations with very different patterns of visitor behaviour; on the one hand, it would support sustainable tourism management where the touristic attractions are iconic and mostly immovable (given that the diversification tourist activity can decongest overcrowded areas in accordance with the date and hour), and, on the other hand, it would support sustainable tourism management where events are programmed that draw large crowds (by notifying both managers and tourists of specific events to prevent overtourism in those areas).
Upgrading the methodology could be focused on obtaining additional data from visitors (through additional data-gathering sources), which would enhance baseline knowledge for indicator analysis and thereby improve the operability of the management platform; as well as providing a way of developing additional tools for visitor management in accordance with those supplementary inputs.
4. Conclusions
The methodology that has been outlined resulted in a sustainable management strategy for cultural-led circular tourism in the historic centre, with tools through which city managers can interact to increase flows to less-visited areas and to incentivize economic activity, as well as to safeguard crowded areas and any threats to the heritage site. Visitors can therefore adapt their visit to the needs and the situation of the historic centre in terms of the number of people that they will be likely to encounter at one site or another.
Sustainable tourism management encourages circular tourism and assures its impact on the well-being of inhabitants, while enhancing the quality of the visit for the tourists themselves. The system has proven itself to be a unique way of assuring long-term social, environmental, and economic sustainability for tourism activities, serving to safeguard the heritage values of the historic centre.
This smart technological solution—as a whole—is economically and operationally feasible. Both the methodology and the system are very adaptable when deploying the monitoring equipment, the KPIs that have been developed, and the cost-effective data-analysis processes. The costs of the data-gathering solutions vary in accordance with the technological solution that is selected. Considering the innovative data-gathering tools (in particular mobile positioning and on-site monitoring via GPS) mentioned above, a low-cost technological solution can be offered.
Future work will be focused on querying the data-gathering process, adapting the methodology to other sources of visitor flows, also in accordance with the costs that they might incur, as well as developing automatized decision-support systems, designed to assist responsive urban environments.


