Article

The Influence of Hydrogen on the Indications of the Electrochemical Carbon Monoxide Sensors

by
Małgorzata Majder-Łopatka
*,
Tomasz Węsierski
,
Anna Dmochowska
,
Zdzisław Salamonowicz
and
Andrzej Polańczyk
Faculty of Fire Safety Engineering, The Main School of Fire Service, 52/54 Słowackiego St., 01-629 Warsaw, Poland
*
Author to whom correspondence should be addressed.
Submission received: 15 November 2019 / Revised: 13 December 2019 / Accepted: 16 December 2019 / Published: 18 December 2019
(This article belongs to the Special Issue Green Technologies in Air Treatment)

Abstract

:
This article examines electrochemical carbon monoxide (CO) sensors used as mobile devices by rescue and firefighting units in Poland. The conducted research indicates that the presence of chlorine (Cl2), ammonia (NH3), hydrogen sulfide (H2S), hydrogen chloride (HCl), hydrogen cyanide (HCN), nitrogen (IV) oxide (NO2), and sulfur (IV) oxide (SO2) in the atmosphere does not affect the functioning of the electrochemical CO sensor. In the case of this sensor, there was a significant cross effect in relation to hydrogen (H2). It was found that the time and manner of using the sensor affects the behavior in relation to H2. Such a relationship was not recorded for CO. Measurements in a mixture of CO and H2 confirm the effect of hydrogen on the changes taking place inside the sensor. Independently of the ratio of H2 to CO, readings of CO were flawed. All analyses showed a significant difference between the electrochemical CO sensor readings and the expected values. Only in experiments with a 1:3 mixture of CO and H2 was the relative error less than 15%. The relative error in the analyzed concentration range for a sensor with an additional compensation electrode ranged from 7% to 38%; for a sensor without this electrode, it ranged from 23% to 55%. It was ascertained that in the cases of measurements for tests carried out at higher concentrations of H2 in relation to CO, a sensor with an additional electrode is significantly better (more accurate) than a sensor without such an electrode. Differences at the significance level p = 0.01 for measurements made in the CO:H2 mixture at a ratio of 1:3 were ascertained.

1. Introduction

To identify hazardous substances, rescue units around the world use different measurement techniques, including gas chromatography, infrared spectroscopy, ion mobility spectrometry, and electrochemical methods [1,2,3]. Due to the low price, small size, and the possibility of their use in mobile instruments, electrochemical sensors have found wide application and are used for monitoring, including for carbon (II) oxide (CO), hydrogen sulfide (H2S) [4], ozone (O3) [5], nitrogen (II) oxide (NO), nitrogen (IV) oxide (NO2) [6], ammonia (NH3) [7], chlorine (Cl2), hydrogen chloride (HCl), hydrogen cyanide (HCN), and sulfur (IV) oxide (SO2) [8].
A typical electrochemical sensor consists of a sensing electrode, counter electrode, and a housing containing an acid electrolyte. One of the housing walls is made of a hydrophobic membrane that is permeable to gases and impermeable to liquids. A hydrophobic membrane is used to control the amount of gas molecules reaching the electrode surface. It is mainly made of thin, low-porosity Teflon membranes [2,9,10]. The electrodes can be made of various materials. Many kinds of nanoparticles, such as metal, oxide, and semiconductor nanoparticles, have been used for constructing electrochemical sensors [11,12,13,14,15].
The electrochemical sensor market is expected to register a Compound Annual Growth Rate of 11.4% over the forecast period 2019–2024. The emergence of nanotechnology-based sensors will drive the market during the forecast period [16].
Statistical data indicate that the most common reason for the intervention of emergency services is the suspected release of carbon monoxide. CO is formed as a result of incomplete combustion of carbon and organic substances. As CO is an odorless, tasteless, and colorless gas, it is known as the silent killer. CO poisoning is the most common type of deadly air poisoning in many countries [17]. CO enters the body mainly through the respiratory system, and the amount that enters the body depends on the concentration of CO in the air and the amount of time for which a person breathes polluted air. The most common symptoms include headache, nausea and vomiting, dizziness, lethargy, and a feeling of weakness [18,19]. Health effects associated with exposure to CO range from the more subtle cardiovascular and neurobehavioral effects at low concentrations to unconsciousness and death after acute or chronic exposure to higher concentrations of CO [20].
Carbon monoxide combines with hemoglobin to produce carboxyhemoglobin (COHb). About 80%–90% of carbon monoxide in the human body is reversibly bound to hemoglobin. CO has over 200 times greater affinity for binding to hemoglobin than to oxygen [21]. A small environmental concentration will thus cause toxic levels of COHb [19]. Different people may have different carbon monoxide tolerance levels [20]. Exposures of CO at 100 ppm or higher is assumed to be hazardous to human health [22].
The principle of operation of the electrochemical sensor for carbon monoxide is based on the measurement of potential change on the working and the counter electrode, where the oxidation and reduction processes take place simultaneously [2,23]. Gases are oxidized by striking the surface of the working electrode [24]:
CO + H2O → CO2 + 2 H+ + 2 e-.
In the case of oxidation of the substance on the working electrode, there is oxygen (O2) reduction on the counter electrode (cathode) according to the equation:
O2 + 4 H+ + 4 e- → 2 H2O.
Reactions on the electrodes cause the flow current to flow. The intensity of this current is a function of the number of reduced/oxidized molecules. The dependence in a given range of concentrations is linear [10].
The use of electrochemical sensors is limited by the fact that the measurement value may be affected by other substances present in the analyzed air [25]. This gas interference is called the crossing effect. This effect is based on the measurement of the reduction/oxidation potential of undesirable substances and distorts the measurement results of the test substance. Interference can be positive or negative. In the case of positive interference, the readings are higher than the actual values, while in the case of negative interference, the results are underestimated [26].
Some electrochemical CO sensors are susceptible to the presence of hydrogen in the atmosphere. In order to minimize the H2 influence in such sensors, an additional electrode is installed—a compensating one. During the measurement, all CO and a portion of the H2 oxidize on the working electrode, while the rest of the hydrogen goes to the compensating electrode, where it is oxidized. After the measurement, when the voltages on all electrodes are known, a compensating signal is emitted according to the current on the compensating electrode, by which the measured concentration of CO is corrected [8,27].
Not only interfering substances, but also the conditions under which measurements are carried out may affect the work of the electrochemical sensor. Research conducted by Popoola et al. and Wu et al. indicates that meteorological conditions (temperature and humidity) also have a great influence on measurement [28,29].
This paper presents the results of measurements made with an electrochemical CO sensor. Calibration gases were used in the tests. Particular attention was paid to the behavior of the electrochemical CO sensor in a hydrogen (H2) atmosphere. In order to determine the impact of the use of an additional electrode on the accuracy of measurements, the content of CO was measured with two sensors in samples that contained a mixture of carbon monoxide and hydrogen. One contained a working electrode and counter electrode, and the other also had a third electrode—an electrode compensating for the outflow of hydrogen per measurement. The tests were carried out under the same ambient conditions.
The obtained results were used to:
  • Investigate the effect of selected substances on the electrochemical CO sensor readings.
  • Determine the kinetics of the oxidation and reduction processes taking place in the electrochemical CO sensor under the influence of 100 ppm CO and 500 ppm H2 for 1 minute at a rate of 1L/min.
  • Determine the influence of H2 content in the analyzed sample according to the indications of electrochemical CO sensors.
The tests were carried out on sensors used in mobile CO measuring instruments commonly used by rescue units.

2. Materials and Methods

2.1. Materials

To measure the influence of gases on the electrochemical CO sensor indications, the following gases were used: 100 ppm CO, 25 ppm H2S, 10 ppm SO2, 25 ppm NH3, 25 ppm NO, 25 ppm NO2, 10 ppm Cl2, 10 ppm HCN, 10 ppm HCl, 500 ppm, 2% vol. H2, and 2.5% vol. methane (CH4). Mixtures of CO and H2 in synthetic air were obtained using gas mixers (LAT, Poland).
Electrochemical CO sensors with a measuring range of 0–999 ppm (Industrial Scientific Corporation, USA) were tested. These were commercial sensors, commonly used by rescue units in Poland. MX4 detectors were utilized with electrochemical CO sensors with different lifetimes. These detectors were made of only two electrodes: a sensing electrode and a counter electrode. In tests with CO and H2 mixtures, an iTX multi-gas detector with two electrochemical CO sensors was used. One of them had an additional electrode compensating the influence of H2 on the measurement of CO.

2.2. Methods

The tests were carried out in three measurement series:
I)
First series: Calibration gases (substances interfering with the measurement) were supplied with intensity of 1 L/min directly from the cylinder to the MX4 multi-gas detector (Industrial Scientific Corporation, USA). The electrochemical CO sensor in the analyzer was new, and never used in rescue operations. Gas was supplied for 2 minutes. The gas introduced through the hydrophobic membrane into the sensor on the surface of the electrodes caused a reaction, which led to a change in current intensity, and the detector showed different concentration values.
II)
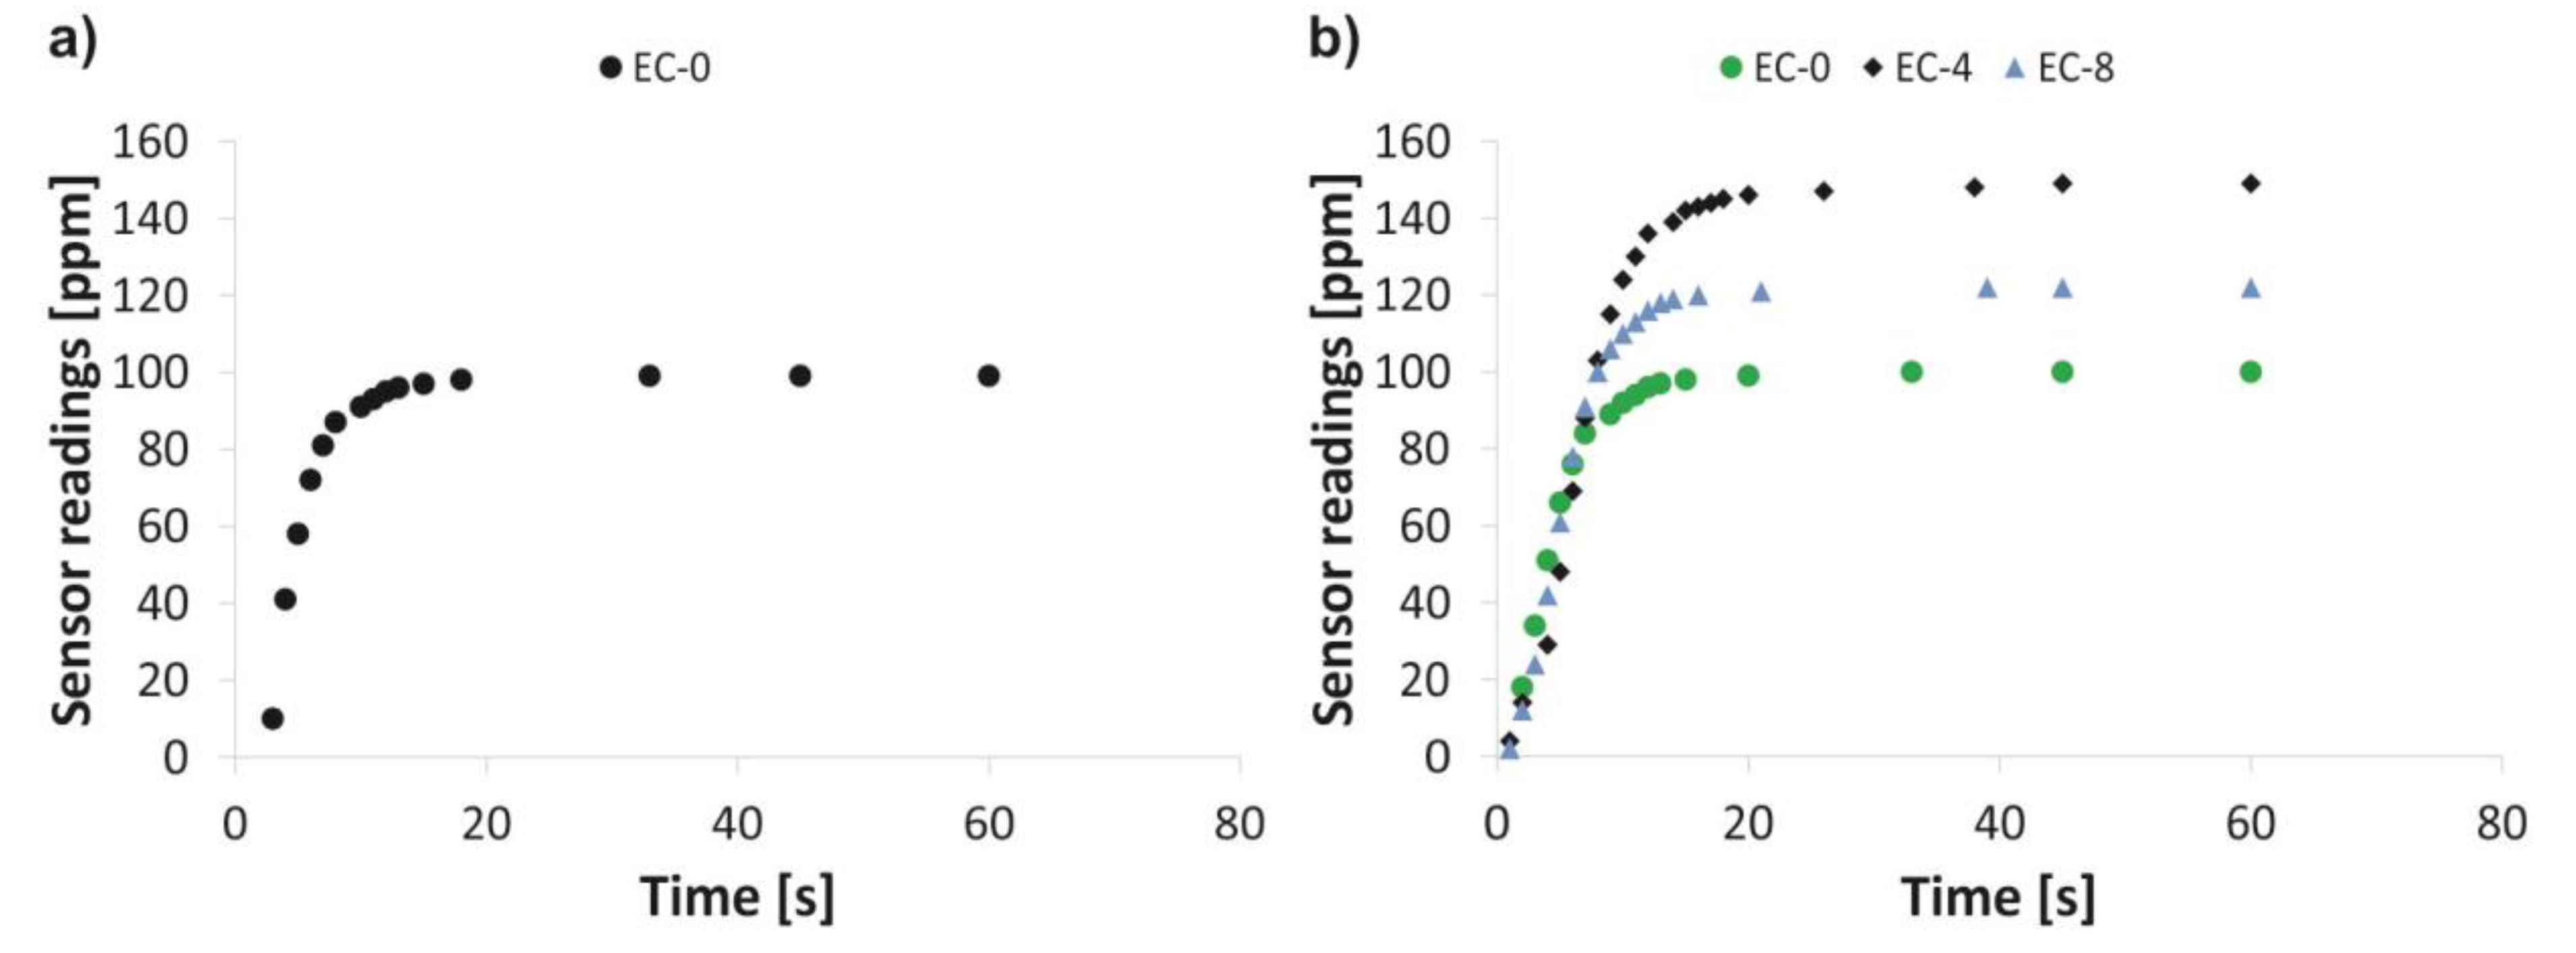
Second series: Calibration gases CO (100 ppm) and H2 (500ppm) were supplied directly from the bottle to three MX4 detectors (Industrial Scientific Corporation, USA). The electrochemical CO sensors installed in the detectors differed in their time of usage. A new sensor and 4 and 8 year old sensors were used in the research. The kinetics of the redox reaction process were determined by recording sensor indications as a function of time.
III)
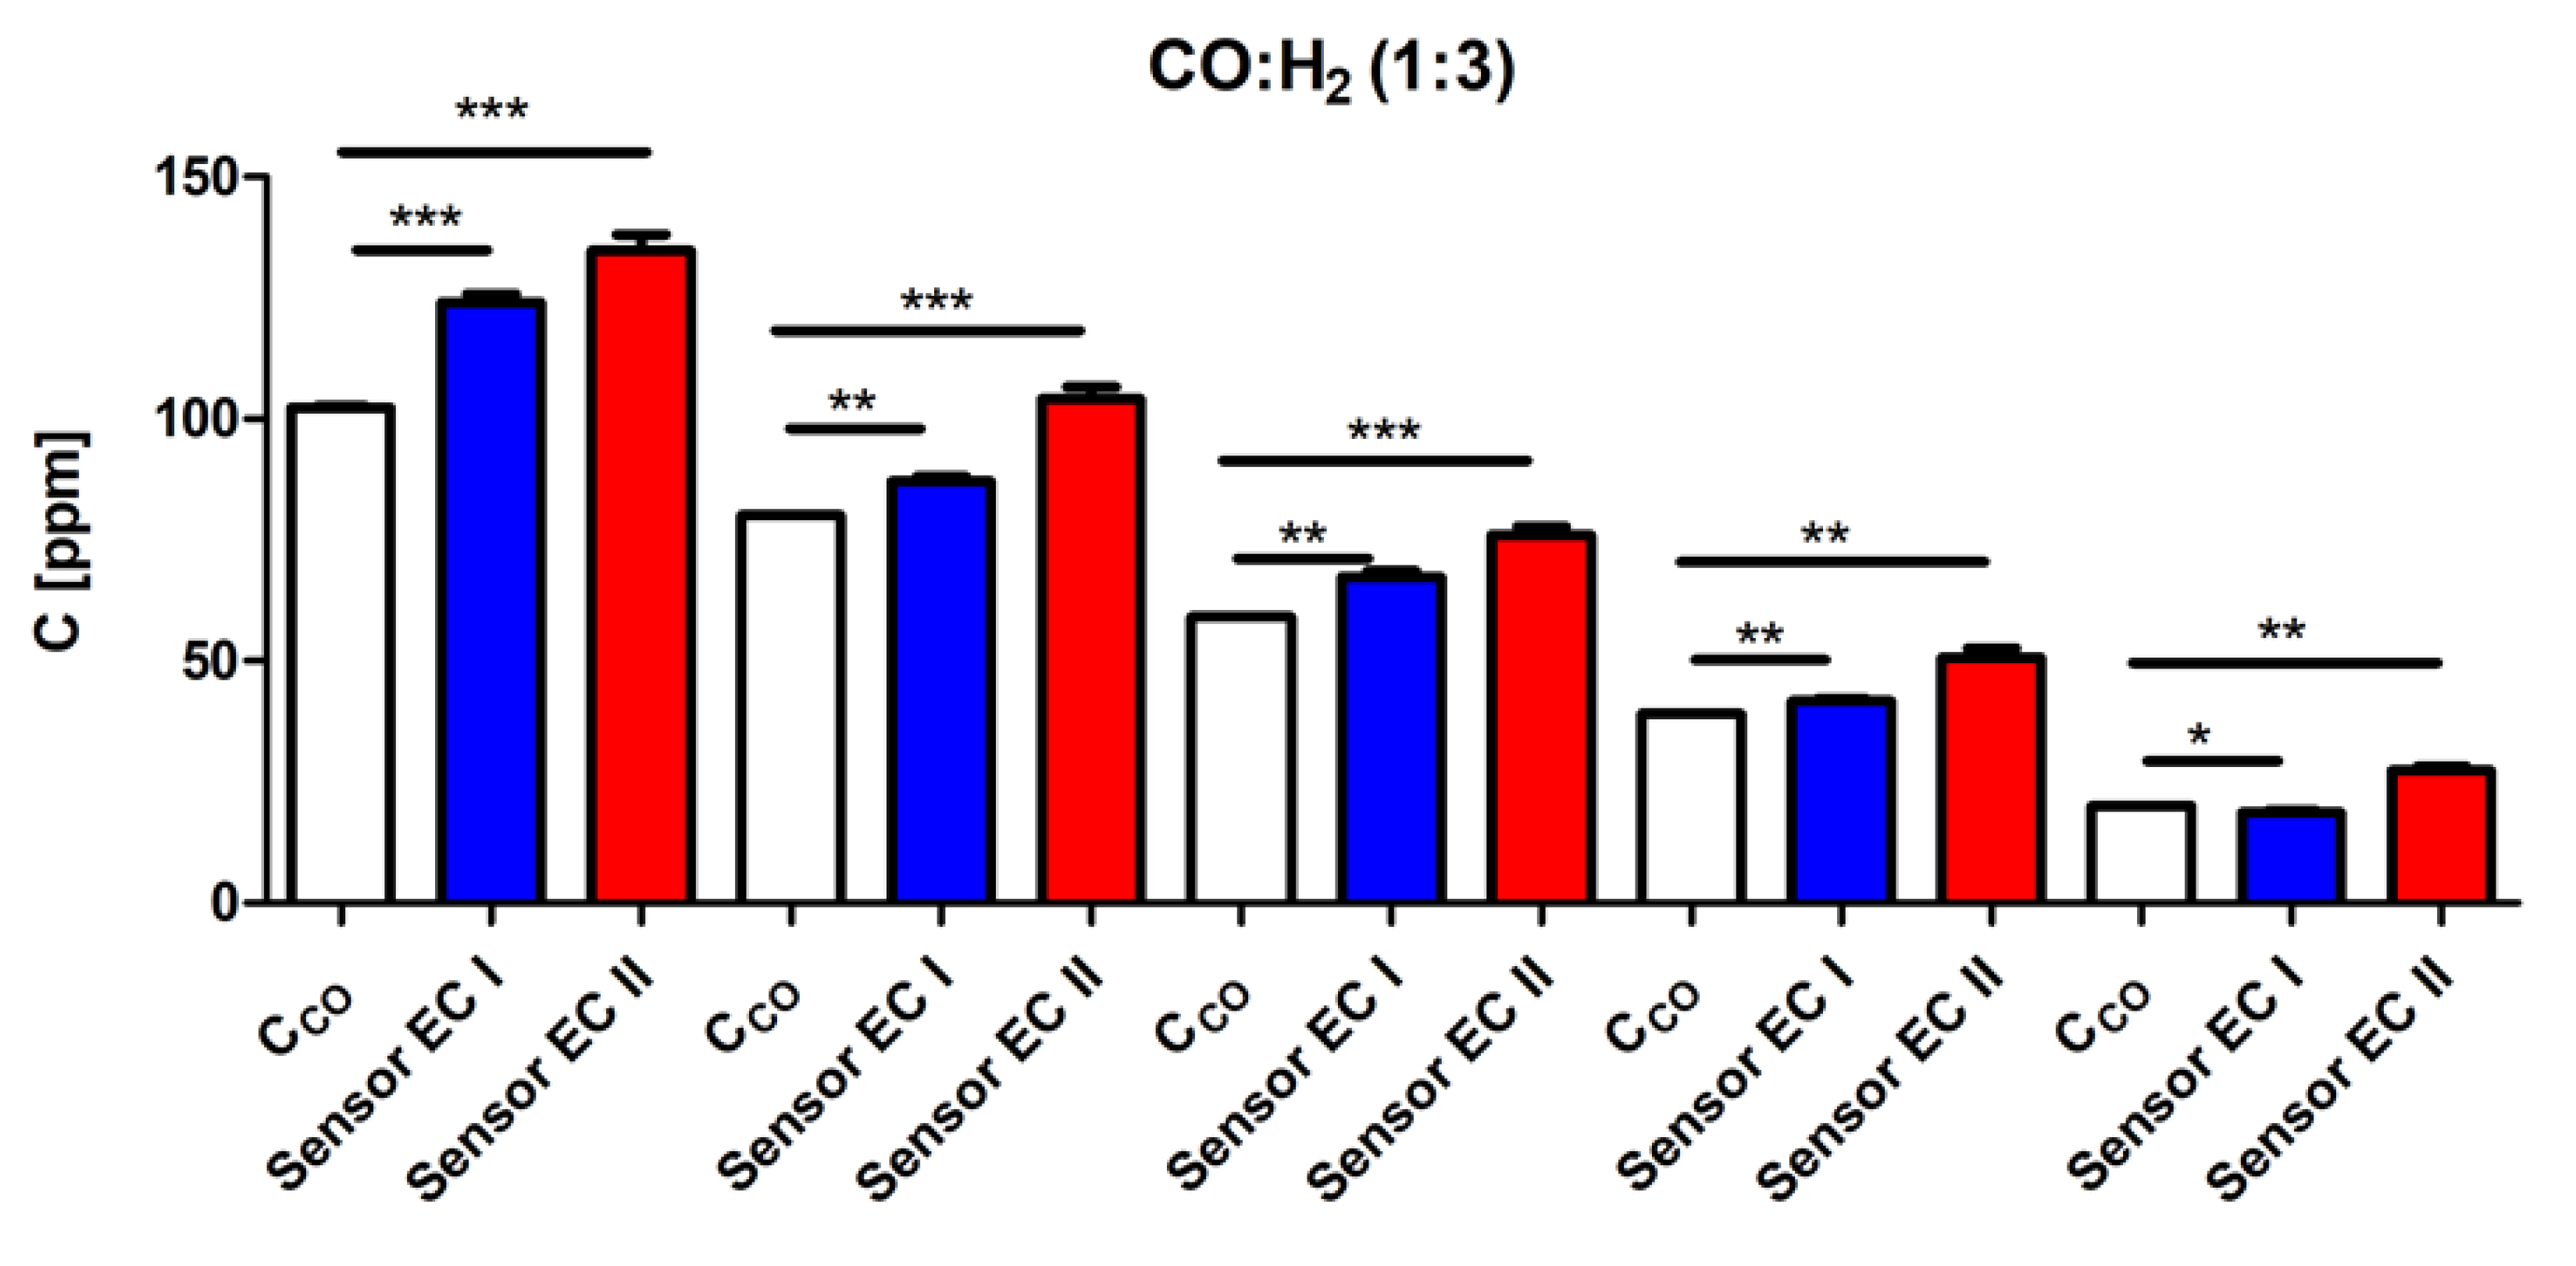
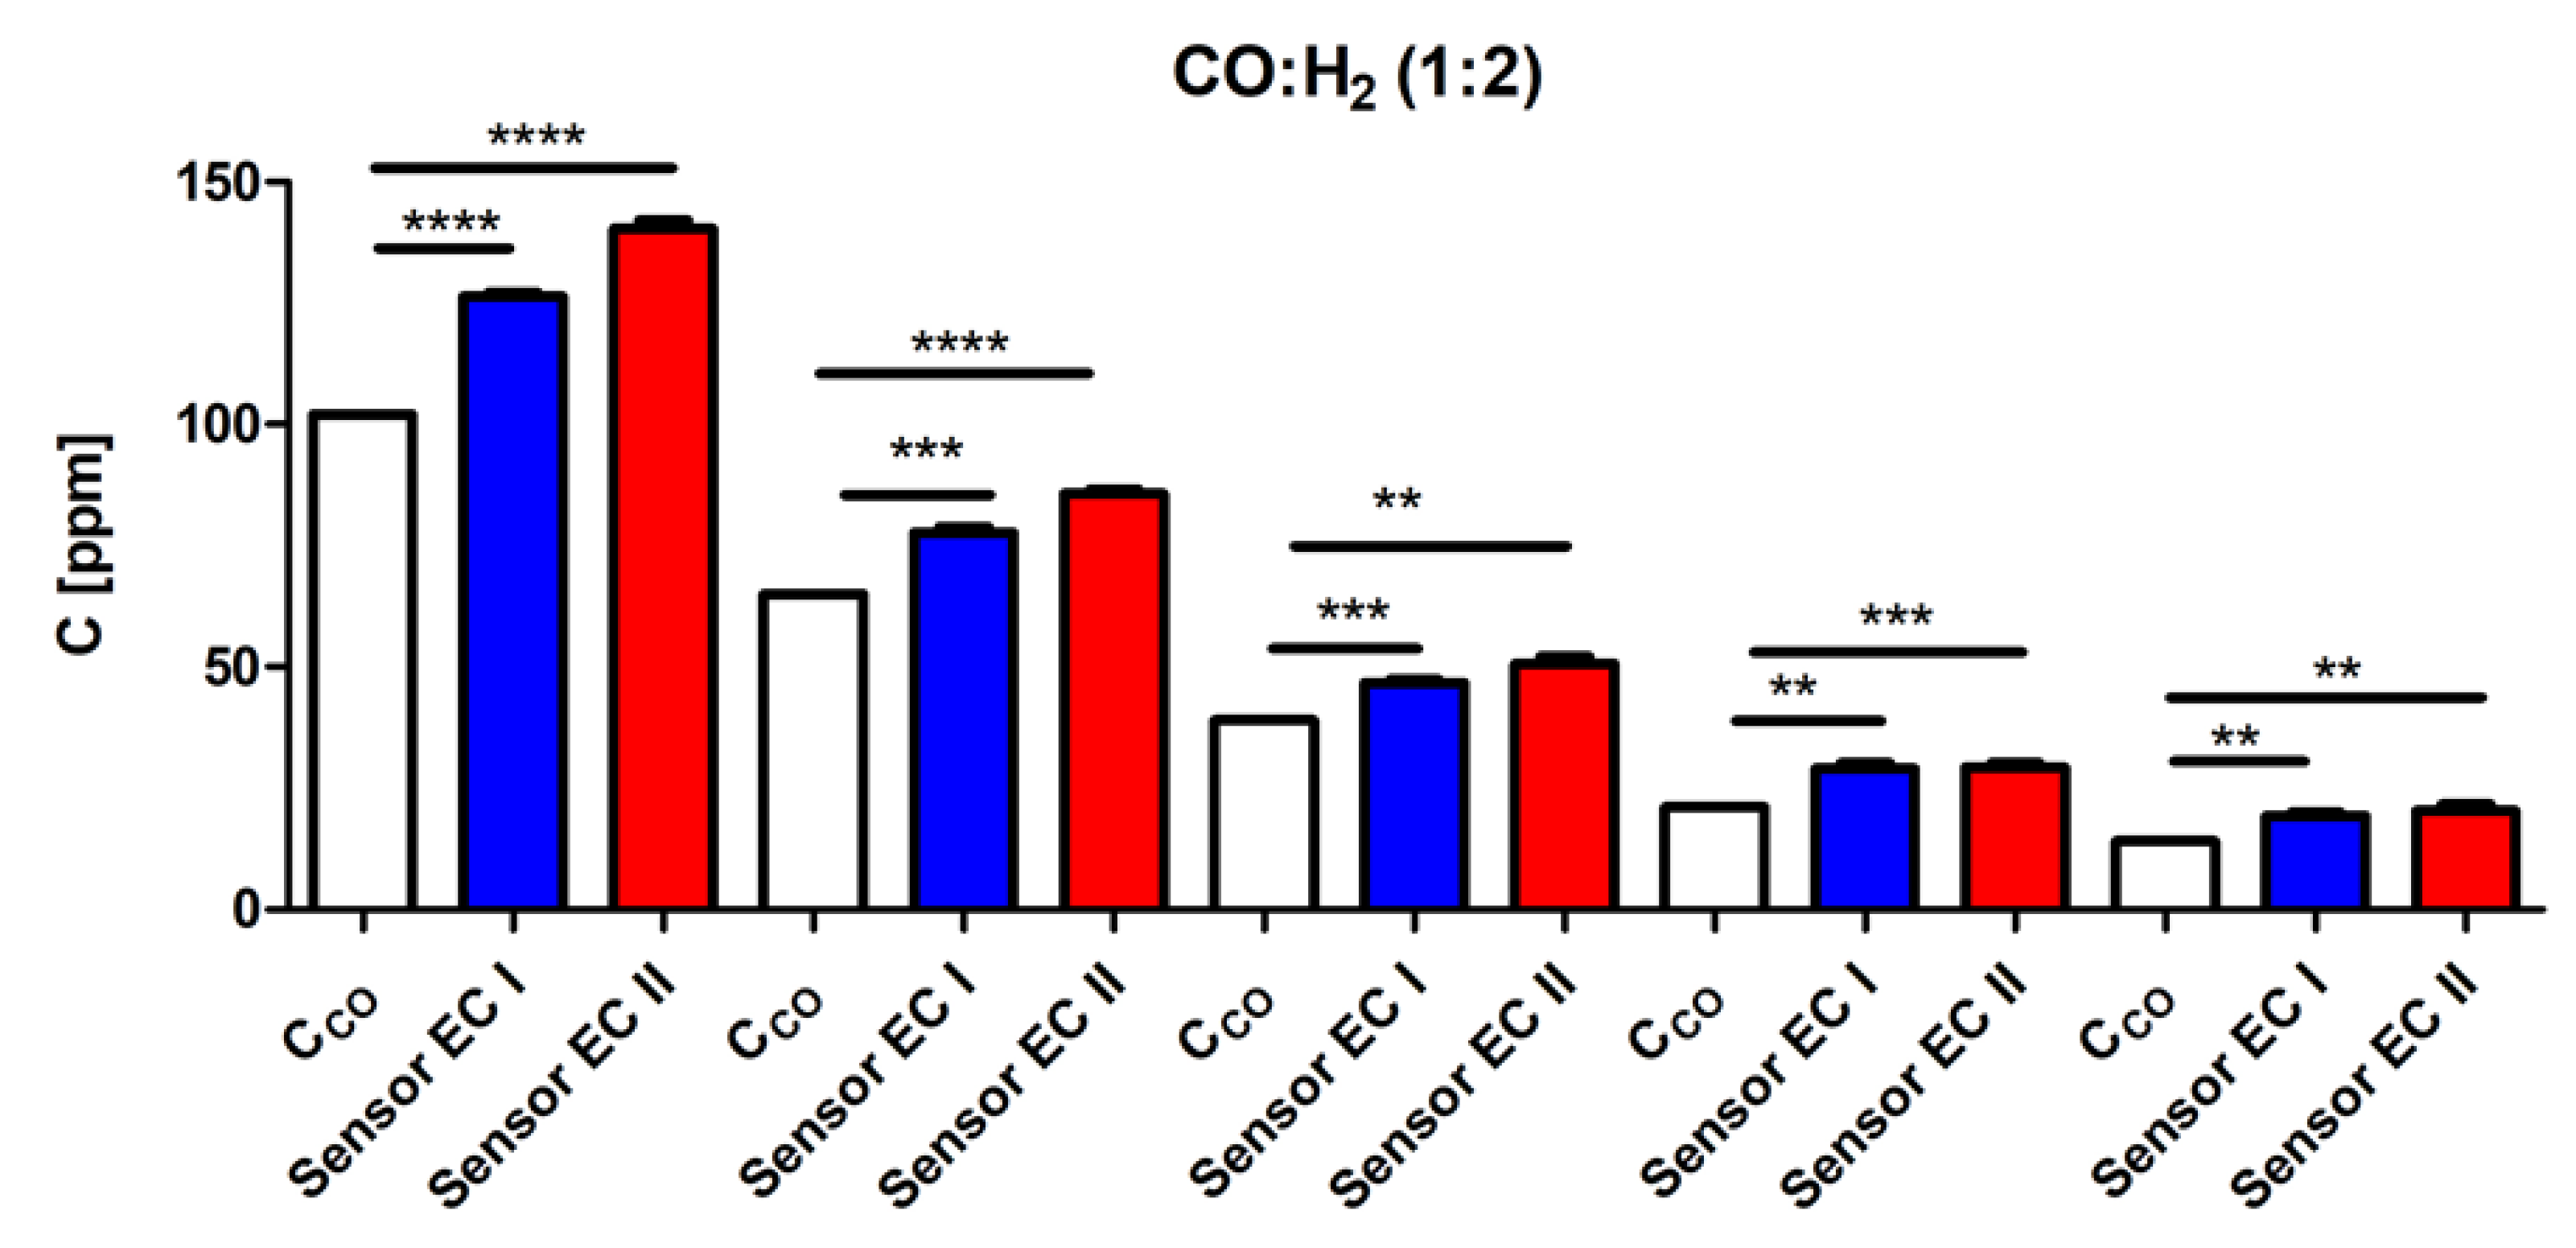
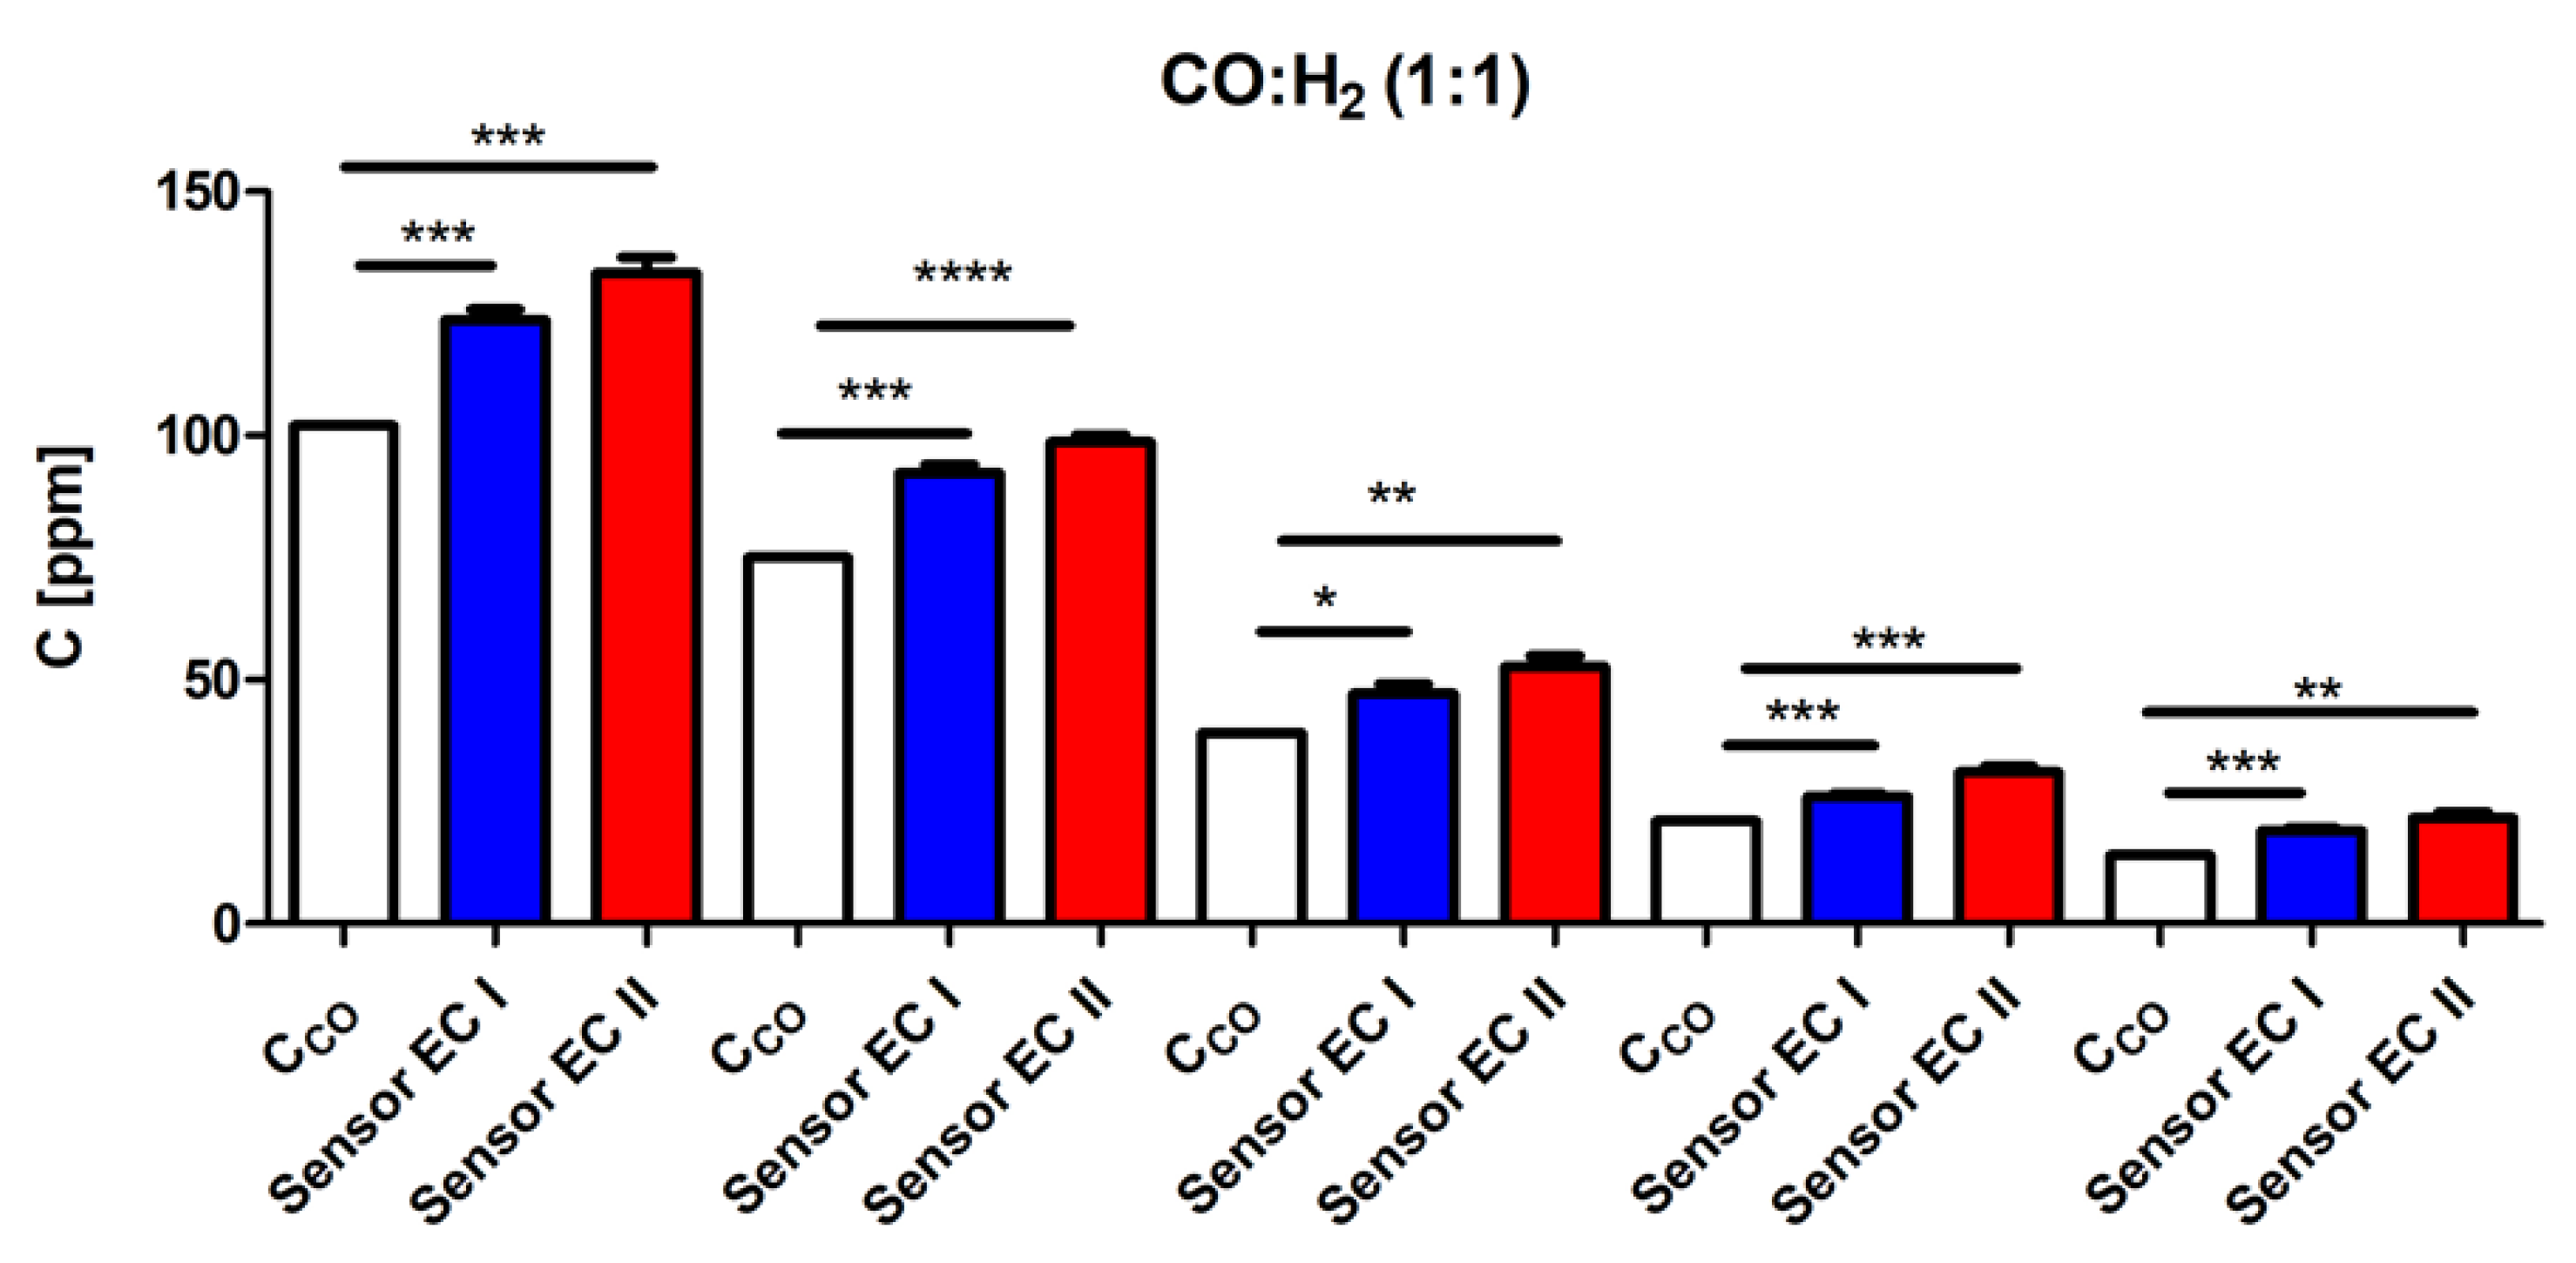
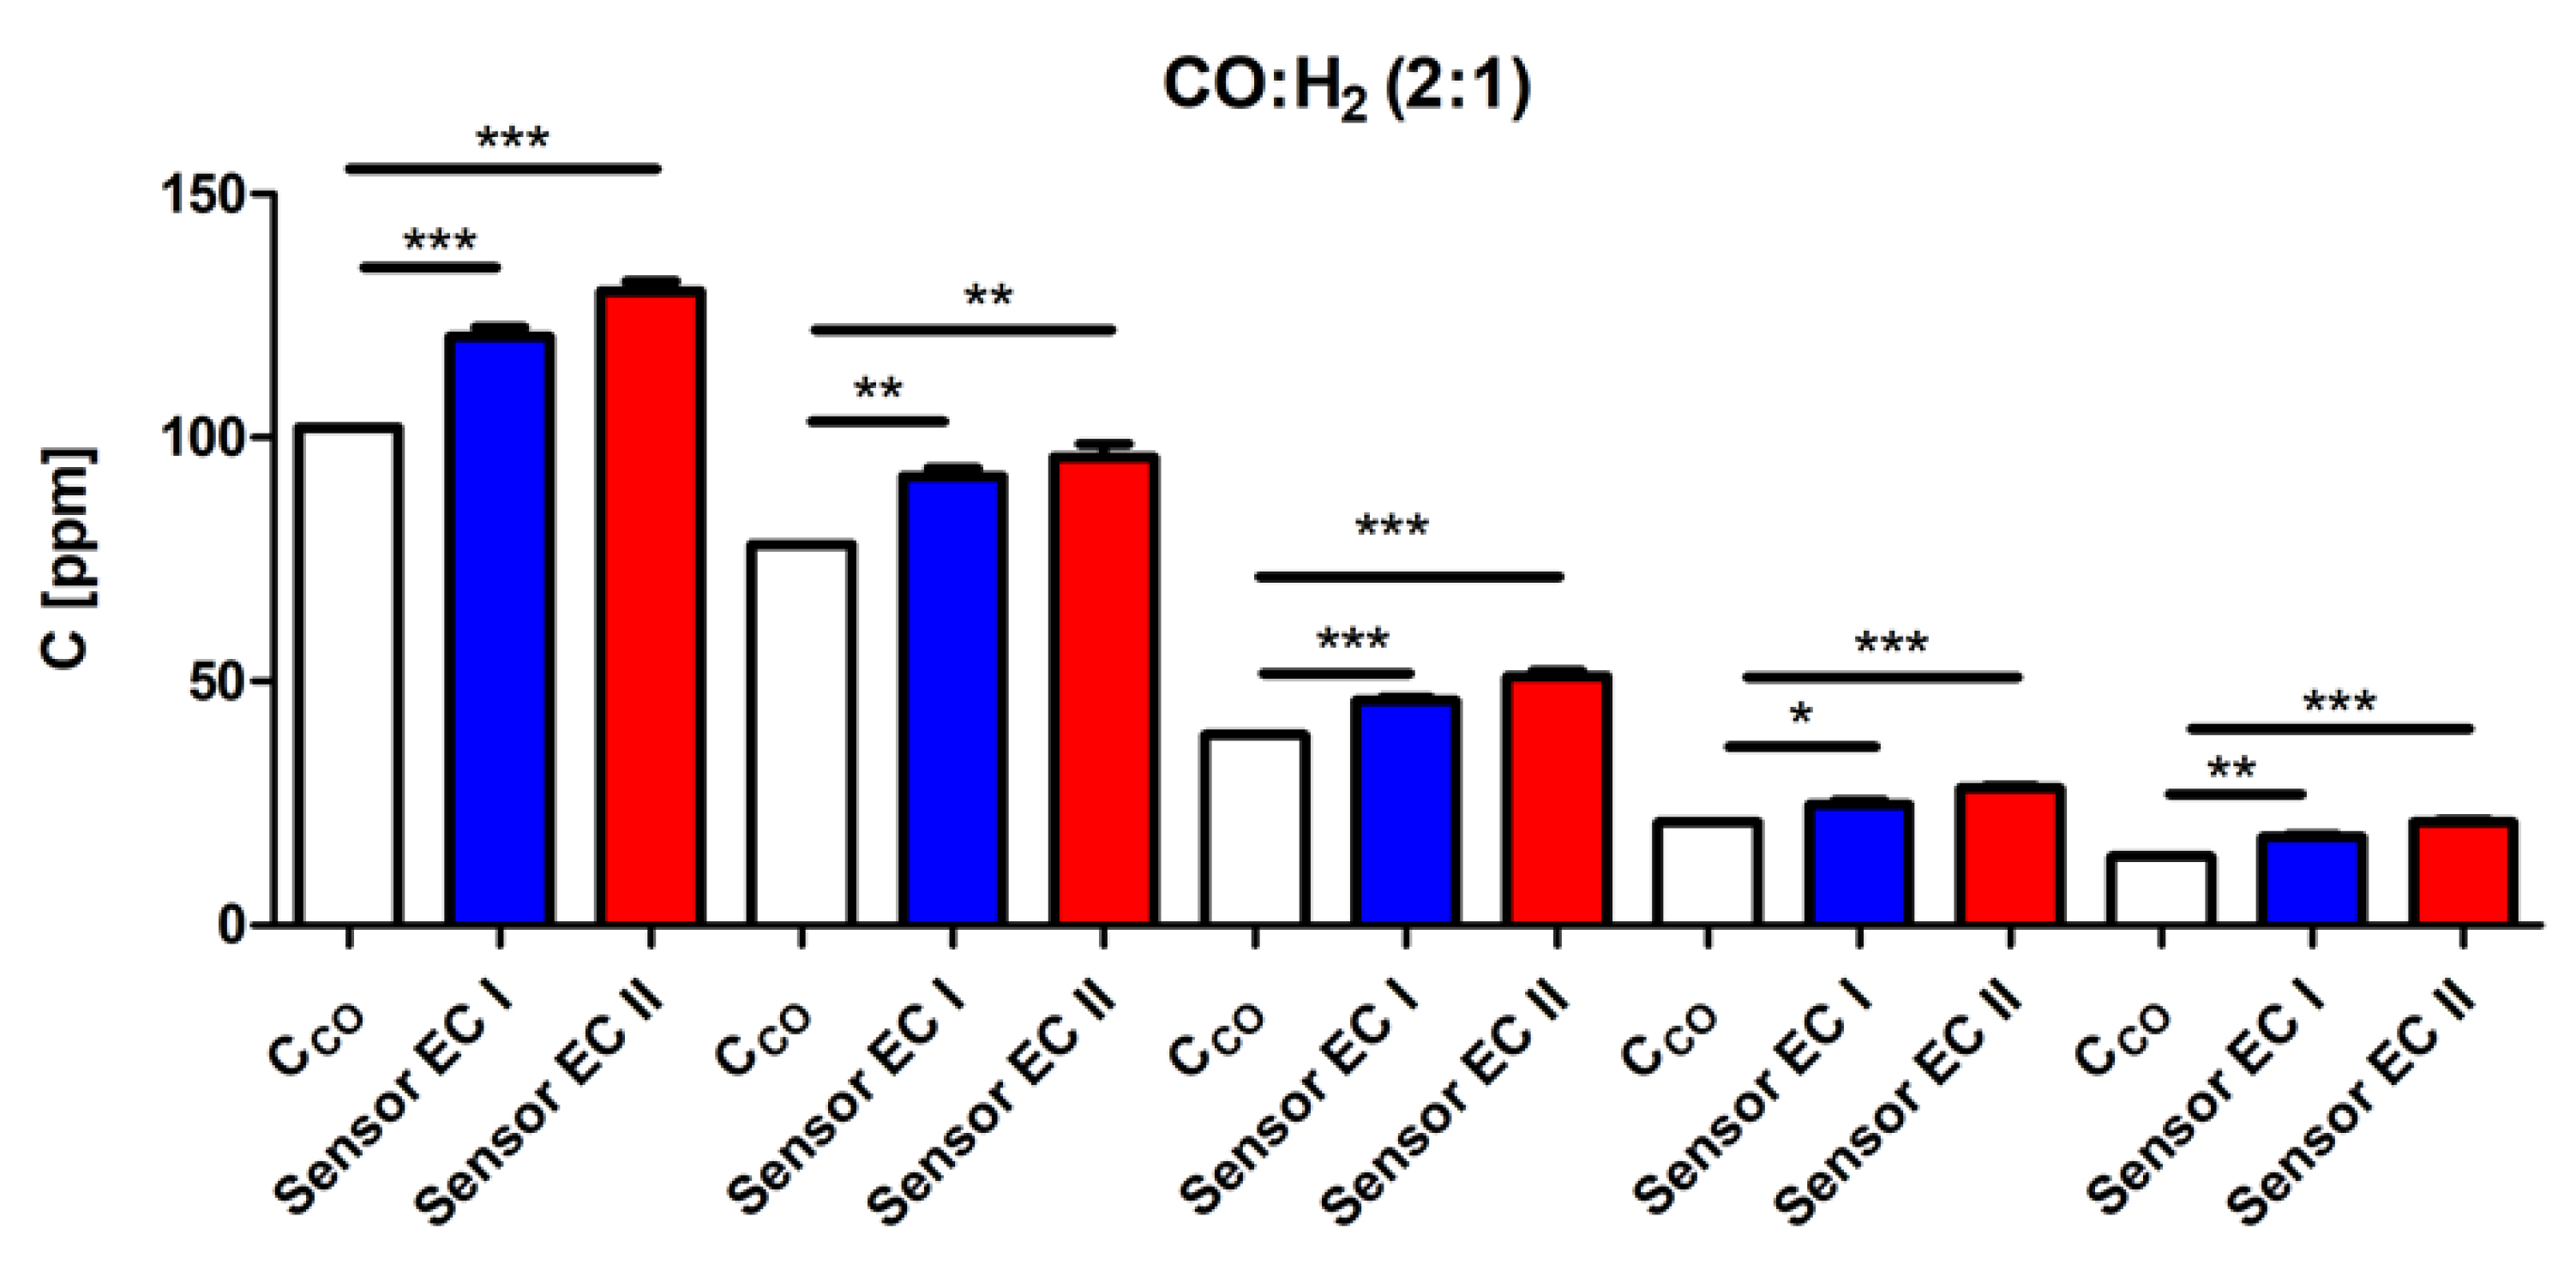
Third series: Mixtures CO and H2 were supplied through the sensors. Samples containing CO and H2 were prepared in a gas mixer in 1:3; 1:2; 1:1; and 2:1 ratios, respectively. They were then introduced into the FTIR spectrophotometer GASMET Dx-4010 (Temet Instruments Oy, Finland) and the iTX multi-gas detector (Industrial Scientific Corporation, USA). Tests for each electrochemical CO sensor were carried out for five CO concentration values. Three measurements were made with each sensor for each concentration value. The results obtained from the GASMET Dx-4010 spectrophotometer were taken as real (expected) values of CO concentration in the analyzed sample, and CCO was determined. The differences between the CCO value and the C concentration value read from the iTX instrument were assumed to be the effect of hydrogen. Two electrochemical CO sensors were tested. One of the sensors had—in addition to the working and counter electrode—a compensating electrode limiting the influence of H2 on the measurement of CO.

2.3. Statistical Analysis

Data are presented as mean ± standard error of the mean (SEM). The relative error of measurement was calculated from the following formula:
δ =   C C C O C C O   100 % ,
where:
C—measurement result with an electrochemical sensor, [ppm]
CCO—expected concentration value (concentration measured by spectrophotometer GASMET Dx-4010), [ppm].
A comparison between groups was performed using a t-Student test after verification of normality was calculated with Statistica 12.0 software. Statistical analysis was also carried out based on the unloaded estimator of variance of result–expected value using the F-Snedecor test. Data were considered statistically different when p < 0.05.

3. Results and Discussion

3.1. Impact of Selected Gases on CO Sensor Readings

The conducted tests of the influence of selected gases on indications of the electrochemical sensor readings show that only two of the tested substances caused positive interference of readings—NO and H2. The test results are shown in Table 1.
The test results indicate that the electrochemical CO sensor does not respond to the presence of CH4 and toxic gases, such as: H2S, SO2, NH3, NO2, Cl2, HCN, or HCl. The obtained results confirm that the electrochemical CO sensor in the presence of H2 may indicate the presence of CO. Wojnowski et al. [24] point to the above disturbance. In [30], it was pointed out that measurement in an atmosphere containing 100 ppm H2 may cause the CO sensor to be displayed at 40 ppm.

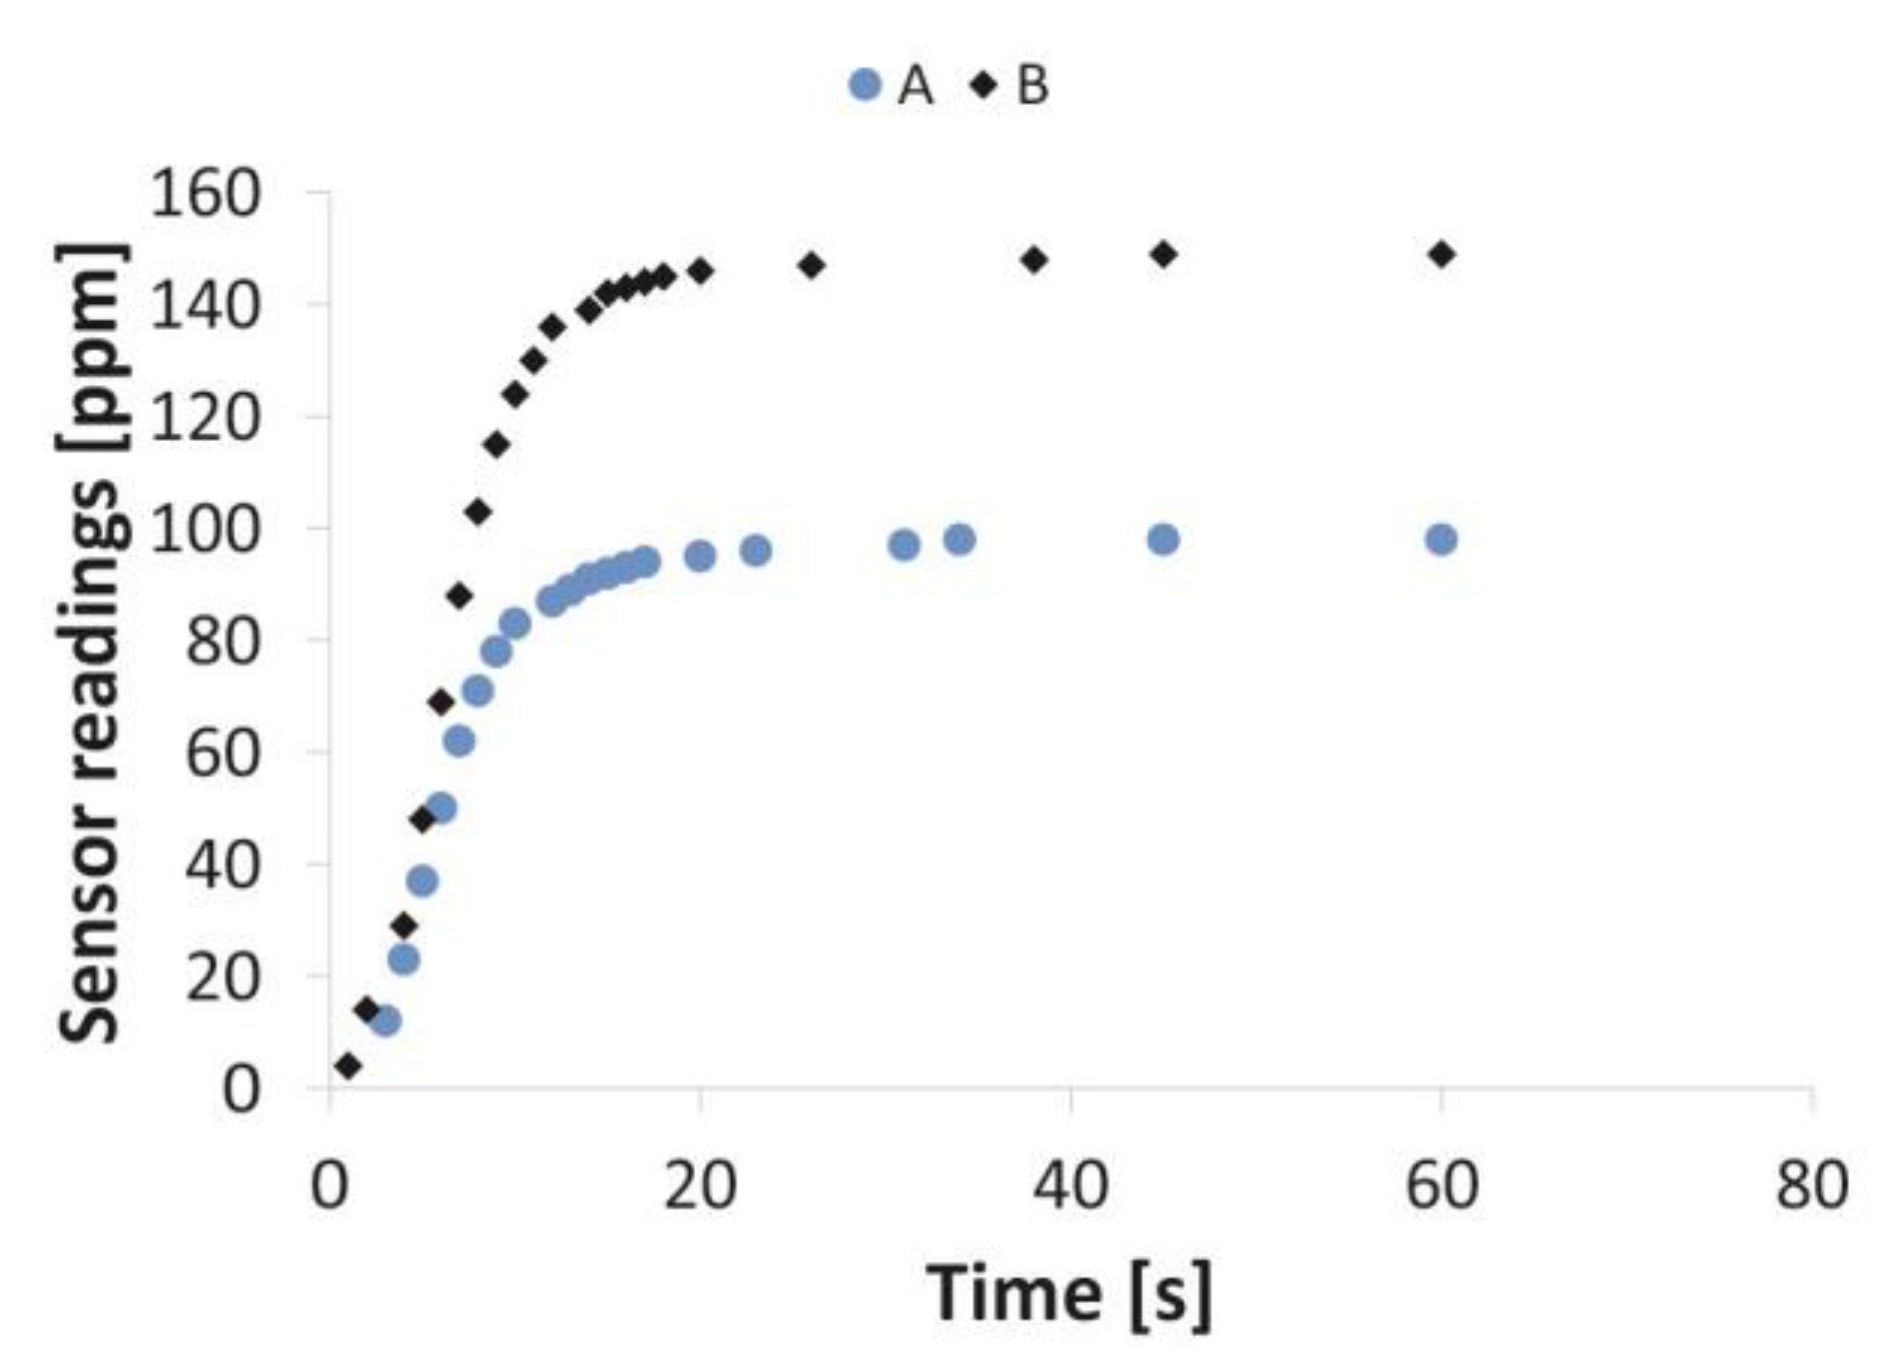
3.2. Impact of Electrochemical CO Sensor Usage Time on Redox Kinetics

The experiments showed that during the sampling of 100 ppm CO, the sensors showed a maximum value at similar times. A steady state was obtained after up to 34 seconds of measurement. The time to reach 50% and 90% of the final value in measurements with a new sensor was 3 seconds shorter than for other sensors (Table 2). The tests were repeated three times for each condition and converging results were received. There was no decrease in sensor efficiency during carbon monoxide measurement. Mead et al. also observed good reproducibility of results and stability of measurements made with an electrochemical CO sensor [10]. The indications of the sensors as a function of time when supplying the calibration gases are presented in Figure 1.
The electrochemical CO sensor response time was shorter than its characteristics describe. Similar times were reported in the studies of Yan and Liu, where the time for a response to a step change of CO equaled ca. 3 s [31]. This is due to the way that gas is supplied directly from the cylinder.
The conducted research indicates that the sensors used significantly affected the behavior of the electrochemical CO sensor in relation to hydrogen. Measurements carried out with a 4 year old sensor showed almost 50% higher readings than in the case of a new sensor. No such changes were found for CO measurements (Figure 2).

3.3. The Influence of Hydrogen on the Indications of the Electrochemical CO Sensor

The tests were carried out using two sensors; one of them had an electrode compensating for the influence of hydrogen, and the other did not. The gas samples tested contained CO and H2. Test results for the mixtures are presented in Table 3, Table 4, Table 5 and Table 6.
The conducted tests show that indications of the electrochemical CO sensors are strongly influenced by the presence of H2 in the analyzed mixture. For the sensor with an additional electrode, the relative error in the H2 mixture (at CO:H2 ratios 1:3) for a concentration of <100 ppm CO was less than 15%. In the case of the sensor with an additional electrode, the measurement error ranged from 7% to 38%. Larger errors were obtained in testing the sensors without additional electrodes (from 23% to 55%). The measurement accuracy declared by manufacturers is 15% [32]. The statistical differences for results obtained using an electrochemical CO sensor with and without an additional electrode compared with the expected (real) values are presented in Figure 3, Figure 4, Figure 5 and Figure 6.
The results depicted in Figure 3, Figure 4, Figure 5 and Figure 6 indicated that the readings from both sensors were significantly different compared to the CCO set values for all analyzed ratios of CO:H2. The highest level of significance (p = 0.0001) was obtained in both electrochemical CO sensors with measurements made for the CO:H2 mixture at a ratio of 1:2 when the CO concentration was 102 ppm. Interestingly, the readings from sensor I and sensor II were closest to the lowest values of the set CO concentrations of 39 ppm and 20 ppm for all analyzed ratios of CO:H2. Therefore, the results showed that both sensors seemed to be the most accurate for the lowest concentrations of CO. Nevertheless, the readings from sensor EC I were closer to the expected value set in the system. The results showed that both sensors seemed to be the most accurate for the lowest concentrations of CO.
In order to compare the values obtained during measurements of electrochemical CO sensors (with different structures), the F-Snedecor test was performed. It was found that the results obtained with a sensor furnished with an additional electrode are more accurate than those obtained with a sensor without a compensating electrode. The higher the content of H2 in relation to CO in the tested mixture, the higher the significance level obtained. The highest level of significance (p = 0.01) was obtained with measurements made in the CO:H2 mixture at a ratio of 1:3. In the cases of tests in a mixture in which the ratio of CO to H2 was 1:2 or 1:1, differences were found with a probability of 94% and 89%, respectively.

4. Conclusions

In rescue operations, mobile detectors with electrochemical sensors are used to determine the content of CO in the air. Measurements performed with the use of those devices do not require any specialist knowledge—the operation is intuitive—yet one should treat the results obtained with some reserve. The values of electrochemical CO sensor indications may be affected by the presence of other substances in the analyzed samples.
This work examined electrochemical CO sensors used by rescue units. The conducted research indicates that the presence of chlorine, ammonia, hydrogen sulfide, hydrogen chloride, hydrogen cyanide, nitrogen (IV) oxide, and sulfur (IV) oxide in the atmosphere does not affect the functioning of the electrochemical CO sensor. In the case of this sensor, there was a significant cross effect in relation to hydrogen. The administration of this substance with a concentration of 2% vol. and 500 ppm indicated the presence of CO at a concentration outside the measuring range (> 999 ppm) and at 100 ppm, respectively.
The lifetime of the electrochemical CO sensor affects the sensor’s indications. When supplying 500 ppm H2 for an EC sensor which was 4 years old, the reading was half as high as for the new sensor. There were no such changes when supplying CO. The time taken to measure steady-states when carbon monoxide is administered does not increase with the electrochemical CO sensor age. Measurements of carbon monoxide concentration in the CO:H2 mixture indicate that, regardless of the proportions of both substances, the measurements are subject to a large error. All measurement results for mixtures containing H2 were statistically significantly different from the expected values (p < 0.05). The relative measurement error in the analyzed concentration range for the EC I sensor ranged from 7% to 38%; in the case of the EC II sensor, it ranged from 23% to 55%.
It was found that the use of an additional electrode in the sensors limits the influence of hydrogen on the measurement. In the cases of measurements carried out at higher concentrations of hydrogen in relation to carbon monoxide, a sensor equipped with a compensation electrode is much better (more accurate) than a sensor without an additional electrode.

Author Contributions

Conceptualization, M.M.-Ł.; Data curation, M.M.-Ł., T.W., A.D. and Z.S.; Formal analysis, M.M.-Ł., T.W., A.D. and A.P.; Investigation, A.D. and A.P.; Methodology, M.M.-Ł. and T.W.; Supervision, M.M.-Ł.; Validation, T.W.; Visualization, Z.S. and A.P.; Writing–original draft, M.M.-Ł.; Writing–review & editing, Z.S. and A.P. All authors have read and agreed to the published version of the manuscript.

Funding

This research was funded by the Ministry of Science and Higher Education, Poland.

Conflicts of Interest

The authors declare no conflict of interest.

References

  1. Wilson, A.D. Review of Electronic-nose Technologies and Algorithms to Detect Hazardous Chemicals in the Environment. Procedia Technol. 2012, 1, 453–463. [Google Scholar] [CrossRef] [Green Version]
  2. Bakker, E.; Telting-Diaz, M. Electrochemical Sensors. Anal. Chem. 2002, 74, 2781–2800. [Google Scholar] [CrossRef] [PubMed]
  3. Majder-Łopatka, M.; Rogula-Kozłowska, W.; Wąsik, W. The application of stand-off infrared detection to identify air pollutants. In Proceedings of the Application of Stand-Off Infrared Detection to Identify Air Pollutants, E3S Web of Conferences, Polanica Zdroj, Poland, 3 July 2018; p. 00104. [Google Scholar] [CrossRef] [Green Version]
  4. Gebicki, J. Application of electrochemical sensors and sensor matrixes for measurement of odorous chemical compounds. TrAC Trends Anal. Chem. 2016, 77, 1–13. [Google Scholar] [CrossRef]
  5. Hayat, A.; Marty, J.L. Disposable Screen Printed Electrochemical Sensors: Tools for Environmental Monitoring. Sensors 2014, 14, 10432–10453. [Google Scholar] [CrossRef] [Green Version]
  6. Stradiotto, N.R.; Yamanaka, H.; Zanoni, M.B. Electrochemical sensors: A powerful tool in analytical chemistry. J. Braz. Chem. Soc. 2003, 14, 159–173. [Google Scholar] [CrossRef] [Green Version]
  7. Hart, J.P.; Wring, S.A. Recent developments in the design and application of screen-printed electrochemical sensors for biomedical, environmental and industrial analyses. TrAC Trends Anal. Chem. 1997, 16, 89–103. [Google Scholar] [CrossRef]
  8. Anderson, L.G.; Hadden, D.M. Electrochemical Sensors–toxic gases and oxygen. In The Gas Monitoring Handbook; Avocet Pres Inc.: New York, NJ, USA, 1999; ISBN 0-9661072-5-X. [Google Scholar]
  9. Lin, L.; Zhao, P.; Mason, A.J.; Zeng, X. Characterization of the Ionic Liquid/Electrode Interfacial Relaxation Processes Under Potential Polarization for Ionic Liquid Amperometric Gas Sensor Method Development. ACS Sens. 2018, 3, 1126–1134. [Google Scholar] [CrossRef]
  10. Mead, M.I.; Popoola, O.A.M.; Stewart, G.B.; Landshoff, P.; Calleja, M.; Hayes, M.; Baldovi, J.J.; Hodgson, T.; McLeod, M.; Dicks, J.; et al. The use of electrochemical sensors for monitoring urban air quality in low-cost, high-density networks. Atmos. Environ. 2013, 70, 186–203. [Google Scholar] [CrossRef] [Green Version]
  11. Luo, X.; Morrin, A.; Killard, A.J.; Smyth, M.R. Application of Nanoparticles in Electrochemical Sensors and Biosensors. Electrolysis. Int. J. Devoted Fundam. Pract. Asp. Electroanal. 2006, 18, 319–326. [Google Scholar] [CrossRef] [Green Version]
  12. Montserrat, M.; Colilla, D.; Ruiz-Hitzky, E. Chitosan–clay nanocomposites: Application as electrochemical sensors. Appl. Clay Sci. 2005, 28, 199–208. [Google Scholar] [CrossRef]
  13. Xu, J.; Wang, Y.; Hu, S. Nanocomposites of graphene and graphene oxides: Synthesis, molecular functionalization and application in electrochemical sensors and biosensors. A review. Microchim. Acta 2017, 184, 1–44. [Google Scholar] [CrossRef]
  14. Sun, W.; Wang, X.; Wang, Y.; Ju, X.; Xu, L.; Li, G.; Sun, Z. Application of graphene–SnO2 nanocomposite modified electrode for the sensitive electrochemical detection of dopamine. Electrochim. Acta 2013, 87, 317–322. [Google Scholar] [CrossRef]
  15. Mandal, S.; Rakibuddin, M.; Ananthakrishnan, R. Strategic Synthesis of SiO2-Modified Porous Co3O4 Nano-Octahedra Through the Nanocoordination Polymer Route for Enhanced and Selective Sensing of H2 Gas over NOx. ACS Omega 2018, 3, 648–661. [Google Scholar] [CrossRef] [PubMed] [Green Version]
  16. Electrochemical Sensor Market-Growth, Trends, and Forecast (2019–2024). Available online: https://www.mordorintelligence.com/industry-reports/global-electrochemical-sensors-market-industry (accessed on 10 October 2019).
  17. Omaye, S.T. Metabolic modulation of carbon monoxide toxicity. Toxicology 2002, 180, 139–150. [Google Scholar] [CrossRef]
  18. Townsend, C.L.; Maynard, R.L. Effects on health of prolonged exposure to low concentrations of carbon monoxide. Occup. Environ. Med. 2002, 59, 708–711. [Google Scholar] [CrossRef] [PubMed] [Green Version]
  19. Blumenthal, I. Carbon monoxide poisoning. J. R. Soc. Med. 2001, 94, 270–272. [Google Scholar] [CrossRef]
  20. Rauba, J.A.; Mathieu-Nolfb, M.; .Hampsonc, N.B.; Thomd, S.R. Carbon monoxide poisoning—A public health perspective. Toxicology 2000, 145, 1–14. [Google Scholar] [CrossRef]
  21. Bateman, D.N. Carbon Monoxide. Medicine 2003, 31, 233. [Google Scholar] [CrossRef]
  22. Prockop, L.D.; Chichkova, R.I. Carbon monoxide intoxication: An updated review. J. Neurol. Sci. 2007, 262, 122–130. [Google Scholar] [CrossRef]
  23. Bay, H.W.; Blurton, K.F.; Sedlak, J.M.; Valentine, A.M. Electrochemical technique for the measurement of carbon monoxide. Anal. Chem. 1974, 46, 1837–1839. [Google Scholar] [CrossRef] [PubMed]
  24. Wojnowski, W.; Majchrzak, T.; Dymerski, T.; Gębicki, J.; Namieśnik, J. Portable Electronic Nose Based on Electrochemical Sensors for Food Quality Assessment. Sensors 2017, 17, 2715. [Google Scholar] [CrossRef] [PubMed] [Green Version]
  25. Majder-Łopatka, M. Effects of interfering gases in electrochemical sensors NH3 and NO2. In Proceedings of the Effects of Interfering Gases in Electrochemical Sensors NH3 and NO2, MATEC Web of Conferences, Warsaw, Poland, 10 December 2018; p. 00023. [Google Scholar] [CrossRef] [Green Version]
  26. Austin, C.; Roberge, B.; Goyer, N. Cross-sensitivities of electrochemical detectors used to monitor worker exposures to airborne contaminants: False positive responses in the absence of target analytes. J. Environ. Monit. 2006, 8, 161–166. [Google Scholar] [CrossRef]
  27. Gębicki, J.; Dymerski, T. Chapter 11–Application of Chemical Sensors and Sensor Matrixes to Air Quality Evaluation. Compr. Anal. Chem. 2016, 267–294. [Google Scholar] [CrossRef]
  28. Wu, N.; Zhao, M.; Zheng, J.; Jiang, C.; Myers, B.; Li, S.; Chyu, M.; Mao, S.X. Porous CuO–ZnO nanocomposite for sensing electrode of high-temperature CO solid-state electrochemical sensor. Nanotechnology 2005, 16, 2878. [Google Scholar] [CrossRef]
  29. Popoola, O.A.M.; Stewart, G.B.; Mead, M.I.; Jones, R.L. Development of a baseline-temperature correction methodology for electrochemical sensors and its implications for long-term stability. Atmos. Environ. 2016, 147, 330–343. [Google Scholar] [CrossRef] [Green Version]
  30. Technical Note TN-114 03/18/VK Senor Specifications and Cross Sensitivities, RAE Systems by Honeywell 877-723-2878. Available online: https://www.scribd.com/document/427040456/Technical-Note-114-Updated-03-26-2018 (accessed on 5 December 2019).
  31. Yan, H.; Liu, C. A solid polymer electrolyte-bases electrochemical carbon monoxide sensor. Sens. Actuators B Chem. 1994, 17, 165–168. [Google Scholar] [CrossRef]
  32. iTX Product Manual, Industrial Scientific, 1st ed.; Delta Service: Zielonka, Poland, 2005.
Figure 1. Electrochemical CO sensor readings as a function of time when supplying: a) 100 ppm CO or b) 500 ppm H2.
Sustainability 12 00014 g001
Figure 2. Electrochemical CO sensor EC-4 readings as a function of time when supplying A) 100 ppm CO and B) 500 ppm H2.
Sustainability 12 00014 g002
Figure 3. Concentration measured in set conditions (CCO) by sensor I (EC I) and sensor II (EC II) when the CO:H2 relation was 1:3. Data presented as mean ± standard error, n = 5. T-student test. * p < 0.05; ** p < 0.01, *** p < 0.001 vs. CCO.
Sustainability 12 00014 g003
Figure 4. Concentration measured in set conditions (CCO) by sensor I (EC I) and sensor II (EC II) when the CO:H2 relation was 1:2. Data presented as mean ± standard error, n = 5. T-student test. * p < 0.05; ** p < 0.01, *** p < 0.001, **** p < 0.0001 vs. CCO.
Sustainability 12 00014 g004
Figure 5. Concentration measured in set conditions (CCO) by sensor I (EC I) and sensor II (EC II) when the CO:H2 relation was 1:1. Data presented as mean ± standard error, n = 5. T-student test. * p < 0.05; ** p < 0.01, *** p < 0.001, **** p < 0.0001 vs. CCO.
Sustainability 12 00014 g005
Figure 6. Concentration measured in set conditions (CCO) by sensor I (EC I) and sensor II (EC II) when the CO:H2 relation was 2:1. Data presented as mean ± standard error, n = 5. T-student test. * p < 0.05; ** p < 0.01, *** p < 0.001 vs. CCO.
Sustainability 12 00014 g006
Table 1. The interfering gases affecting the electrochemical CO sensor readings.
No.Interfering GasConcentration of Interfering GasDisplay of the Electrochemical CO Sensor
1CO100 ppm100 ppm
2H2S25 ppm0 ppm
3SO210 ppm0 ppm
4NH325 ppm0 ppm
5NO25ppm8 ppm
6NO225 ppm0 ppm
7Cl210 ppm0 ppm
8HCN10 ppm0 ppm
9HCl10 ppm0 ppm
10H22% of volumeout of range
11H2500 ppm100 ppm
12CH42.5% of volume0 ppm
Table 2. Parameters obtained when supplied with 100 ppm CO or 500 ppm H2. EC-0—new sensor, EC-4—4 year old sensor, EC-8—8 year old sensor, C max—maximum concentration, T50—time after which the signal reaches 50% of the maximum concentration value, T90—time after which the signal reaches 90% of the maximum concentration value.
Electrochemical
CO Sensors
Gas supply–100 ppm COGas supply–500 ppm H2
T50 [s]T90 [s]C max
[ppm]
T50 [s]T90 [s]C max
[ppm]
EC-031099 (33 s)410100 (33 s)
EC-461398 (34 s))612149 (26 s)
EC-861399 (34 s)510122 (39 s)
Table 3. Test results for the mixture of CO:H2 in a 1:3 volume ratio.
Sensorwith Compensating Electrode (EC I)without Compensating Electrode (EC II)
Expected Value [ppm]Mean [ppm]Standard ErrorRelative Error
[%]
Mean [ppm]Standard ErrorRelative Error
[%]
1021243.0221355.932
80871.791044.430
59672.114763.029
39420.67513.230
20190.67271.537
Table 4. Test results for the mixture of CO:H2 in a 1:2 volume ratio.
Sensorwith Compensating Electrode (EC I) without Compensating Electrode (EC II)
Expected Value [ppm]Mean [ppm]Standard ErrorRelative Error
[%]
Mean [ppm]Standard ErrorRelative Error
[%]
1021261.5241403.138
65782.119861.532
39471.220512.530
21292.038291.540
14191.238202.345
Table 5. Test results for the mixture of CO:H2 in a 1:1 volume ratio.
Sensorwith Compensating Electrode (EC I)without compensating Electrode (EC ii)
Expected Value [ppm]Mean [ppm]Standard ErrorRelative Error
[%]
Mean [ppm]Standard ErrorRelative Error
[%]
1021253.8231335.731
75923.123992.532
39473.521533.835
21261.024312.048
14191.036222.155
Table 6. Test results for the mixture of CO:H2 in a 2:1 volume ratio.
Sensorwith Compensating Electrode (EC I)without Compensating Electrode (EC II)
Expected Value [ppm]Mean [ppm]Standard ErrorRelative Error
[%]
Mean [ppm]Standard ErrorRelative Error
[%]
1021213.2181303.627
78923.018964.623
39461.018511.731
21251.517281.033
14181.029211.050

