Article

Sustainable Road Maintenance Planning in Developing Countries Based on Pavement Management Systems: Case Study in Baja California, México

by
Marco Montoya-Alcaraz
,
Alejandro Mungaray-Moctezuma
* and
Leonel García
Faculty of Engineering, Universidad Autónoma de Baja California, 21280 Mexicali, Mexico
*
Author to whom correspondence should be addressed.
Submission received: 30 November 2019 / Revised: 13 December 2019 / Accepted: 14 December 2019 / Published: 19 December 2019

Abstract

:
The objective of this research is to develop a useful procedure that allows the collection, analysis, processing and updating of pavement conditions data, with the vision of generating inputs for the implementation of sustainable strategies for maintenance and rehabilitation of roads, based on pavement management systems. The relevance of this proposal lies in the fact that road management agencies in most of the developing countries have limited resources, staff and data to plan the interventions carried out on road networks. The proposed model comes from a work that has been done since 2014 to date, on the Centinela-La Rumorosa Highway, located in the state of Baja California, Mexico. Results integrate data gathered from analyzing the surface and structural conditions of its pavement and the study area, as well as the operating conditions of the road, including a georeferencing process in order to determine critical points in the network, and simulation to determine the effects of maintenance work carried out annually. It is concluded that the proposed planning model contributes to the improvement of highway performance, since it allows planning and administering the allocation of resources in making appropriate maintenance and rehabilitation decisions. Additionally, it allows to generate valuable inputs for pavement management systems implementation. The foregoing allows road management agencies in developing countries to provide a quality transportation system to their users.

1. Introduction

An important number of agencies, companies and organizations have adopted a sustainable approach that focuses on the economic, environmental and social impacts in planning and decision-making [1]; on this matter, pavement management has become increasingly important to the extent that, with the passing of time, roads age and deteriorate. On the one hand, roads have been designed and built for a useful life and it is necessary to take actions to increase their service cycle; on the other hand, funding levels are increasingly limited and better resource management is required in order to attend to a global mobility system that is mostly focused on the use of roads [2]. Pavement Management Systems (PMS), are the set of procedures and tools that are intended to assist road management organizations in the systematic application of processes related to pavement management, particularly the identification of optimal alternatives for network conservation in the short and medium term, as well as the development of maintenance and rehabilitation (M&R) programs, which translate into significant benefits, both technically and economically [3]. However, results reliability of these systems depends on the quality and quantity of data that are provided to it and the calibration of the models to local conditions. In developing countries, road management agencies have limited resources and staff, and for this reason, obtaining such inputs implies a greater effort and challenge. In that case, Mexican administrative agencies have not been able to adopt a pavement management approach. Therefore, road maintenance and rehabilitation works are carried out reactively, and not proactively, once surface and structural failures occur; in general terms, it becomes complex for one-way managers to define a preventive strategy.
As a result of the foregoing, as of the year 2014, a project which seeks to improve planning and decision-making regarding the M&R of a road section began. This project locates in a mountain range of Baja California, Mexico. The objective of this research is to develop a useful procedure that allows the collection, analysis, processing and updating of pavement conditions data, with the vision of generating inputs for the implementation of sustainable strategies for M&R of roads, based on pavement management systems.

2. Background

Road construction consumes a large amount of non-renewable resources [4]. To address this problem, several sustainability assessment programs have been developed, such as the Greenroads program [5], the FHWA’s Infrastructure Voluntary Evaluation Sustainability Tool (INVEST), the Sustainability Programme of the European Union Road Federation (ERF) [6] and the Civil Engineering Environmental Quality (CEEQUAL) [7]. These programs contain strategies and tools to implement sustainability criteria at different stages of the pavement life cycle, that is, material production, design, construction, operating phase, maintenance and end of life [1]. In this regard, several studies have carried out pavement sustainability concepts or road sustainability for contributions that improve economic, road social and environmental aspects. For example, Mao et al. [8] provides a method to improve pavement performance sustainability by a reasonable traffic flow assignment; Corriere and Rizzo [9] provide guidance for a methodological approach of sustainability in road design; Farooq et al. [10], Yang et al. [11] and Demasi et al. [12] analyzed factors that contribute to traffic safety; in environmental sustainability, Montgomery et al. [13] provide a wide range of ideas and options to improve the inclusion of environmental sustainability throughout the road project cycle.
However, the implementation of sustainability in M&R strategies requires greater control because it impacts different parts of the pavement cycle. Pavement management is a discipline that encompasses activities involved in planning, design, construction, evaluation and conservation of the pavements in a road network [14]. Background studies in pavement management and sustainability have examined PMS programs in order to recommend network maintenance treatments based on general conditions of the pavement surface, traffic data, road section, structural conditions and other performance indicators [15]. It is important to mention that this research applies the concept of pavement management of roads, highways and major roads. Nevertheless, few studies have applied pavement management activities on urban areas [16,17] and pavement sidewalks [18], proving its reliability in these areas.
It is worth pointing out that most of the data are gathered through pavement condition studies where information on pavement conditions is collected through automated and specialized means; this data generates a scale or condition index. However, the index used depends directly on the agency’s economic resources and its ability to obtain and interpret such data [19]. Since the model simulates future changes on road systems based on current conditions, the reliability of the results depends on two main aspects according to [20]. The first aspect refers to the “data entry,” with a correct interpretation of the data entry requirements, in order to achieve an appropriate data quality for the desired reliability of the results. The second aspect refers to the “output calibration,” with the adjustment of model parameters to improve forecast, considering changes and influences with the passing of time and under various interventions.
According to Yang et al. [21], different practices in construction processes, traffic diversifications and regional conditions generate potential sources of uncertainty when planning maintenance and rehabilitation interventions. Therefore, the search and update of data becomes a very important aspect to maintain the reliability of PMS. In this regard, several studies have carried out calibrations to the prediction models of HDM-4 to be adapted and utilized in PMS; for example, Bannour et al. [22] adapted structural failure models for conditions in Morocco; Jain et al. [23] calibrated pavement deterioration models for general network conditions in India; and Rodhe et al. [24] suggest a series of calibrations to improve the prediction of performance models in South Africa. Furthermore, Pantuso [25] used this model to integrate studies to assess pavement conditions in the implementation of PMS in Kazakhstan. On the other hand, various studies, such as those conducted by Tsunokawa and Ul-Islam [26], are focused on the definition of optimal M&R strategies; also, Zaabar and Chatti [27] used calibrated systems to predict economic costs of users.
In addition, Geographic Information Systems (GIS) have been a useful tool in pavement management, because it allows the integration of different data, such as inventory of road networks, pavement conditions, and history of interventions, just to mention a few examples; as well as using this information in a PMS [28]. As a matter of fact, GIS have certain similarities with PMS because they have systems for collection, processing and presentation of information. Silva-Balaguera et al. [29] carried out a study that integrates multiple analyses of GIS and PMS, denoting that the combination of both systems allows cost optimization and the definition of prioritization of interventions; as well as, a combination of these systems allows time reduction in processing and updating of future data on road networks, as well as allowing access to historical and zoned road information.

3. Materials and Methods
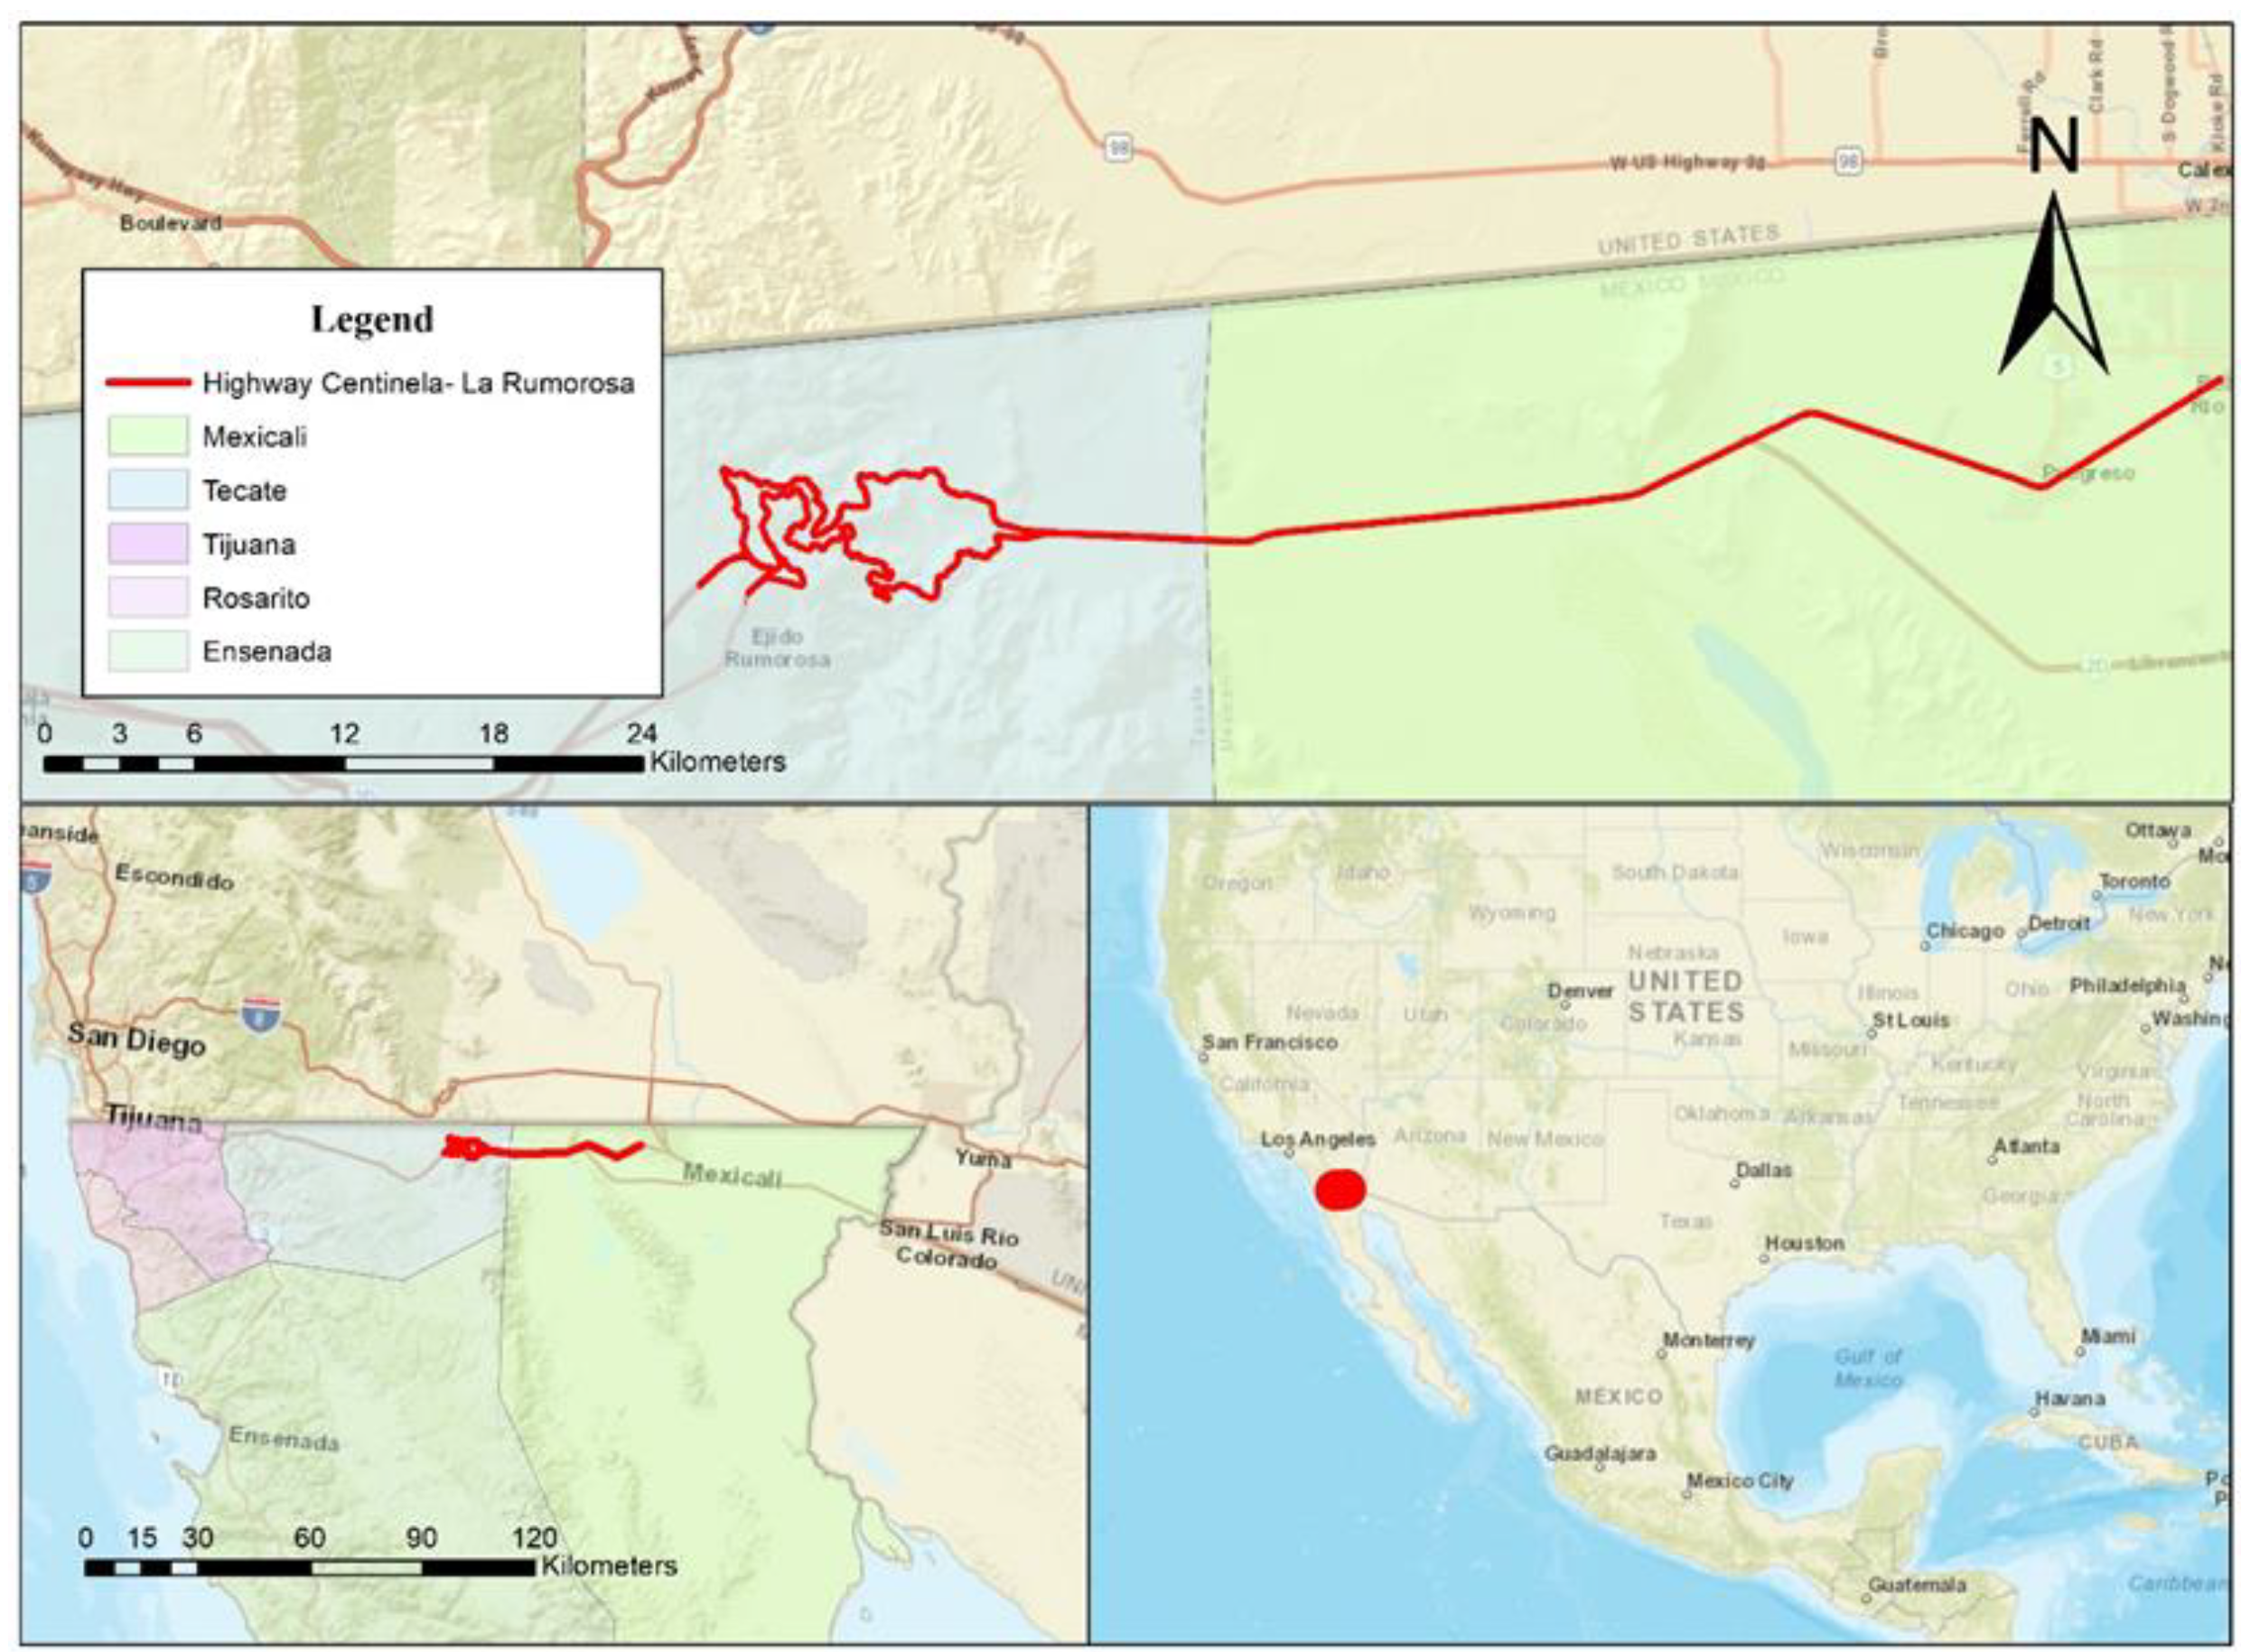
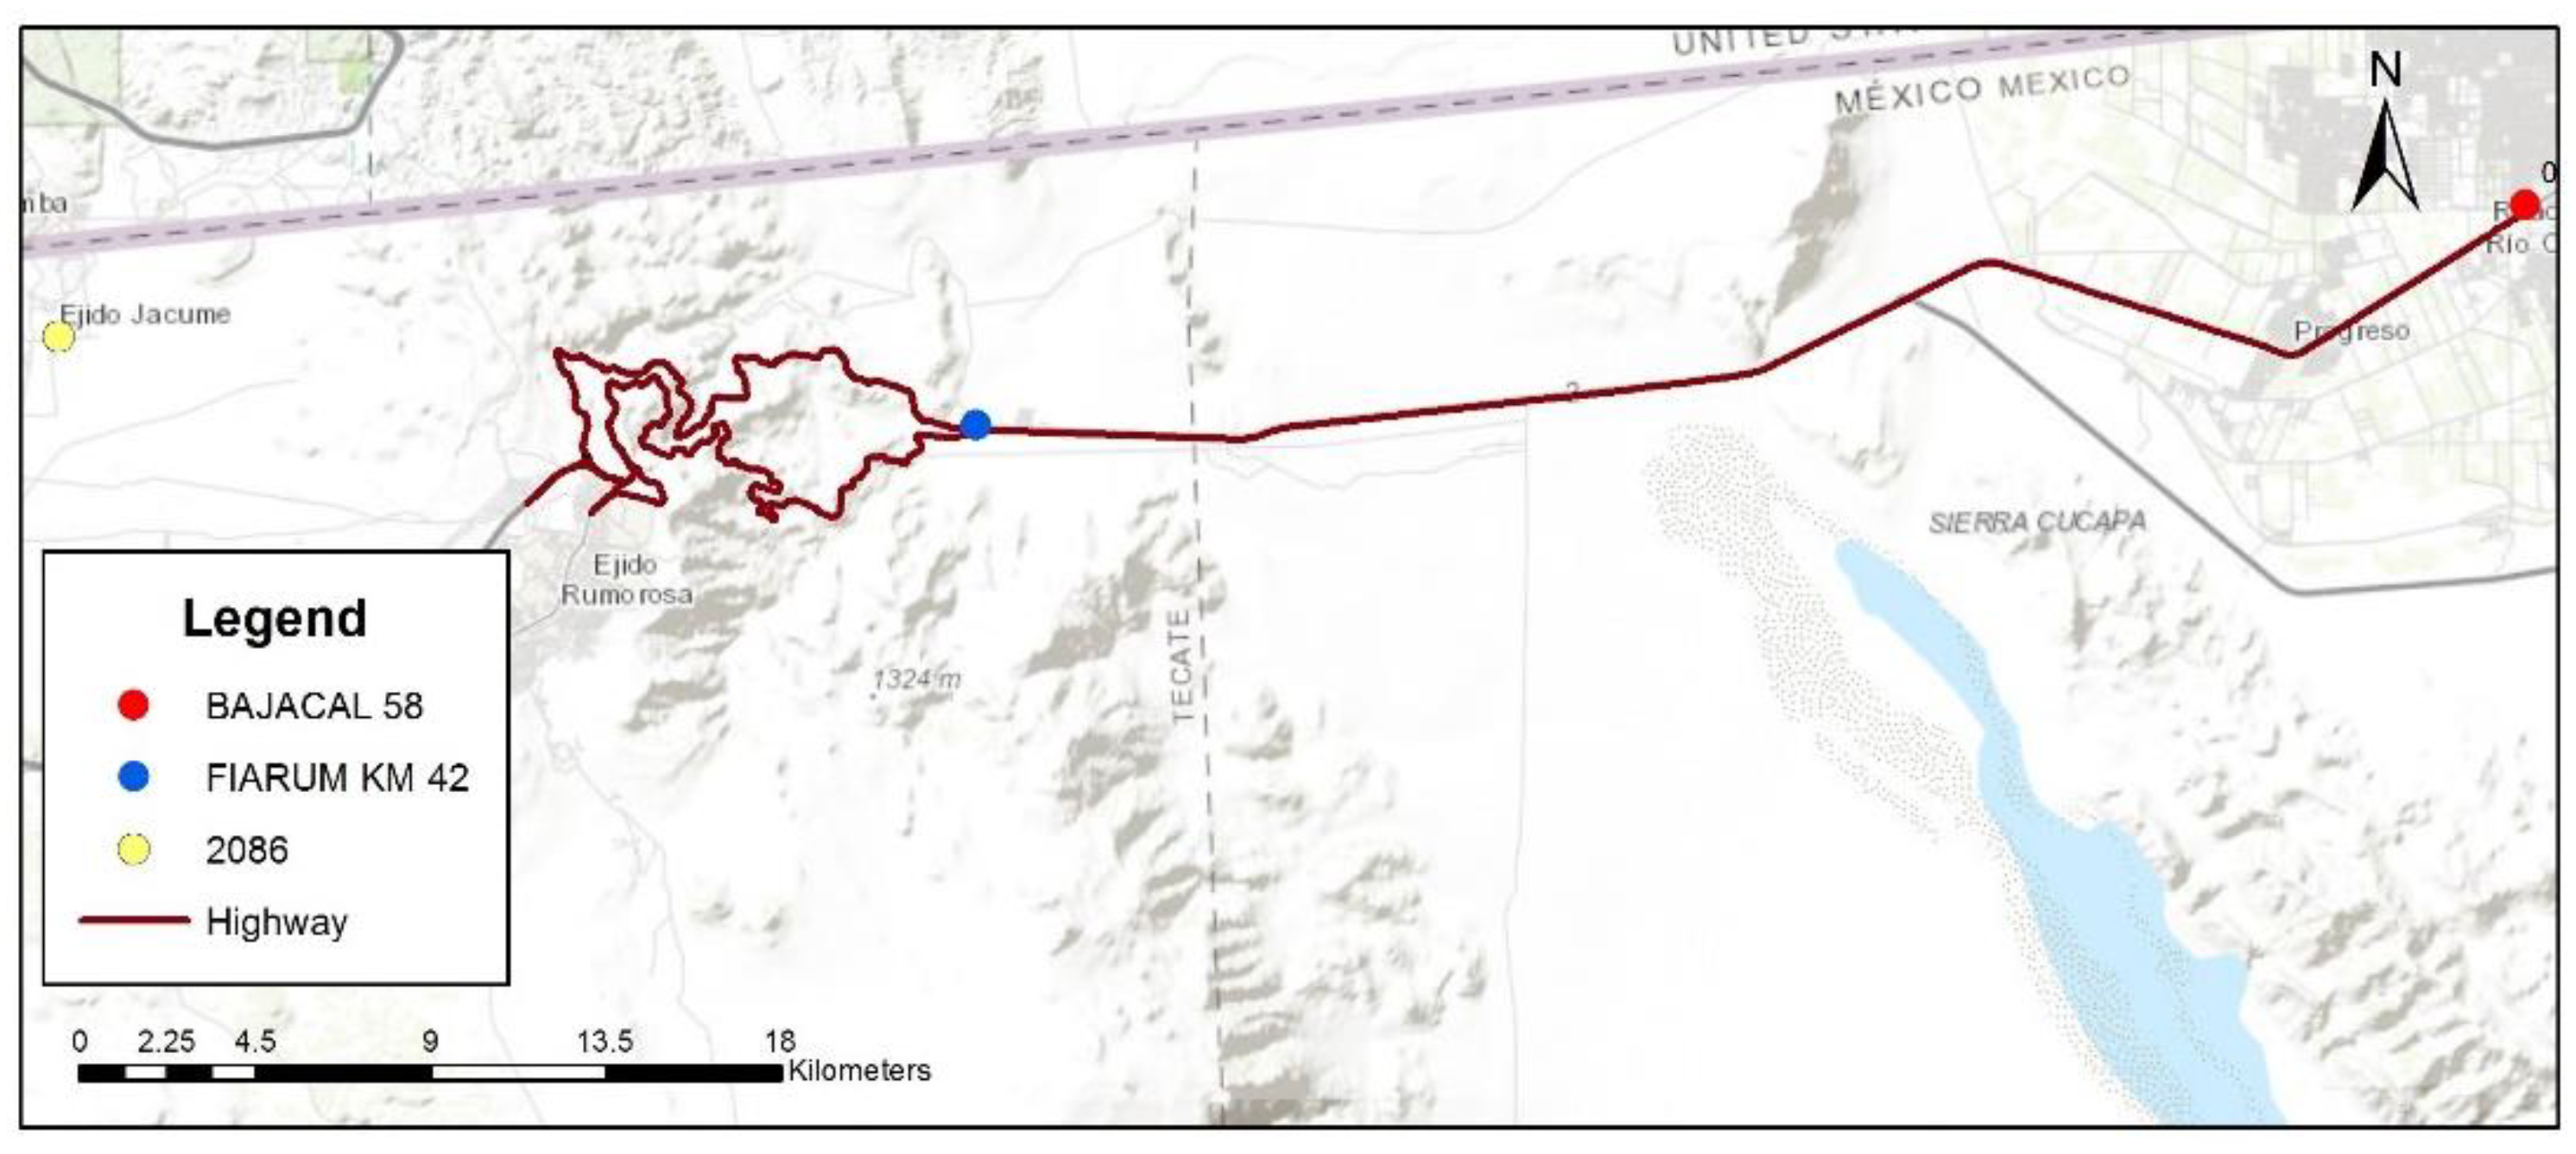
3.1. Study Area

The Highway Centinela-La Rumorosa is managed by the Investment Trust Funds Administration (FIARUM for its acronym in Spanish) which is located in the municipalities of Mexicali and Tecate (Figure 1) belonging to Federal Highway no. 2. This road has separate bodies with different traces and topographic conditions during its route, both in ascent and descent, and is a total of 64 kilometers in length. From road stretch 0+000 to 18+000 is considered an urban area of the municipality of Mexicali, which has a flat topography and straight road sections. In the same way, occurring with road section 18+000 to 42+000 has, from 42+000 to 64+000, a mountainous topography with a considerable curve system.
Although the section is in constant modernization, with an important planning effort by its managing agency, it has not been possible for it to have a preventive strategy for conservation and maintenance. This is due to the fact that the pavement structures have already fulfilled their life cycle in many of its sections, which is even accelerated due to the efforts generated by heavy traffic. That is why, as of 2014, in order to facilitate decision-making, a project which consisted in the analysis of surface and structural pavement conditions started, which resulted in the development of an annual interventions program and subsequently, in conservation efforts for the highway during the period 2014–2019. Furthermore, the analysis of the effects, as a result of these interventions, helped in improving conditions on the road section performance and to provide continuity to the highway maintenance and rehabilitation efforts after 2019.

3.2. Analysis Methodology

This methodology integrates surface and structural conditions data gathered in 2014, mainly the surface deterioration, roughness, rut and texture; as well as measures in structural performance, that is, stratigraphy, remaining life and fatigue data. Representative data of conditions in the study area, in a simulation process in order to determine maintenance rehabilitation work effects carried out to date that support future decision-making, guarantees a better performance for users of this highway. The structure of the model used in the current research work is presented below (Figure 2).
In the following, the steps of the methodology are listed:
  • In the beginning of analysis, representative data of the study area is collected.
  • To obtain the road´s deterioration in 2014, a pavement network inventory is created on a GIS software to obtain the superficial and structural condition of the pavement.
  • The works effect is carried out, to date, by simulation to obtain road conditions at the end of the analysis cycle.
  • The improvement of highway performance is reflected in operational indicators like highway use, reduction of the number of accidents and the improvement of users’ safety and comfort, through the serviceability index. Additionally, these results allow prioritizing future M&R interventions.

3.3. Input Data

It is established that the first input data should reflect pavement conditions regarding surface and structure. The surface analysis refers to an evaluation of surface faults through a pavement distress survey [30], as well as the measurement of two performance indicators, which are the International Roughness Index (IRI) and the Rut Depth (RD). For its part, the structural analysis refers to assessing the structure of the pavement, considering the measurement of thicknesses, quality of the materials that make it up and load capacity. Furthermore, an integral evaluation of the existing pavement is carried out in order to predict its useful life, from the point of view of deformations and fatigue capacities. This analysis considers the weather conditions in the study area and the projected traffic, and these situations resulted in the development of an annual interventions program, and with it, the implementation of maintenance works for the highway in the period 2014–2019. In addition, in order to integrate such data into a PMS, the effect of the work carried out, to date, is simulated.

3.3.1. Pavement Characteristics

For the pavement performance evaluation, several indicators are used, among the most used, the IRI and RD are evaluated. The first one refers an indicator that directly represents the functional condition of a pavement, and at the same time, constitutes a complementary indicator to divide the road network according to its structural capacity [31]. Likewise, HDM-4 program also has criteria established by ASHTOO to measure pavement surface condition. Therefore, data gathered, as well as the deterioration information, are classified according to these criteria (Table 1).
The structural characteristics of the layers that make up physical and mechanical pavement properties are gathered through surveys and laboratory tests, in accordance with the national regulations of the Secretariat of Communication and Transport (SCT) and ASTM. Finally, as part of the evaluation process of the existing pavement, a sub-section review strategy is carried out, with the purpose of identifying the particularities of the road, and thereby, defining the most damaged areas in need of some maintenance work in a timely manner. The final goal of this evaluation stage lies in obtaining the foreseeable pavement life, whether the asphalt layer is stressed, or some or all the layers that make it up are misshapen. To calculate the value of the foreseeable life, either in equivalent axes or translation in years, it is necessary to consider a series of data, such as: road type, project transit, layers, thicknesses, relative values of critical support, elastic or stiffness modulus and Poisson’s ratio [32]. The calculation of these values is done by using the software Dispav-5 version 3.0, developed by UNAM Engineering Institute [33].

3.3.2. Conditions of the Study Area
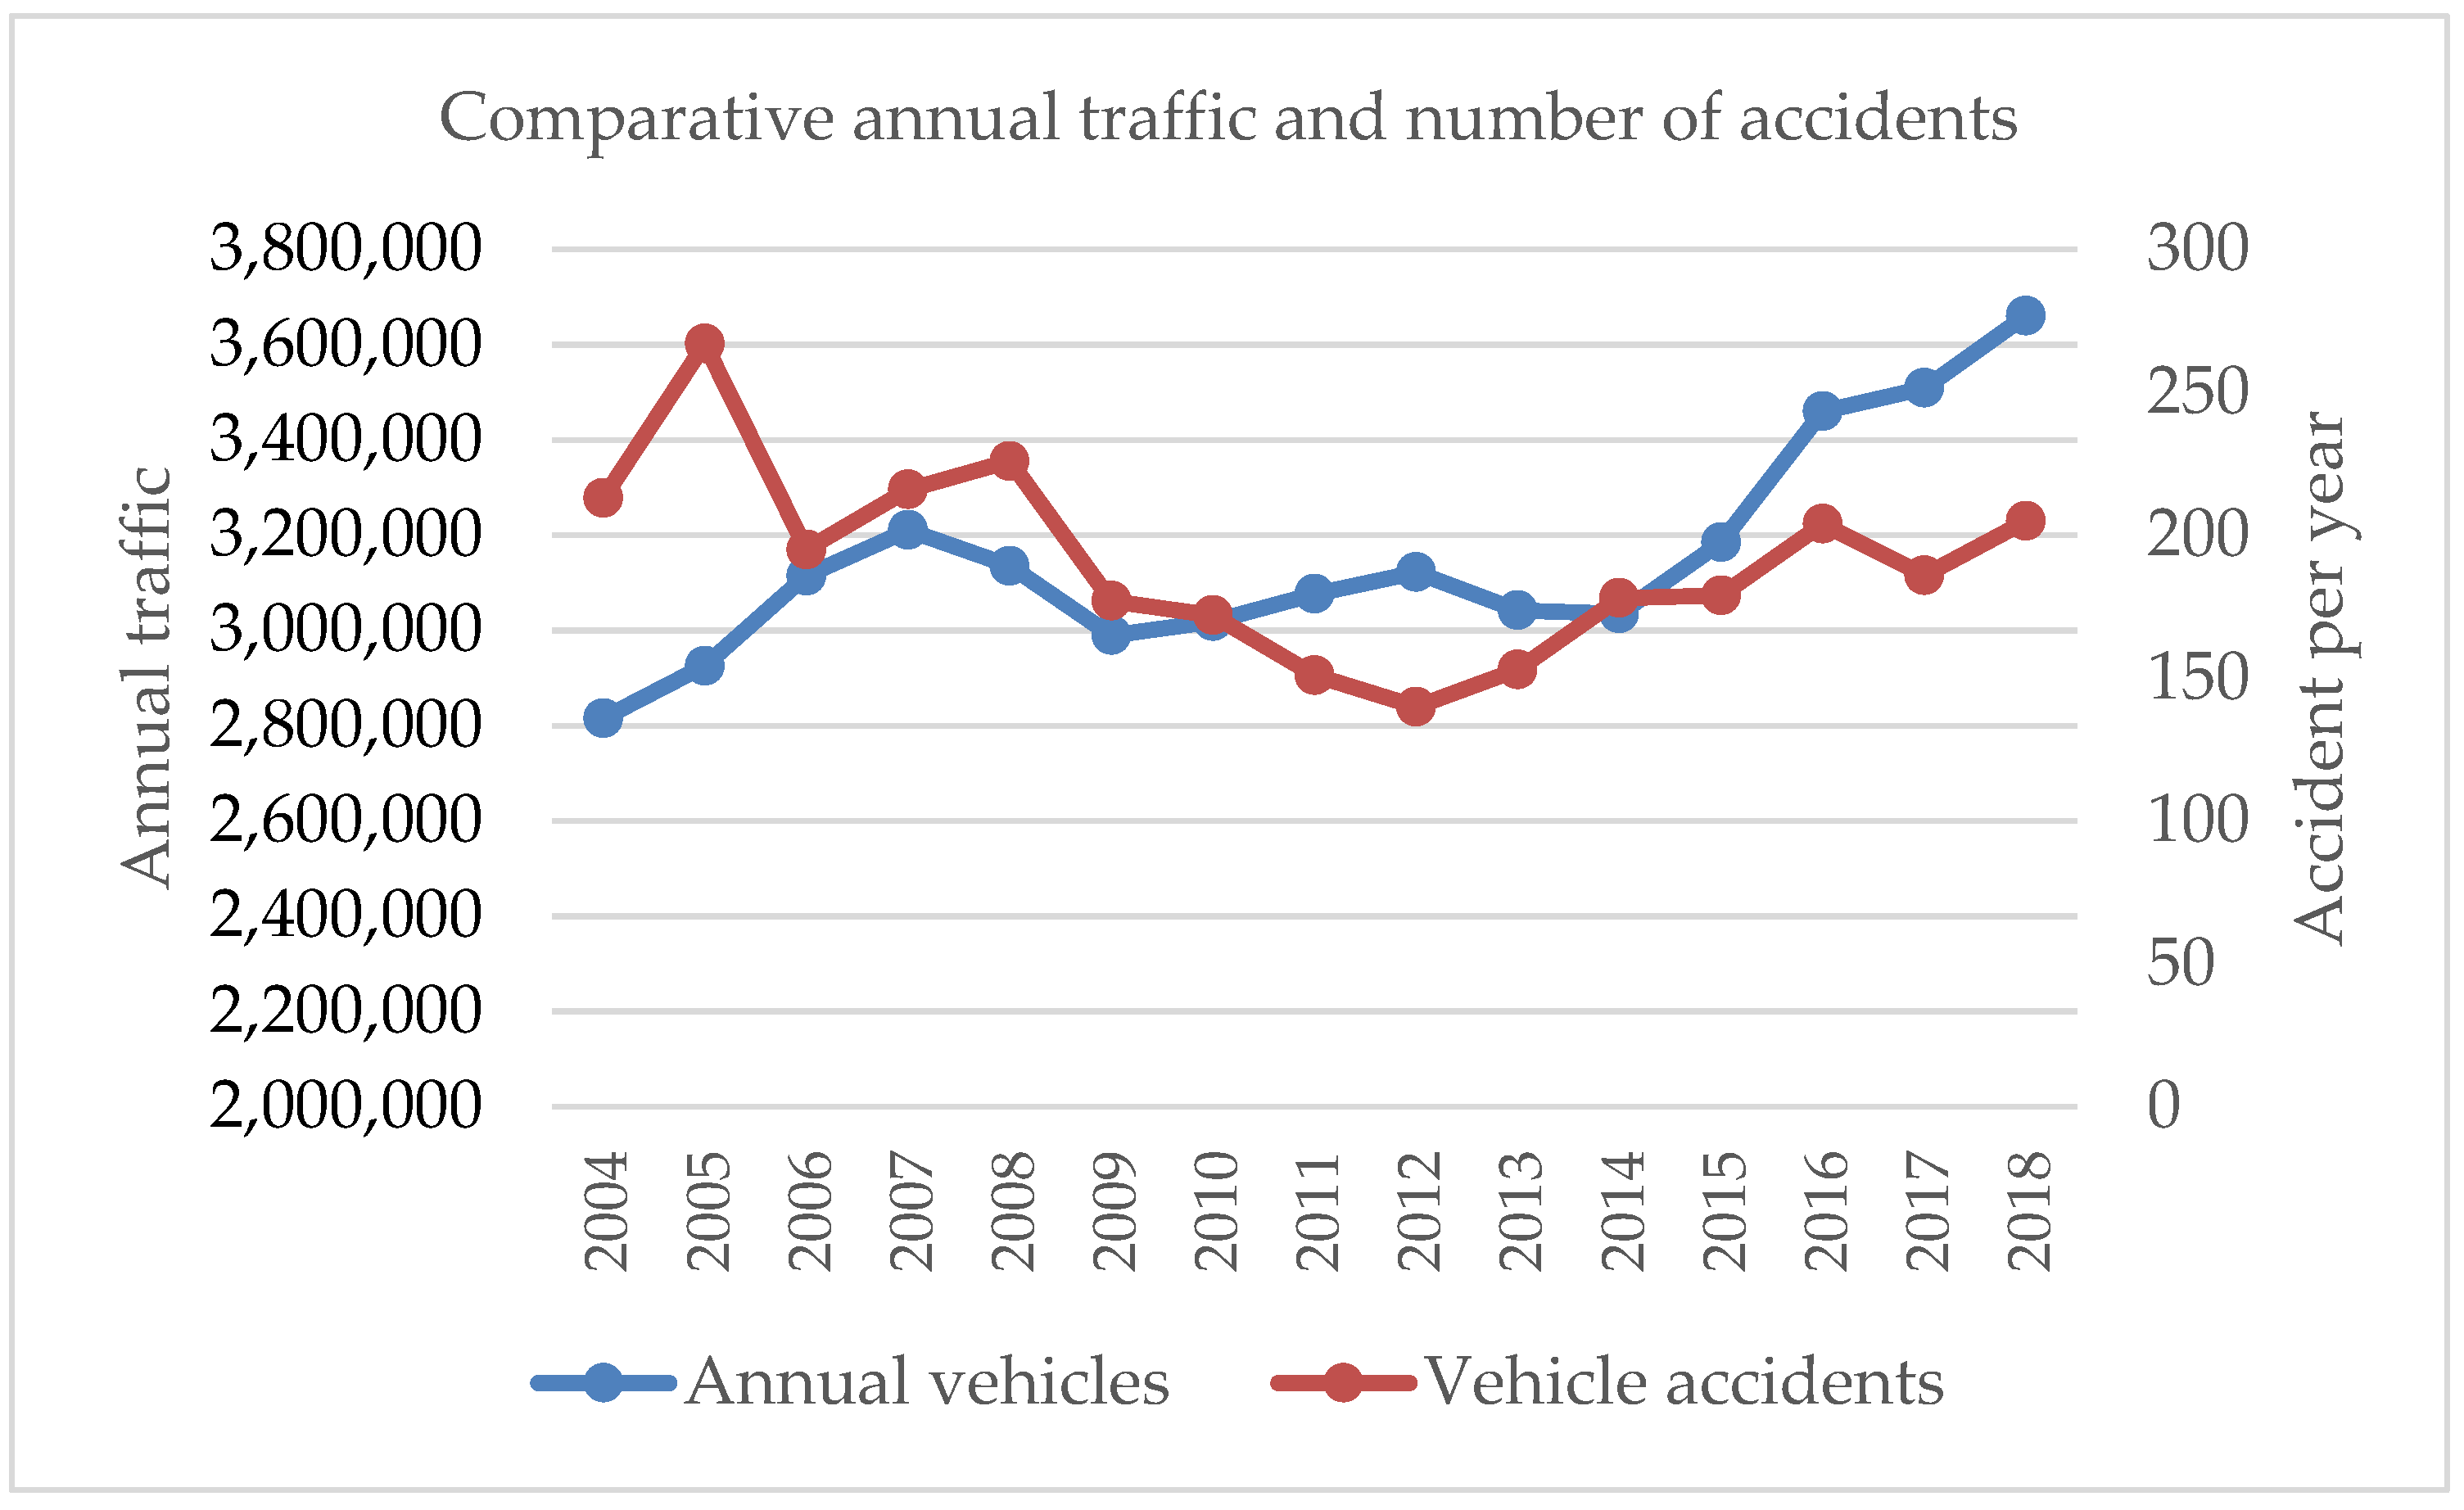
The weather element is an aspect that must be taken into consideration in pavement design and evaluation, since weather directly affects the behavior in design and evaluation. Weather conditions modify the stiffness, due to the thermoplastic properties of the material that constitutes the asphalt layers of the flexible pavements [34]. It is important to mention that the referred highway presents a great variability in its weather conditions. Therefore, for climatological data analysis, three weather stations are used in order to gather temperature data; two of them provided by FIARUM, the case of FIARUM KM-42 and BAJACAL58; as well as another weather station obtained from the network of weather stations of CONAGUA, named station 2086. Station location data are established in Figure 3.

3.3.3. Traffic Data

The vehicular traffic accounted for the direct solicitation to the structural system of distinct pavement [35]; for this reason, it is essential to quantify the magnitude of the loads by distributing the different types of vehicles and representative axes through vehicle composition, contact area and pressure distribution on the pavement. For the preparation of this document, the level of vehicular traffic is defined in equivalent single axle load (ESAL). These axes represent the unit of predicted damage induced by repetitions of a single axis of 8.2 tons with an inflation pressure of 5.8 kg/cm2 in a time frame [14,36]. As Patrick Lavin [37] mentions, equivalent single axes are a key element in the description of the life and design of an asphalt pavement. Traffic effects on pavement conditions can be estimated by means of the Annual Average Daily Traffic (AADT), and the calculation of the equivalent axis corresponding to the traffic that circulated on the road from 2014 to 2018 through the following equation:
Σ L = ( AADT ) × ( CD ) × i = 1 P C i   ( w i   C dm + ( 1 w i ) C dv )
where ΣL is the sum of equivalent axis of 8.2 tons expected at the end of the project; AADT corresponds to the annual average daily traffic; CD is the distribution coefficient per lane in decimals (generally 0.5 for two lane roads, 0.4 to 0.5 on four lane roads and 0.3 to 0.4 on six or more lanes); Cdm is the in damage coefficient of cargo vehicles (loaded) and Cdv corresponds to the damage coefficient of empty vehicles to calculate this coefficient’s view, according to Corro et al. [38]; Ci is the directional distribution coefficient for each type of vehicle (i); and wi is the proportion of cargo vehicles (loaded) for each type of vehicle (i).

4. Results

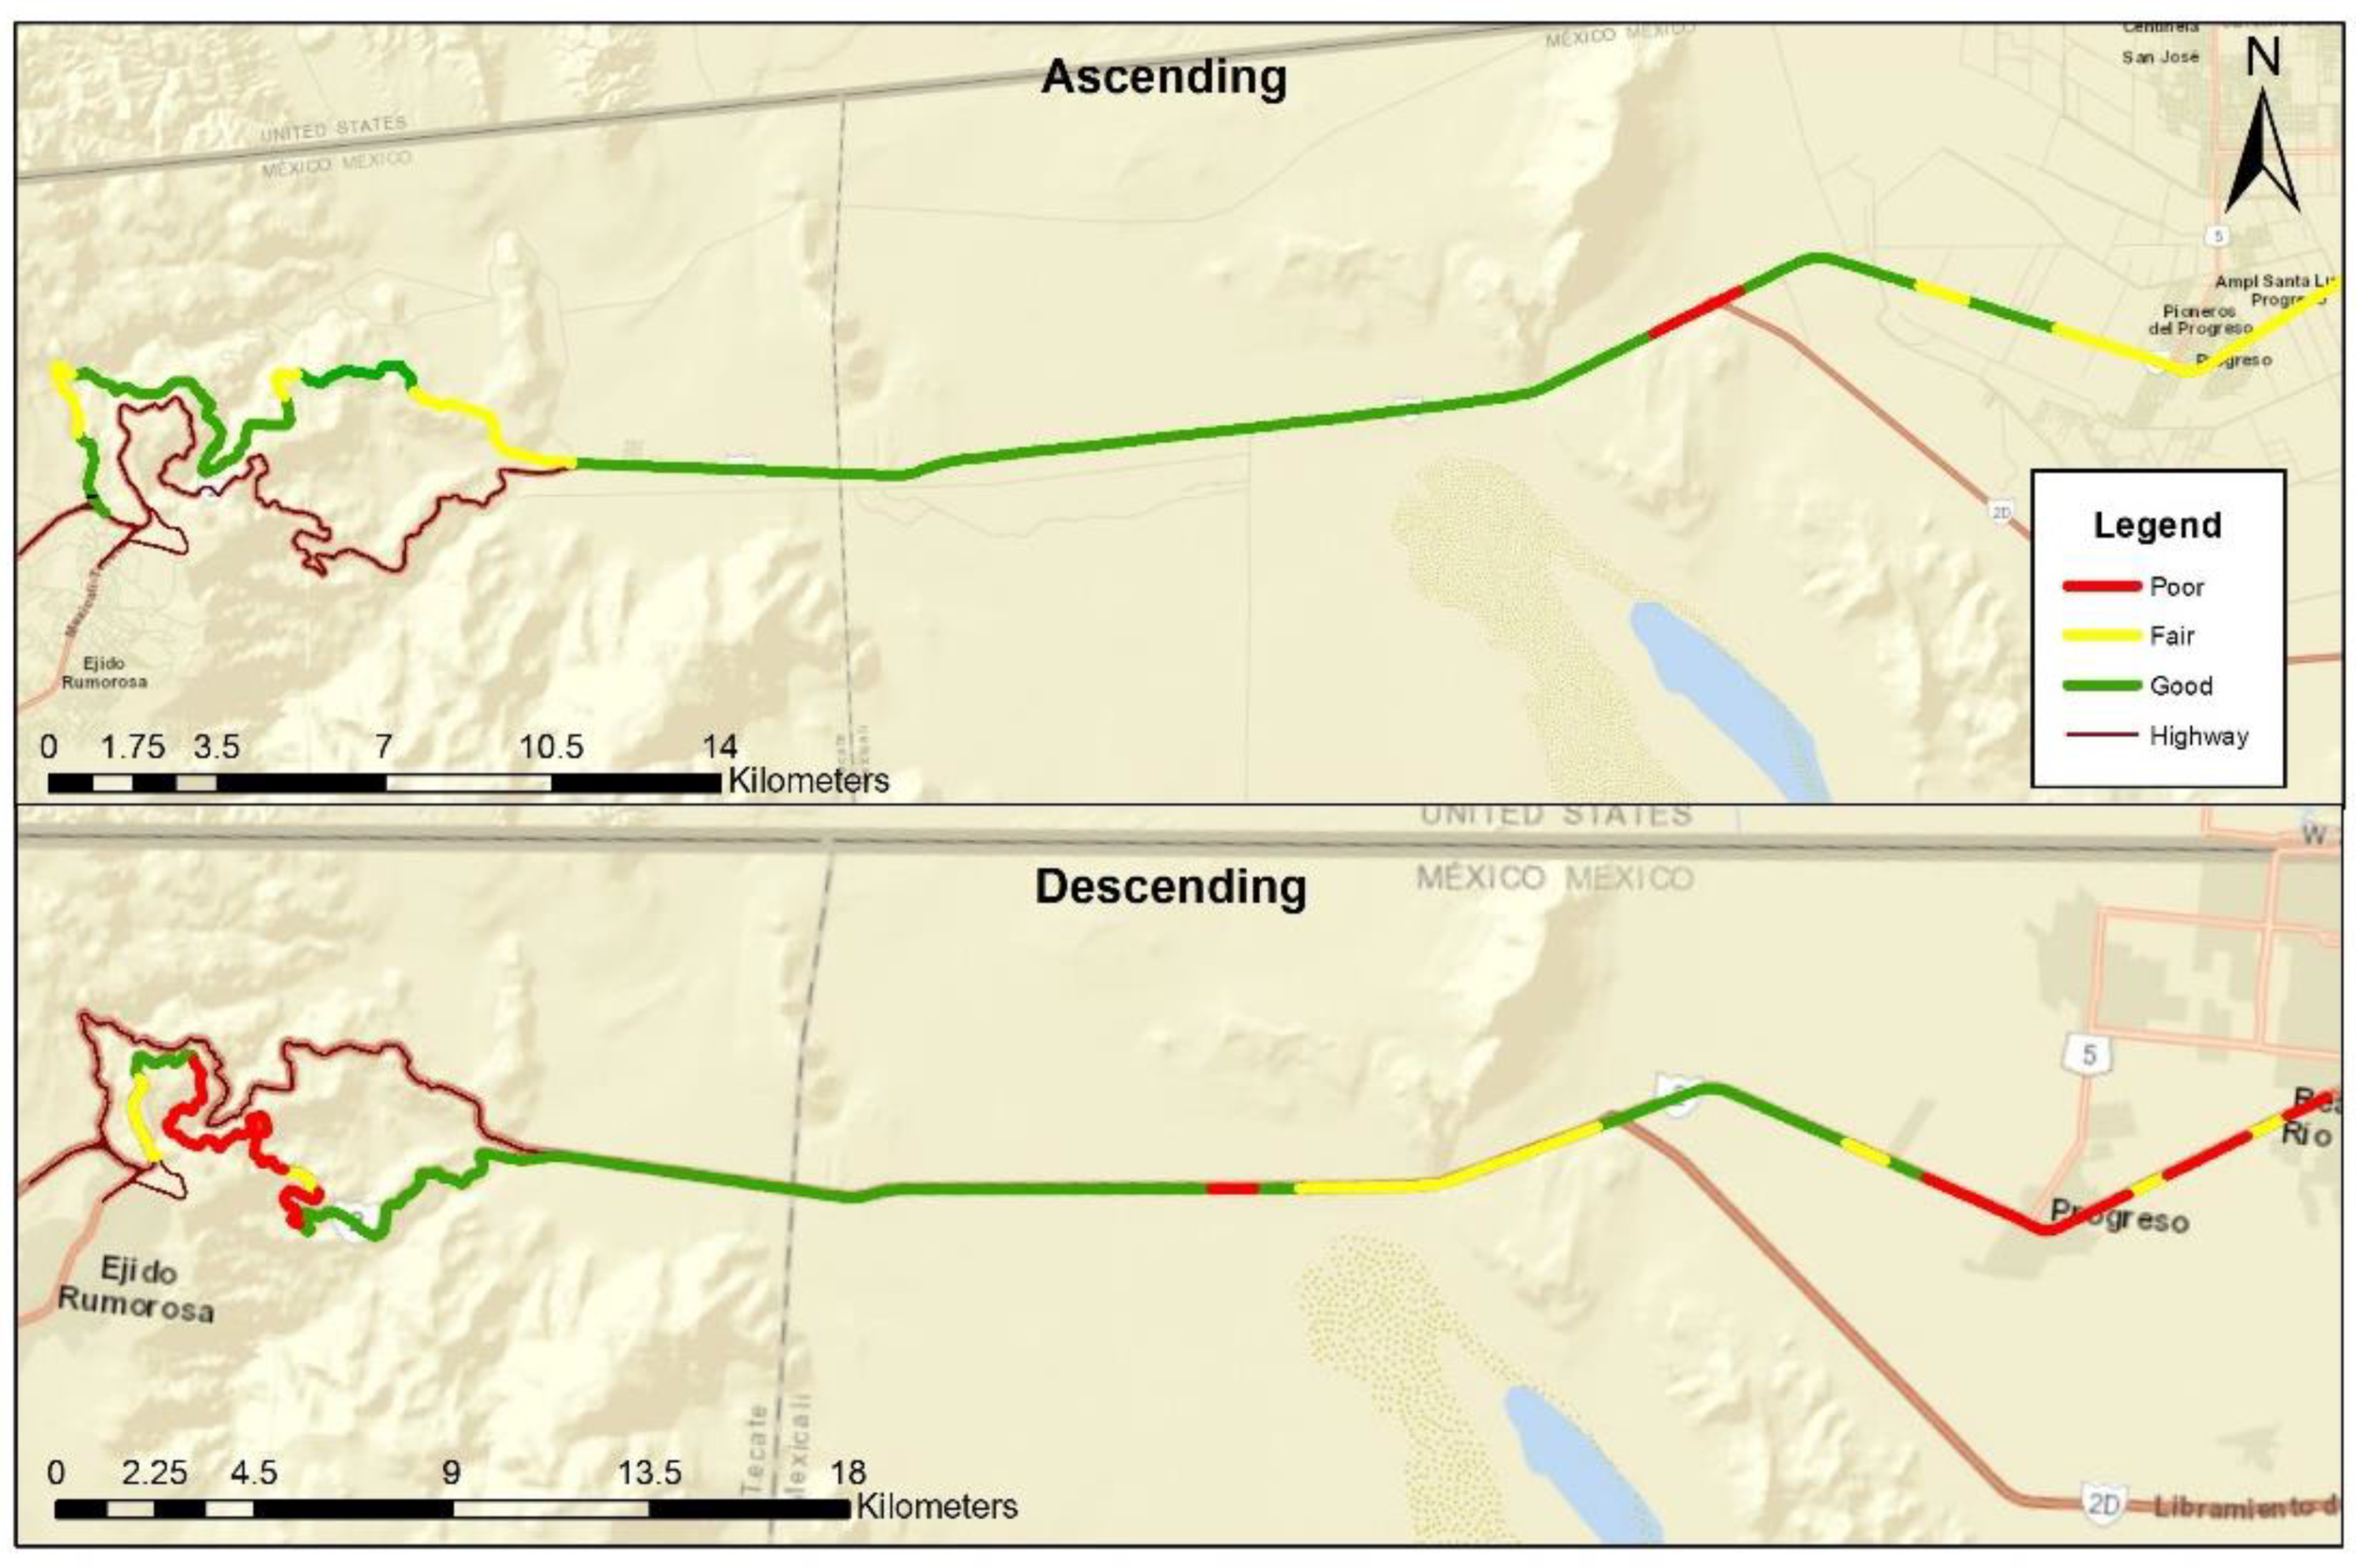
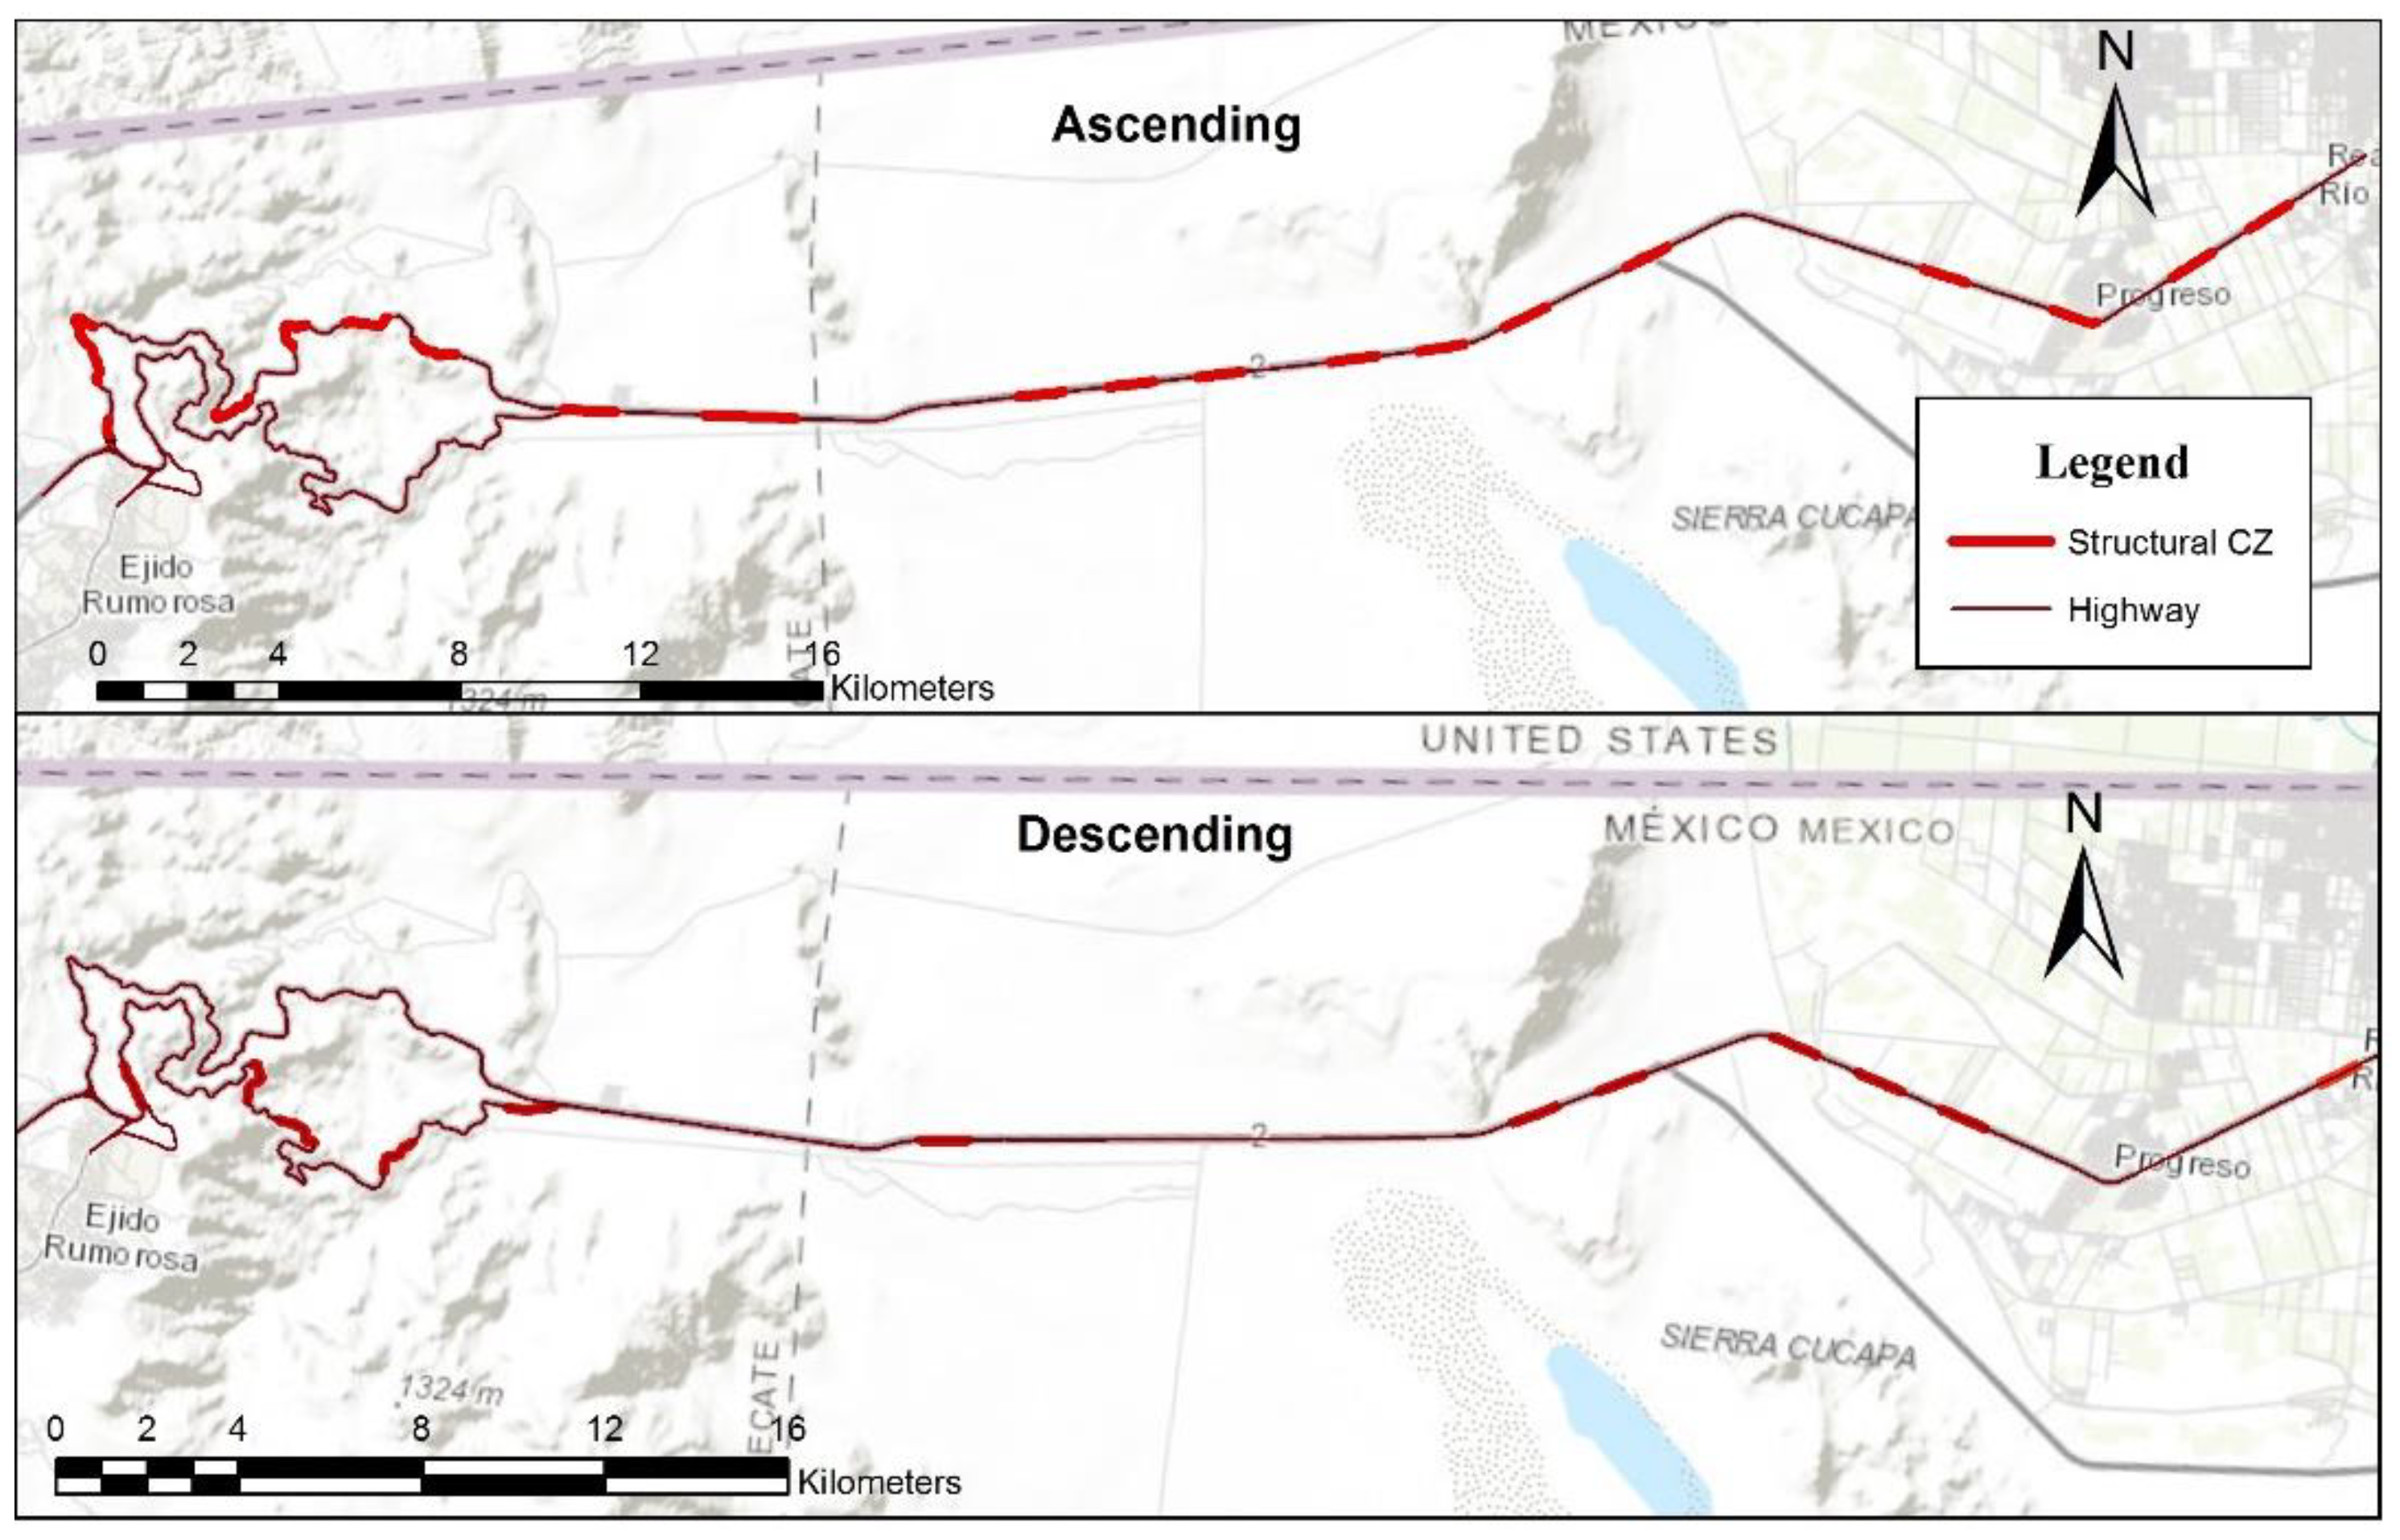
4.1. Superficial and Structural Condition

The classification results for surface damages in the year 2014, show that the most deteriorated road section is the descending one. This one presents bad conditions in 28.1% of its route being more critical in the mountainous area where there are steep slopes and curves; and in the first kilometers of this route that are considered part of the urban area. On the other hand, 70% of the ascending road section has good conditions. This information is presented in Figure 4.
On the other hand, structural conditions analysis results reveal the points of the road network that show resistance deficiencies in some of the layers that make up the pavement structure. According to Figure 5, the ascending road section presents greater structural deficiencies, presenting these deficiencies in 37% of its route. Regarding the descent road section, there are deficiencies in 20% of the route. Nevertheless, the remaining life analysis revealed that these deficiencies do not require an immediate pavement total reconstruction, but a superficial treatment only.

4.2. Definition of Intervention Priorities

Once the information regarding surface and structure of the highway has been analyzed, critical points of the highway are identified. These critical points are values that are outside the minimum operating parameters established by SCT regulations for IRI and RD, as well as those ones established by the CMT book: characteristics of the materials IMT/SCT [39], for different layers that integrate the pavement structure. The summary of this analysis is presented in Table 2.
As mentioned above, structural deficiencies do not require immediate reconstruction works. However, sections that are more likely to get damaged due to deformation or stress are shown for future interventions.

4.3. Maintenance and Rehabilitation Work to Improve Highway Conditions

Once the information on the field data has been analyzed, the work to be carried out in the intervention plan is determined. This plan takes into account works carried out from 2014 through 2019. However, most of the proposed works have already been executed by 2018, with the exception of the first 18 kilometers of the highway, located in the urban area. It is worth mentioning that this section is administered by another local agency that has not carried out the proposed interventions. Works executed are presented below in Table 3.
According to the previous chart, three surface maintenance strategies were carried out. The first strategy was with slurry seal, which consists of applying a homogeneous liquid mixture of water, asphalt emulsion, mineral filler and well-graduated aggregate. The second strategy was with 40 mm overfolder works, which consists of the application of a tack coat and the placement of a dense granulometry layer. The third strategy was milling and re-construction, which refers to the removal of 100 mm of existing asphalt layer and placement of 50 mm of a new layer.

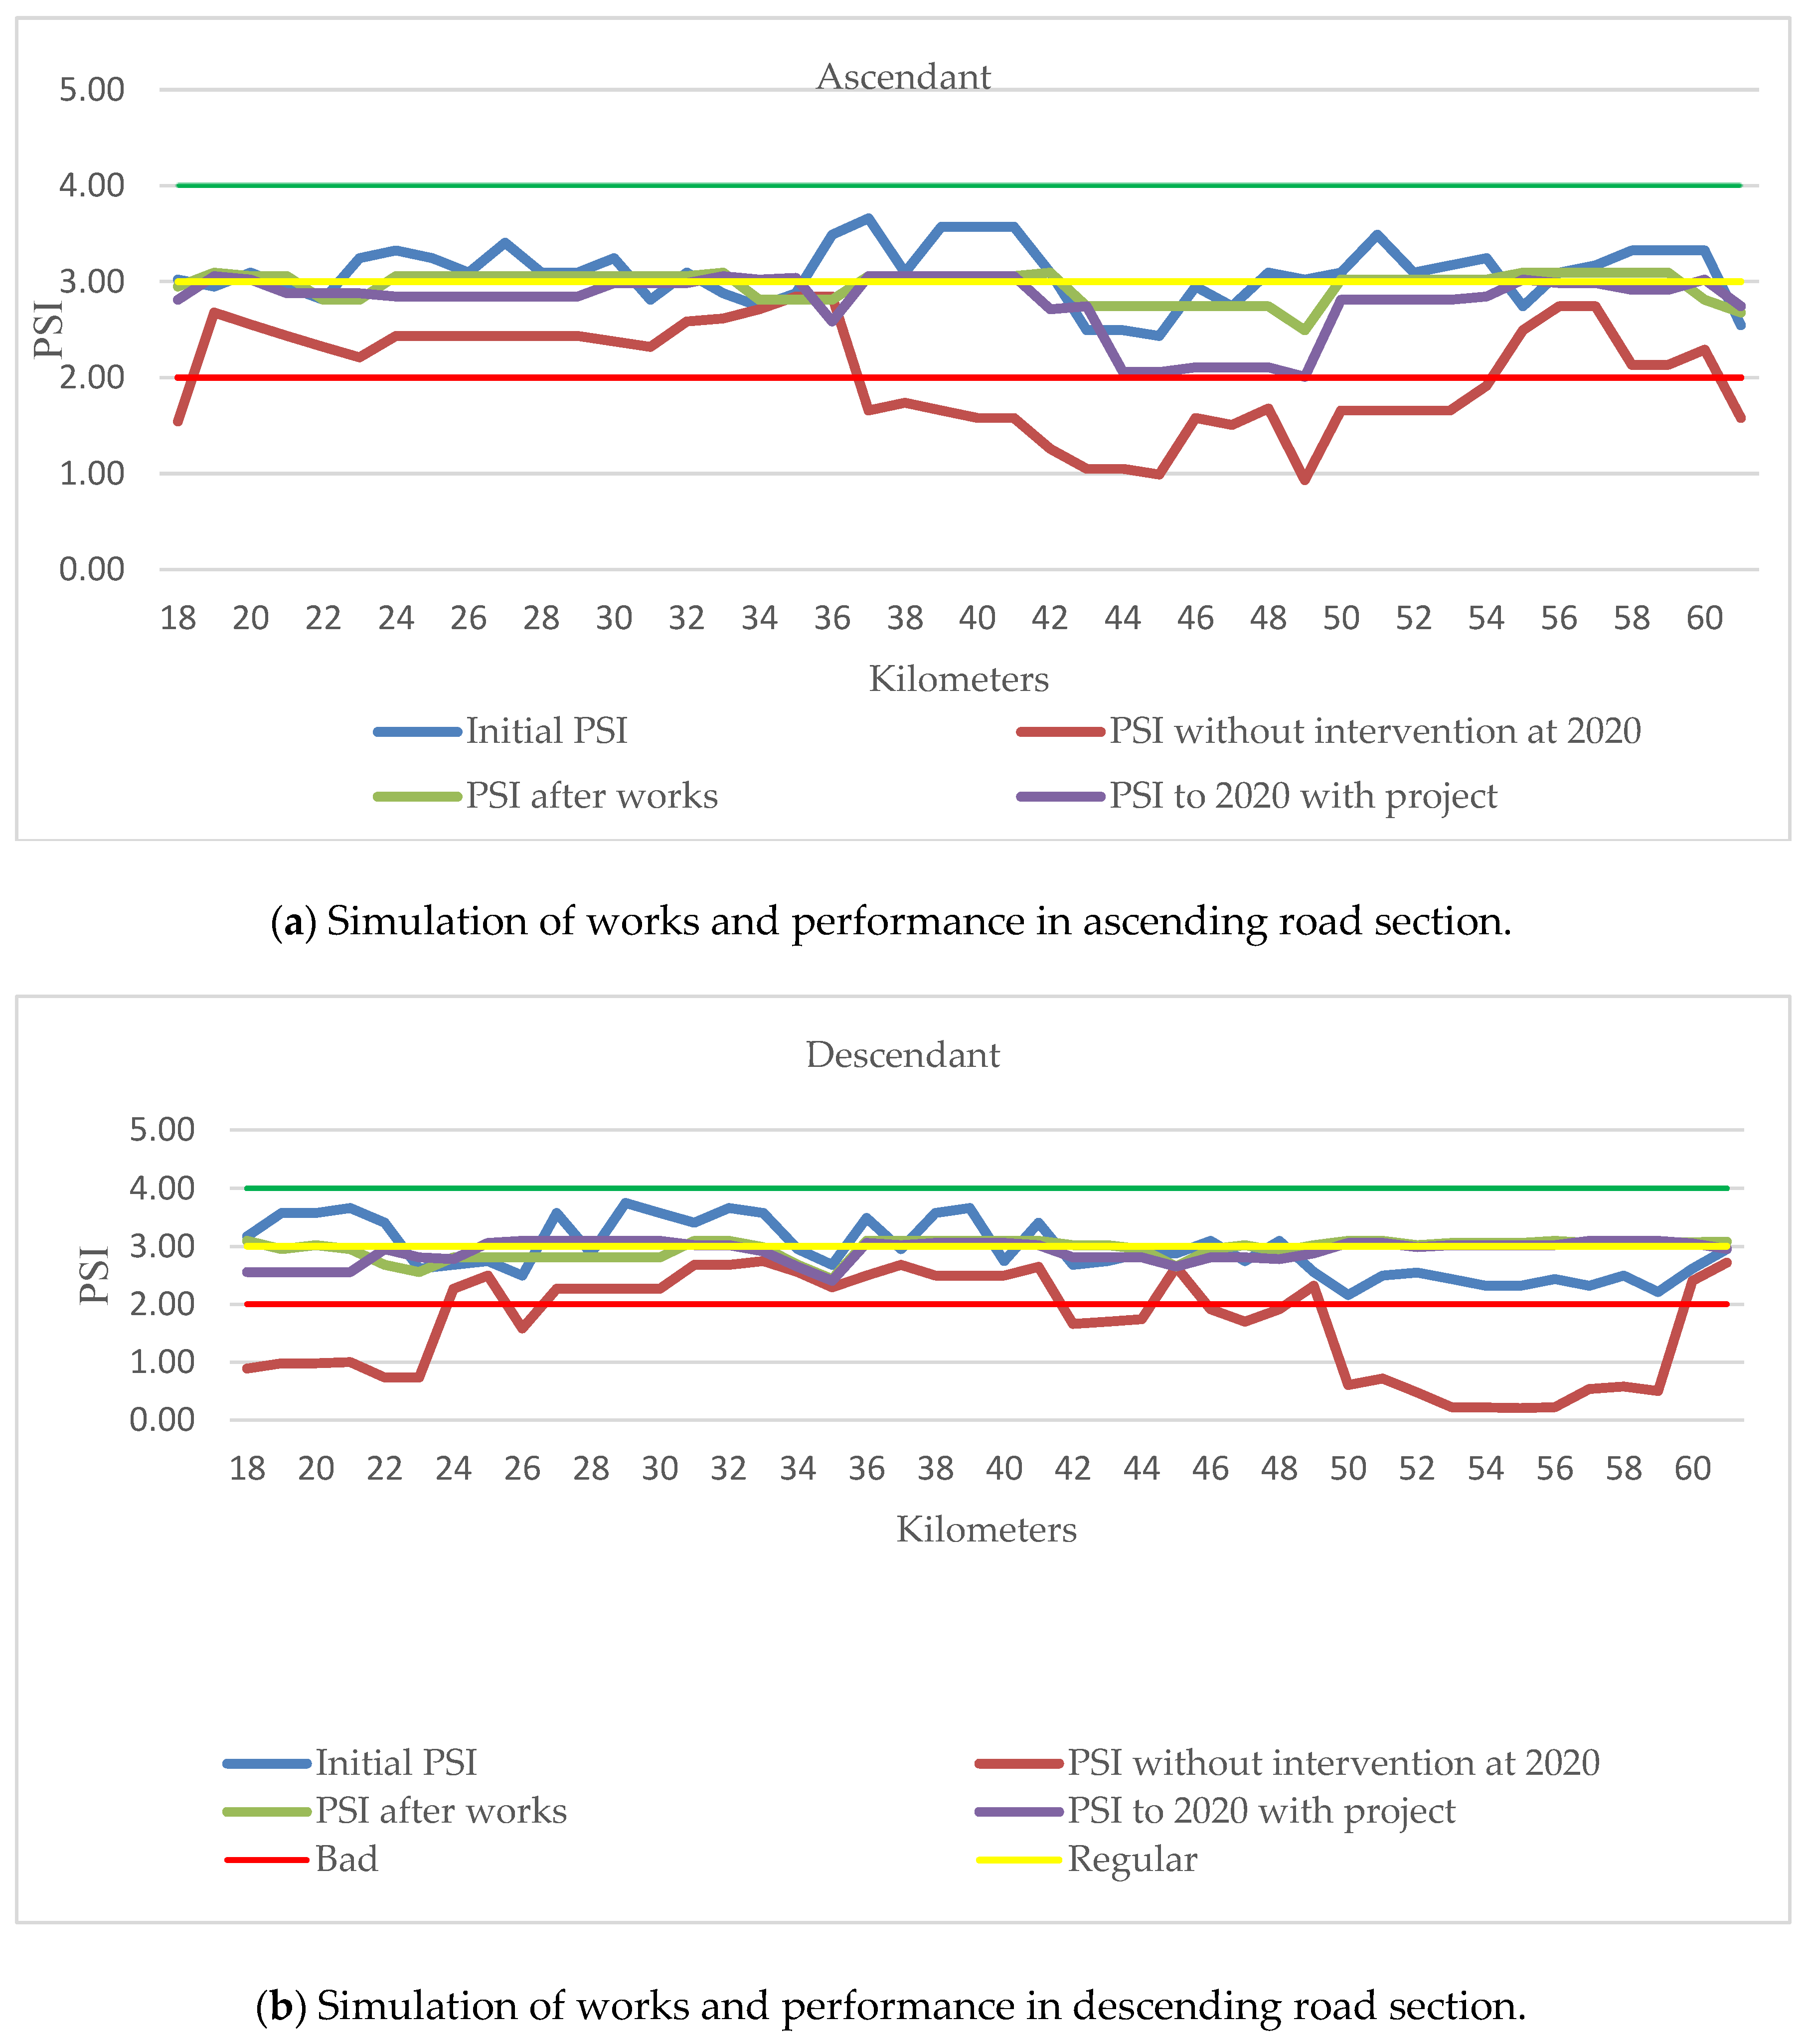
4.4. Highway Improvement Conditions Analysis

Results in the improvement of highway performance conditions are reflected in different operational indicators. This document takes into account increase in highway use, reduction of the number of accidents and the improvement of users’ safety and comfort, through the serviceability index.
In terms of the increase in highway use and registered accidents, Figure 6 presents that from 2008 through 2015, vehicle growth rate is negative. In other words, the number of vehicles on the highway is less every year. However, since the intervention plan came into effect, the average vehicle growth up to 2018 is 5% per year, having its biggest rise in 2016. Despite this growth, the number in annual accidents has not increased proportionally regarding that growth. As a matter of fact, it is observed that in the last ten years, an average of 180 annual accidents have been maintained.
In order to measure the effect of executed works in pavement performance, a simulation of the proposed works and its impact regarding users’ safety and comfort is carried out. Starting on the Present Serviceability Index (PSI), this concept was defined by AASTHO (American Association of State Highway Officials) [14] to assess the pavement’s functional condition according to the user’s perception. This index is calculated through its relationship with the IRI proposed by Al-Omari and Darter [40] for asphalt pavements using the following equation:
PSI = 5 * e 0.24 + IRI
where PSI is the Present Serviceability Index and IRI is the International Roughness Index.
Simulation of works on the road section were carried out with the Infrastructure Management System HDM-4 Version 1.03, using the Work Effects (WE) module, which includes mathematical relationships for modeling of road deterioration and for the effects of works in pavement conditions improvement. Prediction model calibration is carried out through field studies and existing literature related to the impacts of maintenance and rehabilitation strategies [41], and conditions of the study area and calculation of real equivalent axis using Equation (1) per year from 2014 through 2018. Figure 7 shows the simulation in the works effects regarding pavement performance improvement, through the PSI. These results show that the interventions positively influenced highway performance improvement. Due to the simulated levels with the project, the improvement remains in the range from regular to good by 2020. Additionally, these results allow prioritizing future interventions in both highway routes. According to Morova et al. [42], half of the AASHTO study evaluators determined that a range of 3.0 in the PSI is considered acceptable and less than 2.5 is unacceptable. Therefore, the highway has good performance conditions and will maintain this characteristic in years to come.

5. Discussion and Conclusions

Evaluating surface and structural conditions of the existing pavement is essential, in order to determine the M&R actions that provide greater benefits to decision makers and road users.
Surface conditions directly influence in service and safety road section levels. This is because the quality of the bearing is the main factor associated with user safety and comfort. On the other hand, the correct pavement operation depends on materials and strength characteristics that build up the structure, since these structures define deformation magnitude, caused by the conditions of the study area, such as the temperature of the area and traffic characteristics.
Once current highway conditions have been gathered, it is possible to calculate the foreseeable life of both the asphalt layer and structure in order to ensure that all the proposed works are carried out within the necessary time. For the contemplated cycle in the intervention plan, it is not necessary to carry out total pavement reconstruction works, so that the intervention proposals include surficial works only. However, this analysis allows the identification of the most damaged areas in need of total pavement maintenance works in future intervention plans.
Some of the proposed interventions were not carried out based on the intervention plan, particularly in the first 18 km of the highway, which are administered by another agency. Therefore, its immediate intervention is recommended, because this section has superficial and structural deficiencies. Although the prediction models allow an overview of the pavement conditions, it is necessary to obtain updated data in order to optimize the prediction models.
Regarding safety, the main cause of accidents on the highway is attributed to the human factor according to Farooq et al. [10], reflected in overturns, from exiting due to speeding, just to mention the most frequent ones. However, infrastructure characteristics improvements that influence the road safety of road traffic are highly effective. According to the results, although the traffic increased exponentially from the moment of highway improvement conditions, the number of annual accidents did not. However, pavement M&R interventions address only rolling-related factors, so it is necessary to review the path, slope or degree of curvature, as well as interventions related to the improvement of geometric design and regulation of road marking and safety devices.
In general, results of the serviceability analysis show that interventions carried out on the highway improved the comfort and safety of users, according to the PSI. Additionally, some road sections already maintained favorable service levels, so the interventions helped preserve these conditions.
According to the literature review, the concept of sustainability can be applied at all stages of the pavement cycle. However, this proposal focuses on two stages. First, in the maintenance stage, through the improvement in the allocation of resources in M&R activities. Second, in the operation phase, through the improvement in the use of the highway and its interaction with the user.
It is concluded that the proposed planning model contributes to the improvement of highway performance, since it allows planning and administering the allocation of resources in making appropriate maintenance and rehabilitation decisions. Additionally, it allows to generate valuable inputs for PMS implementation. The foregoing allows road management agencies in developing countries to provide a quality transport system to users.

Author Contributions

M.M.-A. software, writing-review, original draft preparation, investigation; A.M.-M. supervision, editing, project administration; L.G. writing—review, editing, validation. All authors have read and agreed to the published version of the manuscript.

Funding

This research received no external funding.

Acknowledgments

We sincerely appreciate the Engineering Faculty of the Universidad Autónoma de Baja California and Fideicomiso Tramo Carretero Centinela-Rumorosa (FIARUM), for their support in this study.

Conflicts of Interest

The authors declare no conflict of interest.

References

  1. Ozer, H.; Al-Qadi, I.L.; Harvey, J. Strategies for Improving the Sustainability of Asphalt Pavements:[techbrief]. 2016. Available online: https://rosap.ntl.bts.gov/view/dot/38346. (accessed on 7 October 2019).
  2. Wolters, A.; Zimmerman, K.; Schattler, K.; Rietgraf, A. Implementing Pavement Management Systems for Local Agencies—State-of-the-Art/State-of-the-Practice. 2011. Available online: https://apps.ict.illinois.edu/projects/getfile.asp?id=3053 (accessed on 5 September 2019).
  3. Martínez, I.; Ríos, J. Sistema de administración de pavimentos sobre la ciudad de Bogotá. 2010. Available online: https://www.academia.edu/15014853/Modelo (accessed on 5 September 2019).
  4. Luo, G.Z.; Fu, J.S.; Yan, P. Highway Construction Based on Sustainable Concept; Advanced Materials Research; Trans Tech Publication: Zurich, Switzerland, 2013; pp. 4086–4090. [Google Scholar]
  5. Muench, S.; Anderson, J.; Hatfield, J.; Koester, J.; Söderlund, M.; Weiland, C. Greenroads Manual v1. 5; University of Washington: Seattle, WA, USA, 2011. [Google Scholar]
  6. Mendoza Sánchez, J. Criterios de Sustentabilidad Para Carreteras en México; Publicacion Tecnica; Instituto Mexicano del Transporte: Pedro Escobedo, Mexico, 2014. [Google Scholar]
  7. Bryce, J.; Brodie, S.; Parry, T.; Presti, D.L. A systematic assessment of road pavement sustainability through a review of rating tools. Resour. Conserv. Recycl. 2017, 120, 108–118. [Google Scholar] [CrossRef]
  8. Mao, X.; Wang, J.; Yuan, C.; Yu, W.; Gan, J. A dynamic traffic assignment model for the sustainability of pavement performance. Sustainability 2019, 11, 170. [Google Scholar] [CrossRef] [Green Version]
  9. Corriere, F.; Rizzo, A. Sustainability in Road Design: A Methodological Proposal for the Drafting of Guideline. Procedia-Soc. Behav. Sci. 2012, 53, 39–48. [Google Scholar] [CrossRef] [Green Version]
  10. Farooq, D.; Moslem, S.; Duleba, S. Evaluation of Driver Behavior Criteria for Evolution of Sustainable Traffic Safety. Sustainability 2019, 11, 3142. [Google Scholar] [CrossRef] [Green Version]
  11. Yang, Y.; Easa, S.M.; Lin, Z.; Zheng, X. Evaluating highway traffic safety: An integrated approach. J. Adv. Transp. 2018, 2018. [Google Scholar] [CrossRef]
  12. Demasi, F.; Loprencipe, G.; Moretti, L. Road safety analysis of urban roads: Case study of an Italian municipality. Safety 2018, 4, 58. [Google Scholar] [CrossRef] [Green Version]
  13. Montgomery, R.; Schirmer, H., Jr.; Hirsch, A. Improving Environmental Sustainability in Road Projects. 2015. Available online: https://static1.squarespace.com/static/5812be0d59cc68fbc0eebd4c/t/591a3e2ff7e0abb702713d7a/1494892088186/Improving_Environmental_Sustainability_in_Road_Projects_2015.pdf (accessed on 9 October 2019).
  14. AASHTO. AASHTO Guide for Design of Pavement Structures, 1993; American Association of State Highway and Transportation Officials: Washington, DC, USA, 1993. [Google Scholar]
  15. Gerber, A.D.; Miller, T.D.; Richardson, M.J. Implementation and Calibration of a Laser Crack Measurement System for the Delaware Department of Transportation’s Pavement Management Program. In Proceedings of the Transportation Research Board 97th Annual Meeting, Washington, DC, USA, 7–11 January 2018. [Google Scholar]
  16. Cottrell, W.D.; Bryan, S.; Chilukuri, B.R.; Kalyani, V.; Stevanovic, A.; Wu, J. Transportation infrastructure maintenance management: Case study of a small urban city. J. Infrastruct. Syst. 2009, 15, 120–132. [Google Scholar] [CrossRef]
  17. Loprencipe, G.; Pantuso, A.; Di Mascio, P. Sustainable pavement management system in urban areas considering the vehicle operating costs. Sustainability 2017, 9, 453. [Google Scholar] [CrossRef] [Green Version]
  18. Corazza, M.V.; Di Mascio, P.; Moretti, L. Managing sidewalk pavement maintenance: A case study to increase pedestrian safety. J. Traffic Transp. Eng. 2016, 3, 203–214. [Google Scholar] [CrossRef] [Green Version]
  19. Attoh-Okine, N.; Adarkwa, O. Pavement Condition Surveys—Overview of Current Practices; Delaware Center for Transportation, University of Delaware: Newark, DE, USA, 2013. [Google Scholar]
  20. Bennett, C.R.; Paterson, W.D. Volume 5: A guide to calibration and adaptation. In HDM-4: Highway Development and Management Series; 2000; Available online: http://piarc.rmto.ir/DocLib4/Volume5.pdf (accessed on 24 July 2019).
  21. Yang, Y.; Huang, L.; Wang, J.; Xia, Y. Research on Reference Indicators for Sustainable Pavement Maintenance Cost Control through Data Mining. Sustainability 2019, 11, 877. [Google Scholar] [CrossRef] [Green Version]
  22. Bannour, A.; Elomari, M.; El Khadir, L.; Afechkar, M.; Lamrini, B.; Joubert, P. Calibration Study of HDM-4 Model of Structural Cracking Models for Flexible Pavements in Moroccan Context. 2015. Available online: https://www.researchgate.net/publication/283349130_Calibration_study_of_HDM-4_Model_of_structural_cracking_models_for_flexible_pavements_in_Moroccan_Context (accessed on 24 July 2019).
  23. Jain, S.; Parida, M.; Thube, D. HDM-4 based optimal maintenance strategies for low-volume roads in India. Road Transp. Res. J. Aust. New Zealand Res. Pract. 2007, 16, 3. [Google Scholar]
  24. Rohde, G.T.; Jooste, F.; Sadzik, E.; Henning, T. The Calibration and Use of HDM-IV Performance Models in a Pavement Management System. In Proceedings of the Fourth International Conference on Managing Pavements, Durban, South Africa, 17–21 May 1998. [Google Scholar]
  25. Pantuso, A.; Loprencipe, G.; Bonin, G.; Teltayev, B.B. Analysis of pavement condition survey data for effective implementation of a network level pavement management program for Kazakhstan. Sustainability 2019, 11, 901. [Google Scholar] [CrossRef] [Green Version]
  26. Tsunokawa, K.; Ul-Islam, R. Optimal pavement design and maintenance strategy for developing countries: An analysis using HDM-4. Int. J. Pavement Eng. 2003, 4, 193–208. [Google Scholar] [CrossRef]
  27. Zaabar, I.; Chatti, K. Calibration of HDM-4 models for estimating the effect of pavement roughness on fuel consumption for US conditions. Transp. Res. Rec. 2010, 2155, 105–116. [Google Scholar] [CrossRef]
  28. Smadi, O. Quantifying the Benefits of Pavement Management. In Proceedings of the 6th International Conference on Managing Pavements, Brisbane, Australia, 19–24 October 2004. [Google Scholar]
  29. Silva-Balaguera, A.; Leguizamón, O.D.; Valiente, L.L. Gestión de pavimentos basado en Sistemas de Información geográfica (SIG): Una revisión. Ing. Solidar. 2018, 14, 26. [Google Scholar]
  30. Ragnoli, A.; De Blasiis, M.R.; Di Benedetto, A. Pavement distress detection methods: A review. Infrastructures 2018, 3, 58. [Google Scholar] [CrossRef] [Green Version]
  31. Vera, I.; Thenoux, G.; Solminihac, H.; Echaveguren, T. Modelo de evaluación técnica del desempeño del mantenimiento de pavimentos flexibles. Rev. De La Construcción 2010, 9, 76–88. [Google Scholar] [CrossRef] [Green Version]
  32. Corro, S.; Prado, G.; Rangel, A. Diseño Estructural de Pavimentos Asfálticos, Incluyendo Carreteras de Altas Especificaciones. 1999. Available online: https://datosabiertos.unam.mx/CCUD_DOR_WS-war/resources/doil/4945567d96f6492b (accessed on 19 July 2019).
  33. Corro, S.; Castillo, G.; Ossa, A.; Hernández, A.; Mandujano, D.; Hernández, F.; Arizaga, S. Manual: Dispav-5, Versión 3.0. Actualización del Sistema Para el Diseño Estructural de Pavimentos Asfálticos, Incluyendo Carreteras de Altas Especificaciones. 2014. Available online: https://aplicaciones.iingen.unam.mx/consultasspii/DetallePublicacion.aspx?id=4972 (accessed on 19 July 2019).
  34. Valdés, G.; Pérez-Jiménez, F.; Martinez, A. Influencia de la temperatura y tipo de mezcla asfáltica en el comportamiento a fatiga de los pavimentos flexibles. Rev. De La Construcción 2012, 11, 87–100. [Google Scholar]
  35. Garnica Anguas, P.; Correa, Á. Conceptos Mecanicistas en Pavimentos; Instituto Mexicano del Transporte: Pedro Escobedo, Mexico, 2004.
  36. Team, B. Comprehensive Truck Size and Weight (TS&W) Study Phase 1-Synthesis; Federal Highway Administration, US Department of Transportation: Columbus, OH, USA, 1995.
  37. Lavin, P. Asphalt Pavements: A Practical Guide to Design, Production and Maintenance for Engineers and Architects; CRC Press: Boca Raton, FL, USA, 2003. [Google Scholar]
  38. Corro, S.; Magallanes, R. Instructivo Para Diseño Estructural de Pavimentos Flexibles Para Carreteras; Instituto de Ingeniería UNAM: Mexico City, Mexico, 1981.
  39. SCT; CMT. Características de los Materiales. 2008. Available online: https://normas.imt.mx/normativa/N-CMT-4-04-08.pdf (accessed on 6 June 2019).
  40. Al-Omari, B.; Darter, M.I. Relationships between International Roughness Index and Present Serviceability Rating. 1994. Available online: https://www.researchgate.net/publication/303142433_Relationships_between_international_roughness_index_and_present_serviceability_rating (accessed on 11 October 2019).
  41. Cole, M.; Geib, J. MnDOT’s Experience: Efforts to Improve Micro Surfacing Performance. Available online: https://www.dot.state.mn.us/materials/pavementpreservation/mndotexperiences/documents/EffortstoImproveMicroSurfacingPerformance.pdf (accessed on 20 September 2019).
  42. Morova, N.; Serín, S.; Terzi, S.; Saltan, M. Prediction of the pavement serviceability ratio of rigid highway pavements by artificial neural networks. İleri Teknol. Bilimleri Derg. 2013, 2, 12–25. [Google Scholar]
Figure 1. Centinela-La Rumorosa highway location. Source: Self-made.
Sustainability 12 00036 g001
Figure 2. Methodology flowchart.
Sustainability 12 00036 g002
Figure 3. Location of weather stations.
Sustainability 12 00036 g003
Figure 4. Highway surface conditions.
Sustainability 12 00036 g004
Figure 5. Structural conditions of the highway.
Sustainability 12 00036 g005
Figure 6. Highway traffic number of accidents comparative.
Sustainability 12 00036 g006
Figure 7. Highway performance improvement simulation.
Sustainability 12 00036 g007
Table 1. Criteria for pavement conditions classification according to the degree of deterioration.
Grade of DeteriorationCracking (%)Aggregate Shedding (%)N° Potholes per kmEdge Break (m² per km)Average Depth of Ruts (mm)Roughness (m per km)
New000000
Good010022
Fair51001054
Poor15205100156
Bad253050300258
Table 2. Identification of critical points on the highway.
SuperficialStructural
AscendingDescendingAscendingDescending
KMCriticalKMCriticalKMCriticalKMCritical
3IRI3IRI and RD2CBR HB1CBR HB
5IRI4IRI4CBR HB10CBR HB
6IRI5IRI7CBR HB12CBR HB
8IRI6IRI and RD10CBR HB14CBR HB
9IRI7PR17CBR HB18CBR HB
12IRI8IRI and RD20CBR HB20CBR HB
10IRI9IRI and RD22CBR HB33CBR HB
12IRI11IRI24CBR HB42CBR HB
17RD26IRI27CBR HB46CBR HB
18RD50IRI29CBR HB52CBRHB
43IRI51IRI31CBR HB54CBR HB
44IRI53IRI37CBR HB63CBR HB
45IRI54IRI38CBR HB
55IRI41CBR HB
56IRI45CBR HB
57IRI47CBR HB, SG
58IRI49CBR HB
59IRI52CBR HB
58CBR HB
59CBR HB
61CBR HB
Note: Critical points establish deficiencies in the California Bearing Ratio (CBR) in some of the layers that make up the pavement; HB corresponds to the hydraulic base; SG corresponds to the subgrade layer.
Table 3. Maintenance work carried out on the highway between 2014 and 2018.
AscendingDescending
YearMaintenance WorkChainage (km)YearMaintenance WorkChainage (km)
2015Overlay 40 mm18+000 to 23+0002015Overlay 40 mm30+008 to 22+000
2015Overlay 40 mm33+642 to 35+8502016Mill and replace 50 mm60+000 to 64+000
2015Overlay 40 mm43+000 to 49+0122016Mill and replace 50 mm60+000 to 56+000
2015Overlay 40 mm60+000 to 61+4052016Mill and replace 50 mm56+000 to 52+000
2016Mill and replace 50 mm20+000 to 29+0002016Mill and replace 50 mm40+500 to 36+000
2017Mill and replace 50 mm20+000 to 29+0002017Slurry seal23+000 to 19+000
2017Slurry seal29+000 to 41+6002017Mill and replace 50 mm19+000 to 18+000
2017Mill and replace 50 mm41+600 to 42+5002018Mill and replace 50 mm60+000 to 48+500
2017Slurry seal49+000 to 53+5002018Mill and replace 50 mm48+500 to 45+300
2017Overlay 40 mm53+500 to 55+5002018Mill and replace 50 mm44+000 to 40+500
2017Slurry seal55+500 to 60+8002018Mill and replace 50 mm40+500 to 36+000
2018Mill and replace 50 mm18+000 to 20+0002018Mill and replace 50 mm35+900 to 34+800
2018Slurry seal20+000 to 29+0002018Slurry seal34+800 to 32+000
2018Mill and replace 50 mm29+000 to 41+6002018Mill and replace 50 mm31+290 to 24+280
2018Slurry seal42+600 to 49+0002018Slurry seal24+500 to 23+300
2018Mill and replace 50 mm49+500 to 53+6002018Mill and replace 50 mm23+100 to 18+000

