Farmers’ Willingness to Pay for Improved Agricultural Technologies: Evidence from a Field Experiment in Tanzania


1
Natural Resources Institute, University of Greenwich, Chatham ME4 4TB, UK
2
International Food Policy Research Institute, 1201 Eye St, NW, Washington, DC 20005, USA
*
Author to whom correspondence should be addressed.
Sustainability 2020, 12(1), 216; https://0-doi-org.brum.beds.ac.uk/10.3390/su12010216
Submission received: 26 November 2019
/
Revised: 11 December 2019
/
Accepted: 22 December 2019
/
Published: 26 December 2019
Abstract
:Initiatives on the sustainable intensification of agriculture have introduced improved technologies tailored to farmers’ local conditions by trial demonstration with free provision of improved seeds and fertilizers. It is not clear, though, whether smallholder farmers would be willing to pay for these technologies, and what factors determine their informed demand. Using a contingent valuation experiment, combined with information at baseline among 400 households in Northern Tanzania, this study measured farmers’ willingness to pay (WTP) for hybrid maize seed and local inorganic fertilizer. Farmers’ WTP was estimated using a dichotomous contingent valuation with follow-up model. Results showed that the average WTP was 61% higher for hybrid maize seed, and 15% lower for inorganic fertilizer, than their respective average local market prices during the reference period, suggesting that farmers were willing to pay a premium for hybrid maize seed, while they did not seem to be interested in fertilizer purchase at current market price. Moreover, since improved access to extension services was found to positively affect farmers’ WTP, strengthening extension services could be a suitable policy intervention to increase farmers’ demand for improved technologies. On the other hand, farmers’ risk aversion was negatively correlated with WTP for both technologies. This result suggests that encouraging risk reduction options, such as agricultural insurance, could be a useful policy strategy for boosting farmers’ demand for improved agricultural technologies.
1. Introduction
Smallholder households in Sub-Saharan Africa (SSA) are overwhelmingly dependent on agriculture that has shown little productivity improvement until the last century. After a relatively stagnant growth of agricultural productivity over several decades [1,2], African agriculture has started showing early signs of productivity growth since early 2000 [3,4,5]. The slow agricultural growth is usually attributed to a relatively low use of improved technologies, including hybrid seeds and fertilizers [1,4]. Hence, a viable policy option to increase agricultural productivity is through the increased adoption of improved agricultural technologies, including hybrid seeds and fertilizers. Various programs have been initiated by governments and the donor community, aimed at sustainably intensifying the agricultural sector through the promotion of these technologies. From a development policy perspective, nonetheless, it would be important to know whether farmers are willing to pay for these technologies and, in addition, the factors that influence their willingness to pay (WTP). It would also be interesting to assess whether there are discrepancies between WTP and market price, an important factor that shapes the rate of technology diffusion.
Free or subsidized supply of agricultural inputs is among the policy options being pursued to increase technology adoption and spur agricultural growth in Africa. For example, more than 6 billion US dollars were committed to support the region’s smallholder agriculture sector as of 2009, with the largest share (43%) devoted to the direct provision of agricultural inputs or training [6]. In their synthesis of input subsidy programs across ten African countries, Jayne and Rashid [7] found expenditures on these programs to account for more than 30% of total public spending on agriculture. In hindsight, such input distribution by the public sector could compromise the incentive for the private sector to actively engage in the input supply market [8].
Like for most Sub-Saharan African countries, Tanzania’s economy is heavily dependent on agricultural production, with 80% of the population employed in agriculture and 31% of the country’s overall GDP derived from this sector [9]. Agriculture is predominantly smallholder-based, with a mean land holding capacity of around 1.2 hectares, where an average small family farm generates a gross income of about 5032 USD (in constant 2009 international dollar) per year [10]. In its effort to promote improved agricultural technologies, the Government of Tanzania subsidized the price of seeds and fertilizers annually from 2007 to 2014 through the National Agricultural Input Voucher Scheme (NAIVS) [11]. However, after the termination of NAIVS in 2014, only around one-third of the beneficiaries have continued to purchase fertilizers, showing the limited success of the program in ensuring sustained technology adoption [11]. As such, a better understanding of the drivers of adoption and farmers’ WTP is essential to identify appropriate policy interventions for encouraging adoption.
Risk perception is among the factors that discourage farmers’ adoption of new technologies [12,13,14,15,16]. Starting with Binswanger’s research [17,18], many studies [15,19,20,21,22,23] have empirically measured risk aversion through field experiments and found farmers to be generally risk averse. However, there is a dearth of empirical evidence on the importance of producers’ risk aversion in influencing farmers’ WTP.
This study elicited farmers’ WTP for improved seed and fertilizer among smallholders, through a stated preference-based contingent valuation (CV) experiment conduced in 2015. We specifically investigated the determinants of WTP for hybrid maize seed and inorganic fertilizer, including the role of farmers’ risk aversion. The empirical analysis combined primary household survey data and WTP elicitation using a CV experiment in the Babati district of Northern Tanzania. While most CV studies in developing countries have focused on consumer preferences [24], our work focused on producers’ preferences in a developing country context, contributing to limited existing applications of CV in these settings.
This paper unfolds in the following way. Section 2 provides a brief review of the literature on demand for agricultural technologies and the CV approach. Section 3 describes our experimental design, technologies, and data. The econometric framework is presented in Section 4. Empirical results are discussed in Section 5. Section 6 concludes with some development policy implications.
2. Willingness to Pay and Contingent Valuation of Agricultural Technology
In recent years, many research-for-development projects have been promoting improved seeds and fertilizers for agricultural intensification. These projects promote agricultural productivity from available land resources without impacting the environment. The ongoing CGIAR center-led projects, such as the Cereal Systems Initiative for South Asia, and the Africa Research in Sustainable Intensification for the Next Generation are two such examples. An important question in this regard is the extent to which farmers are willing to pay for these technologies. WTP is usually defined as the maximum amount that an individual would be willing to pay for a good or service without losing their utility [25,26]. Farmers’ WTP may depend on many interrelated factors, such as socio-economic and demographic characteristics, access to market and infrastructure, quality of available inputs, and individual risk preference. Approaches for assessing WTP can broadly be categorized into two categories—revealed and stated preference. In the revealed preference approach, participants bid real money for real products, and hence can provide unbiased estimates of WTP, but such market data are hardly available. In the stated preference approach, WTP is elicited based on a hypothetical situation. Hence, and in spite of being more convenient, stated preference approaches are prone to hypothetical bias. One of the most important WTP valuation methods is CV, which involves field experiments and survey data collection to elicit the stated preferences of participants. Other important stated preference approaches are discrete choice experiments (DCE), where preferences are elicited from responses to hypothetical alternatives, and experimental auctions, where participants’ bids are incentive-compatible.
In the simplest CV form, with the dichotomous choice model, an individual is asked if they are willing to pay a stated amount for a product or service. Nonetheless, with this approach, the individual provides little information with respect to their WTP, implying that relatively large samples are needed for an accurate estimation of WTP. Hanemann et al. [25] suggested an alternative strategy to the simple CV to improve the efficiency of the estimation, known as dichotomous CV, with follow-up questions or a double-bounded (DB) CV model. Unlike the simple CV, the DB CV involves two questions—the first on whether the respondent is willing to pay a stated amount for a service or product; and the second about their WTP for a higher (lower) amount if they are (are not) willing to pay the initial bid. Within this framework, the true WTP lies between the two offered bid prices if either response is positive, between the second bid and the limit of the WTP if both responses are positive, and below the second bid if both responses are negative.
Another improvement, initially recommended by Cooper [27] and Kanninen [26] and implemented in several studies e.g., [28,29], is that the random variation of initial bid prices among the respondents can eliminate bias that may result from the suggestion of a specific initial bid price. The main criticism of the simple CV is called hypothetical bias, which means that people tend to overstate the amount they would be ideally willing to pay for a good as compared to when they actually pay for it. Cummings and Taylor [30] introduced an alternative approach called a cheap talk script, which clarifies the problem of this hypothetical bias to participants prior to administration of the valuation question. However, some literature [31,32] show that the cheap talk approach does not reduce willingness to pay for knowledgeable participants. In this study, we employ the DB CV and randomly assign initial bid prices to minimize bias.
Existing evidence shows that when markets are unregulated and unmonitored, as is mostly the case in many developing countries, markets for seed and fertilizer typically fail due to asymmetric information [33]. Bold et al. [33] found significant quality uncertainty of fertilizers and hybrid maize seeds in Ugandan market, which they called a “market for lemons” problem, akin to low-quality used cars, which were called with the same term, initially coined by Akerlof [34]. Their results suggested that 30% of nutrients were missing in fertilizers and that locally sold hybrid maize seed contained less than 50% authentic seeds. The supply of low-quality inputs in such markets can reduce farmers’ WTP for (and return from) inputs. In the presence of market failures, attributes of inputs as well as farmer adoption decisions will affect WTP, thereby making the revealed preference approach the preferred analytical method for measuring WTP.
In our experiment, the studied farmers receive hybrid maize seeds and chemical fertilizers along with training to gain knowledge and experience in the season prior to the implementation of the WTP experiment. Since the quality of seeds and fertilizers is guaranteed, and our objective is to elicit farmers’ WTP for these authentic technologies, the stated preference approach using DB CV method is more appropriate compared to a revealed preference approach. Although the stated preference approach has been criticized for embedding effect, e.g., [35], the bias is much lower when responses are based on marketable goods, as in our case, than on non-marketable goods.
3. Study Design, Technologies, and Data
Data for this study were collected in the Babati district in Northern Tanzania, where a systems-based agricultural research for development program, called Africa Research In Sustainable Intensification for the Next Generation (Africa RISING https://africa-rising.net/), has been implemented since early 2012. As part of a broader research initiative aimed at evaluating the Africa RISING program, the authors conducted a CV study for hybrid maize seed and inorganic fertilizer in three villages—Long, Sabilo, and Seloto—that represent different agro-ecological zones (mapped in Figure 1).
Figure 2 shows a schematic summary of the study design, involving 403 study households that attended a demonstration day in June 2013. Half of this sample was randomly assigned to a group eligible to receive a coupon, while the other half was randomly assigned to a control group, not receiving a coupon. In October 2013, the coupon group was provided with one 50 kg bag of a local blend of inorganic fertilizer, Minjingu mazao (hereafter fertilizer), and two 2 kg bags of hybrid maize seeds, Pannar 691 and Seedco 627 varieties, as recommended by the Africa RISING researchers. These inputs were distributed for free and were deemed enough to cultivate half an acre of land. At the time of input distribution, the cost of the seeds was 8000 Tanzanian Shillings (TSH) or about 3.6 USD (per 2 kg bag), while that of fertilizers was 32,000 TSH, or about 14.5 USD (per 50 kg bag).
A baseline survey was conducted in January–March 2014 to collect detailed socioeconomic and agricultural data from the studied households. In August–September 2015, a follow-up survey was conducted to elicit WTP for the two inputs. The non-coupon farmers were presented with a short description of the technologies. The unique feature of our experiment was the random distribution of coupons for hybrid maize seed and fertilizer. We anticipated that the coupons would ease possible financial constraints farmers might have had by motivating them to use the technologies.
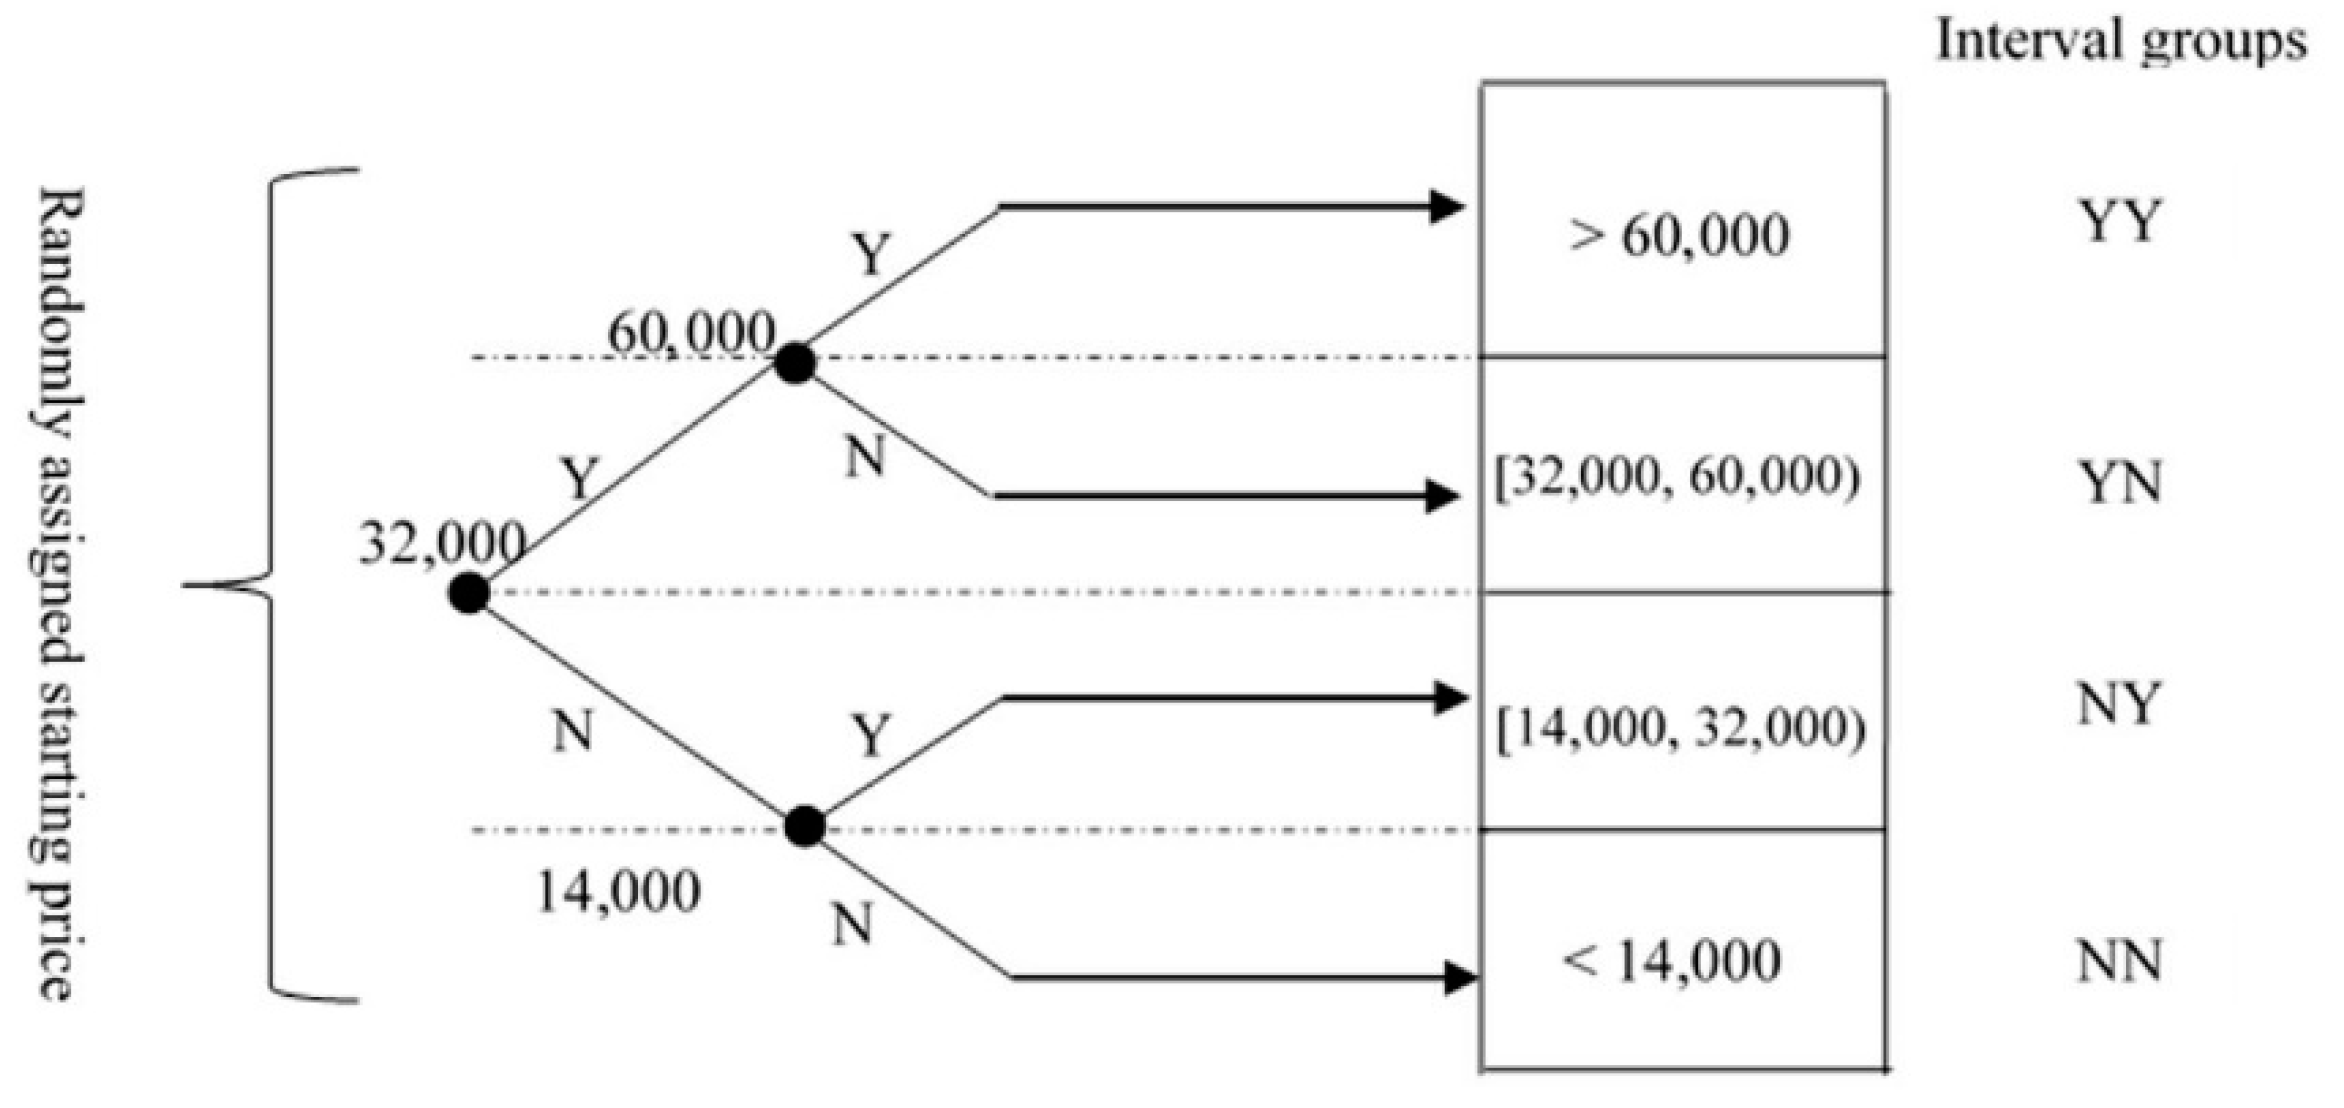
Careful attention was given to questionnaire design and its correct field implementation, both being fundamental elements of a DB CV to ensure accurate economic valuation of the underlying good. Since an unrealistic bid price range can lead to a starting point bias in the DB CV approach [36], we proposed a realistic bid range. For both inputs, five initial bid prices—prevailing market price, two set of prices above and below the market price—were randomly assigned to each participating respondent. As noted before, random variation in bid prices among survey respondents can significantly enhance the efficiency of CV estimation [26,27]. Survey respondents were either the household head or the spouse—whoever was the main agricultural production decision maker. Response to the initial bid price was coded as “Yes”, “No”, or “Not sure”. In the case of a “Not sure” response, the respondent was offered a different initial bid price. When the response was “Yes” (“No”), the respondent was asked a follow-up WTP question with a higher (lower) bid price than the pre-determined initial bid prices. Figure 3 describes the structure of the DB CV design for fertilizer with an initial bid price of 32,000 TSH (about 14.5 USD) per 50 kg bag. Using this structure, participants’ unobserved WTP can be narrowed down to one of the four intervals depicted in Figure 3.
Since individual risk aversion also influences WTP and adoption decisions, we also elicited farmers’ risk aversion preferences—usually varying with individual characteristics—using field-level experiments with real monetary incentives [15,17,18,19,20,21,22,23]. Respondents were given 4000 TSH (about 1.8 USD)—the equivalent of one day’s agricultural wage—as a token of appreciation for their participation, and were asked if they would like to use it to bet on one of five lotteries with varying risks and returns. Details on the risk preference elicitation experiment are provided in Appendix A.
4. Econometric Framework
We assumed that the true WTP for an input could be modeled using the linear function in Equation (1):
where is a vector of explanatory variables for respondent - or household -level socio-economic and demographic characteristics, is the conformable vector of parameters, and is an independently and identically distributed normal error term with mean zero and variance . WTP was not directly observed, but a range of WTP could be identified by using survey responses.
Depending on the answer to the initial bid, a second bid was given, which was higher than the initial bid for a “Yes” response, and lower for a “No” response. Following [25], we called the initial bid amount and the second one . The WTP for each household would then be in one of the following four groups (G):
- (G1)
- , if the individual answers yes to the first question and no to the second;
- (G2)
- , if the individual answers yes both to the first and second questions;
- (G3)
- , if the individual answers no to the first question and yes to the second;
- (G4)
- , if the individual answers no both to the first and second questions.
The log-likelihood function of the WTP model was:
where is the standard normal cumulative distribution function. Using maximum likelihood estimation, we estimated separate interval-censored models for both hybrid maize and fertilizer [29]. We directly estimated and , from which we could indirectly estimate WTP. Average WTP could be obtained by , where is the vector of parameter estimates. The underlying assumptions behind this model are normality of the error term and identical valuation functions behind both the initial and follow-up answers. Cameron and Quiggin [37] pointed out that that the identical valuation functions assumption may fail in the case of initial bid price bias in the responses. In our case, the random selection of the initial bid prices rendered the valuation functions identical. We implemented the estimation in the Stata software package [29].
Among the covariates, household-specific characteristics, as well as access to market and infrastructure, served as key determinants of household demand for new technologies. We included individual risk aversion as an additional explanatory variable because, as discussed in the introduction, this factor has long been recognized as a WTP constraint and barrier to technology adoption. Also, the omission of risk preferences could bias the coefficient estimates of other covariates, such as education and wealth, which could potentially be correlated with individual risk preference. Since individual risk aversion is associated with barrier to technology adoption, its effect on WTP was expected to be negative, given that farmers in low-income settings are mostly uninsured. Households’ wealth, education, awareness, and market access were all expected to be positively correlated.
5. Empirical Results
Table 1 provides the summary statistics of key socio-economic characteristics of WTP respondents and their households. The average household size of the sample was 6.7, whereas the average number of working-age members in a household was 3.5. Only 11% households in the sample were female-headed. The maximum adult years of education in a household was 9.7 years. Average household land holding was about 1.5 ha, with a yield of main staple (maize) amounting to about 3.4 ton·ha−1.
The variable “poor wealth” was an indicator that took a value of one if the household was in the bottom two quartiles of total wealth index. We constructed a household-level aggregate wealth index using housing condition (condition of the dwelling unit, such as materials used for the wall, floor, and roof, source of drinking water, type of toilet, etc.), durable non-agricultural assets (including radio, television, land-line phone, mobile phone, bicycle, motorbike), durable agricultural assets (including sprayer, tractor, power tiller ox-ridger), and livestock ownership (cattle, equines, goats, sheep, chicken). We computed the aggregate wealth index through factorial analysis using the principle component factor (PCF) method. The higher the household wealth index, the wealthier the household. About 74% of the households in the sample were poor by this measure. Improved access to roads and markets, and better access to seed suppliers, were indicator variables that took the value of one if the household was in the bottom two quartiles of the indices of access to roads and markets, and travel time to seed supplier, respectively. About 50% of households in the sample reported improved access to roads, markets, and seed suppliers. Improved access to extension services was an indicator on whether the household had any contact with agricultural development/extension agents at least once during the last cropping season. Only 20% of the sample had improved access to extension services.
Since one of the key objectives of this study was to investigate if individual risk aversion influences farmers’ WTP, we ran an experiment to elicit farmer risk preferences. We used the expected utility framework and followed Binswanger’ method [17,18] to design a game for eliciting individual risk aversion. The description of risk preference elicitation experiment, along with the estimation of constant relative risk aversion (CRRA) coefficients are provided in the Appendix A, with Table A1 summarizing the risk preference classification. Table A1 reports that about half of the sample showed extreme risk aversion, whereas 5.5% showed risk-seeking behavior.
A summary of WTP bid prices and responses is presented in Table 2. The mean initial bid prices for a 2 kg bag of hybrid maize seed and a 50 kg bag of fertilizer were 8,945 TSH and 32,018 TSH, respectively. About 74% and 42% responded yes to the first contingent valuation question for hybrid maize and fertilizer, respectively, suggesting a higher WTP for hybrid maize than fertilizer.
The average (endogenous) bid prices for the second contingent valuation question were 12,178 TSH for hybrid maize and 33,728 TSH for fertilizer. About 57% and 36% of the respondents answered yes to the second contingent valuation question for hybrid maize and fertilizer, respectively. As expected, the share of respondents willing to accept the bid generally decreased with the bid value. Respondents answering yes to both the first and the second WTP questions were significantly more for hybrid maize (32%) than for fertilizer (10%).
Finally, WTP estimates are summarized in Table 3. The average WTP for a 2 kg bag of hybrid maize seed was 12,893 TSH (about 5.8 USD), 61% higher than the prevailing local market price, while the average WTP for a 50 kg bag of fertilizer was 27,086 TSH (about 12.3 USD), 15% lower than the prevailing market price. Access to improved extension services influenced farmers’ WTP positively for both hybrid maize seed and inorganic fertilizer, whereas farmer risk aversion preferences were negatively and significantly correlated to WTP for both inputs. Females on average were willing to pay relatively less for fertilizer than their male counterparts, while male WTP was lower for hybrid maize seed than female. Household characteristics, such as household size, land size, maximum years of education, and wealth, did not have a significant effect on WTP for both the technologies. This is consistent with the findings of De Groote et al. [38], who did not find any significant association of these household characteristics with consumers’ WTP for maize grain quality. Lusk [32] also found an insignificant association of income and education with WTP in his analysis of preference for golden rice. However, studies such as Kimenju and De Groote [39] and Krishna and Quaim [28] found significant and positive influences of income and education on consumers’ WTP. From Table 3 we see that although the coefficients associated with land size and wealth (poor) are not statistically significant, they indeed have the expected sign for both hybrid seed and fertilizer. Table 3 also shows that although statistically insignificant, the estimated parameter for receiving coupon is positive. Some of the statistical significance may have to do with the relatively small sample we worked with.
6. Conclusions and Implications
Using a contingent valuation experiment and primary household survey data from Northern Tanzania, this study estimated farmers’ WTP for hybrid maize seed and local inorganic fertilizer. We used a double bounded CV, where study participants were asked a follow-up bid that was higher (lower) than the initial bid if the latter was accepted (rejected). The average WTP was found to be 61% higher for hybrid maize seed and 15% lower for inorganic fertilizer compared to their average local market prices during the reference period. Access to improved extension services was found to be positively (and significantly) correlated with farmers’ WTP, whereas the opposite occurred for farmers’ risk aversion preferences.
Empirical results suggested that, on average, farmers were willing to pay a premium for hybrid maize seed, while they did not seem to be interested in fertilizer purchase at current market price. This was consistent with the relatively high adoption of hybrid maize and limited adoption of inorganic fertilizer in the area. Since household interaction with agricultural extension agents positively affected WTP, strengthening extension services could be a suitable policy intervention to increase farmers’ demand for improved agricultural technologies. While the promotion of sustainable intensification projects that offer free provision of inputs may increase the likelihood of their adoption, assessing the implication of farmers’ risk preferences is paramount. Given that the latter affected WTP negatively, encouraging risk reduction options, such as agricultural insurance, to boost farmer demand for improved agricultural technologies would be an additional suitable policy recommendation. However, the relationship between risk preferences and farmers’ WTP may be confounded by other unobservable characteristics, such as time preferences and individual ability, not controlled for in our framework and to which further research should be devoted.
The estimated WTP values offer interesting market information signaling farmers’ acceptance of technologies. While an estimated WTP for hybrid maize seed higher than market price suggest the potential for increased adoption of this input, the promotion of inorganic fertilizer may require interventions to reduce input costs to the farmers, including through targeted subsidies. Given the high potential for heavy subsidies to distort the relative cost of inputs, resulting in inefficient allocation, further research is needed to generate evidence on the design and unintended consequences of such interventions, including systematic targeting of specific farmer groups and/or crops. Although the common criticism of upward bias in contingent valuation for tradable goods is less serious than for non-tradable goods, further research is also recommended to compare our contingent valuation WTP measures to the choice-theoretic marginal treatment effect parameters of WTP for farmers still indecisive on technology adoption.
Author Contributions
Conceptualization and design of experiments, A.S., C.A., and B.H.; questionnaire development and data collection, A.S., C.A., and B.H.; manuscript drafting, model and data analysis, A.S.; review and editing of the manuscript, C.A and B.H. All authors have read and agreed to the published version of the manuscript.
Funding
This research was funded by United States Agency for International Development (USAID), and CGIAR Research Program on Policies, Institutions, and Markets (PIM), led by the International Food Policy Research Institute (IFPRI).
Acknowledgments
This research was supported by Africa Research in Sustainable Intensification for the Next Generation (Africa RISING) project. We greatly appreciate contribution from Mateete Bekunda and Festo Ngulu for their support on field work for this study. The opinions expressed in this paper do not necessarily reflect the views of our donor or partners. The contents are the sole responsibility of the authors and do not necessarily reflect the views of University of Greenwich, USAID, the United States Government, PIM, IFPRI, or CGIAR.
Conflicts of Interest
The authors declare no conflict of interest
Appendix A
Description of Risk Preference Elicitation Experiment
Binswanger [17,18] was the first to measure risk aversion using experimental design, taking the case of rural India. He conducted the experiment with farmers by asking them to elicit choices between lotteries involving a 50 percent chance of yielding a high or a low payoff. More recently, Holt and Laury [19], Miyata [20], Vargas-Hill [21], Andersen et al. [40], Chantarat at al. [22], Tanaka et al. [23], and Liu [15] have empirically measured farmers’ aversion to risk through similar field experiments.
At the end of the WTP contingent valuation survey, participants were given 4000 TSH—the equivalent of one day of wages in the area—as a token of appreciation for their two-hour survey participation. Households were provided with the option of either receiving 4000 TSH on the spot or playing one among the following five lotteries: (1) 4400 TSH if head or 3600 TSH if tails; (2) 5200 TSH if head or 2800 TSH if tails; (3) 6000 TSH if head or 2000 TSH if tails; (4) 7200 TSH if head or 800 TSH if tails; and (5) 8000 TSH if head or 0 TSH if tails. Once a respondent chose a lottery option a coin was tossed, and they received the payoffs indicated by heads and tails.
Following [17,22], we calculated six categories of risk aversion based on households’ choices. We estimated the range of relative risk aversion coefficients for each of the six lottery choices under the assumption of constant relative risk aversion (CRRA) utility function, given below:
where utility function , , and . R is the CRRA coefficient and represents the probability of possible payoff P. The range of R was calculated for each lottery that provided the same utility for the associated payoffs: the upper (lower) bound was calculated as the value of R that generated the same utility level for the payoffs associated with the selected lottery and the less (more) risky adjacent alternative. Measures of CRRA were then calculated by the geometric mean of the range of R. We assigned a value of zero to the CRRA value for game 5 (risk seekers) and a value equal to one to the lottery choice #0 to represent extreme risk aversion class (Table A1).

Table A1.
Summary of risk aversion elicitation set-up.
| Lottery Choice | High Payoff | Low Payoff | CRRA Ranges | Geometric Mean CRRA | Risk Aversion Class | Percent HH |
|---|---|---|---|---|---|---|
| 0 | 4000 | 4000 | R > 0.99 | 1.0 | Extreme | 52.25 |
| 1 | 4400 | 3600 | 0.55 < R < 0.99 | 0.7 | Severe | 24.00 |
| 2 | 5200 | 2800 | 0.32 < R < 0.55 | 0.4 | Intermediate | 7.00 |
| 3 | 6000 | 2000 | 0.21 < R < 0.32 | 0.3 | Moderate | 8.75 |
| 4 | 7200 | 800 | 0 < R < 0.21 | 0.1 | Low | 2.50 |
| 5 | 8000 | 0 | R < 0 | 0.0 | Risk seeking | 5.50 |
Note: Upper limit of CRRA was assumed to be 1.
The important aspect of the experiment was that the participants received actual monetary payments and the payoff was significant relative to the average wage in the area. Several trial games were first played, without providing actual payoffs, and then the lottery game was played for real money. One frequent criticism of this type of experiment is that the measurement of risk preference is biased because participants do not face actual loss. In his experiments in India, Binswanger [18] tested this hypothesis by giving cash to the participants some days before the experiment, so that when they played the lottery game, they put their money at risk and found the equivalence between opportunity loss and real loss. In more recent literature, risk preference coefficients were estimated using structural models. Antle [41] developed a moment-based approach to estimate risk aversion parameters for agricultural producers. Being more direct and not subject to model or estimation assumptions, lottery experiments to elicit risk preferences are still deemed reliable.
References
- Evenson, R.E.; Gollin, D. Assessing the impact of the green revolution, 1960 to 2000. Science 2003, 300, 758–762. [Google Scholar] [CrossRef] [PubMed] [Green Version]
- Jama, B.; Pizarro, G. Agriculture in Africa: Strategies to improve and sustain smallholder production systems. Ann. N. Y. Acad. Sci. 2008, 1136, 218–232. [Google Scholar] [CrossRef] [PubMed]
- Barrett, C.B.; Christian, P.; Shiferaw, B.A. The structural transformation of African agriculture and rural spaces: Introduction to a special section. Agric. Econ. 2017, 48, 5–10. [Google Scholar] [CrossRef]
- Barrett, C.B.; Christiaensen, L.; Sheahan, M.; Shimeles, A. On the structural transformation of rural Africa. J. Afr. Econ. 2017, 26, i11–i35. [Google Scholar] [CrossRef] [Green Version]
- Diao, X.; Harttgen, K.; McMillan, M. The changing structure of Africa’s economies. World Bank Econ. Rev. 2017, 31, 412–433. [Google Scholar] [CrossRef] [Green Version]
- FSG. Smallholder Farmer Development: International Donor Funding Trends. A Trend Analysis of the Corporate Leadership Coalition for Smallholder Farmer Livelihoods; Working Paper; FSG Social Impact Advisors: Madrid, Spain, 2010. [Google Scholar]
- Jayne, T.S.; Rachid, S. Input subsidy programs in sub-Saharan Africa: A synthesis of recent evidence. Agric. Econ. 2013, 44, 547–562. [Google Scholar] [CrossRef]
- Kelly, V.; Adesina, A.A.; Gordon, A. Expanding access to agricultural inputs in Africa: A review of recent market development experience. Food Policy 2003, 28, 379–404. [Google Scholar] [CrossRef]
- World Bank. World Development Indicators (WDI) 2018; World Bank: Washington, DC, USA, 2018. [Google Scholar]
- FAO Smallholders Data Portrait. Available online: www.fao.org/family-farming/data-sources/dataportrait/farm-size/en (accessed on 12 August 2018).
- World Bank. Tanzania Public Expenditure Review: National Agricultural Input Voucher Scheme (NAIVS); World Bank: Washington, DC, USA, 2014. [Google Scholar]
- Sandmo, A. On the theory of the competitive firm under price uncertainty. Am. Econ. Rev. 1971, 61, 65–73. [Google Scholar]
- Feder, G. Farm size, risk aversion and the adoption of new technology under uncertainty. Oxf. Econ. Pap. 1980, 32, 263–283. [Google Scholar] [CrossRef]
- Feder, G.; Just, R.; Zilberman, D. Adoption of agricultural innovations in developing countries: A survey. Econ. Dev. Cult. Chang. 1985, 33, 255–298. [Google Scholar] [CrossRef] [Green Version]
- Liu, E. Time to change what to sow: Risk preferences and technology adoption decisions of cotton farmers in China. Rev. Econ. Stat. 2013, 95, 1386–1403. [Google Scholar] [CrossRef] [Green Version]
- Ward, P.S.; Singh, V. Using field experiments to elicit risk and ambiguity preferences: Behavioural factors and the adoption of new agricultural technologies in rural India. J. Dev. Stud. 2015, 51, 707–724. [Google Scholar] [CrossRef]
- Binswanger, H. Attitudes toward risk: Experimental measurement in rural India. Am. J. Agric. Econ. 1980, 62, 395–407. [Google Scholar] [CrossRef] [Green Version]
- Binswanger, H. Attitudes toward risk: Theoretical implications of an experiment in rural India. Am. J. Agric. Econ. 1981, 91, 687–890. [Google Scholar] [CrossRef]
- Holt, C.; Laury, S. Risk aversion and incentive effects. Am. Econ. Rev. 2002, 92, 1644–1655. [Google Scholar] [CrossRef] [Green Version]
- Miyata, S. Household’s risk attitudes in Indonesian villages. Appl. Econ. 2003, 35, 573–583. [Google Scholar] [CrossRef]
- Vargas-Hill, R. Using stated preferences and beliefs to identify the impact of risk on poor households. J. Dev. Stud. 2009, 45, 151–171. [Google Scholar] [CrossRef]
- Chantarat, S.; Mude, A.; Barrett, C. Willingness to Pay for Index Based Livestock Insurance: Results from a Field Experiment in Northern Kenya; Cornell University: Ithaca, NY, USA, 2009. [Google Scholar]
- Tanaka, T.; Camerer, C.F.; Nguyen, Q. Risk and time preferences: Linking experimental and household survey data from Vietnam. Am. Econ. Rev. 2010, 100, 557–571. [Google Scholar] [CrossRef] [Green Version]
- Durand-Morat, A.; Wailes, E.J.; Nayga, R.M. Challenges of conducting contingent valuation studies in developing countries. Am. J. Agric. Econ. 2016, 98, 597–609. [Google Scholar] [CrossRef]
- Hanemann, M.; Loomis, J.; Kanninen, B. Statistical efficiency of double-bounded dichotomous choice contingent valuation. Am. J. Agric. Econ. 1991, 73, 1255–1263. [Google Scholar] [CrossRef]
- Kanninen, B. Optimal experimental design for double-bounded dichotomous choice contingent valuation. Land Econ. 1993, 69, 138–146. [Google Scholar] [CrossRef]
- Cooper, J. Optimal bid selection for dichotomous choice contingent valuation surveys. J. Environ. Econ. Manag. 1993, 24, 25–40. [Google Scholar] [CrossRef]
- Krishna, V.V.; Qaim, M. Consumer attitudes toward GM food and pesticide residues in India. Appl. Econ. Perspect. Policy 2008, 30, 233–251. [Google Scholar] [CrossRef]
- Lopez-Feldman, A. Introduction to Contingent Valuation using Stata. MPRA Paper No. 41018. Available online: https://mpra.ub.uni-muenchen.de/41018/ (accessed on 12 February 2015).
- Cummings, R.G.; Taylor, L.O. Unbiased value estimates for environmental goods: A cheap talk design for the contingent valuation method. Am. Econ. Rev. 1999, 89, 649–665. [Google Scholar] [CrossRef]
- Lists, J.A. Do explicit warnings eliminate the hypothetical bias in elicitation procedures? evidence from field auctions for sports cards. Am. Econ. Rev. 2001, 91, 1498–1507. [Google Scholar] [CrossRef] [Green Version]
- Lusk, J.L. Effects of cheap talk on consumer willingness-to-pay for golden rice. Am. J. Agric. Econ. 2003, 85, 840–856. [Google Scholar] [CrossRef]
- Bold, T.; Kaizzi, K.C.; Svensson, J.; Yanagizawa-Drott, D. Lemon technologies and adoption: Measurement, theory, and evidence from agricultural markets in Uganda. Q. J. Econ. 2017, 132, 1055–1100. [Google Scholar] [CrossRef] [Green Version]
- Akerlof, G.A. The market for ‘lemons’: Quality under uncertainty and the market Mechanism. Q. J. Econ. 1970, 84, 488–500. [Google Scholar] [CrossRef]
- Diamond, P.A.; Hausman, J.A. Contingent valuation: Is some number better than no number? J. Econ. Perspect. 1994, 8, 45–64. [Google Scholar] [CrossRef]
- Boyle, K.J.; Bishop, R.C.; Welsh, M.P. Starting point bias in contingent valuation bidding games. Land Econ. 1985, 61, 188–194. [Google Scholar] [CrossRef]
- Cameron, T.; Quiggin, J. Estimation using contingent valuation data from a dichotomous choice with follow-up questionnaire. J. Environ. Econ. Manag. 1994, 27, 218–234. [Google Scholar] [CrossRef]
- De Groote, H.; Narrod, C.; Kimenju, S.C.; Bett, C.; Scott, R.P.B.; Tiongco, M.M.; Gitonga, Z.M. Measuring rural consumers’ willingness to pay for quality labels using experimental auctions: The case of aflatoxin-free maize in Kenya. Agric. Econ. 2016, 47, 33–45. [Google Scholar] [CrossRef]
- Kimenju, S.C.; de Groote, H. Consumer willingness to pay for genetically modified food in Kenya. Agric. Econ. 2008, 38, 35–46. [Google Scholar] [CrossRef]
- Andersen, S.; Harrison, G.W.; Lau, M.I.; Rutstrom, E.E. Eliciting risk and time preferences. Econometrica 2008, 76, 583–618. [Google Scholar] [CrossRef] [Green Version]
- Antle, J.M. Econometric estimation of producers risk attitudes. Am. J. Agric. Econ. 1987, 69, 509–522. [Google Scholar] [CrossRef]
Figure 1.
Babati study area with agro-ecological layers.

Figure 2.
Study design.

Figure 3.
Structure of double-bounded contingent valuation (CV) experiment design for fertilizer. Note: Y = Yes, N = No.
Figure 3.
Structure of double-bounded contingent valuation (CV) experiment design for fertilizer. Note: Y = Yes, N = No.

Table 1.
Descriptive statistics of the variables in the model.
| Variables | Mean | Std. Dev. | Min | Max |
|---|---|---|---|---|
| Household size (number of members in a household) | 6.67 | 2.81 | 1 | 17 |
| Maximum adult years of education (years) | 9.69 | 3.41 | 0 | 21 |
| Female head of household (%) | 11 | 0.31 | 0 | 1 |
| Number of working age members (no.) | 3.5 | 1.85 | 0 | 11 |
| Land operated (ha) | 1.44 | 1.20 | 0.00 | 12.95 |
| Poor wealth (%) | 74 | 0.44 | 0 | 1 |
| Received coupon for seed and fertilizer (%) | 40 | 0.49 | 0 | 1 |
| Average maize yield (tons/ha) | 3.38 | 1.31 | 0.50 | 10.19 |
| Improved access to extension services (%) | 20 | 0.40 | 0 | 1 |
| Improved access to roads and markets (%) | 50 | 0.50 | 0 | 1 |
| Improved access to seed supplier (%) | 51 | 0.50 | 0 | 1 |
| Male WTP respondent (%) | 61 | 0.49 | 0 | 1 |
| Age of WTP respondent (years) | 44.55 | 12.74 | 18 | 90 |
| Constant relative risk aversion (CRRA) | 0.75 | 0.32 | 0 | 1 |
Table 2.
Willingness to pay (WTP) bid prices and responses.
| WTP Bid Prices and Responses | Mean | Std. Dev. |
|---|---|---|
| Hybrid Maize Seed | ||
| Exogenous bid price for the first WTP question (WTP_1st) (TSH) | 8945.00 | 3645.57 |
| Response to WTP_1st is YES (%) | 0.74 | 0.44 |
| Endogenous bid price for the second WTP question (WTP_2nd) (TSH) | 12,178.00 | 4399.63 |
| Response to WTP_2nd is YES (%) | 0.57 | 0.50 |
| Response to WTP_1st = YES; Response to WTP_2nd = YES (%) | 0.32 | 0.47 |
| Response to WTP_1st = YES; Response to WTP_2nd = NO (%) | 0.42 | 0.49 |
| Response to WTP_1st = NO; Response to WTP_2nd = YES (%) | 0.24 | 0.43 |
| Response to WTP_1st = NO; Response to WTP_2nd = NO (%) | 0.02 | 0.13 |
| Inorganic Fertilizer | ||
| Exogenous bid price for the first WTP question (WTP_1st) (TSH) | 32,017.50 | 11,858.70 |
| Response to WTP_1st is YES (%) | 0.42 | 0.49 |
| Endogenous bid price for the second WTP question (WTP_2nd) (TSH) | 33,727.50 | 21,236.07 |
| Response to WTP_2nd is YES (%) | 0.36 | 0.48 |
| Response to WTP_1st = YES; Response to WTP_2nd = YES (%) | 0.10 | 0.30 |
| Response to WTP_1st = YES; Response to WTP_2nd = NO (%) | 0.33 | 0.47 |
| Response to WTP_1st = NO; Response to WTP_2nd = YES (%) | 0.26 | 0.44 |
| Response to WTP_1st = NO; Response to WTP_2nd = NO (%) | 0.32 | 0.47 |
| Observations | 400 |
Table 3.
Estimation of WTP for hybrid maize seed and fertilizer.
| Hybrid Maize Seed | Fertilizer | |||
|---|---|---|---|---|
| Coef. | Se | Coef. | Se | |
| Household size | 74.613 | 114.915 | 585.370 | 602.806 |
| Maximum adult years of education | 33.031 | 87.012 | 659.873 | 457.718 |
| Female head of household | −301.041 | 880.276 | −10,479.906 ** | 4730.030 |
| Number of working age members | −74.904 | 192.866 | −1120.359 | 1023.494 |
| Land operated (ha) | 313.561 | 261.363 | 109.658 | 1224.519 |
| Poor wealth | −293.649 | 643.712 | −4402.484 | 3353.576 |
| Received coupon for seed and fertilizer | 626.124 | 520.078 | 2000.197 | 2709.407 |
| Average maize yield (tons/ha) | −3.213 | 200.028 | 1279.580 | 1052.284 |
| Improved access to extension services | 1401.618 ** | 641.806 | 8599.780 *** | 3308.499 |
| Improved access to roads and markets | 270.388 | 536.085 | −997.427 | 2808.005 |
| Improved access to seed supplier | 293.161 | 535.485 | −641.729 | 2799.271 |
| Male WTP respondent | −961.569 * | 544.447 | 342.103 | 2846.452 |
| Age of WTP respondent (years) | −16.662 | 20.676 | 79.348 | 110.429 |
| Constant Relative Risk Aversion (CRRA) | −1978.861 ** | 809.170 | −10,272.355 ** | 4228.701 |
| Constant | 14,161.764 *** | 1811.796 | 22,892.143 ** | 9402.048 |
| Sigma | 4333.830 *** | 216.599 | 23,763.570 *** | 1253.986 |
| Number of observations | 395 | 395 | ||
| Log-Likelihood | −373.63 | −496.40 | ||
| chi2 | 22.525 | 31.097 | ||
| p | 0.068 | 0.005 | ||
| Average willingness to pay | 12,893.84 *** | 259.916 | 27,086.41 *** | 1367.243 |
Note: *** p < 0.01, ** p < 0.05, * p < 0.1. Coef. = coefficient, Se = Standard error.
© 2019 by the authors. Licensee MDPI, Basel, Switzerland. This article is an open access article distributed under the terms and conditions of the Creative Commons Attribution (CC BY) license (http://creativecommons.org/licenses/by/4.0/).
Share and Cite
MDPI and ACS Style
Shee, A.; Azzarri, C.; Haile, B. Farmers’ Willingness to Pay for Improved Agricultural Technologies: Evidence from a Field Experiment in Tanzania. Sustainability 2020, 12, 216. https://0-doi-org.brum.beds.ac.uk/10.3390/su12010216
AMA Style
Shee A, Azzarri C, Haile B. Farmers’ Willingness to Pay for Improved Agricultural Technologies: Evidence from a Field Experiment in Tanzania. Sustainability. 2020; 12(1):216. https://0-doi-org.brum.beds.ac.uk/10.3390/su12010216
Chicago/Turabian StyleShee, Apurba, Carlo Azzarri, and Beliyou Haile. 2020. "Farmers’ Willingness to Pay for Improved Agricultural Technologies: Evidence from a Field Experiment in Tanzania" Sustainability 12, no. 1: 216. https://0-doi-org.brum.beds.ac.uk/10.3390/su12010216
Note that from the first issue of 2016, this journal uses article numbers instead of page numbers. See further details here.